Embed Size (px)
Citation preview
Estimating the cost of accidents and ill-health at work - – A review of methodologies
ISSN: 1831-9351
Estimating the cost of accidents and ill-health at work: A review of methodologies
European Risk Observatory
European Agency for Safety and Health at Work

Estimating the cost of accidents and ill-health at work – A review of methodologies
Authors:
Marjolein de Weerd (TNO); Rory Tierney (Matrix); Birgit van Duuren-Stuurman (TNO); Evelina Bertranou (Matrix)
Project management: Xabier Irastorza, Dietmar Elsler (EU-OSHA)
More information on the European Union is available on the Internet (http://europa.eu).
Cataloguing data can be found on the cover of this publication.
Luxembourg: Publications Office of the European Union, 2014
ISBN: 978-92-9240-319-5
doi: 10.2802/92605
© European Agency for Safety and Health at Work, 2014
Reproduction is authorised provided the source is acknowledged.
Europe Direct is a service to help you find answers to your questions about the European Union
Freephone number (*):
00 800 6 7 8 9 10 11 (*) Certain mobile telephone operators do not allow access to 00 800 numbers, or these calls may be billed.
European Agency for Safety and Health at Work – EU-OSHA 1

Estimating the cost of accidents and ill-health at work – A review of methodologies
Table of contentsList of abbreviations ................................................................................................................................ 3 Executive summary ................................................................................................................................. 4
1 Introduction ................................................................................................................................... 7
2 Background and policy context .................................................................................................... 8
2.1 The importance of health and safety in the workplace ................................................................. 8 2.2 EU policy action ............................................................................................................................ 9
2.3 The situation in the Member States ........................................................................................... 10
3 Conceptual framework ............................................................................................................... 11
4 Identification of models: methodology and results ..................................................................... 14
4.1 Identification of models............................................................................................................... 14
4.2 Description of identified models ................................................................................................. 15 5 Comparative analysis ................................................................................................................. 22
5.1 Selection of studies .................................................................................................................... 22
5.2 Methods for estimating the number of work-related accidents and ill health cases .................. 23
5.3 Methods for estimating economic costs ..................................................................................... 27
6 Discussion of findings................................................................................................................. 47
6.1 Number of cases ........................................................................................................................ 47 6.2 Costs by category ....................................................................................................................... 48
6.3 Overall cost discussion............................................................................................................... 49
6.4 Recommendations ..................................................................................................................... 50
7 References ................................................................................................................................. 53
8 Appendix 1: Identified studies .................................................................................................... 55 9 Appendix 2: OSH policy and availability of data at Member State level .................................... 57
List of figures and tables Figure 1: Overview of the tasks and main activities of the study ............................................................ 7
Figure 2: Conceptual framework of work-related accidents and ill health consequences/economic costs....................................................................................................................................... 12
Figure 3. Flow chart of the white and grey literature ............................................................................. 14
Table 1: Economic costs of work-related accidents and ill health, by perspective and type ................ 13
Table 2: General overview of models to estimate the costs of poor or non-OSH at macro level ......... 16
Table 3. Shortlisted studies ................................................................................................................... 22
Table 4: Overview of studies estimating economic costs ..................................................................... 27
European Agency for Safety and Health at Work – EU-OSHA 2

Estimating the cost of accidents and ill-health at work – A review of methodologies
List of abbreviations BLS Bureau of Labor Statistics
CFOI Census of Fatal Occupational Injuries
CIPD Chartered Institute of Personnel and Development
CPMR Comparative performance monitoring report
CVD Cardiovascular disease
EU-OSHA European Agency for Safety and Health at Work
GDP Gross domestic product
GP General practitioner
HSE Health and Safety Executive
ILO International labour organization
LFS Labour force survey
MSD Musculoskeletal disorder
OECD Organisation for Economic Co-operation and Development
OSH Occupational safety and health
RIDDOR Reporting of Injuries, Diseases and Dangerous Occurrences Regulations
SME Small and medium-sized enterprise
SWORD Surveillance of work-related and occupational respiratory disease
European Agency for Safety and Health at Work – EU-OSHA
3

Estimating the cost of accidents and ill-health at work – A review of methodologies
Executive summary The costs of work-related injuries and illness can be substantial. In the EU-27 in 2007, 5,580 accidents at the workplace resulted in death and 2.9 % of the workforce had an accident at work that resulted in more than three days of absence. Additionally, approximately 23 million people had a health problem caused or made worse by work across a 12-month period (Eurostat, 2010).
Establishing an accurate overall estimate of the cost to all stakeholders at a national or international level with regard to work-related injuries and illness due to poor or non-occupational safety and health (OSH) is a complex task. However, it is vital that policy-makers understand the scope and scale of poor or non-OSH in order to implement effective measures in this policy area.
TNO and Matrix were commissioned by the European Agency for Safety and Health at Work (EU-OSHA) to review studies evaluating the costs of OSH, critically compare methodologies and make recommendations for future research regarding the estimation of the cost of poor or non-OSH at a macro level. The focus was on scientifically published papers that provide a monetary value attached to the loss in productivity and increase in health problems resulting from poor or non-OSH.
The literature review identified studies in scientific databases (PubMed, Scopus, OSH-ROM and PsycINFO) that reported on the estimation of these costs. Altogether, 475 studies were identified and screened, 29 of which were shortlisted (including six additional studies, available in English or Dutch, identified by the International Labour Organization, EU-OSHA and national-level occupational health and safety institutions).
The final selection of studies from the shortlist then followed the subsequent criteria:
covers a broad range of industries or a key industry for OSH (e.g. construction); not focused on a specific type of injury or illness; related to one of the European Union (EU) Member States.
Fourteen studies were selected that met at least two of the above criteria, and, in collaboration with EU-OSHA, nine of these were chosen for full review.
Each of the nine studies was assessed and compared with respect to the two key steps required to provide a quantitative estimate of the cost of occupational injuries and illnesses:
(1) the identification of the number of cases and
(2) the application of monetary values to the identified cases.
Regarding the number of cases, findings from the comparative analysis suggest that most studies drew on existing literature, surveys and statistics — typically labour force surveys, compensation statistics and national registries — as the focus of the papers was to establish cost estimates. In some studies, survey data were directly used to establish the number of cases; others applied the ‘population attributable risk’ method by which the probabilities of work-related exposure to a particular risk factor and the relative risk of developing a condition are estimated and applied to the overall number of cases to estimate the number of work-related cases.
At a broader level, studies applied either the incidence or the prevalence method; the former estimates the number of new cases in a given year (and then calculates all future costs for those cases) and the latter estimates the total number of cases in a given year. Either is methodologically valid; the choice depends mostly on data availability. The incidence method, however, gives a better approximation of current conditions, which may be useful for estimating changes over time.
In general, there is a significant potential for underestimation and underreporting of the number of cases, especially for long-latency disease (for which the cause may be difficult to establish) or for small-scale incidents or cases that do not result in a long absence from work (or may not be reported at all). Several papers used expert opinion to mitigate this, which is to be encouraged in future cost calculations. Further research on narrowing the extent of underestimation and statistically accounting for it is recommended.
Regarding the estimation of costs, a variety of methods and approaches were used throughout the studies. Costs were thereby categorised into five main types:
European Agency for Safety and Health at Work – EU-OSHA
4

Estimating the cost of accidents and ill-health at work – A review of methodologies
Productivity costs: costs related to decreases in output or production. Healthcare costs: medical costs, including both direct (e.g. pharmaceuticals) and indirect (e.g.
caregiver time). Quality of life losses: monetary valuation of the decrease in quality of life, such as physical
pain and suffering. Administration costs: costs of administration, for example applying for social security
payments or reporting on a workplace accident. Insurance costs: costs regarding insurance, such as compensation payments and insurance
premiums.
These five main cost types are further assessed by the perspective(s) taken, that is, in terms of costs to four stakeholders, namely:
Workers and family: the affected individual and close family or friends who are affected by the injury or illness.
Employers: the company or organisation for which the affected individual works. Government: the relevant public authority regarding, for example, social security payments. Society: all stakeholders — the effect on society is the overall impact of an injury or illness,
excluding transfers between stakeholders (which cancel out).
Methodologies by paper for each cost type and cost perspective are presented in the main body of the report. Accordingly, our recommendations include the most predominant and accurate methodologies for each cost type. Overall, the key methodological recommendations are to:
include all cost categories and all cost perspectives in a thorough and rigorous study, taking care to avoid double counting, for example excluding transfers between stakeholders such as social welfare payments when calculating cost to society;
discount and account for growth in future costs; and account for underreporting as much as possible.
In particular, for productivity costs, the human capital approach is most often used for workers and families and is recommended. This method consists of valuing time lost as a result of injury or illness by the wage rate, but it is also suggested that non-market production (i.e. productivity that is not financially compensated, such as household activities) is included. For employers, the friction cost method may be a better approach, as this assumes that workers are replaced after a given ‘friction period’ and measures productivity loss only during this time, in addition to reorganisation and retraining costs. However, there may be some permanent loss of productivity not captured by this method. For the government, social welfare payments paid to injured or ill workers should be included, as well as the loss in tax revenue, but it is important to note that at a societal level the former is simply a monetary transfer between stakeholders and not a cost to society. Gross wage plus reorganisation and recruitment costs to the employer represent overall societal productivity costs, although the friction cost method may be used if it is believed that an injured or ill worker is completely replaced as a result of structural unemployment.
Healthcare costs can be measured more directly, but there may be significant differences across countries depending on the individual healthcare systems. These differences include the distribution of costs over the different stakeholder perspectives. Therefore, it might be necessary to assess these costs locally or at the national level.
Quality-of-life costs can be valued using the willingness-to-pay approach (i.e. asking respondents how much they would pay to avoid a certain health outcome). If included in an estimate, it should be specifically noted that this approach is a monetary approximation of a qualitative concept, that is the quality-of-life loss. This is different from assessing productivity or healthcare costs.
Administrative and insurance costs are deemed to be less substantial cost items but should be included in a thorough estimation and valued by the opportunity cost method (time taken multiplied by the wage rate of the administrator) and through figures from the insurance industry.
In general, given the high degree of uncertainty around all of these cost estimates, sensitivity analysis of key variables, as well as caution against placing too much emphasis on single, ‘headline’ figures, is
European Agency for Safety and Health at Work – EU-OSHA
5

Estimating the cost of accidents and ill-health at work – A review of methodologies
strongly recommended. Further, a deeper look into the methodological theory is also advised, including work on the human capital approach, the friction cost method and the population attributable risk method, given that the focus of this study is primarily on the application of these methodologies.
An issue that was beyond the scope of this report but which is important in informing and evaluating policy decisions is that of the costs of complying with OSH regulation and providing a healthy and safe workplace. It is also worth noting that this burden of compliance falls predominantly on employers, who, on the other hand, may bear little of the cost of an occupational injury or illness (i.e. not complying), compared with the individual or even the government — healthcare costs are rarely borne by employers and productivity losses to the employer may extend only until a replacement worker is found. This disparity should be kept in mind by policy-makers and reinforces the importance of examining costs per stakeholder. Our results encourage further research and the synthesis of existing evidence in this area.
For an EU-level estimate the issue of international transferability is paramount. To a large extent, this is because of the different social security and healthcare systems that operate in different countries. Not only do healthcare costs vary, as well as the stakeholders paying for them, but social security and healthcare systems can also incentivise individuals to behave in certain ways, such as continuing to work at low productivity or declaring disability. Differences in wages have a large impact on the productivity costs for the different countries, so some type of weighing using the variable of gross domestic product (GDP) per capita is recommended.
Finally, and bearing these issues in mind, a close examination of existing country-specific literature and a review of national OSH systems is suggested in order to inform future research. The best approach for an EU-wide calculation of costs of poor or non-OSH would probably be an aggregation of national studies, highlighting the relevant structural differences. The most important factor for international comparability, however, is a standardisation of cost calculation methodologies at the country level. The models by the United Kingdom Health and Safety Executive (HSE) and Safe Work Australia could be taken as good-practice examples, and, based on this analysis, further theoretical research and national feasibility studies could be carried out. The three basic cost categories that should be included in any cost of poor or non-OSH analysis are healthcare costs (direct), productivity costs (indirect) and quality-of-life losses (intangible). Administrative and insurance costs should be added where possible.
As an idea of the scope of the problem of poor or non-OSH, the two papers that were judged to be the most methodologically sound, those by HSE and Safe Work Australia, reported, respectively, costs to the United Kingdom economy of GBP 13.4 billion in 2010/11, excluding occupational cancers (calculated to be approximately 1 % of GDP (1)) and costs to the Australian economy of AUD 60.6 billion in 2008/09 (4.8 % of GDP). In the Netherlands, the costs of poor or non-OSH were estimated by another study (Koningsveld et al., 2003) at EUR 12.7 billion in 2001, or 3 % of GDP. The variation in these estimates leads us to caution against placing too much emphasis on headline figures taken alone, but gives a good impression of the size of the cost of poor or non-OSH.
(1) HSE calculated the cost to society of workplace fatalities and injuries and work-related ill health in 2010/11, at 2010 prices, as GBP 13,424 million. The nominal GDP was taken from the UK Treasury’s ‘GDP deflators at market prices, and money GDP: September 2013’, available at https://www.gov.uk/government/publications/gdp-deflators-at-market-prices-and-money-gdp-march-2013 (accessed 14 October 2013). The cost to the economy is calculated at 0.89 % using the 2010/11 financial year GDP or at 0.90 % using the 2010 calendar year GDP (GBP 1,502,176 million and GBP 1,485,615 million, respectively). This compares with the 1.2 %, based on costs to society of GBP 16.5 billion, for 2006/07 and the 0.97 %, based on costs to society of GBP 14 billion for 2009/10 previously reported by HSE (‘The costs to Britain of workplace injuries and work-related ill health in 2006/07’ and its 2009/10 update), available at http://www.hse.gov.uk/economics/costing.htm (accessed 14 October 2013).
European Agency for Safety and Health at Work – EU-OSHA
6

Estimating the cost of accidents and ill-health at work – A review of methodologies
1 Introduction The European Agency for Safety and Health at Work (EU-OSHA) commissioned TNO and Matrix to assess different methodologies for estimating the cost of poor or non-occupational safety and health (OSH) at the macro level in order to:
understand the rationale behind the different estimates and get a better knowledge of the economic impact of poor OSH;
provide information to support policy-makers at European and national level; establish a strong basis for debate on key issues around the subject; contribute to the promotion and fostering of further research.
With these aims in mind, the objective of this study was to provide a policy-oriented review of economic models that estimate the cost of poor or non-OSH. The study is divided into four main tasks:
1. Identification of estimation models 2. Description of the models 3. Comparative analysis 4. Discussion of findings
An overview of the tasks and corresponding main activities of the study is provided in Figure 1. This report presents the results of the study and is structured as follows:
Section 2 provides a background understanding of the key issues concerning the problem of OSH as well as the EU and Member States’ actions.
Section 3 presents the conceptual framework of the costs of poor or non-OSH in relation to stakeholders.
Section 4 describes the methodology used for identifying models that estimate the costs of poor or non-OSH at macro level, and a high-level description of the identified models.
Section 5 describes and compares a selected number of models. In section 6 the results are discussed and recommendations are given.
Figure 1: Overview of the tasks and main activities of the study
Task Main activities
1. Identification of estimation models Literature review
2. In-depth description of the models
General characterisation Method for estimating the number of work-related accidents
and ill health cases Method for estimating economic costs
3. Comparative analysis Comparative summary Similarities and differences
4. Discussion of findings
Strengths and limitations Effects of poor or non-OSH on employment and
competitiveness Transferability to other countries or at the international level Proposals for future research and modelling initiatives
European Agency for Safety and Health at Work – EU-OSHA
7

Estimating the cost of accidents and ill-health at work – A review of methodologies
2 Background and policy context This section provides a background understanding of the key issues concerning the extent of the problem of poor or non-OSH as well as the EU and Member States’ actions in this area.
2.1 The importance of health and safety in the workplace A healthy and safe work environment not only is desirable from the perspective of workers, but also contributes considerably to labour productivity and, as a consequence, promotes economic growth. OSH increases the competitiveness and productivity of enterprises by reducing costs resulting from occupational accidents, incidents and diseases and by enhancing worker motivation. Moreover, a decrease in accidents and illness relieves pressure on public and private social protection and insurance systems.
Risks to health and safety at the workplace abound worldwide. The International Labour Organization (ILO) estimates that 2.34 million people died from work-related injury or illness in 2008: 2.08 million from illness and 321,000 from accidents. Additionally, it is estimated that there were 317 million non-fatal accidents leading to an absence of four or more days, mostly in South-East Asia and Western Pacific countries (ILO, 2011). An estimated 160 million people suffer from work-related diseases (ILO, 2003). Some incidents, such as industrial accidents, can cause major environmental damage that affect people beyond the workplace. These risks are not restricted to developing countries. In the EU-27 in 2007, 5,580 accidents at the workplace resulted in death and 2.9 % of the workforce had an accident at work that resulted in more than three days of absence from work. Approximately 23 million people had a health problem caused or made worse by work in a 12-month period (Eurostat, 2010). The likelihood of being affected by workplace accidents varies considerably when accounting for gender and location as well as industry. Men are, on average, 2.5 times more likely to have a serious accident at work than women, although this is largely driven by the gender patterns of employment by sector and occupation — we would expect that the most affected industries, detailed below, employ more men. Across a selection of European countries, incidence rates of fatal accidents per 100,000 workers ranged from over five in Poland to less than one in Germany, Denmark, the Netherlands, the United Kingdom and Slovakia, although some figures may be subject to underreporting, as discussed later (HSE, 2013). In terms of industries, within the EU-27 in 2009, the construction, manufacturing, transportation and storage, and agriculture, forestry and fishing sectors accounted for more than two-thirds of all fatal accidents at work. The construction sector alone accounted for 26.1 % of all fatal work accidents (Eurostat, 2012). In addition to accidents, exposure to hazardous substances at work is believed to contribute significantly to mortality through carcinogenic and respiratory diseases. For example, exposure to occupational carcinogens alone is estimated to result in a global disease burden of 152,000 deaths and nearly 1.6 million disability-adjusted life years (Driscoll et al., 2005) (DALY, a measure combining quality and quantity of life lost). More specific figures show that, for example, in 2005 in the United Kingdom alone, 8,019 cancer deaths were attributable to occupation, the majority of which were associated with substance exposure (Rushton et al., 2010).
Small and medium-sized enterprises (SMEs) are particularly vulnerable to occupational hazards as they have fewer resources to dedicate to worker protection (Commission of the European Communities, 2007). In addition, prevalence rates among European workers indicate that in 2007 a total of 23 million workers or 8.6 % of the workforce (aged between 15 and 64 years) suffered from work-related health problems. The health problems most often reported in 2007 were musculoskeletal disorders, stress, depression and anxiety (Eurostat, 2010).
These injuries and deaths not only cause human suffering for workers and their families but also result in economic costs to individuals, businesses, government and society. Potential negative effects include costly early retirements, loss of skilled staff, absenteeism, as well as presenteeism (when employees go to work despite illness, increasing the likelihood of errors occurring), and high medical costs and insurance premiums. Organisation for Economic Co-operation and Development (OECD) countries already spend 2.4 % of gross domestic product (GDP) on incapacity-related benefits (OECD, 2006. At the same time, the ILO estimates that many of these tragedies are preventable through the implementation of sound prevention, reporting and inspection practices. The
European Agency for Safety and Health at Work – EU-OSHA
8

Estimating the cost of accidents and ill-health at work – A review of methodologies
ILO puts the loss of global GDP due to occupational diseases and accidents at 4 % (ILO, 2003). At the Member State level, the United Kingdom estimates that the economic damage caused by work-related injuries and ill health (excluding occupational cancers) amounts to GBP 13.4 billion (HSE, 2011) and the Netherlands makes an estimation for accidents of EUR 276 million, including direct medical costs (EUR 76 million) and total absence costs (EUR 200 million) (2).
As should become evident from these statistics, the magnitude of the problem of inadequate health and safety at the workplace is considerable and needs to be addressed in order to decrease the associated disease burden and increase the productivity of workers and the competitiveness of European businesses. The EU has developed several policies in response to this challenge. These are described in the next section.
2.2 EU policy action The EU actively promotes health and safety at work on the basis of Article 153 of the Treaty on the Functioning of the European Union, which states that the EU should support and complement Member State activities in the following areas, among others: improvement, in particular of the working environment, to protect workers’ health and safety; and working conditions. The European Framework Directive on Safety and Health at Work can be seen as the centrepiece of the EU efforts in the area of health and safety (Directive 89/391 EEC), introducing a number of obligations for both workers and employers. In addition to risk assessments, the obligations for employers include implementing measures aimed at improving the protection of workers, consulting workers on matters related to health and safety, and ensuring that workers receive adequate training. In order to help Member States implement these Directives, the European Commission set up the Advisory Committee on Safety and Health at Work, which provides practical guidelines for both public authorities and enterprises (Commission of the European Communities, 2007). Furthermore, the existing EU legislation is supported by a range of other actions, most of them rooted in the Community Strategy 2007–2012 on health and safety at work (Commission of the European Communities, 2007). The strategy’s overall objective is the reduction by 25 % of the incidence rate of accidents at work per 100,000 workers in the EU-27 through: guaranteeing the proper implementation of EU legislation; supporting SMEs in the implementation of the legislation in force; adapting the legal framework to changes in the workplace and simplifying it, particularly in view
of SMEs; promoting the development and implementation of national strategies; encouraging changes in the behaviour of workers and encouraging their employers to adopt
health-focused approaches; finalising the methods for identifying and evaluating new potential risks; improving the tracking of progress; and promoting health and safety at international level. The non-legislative instruments that fall within the scope of the strategy include research, exchanges of good practice and awareness-raising campaigns, among others.
As stated by the European Commission, a risk assessment is the precondition for any further action (3). To this end, EU-OSHA collaborates with Member State governments and employers’ and employee representatives to raise awareness of OSH risks, identify good practice in OSH, anticipate new and emerging risks and promote cooperation and networking among Member States.
(2) Monitor Arbeidsongevallen in Nederland 2010 (www.tno.nl/arbeid) (3) https://osha.europa.eu/en/topics/riskassessment/index_html
European Agency for Safety and Health at Work – EU-OSHA
9

Estimating the cost of accidents and ill-health at work – A review of methodologies
2.3 The situation in the Member States There are limited (recent) available data on the cost of poor OSH in the EU as a whole. In 2002, EU-OSHA published a report on the costs of work-related illnesses which aimed to improve the knowledge base for policy-makers when making decisions regarding workers’ protection and OSH (Mossink and de Greef, 2002). The study gave an overview of the methodological challenges around measuring the costs of accidents on employee health and company performance. According to that research, Member States bear costs between 2.6 % and 3.8 % of GDP annually. For those Member States that do not report such data, EU-OSHA made estimates which range from 0.4 % to 4 % of GDP.
As pointed out in the section above, many countries do produce national estimates and a majority of them try to encourage enterprises to invest in preventative OSH measures by providing financial incentives (mostly subsidies), albeit not always in a systematic way. Other measures include insurance schemes, as well as public procurement policies that reward companies that are active in managing OSH. When new policies to promote workers’ protection are developed, their economic costs are usually considered, at least implicitly. Policy-makers can decide on the most effective and appropriate instruments to ensure a healthy and safe work environment only if they have sound and transparent estimates of the economic costs caused by poor OSH. In many countries, economic impact assessments are already part of any political decision-making process. EU-OSHA has presented a collection of Member State strategies (4).
Additionally, a comprehensive 1998 study summarised, for a sample of Member States, the extent to which OSH was considered a major policy issue at the time and the kind of data that were being collected on the economic impact of OSH to inform decision-making (EU-OSHA, 1998). Given the date of the report, its findings are not summarised here but are included as Appendix 2.
(4) https://osha.europa.eu/en/organisations/osh_strategies/list_eu_strategies#EU Member State strategies and programmes
European Agency for Safety and Health at Work – EU-OSHA
10

Estimating the cost of accidents and ill-health at work – A review of methodologies
3 Conceptual framework This section presents a conceptual framework of the costs of poor or non-OSH that is used as guidance for describing the models identified to estimate the costs of poor or non-OSH. The economic costs of poor or non-OSH are determined by the number of work-related accidents and ill health cases and the consequences associated with these. Figure 2 provides a conceptual framework for capturing these elements and it can be interpreted as follows. Workers may suffer from a work-related accident/injury or illness. These accidents or illnesses may be fatal or non-fatal. Non-fatal accidents or illnesses may in turn lead to impairment either with non-lasting functional limitations or with lasting functional limitations (work or non-work related). These four high-level potential outcomes may be associated with numerous consequences. When interpreted in monetary terms, these consequences are referred to as economic costs. Figure 2 summarises these costs into five main types: Productivity costs: costs relating to decreases in output or production. Healthcare costs: medical costs, both direct (e.g. pharmaceuticals) and indirect (e.g. caregiver
time). Quality of life losses: monetary valuation of the decrease in quality of life, such as physical
pain and suffering. Administration costs: costs of administration (e.g. applying for social security payments or
reporting on a workplace accident). Insurance costs: such as compensation payments and insurance premiums. Table 1 provides specific costs within each of the five groups specified above. These are distributed among four types of stakeholders, namely:
• Workers and family: the affected individual and close family or friends who are impacted by the injury or illness.
• Employers: the company or organisation for which the affected individual works. • Government: the relevant public authority regarding, for example, social security payments. • Society: all stakeholders — the effect on society is the overall impact of an injury or illness,
excluding transfers between stakeholders, which cancel out. The list of costs included may not be exhaustive. However, in order to allow comparison across models a decision was made to keep this typology of costs at a relatively high level.
European Agency for Safety and Health at Work – EU-OSHA
11

Estimating the cost of accidents and ill-health at work - – A review of methodologies
Figure 2: Conceptual framework of work-related accidents and ill health consequences/economic costs
Non-fatal
Fatal
Worker
Ill health or illness
Healthcare costs
Quality of life losses
Administration costs
Insurance costs
Productivity costs
Healthcare costs
Quality of life losses
Administration costs
Insurance costs
Productivity costs
Accident or injury
Fatal Healthcare costs
Quality of life losses
Administration costs
Insurance costs
Productivity costs
Non-fatal Healthcare costs
Quality of life losses
Administration costs
Insurance costs
Productivity costs
European Agency for Safety and Health at Work – EU-OSHA
12

Estimating the cost of accidents and ill-health at work - – A review of methodologies
Table 1: Economic costs of work-related accidents and ill health, by perspective and type
Cost type
Stakeholder
Productivity costs Healthcare costs Quality of life losses Administration costs Insurance costs
Workers and families Loss of present and future
income (net of taxes)
Direct and indirect medical
costs and rehabilitation costs
Physical pain and suffering
Moral pain and suffering
Cost of time
claiming benefits,
waiting for
treatment, etc.
Compensation
payments
Employers
Sick payments
Production losses
Production disturbances
Damaged equipment
Damaged company image
(All of the above costs are
net of taxes)
Administrative and
legal costs
Cost for
reintegration and
re-schooling of
(disabled) workers
Impact on insurance
premiums
Government
Sick payments
State benefits (disability,
early retirement)
Tax revenue losses
Direct and indirect medical
costs and rehabilitation costs
Administrative and
legal costs
Society (over and above all
the previous)
Loss of output (due to
fatality or disability/early
retirement)
European Agency for Safety and Health at Work – EU-OSHA
13

Estimating the cost of accidents and ill-health at work - – A review of methodologies
4 Identification of models: methodology and results This section describes the methodology for identifying models that estimate the costs of poor or non-OSH at the macro level, and a description of the identified models.
4.1 Identification of models Studies were identified through a systematic literature review, consisting of the following key steps: Search. Searches were performed in PubMed, Scopus, OSH-ROM and PsycINFO to retrieve all published articles reporting on the estimation of the costs of poor or non-OSH at macro level from the year 2000 onwards. The following keywords were used: [Terms for setting]: work* OR occupation* [Terms for health and safety]: health and safety OR accident* OR injury OR disease OR illness [Terms for economic study]: cost* OR economic evaluation OR economic analysis OR economic assessment. As a result of this process, 475 studies were identified. The details are illustrated in Figure 3. Excluding duplicates, out of the 475 studies:
366 studies were identified in Scopus; 284 additional studies were identified in PubMed (excluding duplicates); 57 additional studies were identified in OSH-ROM (excluding duplicates); and no additional studies were identified in PsycINFO (excluding duplicates).
Figure 3: Flow chart of the white and grey literature
Screening. The studies were reviewed based on titles and abstracts to identify those that satisfied
European Agency for Safety and Health at Work – EU-OSHA
14

Estimating the cost of accidents and ill-health at work – A review of methodologies
the following predefined inclusion criteria: Evaluated occupational health and safety, workplace accidents, injury, ill health or diseases. Included information about the methodology of the economic analysis. The level of these
methodologies needed to be macro, industry or enterprise and performed in any country, including EU Member States and the European Economic Area countries.
Written in English or Dutch — Dutch was included because of the nationality of some of the reviewers.
Publications whose main purpose was to estimate the benefits or cost–benefits of specific OSH interventions were excluded. The decisions were made in close collaboration with EU-OSHA. After the first screening, 58 articles were selected to review in full text. After screening the 58 articles in full text, 23 articles (see Appendix 1, Table A1, references 1–23) were selected for further inspection. Additional searches. Other sources were searched to ensure that all relevant studies that may not have been published in the above databases were identified. The following key websites were checked: ILO, EU-OSHA and national-level OSH institutions providing information in English or Dutch. As a result, six additional studies were selected (see Table A1, references 24–29). Five articles were found on the ILO and EU-OSHA website (see Table A1, references 24–28) and one Dutch article was included from OSH institutions (see Table A1, reference 29). The studies found on the websites were screened in full text and the decision to include or exclude them was based on the criteria mentioned above.
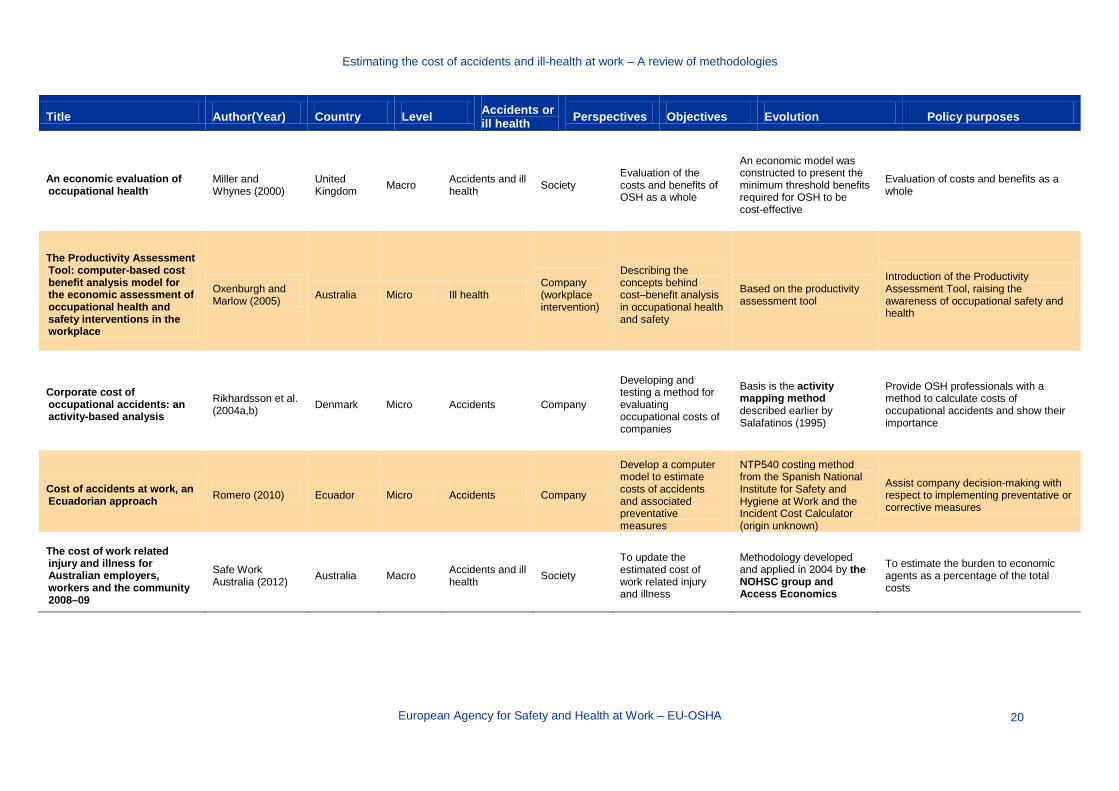
4.2 Description of identified models This section presents a description of the studies identified through the review of the literature. Table 2 summarises the characteristics of the 29 studies identified. Two publications (Rikhardsson et al., 2004a,b) were described as one study; therefore, hereafter we refer to a total of 28 studies. One of the publications was in Dutch and the remaining 27 studies were in English. There was considerable variation in the main aim and the political purpose of the studies. The majority looked at all affected workers in the area under study; only four out of the 28 selected studies were specific to a particular worker population. The scope of the models in terms of accidents and diseases was diverse. Six studies focused on accidents only, 11 focused on ill health only and 11 covered both accidents and illnesses. The focus of the methodologies was diverse. Six studies were at a company level, five were at the industry level and 14 were at the society level; only three were at all levels. Although the objectives were different in all studies, two general groups were made:
In the first group, the main objective was to develop, test or update a method. Nine of the studies were categorised in this group.
In the second group, the main objective was to perform an economic assessment or to compare costs across different countries. Nineteen studies were categorised in this group.
European Agency for Safety and Health at Work – EU-OSHA
15

Estimating the cost of accidents and ill-health at work - – A review of methodologies
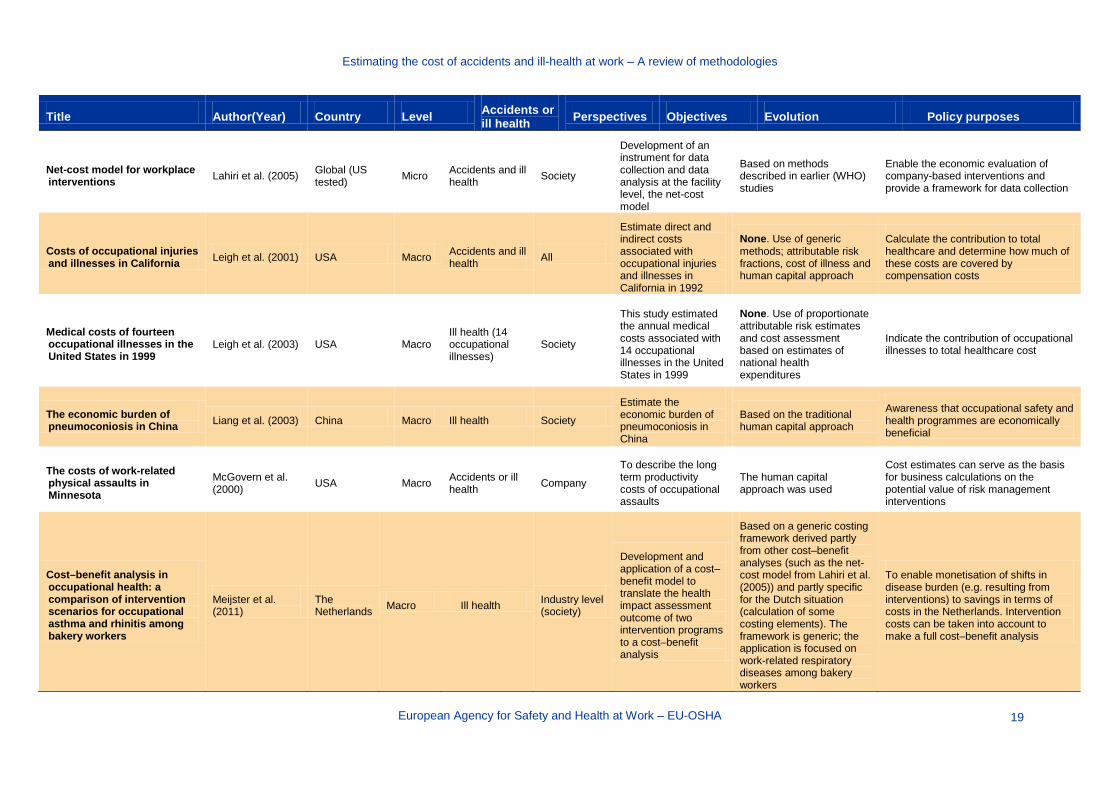
Table 2: General overview of models to estimate the costs of poor or non-OSH at macro level
Title Author(Year) Country Level Accidents or ill health Perspectives Objectives Evolution Policy purposes
Predictors and economic burden of serious workplace falls in health care
Alamgir et al. (2011) Canada Macro Accidents Society
Estimate the economic burden of serious fall injuries in Canadian healthcare workers
None. Specific model was referred. Cost estimates were based on figures from the Workplace Health Indicator Tracking and Evaluation (WHITE) database and compensation and payroll data
To see what benefit could be obtained from decreasing the incidence of fall accidents and obtain information on important determinants
An overview to CERSSO’s self-evaluation of the cost–benefit on the investment in OSH in the textile factories: ‘A step by step methodology’
Amador-Rodezno (2005)
Central America and the Dominican Republic
Macro (but applied at company level)
Ill health [OSH (broad)] Industry
Estimate the cost–benefits from investments in OSH
A specific model was developed for the textile industry in Central America using a World Health Organization (WHO)/Pan-American Health Organization (PAHO)-developed model
To enable managers in garment factories to self-diagnose plant and workstation hazards and to estimate the costs and benefits of investing in OSH
Cost of occupational asthma in the United Kingdom Ayres et al. (2011) United
Kingdom Macro Ill health (occupational asthma)
Society
Estimate the social cost of occupational asthma in the United Kingdom
None, uses generic cost-of-illness methodology and obtained incidence figures from the Surveillance of work-related and occupational respiratory disease (SWORD) database
Provide insight into the justifications for approaches that can reduce the disease burden from occupational asthma
Modeling the economic burden of diseases imputable to stress at work
Béjean and Sultan-Taïeb (2005)
France Macro Ill health Society
Calculate the cost, in France, of the attributable fraction of three diseases (musculoskeletal disorders [MSDs], cardiovascular disease [CVD] and depression) associated with work-related stress. The study compares the impact of two costing hypotheses
None. Uses attributable fraction method. Two separate cost models are introduced, of which the first is based upon the human capital theory and the second on an alternative theory of the authors
Provide insight into the contribution of work stress to the costs of certain diseases in relation to the organisation of social security and insurance system in France (who pays when)
European Agency for Safety and Health at Work – EU-OSHA
16

Estimating the cost of accidents and ill-health at work – A review of methodologies
Title Author(Year) Country Level Accidents or ill health Perspectives Objectives Evolution Policy purposes
The economic cost of fatal occupational injuries in the United States, 1980–97
Biddle (2004) USA Macro Accidents (fatal injuries) Society
Developing a computerised costing model for calculating cost consequences of occupational fatal injuries
None. Use of generic methods and data sources. Cost of illness theoretical model and data from the National Traumatic Occupational Fatality survey
Provide policy-makers with a tool to use in cost–benefit analysis of prevention strategies
Economic burden of dermatitis in US workers Blanciforti (2010) USA Macro Ill health
(dermatitis) Society
Estimate the economic burden of dermatitis cases in seven industries
Cost of illness method and data from the national medical expenditure panel survey
Provide insight into the economic burden of dermatitis
Work status and productivity costs due to ankylosing spondylitis: comparison of three European countries
Boonen et al. (2002)
EU (several countries) Macro
Ill health (ankylosing spondylitis)
Society
To compare work disability, sick leave, and productivity costs due to ankylosing spondylitis of three European countries
None. A range of observational questionnaires were used to estimate important costing parameters such as quality of life. Human capital approach and friction cost method were used to estimate productivity costs
Study the differences in work status and productivity costs between the three European countries and look at the implications for the generalisability of health economics studies
Inventory of socioeconomic costs of work accidents EU-OSHA (2002) EU Macro Accidents All
The aim was to offer some guidance in making estimations of the costs of accidents and the benefits of preventative activities
None. The report does not build on a specific model but provides guidelines for cost–benefit analysis that are (partially) based on earlier work for EU-OSHA and the European Commission
Provide the European Commission with knowledge on the costs of occupational accidents and contribute to the Community strategy on health and safety at work
Socioeconomic costs of accidents at work and work related ill health
European Commission (2011)
EU Macro Accidents and ill health Company
To shed light on the socio-economic costs of accidents at work and the incremental benefits of prevention for companies if they develop and implement effective safety and health management policies
None. Based on cost–benefit analysis indicators: net present value, profitability index, benefit–cost ratio
The key message of this publication is the need to consider the calculation of costs and benefits
European Agency for Safety and Health at Work – EU-OSHA
17

Estimating the cost of accidents and ill-health at work – A review of methodologies
Title Author(Year) Country Level Accidents or ill health Perspectives Objectives Evolution Policy purposes
Costs to Britain of workplace injuries and work-related ill health: 2010/11
HSE (2011) United Kingdom Macro
Accidents and illnesses (excluding occupational cancer and other long-latency diseases)
All
Perform an update of the Health and Safety Executive (HSE) cost model and use it to generate cost estimates for years up to 2010/11
Update of the HSE cost model
Provide an estimate of the total costs for society, employer and employees of occupational ill health and injuries
The economic burden of all-terrain vehicle related adult deaths in the U.S. workplace, 2003–2006
Helmkamp et al. (2012) USA Macro
Accidents and fatal occupational illness
Society
To shed light on the costs of vehicle-related deaths in the workplace
The costing method is based upon a National Institute for Occupational Safety and Health (NIOSH) model described in some of our other sources (Biddle, 2004). Data are obtained from generic databases (e.g. insurance)
Main objective is to provide insight into the costs. Secondary several intervention options are discussed
Report on economic impact of the Safety, Health and Welfare at Work legislation
Indecon (2006) Ireland Macro Accidents and ill health Society
To undertake an economic assessment of the effect of OSH and welfare law on the Irish economy
Based on the model of Scholz and Gray (1993)
To estimate savings to the economy and the impact of the implementation of OSH rules
National costs of working conditions of labourers in the Netherlands 2001
Koningsveld et al. (2003)
The Netherlands Macro Accidents and ill
health Company
To present the total costs of OSH and to present a method to perform these calculations
Based on the method presented by Koningsveld and Mossink (1997)
Focus is to help decision makers, to perform scenario analysis, to perform break-even and cost–benefit analyses
The cost effectiveness of occupational health interventions: preventing occupational back pain
Lahiri et al. (2005) Global (several WHO subregions)
Macro Ill health (back pain) Society
Estimates the average and incremental CERs of specific interventions for the prevention of occupationally induced back pain
The WHO-CHOICE simulation model was used as basis for this study
Provide WHO with insight into the CER for several preventative strategies and differences between subregions
European Agency for Safety and Health at Work – EU-OSHA
18
Estimating the cost of accidents and ill-health at work – A review of methodologies
Title Author(Year) Country Level Accidents or ill health Perspectives Objectives Evolution Policy purposes
Net-cost model for workplace interventions Lahiri et al. (2005) Global (US
tested) Micro Accidents and ill health Society
Development of an instrument for data collection and data analysis at the facility level, the net-cost model
Based on methods described in earlier (WHO) studies
Enable the economic evaluation of company-based interventions and provide a framework for data collection
Costs of occupational injuries and illnesses in California Leigh et al. (2001) USA Macro Accidents and ill
health All
Estimate direct and indirect costs associated with occupational injuries and illnesses in California in 1992
None. Use of generic methods; attributable risk fractions, cost of illness and human capital approach
Calculate the contribution to total healthcare and determine how much of these costs are covered by compensation costs
Medical costs of fourteen occupational illnesses in the United States in 1999
Leigh et al. (2003) USA Macro Ill health (14 occupational illnesses)
Society
This study estimated the annual medical costs associated with 14 occupational illnesses in the United States in 1999
None. Use of proportionate attributable risk estimates and cost assessment based on estimates of national health expenditures
Indicate the contribution of occupational illnesses to total healthcare cost
The economic burden of pneumoconiosis in China Liang et al. (2003) China Macro Ill health Society
Estimate the economic burden of pneumoconiosis in China
Based on the traditional human capital approach
Awareness that occupational safety and health programmes are economically beneficial
The costs of work-related physical assaults in Minnesota
McGovern et al. (2000) USA Macro Accidents or ill
health Company
To describe the long term productivity costs of occupational assaults
The human capital approach was used
Cost estimates can serve as the basis for business calculations on the potential value of risk management interventions
Cost–benefit analysis in occupational health: a comparison of intervention scenarios for occupational asthma and rhinitis among bakery workers
Meijster et al. (2011)
The Netherlands Macro Ill health Industry level
(society)
Development and application of a cost–benefit model to translate the health impact assessment outcome of two intervention programs to a cost–benefit analysis
Based on a generic costing framework derived partly from other cost–benefit analyses (such as the net-cost model from Lahiri et al. (2005)) and partly specific for the Dutch situation (calculation of some costing elements). The framework is generic; the application is focused on work-related respiratory diseases among bakery workers
To enable monetisation of shifts in disease burden (e.g. resulting from interventions) to savings in terms of costs in the Netherlands. Intervention costs can be taken into account to make a full cost–benefit analysis
European Agency for Safety and Health at Work – EU-OSHA
19
Estimating the cost of accidents and ill-health at work – A review of methodologies
Title Author(Year) Country Level Accidents or ill health Perspectives Objectives Evolution Policy purposes
An economic evaluation of occupational health
Miller and Whynes (2000)
United Kingdom Macro Accidents and ill
health Society Evaluation of the costs and benefits of OSH as a whole
An economic model was constructed to present the minimum threshold benefits required for OSH to be cost-effective
Evaluation of costs and benefits as a whole
The Productivity Assessment Tool: computer-based cost benefit analysis model for the economic assessment of occupational health and safety interventions in the workplace
Oxenburgh and Marlow (2005) Australia Micro Ill health
Company (workplace intervention)
Describing the concepts behind cost–benefit analysis in occupational health and safety
Based on the productivity assessment tool
Introduction of the Productivity Assessment Tool, raising the awareness of occupational safety and health
Corporate cost of occupational accidents: an activity-based analysis
Rikhardsson et al. (2004a,b) Denmark Micro Accidents Company
Developing and testing a method for evaluating occupational costs of companies
Basis is the activity mapping method described earlier by Salafatinos (1995)
Provide OSH professionals with a method to calculate costs of occupational accidents and show their importance
Cost of accidents at work, an Ecuadorian approach Romero (2010) Ecuador Micro Accidents Company
Develop a computer model to estimate costs of accidents and associated preventative measures
NTP540 costing method from the Spanish National Institute for Safety and Hygiene at Work and the Incident Cost Calculator (origin unknown)
Assist company decision-making with respect to implementing preventative or corrective measures
The cost of work related injury and illness for Australian employers, workers and the community 2008–09
Safe Work Australia (2012) Australia Macro Accidents and ill
health Society
To update the estimated cost of work related injury and illness
Methodology developed and applied in 2004 by the NOHSC group and Access Economics
To estimate the burden to economic agents as a percentage of the total costs
European Agency for Safety and Health at Work – EU-OSHA
20

Estimating the cost of accidents and ill-health at work – A review of methodologies
Title Author(Year) Country Level Accidents or ill health Perspectives Objectives Evolution Policy purposes
Cost of lost productive work time among US workers with depression
Stewart et al. (2003) USA Macro Ill health Society
To estimate the impact of depression on labour costs in the US workforce
Lost labour costs were estimated from lost productive hours and self-reported annual income. Lost dollars were calculated by multiplying lost hours by the hourly wage
Suggestion that there might be cost-effective opportunities for improving depression-related outcomes in the US workforce
Costs of occupational injury and illness within the health services sector
Waehrer et al. (2005) USA Macro Accidents and ill
health Society
To estimate and compare the costs across occupations, industries, gender, race and types of non-fatal injuries and illnesses
Incidence study of nationwide data. Costs were calculated using the current population survey
Occupational injuries and illnesses were especially high in this sector, suggesting that healthcare organisations should devote more resources to prevention
Costs of occupational injuries in construction in the United States
Waehrer et al. (2007) USA Macro
Accidents (fatal and non-fatal injuries)
Construction industry
To present the total costs of fatal and non-fatal injuries for the construction industry and a comprehensive cost model that included direct medical costs, indirect losses in wage and household productivity, as well as an estimate of the quality-adjusted life year costs due to injury
Incidence study of nationwide data. Costs were calculated using the current population survey
To present the average costs in the construction industry
CER, cost-effectiveness ratio; CVD, cardiovascular disease; EU-OSHA, European Agency for Safety and Health at Work; HSE, Health and Safety Executive; MSD, musculoskeletal disorder; NIOSH, National Institute for Occupational Safety and Health; NOHSC, National Occupational Health and Safety Commission; OSH, occupational safety and health; PAHO, Pan American Health Organization; SWORD, Surveillance of work-related and occupational respiratory disease; WHITE, Workplace Health Indicator Tracking and Evaluation; WHO, World Health Organization; WHO-CHOICE, World Health Organization – CHOosing Interventions that are Cost Effective.
European Agency for Safety and Health at Work – EU-OSHA
21

Estimating the cost of accidents and ill-health at work - – A review of methodologies
5 Comparative analysis In this section we describe and compare a selected number of studies in further detail.
5.1 Selection of studies The objective of selecting studies was to ensure that we focus our efforts on studies with the potential to add most value to this research. The selection of models was done based on the following criteria:
covering a broad range of industries or one of the main industries when it comes to OSH (e.g. construction);
not focused on a specific type of injury/illness; and relating to one of the EU Member States.
These criteria were applied to the 28 studies presented in section 4. Studies were shortlisted if they complied with at least two of the above criteria. Following this process, 14 studies were selected. In collaboration with EU-OSHA, it was then decided to focus on nine studies, as indicated in Table 3. Table 3: Shortlisted studies
Study Comments
Ayres et al. (2011) Included
Béjean and Sultan-Taïeb (2005) Included
Biddle (2004) Included
Boonen et al. (2002) Included
European Commission (2011) Excluded — too enterprise focused
Helmkamp et al. (2012) Excluded — same method as Biddle (2004)
HSE (2011) Included
Indecon (2006) Excluded — not good quality
Koningsveld et al. (2003) Included
Leigh et al. (2001) Included
Leigh et al. (2003) Excluded — same method as Leigh et al. (2001)
EU-OSHA (2002) Excluded – more of a guidance document; it has very high-level descriptions of how to calculate certain costs, but no methods on how to derive the number of cases
Rikhardsson (2004) Included
Romero (2010) Included
Safe Work Australia (2012) Included The in-depth description and comparative analysis of studies covers two essential steps required to estimate the cost of poor or non-OSH at macro level:
• Method for estimating the number of work-related accidents and ill health cases. This is done for each type of accident and illness included in the model.
• Method for estimating economic costs. This is done for each type of accident and illness included in the model and for the different perspectives (workers and families, employers, government and society) and types of costs (productivity costs, healthcare costs, quality of life losses, administration costs and insurance costs).
European Agency for Safety and Health at Work – EU-OSHA
22
Estimating the cost of accidents and ill-health at work – A review of methodologies
Further details on each study reviewed, including the results they present, are given in the Technical Annex. It is available at: https://osha.europa.eu/en/resources/annex-costs-of-accidents-ill-health-work/annex-estimating-the-costs-of-accidents-and-ill-health-at-work/view
5.2 Methods for estimating the number of work-related accidents and ill health cases
Owing to the level of detail, the description of the methods applied in each study is presented in the Technical Annex. As several studies cover both fatal and non-fatal injuries and illnesses, for each study the number of entries (rows) reflects the different types of accidents and illnesses included in the model. A small number of studies make a distinction by severity of injury (e.g. minor versus major) and the level or duration of impairment caused by the injury or illness (e.g. returns to work versus never returns to work). The studies apply a range of methods to estimate the number of cases of injuries and ill health. Typically, they are based on labour force surveys and national registries of accidents, diseases and deaths. Only in a small number of models did the authors identify and deal with underreporting. Likewise, many studies did not make explicit reference to the strengths and limitations of the models as well as the gaps in the evidence and recommendations for future research, although these have been evaluated throughout this research. The structure below does not directly compare individual papers owing to the variety of methodologies used. Rather, the methodologies of each are described and an overall assessment of methodologies is provided.
5.2.1 Methodologies by study All studies provided estimates for the number of cases, with the exception of Romero (2010), which described the development of a software tool for use in calculating costs of work-related injury and illness.
Ayres et al. (2011)
Ayres et al. looked at cases of occupational asthma in the United Kingdom, and the number of cases was calculated based on the agent to which the worker was exposed. Data on the number of new cases per year were established from existing survey data on occupational lung disease in the United Kingdom, and these were extrapolated to estimate the total prevalence.
There were no available data broken down by agent, gender and occupation simultaneously, but the authors calculated estimates based on information available on occupation from the United Kingdom Labour Force Survey (LFS) and available gender information for work-related and occupational diseases. Assumptions on the gender proportions were required (the authors subsequently calculated costs according to gender), as well as the assumption that within the same job the risk of occupational asthma is the same for men and women. The authors acknowledged that these were limitations on the accuracy of the results.
The authors cited a study by Newman Taylor et al. (2004), which suggested that the number of incident cases of occupational asthma may be underestimated by a third, based on a review of the Surveillance of work-related and occupational respiratory disease (SWORD) scheme data.
Béjean and Sultan-Taïeb (2005)
This study looked at cases of three illnesses in France caused by work-related stress: cardiovascular disease (non-fatal and fatal); depression (non-fatal and fatal); and musculoskeletal disorders and back pain (non-fatal, no deaths were recorded). Results were broken down by gender for each condition.
European Agency for Safety and Health at Work – EU-OSHA
23

Estimating the cost of accidents and ill-health at work – A review of methodologies
Cases were calculated by taking the total number of cases of each disease in the French population and multiplying this by the proportion of these cases attributable to work-related stress. This was done using the attributable fractions method, a formula linking the proportion of cases attributable to a risk factor, in this case stress, to exposure to that factor and relative risk; in other words, the strength of the cause and effect relationship between the risk factor and the frequency of an illness for an individual.
Data came from INSERM (the French national institutes of health and medical research), surveys of working conditions and previously published studies.
Biddle (2004)
Biddle examined fatal injuries in the USA and examined data from a US data set that provides detailed information on such cases. For the purposes of calculating costs, data were collected by the authors on age, race, sex and occupation at time of death.
In terms of recommendations for future research, the authors point out that there are two data sets available in the USA for occupational fatal injuries (this study used one), and note that there are differences in the characteristics of decedents captured in each.
Boonen et al. (2002)
This study looked at ankylosing spondylitis (a chronic inflammatory disease of the axial skeleton), but this did not necessarily have an occupational cause. Given this, only a general prevalence estimate of the disease was provided.
HSE (2011)
This study examined all types of injury and newly occurring occupational illness, and the resulting absences from work. Data on all except fatal injuries and some serious injuries were taken from self-reported cases in the LFS. Fatal and some serious injuries must be reported under United Kingdom regulations (RIDDOR — Reporting of Injuries, Diseases and Dangerous Occurrences Regulations), and the number of cases was obtained from these reports. Cases of a person permanently withdrawing from the workforce (expecting not to return) as a result of their injury or illness were also recorded.
Cases were broken down by category: minor injuries; RIDDOR-reportable (major) injuries; fatal injuries; and illness.
The authors did not include occupational cancer, or other long-latency diseases, because of the difficulty of capturing this in the LFS, but acknowledge that the inclusion of this, which is a work in progress, would substantially increase costs.
The authors note that, as with any survey, data from the LFS may be subject to sampling errors. In order to minimise this, several years of data were collected and pooled, and an annual average estimate was used to smooth out random year-to-year variation.
The study suggests that using an incidence approach helps better evaluate costs further on as it captures current working conditions and their associated costs.
They also note some limitations to the methodology used to estimate the number of cases: Those on long-term sick leave lasting over a year but who still expect to return to work are not
captured. Only the most serious illness per person per year and only the most recent injury are captured. The LFS counts ‘people’ as opposed to ‘cases’, meaning that there is an underestimation of
time off for those people experiencing more than one incident per year. For those who do not return to work, the injury or illness may not necessarily be a new case
and some withdrawals will be based on previous working conditions.
European Agency for Safety and Health at Work – EU-OSHA
24

Estimating the cost of accidents and ill-health at work – A review of methodologies
Koningsveld et al. (2003)
Koningsveld examined injuries and ill health in the Netherlands for individual years. The researcher used information from the social security administrations and expert judgement to estimate the percentage of work-related absence and disability for injuries and a wide variety of different classifications of illness. Medical costs related to work-related diseases are also based on available literature and expert judgement. Information regarding gender is available and used.
The work drew on a previous study by the author and a collaborator. Work relatedness was largely based on expert judgement — a strength given that information on work-relatedness is rarely available. Looking at long-latency diseases, it is a limitation of this study that only the working population (age 15–65 years) is included. Diseases experienced after working age are not considered in this study, even though they could be related to work. In addition, self-employed workers are not included.
Leigh et al. (2001, 2003)
Leigh et al. looked at injuries and illnesses in California. The number of cases was calculated on an incidence basis, with each case followed for two years. The authors used different sources for fatal and non-fatal injuries and illnesses.
For fatal injuries the USA has a Census of Fatal Occupational Injuries (CFOI), and this was used to establish the proportion of cases likely to apply to California but taking into account different national estimates in order to allow for the potential undercount of minorities in the CFOI figures.
A similar methodology was applied for non-fatal injuries, using survey data to provide a percentage for California that was then applied to the national estimates. These estimates were then categorised into disabling or non-disabling estimates, taking at least one work day lost as a disabling injury. As national estimates include workers who may not be counted in the survey data, such as farmers, government workers and the self-employed, and assume that firms underreport by a certain percentage in survey data (as they have an economic and reputational incentive to do so), the authors adjusted the California percentage from the survey data for this. Additionally, they did so based on California being more generous in granting disability compensation than the national average. This also relies on the assumption that the injury rate for those excluded from the survey data is the same as those included. The authors note that making these adjustments and assumptions is a limitation on the accuracy of the data, as well as pointing out that trends in instances of injury were declining while absence length was rising, introducing an unknown bias on future predictions.
For illnesses, both fatal and non-fatal, the authors use a population attributable risk method, taking a similar approach to the Béjean and Sultan-Taïeb (2005) study. They estimate percentages of instances for various illnesses to be work related, drawn from the literature on the subject, and apply this percentage to epidemiological data. A range of values are provided to acknowledge the uncertainty of such estimates. They exclude all illnesses in the under 25s and fatalities in the over 64s. They assume that no deaths or illnesses are caused by worry over job loss and do not include ‘sick building syndrome’ (workers becoming ill as a result of building conditions, particularly fresh air supply). Circulatory diseases were also limited to people under 65. A variety of sources were used, including a government survey, a government compensation programme, a surveillance programme for lead poisoning and previous work by the same author. As before, the authors noted the limitations of survey data, noting the exclusion of many farm workers, government workers and the self-employed, as well as the economic incentive of firms to underreport.
Rikhardsson and Impgaard (2004)
Investigating non-fatal occupational injury in Denmark, the authors surveyed companies in the service, construction and production industries. Accidents were categorised as either serious (absence of 35–361 days), less serious (absence of 2–114 days) or typical (absence of 2–21 days). In addition to
European Agency for Safety and Health at Work – EU-OSHA
25

Estimating the cost of accidents and ill-health at work – A review of methodologies
absence, frequency of occurrence was taken into account in the classification of accidents. Nine types of accident were observed for each of the above categories.
The authors note that different companies do use different definitions, hence the overlap in the absence lengths, and that, as the companies classified accidents themselves based on the selection criteria from the researchers, a lack of consistency could lead to inaccuracies. Finally, while noting that the method for establishing cost burden can be used for other companies, they stress that due to the nature of the method and sample, the results themselves cannot be generalised as they are specific to the companies surveyed.
Safe Work Australia (2012)
This study investigated all injuries and illness, fatal or non-fatal, in Australia. The authors took an incidence approach, assessing new cases that arise during a given year.
For injuries, details of new workers’ compensation cases for the reference year were combined with estimates from government survey data to assess compensated and uncompensated injuries for cost calculations. Injuries were classified in five categories of severity, ranging from short absence (less than five days) to fatality. This method excludes those who lost only part of a shift or had no time off and assumes that distribution of the severity of incidents (found in the compensation data) was the same for uncompensated incidents (excluding fatalities), which the authors expect to be a conservative assumption.
A similar approach was taken for illness, except that disease fatalities were assumed to be at a similar level to a previous study by the Australian government and additional estimates were included for disease morbidity, which is known to be unreported often in both of the sources used. For these additional morbidity estimates, data on four key work-related diseases were included: neoplasm, asthma, respiratory disease and heart disease. These came from government figures as well as the literature.
5.2.2 Assessment of methodologies The reviewed studies predominantly focused on costs and many relied on existing literature, surveys and statistics to calculate the number of cases. In particular, compensation statistics and company surveys could be used to establish occupational injuries and illness.
In particular for illness, other studies, faced with general information on the incidence or prevalence of certain illnesses, were required to establish the number of these illnesses that had occupational causes. Generally this can be done through the population attributable risk method, or attributable fractions method, by which the probabilities of exposure to a risk factor and relative risk of developing a condition are established and applied to the figure. Literature can be sourced for this and applied to epidemiological data, or expert opinion can be sought. Naturally, this introduces uncertainty into the estimates, but establishing the cause of illnesses is certainly challenging.
Where possible, the more information that can be gathered on gender, occupation and particularly the severity of the injury or illness, the better, as this will allow more accurate costing further on.
Either the incidence or the prevalence method can be used: the incidence approach calculates the number of new cases in a given year, while prevalence counts the number of existing cases. This largely depends on the costing methodology intended to be used, but incidence data may provide a better estimate of current working conditions.
When using survey data or extrapolating from statistical information there is always a risk of sampling error and this must be borne in mind. Additionally, there may be random year-on-year variations, so it is useful to take an average of several years of data where possible.
Perhaps more problematically, underestimation is frequently expected to have occurred, for a variety of reasons. Fatal and serious injuries are generally the least problematic, as there are often laws requiring reporting and the cause is generally obvious. However, for less serious injuries and illness there are expected to be many cases missed in survey and epidemiological data. Some of the
European Agency for Safety and Health at Work – EU-OSHA
26

Estimating the cost of accidents and ill-health at work – A review of methodologies
problems flagged up in the studies include self-assessment in survey data; counting only the most serious injury or illness in a given year; the lack of reach of statistics to the self-employed; and the difficulty in establishing data when an occupational injury or illness results in no or very little time off. Questions were also raised as to the incentives of firms to underreport — this can vary depending on the administrative requirements and/or the economic consequences that firms face.
The most severe underestimation may be the difficulty of establishing a work-related cause to many diseases, particularly if they involve exposure to a disease-causing agent and may not manifest for a long while, even after retirement. In addition, worry over job loss and other intangible factors may contribute to illness, although some research into stress has been carried out. Compensation statistics in particular may underreport, given that, in order to be counted, a case may have to have been explicitly assessed as work related following an application. Additionally, studies often do not include the self-employed in their statistics.
There is no simple method that can be used to account for these issues, and many studies acknowledge that they cannot correct for all underreporting with any degree of accuracy. Adjustments using expert opinion and a variety of literature sources to establish the number of cases of injury and illness that are work related must be recommended and there is on-going research in this area.
5.3 Methods for estimating economic costs Table 4 presents an overview of the economic costs estimated by the different studies. Table 4: Overview of studies estimating economic costs
Cases Perspective Productivity costs
Healthcare costs
Quality of life losses
Administration costs
Insurance costs
Fatal injuries
Workers and families
Biddle (2004)
HSE (2011)
Leigh et al.
(2001) SWA (2012)
HSE (2011)
SWA (2012) HSE (2011) HSE (2011)
Employers
HSE (2011)
Romero (2010)*
SWA (2012)
HSE (2011)
Leigh et al. (2001)
Romero (2010)*
SWA (2012)
HSE (2011)
Government HSE (2011)
SWA (2012)
Biddle (2004)
HSE (2011)
Leigh et al.
(2001)
HSE (2011)
Leigh et al. (2001)
Society HSE (2011)
SWA (2012)
Non-fatal injuries
Workers and families
HSE (2011)
Leigh et al.
(2001)
SWA (2012)
HSE (2011)
SWA (2012) HSE (2011) HSE (2011) HSE (2011)
European Agency for Safety and Health at Work – EU-OSHA
27
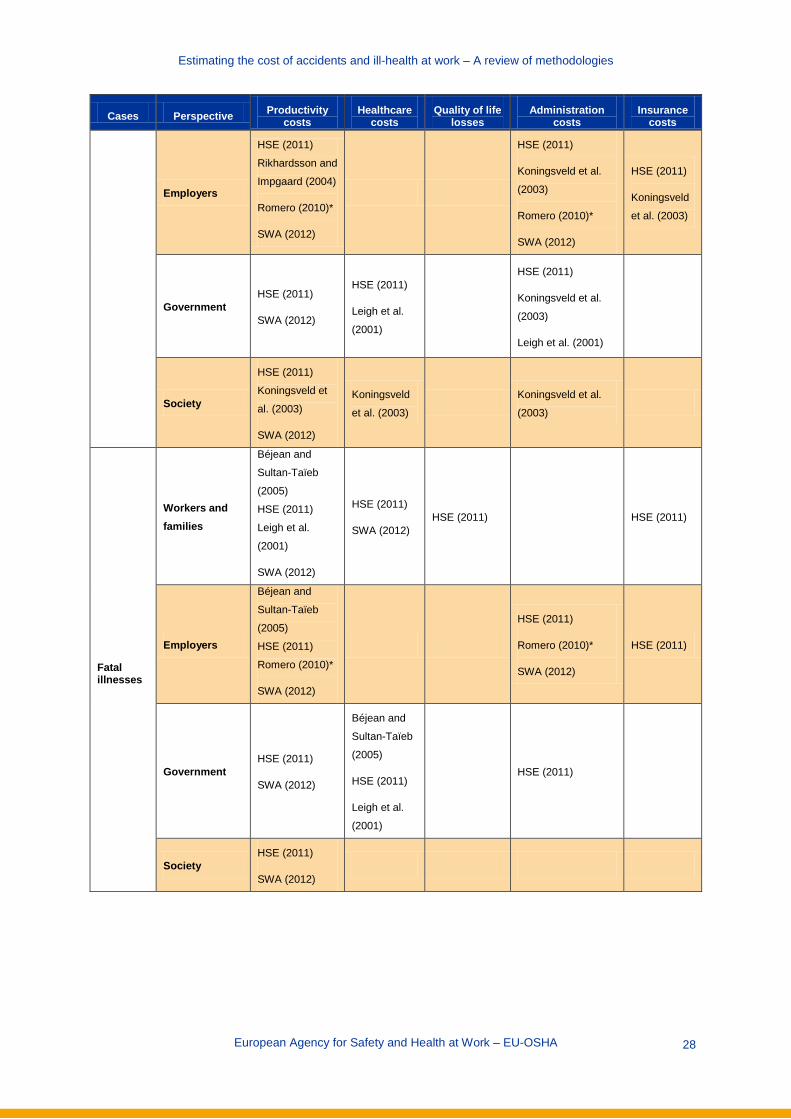
Estimating the cost of accidents and ill-health at work – A review of methodologies
Cases Perspective Productivity costs
Healthcare costs
Quality of life losses
Administration costs
Insurance costs
Employers
HSE (2011)
Rikhardsson and
Impgaard (2004)
Romero (2010)*
SWA (2012)
HSE (2011)
Koningsveld et al.
(2003)
Romero (2010)*
SWA (2012)
HSE (2011)
Koningsveld
et al. (2003)
Government HSE (2011)
SWA (2012)
HSE (2011)
Leigh et al.
(2001)
HSE (2011)
Koningsveld et al.
(2003)
Leigh et al. (2001)
Society
HSE (2011)
Koningsveld et
al. (2003)
SWA (2012)
Koningsveld
et al. (2003)
Koningsveld et al.
(2003)
Fatal illnesses
Workers and families
Béjean and
Sultan-Taïeb
(2005)
HSE (2011)
Leigh et al.
(2001)
SWA (2012)
HSE (2011)
SWA (2012) HSE (2011) HSE (2011)
Employers
Béjean and
Sultan-Taïeb
(2005)
HSE (2011)
Romero (2010)*
SWA (2012)
HSE (2011)
Romero (2010)*
SWA (2012)
HSE (2011)
Government HSE (2011)
SWA (2012)
Béjean and
Sultan-Taïeb
(2005)
HSE (2011)
Leigh et al.
(2001)
HSE (2011)
Society HSE (2011)
SWA (2012)
European Agency for Safety and Health at Work – EU-OSHA
28

Estimating the cost of accidents and ill-health at work – A review of methodologies
Cases Perspective Productivity costs
Healthcare costs
Quality of life losses
Administration costs
Insurance costs
Non-fatal illnesses
Workers and families
Ayres et al.
(2011)
Béjean and
Sultan-Taïeb
(2005)
HSE (2011)
Leigh et al.
(2001)
SWA (2012)
Ayres et al.
(2011)
HSE (2011)
SWA (2012)
Ayres et al.
(2011)
HSE (2011)
Ayres et al. (2011)
HSE (2011)
Koningsveld et al.
(2003)
HSE (2011)
Employers
Ayres et al.
(2011)
Béjean and
Sultan-Taïeb
(2005)
Boonen et al.
(2002)
HSE (2011)
Romero (2010)*
SWA (2012)
HSE (2011)
Koningsveld et al.
(2003)
Romero (2010)*
SWA (2012)
HSE (2011)
Koningsveld
et al. (2003)
Government
Ayres et al.
(2011)
HSE (2011)
SWA (2012)
Ayres et al.
(2011)
Béjean and
Sultan-Taïeb
(2005)
HSE (2011)
Leigh et al.
(2001)
Ayres et al. (2011)
HSE (2011)
Leigh et al. (2001)
Society
Ayres et al.
(2011)
Boonen et al.
(2002)
HSE (2011)
SWA (2012)
Koningsveld et
al. (2003)
Koningsveld
et al. (2003)
Koningsveld et al.
(2003)
HSE, Health and Safety Executive; SWA, Safe Work Australia. *Romero (2010) does not estimate costs, but describes the development of a software tool for use in calculating costs of work-related injury and illness.
European Agency for Safety and Health at Work – EU-OSHA
29

Estimating the cost of accidents and ill-health at work – A review of methodologies
Table 4 shows a wide range of possible scopes — from models covering both injuries and illnesses, fatal and non-fatal, to models that are specific to only a particular illness. Similarly, there is wide variation in terms of perspectives and types of costs. The majority of studies include productivity costs. Healthcare costs and administration costs are also fairly well covered, as opposed to quality of life losses and insurance costs, which are less frequently accounted for. In terms of perspectives, workers and families, employers and governments are all considered in several studies. The description of the methods applied in each of the study is presented in the Technical Annex. For each study, the number of entries (rows) is dictated by the types of accidents/illnesses, perspectives and types of costs estimated. The remainder of this section is organised into five subsections, one for each type of cost: productivity, healthcare, quality of life, administration and insurance. For each cost type we analyse the methodologies used by the studies and then provide a comparative assessment of the alternative methodologies used in the literature. As with the numbers of cases, the structure below does not directly compare individual papers because of the variety of methodologies used. Rather, the methodologies of each are described and an overall assessment of methodologies is provided. Three specific methodologies are used by two or more papers, so a summary explanation of how they are used is given here. The human capital approach takes the time that would have been spent on productive activity (i.e. work) and monetises it by multiplying it by the wage rate of the person in question. The friction cost method assumes that a worker will be replaced and monetises only the time until this occurs (the ‘friction period’). Willingness-to-pay is a tool that monetises intangible costs or benefits by asking respondents ex ante what they would be willing to pay to avoid (or reduce the risk of) an event, for example disability, happening.
5.3.1 Productivity costs All 10 studies address productivity costs, from a particular perspective or several:
Ayres et al. (2011): workers and families, employers, the government and society for occupational asthma.
Béjean and Sultan-Taiïeb (2005): employers and workers and families for occupational stress-related cardiovascular disease, depression and musculoskeletal disorders or back pain.
Biddle (2004): workers and families for fatal injuries. Boonen et al. (2002): employers and society for ankylosing spondylitis (5), specifically looking
at international differences between the Netherlands, Belgium and France. (The cases of ankylosing spondylitis studied may not have an occupational cause.)
HSE (2011): workers and families, employers, government and society for all occupational injuries and illness.
Koningsveld et al. (2003): society for non-fatal occupational injuries and, predominantly, illnesses.
Leigh et al. (2001): workers and families for all occupational injuries and illness. Rikhardsson (2004): employers for occupational injuries. Romero (2010): employers for occupational injuries and illnesses. Safe Work Australia (2012): workers and families, employers, government and society for all
occupational injuries and illnesses.
Methodologies by study
Ayres et al. (2011) Constructed an evidence-based model of new occurrences/diagnoses of occupational asthma,
aiming to predict the effects on an individual’s ability to work and his or her wider life, including usage of health services.
(5) Ankylosing spondylitis is a type of chronic (long-term) arthritis that affects parts of the spine, including bones, muscles and ligaments.
European Agency for Safety and Health at Work – EU-OSHA
30

Estimating the cost of accidents and ill-health at work – A review of methodologies
The model is based on a hypothetical male and female developing occupational asthma after exposure to one of three agents causing occupational asthma. The model assumes that 25 % of these remain in the same job with the same employer, 25 % move to a different job with the same employer, 15 % change employer and 15 % retire from the workforce completely. These states have associated salary reductions. The reviewed studies show that, at the time of follow-up, about 20 % of individuals with asthma are unemployed — further assumptions were made about whether these individuals return and at what wage level.
Data came from the United Kingdom SWORD scheme and the LFS. For workers and families, the authors used a willingness-to-pay method to assess the
indirect, opportunity costs of production loss due to illness. Willingness-to-pay involves asking (healthy) individuals how much they would pay to avoid a certain outcome.
o The authors noted that the wider costs of illness (not productivity costs) were covered in this method: pain and suffering/quality of life costs, which are not usually assessed in cost of illness studies. This model also included costs to the friends and family of sufferers.
The net cost to government of incapacity benefit and industrial injuries disablement benefit, as well as statutory sick pay, was estimated.
For employers the cost of sickness absence and the one-off labour turnover cost when an employee does not return to the same position were estimated using the same methodology and data sources. The costs of workplace modification were not included, as this is site specific.
As the overall cost to society, all figures were summed (avoiding double counting), and presented as total direct costs and total indirect costs (one-off costs as well as annual recurring costs).
The authors noted that their cost of illness approach, by costing the existing patterns of diagnosis, treatment and rehabilitation, allows more accurate assessment of new cases occurring during the time period studied. The model does not question the relative net benefits of other potential uses of these resources.
Limitations identified included the use of six hypothetical cases rather than actual patient data.
Béjean and Sultan-Taïeb (2005) Béjean and Sultan-Taïeb measured costs according to two separate hypotheses, using a
prevalence approach, assessing costs for the overall number of cases in a given year: o Hypothesis 1 uses the widely-employed human capital approach, where lost output is
valued according to wages that would have been earned. In this case, the number of days of work lost before retirement age is multiplied by wage, proxied in this case by GDP per person per day, which also avoids ethical issues surrounding the different valuations of the time of different patients, according to wage. The authors noted they used this method for purposes of international comparison.
o By contrast, Hypothesis 2 — which is employed only in cases of premature death — suggests that all time, including retirement years, is valuable, and costs the number of years of life lost (measured using average life expectancy) by GDP per person, i.e. wealth created per person per year. This is based on the notion of what payment would be made by the occupational illnesses and work injuries branch of the public health insurance system if the occupational origin of diseases were to be acknowledged.
Data on cardiovascular disease and depression come from studies by Letouzey et al. (1996) and Le Pape and Lecomte (1996), respectively. The source for musculoskeletal disease and back pain was not given.
European Agency for Safety and Health at Work – EU-OSHA
31
Estimating the cost of accidents and ill-health at work – A review of methodologies
For employers, only Hypothesis 1 is relevant, and the cost of sick leave is calculated according to this methodology (using a discount rate of 5 %, and assuming an economic growth rate of 2 % year on year).
The authors did not include costs of early retirement, because of a lack of data, but estimate that this would add one-third to the costs they identified.
The back pain share of costs is identified as being very low. The authors suggest that this is because of underrecognition of the occupational nature of these conditions, as compared with cardiovascular disease and depression.
This is a high-level study and the authors suggest future research disaggregating figures by sex and occupation.
For future studies the authors recommend using an incidence approach (lifetime costs of new cases used to measure average yearly costs) rather than a prevalence approach when assessing the effects of increased stress on health.
For workers and families both hypotheses were assessed and compared. The same discount and growth rates as above were employed. No costs for musculoskeletal disorders and back pain were counted using this method. Hypothesis 2 yielded larger results as it valued more time.
Biddle (2004) • The author attempted to quantify the productivity loss of fatal injuries from the perspective of
workers and families, by calculating earnings and non-market production over the expected life years lost. A version of the human capital approach was used.
• This was done using the following four elements, based on government statistics and survey data:
o Base wages: defined as median annual earnings before taxes and other deductions. These figures were presented by occupation, sex and age, using similar occupations when necessary.
o Employee benefits: these were added to the base wage to represent more accurately the market value of a worker, as a percentage of payroll and before tax. Benefits included employers’ contributions to retirement funds, life insurance and medical benefits. They did not include items such as paid rest periods, travel time or payment for time not worked.
o Both of the above were adjusted by economy-wide productivity gains (wage rises in concert with productivity growth) and life cycle growth (salary growth resulting from worker experience, assessed by comparing age group data), based on historical data. These adjustments are based on the expectation that workers’ wages would have risen over time owing to economic growth and their own career progression. A long-term economic growth rate was used, as wages are predicted for up to 50 years.
o Lost household production (non-market costs), calculated with time diary data by asking respondents to record time spent on non-market production over a period of time, including areas such as household production, care provision, leisure and education. These were valued according to the market replacement value of time (i.e. how much a professional would cost for the same tasks) and adjusted for inflation.
A 3 % discount rate was used, as suggested by all agencies within the US Department of Health and Human Services.
All figures were inflation adjusted, using constant dollars (rather than current dollars) to allow for aggregation against different years of death.
For wage calculations, the number of deaths was assumed to be approximately the same each month (so that wage growth calculations were reduced by half for year one).
The author points out that the theoretical approach of the model is easy to understand and calculate and that data are relatively easy to acquire.
European Agency for Safety and Health at Work – EU-OSHA
32

Estimating the cost of accidents and ill-health at work – A review of methodologies
Limitations identified include the fact that the human capital approach ignores individuals’ preferences (unlike willingness to pay, for example), and that the model does not include career changes or multiple jobs.
In addition, time diaries for lost household production can be called into question as they rely on self-reported data.
Boonen et al. (2002) This study collected data from patients with ankylosing spondylitis through the use of
questionnaires: economic questionnaires on the use of ankylosing spondylitis-related health resources every two months and sociodemographic data every six months. These were adapted for each of the three countries studied: the Netherlands, France and Belgium.
A prevalence-based, prospective, disease-specific cost of illness analysis was designed to calculate costs to society. Only paid production was taken into account (i.e. the model excluded patients disabled for work, retired persons, students and those who were voluntarily unemployed). Two methods were used for the assessment of productivity costs: the human capital approach and the friction cost method. The latter assumes that after a friction period a lost worker will be replaced and that lost production occurs only during the friction period. A four-month friction period was assumed based on data from the Netherlands.
Self-reported income was used to assess production value per work day. This was adapted, if applicable, for the number of contractual work days per month and the income out of work disability (according to each country’s benefit scheme).
Values are presented as friction costs for those in a paid job and for all patients and as human capital costs, broken down by absence and disability, for each of the three countries.
Friction costs for those in a paid job can be used to estimate costs to employers. Data were sourced from Eurostat, OECD health data, national and European statistics and
national government ministries. An important conclusion drawn from results was that the country in which a patient lives can
make a significant difference to costs. The authors speculate that this is because of the different incentives provided by different social security systems and/or economic prosperity. They caution against generalising across countries and call for international, comparable reference data.
HSE (2011) The HSE study, which calculates aggregate costs for the United Kingdom, distinguishes, for
workers and families, between those who do return to work and those who do not, taking a human capital approach.
o For those who do return to work, average gross pay per day (including overtime, bonus payments, etc.) is multiplied by the time off for absences up to 12 months, minus taxation saved and government benefits (occupational sick pay and statutory sick pay) received.
o For those who do not return to work, the loss of all gross salary up to retirement is calculated (working years lost, taking into account life expectancy), adjusted for real growth — net of inflation — in expected salary and average changes in salary due to age and experience. Again, taxation saved and government benefits received are subtracted from the total. This is discounted to present values and assumes no earnings after retirement. For fatalities, the process is the same except that no benefits would be received. Data come from the LFS and the sample size for ‘never returns’ is too small to estimate a male–female proportion. For fatalities, male average earnings are assumed, as most workplace fatalities are among males.
Data come from the United Kingdom Annual Survey of Hours and Earnings as well as the LFS. The authors point out that there may be some underreporting as the LFS counts ‘people’
European Agency for Safety and Health at Work – EU-OSHA
33

Estimating the cost of accidents and ill-health at work – A review of methodologies
rather than ‘cases’, underestimating the amount of time off for those who suffered more than one incident in a year. The sample size for ‘never returns’ is small, so estimates are top down.
They also note that long-latency illnesses are not captured by the LFS and future research should make this feasible.
Costs to employers are presented in three categories: o Employers’ occupational sick pay, statutory sick pay and national insurance
contributions, minus government reimbursement. For the self-employed, absence profiles are multiplied by sick pay rates and eligibility criteria.
o Work reorganisation costs, based on manager time for redistributing the sick or injured employee’s work and calculated as needing half a day on average, plus 29 % typical non-wage costs, according to data sourced from a study by the Chartered Institute of Personnel and Development (CIPD).
o Recruitment costs of temporary workers to cover absences greater than six months. These are based on data from CIPD and assume that employers wait 28 weeks before recruiting a replacement employee.
The authors flag a potential underreporting in comparing their data on average working days lost per worker per year as a result of work-related absence: (1.5 days vs. 8.4 from the CIPD study). They also note that the CIPD study potentially has lower response rates than other surveys.
For government, HSE identifies costs of benefits paid and reductions in income tax and national insurance received. The study determined which cases are able to claim against which type of replacement income from the government and identified different sources and levels of income:
o for the current year, time away from work was multiplied by the appropriate daily rate and the proportion of the population assumed to claim it; and
o for future years, a yearly rate was used and discounted to present values (for ‘never returns’ and fatalities).
Data came from the United Kingdom government (Department for Work and Pensions). The key assumption in this methodology is that workers who do not permanently withdraw from the workforce are able to return to their normal jobs at pre-injury/illness salary level.
Costs to society aggregate these costs, while removing transfer costs (i.e. benefits and taxation). Assuming that the employer directly affected seeks to maintain its output, the net cost to society is the gross loss of earnings from the absent worker — this is the only production loss to society as a whole.
Koningsveld et al. (2003) Societal costs related to worker absence and worker disability were calculated, with costs
broken down for different illnesses and injuries. For absence, the total worker salary costs in the Netherlands were multiplied by the
percentage of absence at work related to work-related diseases and injuries. The percentage of work-related absence is bases on expert judgement.
For disability, disability payments in the Dutch social security system were multiplied by the percentage of cases identified as being work related.
Underreporting may have occurred as the self-employed, the effects on company performance and its potential decrease in productivity after an illness or accident or the possibility of early retirement before the disability were not included.
Attention was paid to the avoidance of double counting of costs in aggregation, where at all possible (particularly among overlapping social security), and some costs were included provisionally.
European Agency for Safety and Health at Work – EU-OSHA
34

Estimating the cost of accidents and ill-health at work – A review of methodologies
Leigh et al. (2001) This study also takes a human capital approach to estimate productivity costs from the
perspective of workers and families. It calculates lost wages, lost fringe benefits and lost home production.
o For non-fatal injuries and illness, lost wages are calculated from workers’ compensation paid out, according to the ratios of wages replaced based on category of disablement (death, permanent total, permanent partial, temporary total and partial combined, medical only). Fringe benefits, such as employer-funded insurance (health, life), childcare and pensions, are calculated as 23.3 % above wages. Home production is estimated from a study by Douglas et al. (1990).
o For fatalities, the same applies except that the calculation is based on the wages of someone the same age and gender of the deceased, discounted to present value. This assumes that the deceased would have earned what others of the same age and gender earn.
Data for non-fatal injuries and fringe benefits come from studies by Telles and Fox (1997) and Jacobs (1997), respectively. Non-fatal illnesses draw on US Bureau of Labor Statistics (BLS) illness and injury data and the Adult Blood Lead Epidemiology and Surveillance programme. Fatal injuries data come from the US Census of Fatal Occupational Injuries, while fatal illnesses data come from the US National Center for Health Statistics (mortality data) and BLS (earnings, labour force participation and life table estimates).
The authors suggest that one of the strengths of their approach is the use of worker compensation data to avoid calculated estimates of salary, noting that, in the year of study (1992), compensation was paid for almost 100 % of claims. They also note the simple calculation methodology and that the data used are incidence based and follow each case for two years.
In terms of limitations, the authors note that pain and suffering costs are not included and that no damage costs are included for injuries that would eventually lead to arthritis or the effect of dull, repetitive work on dementia (i.e. long-latency diseases).
Rikhardsson (2004) Rikhardsson estimates costs to employers using a method described as systematic accident
cost analysis. This method is based on mapping activities, where costs are seen as being caused by the activities of managers and employees. Cost categories used are time (hours where wages are paid for no work effort), materials and components used or lost as a result of the accident, external services such as temporary replacements and other less frequent costs such as rehabilitation. Using company data, these are categorised and broken down by type of accident: absence is the greatest contributor to cost (65 % of total cost), followed by operation disturbance at 14 %. Some costs that were deemed unrelated to the accident itself but related to equipment, for example material damage to equipment, are not included.
The authors target this approach at managers, suggesting that it is simple to apply as it reflects traditional accounting systems but goes further by identifying the separation of costs. However, the study does not give unit costs for each type of activity identified, only a percentage of total costs for each type of accident.
Romero (2010) This study describes the development of a software tool for employers, and lists the costs to
be collected and included in the tool to estimate costs of occupational injuries and illnesses. They advocate a human capital approach, taking into account the direct wage costs of those off work minus government contributions to their sick pay. They suggest including indirect wage costs (salaries of the personnel involved in investigating, disclosing, discussing and
European Agency for Safety and Health at Work – EU-OSHA
35

Estimating the cost of accidents and ill-health at work – A review of methodologies
preventing the incident or accident), as well as decrease in productivity through machinery damage (interrupting production), evacuations, clean-up, transportation and preventative activities. A case study is given but no costs are reported in the study. European Community classifications for time needed for investigations into occupational accidents are used: simple investigation (1.5 hours), standard investigation (6.5 hours) and detailed investigation (27 hours). The methodology was developed from the Spanish National Institute for Safety and Hygiene at Work.
Safe Work Australia (2012) For employers, this study costs lost productivity from absent workers and lost potential
output, using both the friction cost method and the human capital approach. Costs are grouped into two categories: short-term costs until production is restored to pre-incident levels (production disturbance costs); and long-run costs, that is decrease in potential output occurring after production is restored to pre-incident levels (human capital costs). The friction cost method is employed for the former, which assumes that structural unemployment allows a worker to be replaced if necessary after a friction period, while the human capital approach is used for the latter. The study uses an incidence approach, where lifetime costs of new cases occurring during the reference year, discounting future costs, are calculated as a proxy for costs in the reference year of cases already in the system that year. Costs are assigned ex post, that is after the incident.
Costs are additionally subcategorised according to the severity level of the accident: short absence, long absence, partial incapacity, full incapacity and fatality, as well as their compensated/uncompensated status and whether they are brought on by disease or injury.
Workers’ compensation premiums paid by employers are not included as they are considered a transfer cost to society — the study as a whole takes a societal approach, although these costs will impact employers.
The authors describe their assumptions as deliberately conservative, and note that costs ‘that cannot be specifically related to injury or illness to employees (such as damage to property and loss of company image)’ (p. 4) are not included.
A friction period of (maximum) four weeks is assumed. After six months of absence, a worker’s capacity is assumed to be reduced as there is no reliable indicator of return to work status (capacity). If there is no absence at all, contribution to total employer costs is assumed to be negligible.
Current treatment costs are assumed to be a good predictor of the type and level of future costs.
Data were sourced from the Australian Bureau of Statistics and Safe Work Australia’s Comparative Performance Monitoring Report (CPMR).
Limitations identified by the authors include the assumption that, without absence, there are negligible costs, noting that it is difficult to measure productivity drops at work; the model is not exhaustive of all possible cases and combinations of absence and capacity, assuming that capacity is reduced once six months of absence is reached; and the incidence approach is not as accurate in theory as a prevalence basis, but that the latter tends to underestimate as it relies on data already in ‘the system’ at a given point during the reference year.
The authors also raise the point that these costs represent only one side of the work health and safety equation; the costs of complying with regulations and preventative activities are not included.
For workers and families, human capital costs are calculated based on the loss of current and future earnings. This is calculated as a residual between total human capital loss and deadweight loss to society from taxation and welfare redistribution, representing lost future productivity and largely driven by the prevailing wage rate. This does not include the cost of
European Agency for Safety and Health at Work – EU-OSHA
36

Estimating the cost of accidents and ill-health at work – A review of methodologies
pain and suffering, although they note that an earlier study did so to some extent. Data come from the Australian Bureau of Statistics and the CPMR.
For the government, the cost of providing social welfare programmes is calculated, based on data from the Australian Bureau of Statistics and the CPMR.
For society as a whole, compensation premiums and welfare are treated as a transfer cost to society, so are not included, meaning that only those costs relating to a decrease in potential output and revenue are added together. Overall, the human capital approach is used rather than the friction cost method, as the authors note that ‘while some lost potential is likely to be “picked-up” by previously unemployed workers entering the labour force, it will not be entirely replaced’ (p. 16).
Assessment of methodologies
For workers and families, almost all studies used a version of the human capital approach to value lost production. Only Ayres et al. (2011) used the willingness-to-pay method in order to holistically include pain and suffering and quality of life losses in a single metric. For productivity losses alone, however, the human capital approach is more popular.
When using the human capital approach, the basic method is to calculate time off as a result of absence or permanent disability and multiply it by the wage rate. Early retirement associated with work-related injury or illness should also be included — this contributes significantly to totals, especially with an ageing population. Simply valuing paid production means establishing the number of days missed from work through absence or from the point of leaving the workforce as a result of disability until retirement. The wage rate can be established through data on specific occupations, ages, genders and other categories.
Some extra detail can make this estimation more accurate, as most of the studies reviewed have done to some extent. These include adding employee benefits to give a more accurate impression of income, subtracting the taxation that would have been paid and the benefits/compensation received when absent from work or disabled, applying a discount rate to future earnings and building in growth — both overall economic growth over time and growth in wage expected as a result of career progression. Once applied, this figure is a good approximation of lost production from the individual’s perspective.
‘Presenteeism’, or reduced productivity while at work, is not quantified by any of the studies above, as it is very difficult to measure productivity drops at work. However, self-reported data (e.g. time diaries and surveys) may be able to establish an estimate for this. Non-market production (i.e. productivity that is not financially compensated, such as household activities) undoubtedly also occurs, and is typically valued by the prevailing wage rate of a professional hired to do a similar job (e.g. cleaning) and assessed through self-reported data. This is a useful proxy because data availability is poor, but it may overestimate the decrease in production, as not all non-market production is done to a professional standard.
More broadly, there are further issues with the human capital approach. Using wage rates implicitly values preventing occupational injuries and illnesses among those with higher wages as of greater benefit than among those with lower wages, and there are ethical concerns over this. Similarly, if the analysis is restricted to paid production, people such as the retired, students and the unemployed are assumed not to be productive. An overall average such as GDP per person could be used instead, although this runs into similar problems in international and intertemporal comparison. Valuing all time according to GDP per person (including, for instance, retirement) could also help avoid the exclusion of non-market production, but it still relies on paid production for the calculation of GDP. However, when comparing internationally, percentage of GDP could also be presented.
Nevertheless, the human capital approach remains the simplest and most intuitive method for valuing production losses to workers and families.
For employers, the human capital approach can be used, but the competing friction cost method also applies. The essential difference is the assumption in the former that productivity losses from a lost worker are permanent, whereas in the latter the employer can reinstate production at the same levels
European Agency for Safety and Health at Work – EU-OSHA
37

Estimating the cost of accidents and ill-health at work – A review of methodologies
prior to the occupational illness or injury after a friction period. The friction cost method assumes structural unemployment that can replace workers who have been absent for long periods of time. A reasonable estimation for the friction period must be established, as this can have a large bearing on results.
The reality is most likely somewhere in between. Most economies do contain structural unemployment and replacement workers would be expected to be hired, but there may be a permanent loss of skills and expertise.
In addition, employers may suffer production losses owing to the labour and capital required to repair, reorganise, recruit and rehabilitate following a workplace incident (including damage to property), and this should be valued, together with benefits paid out, as well as loss of clients, contract fines as a result of late delivery, reputation damage and other lost potential.
It is important to note, however, that this is ‘only one side of the work health and safety equation’, as put by the Safe Work Australia study (p. 4), as the costs of complying with health and safety regulation to avoid occupational illness or injury are not established. This also applies to workers and families, but the burden falls particularly on employers. The benefits in OSH improvement of an individual policy or procedure can therefore be measured against the cost of its implementation.
Production costs to the government include social welfare payments paid to victims of occupational illness or injury. However, when analysing production costs from a society perspective, these costs are considered a transfer between the government and workers and families, so they cancel out. Tax revenue loss from the loss or reduction of a worker’s income should also be included.
To assess societal impact, a worker’s gross wage multiplied by time off work (and potentially the valuation of non-market production) plus reorganisation and recruitment costs to the employer represent the overall societal loss of productivity, although there are methodological arguments for use of a friction period instead of gross wage if one assumes that structural unemployment allows the complete replacement of a worker.
5.3.2 Healthcare costs Seven of the ten studies address healthcare costs to some extent:
1. Ayres et al. (2011): healthcare costs affecting workers and families and the government for occupational asthma.
2. Béjean and Sultan-Taïeb (2005): healthcare costs affecting the government for occupational stress-related cardiovascular disease, depression, musculoskeletal disorders and back pain.
3. Biddle (2004): healthcare costs affecting the government for fatal occupational injuries. 4. HSE (2011): healthcare costs affecting workers and families and the government for all
occupational injuries and illnesses. 5. Koningsveld et al. (2003): healthcare costs affecting society for all occupational injuries and
illnesses (non-fatal). 6. Leigh et al. (2001): healthcare costs affecting the government for all occupational injuries and
illnesses. 7. Safe Work Australia (2012): healthcare costs affecting workers and families for occupational
injuries and illnesses.
Methodologies by study
Ayres et al. (2011)
Constructed an evidence-based model of new occurrences/diagnoses of occupational asthma, aiming to predict the effects on an individual’s ability to work and his or her wider life, including usage of health services.
The model is based on a hypothetical male and female developing occupational asthma after exposure to one of three agents causing occupational asthma.
European Agency for Safety and Health at Work – EU-OSHA
38

Estimating the cost of accidents and ill-health at work – A review of methodologies
Direct healthcare costs were sourced for treating asthma, with the assumption that the costs of treating occupational asthma were the same as those for treating non-occupational asthma.
Care was taken to distinguish between the cost burden to the individual (workers and families) and the government.
For workers and families, healthcare costs were presented as unit costs for the following: o planned GP (general practitioner) visits; o unplanned GP visits; o annual spend on medication; o average annual costs of hospital inpatient services; o annual average costs of outpatient services; o average travel costs to engage in healthcare services; and o prescription charges.
For the government, the dimensions were: o general practice (planned); o general practice (unplanned); o medication (net); o hospital admissions; and o outpatient services.
The authors suggest that this approach allows an accurate assessment of the cost of new cases, but is limited by the fact that it used six hypothetical cases rather than actual patient data.
Béjean and Sultan-Taïeb (2005) Healthcare costs to the government were calculated for three occupational stress-related
illness categories in France. For cardiovascular disease (CVD) and depression, healthcare costs were sourced from the
literature and were broken down into hospital care expenses (medicine, surgery, rehabilitation, emergency services) and ambulatory care (fees, pharmacy, biology, imagery and paramedical transport).
For musculoskeletal disorders (MSDs), data were derived from statistics on costs from the National Health Insurance Fund.
In order to update earlier costs from the literature for CVD and depression to the year of study, the authors assumed that the change in the price of medical goods and services was equal to that of consumer goods’ prices; the increased prevalence of CVD and depression affects changes in spending proportionately; and the structure of health spending is stable.
For MSDs, the authors suggested underreporting in the initial data, as only those conditions deemed occupation related by government insurers were included. They suggest that improved knowledge of the medical cost of these conditions is needed to obtain a more precise estimate.
Biddle (2004) This study includes government costs from an occupational fatality in the USA, sourced
directly from medical expenses in the Detailed Claims Information database. To smooth out annual variation, mean medical costs over a four-year period were used.
HSE (2011) This study distinguished between the various medical conditions and injuries captured in LFS
data and estimated healthcare costs using published data (including the United Kingdom Personal Social Services Research Unit) and expert opinion.
European Agency for Safety and Health at Work – EU-OSHA
39

Estimating the cost of accidents and ill-health at work – A review of methodologies
The LFS does not record healthcare visits, so this needed to be identified by expert opinion. For workers and families suffering from injury or illness (except fatal injury), total health
costs were composed of prescription charges, travel/living costs and premiums for private insurance. These were estimated according to the severity of the injury or illness.
o For those who never return to work (proxied by an absence greater than 12 months), long-term medical costs were also estimated, adjusted for above-inflation health cost growth (using the difference between average growth in the hospital and community health services pay and price index and the average growth in the retail price index) and discounted to present value using the treasury discount rate of 3.5 %.
For fatal injuries, funeral costs were calculated. For the government the same approach was used, although in more detail for categories, as
the government bears most healthcare costs in the United Kingdom. Assumptions were made on types of healthcare usage for each category of injury and illness: minor injury, major injury, reportable (under United Kingdom regulations) injury with over three days’ absence, injury leading to permanent withdrawal from the workforce, fatal injury, illness and illness leading to permanent withdrawal from the workforce.
For injuries (non-fatal), the assumptions and cost categories are reported in more depth in the Technical Annex, but included initial examinations, GP visits, prescription charges, ambulance usage, inpatient stays and outpatient clinic visits.
o For those who never return to work additional estimates were made on future healthcare usage, adjusted (as above) and discounted to present values.
For fatal injuries costs comprised ambulance attendance, emergency accident and emergency intervention and the issuing of a death certificate.
For illness, the vast majority of cases would be expected to be managed by a local GP. The authors went into more detail for MSDs, stress, depression and anxiety, as well as chronic breathing and lung problems. Future costs are adjusted and discounted as injuries causing withdrawal from the workforce.
The authors acknowledge that their analysis largely ignores long-latency conditions such as cancer, and that these would substantially increase costs.
Koningsveld et al. (2003) This study valued the total cost to society of illness and injuries. A database of medical costs
was used, as well as literature, and was corrected for work-relatedness, which is based on expert judgement. Corrections were made for the labour participation for men and women.
Values were presented as medical cost estimates for workers in the Wet Arbeidsongeschiktheidsverzekering (Dutch disability insurance scheme) and separately for those at work.
The prevalence method was used, taking all costs for those currently with the illness in a given year.
The authors acknowledge some underreporting: self-employed persons were not counted and, as only the working population was included, long-latency disease could be underestimated because work-related diseases that began after retirement were not included.
However, special attention was paid to double counting and uncertain estimates were presented as provisional.
Leigh et al. (2001) This study assessed costs to the government for occupational injuries and illness in
California. For injuries, estimates of numbers of cases were calculated using the incidence method,
followed for two years, and categorised according to the workers’ compensation insurance
European Agency for Safety and Health at Work – EU-OSHA
40

Estimating the cost of accidents and ill-health at work – A review of methodologies
system for disabling injuries into death, permanent total, permanent partial, temporary total and partial combined and medical only. These estimates were then multiplied by estimates of average costs from the literature.
o Adjustments were made to make up for the lack of workers’ compensation coverage for all injuries as well as the greater medical expense associated with workers’ compensation as opposed to non-workers’ compensation injuries.
• For non-fatal illnesses, national estimates for medical costs of non-fatal diseases were multiplied by California’s contribution to total illnesses reported by the BLS.
• For fatal illnesses, the authors calculated a ratio of hospital days: the total number of days spent by patients with a primary diagnosis for the attributable occupational diseases divided by total hospital days for all diseases and injuries. This ratio was then multiplied by national estimates of medical spending and a correction factor to account for California’s contribution to national health expenditures.
o Data came from national health statistics and the National Hospital Discharge Survey. The authors point to the use of workers’ compensation data as a strength of their estimate, as
it avoids some of the problems involved with calculating estimates, and that in the year of data workers’ compensation was paid for almost 100 % of claims.
However, they note that no damage costs were included for injuries that would eventually lead to arthritis or the effect of dull, repetitive work on producing dementia.
Safe Work Australia (2012) The healthcare costs for workers and families for all injuries and illness were calculated.
These included medical costs and the costs of carers, aids and modifications that were uncompensated by insurance or the government.
The authors used an incidence approach, taking the lifetime costs of new cases occurring during the reference year, with future costs discounted to present values, as a proxy for costs in the reference year for cases already in the system at the start of the year.
Costs were subcategorised by severity level (five categories: short absence, long absence, partial incapacity, full incapacity, fatality) of diseases and injuries. An ex post approach was used, calculating the costs after the incident.
Data came from a variety of data sources, the main ones being Australian compensation statistics, government statistics and the CPMR.
This method assumes that current treatment costs are a good predictor of type and level of future costs.
Additionally, it assumes that there is a negligible contribution to total costs if there is no absence from work, so this is not included.
The authors acknowledge that the incidence cost approach is not as accurate in theory as a prevalence basis, but note that the latter tends to underestimate in practice as it relies on data already ‘in the system’ at a given point during the reference year.
Assessment of methodologies
Healthcare costs represent most of the direct costs of an injury or illness, so require less approximation than other cost types. There are many data available on healthcare costs, and with knowledge of the number of cases and the severity of those cases a reasonable estimate can be made of the healthcare costs resulting from occupational injury or illness, given the inclusion of as many types of cost as possible and adjustments for bias or underreporting.
However, the apportionment of cost to workers and families, government and, to a lesser extent, employers varies tremendously from country to country — or even from condition to condition — according to the healthcare system, and a method or data source useful for one may not apply to the other.
European Agency for Safety and Health at Work – EU-OSHA
41

Estimating the cost of accidents and ill-health at work – A review of methodologies
For workers and families costs can include planned and unplanned GP visits, medication, hospital inpatient services, outpatient services, prescription charges, rehabilitation, emergency services, premiums for private insurance (although this may be classed under insurance costs), funeral costs for fatalities, carers, aids and modifications, and travel costs. Most studies included most of these but many missed carers and/or travel costs, which may be significant cost burdens to an individual. As these costs are not necessarily available in the same health service data sets generally used to establish healthcare costs such as GP and hospital costs, care must be taken to locate data sources that include them.
Often data will not be available for purely work-related injury or illness, but rather a given injury or illness in general. Depending on the national compensation system, it may in some cases be reasonable, however, to assume that costs are the same for an occupational condition as a non-occupational condition, depending on the injury or illness in question. If doing so, this must be stated as an assumption, as it is in Ayres et al. (2011) above, because in some countries work accidents will be better compensated than normal accidents; therefore, this approach may lead to an underestimation.
If data are available only from workers’ compensation statistics — which may show how much a person was reimbursed for out-of-pocket medical expenses — these costs must also be included for those uncompensated, although this may need to be adjusted according to best estimates as uncompensated cases will be expected to carry less cost.
Additionally, there may be underreporting in the case of long-latency disease. It may not be possible at present to count cases of these, but if adjustments can be made this should be done. If not, it should be acknowledged, as in the HSE (2011) study.
When the incidence method is being used, long-term medical costs must be estimated and discounted to present value. While one study used current healthcare costs as a proxy for future healthcare costs, another adjusted medical costs according to inflation and historical price rises or falls after inflation, as measured by a healthcare index. This is to be recommended for accuracy, given that healthcare costs may well increase above inflation due to demographic change and advances in medical technology.
The prevalence method may be more accurate for estimating healthcare costs, as one study pointed out, but does rely on data being in the system in a given year, as current costs for all prevalent cases are calculated. Therefore, if a data source is robust a prevalence method may be recommended but, if not, an incidence method may be more suitable in practice.
For the government, the methodology is the same, with apportionment of costs to the government according to how healthcare is reimbursed in the system. GP visits, medication, hospital admissions, outpatient services and the costs surrounding the issuing of a death certificate for fatalities should all be included. Many governments will hold data sources and statistics on the cost of healthcare, and these should be carefully attributed to the proportion of usage relevant to occupational injury and illness.
No study assessed healthcare costs to employers, presumably because it is rare that an employer will have to pay for healthcare services, and instances such as the use of first aid after an accident can be included as part of the employer’s productivity costs but, if not, should be accounted for under healthcare costs.
5.3.3 Quality of life losses Two studies address quality of life losses: Ayres (2010) and HSE (2010).
1. Ayres et al. (2011): provides estimates of quality of life losses for workers and families for
occupational asthma. 2. HSE (2011): provides estimates of quality of life losses for workers and families for all
occupational injuries and illnesses (including fatalities).
European Agency for Safety and Health at Work – EU-OSHA
42

Estimating the cost of accidents and ill-health at work – A review of methodologies
Methodologies by study
Ayres et al. (2011) • Quality of life losses were approximated using values from willingness-to-pay studies of
health outcomes relevant to occupational asthma. Morbidity costs to individuals were measured by their willingness to pay to avoid quality of life reductions associated with the disease. Mortality costs were estimated by the willingness to pay to avoid the risk of death due to occupational asthma. Values were drawn from a study conducted by the HSE, but no further detail on how these were derived was provided.
HSE (2011) • Quality of life losses were estimated based on existing estimates using stated preferences
from members of the public primarily, but not exclusively, from the road safety literature, an area where a body of evidence already exists. These preferences were elicited in the form of their expressed willingness to pay for reductions in the risks of premature death, injury and ill health and also the trade-offs they say they are willing to make between different levels of these hazards. These values reflect what people would pay to reduce risk, not what they would accept in compensation for suffering. Therefore, the authors acknowledge that they can never fully capture the loss to victims and their families of actual work-related fatalities.
• One of the limitations of the approach used is that the road safety research used injury descriptions that were reasonably representative of the range of road injury types but which were not necessarily suited to work-related injuries. In addition, they were even less easy to map to some important categories of work-related ill health.
o The non-financial human cost of a workplace fatality was equated with the corresponding portion of the value placed on a fatal road accident casualty.
o The non-financial human costs of non-fatal injuries and ill health are pegged to the full willingness-to-pay value to avoid fatalities, using weighting factors based on (i) the time taken off work and (ii) estimates of stated preference relativities between injury and death.
Assessment of methodologies
Quality of life losses have generally not been included in the literature — and when they have been included, as the HSE (2011) put it, ‘there is clearly plenty of scope for the estimates to be improved’ (p. 51). The system of trying to map the wide variety of work-related injuries and ill health categories to a set of road traffic injuries is less than ideal. Nevertheless, it may be the best that can be done at the moment.
5.3.4 Administration costs Six studies address administrative costs to some extent:
1. Ayres et al. (2011): administrative costs for workers and families and the government for occupational asthma.
2. HSE (2011): administrative costs for workers and families, employers and the government for all occupational injuries and illnesses (including fatalities).
3. Koningsveld et al. (2003): administrative costs for society, employers and government for occupational illnesses and injuries.
4. Leigh et al. (2001): administrative costs for government for all occupational injuries and non-fatal illnesses.
5. Romero (2010): administrative costs for employers for occupational injuries and illnesses. 6. Safe Work Australia (2012): administrative costs for employers for all occupational injuries
and illnesses.
European Agency for Safety and Health at Work – EU-OSHA
43

Estimating the cost of accidents and ill-health at work – A review of methodologies
Methodologies by study
Ayres et al. (2011) • Uses survey data to establish commuting costs saved through absence from work, for
workers and families. These are direct costs saved, not opportunity costs of time. Using data from the SWORD scheme, which investigated work-related respiratory disease in the United Kingdom from 1988 to 2006, and the ongoing LFS data on the United Kingdom labour market, average days absent were multiplied by average commuting costs. It is worth noting that the study did not specifically classify these costs as administration costs, but they were captured in our metric.
• For the government, costs of the administration of benefits programmes were calculated based on estimates from the Department for Work and Pensions.
HSE (2011) • Estimates time spent on administration related to benefits programmes for workers and
families (using an opportunity cost approach). This is based on the assumption that it takes between half a day and a day per claim for absences up to six months, rising to a maximum of three days per claim for long-term absences, and that administrative activity takes place at the beginning, midpoint and end of a claim (the three administrative points approach). Time is valued by average wages, based on data from the United Kingdom Government’s Annual Survey of Hours and Earnings.
• For employers and for the government, time spent on administration of workers’ compensation claims was estimated, as was the time spent on the administration of investigations and prosecutions. The former was based on an assumption of 2.5–3.5 hours per case for routine compensation claims, increasing to 2.5 days for complex claims for those who do not return to work. This was multiplied by the number of claims estimated and the average wage for clerical staff to calculate a total value. The latter took local authority and HSE inspector person hours (multiplied by their wage) for the investigation of cases as a proxy for employers’ costs, ‘on the assumption that a similarly qualified person would be expected to spend a similar amount of time per case’ (p. 20).
Koningsveld et al. (2003) • Looks at cost to society of occupational illness in the Netherlands, for absence and disability,
using information from the Dutch social security system. • The governmental costs of OSH enforcement are based on information available from the
Ministry of Social Affairs and Employability and health and safety executives. • Costs related to subsidies are based on information available from the Ministry of Social
Affairs and Employability. These costs can be addressed to the government. • The total cost of research in the field of OSH is based on interviews with different institutes,
research centres and consultancies. Part of this research is paid by the government. All these costs are addressed to society.
• Employers use OSH consultancies but also hire personnel or purchase equipment to improve OSH. These costs are based on the literature.
• Koningsveld et al. totalled all the costs to one figure for society.
Leigh et al. (2001) • Looks at costs in California; estimates hiring, training and disruption costs for employers
when an employee is absent or replaced using (locally adjusted) US estimates for training costs as a proxy.
European Agency for Safety and Health at Work – EU-OSHA
44

Estimating the cost of accidents and ill-health at work – A review of methodologies
• For government costs, a percentage of insurance and indemnity payments allocated towards administration is used (although this is USA specific).
Romero (2010) • Recommends including administration costs (in the specification for a software tool for
employers, based in Ecuador) but does not go into further detail — there is no specific methodology.
Safe Work Australia (2012) • Estimates a variety of employer costs: recruitment and retraining costs; fines and penalties
for health and safety breaches; and administration of compensation schemes, investigations and legal costs. Takes an incidence approach, estimating total (lifetime) costs for any new cases arising in a given year. Data come from a variety of Australian statistical sources. The study points out this is only one side of the work health and safety equation for employers, as there are costs involved in complying with regulation and preventative activities not resulting from occupational illness and injury.
Assessment of methodologies
Administration costs for workers and families are, predominantly, the time taken performing administrative activity, such as applying for benefits. The opportunity cost of this time can be valued in two steps: by assessing the average time taken by case (through survey data, existing statistics on administrative requirements or assumptions on administrative burden) and multiplying it by a valuation of time. Most studies use average wage rates to establish this, although there are equity considerations here. Willingness to pay could also be used to establish how much an individual would pay to avoid the administrative burden, although this has not been done in the studies above. Direct costs, such as commuting costs, avoided can be established through surveys or existing statistics.
For employers, an opportunity cost method can also be used in assessing time spent on administration relating to benefits or legal investigations, and this can be valued by the wage level of the relevant professional undertaking the work. Hiring, training and disruption costs could be measured by the opportunity cost of time spent on such work plus any direct resource costs that employers encounter (measured through survey data, for instance) or can be estimated directly from employers. Fees, penalties and legal costs can be estimated directly from employer surveys or national statistics, where available.
Government administration costs — predominantly administration of benefits and investigations — can be measured directly from government statistics, where available, or by the opportunity cost method: estimating time spent on administration (in a similar fashion to that for employers) and multiplying by wage.
5.3.5 Insurance costs Two studies address insurance costs to some extent: HSE (2011) and Koningsveld et al. (2003).
1. HSE (2011): provides insurance costs for employers and insurance receipts to workers and
families. 2. Koningsveld et al. (2003): provides insurance costs that should be considered for employers.
Methodologies by study
HSE (2011) • From the perspective of employers, this study estimates the cost of employer’s liability
insurance premiums and the cost of corporate private health insurance premiums attributable
European Agency for Safety and Health at Work – EU-OSHA
45

Estimating the cost of accidents and ill-health at work – A review of methodologies
to workplace accidents and work-related ill health. In the United Kingdom, employer’s liability insurance is compulsory for all employers (apart from the government).
• For both types of costs the data were derived from records from the insurance industry. Premium data across a number of product lines were considered. To smooth variation, three-year averages were taken.
• Only a proportion of these costs are considered to be attributable to work-related ill health and injury. However, the information was provided through personal communication with representatives of the healthcare insurance company and further details were not reported.
• For workers and families, the study included: o Lump sum payments to individuals made from claims against employer’s liability
insurance. These represent a benefit rather than a cost. The data were derived from the total claims value reported by the insurance industry. This estimate was adjusted to reflect the actual value received by the victims (60 %), given that the remaining 40 % is estimated to cover for legal fees and expenses.
o Premiums for private medical insurance. As with premiums paid by employers, only a proportion of these costs are considered to be attributable to work-related ill health and injury.
• It is worth noting that, from the perspective of governments, the value of treatment and rehabilitation covered by private health insurance claims is a net benefit, as services delivered by the private sector do not have to be funded by the National Health Service.
Koningsveld et al. (2003) • From the perspective of employers, this study indicates that employers might have to pay for
damage that is not paid for by the insurer and possible premiums for insurance. At present, not enough information is available to estimate these costs for an evaluation.
• Costs that are related to Wet Arbeidsongeschiktheidsverzekering (disability insurance programme) are available from the Ministry of Social Affairs and Employment.
Assessment of methodologies
Insurance costs relate to the proportion of insurance premiums for employers or workers and families relating to occupational injury or illness. Insurance costs may also include compensation paid out to employees. The two studies that estimates insurance costs obtained figures from the insurance industry. Care must be taken in attributing costs to work-related injury or illness rather than other insurance, but insufficient information is available with regard to the methodologies used to estimate attribution.
European Agency for Safety and Health at Work – EU-OSHA
46

Estimating the cost of accidents and ill-health at work – A review of methodologies
6 Discussion of findings In order to assess the costs of workplace injury and illness, two steps are required: (1) an identification of the number of cases and (2) a valuation of the costs incurred by those cases. Each of the studies surveyed here does this, according to the scope in question, which ranges from a sample of companies or a specific illness to nationwide estimates of OSH. The one exception is the study by Romero (2010), which provides more of a checklist of costs to include.
A detailed explanation of the methods employed by each study, including identified strengths and limitations, can be found in the comparison above, with further information included in the Appendices. The comparison also includes an assessment of the methodologies according to cost type, cost bearer and types of injury and illness, identifying what was done and what is best to include in a similar analysis. The five cost types are productivity, healthcare, quality of life, administration and insurance. The cost bearers are workers and families, employers, government (and thus the taxpayer) and society, where society identifies costs incurred overall, net of transfers between cost bearers.
The following discussion includes a brief summary of the best methods that can be employed to conduct an analysis of the cost burden overall, taking into account the limitations and uncertainties involved. Recommendations are provided with regard to establishing the burden of poor or non-OSH. The issue of transferability of methods across countries is also considered.
6.1 Number of cases As mentioned in the comparison, the studies reviewed primarily focused on costing and many relied on existing estimates for numbers of cases. Survey data were often used, as well as published statistics from sources such as compensation claims. The key issues for accurately assessing numbers of cases lie in accurately establishing work as the cause of an injury or illness, and accounting for other forms of underreporting.
Generally speaking, injuries — and particularly severe or fatal injuries — are easier to estimate, both because they occur at the workplace, so attributing them as work-related is not difficult, and because there are often regulations in place mandating the reporting of these incidents. For illness, cause can be much more difficult to establish, may not be known to the patient, employer or medical professional (thus making survey data less accurate) and may have to be conclusively proven before being registered in official statistics. There is a large potential for underreporting in these instances.
In addition to this are small-scale injuries and illness, which may cause productivity loss and/or pain and suffering to the afflicted, but which may go unreported, especially in a case where there is no absence from work. A further issue for underreporting is that the self-employed are rarely included in reported data.
These underreporting issues may depend heavily on government regulation — if employers have a legal responsibility to report cases, with penalties to enforce this, one would expect to see higher numbers of reported cases than if they did not. By contrast, however, strict requirements for compensation of occupational injuries and illness (such as that identified by Boonen et al. (2002) in regard to France) may lead to further underreporting, due to administrative burdens and the burden of proof.
Many of the studies acknowledged these issues and explained that underreporting may be inevitable, but others took steps to adjust for them, including consultation of expert opinion. This is to be recommended, but it must be acknowledged that there can be high uncertainty around estimates on number of cases. ‘Headline figures’, expressing cases in a single number, must always be qualified appropriately, otherwise uncertainties can be ignored and multiplied in further calculations of cost. Research on the estimation of cases and techniques for the attribution of cause is ongoing.
The main divergence in approach towards the number of cases exists between the incidence and prevalence method, which has consequences in the attribution of costs. In theory, a prevalence method is more accurate for estimating cases existing and costs accrued during a given year, without the need for extrapolation. However, it leads to a much greater data burden as it requires identification of everyone suffering from a work-related injury or illness in a given
European Agency for Safety and Health at Work – EU-OSHA
47

Estimating the cost of accidents and ill-health at work – A review of methodologies
year, regardless of when the injury or illness began. As Safe Work Australia put it, the cases must be ‘in the system’ throughout. By contrast, an incidence method requires assessing only new cases accruing during a given year and then estimating lifetime costs accrued. This is easier to assess and may actually provide a more accurate estimate of current working conditions, which is of use to policy-makers looking to improve workplace safety and health. Ultimately, the choice depends on the purpose and focus of the study as well as availability of information.
Finally, the greater the detail that can be collected in numbers of cases, such as severity of illness/injury, demographic data and employment data, the more accurate will be the calculation of costs.
6.2 Costs by category For productivity costs, the human capital approach is the most popular when assessing the costs of workers and families. Extra detail should be included in the interests of accuracy — net income lost should be calculated (i.e. net of taxation that would have been paid and including benefits received when not working) and non-market production should also be assessed. Presenteeism was not included in any of the studies but could be included if data were available. Additionally, early retirement related to occupational injury or illness should be included, as it can be significant — especially with an ageing population.
There are ethical issues around placing more value on the absence of those people receiving higher wages, and although one study addressed this by using average GDP per capita, this may result in the loss of accuracy at a macro level, particularly internationally (although using percentage of GDP when comparing across countries may mitigate some of this). Nevertheless, the principle of using wages to value the lost production is well established and relatively easy to calculate.
For employers, there is a choice between the human capital approach and the friction cost method, and this depends on whether it is expected that there is a permanent loss from absence or a worker can be replaced. Most likely it is closer to the latter, given structural unemployment, but there may be a permanent loss of skills or expertise. Recruitment and reorganisation costs and damage to property should be included — although this may be covered under administrative costs — as well as lost potential, for example loss of clients or reputation.
For government, the social welfare payments paid to injured or ill workers should be included, as well as the loss in tax revenue, but it is important to note that at a societal level the former is simply a monetary transfer. Gross wage plus reorganisation and recruitment costs to the employer represent overall societal productivity costs, although the friction cost method may be used instead of gross wage if it is believed that structural unemployment allows complete replacement of the lost productivity of an injured or ill worker.
Healthcare costs are more directly established, but care must be taken to include everything. For example, only some studies included carer and travel costs, which may be substantial. Apportionment to the government, workers and families, or even employers, depends on the health system.
For quality of life costs the method employed by the few studies which included this used a form of willingness to pay. This is an attempt to quantify something that is by nature qualitative, but represents a significant effect of an injury and illness, by asking people ex ante what they would pay to avoid a certain outcome.
Willingness to pay is a flexible method that can be used to value any indirect cost — Ayres et al. (2011), for instance, used it for productivity costs as well as quality of life costs. However, it is also subject to a great amount of uncertainty, as it relies on the self-assessment of the (potential) effects of an injury or illness and is difficult to separate from what people are able to pay. Additionally, this may vary over different countries, and this should also be taken into account. As such, for productivity costs the human capital approach represents a more justifiably quantitative methodology, but willingness to pay is useful for quality of life costs. Care must be taken to ensure that there is no overlap between the two when used together and that quality of life questions do not include loss of income.
European Agency for Safety and Health at Work – EU-OSHA
48

Estimating the cost of accidents and ill-health at work – A review of methodologies
Most administrative costs generally relate to time taken on administrative activity. The opportunity cost method is generally employed: this requires establishing the time taken by workers and families, employers or government — by surveys if existing literature is not available — and valuing it by what that time would otherwise have been worth. Generally, the wage rate of the person conducting the administrative activity is used. Other administrative costs that are more direct include hiring, training and disruption costs and commuting costs avoided, although both could also be classed under productivity costs.
Insurance costs relate to the proportion of insurance premiums for employers or workers and families relating to occupational injury or illness (as well as compensation paid out). The two studies that included insurance costs obtained figures on premiums and payouts from the insurance industry. Care must be taken in attributing costs to work-related injury or illness rather than other insurance, and it should be noted that insurance costs cancel out at a societal level.
6.3 Overall cost discussion When assessing the overall impact of poor or non-OSH, ideally all these costs should be included. However, some may have a greater effect on the overall total than others and for this study it may be more accurate to prioritise rigour in certain categories over scope in terms of costs included. All studies included productivity costs and these are undoubtedly key. Seven studies included healthcare costs and these can also be significant, although it does depend on both perspective and the healthcare system. For example, healthcare costs may be low for workers and families in a country where healthcare is provided by the government. Seven studies assessed administrative costs, which can be a considerable burden but not at the scale of overall productivity losses, and only two looked separately at quality of life and insurance.
While insurance and administration may be included less often as they are a smaller fraction of the total cost, quality of life costs are most likely to be underrepresented because of the difficulty — or even controversy — over quantifying these. They are, in a sense, a step more indirect than productivity costs, which are less direct than immediate healthcare costs. However, they are certainly an important part of the overall experience of work-related injury or illness, and future research should look to include these. Arguably, the three basic categories in a cost of poor or non-OSH analysis are healthcare costs (direct), productivity costs (indirect) and quality of life costs (intangible). Administration costs and insurance costs should be added when possible.
The issue of uncertainty of estimates is prevalent throughout studies like these — in many ways it is inevitable because of the availability of data. Uncertainty must be acknowledged and accounted for, in terms of both sensitivity analysis and the presentation of a range of figures. Caution must always be taken when presenting a ‘headline’ figure, as this can sometimes become viewed as an absolute truth.
The studies that achieved the goal of assessing the effects of poor or non-OSH most substantially were by HSE (2011) and Safe Work Australia (2012). Both were government-commissioned studies, aimed at establishing the costs of occupational injury and illness to the country overall, as well as establishing who bore which costs. Although both methodologies are not perfect, as discussed in the comparison, they provide excellent templates for a national study, and adoption of similar research efforts by other countries should be encouraged. As an idea of the scope of the problem of poor or non-OSH, the United Kingdom and Australian studies reported, respectively, costs to the United Kingdom economy of GBP 13.4 billion in 2010/11, excluding occupational cancers (which is calculated to be approximately 0.9 % of GDP (6)) and costs to the Australian economy of AUD 60.6 billion in 2008/09, or 4.8 % of GDP. The variation in these estimates leads us to caution against
(6) HSE calculated the cost to society of workplace fatalities and injuries and work-related ill health in 2010/11, at 2010 prices, as GBP 13,424 million. The nominal GDP was taken from the UK Treasury’s ‘GDP deflators at market prices, and money GDP: September 2013’, available at https://www.gov.uk/government/publications/gdp-deflators-at-market-prices-and-money-gdp-march-2013 (accessed 14 October 2013). The cost to the economy is calculated at 0.89 % using the 2010/11 financial year GDP or at 0.90 % using the 2010 calendar year GDP (GBP 1,502,176 million and GBP 1,485,615 million, respectively). This compares with the 1.2 %, based on costs to society of GBP 16.5 billion, for 2006/07 and the 0.97 %, based on costs to society of GBP 14 billion for 2009/10 previously reported by HSE (‘The costs to Britain of workplace injuries and work-related ill health in 2006/07’ and its 2009/10 update), available at http://www.hse.gov.uk/economics/costing.htm (accessed 14 October 2013).
European Agency for Safety and Health at Work – EU-OSHA
49

Estimating the cost of accidents and ill-health at work – A review of methodologies
placing too much emphasis on headline figures taken alone, but gives a good impression of the size of the cost of poor or non-OSH. As another example, for the Netherlands the costs of poor or non-OSH were estimated by Koningsveld et al. (2003) at EUR 12.7 billion in 2001, representing 3 % of GDP.
In general terms, many of the key methods employed (e.g. the population attributable risk approach, the human capital approach, the friction cost method and the opportunity cost method) can be transferred internationally. However, key differences emerge in terms of healthcare system, compensation statistics and the likelihood of underreporting. The Boonen et al. (2002) study illustrates well how estimates of numbers of cases and particularly cost can vary tremendously, even between similar countries. There are significant differences in social security systems between countries, which can result in large differences in costs — the Boonen et al. (2002) study even suggests that government programmes may influence people’s behaviour in terms of taking absence or registering themselves as disabled. This should be kept in mind when calculating or comparing costs internationally (see ‘Recommendations’ below).
Finally, an important aspect that is evident from our analysis of methodologies is that two of the key cost types — healthcare and quality of life — are almost entirely not borne by employers, and, assuming employee replacement, neither are most productivity costs. Yet it is the employer who must bear most of the burden of ensuring a healthy and safe workplace; this disparity suggests a need for public intervention of some kind. Economic incentives for employers can be a useful way of aligning the preferences of employers with the preferences of society.
6.4 Recommendations As stated previously, a healthy and safe working environment contributes considerably to labour productivity and promotes economic growth, competitiveness and welfare. It is vital that policy-makers have an idea of the scale of the problem when trying to improve OSH.
With new policies intended to promote workers’ protection, economic costs are usually considered, at least implicitly. However, based on different methods, different estimates of the effects of poor or non-OSH are found, and it is important to know where these differences come from and how complete a study is in quantifying the costs of poor or non-OSH, including such indirect cost calculations as productivity and quality of life costs.
Establishing an accurate estimate of the cost of occupational injury and illness to all stakeholders at a national or international level is a complex task. However, some countries have already attempted this to a significant extent, which is encouraging. Our study has shown the variety of cost considerations and perspectives that need to be taken into account. We have singled out the HSE (2011) study (in the United Kingdom) and the Safe Work Australia (2012) study as good methodological examples.
Research into the economic impact of poor or non-OSH provides quantitative evidence, based on which informed policy can be made and evaluated. Below, we set out some recommendations in terms of how this could be done at an EU level, taking this study as a starting point. In summary, we will make methodological recommendations, suggest an evaluation of existing theory, mention the need to balance cost of poor or non-OSH with the cost of complying with OSH regulation, suggest that country-level studies are carried out to establish the variables providing international differences, and stress the problem of underreporting and underestimation.
The studies evaluated above encompassed a variety of different stakeholders, industries and cost perspectives. Numbers of cases were mostly drawn from direct surveys and existing literature, with two studies including the population attributable risk method to establish the estimated proportion of work relatedness of a given injury or illness. Costs could be broadly categorised into five types: productivity, healthcare, quality of life, administration and insurance. Stakeholders were defined as workers (and their families), employers, government and overall society.
We recommend that a thorough study should include all types of cost categories and all stakeholders, with costs calculated for each, for example calculating the transfer of benefits from government to individuals, despite this not being a cost to society.
European Agency for Safety and Health at Work – EU-OSHA
50

Estimating the cost of accidents and ill-health at work – A review of methodologies
Numbers of cases should be drawn from the existing literature where possible, while acknowledging the high potential for underreporting of work relatedness, particularly with illness and especially long-latency illness such as occupational cancer, given the incentives of firms to underreport (e.g. to avoid fines and/or legal repercussions) and the common exclusion of the self-employed. We recommend including expert opinion to try to account for this type of underreporting (such as in the use of the population attributable risk method) and acknowledgement and sensitivity analysis around the uncertainty of any estimate. Changes in numbers of cases can have a large effect when multiplied by unit costs of cases. The choice of the incidence over the prevalence method depends on data availability, although it should be mentioned that changes in numbers of occupational injury and illness over time are best measured using the incidence method, as it gives a more accurate representation of what is currently happening.
When establishing cost we recommend that (at least) productivity costs, healthcare costs and quality of life costs should be taken into account if a thorough estimate is sought. The majority of the studies included the first two but not the last, as it is arguably the most difficult to quantify (it is the most indirect cost). Administration and insurance costs should also be included where possible, but are perhaps less significant.
We recommend the human capital approach for productivity costs, with adjustments detailed above for workers; the friction cost method for employers, although there may be some permanent loss of productivity; and social welfare payments and tax revenue loss for governments. Note that at a societal level social welfare payments cancel out as a transfer between stakeholders, but administration costs related to social welfare payments are considered. The friction cost method may be used instead of the human capital approach if it is believed that an injured or ill worker is completely replaced as a result of structural unemployment.
Healthcare costs can be assessed more directly, although they also present major potential differences internationally and may need to be assessed locally or at the country level.
Quality of life costs can be valued using willingness to pay and, if included, we recommend that it be specifically noted that this is a monetary approximation of the quality of life loss, i.e. not a financial cost but a valuation of an intangible cost. Future research could add to the body of evidence on willingness to pay, specifically for occupational injury and illness.
We recommend valuing administration cost (for professionals) by calculating the opportunity cost of time taken by the wage rate of the person undertaking the administration, and insurance costs must most likely be established through the insurance industry.
Particular care must be taken to avoid the issue of double counting when establishing costs from a variety of sources, especially when aggregating to the societal level. Transfer costs to society, such as social welfare payments, must be removed at the societal level (although the administration of them is a societal cost). Additionally, all future costs should be discounted and adjusted for inflation and above-inflation growth as much as possible.
None of these measures is without its uncertainties, and sensitivity analysis should be undertaken to identify which elements are most liable to change the final results. We caution against placing too much emphasis on ‘headline figures’, given the level of approximation needed to come up with a single figure.
An issue that was beyond the scope of this report but that is important in informing and evaluating policy decisions is that of the costs of complying with OSH regulation and providing a healthy and safe workplace. This is, as the Safe Work Australia (2012) study pointed out, the other side of the equation and a comprehensive evaluation of a policy option should take it into account. It is also worth noting that this burden falls predominantly on employers, which, conversely, may bear little of the cost of an occupational injury or illness (i.e. not complying) compared with the individual or even the government. Given that employers can mitigate productivity loss through replacement, they are unlikely to bear healthcare costs and do not suffer quality of life losses. However, they may suffer reputation damage, which can also be costed. This disparity should be borne in mind by policy-makers and reinforces the importance of examining costs for every stakeholder. Further research and synthesis of existing evidence in this area is encouraged, including cost–benefit analysis from a variety of perspectives for a given policy or procedure.
European Agency for Safety and Health at Work – EU-OSHA
51

Estimating the cost of accidents and ill-health at work – A review of methodologies
Another area to be studied is the theoretical basis of many of these cost approaches, for example the work of Koopmanschap et al. (1995) in developing the friction cost method. Given that the studies reviewed applied these theories, the literature developing and examining them also warrants attention and may inform a thorough assessment of the costs of poor or non-OSH.
For an EU-level study, the issue of international transferability is paramount. The study by Boonen et al. (2002) gives an interesting insight into the difficulties of this. In large part, this is because of the different social security and healthcare systems that operate in different countries. Not only do healthcare costs vary, as well as the stakeholders paying for them, but social security and healthcare systems can also incentivise individuals to behave in certain ways, such as continuing to work at lower productivity or declaring disability. Differences in wages have a large impact on the productivity costs for the different countries. Some type of weighting or adjustment to make productivity costs more comparable across countries (such as expressing costs as a proportion of GDP rather than in absolute terms) may be preferable.
Therefore, we advise a close examination of existing country literature — bearing in mind that our study was limited to English-language studies as well as those in Dutch because of the nationalities of the reviewers — and a review of the systems of each Member State in order to inform research. The best approach for an EU-wide calculation of costs would probably be an aggregation of national studies, with relevant structural differences highlighted.
The most important factor for international comparisons, however, is standardisation of methodologies. Using studies such as those by the HSE (2011) and Safe Work Australia (2012) as examples, and based on this analysis, theoretical research and national feasibility, it is recommended that a standardised methodology at the country level is used in order to facilitate accurate international comparison.
Finally, attention must be drawn to the issue of underreporting, particularly when establishing work-relatedness of disease. Often this is the result of the sheer difficulty of, and uncertainty in, such things as establishing the cause of a disease (e.g. the HSE (2011) study excluded occupational cancer for these reasons) or measuring presenteeism (not included by any study). However, these can carry significant costs, which could be mitigated by policy. If suspected, underreporting or underestimation should at least be noted and assessed in sensitivity analysis. Additionally, expert opinion can go some way to account for underestimation. However, future research in this area is recommended, for instance longitudinal studies may be able to assess the degree to which underreporting occurs among the general population.
European Agency for Safety and Health at Work – EU-OSHA
52

Estimating the cost of accidents and ill-health at work – A review of methodologies
7 References Commission of the European Communities, Communication from the Commission to the European
Parliament, the Council, the European Economic and Social Committee and the Committee of the Regions, 2007. Available at: http://eur-lex.europa.eu/LexUriServ/LexUriServ.do?uri=COM:2007:0062:FIN:en:PDF (accessed 21 June 2013).
Driscoll, T., Nelson, D. I., Steenland, K., et al., ‘The global burden of disease due to occupational carcinogens’, American Journal of Industrial Medicine, Vol. 48, 2005, pp. 419–431.
EU-OSHA (European Agency for Safety and Health at Work), ‘Economic impact of occupational safety and health in the Member States of the European Union’, 1998. Available at: http://osha.europa.eu/en/publications/reports/302 (accessed 19 July 2013).
Eurostat, ‘Health and safety at work in Europe (1999–2007): a statistical portrait’, 2010. Available at: http://epp.eurostat.ec.europa.eu/cache/ITY_OFFPUB/KS-31-09-290/EN/KS-31-09-290-EN.PDF (accessed 21 June 2013).
Eurostat, ‘Health and safety at work statistics’, 2012. Available at: http://epp.eurostat.ec.europa.eu/statistics_explained/index.php/Health_and_safety_at_work_statistics (accessed 21 June 2013).
Gray, W. B. and Scholz, J. T., ‘Does regulatory enforcement work? A panel analysis of OSHA enforcement’, Law and Society Review, Vol. 27, 1993, pp. 177–213.
HSE (Health and Safety Executive), ‘Cost to Britain of workplace injuries and work related ill health: 2010/11’, 2011. Available at: http://www.hse.gov.uk/statistics/pdf/cost-to-britain.pdf
HSE (Health and Safety Executive), ‘European comparisons: summary of GB performance’, 2013. Available at: http://www.hse.gov.uk/statistics/european/european-comparisons.pdf (accessed 21 June 2013).
ILO (International Labour Organization), ‘Occupational safety and health’, 2003. Available at: http://www.ilo.org/public/english/region/eurpro/moscow/areas/safety/docs/safety_in_numbers_en.pdf
ILO (International Labour Organization), ‘ILO introductory report: global trends and challenges on occupational safety and health’, XIX World Congress on Safety and Health at Work, Istanbul, September 2011. Available at: http://www.ilo.org/wcmsp5/groups/public/---ed_protect/---protrav/---safework/documents/publication/wcms_162662.pdf (accessed 21 June 2013).
Jacobs, E. (ed.), Handbook of U.S. labor statistics, Bernan Press, Lanham, MD, 1997.
Koopmanschap, M. A., Rutten, F. F., van Ineveld, B. M. and van Roijen, L., ‘The friction cost method for measuring indirect costs of disease’, Journal of Health Economics, Vol. 14, No 2, 1995, pp. 171–189.
Letouzey, J., et al., ‘Les coûts de l'entreprise cardiologique’, in: Letouzey, J., et al., Cardiologie 2000: livre blanc sur la prise en charge des maladies cardiovasculaires en France, Paris, Sanesco, 1996.
Le-Pape, A. and Lecomte, T., Aspects socio-économiques de la dépression – Evolution 1980–81/1991–92, Paris, CREDES, 1996.
Mossink, J. and de Greef, M. for Topic Centre on Research — Work and Health, ‘Inventory of socioeconomic costs of work accidents’, 2002. Available at: https://osha.europa.eu/en/publications/reports/207 (accessed 21 June 2013).
Newman Taylor, A. J., Nicholson, P. J., Cullinan, P., et al., Guidelines for the prevention, identification and management of occupational asthma: evidence review and recommendations, British Occupational Health Research Foundation, London, 2004.
OECD (Organisation for Economic Co-operation and Development), ‘Too many workers leave the labour market through sickness and disability benefit, says OECD’, 2006. Available at: http://www.oecd.org/general/toomanyworkersleavethelabourmarketthroughsicknessanddisabilitybenefitssaysoecd.htm (accessed 21 June 2013).
European Agency for Safety and Health at Work – EU-OSHA
53

Estimating the cost of accidents and ill-health at work – A review of methodologies
Rushton, L., Bagga, S., Bevan, R., et al., ‘Occupation and cancer in Britain’, British Journal of Cancer, Vol. 102, No 9, 2010, pp. 1428–1437.
Salafatinos, C., ‘Integrating the theory of constraints and activity-based costing’, Journal of Cost Management, Fall, 1995, pp. 58–67.
Telles, C. A. and Fox, S. E., Revisiting workers’ compensation in California: administrative inventory, Cambridge, MA, Workers Compensation Research Institute, 1997.
European Agency for Safety and Health at Work – EU-OSHA
54
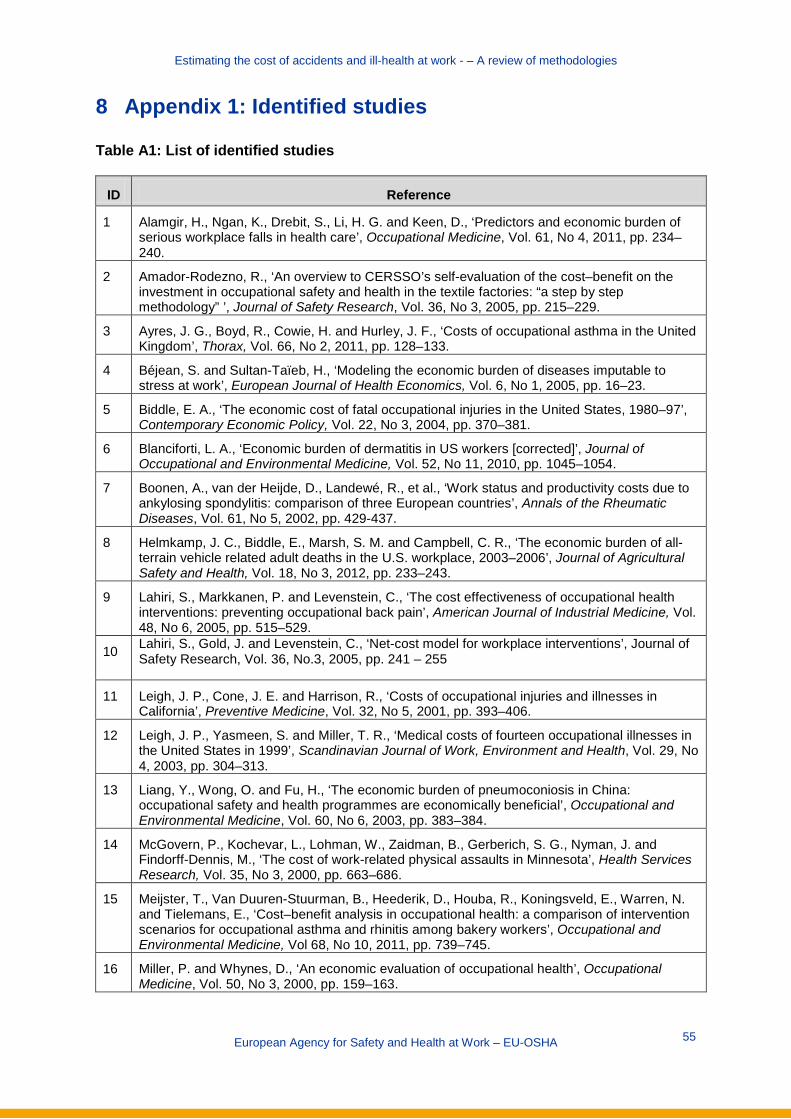
Estimating the cost of accidents and ill-health at work - – A review of methodologies
8 Appendix 1: Identified studies Table A1: List of identified studies
ID Reference
1 Alamgir, H., Ngan, K., Drebit, S., Li, H. G. and Keen, D., ‘Predictors and economic burden of serious workplace falls in health care’, Occupational Medicine, Vol. 61, No 4, 2011, pp. 234–240.
2 Amador-Rodezno, R., ‘An overview to CERSSO’s self-evaluation of the cost–benefit on the investment in occupational safety and health in the textile factories: “a step by step methodology” ’, Journal of Safety Research, Vol. 36, No 3, 2005, pp. 215–229.
3 Ayres, J. G., Boyd, R., Cowie, H. and Hurley, J. F., ‘Costs of occupational asthma in the United Kingdom’, Thorax, Vol. 66, No 2, 2011, pp. 128–133.
4 Béjean, S. and Sultan-Taïeb, H., ‘Modeling the economic burden of diseases imputable to stress at work’, European Journal of Health Economics, Vol. 6, No 1, 2005, pp. 16–23.
5 Biddle, E. A., ‘The economic cost of fatal occupational injuries in the United States, 1980–97’, Contemporary Economic Policy, Vol. 22, No 3, 2004, pp. 370–381.
6 Blanciforti, L. A., ‘Economic burden of dermatitis in US workers [corrected]’, Journal of Occupational and Environmental Medicine, Vol. 52, No 11, 2010, pp. 1045–1054.
7 Boonen, A., van der Heijde, D., Landewé, R., et al., ‘Work status and productivity costs due to ankylosing spondylitis: comparison of three European countries’, Annals of the Rheumatic Diseases, Vol. 61, No 5, 2002, pp. 429-437.
8 Helmkamp, J. C., Biddle, E., Marsh, S. M. and Campbell, C. R., ‘The economic burden of all-terrain vehicle related adult deaths in the U.S. workplace, 2003–2006’, Journal of Agricultural Safety and Health, Vol. 18, No 3, 2012, pp. 233–243.
9 Lahiri, S., Markkanen, P. and Levenstein, C., ‘The cost effectiveness of occupational health interventions: preventing occupational back pain’, American Journal of Industrial Medicine, Vol. 48, No 6, 2005, pp. 515–529.
10 Lahiri, S., Gold, J. and Levenstein, C., ‘Net-cost model for workplace interventions’, Journal of Safety Research, Vol. 36, No.3, 2005, pp. 241 – 255
11 Leigh, J. P., Cone, J. E. and Harrison, R., ‘Costs of occupational injuries and illnesses in California’, Preventive Medicine, Vol. 32, No 5, 2001, pp. 393–406.
12 Leigh, J. P., Yasmeen, S. and Miller, T. R., ‘Medical costs of fourteen occupational illnesses in the United States in 1999’, Scandinavian Journal of Work, Environment and Health, Vol. 29, No 4, 2003, pp. 304–313.
13 Liang, Y., Wong, O. and Fu, H., ‘The economic burden of pneumoconiosis in China: occupational safety and health programmes are economically beneficial’, Occupational and Environmental Medicine, Vol. 60, No 6, 2003, pp. 383–384.
14 McGovern, P., Kochevar, L., Lohman, W., Zaidman, B., Gerberich, S. G., Nyman, J. and Findorff-Dennis, M., ‘The cost of work-related physical assaults in Minnesota’, Health Services Research, Vol. 35, No 3, 2000, pp. 663–686.
15 Meijster, T., Van Duuren-Stuurman, B., Heederik, D., Houba, R., Koningsveld, E., Warren, N. and Tielemans, E., ‘Cost–benefit analysis in occupational health: a comparison of intervention scenarios for occupational asthma and rhinitis among bakery workers’, Occupational and Environmental Medicine, Vol 68, No 10, 2011, pp. 739–745.
16 Miller, P. and Whynes, D., ‘An economic evaluation of occupational health’, Occupational Medicine, Vol. 50, No 3, 2000, pp. 159–163.
European Agency for Safety and Health at Work – EU-OSHA
55

Estimating the cost of accidents and ill-health at work – A review of methodologies
ID Reference
17 Oxenburgh, M. and Marlow, P., ‘The Productivity Assessment Tool: computer-based cost benefit analysis model for the economic assessment of occupational health and safety interventions in the workplace’, Journal of Safety Research, Vol. 36, No 3, 2005, pp. 209–214.
18 Rikhardsson, P. M., ‘Accounting for the cost of occupational accidents’, Corporate Social Responsibility and Environmental Management, Vol. 11, No 2, 2004a, pp. 63–70.
19 Rikhardsson, P. M. and Impgaard, M., ‘Corporate cost of occupational accidents: an activity-based analysis’, Accident Analysis and Prevention, Vol. 36, No 2, 2004b, pp. 173–182.
20 Romero, J., ‘Cost of accidents at work, an Ecuadorian approach’, in: SPE international conference on health, safety and environment in oil and gas exploration and production (SPE 126767), Society of Petroleum Engineers, Richardson, Texas, 2010.
21 Stewart, W. F., Ricci, J. A., Chee, E., Hahn, S. R. and Morganstein, D., ‘Cost of lost productive work time among US workers with depression', Journal of the American Medical Association , Vol. 289, No 23, 2003, pp. 3135–3144.
22 Waehrer, G., Leigh, J. P. and Miller, T. R., ‘Costs of occupational injury and illness within the health services sector’, International Journal of Health Services, Vol. 35, No 2, 2005, pp. 343–359.
23 Waehrer, G. M., Dong, X. S., Miller, T., Haile, E. and Men, Y., ‘Costs of occupational injuries in construction in the United States’, Accident Analysis and Prevention, Vol. 39, No 6, 2007, pp. 1258–1266.
24 EU-OSHA, ‘Inventory of socioeconomic costs of work accidents’, 2002. Available at: https://osha.europa.eu/en/publications/reports/207
25 European Commission, Socioeconomic costs of accidents at work and work related ill health, 2011. Available at: http://ec.europa.eu/social/BlobServlet?docId=7416&langId=en
26 Health and Safety Executive, Cost to Britain of workplace injuries and work related ill health: 2010/11, 2011. Available at: http://www.hse.gov.uk/statistics/pdf/cost-to-britain.pdf
27 Indecon, Report on economic impact of the Safety, Health and Welfare at Work legislation, Department of Enterprise, Trade and Employment, 2006. Available at: http://www.entemp.ie/publications/corporate/2006/finalindeconreport.pdf
28 Safe Work Australia, The cost of work related injury and illness for Australian employers, workers and the community 2008–2009, 2012. Available at: http://safeworkaustralia.gov.au/AboutSafeWorkAustralia/WhatWeDo/Publications/Pages/cost-injury-illness-2008–09.aspx
29 Koningsveld, E. A. P., Zwinkels, W., Mossink, J. C. M., Thie, X. and Abspoel, M., ‘National costs of working conditions of labourers in the Netherlands 2001 [in Dutch: Maatschappelijke kosten van arbeidsomstandigheden van werknemers in 2001]’, Werkdocument 203, Ministry of Social Affairs and Employment, The Hague, The Netherlands, 2003. Available at: http://www.eurofound.europa.eu/ewco/2004/12/NL0412NU01.htm
European Agency for Safety and Health at Work – EU-OSHA
56

Estimating the cost of accidents and ill-health at work - – A review of methodologies
9 Appendix 2: OSH policy and availability of data at Member State level
Table A2: OSH policy and availability of data at Member State level, 1998
Country OSH policy Availability of data
Austria Not an explicit priority, but authorities are concerned about costs for SMEs of any legal OSH requirements
Estimates of costs are of growing importance. Analyses of the financial consequences for the public budget are compulsory and no measures with negative consequences will be imposed. Costs for the private sector are not estimated
Belgium OSH is a key topic for authorities but funding is scarce. While an emphasis is put on cost-effective measures that will be easier to communicate to employers, the national debate continues to focus on moral considerations and public awareness
When costs have to be estimated, the focus is on employers and the sector(s) affected by a measure
Denmark The costs of sickness to society and costs to businesses of new regulations (amendments to Working Conditions Act) are being discussed by social partners and others
Data are available from economic impact assessments which are routinely carried out during the legislation process. The impact of any policy on social partners is considered and quality checks of legislative proposals are carried out regularly. Both costs (e.g. costs of equipment, maintenance and energy, additional work time) and benefits (reduction in costs for healthcare and rehabilitation, sick leave, early retirement and death) are taken into account when assessing the efficiency of OSH measures
Finland The debate centres on the importance of working conditions for the economy. The OSH administration develops models to be used by companies
Economic analysis plays a role only in the drafting process of new legislation but CBAs will probably be carried out more often. Estimates relate to the national economy and public finance, but sector and company assessments are often taken into account. Information on the efficiency of measures can be deduced from statistics on accidents and health and from questionnaires
France CBAs are considered important to encourage social partners and companies to improve OSH
Assessment of the impact of new regulations is now mandatory at the national level. Feedback from social partners on the human, social and financial impact of any regulation is regularly taken into account
European Agency for Safety and Health at Work – EU-OSHA
57

Estimating the cost of accidents and ill-health at work - – A review of methodologies
Country OSH policy Availability of data
Germany Costs and benefits of OSH are a major topic. Measures are assessed according to the financial advantages that result from them. New legislation tries to provide businesses with enough flexibility to reduce the financial burden of regulation
The cost effects of regulation on administrations and companies have to be documented. Policies are evaluated according to a catalogue which includes costs and benefits for SMEs in particular. Some instruments for measuring macro- and micro-economic efficiency have been developed
Greece An estimation of costs and benefits becomes increasingly important as new analyses will convince employers of the benefits of OSH measures
An estimate of financial consequences for the state budget of new legislative proposals is mandatory. CBAs are having an increasing influence on decision-making
Ireland OSH has only lately become a topic of interest. The focus lies on legal and moral issues
Currently, CBAs are not formally a part of the legislation process, but this is likely to change in the future
Italy The topic is becoming increasingly important
Research has been funded which reveals the impact of EU regulations on SMEs
Luxembourg The debate focuses on estimations of the costs (not benefits) of OSH measures
CBAs do not play a big role in policy development
Netherlands An awareness that cost–benefit consideration can encourage enterprises to improve OSH does exist. The focus is on market elements to get employers on board
There is a growing amount of research on the costs and benefits of OSH measures. The goal is to ensure that new regulation does not create an unnecessary additional financial burden on stakeholders. CBAs are increasingly carried out in a more systematic way but primarily if high costs are expected. Ex ante assessments for OSH regulation have been carried out twice, at national and sector level. The ratio between preventative costs and correction costs is viewed as an efficiency indicator at national level. Costs of absenteeism and disability are included
Portugal Cost estimations are regarded as important because of the impact of OSH measures on the social security system and companies. The debate focuses more on the costs than on the benefits
Only estimates of costs to the administration are made on a regular basis. Indicators such as improved life expectancy, quality of life, reduced sickness, less public spending and lower costs to business are linked to OSH
European Agency for Safety and Health at Work – EU-OSHA 58

Estimating the cost of accidents and ill-health at work - – A review of methodologies
Country OSH policy Availability of data
Spain The topic does not currently attract public attention. Employers, however, are interested in instruments for the economic assessment of OSH
CBAs play an important role in convincing social partners of the desirability of a policy but are unlikely to become determining factors in the legislative process. Quantitative information on the costs incurred as a result of occupational accidents is available
Sweden Authorities try to raise awareness of using CBAs to improve working conditions. They receive positive feedback by employers
Assessments are being carried out routinely and include cost calculations at the national level. The OSH administration is required to report both effects and productivity to the government annually
United Kingdom
A CBA of any new legislation is routine
Comprehensive data are available. Between 15 and 35 analyses are carried out each year. Data can be broken down by sector and other factors. Indicators of economic impact include medical costs, monetary value of grief and suffering and direct costs to business
CBA, cost–benefit analysis; OSH, occupational safety and health; SME, small and medium-sized enterprise.
Source: EU-OSHA (1998)
European Agency for Safety and Health at Work – EU-OSHA 59
Estimating the cost of accidents and ill-health at work - – A review of methodologies
TE-W
E-14-002-E
N-N
European Agency for Safety and Health at Work
Santiago de Compostela, 12 (Edificio Miribilla) E- 48003 - Bilbao, Spain E-mail: [email protected]
http://osha.europa.eu
The European Agency for Safety and Health at Work (EU-OSHA) contributes to
making Europe a safer, healthier and more
productive place to work. The Agency
researches, develops, and distributes
reliable, balanced, and impartial safety and
health information and organises pan-
European awareness raising campaigns. Set
up by the European Union in 1996 and
based in Bilbao, Spain, the Agency brings
together representatives from the European
Commission, Member State governments,
employers’ and workers’ organisations, as
well as leading experts in each of the EU-27
Member States and beyond.
European Agency for Safety and Health at Work – EU-OSHA 60