Embed Size (px)
Citation preview
DRAFT VERSION – To be presented at SNAME 2011 Annual Meeting Kontovas et al. (2011)
1
Estimating the Consequence Costs of Oil Spills from Tankers
C. A. Kontovas (M), N. P. Ventikos and H. N. Psaraftis (FL)
In the last decade, both worldwide and in the United States, the number of oil spills and the total quantity of oil
spilled into the seas have declined. However further improvements are still desirable. Clearly, the cost of oil spills to
be avoided is one of the most important parameters in evaluating ship designs, measures and policies to reduce oil
pollution. The approach used in this work is based on the assumption that the cleanup and the total cost of an oil spill
can be approximated by the compensation eventually paid to claimants regarding the relative cost categories. To that
extent, this paper reports on various analysis of oil spill cost data for spills. These analyses and their results can
provide useful insights to the ongoing discussion on environmental risk evaluation criteria within Formal Safety
Assessment (FSA). Additional uses are also suggested and some examples are given.
KEY WORDS: tankers; oil spills; pollution; damage
assessment; regulations
INTRODUCTION According to the latest statistics, a downward tendency is
apparent in the total annual quantity of oil spilt by crude oil
carriers during the last decade as well as in the number of oil
spills worldwide, see ITOPF (2010) and Kontovas et al. (2010).
The same is valid for oil spills in US territorial waters, mainly
due to the enactment of the Oil Pollution Act of 1990 (Ramseur,
2010) oil spill legislation after the Exxon Valdez. However,
there is a constant need for designing and operating ships that
will lead to minimal consequences to the environment and
society in case of an accident. A crucial parameter in evaluating
designs and policy measures to reduce pollution is the
estimation of oil spill cost.
Beyond any doubt, the cost of an oil spill is a very difficult
quantity to estimate. However, there is a general agreement
(Etkin, 1999; Grey, 1999; White and Molloy, 2003) that the
main factors influencing the cost of oil spills are the type of oil,
location, weather and sea conditions and the amount spilled and
rate of spillage. Given the above parameters are highly variable
and cannot be predicted in advance, a usual approach taken in
the literature is to connect the cost of an oil spill to its volume.
In that sense, a larger oil spill is expected to have a higher cost,
all else being equal. Estimates of the cleanup cost and the total
oil spill costs which may include the costs for response, third
party claims and environmental damages as a function of the oil
spill size have been extensively analyzed in the literature and
substantial work has been performed over at least the last 30-35
years, mostly in the context of analyzing the economic impact of
oil spills and contemplating measures to mitigate their damages.
For a short literature review the reader is referred a previous
work of the authors, see Kontovas et al. (2010)
Lately, the subject of estimating the cost of oil spills has been in
the center stage of discussions at the International Maritime
Organization (IMO) in regards to the establishment of
Environmental Risk Evaluation Criteria within the context of
Formal Safety Assessment (FSA). During the 55th
session of
Marine Environment Protection Committee (MEPC) that took
place in 2006, the IMO decided to act on the subject of
environmental criteria. At the 56th
session of MEPC (July 2007)
a correspondence group (CG), coordinated by the third author of
this paper on behalf of Greece, was tasked to look into all
related matters, with a view to establishing environmental risk
evaluation criteria within Formal Safety Assessment (FSA).
FSA was introduced by the International Maritime Organization
(IMO) as “a rational and systematic process for accessing the
risk related to maritime safety and the protection of the marine
environment and for evaluating the costs and benefits of IMO’s
options for reducing these risks” (IMO, 2007).
An issue of primary importance was found to be the relationship
between the spill volume and the spill cost. The work within the
IMO has focused, among other things, on the use of oil spill cost
data assembled by the International Oil Pollution Compensation
Fund (IOPCF). Deriving cost functions by using the IOPCF data
is by itself not new and has been performed by Friis-Hansen and
Ditlevsen (2003), Ventikos et al. (2009), Hendricksx (2007),
Yamada (2009), Kontovas et al. (2010 and Psarros et al. (2011).
The core of the last three papers was also submitted to the
MEPC that deals with the issue as discussed above.
In addition, a much earlier work performed under the SNAME
T&R Ad Hoc Panel on the Environmental Performance of
Tankers used the IOPCF database to estimate the cost of spills
as a function of spill size. The cost could be used against the oil
outflow and the probability for hypothetical damage cases in
order to estimate the total mean oil spill cost for alternative
tanker designs (Sirkar et al., 1997). The same paper states the
IOPCF database “is generally considered to be the most
accurate with regard to the cost information available for the
spills it contains” which is still valid today.
The approach used in this work is based on the assumption that
the cleanup and the total cost of an oil spill can be approximated
by the compensation eventually paid to claimants regarding the

Kontovas et al. (2011) DRAFT VERSION – To be presented at SNAME 2011 Annual Meeting 2
relative cost categories. The paper reports on recent analyses of
oil spill cost data assembled by the International Oil Pollution
Compensation Fund (IOPCF). Furthermore, analyses of the
cleanup cost based on data of spills that were covered by the US
Oil Spill Liability Trust Fund (OSLTF) are also presented. Note
that the US is not a member of the IOPCF and, as a result, no
US spills are included in the IOPCF dataset. More specifically
the OSLTF dataset includes cost data provided by the National
Pollution Funds Centre (NPFC) and volume data from the U.S.
Coast Guard's Marine Information for Safety and Law
Enforcement (MISLE) system. These data were also the basis of
an analysis on oil spill costs that was submitted to the IMO by
the United States (IMO, 2010b). In addition, an analysis of the
combined dataset that includes spills in US territorial waters and
worldwide spills included in the IOPCF dataset was also
performed. Preliminary results of these analyses were performed
by the authors and submitted to the IMO by Greece (IMO,
2010c).
The next Section of this paper presents an introduction to the
IOPC Fund and the regression analyses that were carried out to
derive functions to estimate the cleanup and total cost of oil
spills as a function of the oil spill size. Next, response cost data
based on the Oil Spill Liability Trust Fund (OSLTF) are used to
carry out various analyses. These data are also validated against
the formulas derived by the IOPCF dataset and regressions
based on the combined dataset are also carried out. The
penultimate Section presents the ways that the cost formula can
be used within cost benefit analysis, risk assessment methods
and in evaluating the performance of tanker designs. Finally,
the last Section describes the main conclusions of this work.
OIL SPILL VALUATION BASED ON THE IOPCF
Compensation for oil pollution caused by tankers is governed by
four international conventions: the 1969 and the 1992
International Convention on Civil Liability for Oil Pollution
Damage (“CLC 1969” and “CLC 1992”) and the 1971 and 1992
conventions on the Establishment of an International fund for
Compensation for Oil Pollution Damage (“1971 Fund” and
“1992 Fund”). These conventions together create and
international system where reasonable costs of cleanup and
damages are met, first by the individual tanker owner up to the
relevant CLC limit through a compulsory insurance and then by
the international IOPCF, if the amounts claimed exceed the CLC
limits. More on compensation for oil pollution damage can be
found in Jacobsson (2007), ITOPF (2010) and Liu and Wirtz
(2009).
Literature review One way to estimate the total cost of oil spills is by using
compensation data. The most widely accepted public source that
covers compensations paid is provided by the International Oil
Pollution Compensation Fund (IOPCF). A couple of recent
cases where the IOPCF data was analyzed were known to the
authors prior to their own analysis.
Friis-Hansen and Ditlevsen (2003) used the 1999 Annual
Report (except those accidents that belonged to the categories
“loading/unloading”, “mishandling of cargo”, and “unknown
reason” which were removed from their analysis) and converted
all amounts into Special Drawing Units (SDR) by an average
annual exchange rate taken from the International Financial
Yearbook. Then, historic interest rates for money market rates
were applied to capitalize all costs into year 2000 units followed
by a conversion into 2000 USD.
Hendrickx (2007) performed an analysis based on data of the
2003 Annual Report and analyzed 91 cases by converting each
compensation amount into US Dollars using for each accident
the exchange rate on Dec. 31 of the year of occurrence.
Exchange rates of the Bank of England were used for the
currencies available and for the others an online website
(OANDA.com) was used. There is no report that an inflation
rate was used to bring these latter amounts into current Dollars.
Yamada (2009) performed a regression analysis of the amount
spilled and the total cost by using the exchange rate provided in
the IOPCF Annual Report. These rates can be used for
conversion of one currency into another as of Dec. 31, 2007 and
do not take into account the time of the accident nor is any
inflation taken into account. Note that spills less than 1 tonne
were excluded by the analysis. His analysis formed the basis of
Japan‟s submissions to the MEPC and, to a large extent, the
basis of the MEPC decision to recommend a volume-based
approach.
Last but not least, Psarros et al. (2011) used combined data from
two datasets, namely the IOPCF report and the accident
database developed by EU research project SAFECO II. A
regression analysis on the 183 oil spill incidents was performed.
It is not immediately clear from their analysis what the
SAFECO II database is and what (if any) biases it introduces to
the analysis. The amounts were converted into 2008 US Dollars
taking into account the inflation rate.
Regression analyses based on the IOPCF The 2008 IOPCF Annual report presents the claims that the
IOPCF dealt with in the past (IOPCF, 2009). This report
includes 107 accidents that are covered by the 1971 Fund and
33 by the 1992 Fund. For each accident the time and the place of
accident are known and for most of the cases the volume of oil
spilt, as well as, the costs claimed and eventually covered by the
Fund are recorded.
In order to perform the regression analysis, the steps below were
followed: 1. All incomplete entries (mainly the cases where no
information regarding either the cost or the oil spill
volume) and claims that were not eventually paid were
removed.
2. All claims for the cleanup and the total cost categories (in
the case of multiple claims) were added up by converting
them to US Dollars at the time of the accident based on
available exchange rates. We note that we are aware of the
fact that the year of the accident and the year when the
amount agreed was paid are not the same but this was the
only available information.
Kontovas et al. (2011) DRAFT VERSION – To be presented at SNAME 2011 Annual Meeting 3
3. The cost deviations from the previous step were
capitalized into 2009 US Dollars by using conversion
factors based on the Consumer Price Index (CPI).
This way we arrived at two datasets, one having data on the
Cleanup Cost (CC) and the Volume (V) and another on the
Total Cost (TC) and the Volume (V). These datasets were not
disjointed. In fact, the first dataset contained 84 entries, the
second had 91 entries, and 68 spills reported both CC and TC.
According to Friis-Hansen and Ditlevsen (2003), the logarithm
of the oil spill volume and the logarithm of the total spill cost
are positively correlated, having a very high correlation
coefficient. This was also observed by Hendrickx (2007),
Yamada (2009) and shown in an earlier version of Psarros et al.
(2011). Our analysis of possible fits concluded that the double
logarithmic, the multiplicative and the double reciprocal have
the highest correlation coefficients. Therefore, to be consistent
with the analyses performed by others the Costs (TC and CC)
and Volumes (V) were Log-transformed and linear regressions
were performed for the two cases.
Cleanup Cost After removing incomplete entries, a dataset of 84 spills for the
period 1979-2006 was used for this regression analysis. The
minimum volume was 0.2 tonnes and the maximum was 84,000
tonnes. The average spill was 4,055.82 tonnes with a standard
deviation of 14,616.15 tonnes and the median was just 162.5
tonnes. Even without a histogram one could easily realize that
most claims came from relatively small spills. There were only
10 spills above 5,000 tonnes and, thus, one should be very
careful when using the regression formulas to extrapolate the
cost of large spills.
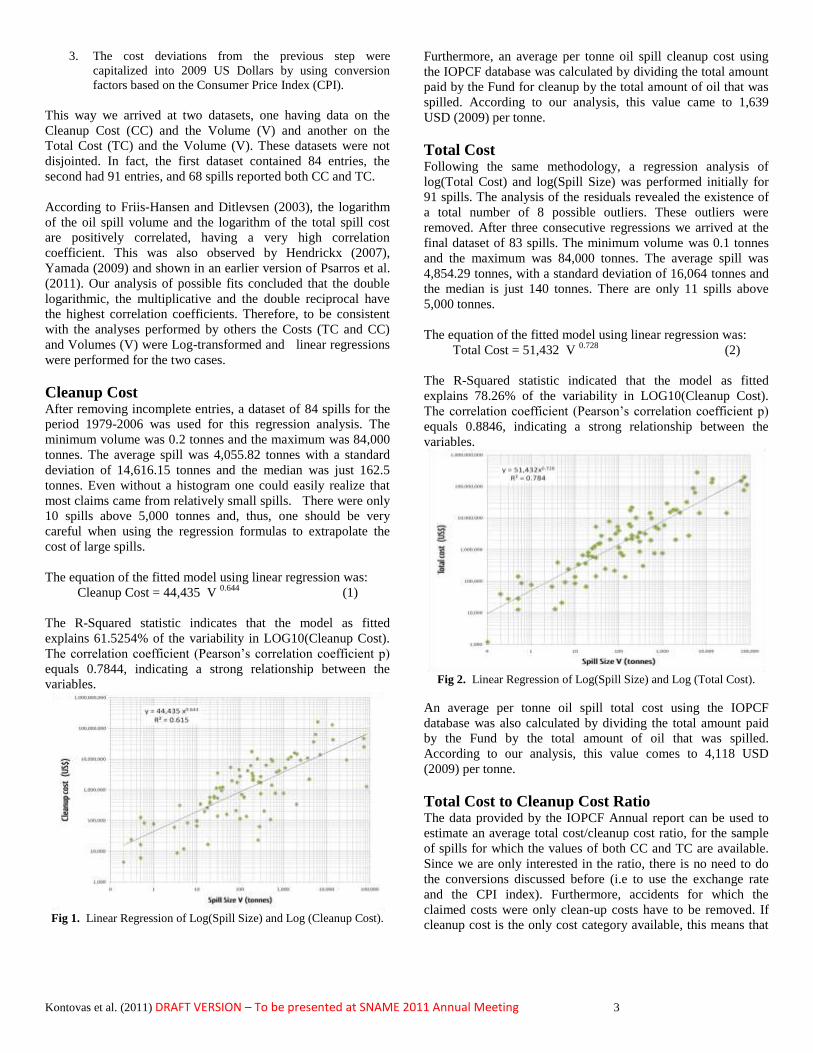
The equation of the fitted model using linear regression was:
Cleanup Cost = 44,435 V 0.644
(1)
The R-Squared statistic indicates that the model as fitted
explains 61.5254% of the variability in LOG10(Cleanup Cost).
The correlation coefficient (Pearson‟s correlation coefficient p)
equals 0.7844, indicating a strong relationship between the
variables.
Fig 1. Linear Regression of Log(Spill Size) and Log (Cleanup Cost).
Furthermore, an average per tonne oil spill cleanup cost using
the IOPCF database was calculated by dividing the total amount
paid by the Fund for cleanup by the total amount of oil that was
spilled. According to our analysis, this value came to 1,639
USD (2009) per tonne.
Total Cost Following the same methodology, a regression analysis of
log(Total Cost) and log(Spill Size) was performed initially for
91 spills. The analysis of the residuals revealed the existence of
a total number of 8 possible outliers. These outliers were
removed. After three consecutive regressions we arrived at the
final dataset of 83 spills. The minimum volume was 0.1 tonnes
and the maximum was 84,000 tonnes. The average spill was
4,854.29 tonnes, with a standard deviation of 16,064 tonnes and
the median is just 140 tonnes. There are only 11 spills above
5,000 tonnes.
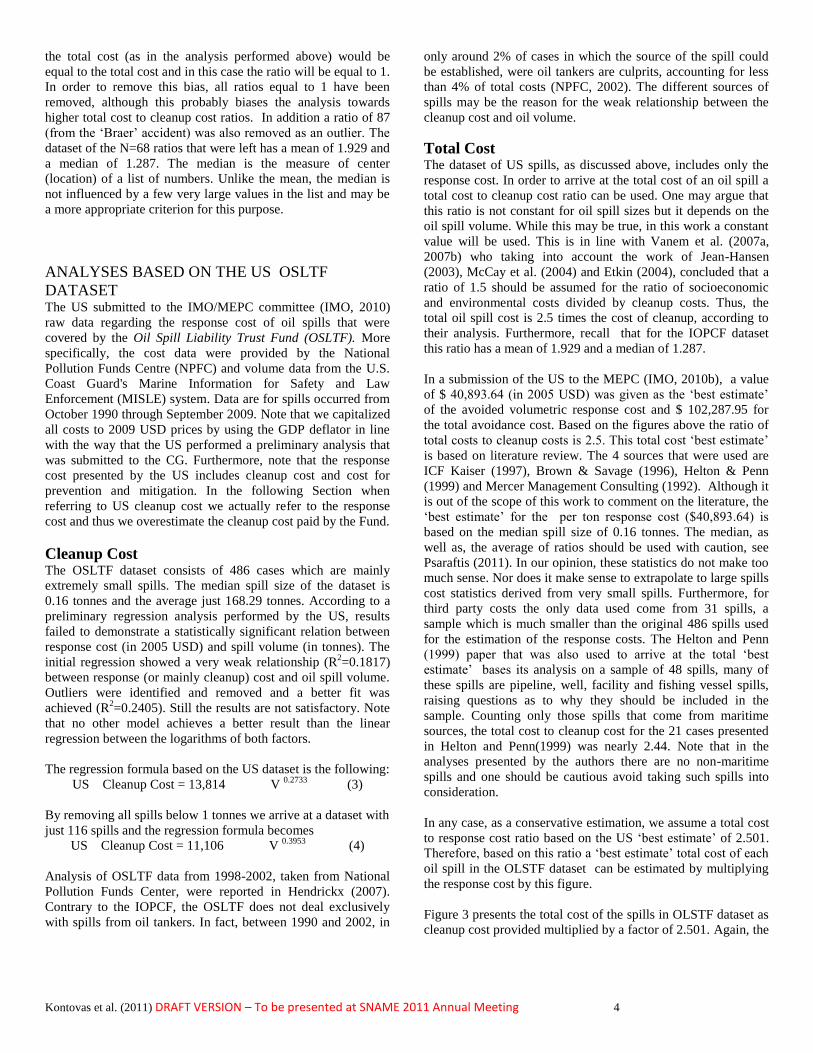
The equation of the fitted model using linear regression was:
Total Cost = 51,432 V 0.728
(2)
The R-Squared statistic indicated that the model as fitted
explains 78.26% of the variability in LOG10(Cleanup Cost).
The correlation coefficient (Pearson‟s correlation coefficient p)
equals 0.8846, indicating a strong relationship between the
variables.
Fig 2. Linear Regression of Log(Spill Size) and Log (Total Cost).
An average per tonne oil spill total cost using the IOPCF
database was also calculated by dividing the total amount paid
by the Fund by the total amount of oil that was spilled.
According to our analysis, this value comes to 4,118 USD
(2009) per tonne.
Total Cost to Cleanup Cost Ratio The data provided by the IOPCF Annual report can be used to
estimate an average total cost/cleanup cost ratio, for the sample
of spills for which the values of both CC and TC are available.
Since we are only interested in the ratio, there is no need to do
the conversions discussed before (i.e to use the exchange rate
and the CPI index). Furthermore, accidents for which the
claimed costs were only clean-up costs have to be removed. If
cleanup cost is the only cost category available, this means that
Kontovas et al. (2011) DRAFT VERSION – To be presented at SNAME 2011 Annual Meeting 4
the total cost (as in the analysis performed above) would be
equal to the total cost and in this case the ratio will be equal to 1.
In order to remove this bias, all ratios equal to 1 have been
removed, although this probably biases the analysis towards
higher total cost to cleanup cost ratios. In addition a ratio of 87
(from the „Braer‟ accident) was also removed as an outlier. The
dataset of the N=68 ratios that were left has a mean of 1.929 and
a median of 1.287. The median is the measure of center
(location) of a list of numbers. Unlike the mean, the median is
not influenced by a few very large values in the list and may be
a more appropriate criterion for this purpose.
ANALYSES BASED ON THE US OSLTF
DATASET The US submitted to the IMO/MEPC committee (IMO, 2010)
raw data regarding the response cost of oil spills that were
covered by the Oil Spill Liability Trust Fund (OSLTF). More
specifically, the cost data were provided by the National
Pollution Funds Centre (NPFC) and volume data from the U.S.
Coast Guard's Marine Information for Safety and Law
Enforcement (MISLE) system. Data are for spills occurred from
October 1990 through September 2009. Note that we capitalized
all costs to 2009 USD prices by using the GDP deflator in line
with the way that the US performed a preliminary analysis that
was submitted to the CG. Furthermore, note that the response
cost presented by the US includes cleanup cost and cost for
prevention and mitigation. In the following Section when
referring to US cleanup cost we actually refer to the response
cost and thus we overestimate the cleanup cost paid by the Fund.
Cleanup Cost The OSLTF dataset consists of 486 cases which are mainly
extremely small spills. The median spill size of the dataset is
0.16 tonnes and the average just 168.29 tonnes. According to a
preliminary regression analysis performed by the US, results
failed to demonstrate a statistically significant relation between
response cost (in 2005 USD) and spill volume (in tonnes). The
initial regression showed a very weak relationship (R2=0.1817)
between response (or mainly cleanup) cost and oil spill volume.
Outliers were identified and removed and a better fit was
achieved (R2=0.2405). Still the results are not satisfactory. Note
that no other model achieves a better result than the linear
regression between the logarithms of both factors.
The regression formula based on the US dataset is the following:
US Cleanup Cost = 13,814 V 0.2733
(3)
By removing all spills below 1 tonnes we arrive at a dataset with
just 116 spills and the regression formula becomes
US Cleanup Cost = 11,106 V 0.3953
(4)
Analysis of OSLTF data from 1998-2002, taken from National
Pollution Funds Center, were reported in Hendrickx (2007).
Contrary to the IOPCF, the OSLTF does not deal exclusively
with spills from oil tankers. In fact, between 1990 and 2002, in
only around 2% of cases in which the source of the spill could
be established, were oil tankers are culprits, accounting for less
than 4% of total costs (NPFC, 2002). The different sources of
spills may be the reason for the weak relationship between the
cleanup cost and oil volume.
Total Cost The dataset of US spills, as discussed above, includes only the
response cost. In order to arrive at the total cost of an oil spill a
total cost to cleanup cost ratio can be used. One may argue that
this ratio is not constant for oil spill sizes but it depends on the
oil spill volume. While this may be true, in this work a constant
value will be used. This is in line with Vanem et al. (2007a,
2007b) who taking into account the work of Jean-Hansen
(2003), McCay et al. (2004) and Etkin (2004), concluded that a
ratio of 1.5 should be assumed for the ratio of socioeconomic
and environmental costs divided by cleanup costs. Thus, the
total oil spill cost is 2.5 times the cost of cleanup, according to
their analysis. Furthermore, recall that for the IOPCF dataset
this ratio has a mean of 1.929 and a median of 1.287.
In a submission of the US to the MEPC (IMO, 2010b), a value
of $ 40,893.64 (in 2005 USD) was given as the „best estimate‟
of the avoided volumetric response cost and $ 102,287.95 for
the total avoidance cost. Based on the figures above the ratio of
total costs to cleanup costs is 2.5. This total cost „best estimate‟
is based on literature review. The 4 sources that were used are
ICF Kaiser (1997), Brown & Savage (1996), Helton & Penn
(1999) and Mercer Management Consulting (1992). Although it
is out of the scope of this work to comment on the literature, the
„best estimate‟ for the per ton response cost ($40,893.64) is
based on the median spill size of 0.16 tonnes. The median, as
well as, the average of ratios should be used with caution, see
Psaraftis (2011). In our opinion, these statistics do not make too
much sense. Nor does it make sense to extrapolate to large spills
cost statistics derived from very small spills. Furthermore, for
third party costs the only data used come from 31 spills, a
sample which is much smaller than the original 486 spills used
for the estimation of the response costs. The Helton and Penn
(1999) paper that was also used to arrive at the total „best
estimate‟ bases its analysis on a sample of 48 spills, many of
these spills are pipeline, well, facility and fishing vessel spills,
raising questions as to why they should be included in the
sample. Counting only those spills that come from maritime
sources, the total cost to cleanup cost for the 21 cases presented
in Helton and Penn(1999) was nearly 2.44. Note that in the
analyses presented by the authors there are no non-maritime
spills and one should be cautious avoid taking such spills into
consideration.
In any case, as a conservative estimation, we assume a total cost
to response cost ratio based on the US „best estimate‟ of 2.501.
Therefore, based on this ratio a „best estimate‟ total cost of each
oil spill in the OLSTF dataset can be estimated by multiplying
the response cost by this figure.
Figure 3 presents the total cost of the spills in OLSTF dataset as
cleanup cost provided multiplied by a factor of 2.501. Again, the
Kontovas et al. (2011) DRAFT VERSION – To be presented at SNAME 2011 Annual Meeting 5
response cost provided by US contains more cost categories
than just the cleanup cost and, therefore, this function is
conservative.
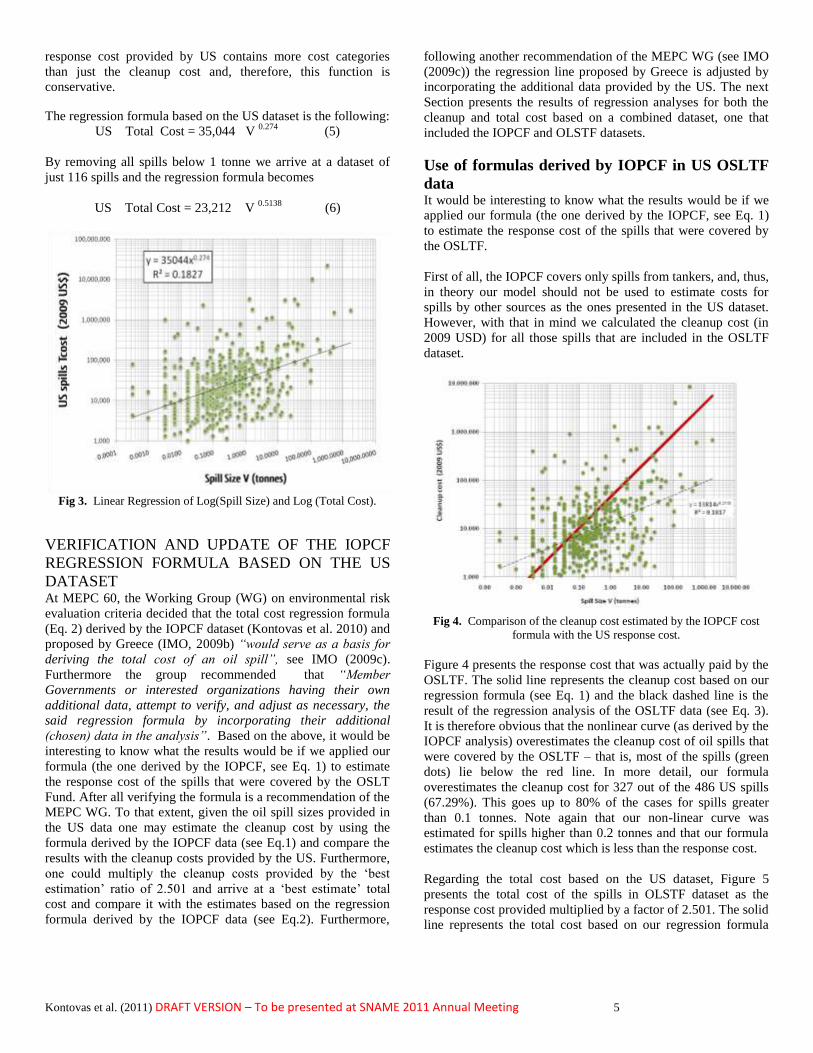
The regression formula based on the US dataset is the following:
US Total Cost = 35,044 V 0.274
(5)
By removing all spills below 1 tonne we arrive at a dataset of
just 116 spills and the regression formula becomes
US Total Cost = 23,212 V 0.5138
(6)
Fig 3. Linear Regression of Log(Spill Size) and Log (Total Cost).
VERIFICATION AND UPDATE OF THE IOPCF
REGRESSION FORMULA BASED ON THE US
DATASET At MEPC 60, the Working Group (WG) on environmental risk
evaluation criteria decided that the total cost regression formula
(Eq. 2) derived by the IOPCF dataset (Kontovas et al. 2010) and
proposed by Greece (IMO, 2009b) “would serve as a basis for
deriving the total cost of an oil spill”, see IMO (2009c).
Furthermore the group recommended that “Member
Governments or interested organizations having their own
additional data, attempt to verify, and adjust as necessary, the
said regression formula by incorporating their additional
(chosen) data in the analysis”. Based on the above, it would be
interesting to know what the results would be if we applied our
formula (the one derived by the IOPCF, see Eq. 1) to estimate
the response cost of the spills that were covered by the OSLT
Fund. After all verifying the formula is a recommendation of the
MEPC WG. To that extent, given the oil spill sizes provided in
the US data one may estimate the cleanup cost by using the
formula derived by the IOPCF data (see Eq.1) and compare the
results with the cleanup costs provided by the US. Furthermore,
one could multiply the cleanup costs provided by the „best
estimation‟ ratio of 2.501 and arrive at a „best estimate‟ total
cost and compare it with the estimates based on the regression
formula derived by the IOPCF data (see Eq.2). Furthermore,
following another recommendation of the MEPC WG (see IMO
(2009c)) the regression line proposed by Greece is adjusted by
incorporating the additional data provided by the US. The next
Section presents the results of regression analyses for both the
cleanup and total cost based on a combined dataset, one that
included the IOPCF and OLSTF datasets.
Use of formulas derived by IOPCF in US OSLTF
data It would be interesting to know what the results would be if we
applied our formula (the one derived by the IOPCF, see Eq. 1)
to estimate the response cost of the spills that were covered by
the OSLTF.
First of all, the IOPCF covers only spills from tankers, and, thus,
in theory our model should not be used to estimate costs for
spills by other sources as the ones presented in the US dataset.
However, with that in mind we calculated the cleanup cost (in
2009 USD) for all those spills that are included in the OSLTF
dataset.
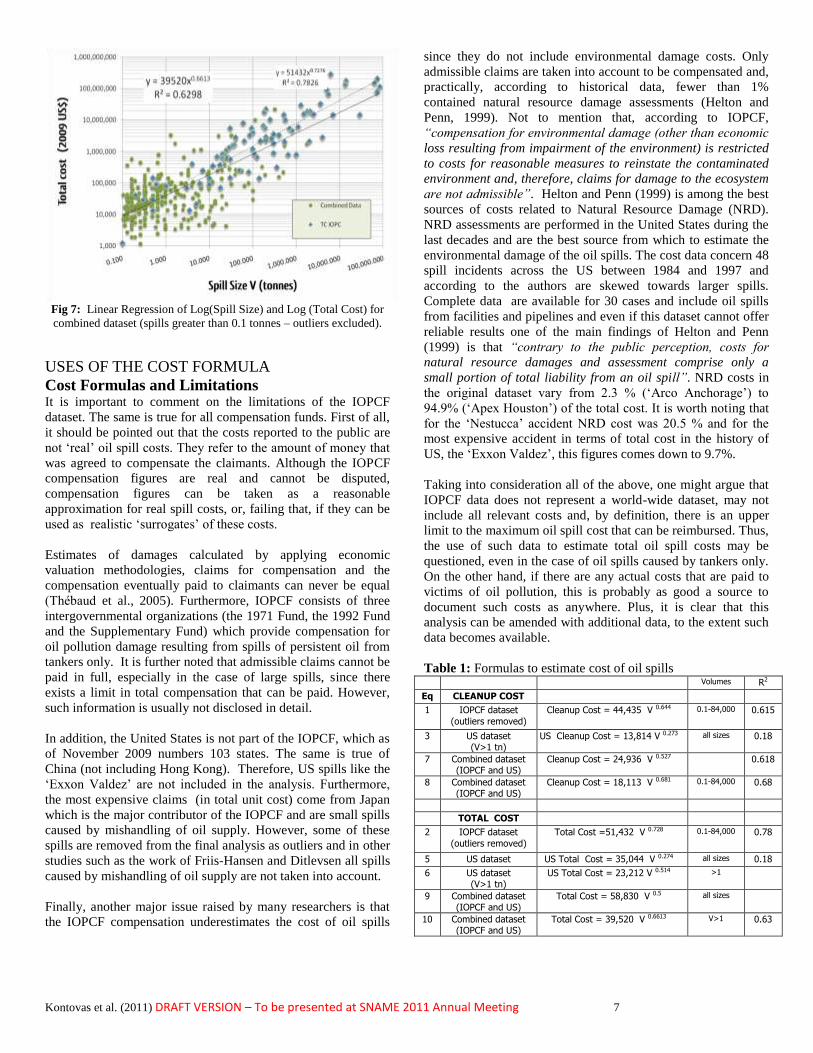
Fig 4. Comparison of the cleanup cost estimated by the IOPCF cost
formula with the US response cost.
Figure 4 presents the response cost that was actually paid by the
OSLTF. The solid line represents the cleanup cost based on our
regression formula (see Eq. 1) and the black dashed line is the
result of the regression analysis of the OSLTF data (see Eq. 3).
It is therefore obvious that the nonlinear curve (as derived by the
IOPCF analysis) overestimates the cleanup cost of oil spills that
were covered by the OSLTF – that is, most of the spills (green
dots) lie below the red line. In more detail, our formula
overestimates the cleanup cost for 327 out of the 486 US spills
(67.29%). This goes up to 80% of the cases for spills greater
than 0.1 tonnes. Note again that our non-linear curve was
estimated for spills higher than 0.2 tonnes and that our formula
estimates the cleanup cost which is less than the response cost.
Regarding the total cost based on the US dataset, Figure 5
presents the total cost of the spills in OLSTF dataset as the
response cost provided multiplied by a factor of 2.501. The solid
line represents the total cost based on our regression formula

Kontovas et al. (2011) DRAFT VERSION – To be presented at SNAME 2011 Annual Meeting 6
(see Eq. 2) and the dashed line is the result of the regression
analysis of the „best estimate‟ total costs. As a result, our
formula based on the IOPCF dataset overestimates the total cost
of oil spills (in comparison to the „best estimate‟ total cost) for
40% of all cases. However, for spills above 0.1 tonnes this
figure goes up to 57% and to 78% for spills above 1 tonne.
Although there are reservations for the total cost to response
cost „best estimate‟ ratio of 2.501 it is clearly that our formula
overestimates the total cost for about 80% of spills above 1
tonne.
Fig 5. Comparison of the total cost estimated by the IOPCF cost
formula with the US response cost.
Formulas based on the combined dataset Although these datasets come from two different spill sources, it
could be interesting to investigate the combination of the two.
One reason to do so is that the IOPCF dataset includes mainly
large spills and the OSLTF dataset contains mainly small spills.
This is also in line with the recommendation stated in IMO
(2009c) that our regression formula could be adjusted by
incorporating oil spill data provided by other Member
Governments.
Given that the dataset provided by the US included only
response cost our analysis focuses on combining this dataset
with the IOPCF cleanup cost data. Thus, we arrive at a data set
of 570 spills. The median oil spill has a size of 0.25 tonnes
whereas the average is 749.38 tonnes. By combining all data we
arrive at a new trend line that lies well below the cleanup trend
line derived from the IOPCF dataset, especially for large spills.
The reason as discussed before is that the OSLTF dataset
contains extremely small spills and about 3 times more data than
the IOPCF dataset. Note that any curve derived by regression
analysis of the combined dataset will grossly underestimate
spills over 1,000 tonnes.
By removing outliers (data points with an absolute residual of
above 2) a better fit can be achieved. The equation of the fitted
model is:
Cleanup Cost = 24,936 V 0.5271
(7)
Given that the IOPCF dataset contains spills greater that 0.1
tonnes we also performed a regression analysis of the combined
dataset for spills greater that 0.1 tonnes, see Fig. 6. The number
of spills in the final dataset is N=350 and they vary from 0.1 to
84,000 tonnes with a median of just 0.97 tonnes and an average
of 969 tonnes. The fit is better than the one derived by the
IOPCF dataset alone. The trend line derived by this regression is
the solid one. By carefully looking at the scatter plot, it is
obvious that this model overestimates spills at the lower end and
underestimates spills at the higher end.
To sum up, our analysis of the combined data for oil spills
greater than 0.1 tonnes (after removing the outliers) resulted in
the following equation of the fitted model using linear
regression:
Cleanup Cost = 18,113 V 0.6816
(8)
Fig.6: Linear Regression of Log(Spill Size) and Log (Cleanup Cost)
Combined dataset (spills greater than 0.1 tonnes – outliers excluded).
Similarly regression analyses were carried out based on a
combined dataset consisting of total costs based on the IOPCF
dataset (Fig 7, dashed line) and total costs for the US spills that
were estimated by multiplying the response cost with the factor
of 2.501 as discussed above.
The analysis of the combined data resulted in the following total
cost equation of the fitted model using linear regression:
Total Cost = 58,830 V 0.5
(9)
By removing all spills below 0.1 tonne (since the IOPCF dataset
contains only spills above 0.1 tonnes) we arrive at the following
formula (solid line):
Total Cost = 39,520 V 0.6613
(10)
It can be seen that the dashed trend line (Eq. 2) lies above the
solid one (Eq. 10) which means that the regression formula
based on the IOPCF overestimates the total costs for oil spills in
comparison to one derived from the OSLTF data.
Kontovas et al. (2011) DRAFT VERSION – To be presented at SNAME 2011 Annual Meeting 7
Fig 7: Linear Regression of Log(Spill Size) and Log (Total Cost) for
combined dataset (spills greater than 0.1 tonnes – outliers excluded).
USES OF THE COST FORMULA
Cost Formulas and Limitations It is important to comment on the limitations of the IOPCF
dataset. The same is true for all compensation funds. First of all,
it should be pointed out that the costs reported to the public are
not „real‟ oil spill costs. They refer to the amount of money that
was agreed to compensate the claimants. Although the IOPCF
compensation figures are real and cannot be disputed,
compensation figures can be taken as a reasonable
approximation for real spill costs, or, failing that, if they can be
used as realistic „surrogates‟ of these costs.
Estimates of damages calculated by applying economic
valuation methodologies, claims for compensation and the
compensation eventually paid to claimants can never be equal
(Thébaud et al., 2005). Furthermore, IOPCF consists of three
intergovernmental organizations (the 1971 Fund, the 1992 Fund
and the Supplementary Fund) which provide compensation for
oil pollution damage resulting from spills of persistent oil from
tankers only. It is further noted that admissible claims cannot be
paid in full, especially in the case of large spills, since there
exists a limit in total compensation that can be paid. However,
such information is usually not disclosed in detail.
In addition, the United States is not part of the IOPCF, which as
of November 2009 numbers 103 states. The same is true of
China (not including Hong Kong). Therefore, US spills like the
„Exxon Valdez‟ are not included in the analysis. Furthermore,
the most expensive claims (in total unit cost) come from Japan
which is the major contributor of the IOPCF and are small spills
caused by mishandling of oil supply. However, some of these
spills are removed from the final analysis as outliers and in other
studies such as the work of Friis-Hansen and Ditlevsen all spills
caused by mishandling of oil supply are not taken into account.
Finally, another major issue raised by many researchers is that
the IOPCF compensation underestimates the cost of oil spills
since they do not include environmental damage costs. Only
admissible claims are taken into account to be compensated and,
practically, according to historical data, fewer than 1%
contained natural resource damage assessments (Helton and
Penn, 1999). Not to mention that, according to IOPCF,
“compensation for environmental damage (other than economic
loss resulting from impairment of the environment) is restricted
to costs for reasonable measures to reinstate the contaminated
environment and, therefore, claims for damage to the ecosystem
are not admissible”. Helton and Penn (1999) is among the best
sources of costs related to Natural Resource Damage (NRD).
NRD assessments are performed in the United States during the
last decades and are the best source from which to estimate the
environmental damage of the oil spills. The cost data concern 48
spill incidents across the US between 1984 and 1997 and
according to the authors are skewed towards larger spills.
Complete data are available for 30 cases and include oil spills
from facilities and pipelines and even if this dataset cannot offer
reliable results one of the main findings of Helton and Penn
(1999) is that “contrary to the public perception, costs for
natural resource damages and assessment comprise only a
small portion of total liability from an oil spill”. NRD costs in
the original dataset vary from 2.3 % („Arco Anchorage‟) to
94.9% („Apex Houston‟) of the total cost. It is worth noting that
for the „Nestucca‟ accident NRD cost was 20.5 % and for the
most expensive accident in terms of total cost in the history of
US, the „Exxon Valdez‟, this figures comes down to 9.7%.
Taking into consideration all of the above, one might argue that
IOPCF data does not represent a world-wide dataset, may not
include all relevant costs and, by definition, there is an upper
limit to the maximum oil spill cost that can be reimbursed. Thus,
the use of such data to estimate total oil spill costs may be
questioned, even in the case of oil spills caused by tankers only.
On the other hand, if there are any actual costs that are paid to
victims of oil pollution, this is probably as good a source to
document such costs as anywhere. Plus, it is clear that this
analysis can be amended with additional data, to the extent such
data becomes available.
Table 1: Formulas to estimate cost of oil spills Volumes R2
Eq CLEANUP COST
1 IOPCF dataset
(outliers removed)
Cleanup Cost = 44,435 V 0.644 0.1-84,000 0.615
3 US dataset (V>1 tn)
US Cleanup Cost = 13,814 V 0.273 all sizes 0.18
7 Combined dataset (IOPCF and US)
Cleanup Cost = 24,936 V 0.527
0.618
8 Combined dataset (IOPCF and US)
Cleanup Cost = 18,113 V 0.681 0.1-84,000 0.68
TOTAL COST
2 IOPCF dataset
(outliers removed)
Total Cost =51,432 V 0.728 0.1-84,000 0.78
5 US dataset US Total Cost = 35,044 V 0.274 all sizes 0.18
6 US dataset (V>1 tn)
US Total Cost = 23,212 V 0.514 >1
9 Combined dataset (IOPCF and US)
Total Cost = 58,830 V 0.5 all sizes
10 Combined dataset (IOPCF and US)
Total Cost = 39,520 V 0.6613 V>1
0.63
Kontovas et al. (2011) DRAFT VERSION – To be presented at SNAME 2011 Annual Meeting 8
Before commenting on the possible uses of the regression
formulas we present them in the table above so that the reader
can easily compare them and pick the one that looks more
relevant for the particular analysis to be performed.
ADD TABLE AND GUIDANCE / SHORT
REVIEW
Formal Safety Assessment (FSA) FSA aims at giving recommendations to relevant decision
makers for safety improvements under the condition that the
recommended measures (risk control options) are cost-effective
and also reduce risk so that the residual risk is as low as
reasonably practicable (ALARP principle). Recall that for a risk
to be ALARP, the cost involved in reducing it further should be
grossly disproportionate to the benefit gained. FSA is, currently,
the major risk assessment tool that is being used for policy-
making within the International Maritime Organization (IMO),
however, until recently its main focus has been on assessing the
safety of human life and that of property. No environmental
considerations have been incorporated thus far into FSA
guidelines (IMO, 2007). However, MEPC 62 (July 2011) agreed
to package the main recommendations of the discussion on this
topic in the form of an amendment to the FSA guidelines, and
forwarded this to IMO‟s Maritime Safety Committee for further
action (IMO, 2011).
In addition, note that FSA exhibits some limitations and
deficiencies. The reader is referred to Kontovas (2005),
Kontovas and Psaraftis (2006 and 2009), Kontovas et al.
(2007a,b)) and Giannakopoulos et al. (2007) for a discussion on
these issues.
The fourth Step of a Formal Safety Assessment is to perform a
Cost-Benefit Analysis (CBA) so as to pick which RCOs are
most cost effective. According to the FSA guidelines (IMO,
2007), one stage of this Step is to “estimate and compare the
cost effectiveness of each option, in terms of the cost per unit
risk reduction by dividing the net cost by the risk reduction
achieved as a result of implementing the option”.
Up to now in most FSA studies cost effectiveness is assessed by
using the so-called Cost Effectiveness Analysis (CEA) and not
Cost Benefit Analysis (CBA) both of which will be briefly
discussed below. CEA may be considered to be a particular
form of CBA, where the benefits are usually not monetized, and
therefore, net benefits cannot be calculated, see Mishan and
Quah (2007) and Krupnick (2004).
Usually, in CEA, one calculates costs per unit of an
effectiveness measure (such as lives saved). Therefore, while
CEA cannot help in determining whether a policy increases
social welfare, it can help in the choice of policy that achieves
the specified goal with the smallest loss in social well-being and
help rank alternative policies according to their cost-
effectiveness (Krupnick, 2004).
In theory, the analytical tool of Cost Effectiveness Analysis is
the incremental cost-effectiveness ratio (ICER), also called
marginal cost-effectiveness ratio, given by the difference
in costs between two actions divided by the difference in
outcomes between these two, with the comparison typically
being between an action that is proposed to be implemented and
the current status. Note that being ratio tests, ICER figures
ignore the absolute value (or scale) of risk reduction ΔR, which
should always be taken into account as a criterion in itself
(Kontovas and Psaraftis, 2009).
In the scope of this paper, the following indices can be
formulated:
Gross Cost Effectiveness Index (GCEI)
CGCEI
R (10)
Net Cost Effectiveness Index (NCEI)
C BNCEI
R (11)
where
ΔC is the cost per ship of the action (eg. measure, risk control option)
under consideration ($)
ΔB is the economic benefit per ship resulting from the implementation
of the RCO ($), and
ΔR is the risk reduction per ship year, in terms of the number of tonnes
of oil averted (or fatalities when assessing human safety).
Currently only one such index is being extensively used in FSA
applications. This is the so-called “Cost of Averting a Fatality”
(CAF) and is expressed in two forms: Gross and Net. These two
indexes are the incremental cost-effectiveness ratios (in gross
and net form) for risk reductions in terms of the number of
fatalities averted. As part of the EU-funded project SAFEDOR
(2005), Skjong et al. (2005) and Vanem et al. (2007a, 2007b)
presented an environmental criterion equivalent to CAF. This is
nothing new, but an incremental cost effectiveness ratio to
assess the case of accidental releases of oil to the marine
environment that measures risk reduction in terms of the number
of tonnes of oil averted. This criterion was named CATS (for
‟Cost of averting a ton of oil spilt „, also referred to as ‟Cost to
Avert one Tonne of Spilled oil‟) and its suggested threshold
value was 60,000 USD/tonne. According to the CATS criterion,
a specific Risk Control Option (RCO) for reducing
environmental risk should be recommended for adoption if the
value of CATS associated with it (defined as the ratio of the
expected cost of implementing this RCO divided by the
expected oil spill volume averted by it) is below the specified
threshold. Otherwise that particular RCO should not be
recommended.
Kontovas and Psaraftis (2006) were probably the first to
question CATS as proposed by Skjong et al. (2005), both on the
use of any single dollar per tonne figure and on the 60,000
dollar threshold. A submission by Greece based on this paper
Kontovas et al. (2011) DRAFT VERSION – To be presented at SNAME 2011 Annual Meeting 9
opened the debate concerning environmental risk evaluation
criteria and its uses within FSA. As discussed previously, an
issue of primary importance was found to be the relationship
between spill volume and spill cost. Within the MEPC the
majority of those involved are in favor of a non-linear cost
function (IMO, 2009c). Given that the cost of an oil spill
depends upon the volume of the spill it is difficult to incorporate
the regression formulas within CEA. Besides, most Risk Control
Options have multiple effects (for example both in safety and
the environment) and in those cases CBA should be preferred as
it can combine multiple effects. The next Section will present
the technique of CBA along with the way to incorporate CBA
into FSA followed by an example.
Cost Benefit Analysis (CBA) CBA is an accounting technique for capturing the advantages
and disadvantages of an action in monetary terms, see Krupnick
(2004). This action can be a project, a Risk Control Option
(RCO), a medical intervention, a policy or any other measure.
Subtracting costs from benefits yields the net benefits to society
(also referred to as net improvements in social welfare). Actions
that improve welfare or well-being are superior to those that
reduce it. Furthermore, CBA can be used to cardinally rank
them on the basis of their change in well-being. CBA focuses on
the aggregate measures of well-being, taking the existing
distribution of income as given. For more details the reader is
referred to CBA textbooks such as Mishan and Quah (2007),
Boardman et al. (2001) and de Rus (2010).
The basic criterion is that if the discounted present value of the
benefits exceeds the discounted present value of the costs then
the action is worthwhile. This is equivalent to the saying that the
net benefit must be positive or that the ratio of the present value
of the benefits to the present value of the costs must be greater
than one. Amongst alternatives the one that has the higher net
benefit is the better.
In general, the cost component consists of the one-time (initial)
and running costs of an RCO, cumulating over the lifetime of
the system. The benefit part is much more intricate. It can be a
reduction in fatalities or a benefit to the environment (which is
the avoided cost of oil spills) or an economic benefit from
preventing a total ship loss. Cost is usually expressed using
monetary units. To be able to use a common denominator, a
monetary value has to be given for the benefit too. Therefore,
CBA can be used as an alternative to CEA even within FSA as
discussed in Yamada and Kaneko (2009) and Kontovas et al.
(2010), see next Section.
Finally, CBA can be used in risk analysis within probabilistic
oil outflow. Probabilistic oil outflow models may be used in risk
based optimization of crude oil carriers with respect to loss of
cargo. These are in line with the IMO regulations regarding the
probabilistic oil outflow for bunker tanks (applied to all spills)
and cargo tanks regarding oil carriers. Indeed, MEPC has
adopted a revised MARPOL Annex I/22 and 23 applicable to all
new oil tankers to provide adequate protection against oil
pollution in the event of grounding or collision, see IMO
(2006a, 2006b, 2006c).
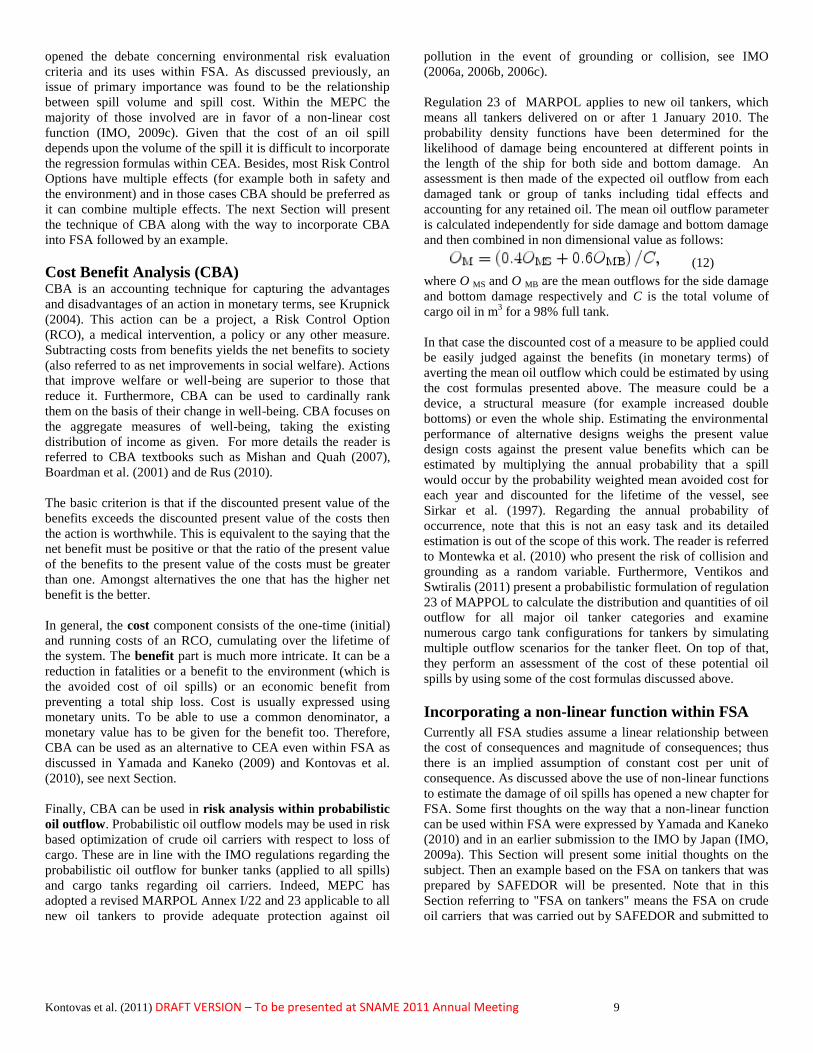
Regulation 23 of MARPOL applies to new oil tankers, which
means all tankers delivered on or after 1 January 2010. The
probability density functions have been determined for the
likelihood of damage being encountered at different points in
the length of the ship for both side and bottom damage. An
assessment is then made of the expected oil outflow from each
damaged tank or group of tanks including tidal effects and
accounting for any retained oil. The mean oil outflow parameter
is calculated independently for side damage and bottom damage
and then combined in non dimensional value as follows:
(12)
where O MS and O MB are the mean outflows for the side damage
and bottom damage respectively and C is the total volume of
cargo oil in m3 for a 98% full tank.
In that case the discounted cost of a measure to be applied could
be easily judged against the benefits (in monetary terms) of
averting the mean oil outflow which could be estimated by using
the cost formulas presented above. The measure could be a
device, a structural measure (for example increased double
bottoms) or even the whole ship. Estimating the environmental
performance of alternative designs weighs the present value
design costs against the present value benefits which can be
estimated by multiplying the annual probability that a spill
would occur by the probability weighted mean avoided cost for
each year and discounted for the lifetime of the vessel, see
Sirkar et al. (1997). Regarding the annual probability of
occurrence, note that this is not an easy task and its detailed
estimation is out of the scope of this work. The reader is referred
to Montewka et al. (2010) who present the risk of collision and
grounding as a random variable. Furthermore, Ventikos and
Swtiralis (2011) present a probabilistic formulation of regulation
23 of MAPPOL to calculate the distribution and quantities of oil
outflow for all major oil tanker categories and examine
numerous cargo tank configurations for tankers by simulating
multiple outflow scenarios for the tanker fleet. On top of that,
they perform an assessment of the cost of these potential oil
spills by using some of the cost formulas discussed above.
Incorporating a non-linear function within FSA
Currently all FSA studies assume a linear relationship between
the cost of consequences and magnitude of consequences; thus
there is an implied assumption of constant cost per unit of
consequence. As discussed above the use of non-linear functions
to estimate the damage of oil spills has opened a new chapter for
FSA. Some first thoughts on the way that a non-linear function
can be used within FSA were expressed by Yamada and Kaneko
(2010) and in an earlier submission to the IMO by Japan (IMO,
2009a). This Section will present some initial thoughts on the
subject. Then an example based on the FSA on tankers that was
prepared by SAFEDOR will be presented. Note that in this
Section referring to "FSA on tankers" means the FSA on crude
oil carriers that was carried out by SAFEDOR and submitted to

Kontovas et al. (2011) DRAFT VERSION – To be presented at SNAME 2011 Annual Meeting 10
the IMO by Denmark, see doc. MEPC 58/17/2 and MEPC
58/INF.2 (IMO, 2008).
First of all, assume that the spill cost function is given by the
formula produced after regression analysis of IOPCF data
which is as follows (Kontovas et al., 2010):
Cost (V) = 51,432V 0.728
(in USD, if V is in tonnes) (12)
The use of this particular function causes no loss of generality,
as any other function of volume can be tried. These include the
one used by Yamada (Japan), the one used by Psarros et al.
(DNV, Norway) or any other. Note however that the above
function was chosen by MEPC 60 as a test case for further
analysis (see report of MEPC 60, agenda item 17). The function
(Eq. 12) was chosen as it was judged as the most conservative
among the 3 non-linear functions, that is, produces higher cost
values among all 3 functions.
RCO evaluation by comparing the benefits (derived by using a
function) and the costs is, in theory, presented in Psaraftis
(2008) and Kontovas et al. (2010). Hammann and Loer (2010)
use such non linear cost functions within Cost Benefit
Assessment in risk-based ship design and more specifically to
optimize the arrangement of cargo holds of crude oil tankers.
Finally, Yamada (2009) and Yamada and Kaneko (2010)
presented a way to incorporate a non-linear cost function within
FSA. The latter paper forms the basis of a relevant submission
to the IMO, see IMO (2009a).
In most FSA studies an event tree is presented. For each
sequence of the event tree the expected number of tonnes of oil
that will be averted is calculated as the product of the frequency
of the event (Pi) and the average consequences (Vi) and is
presented as E[V]. This is defined as the Potential Loss of Cargo
(PLC) value for each sequence. In the case of using a non-linear
cost function, this value should then be multiplied with the per
tonne cost (which is a function of the spill volume) to estimate
the risk (denoted as E[Ci]) and by summing all the relevant
sequences the total risk may be obtained. Another equivalent
way to estimate the expected benefit of averting an oil spill by
using the cost function (Cost(V)) is to multiplying the
probability Pi with Cost (Vi).
According to Yamada and Kaneko (2010), an RCO can be
regarded as cost-effective if the following formula is satisfied
ΔΒ - ΔS > 0
where ΔΒ is the benefit by implementing the RCO which is the
risk reduction (in monetary units) and ΔS is the cost of
implementing the RCO. ΔΒ is the difference of estimated cost of
expected spillage before (E[Corg]) and after the implementation
of the RCO (E[Cnew]). Therefore, the criterion becomes
ΔS < ΔB = E[Corg] - E[Cnew]
Note that according to the recommendations of MEPC 62 (IMO,
2011 ) the cost to avert an oil spill should be equal to the
damage cost multiplied by two factors, namely the “assurance
factor” and the “uncertainty factor”. The so-called “assurance
factor” is supposed to represent society‟s willingness to pay to
prevent an oil spill instead of sustaining its damages. The
“uncertainty factor” represents the fact that the compensation
costs of a spill are not equal to the real costs of that spill. In
other words, this factor reflects the fact that some spill costs
cannot be captured and are uncertain. However, thus far there
has been no agreement on what this factor might be, even
though there is a clear belief by some IMO delegations that this
factor should be well above 1.0. Taking into account that a
commonly accepted and exact estimation of the cost of averting
an oil spill is not a trivial issue we assume within this paper that
the damage oil spill cost is equal to the cost of averting such a
spill. However, it is duly noted that this is a subject of further
debate.
We shall now present an example of how to incorporate the non-
linear function into FSA.
An example based on the FSA on tankers
FSA on tankers (IMO, 2008) was carried out by the project
SAFEDOR and presents a high-level Formal Safety Assessment
pertaining to large oil tanker ships. One of the scenarios
evaluated is the one that has to do with contact and this is used
as an example in the following.
Contact events consist of scenarios where the vessel accidentally
comes into contact with a floating object or a fixed installation.
The basic causes are because of bad visibility, navigational
problems such as human errors or equipment failure such as
radar failure, steering or propulsion failure. The following
Qualitative risk model presents the event sequence of a contact
of a tanker with a floating object (such as iceberg or a boy) or
with a fixed installation (for example an offshore terminal or
rocks).
Figure 8 : Event sequence in contact risk model of an Oil Tanker
(Source: IMO, 2008)
The high-level event tree model for collision accidents has been
elaborated on the basis of the qualitative and quantitative
considerations and can be represented by an event tree total of
52 sequential scenario branches with non zero frequency, 7 of
which are associated with oil spill occurrence. For simplicity,
the event tree with only these 7 braches is presented in the
Kontovas et al. (2011) DRAFT VERSION – To be presented at SNAME 2011 Annual Meeting 11
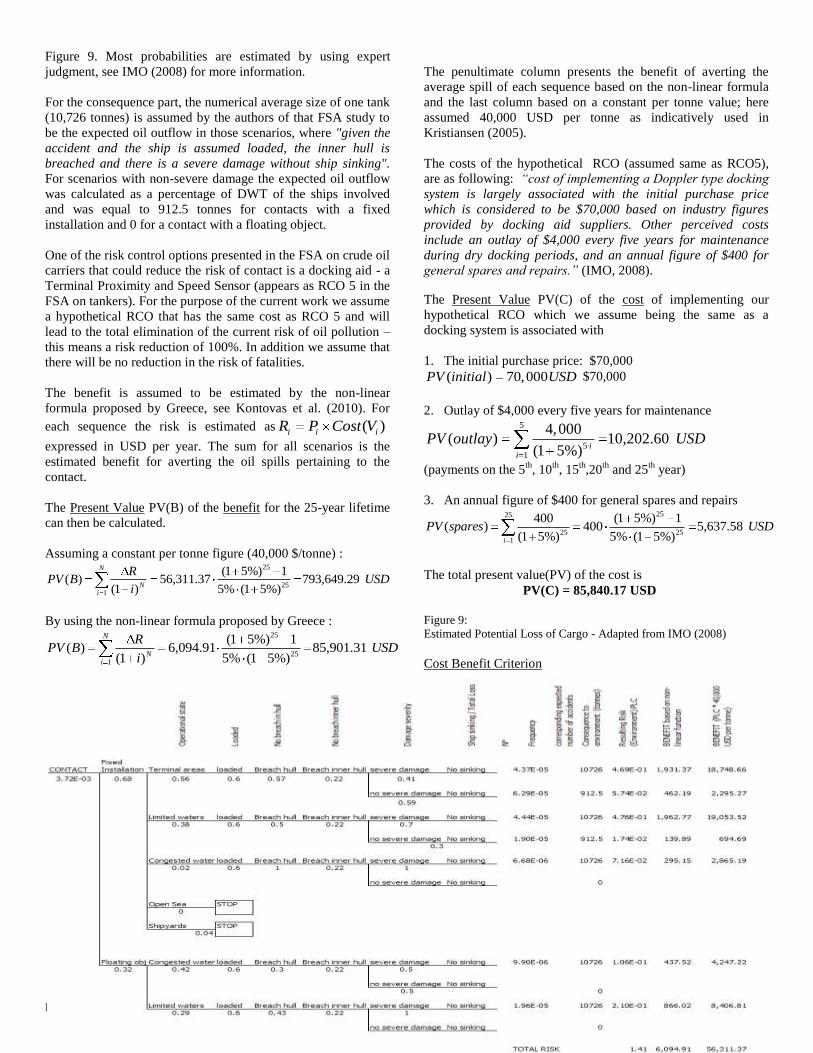
Figure 9. Most probabilities are estimated by using expert
judgment, see IMO (2008) for more information.
For the consequence part, the numerical average size of one tank
(10,726 tonnes) is assumed by the authors of that FSA study to
be the expected oil outflow in those scenarios, where "given the
accident and the ship is assumed loaded, the inner hull is
breached and there is a severe damage without ship sinking".
For scenarios with non-severe damage the expected oil outflow
was calculated as a percentage of DWT of the ships involved
and was equal to 912.5 tonnes for contacts with a fixed
installation and 0 for a contact with a floating object.
One of the risk control options presented in the FSA on crude oil
carriers that could reduce the risk of contact is a docking aid - a
Terminal Proximity and Speed Sensor (appears as RCO 5 in the
FSA on tankers). For the purpose of the current work we assume
a hypothetical RCO that has the same cost as RCO 5 and will
lead to the total elimination of the current risk of oil pollution –
this means a risk reduction of 100%. In addition we assume that
there will be no reduction in the risk of fatalities.
The benefit is assumed to be estimated by the non-linear
formula proposed by Greece, see Kontovas et al. (2010). For
each sequence the risk is estimated as ( )i i iR P Cost V
expressed in USD per year. The sum for all scenarios is the
estimated benefit for averting the oil spills pertaining to the
contact.
The Present Value PV(B) of the benefit for the 25-year lifetime
can then be calculated.
Assuming a constant per tonne figure (40,000 $/tonne) : 25
251
(1 5%) 1( ) 56,311.37 793,649.29
(1 ) 5% (1 5%)
N
Ni
RPV B USD
i
By using the non-linear formula proposed by Greece : 25
251
(1 5%) 1( ) 6,094.91 85,901.31
(1 ) 5% (1 5%)
N
Ni
RPV B USD
i
The penultimate column presents the benefit of averting the
average spill of each sequence based on the non-linear formula
and the last column based on a constant per tonne value; here
assumed 40,000 USD per tonne as indicatively used in
Kristiansen (2005).
The costs of the hypothetical RCO (assumed same as RCO5),
are as following: “cost of implementing a Doppler type docking
system is largely associated with the initial purchase price
which is considered to be $70,000 based on industry figures
provided by docking aid suppliers. Other perceived costs
include an outlay of $4,000 every five years for maintenance
during dry docking periods, and an annual figure of $400 for
general spares and repairs.” (IMO, 2008).
The Present Value PV(C) of the cost of implementing our
hypothetical RCO which we assume being the same as a
docking system is associated with
1. The initial purchase price: $70,000
( ) 70,000PV initial USD $70,000
2. Outlay of $4,000 every five years for maintenance 5
51
4,000( ) 10,202.60
(1 5%) ii
PV outlay USD
(payments on the 5th
, 10th
, 15th,20
th and 25
th year)
3. An annual figure of $400 for general spares and repairs 2525
25 251
400 (1 5%) 1( ) 400 5,637.58
(1 5%) 5% (1 5%)i
PV spares USD
The total present value(PV) of the cost is
PV(C) = 85,840.17 USD Figure 9:
Estimated Potential Loss of Cargo - Adapted from IMO (2008)
Cost Benefit Criterion
Kontovas et al. (2011) DRAFT VERSION – To be presented at SNAME 2011 Annual Meeting 12
The present value of the cost of the implementation of the RCO
is $85,840 and is less than the benefits based on the above
calculations. Therefore the RCO should be considered for
implementation.
Note that if a high constant per tonne value is used the benefit of
averting the oil spill will be grossly overestimated. In the above
calculation a constant per tonne value of 40,000, in line with
Kristiansen (2005) and Skjong (2005) leads to 10 times the
benefit that we estimate by using the non-linear function.
Obviously, the greater the per tonne figure the greater the
benefit and, thus, more RCOs will be deemed as cost-effective.
CONCLUSIONS The paper discusses the rather difficult issue of estimating the
cost of oil spills. This issue is of primary importance for risk
assessment since this cost could be used to estimate the benefit
of risk control measures that avert such oil spills. However,
beyond any doubt, the cost of an oil spill is a very difficult
quantity to estimate. The main factors influencing the cost of oil
spills are the type of oil, location, weather and sea conditions
and the amount spilled and rate of spillage. In order to be in line
with the work done within the IMO the cost of oil spills is
expressed as a function of the amount spilled. Furthermore, the
approach used in this work is based on the assumption that the
cost of an oil spill can be approximated by the compensation
eventually paid to claimants by relative funds. The paper
reported on recent analyses of oil spill cost data assembled by
the International Oil Pollution Compensation Fund (IOPCF).
Given that the US in not a part of the IOPCF, analyses of the
cleanup cost based on data of US spills that were covered by the
US Oil Spill Liability Trust Fund (OSLTF) are also presented.
Caution should be exercised when using these valuation
functions since the compensation data refer to the amount of
money that was agreed to compensate the claimants. Although
the IOPCF compensation figures are real and cannot be
disputed, a question is if compensation figures can be taken to
reasonably approximate real spill costs, or, failing that, if they
can be used as realistic „surrogates‟ of these costs. Furthermore,
the IOPCF contains spills from 0.1 to 84,000 tonnes of which
only 11 are above 5,000 tonnes. The data from US spills mainly
come from extremely small spills. The median spill size of the
dataset is 0.16 tonnes and the average is just 168.29 tonnes. The
oil spill size in question should fall within the range of the data
that were used to arrive at the regression formula that is to be
used Finally, it has been shown that the regression formula
derived from IOPCF data (Eq. 1) gives more conservative
results than all other formulas and could be used in order to be
on the safe side.
Moreover, the paper discusses the uses of these non-linear
functions to estimate the cost of an oil spill. These functions
could also be used within maritime risk assessment and more
specifically within the Formal Safety Assessment. Indeed, there
is an ongoing discussion within the Marine Environment
Protection Committee (MEPC) starting in 2006 when the IMO
decided to act on the subject of environmental criteria. An
example of the use of a non-linear cost function based on an
FSA study on tankers submitted to the IMO was also presented.
Finally, the paper presented a brief discussion on the uses of oil
spill valuation through Cost Benefit Assessment to evaluate the
performance of tanker designs taking into account the recent
IMO regulations regarding oil carriers and more precisely the
revised MARPOL Annex I/23 and 24 applicable to all new oil
tankers to provide adequate protection against oil pollution in
the event of grounding or collision.
ACKNOWLEDGEMENT We would like to thank three anonymous reviewers and the lead
reviewer for their comments on a previous version of the paper.
REFERENCES Boardman et al. (2001) ―Cost-Benefit Analysis: Concepts and Practice,
2nd edition. Prentice Hall, Upper Saddle River.
Brown, & Savage. (1996). ―The Economics of Double-Hulled
Tankers‖. Maritime Policy Management, Vol. 23, No. 2.
Etkin, D.S.(1999) ―Estimating Cleanup Costs for Oil Spills‖,
Proceedings International Oil Spill Conference, American
Petroleum Institute, Washington, DC.
De Rus, G. (2010) "Introduction to Cost-Benefit Analysis: Looking for
Reasonable Shortcuts", Edward Elgar Publishing.
Friis-Hansen,P., Ditlevsen,O., (2003),"Nature preservation acceptance
model applied to tanker oil spill simulations", Journal of Structural
Safety, Vol. 25, Issue 1,pp 1-34.
Giannakopoulos Y., D. Bouros, N.P.Ventikos (2007) ―Safety at
Risk?.‖, Proceedings of the International Symposium on Maritime
Safety, Security and Environmental Protection (SSE07),Athens,
Greece, September 2007.
Grey, C., (1999), ―The Cost of Oil Spills from Tankers: An Analysis of
IOPC Fund Incidents‖, The International Oil Spill Conference
1999, 7-12 March 1999, Seattle, USA. ITOPF, London.
Hamann, R. and Loer, K., (2010), " Risk-based Optimization of Crude
Oil Tanker Cargo Holds", The 3rd International Symposium on
Ship Operations, Management & Economics, Athens, Greece 7-8
October, 2010.
Helton, D., Penn, T.,1999. ―Putting response and natural resource
damage costs in perspective‖. In: Proceedings of the 1999
international oil spill conference, 1999.
Hendrickx, R., (2007), "Maritime Oil Pollution: an Empirical
Analysis", in Faure, M. and Verheij, A. (Eds.) "Shifts in
Compensation for Environmental Damage", Springer Verlag.
ICF Kaiser. (1997). ―The Economic Impacts of Accidents on the
Marine Industry‖.Washington: U.S. Coast Guard.
IOPCF(2009), ―Annual report 2008‖. International Oil Pollution
Compensation Funds, London, UK.
ITOPF (2010), "Oil Tanker Spill Statistics: 2010", The International
Tanker Owners Pollution Federation (ITOPF), London; UK.
IMO (2006a), Resolution MEPC 141(54), March 2006, MARPOL 12A
IMO (2006b), Resolution MEPC 122(52), October 2006, MARPOL –
Explanatory notes on Reg 23.
IMO (2006c), Resolution MEPC 117(52), October 2006, MARPOL
Revised Annex I.
IMO (2007). ―Formal Safety Assessment: Consolidated text of the
Guidelines for Formal Safety Assessment (FSA) for Use in the
IMO Rule-Making Process‖, MSC 83/INF.2.

Kontovas et al. (2011) DRAFT VERSION – To be presented at SNAME 2011 Annual Meeting 13
IMO (2008), ―Formal Safety Assessment on Crude Oil Tankers‖. Doc.
MEPC 58/17/2 and MEPC 58/INF.2. Submitted by Denmark.
IMO (2009a), "Comments on the Correspondence Group report of the
Environmental Risk Evaluation Criteria", Submitted by Japan,
MEPC 59/17/1 - Yamada+cost incorp.
IMO (2009b), "An Empirical Analysis of IOPCF Oil Spill Cost Data",
Abridged Version of Kontovas et al. (2010), Submitted by Greece,
MEPC 60/17 - Annex 2, Dec. 18, 2009.
IMO (2009c), "Report of the Correspondence Group on Environmental
Risk Evaluation Criteria", Submitted by Greece on behalf of the
Coordinator of the Correspondence Group, MEPC 60/17, Dec.
2009.
IMO (2010a), "Report of the Working Group on Environmental Risk
Evaluation Criteria within the context of Formal Safety
Assessment", MEPC 60/WP.11, March 24, 2010.
IMO (2010b), "Information on the cost of oil spills in the United States'
territorial waters", Submitted by the United States. MEPC
61/INF.11 , July 13, 2010.
IMO (2010c), "Further experience with non-linear oil spill cost
functions" , Submitted by Greece, MEPC 61/18/2 , July 23, 2010.
IMO (2011), "Report of the Working Group on Environmental Risk
Evaluation Criteria within the context of Formal Safety
Assessment", MEPC 62/WP.13, July, 2011.
Jacobsson, M., (2007), The International Oil Pollution Compensation
Funds and the International Regime of Compensation for Oil
Pollution Damage. In: Basedow J, Magnus U (eds) Pollution of the
sea—prevention and compensation. Springer, Berlin, pp 137–150.
Jean-Hansen V.(2003)," Skipstrafikken i området Lofoten—
Barentshavet", Kystverket, Transportøkonomisk institutt,
644/2003, 2003 (in Norwegian), ISBN:82-480-0341-8.
Kontovas, C.A., (2005) ―Formal Safety Assessment: Critical Review
and Future Role‖, Diploma Thesis supervised by H.N. Psaraftis,
National Technical University of Athens, July 2005 (available at
www.martrans.org).
Kontovas, C.A. and H.N. Psaraftis (2006), ―Assessing Environmental
Risk: Is a single figure realistic as an estimate for the cost of
averting one tonne of spilled oil?,‖ Working Paper NTUA-MT-06-
101, National Technical University of Athens, February (available
at www.martrans.org).
Kontovas, C. A., H.N. Psaraftis, and P. Zachariadis (2007a), ―The Two
C’s of the Risk Based Approach to Goal-Based Standards:
Challenges and Caveats,‖ International Symposium on Maritime
Safety, Security and Environmental Protection (SSE07), Athens,
Greece, September.
Kontovas, C. A., H.N. Psaraftis, and P. Zachariadis, (2007b),
―Improvements in FSA Necessary for Risk-Based GBS,‖ PRADS
2007 Conference, Houston, USA, October.
Kontovas, C.A., and H.N. Psaraftis (2009. Formal Safety Assessment:
A Critical Review,‖ Marine Technology, Vol. 46(1). January 2009,
pp. 45-59.
Kontovas, C.A., H.N. Psaraftis , (2008). Marine Environment Risk
Assessment: A Survey on the Disutility Cost of Oil Spills,‖ 2nd
International Symposium on Ship Operations, Management and
Economics,‖ Athens, Greece.
Kontovas, C.A., Psaraftis, H.N., Ventikos N. (2010), ―An Empirical
Analysis of IOPCF Oil Spill Cost Data‖, Marine Pollution
Bulletin, Volume 60, Issue 9, September 2010, Pages 1455-1466.
Kristiansen, S.,‖Maritime Transportation: Safety Management and Risk
Analysis‖, Butterworth-Heinemann, 2004.
Krupnick (2004) "Valuing Health Outcomes:Policy Choices and
Technical Issues", Resources for the Future (RFF) report,
Executive Summary.
Liu W., Wirtz, K.W, Kannen, A, Kraft, A. ,2009. Willingness to pay
among households to prevent coastal resources from polluting by
oil spills: A pilot survey. Marine Pollution Bulletin. 58, 10, pp.
1514-1521.
Mercer Management Consulting. (1992). OPA-90: Regulatory Impact
Analysis Review –Spill Unit Values. Lexington: Mercer
Management Consulting.
McCay, D.F., Rowe, J.J. ,Whittier, N. , Sankaranarayanan, S. and
Etkin, D.S., (2004), ―Estimation of potential impacts and natural
resource damages of oil‖, Journal of Hazardous Materials 107
(2004), pp. 11–25.
Mishan, E.J and Euston Quah (2007), "Cost Benefit Analysis",
Routledge, New York, NY.
Montewka J, Krata P, Kujala P. (2010), ―Elements of risk analysis for
collision and grounding of oil tankers in the selected areas of the
Gulf of Finland‖, 5th International Conference on Collision and
Grounding of Ships.
NPFC (2002), ―Year in Review FY2001-FY2002(2002)‖, National
Pollution Funds Center, Report, [Online] www.uscg.mil/hq/npfc.
Psaraftis, H.N., (2008), ―Environmental Risk Evaluation Criteria‖,
WMU Journal of Maritime Affairs, Volume 7, Number 2, October
2008 , pp. 409-427(19).
Psarros,G., Skjong,R. and Vanem, E., (2011), "Risk acceptance
criterion for tanker oil spill risk reduction measures" ,Marine
Pollution Bulletin, Volume 62, Issue 1, January 2011.
Ramseur, J. R. (2010). Oil spills in U.S. coastal waters: Background,
governance, and issues for Congress. Congressional Research
Service.
Sirkar,J., Ameer,P., Brown,A., Goss,P., Michel,K., Frank, F., Wayne,
W. (1979)"A Framework for Assessing the Environmental
Performance of Tankers in Accidental Groundings and Collisions",
SNAME Transactions Volume 105, 1997.
Skjong, R., E. Vanem, Ø. Endresen, 2005. Risk Evaluation Criteria‖
SAFEDOR-D-4.5.2-2007-10-24-DNV-RiskEvaluationCriteria-rev-
3.0, [Online] www.safedor.org.
Thébaud, O., D. Bailly, J. Hay, and J.A. Pérez Agundez, 2005. The
cost of oil pollution at sea : an analysis of the process of damage
valuation and compensation following oil spills. in Economic,
Social and Environmental Effects of the Prestige Oil Spill de
Compostella, Santiago. 2005. p. 187-219.
Vanem, E., Endresen, Ø., Skjong, R., (2007a), ―Cost effectiveness
criteria for marine oil spill preventive measures‖, Reliability
Engineering and System Safety, doi:10.1016/j.ress.2007.07.008.
Vanem, E., Endresen, Ø., Skjong, R.,(2007b),―CATS – Cost-
effectiveness in Designing for Oil Spill Prevention‖, PRADS 2007
Conference, Houston, USA, October.
Ventikos, N. P., Hatzinikolaou S. D. and Zagoraios, G., 2009. The cost
of oil spill response in Greece: analysis and results. Proc. Int.
Maritime Association of Mediterranean. 12-15 October, Istanbul,
Turkey.
Ventikos N.P. and Swtiralis P. (2011), "Probabilistic Oil Outflow: The
Tanker Fleet in the context of Risk Analysis", Proc. European
Conference on Shipping & Ports 2011, Chios, Greece, June 22-24.
White, I.C., Molloy, F. (2003), ―Factors that Determine the Cost of Oil
Spills”, International Oil Spill Conference 2003, Vancouver,
Canada, 6-11 April.
Yamada, Y. (2009), "The Cost of Oil Spills from Tankers in Relation to
Weight of Spilled Oil", Marine Technology, 46(4), pp. 219-
228(10).
Yamada, Y. and Kaneko, F. (2010), "On the Derivation of CATSthr
within the Framework of IMO environmental FSA studies", 5th
International Conference on Collision and Grounding of Ships,
June 14th - 16th 2010, Espoo, Finland.