Embed Size (px)
Citation preview
1
Estimating Surface Runoff and Landcover Changes for the Thorn Creek Watershed
Authors: Mike Michalek, Alison Keener, and Kauthar Al-Habsi
Introduction: It is well-known that pervasive land-use changes since the 1800’s have
contributed to an increase in nonpoint source water pollution, which the Environmental
Protection Agency (EPA) has identified as one of the leading sources of water quality
impairment nationwide. With over twenty-seven reports of impaired waterbodies within the
Muskegon River Watershed alone, illicit sources of surface water runoff have received attention
from environmental regulators and environmental advocates alike. Modified pathways and rates
of water flow across a landscape can be effectively measured using GIS software in conjunction
with established hydrologic parameters. Our project will estimate a runoff curve number within
ESRI’s ArcGIS to demonstrate how deforestation and urban development within the last 150
years has increased storm water surface runoff in the Thorn Creek Watershed of North-Central
Lower Michigan, a sub-basin within the Muskegon River Watershed. Surface runoff in the Thorn
Creek Watershed exits the catchment at the lowest point in Evart, Michigan (310 meters above
sea level).
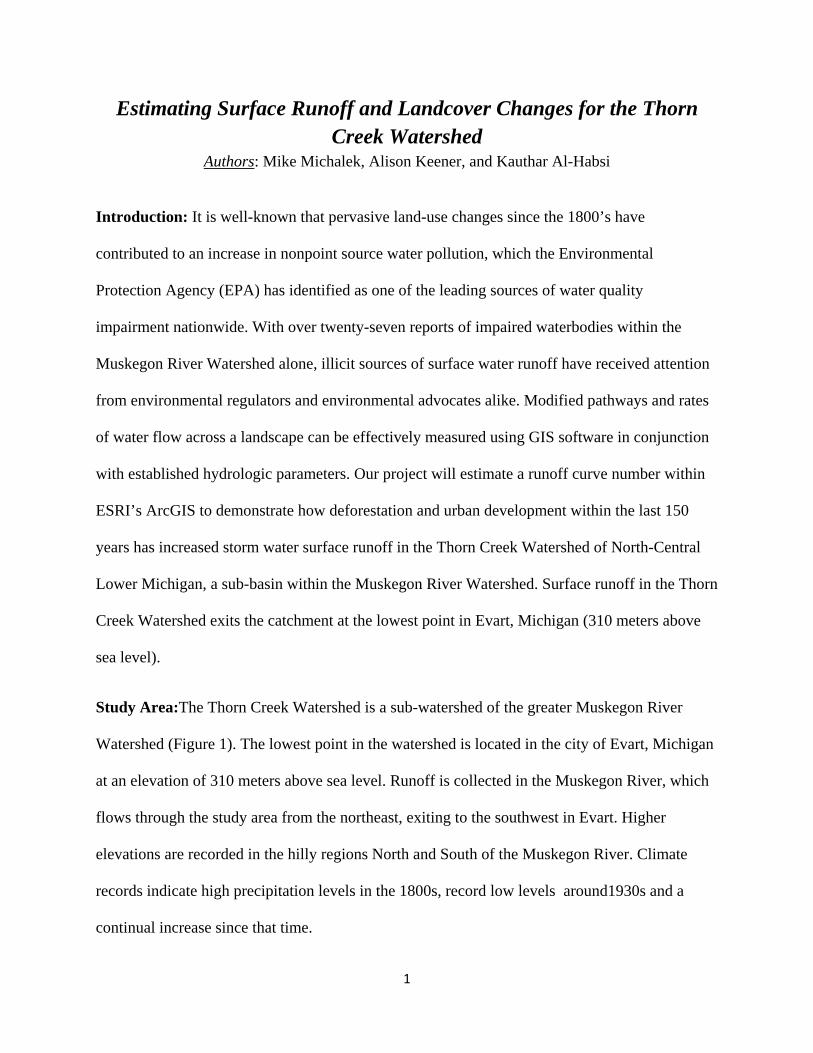
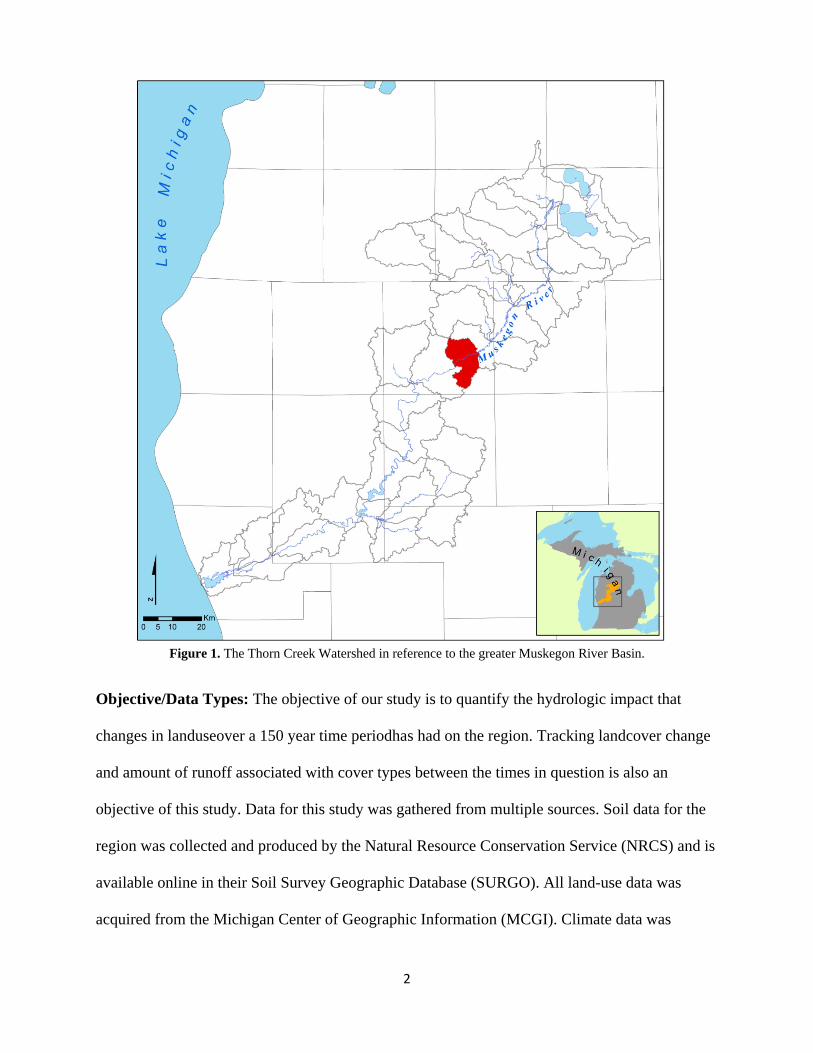
Study Area:The Thorn Creek Watershed is a sub-watershed of the greater Muskegon River
Watershed (Figure 1). The lowest point in the watershed is located in the city of Evart, Michigan
at an elevation of 310 meters above sea level. Runoff is collected in the Muskegon River, which
flows through the study area from the northeast, exiting to the southwest in Evart. Higher
elevations are recorded in the hilly regions North and South of the Muskegon River. Climate
records indicate high precipitation levels in the 1800s, record low levels around1930s and a
continual increase since that time.
2
Figure 1. The Thorn Creek Watershed in reference to the greater Muskegon River Basin.
Objective/Data Types: The objective of our study is to quantify the hydrologic impact that
changes in landuseover a 150 year time periodhas had on the region. Tracking landcover change
and amount of runoff associated with cover types between the times in question is also an
objective of this study. Data for this study was gathered from multiple sources. Soil data for the
region was collected and produced by the Natural Resource Conservation Service (NRCS) and is
available online in their Soil Survey Geographic Database (SURGO). All land-use data was
acquired from the Michigan Center of Geographic Information (MCGI). Climate data was
3
obtained from Jeffrey Andresen, PhD., in the Michigan State University Department of
Geography.
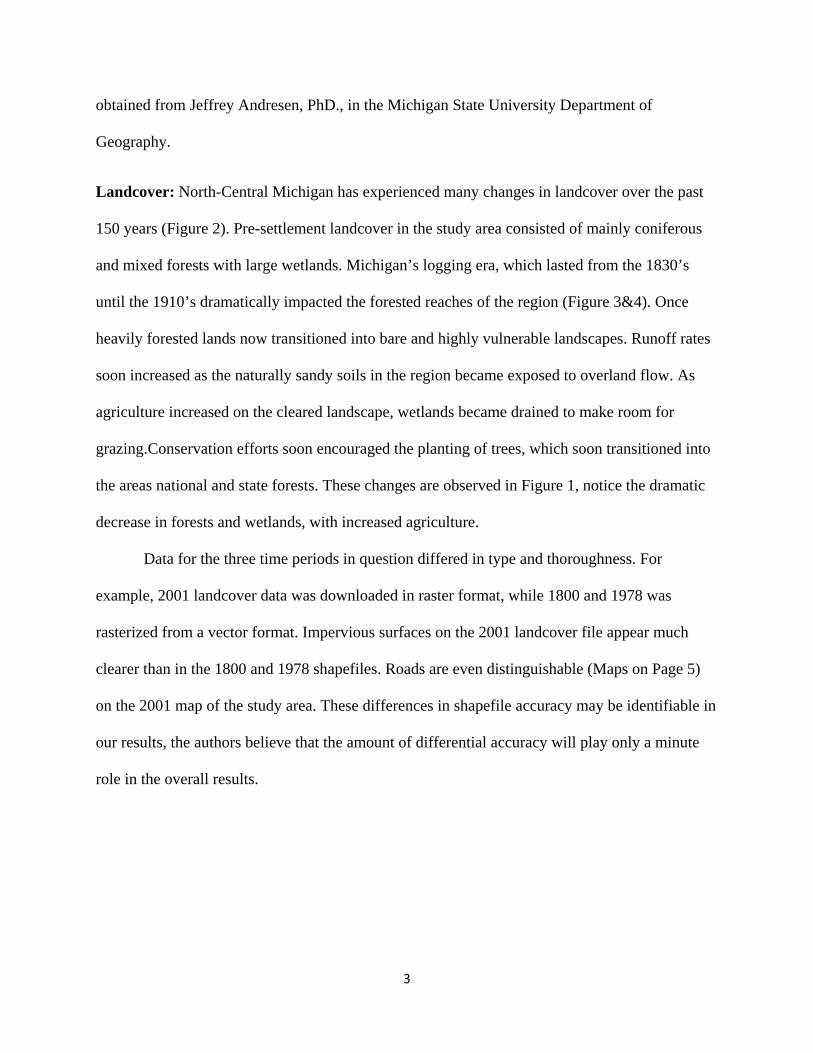
Landcover: North-Central Michigan has experienced many changes in landcover over the past
150 years (Figure 2). Pre-settlement landcover in the study area consisted of mainly coniferous
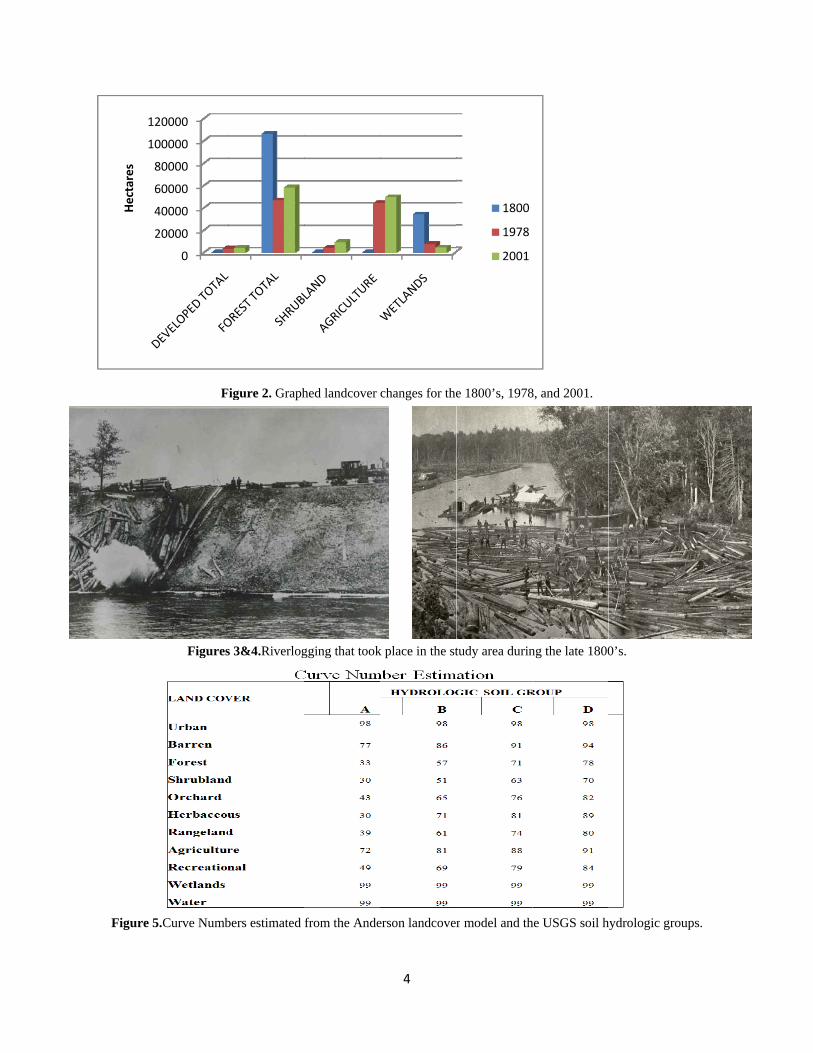
and mixed forests with large wetlands. Michigan’s logging era, which lasted from the 1830’s
until the 1910’s dramatically impacted the forested reaches of the region (Figure 3&4). Once
heavily forested lands now transitioned into bare and highly vulnerable landscapes. Runoff rates
soon increased as the naturally sandy soils in the region became exposed to overland flow. As
agriculture increased on the cleared landscape, wetlands became drained to make room for
grazing.Conservation efforts soon encouraged the planting of trees, which soon transitioned into
the areas national and state forests. These changes are observed in Figure 1, notice the dramatic
decrease in forests and wetlands, with increased agriculture.
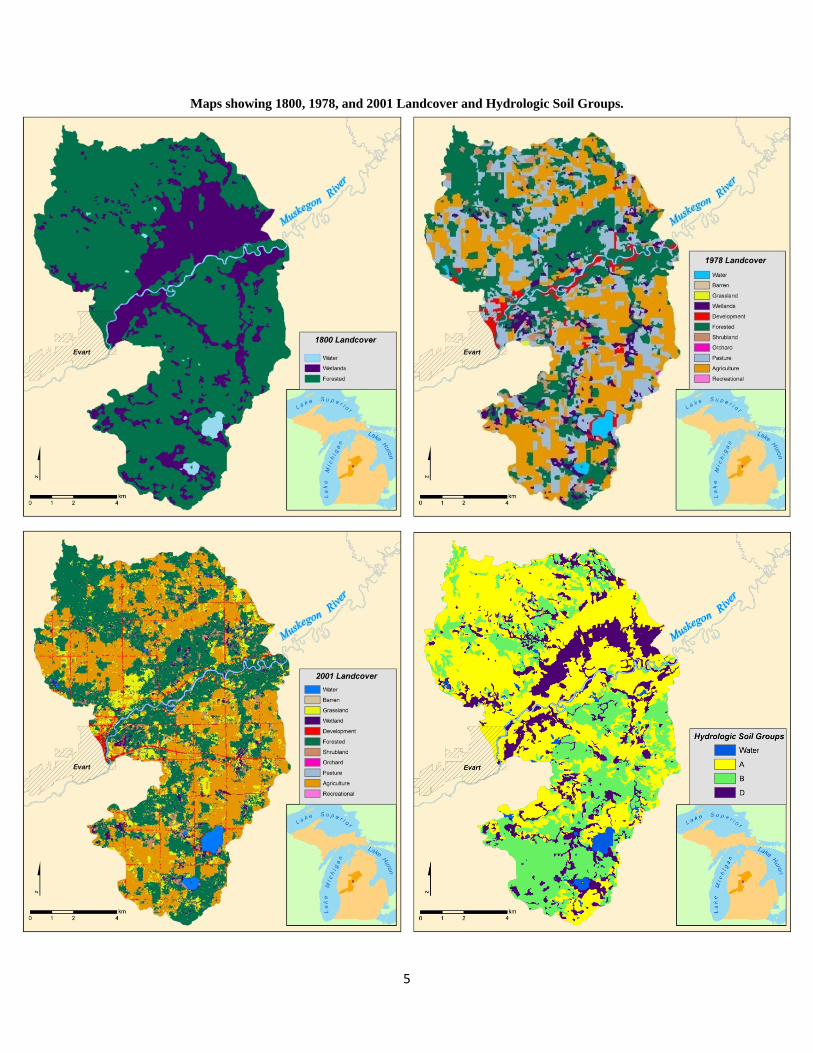
Data for the three time periods in question differed in type and thoroughness. For
example, 2001 landcover data was downloaded in raster format, while 1800 and 1978 was
rasterized from a vector format. Impervious surfaces on the 2001 landcover file appear much
clearer than in the 1800 and 1978 shapefiles. Roads are even distinguishable (Maps on Page 5)
on the 2001 map of the study area. These differences in shapefile accuracy may be identifiable in
our results, the authors believe that the amount of differential accuracy will play only a minute
role in the overall results.
Figure
1
1Hectares
F
Figures
5.Curve Numb
0
20000
40000
60000
80000
100000
120000
Figure 2. Graph
s 3&4.Riverlog
bers estimated
hed landcover
gging that took
from the Ande
4
changes for the
k place in the st
erson landcover
e 1800’s, 1978
tudy area durin
r model and th
1800
1978
2001
8, and 2001.
ng the late 1800
he USGS soil h
0’s.
hydrologic grouups.
5
Maps showing 1800, 1978, and 2001 Landcover and Hydrologic Soil Groups.
6
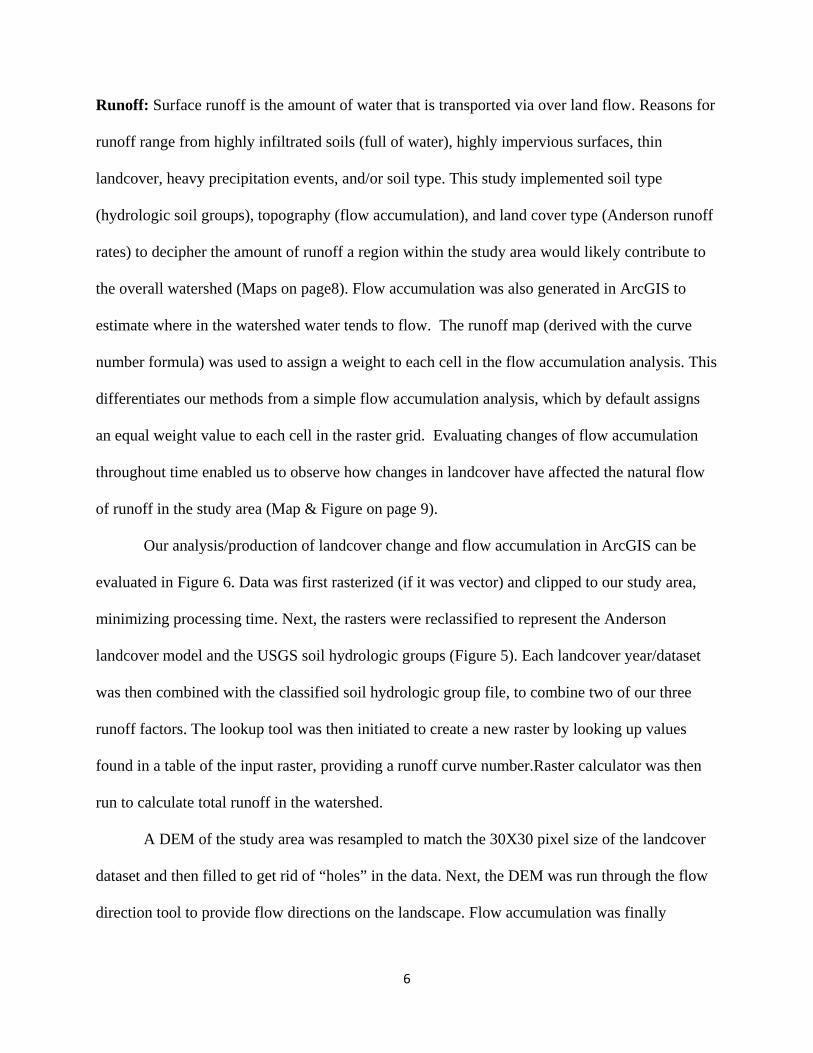
Runoff: Surface runoff is the amount of water that is transported via over land flow. Reasons for
runoff range from highly infiltrated soils (full of water), highly impervious surfaces, thin
landcover, heavy precipitation events, and/or soil type. This study implemented soil type
(hydrologic soil groups), topography (flow accumulation), and land cover type (Anderson runoff
rates) to decipher the amount of runoff a region within the study area would likely contribute to
the overall watershed (Maps on page8). Flow accumulation was also generated in ArcGIS to
estimate where in the watershed water tends to flow. The runoff map (derived with the curve
number formula) was used to assign a weight to each cell in the flow accumulation analysis. This
differentiates our methods from a simple flow accumulation analysis, which by default assigns
an equal weight value to each cell in the raster grid. Evaluating changes of flow accumulation
throughout time enabled us to observe how changes in landcover have affected the natural flow
of runoff in the study area (Map & Figure on page 9).
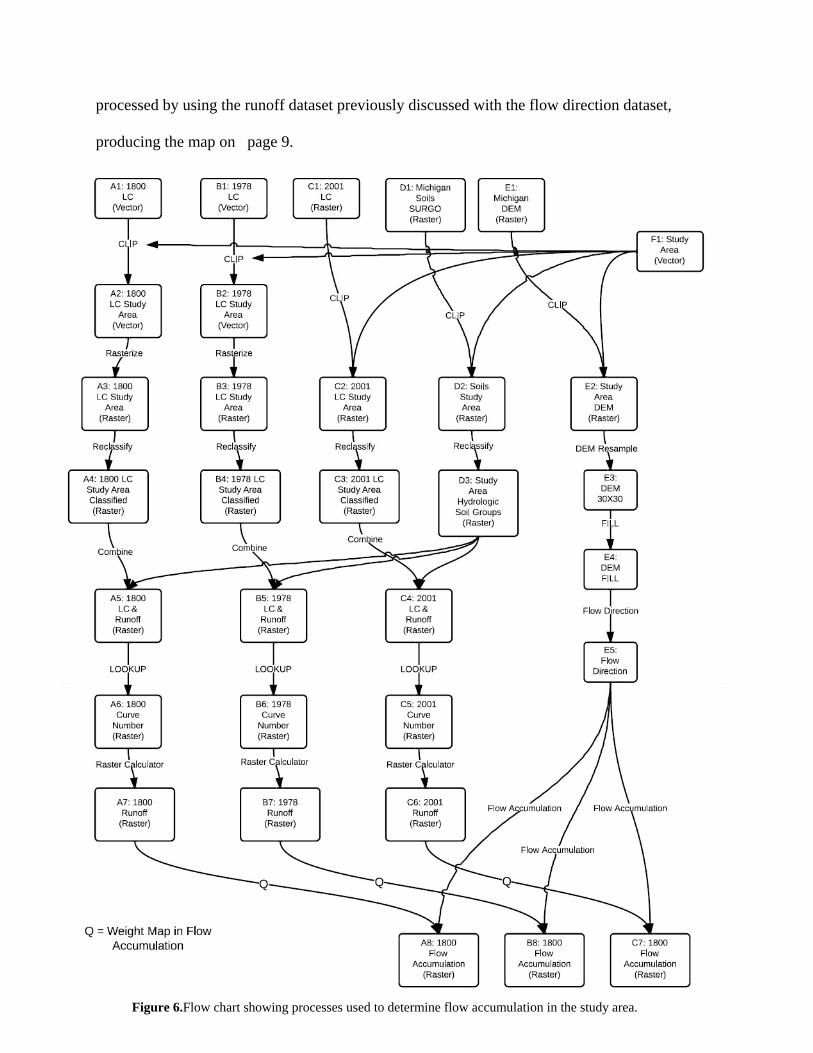
Our analysis/production of landcover change and flow accumulation in ArcGIS can be
evaluated in Figure 6. Data was first rasterized (if it was vector) and clipped to our study area,
minimizing processing time. Next, the rasters were reclassified to represent the Anderson
landcover model and the USGS soil hydrologic groups (Figure 5). Each landcover year/dataset
was then combined with the classified soil hydrologic group file, to combine two of our three
runoff factors. The lookup tool was then initiated to create a new raster by looking up values
found in a table of the input raster, providing a runoff curve number.Raster calculator was then
run to calculate total runoff in the watershed.
A DEM of the study area was resampled to match the 30X30 pixel size of the landcover
dataset and then filled to get rid of “holes” in the data. Next, the DEM was run through the flow
direction tool to provide flow directions on the landscape. Flow accumulation was finally
7
processed by using the runoff dataset previously discussed with the flow direction dataset,
producing the map on page 9.
Figure 6.Flow chart showing processes used to determine flow accumulation in the study area.
8
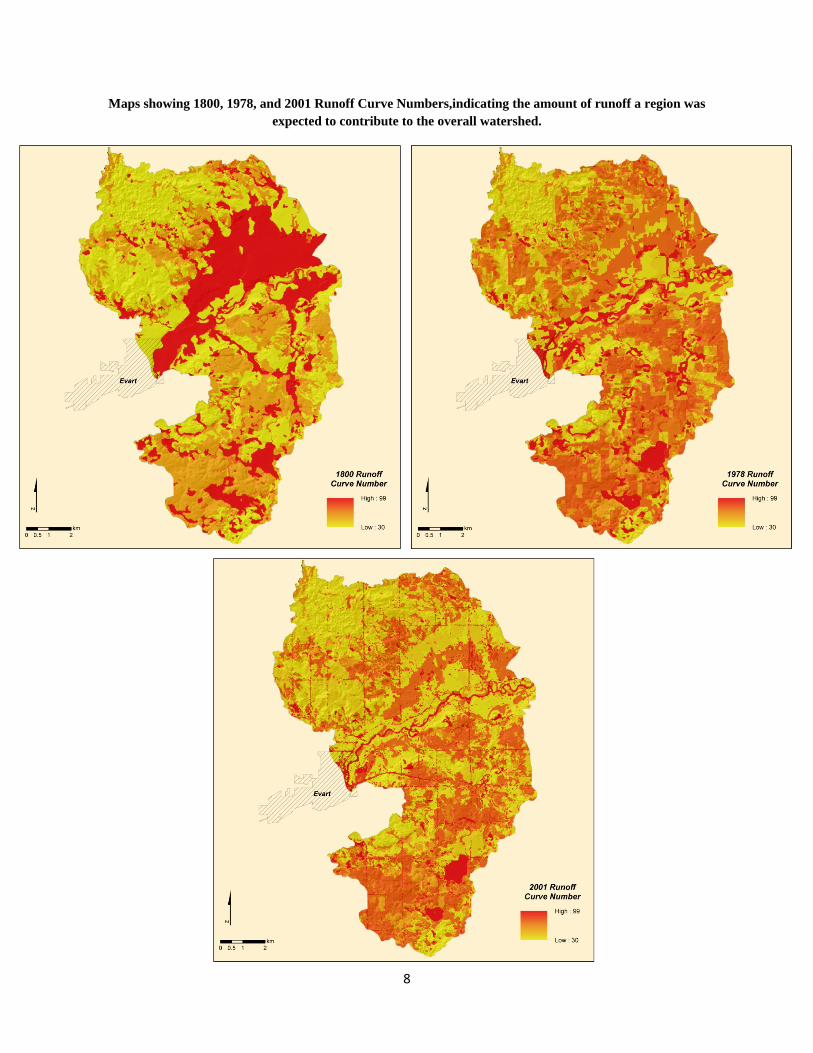
Maps showing 1800, 1978, and 2001 Runoff Curve Numbers,indicating the amount of runoff a region was expected to contribute to the overall watershed.
9
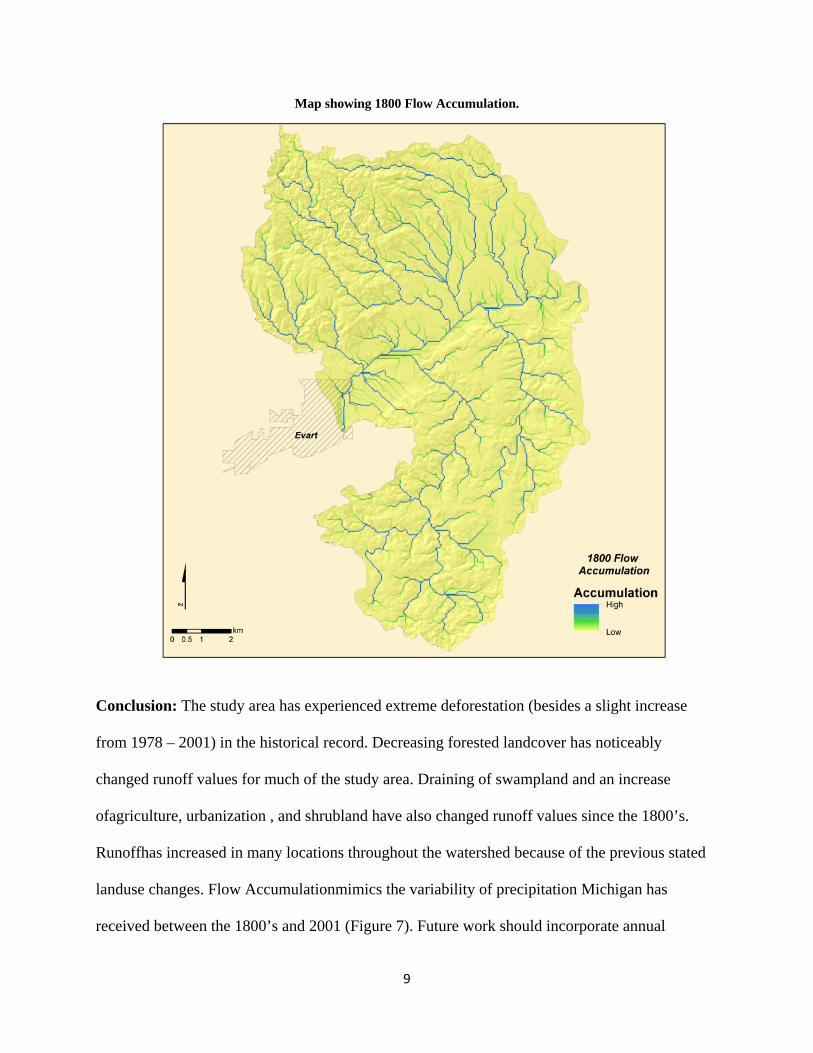
Map showing 1800 Flow Accumulation.
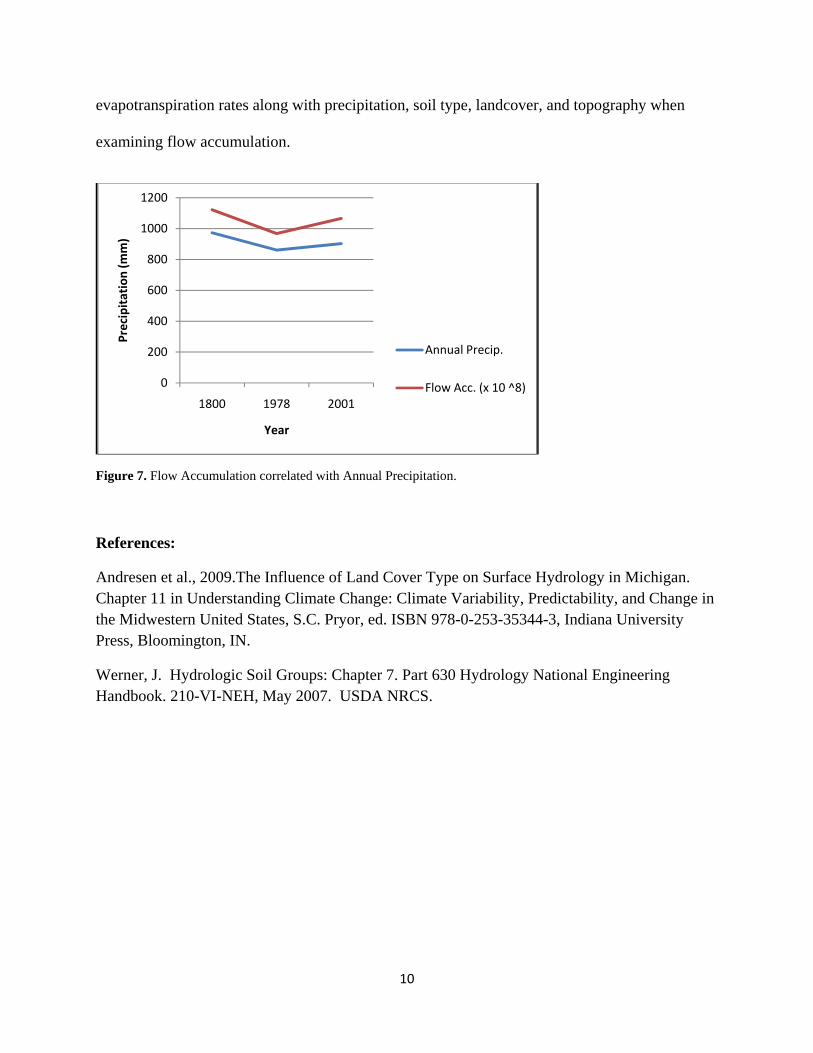
Conclusion: The study area has experienced extreme deforestation (besides a slight increase
from 1978 – 2001) in the historical record. Decreasing forested landcover has noticeably
changed runoff values for much of the study area. Draining of swampland and an increase
ofagriculture, urbanization , and shrubland have also changed runoff values since the 1800’s.
Runoffhas increased in many locations throughout the watershed because of the previous stated
landuse changes. Flow Accumulationmimics the variability of precipitation Michigan has
received between the 1800’s and 2001 (Figure 7). Future work should incorporate annual
10
evapotranspiration rates along with precipitation, soil type, landcover, and topography when
examining flow accumulation.
Figure 7. Flow Accumulation correlated with Annual Precipitation.
References:
Andresen et al., 2009.The Influence of Land Cover Type on Surface Hydrology in Michigan. Chapter 11 in Understanding Climate Change: Climate Variability, Predictability, and Change in the Midwestern United States, S.C. Pryor, ed. ISBN 978-0-253-35344-3, Indiana University Press, Bloomington, IN.
Werner, J. Hydrologic Soil Groups: Chapter 7. Part 630 Hydrology National Engineering Handbook. 210-VI-NEH, May 2007. USDA NRCS.
0
200
400
600
800
1000
1200
1800 1978 2001
Precipita
tion (m
m)
Year
Annual Precip.
Flow Acc. (x 10 ^8)