Embed Size (px)
Citation preview
52 TRANSPORTATION RESEARCH RECORD 1214
Estimating Practical Maximum Flight Hours for General Aviation Turboprop and Jet Aircraft
GERALDS. McDouGALL AND DONG W. CHo
A production relation linking total Oight hours to size of the general aviation fleet is used to derive a nonlinear model explaining average Oight hours per plane per year. The model includes parameters measuring the effect of relative operating costs and corporate profits, as well as a parameter measuring the maximum practical Oight hours from an aircraft. An estimate of maximum practical Oight hours is useful information for aircraft manufacturers in developing marketing strategies and for aircraft operators in making purchase decisions and in planning fleet expansion. Model parameters explaining average Oight hours for general aviation turboprop and jet aircraft are estimated over annual data from 1969 through 1985. As expected, relative operating costs are negatively related to average flight hours and corporate profits are positively related to average flight hours. Practical maximum flight hours are estimated to be approximately 1,055 hr per year for general aviation turboprop aircraft and approximately 900 hr per year for general aviation jet aircraft. These values are approximately twice the mean average hours Down and several hundred flight hours above the maximum average hours observed for these type of aircraft over the sample period. However, the estimated values are consistent with use observed among operators of general aviation turbine aircraft with sufficiently large facilities and staff to support intensive aircraft operations.
Knowledge about the practical maximum flight hours available from a general aviation turboprop or jet aircraft is important to both aircraft owners and aircraft manufacturers. A potential aircraft owner requires information about the practical constraints on aircraft use to evaluate the possible benefits of ownership. Businesses with one aircraft and corporate operators of 1nultiple aircraft, require information on maximum flight hours to plan fleet expansion and enhancement. Manufacturers also require accurate information on maximum flight hours to market their general aviation products properly and effectively.
This study presents statistically derived estimates of maximum flight hours for general aviation turboprop and jet aircraft based on calculated average flight hours per plane. Given the difficulties in deriving meaningful estimates for maximum flight hours, it is prudent to compare the study's methods and results with estimates derived using other methods. For example, this study's results might be compared with estimates
G. S. McDougall and D . W. Cho , Institute for Aviation Research , The Wichita State University, Wichita, Kans. 67208.
based on analysis of the engineering and design characteristics of general aviation aircraft.
Estimates derived using statistical methods applied to actual flight hours have the advantage of implicitly accounting for not only the engineering and design characteristics of an aircraft but also many, if not all, of the other nonengineering factors that influence or constrain aircraft operation. For example, an engineering analysis of maximum flight hours available from an aircraft may be completed under the assumption of ideal flight conditions, and ignoring flight delays associated with tower workloads and congested airports. Presumably, in an aggregated way, an estimate based on actual flight hours will reflect these kinds of nonengineering impediments that help determine the limits on aircraft operation. The estimates presented are best interpreted as statements about the practical limits on aircraft operation.
The conceptual framework, data, and empirical results for the statistical approach to estimating maximum flight hours are summarized below.
CONCEPTUAL FRAMEWORK
The foundation for this study is the production relation linking reported total flight hours to the size of the general aviation fleet:
TFH = ex MFH FLT (1)
Equation 1 simply states that total flight hours, TFH, is determined by the size of the aircraft fleet, FLT, the maximum flight hours avaiiable from a single aircraft, lv!FH, aml the average aircraft utilization rate, ex. For brevity, notation identifying different types of aircraft has not been included. If data were available it would be desirable to analyze this production relation using data disaggregated both by type of aircraft and use (e.g., general aviation turboprop aircraft in executive use) . Unfortunately, sufficiently long data series are not available to undertake such analysis. Therefore, the results presented below distinguish between turboprop and jet aircraft type only.
To simplify the right-hand side of the relation it is convenient to rearrange this expression in terms of average flight hours per plane, AFH. Dividing through Equation 1 by size of the fleet, FLT, yields:
TFHIFLT = AFH = a.MFR (2)
McDougall and Cho
Equation 2 includes, on the left-hand side, average flight hours, which is measurable . On the right-hand side is the production parameter MFH, which is unobservable, as well as the average utilization rate, ex, the value of which is determined by the aircraft utilization function. Ideally the utilization function would include factors related to substitute commecial air services (e.g. , variables measuring the amount of commuter air traffic or the number of scheduled commuter air flights). Unfortunately, sufficient data over these variables are not available. Nonetheless, a previous study (1) has shown that aircraft utilization is related to relative operating costs (ROP) of general aviation aircraft and corporate profits, PRFT. Therefore, it is reasonable to assume that the following logistic utilization function explains the average aircraft utilization rate:
ex = 1/(1 + exp(8 + f,3ROP + TPRFT)) (3)
where 8, (3 , and Tare unknown utilization parameters. Though values are unknown, (3 is expected to be positive and T negative as an increase in ROP should reduce ex while an increase in PRFT should increase ex. A logistic specification is selected for the utilization function because it imposes an S-shape on the relationship between the utilization rate and the various explanatory or independent variables.
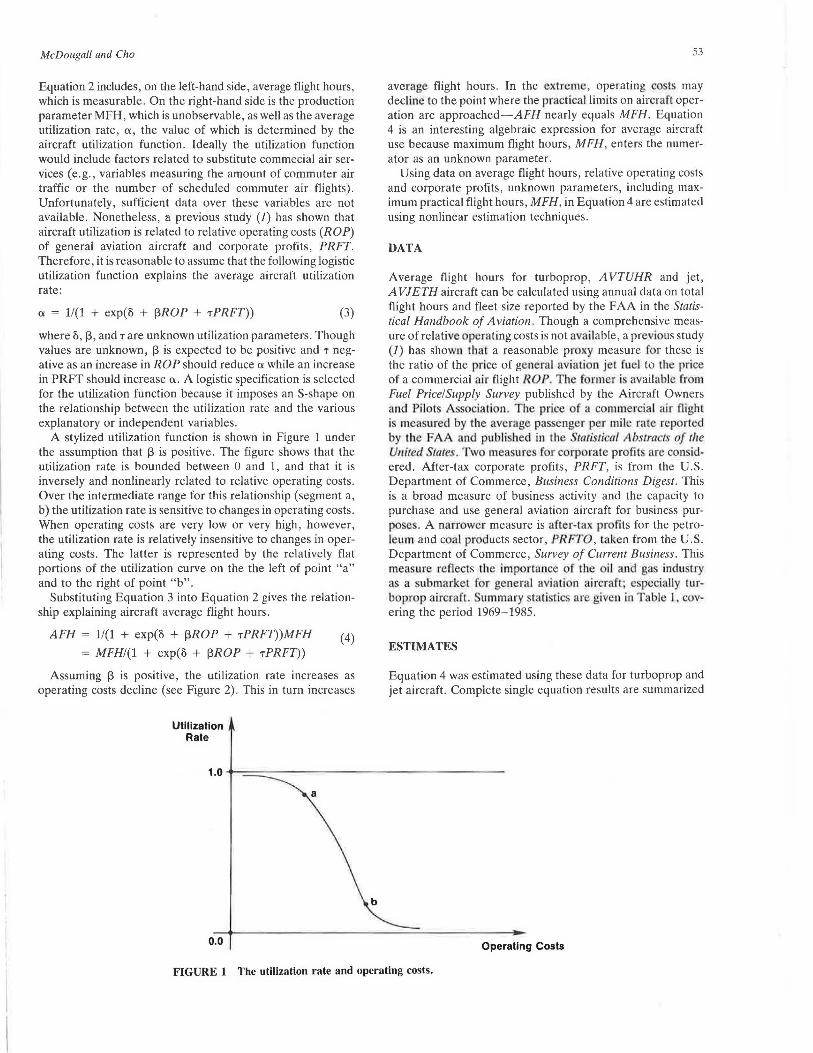
A stylized utilization function is shown in Figure 1 under the assumption that (3 is positive. The figure shows that the utilization rate is bounded between 0 and 1, and that it is inversely and nonlinearly related to relative operating costs. Over the intermediate range for this relationship (segment a, b) the utilization rate is sensitive to changes in operating costs. When operating costs are very low or very high , however, the utilization rate is relatively insensitive to changes in operating costs . The latter is represented by the relatively flat portions of the utilization curve on the the left of point "a" and to the right of point "b".
Substituting Equation 3 into Equation 2 gives the relationship explaining aircraft average flight hours .
AFH = 1/(1 + exp(B + (3ROP + TPRFT))MFH
= MFHl(l + exp(8 + (3ROP + -rPRFT)) (4)
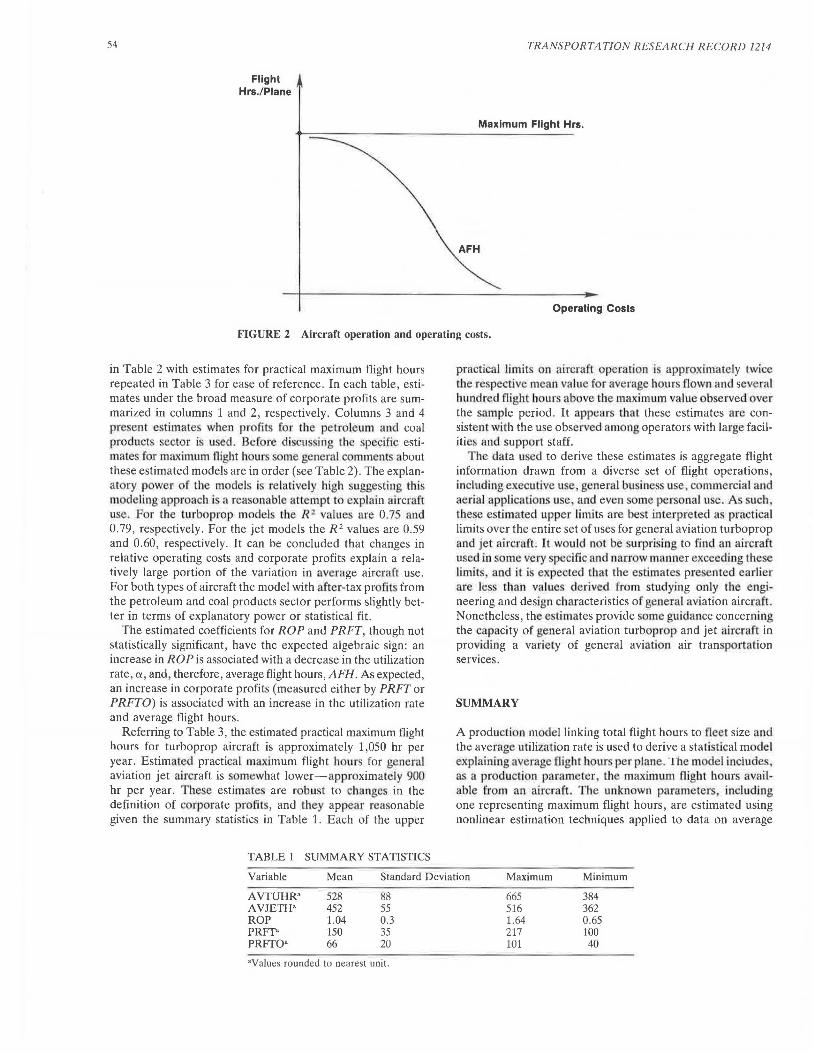
Assuming (3 is positive, the utilization rate increases as operating costs decline (see Figure 2). This in turn increases
Utilization Rate
0.0
53
average flight hours. In the extreme, operating co t · may decline lo the point where the practi.cal limits on aircraft operation are approached-AFR nearly equals MFH. Equation 4 is an interesting algebraic expression for average aircraft use because maximum flight hours , MFH, enters the numerator as an unknown parameter.
Using data on average flight hours, relative operating costs and corporate profits, unknown parameters, including maximum practical flight hours , MFH, in Equation 4 are estimated using nonlinear estimation techniques.
DATA
Average flight hours for turboprop , AVTUHR and jet , A VJ ETH aircraft can be calculated using annual data on total flight hours and fleet size reported by the FAA in the Statistical Handbook of Aviation. Though a comprehensive measure of relative operating costs is not available, a previous study (1) has shown that a reasonable p roxy measure for these is the ratio of the price of general aviation je t fuel to the price of a commercial air flight ROP. The former is availabl from Fuel Price/Supply Survey published by the Aircraft Owners and Pilots Association. The price of a commercial air flight i measured by the average pas enger per mile rate reported by the FAA and publi hed in the 111/istical Abstm ts of the United tates. Two mea ure for corporate profit are consid· ered. After-tax corporate profits, PRFT, is from the U .S. Department of Commerce, Business Conditions Digest. This is a broad measure of business activity and the capacity to purchase and use general aviation aircraft for business purp ' e . A narrower measure is after-tax profits for the petrol um and coal products sector, PRFIO, taken from the U.S. Department of Commerce, Survey of Current Business. This measure reflects the importance or the oil and ga industry as a submarkel for general aviatl n aircraft; especially turboprop aircraft. Summary tatistic a re given in Table 1, covering the period 1969-1985.
ESTIMATES
Equation 4 was estimated using these data for turboprop and jet aircraft. Complete single equation results are summarized
Operating Costs
FIGURE 1 The utilization rate and operating costs.
S4
Flight Hrs./Plane
TRANSPORTATION RESEARCH RECORD 1214
Maximum Flight Hrs.
AFH
Operating Costs
FIGURE 2 Aircraft operation and operating costs.
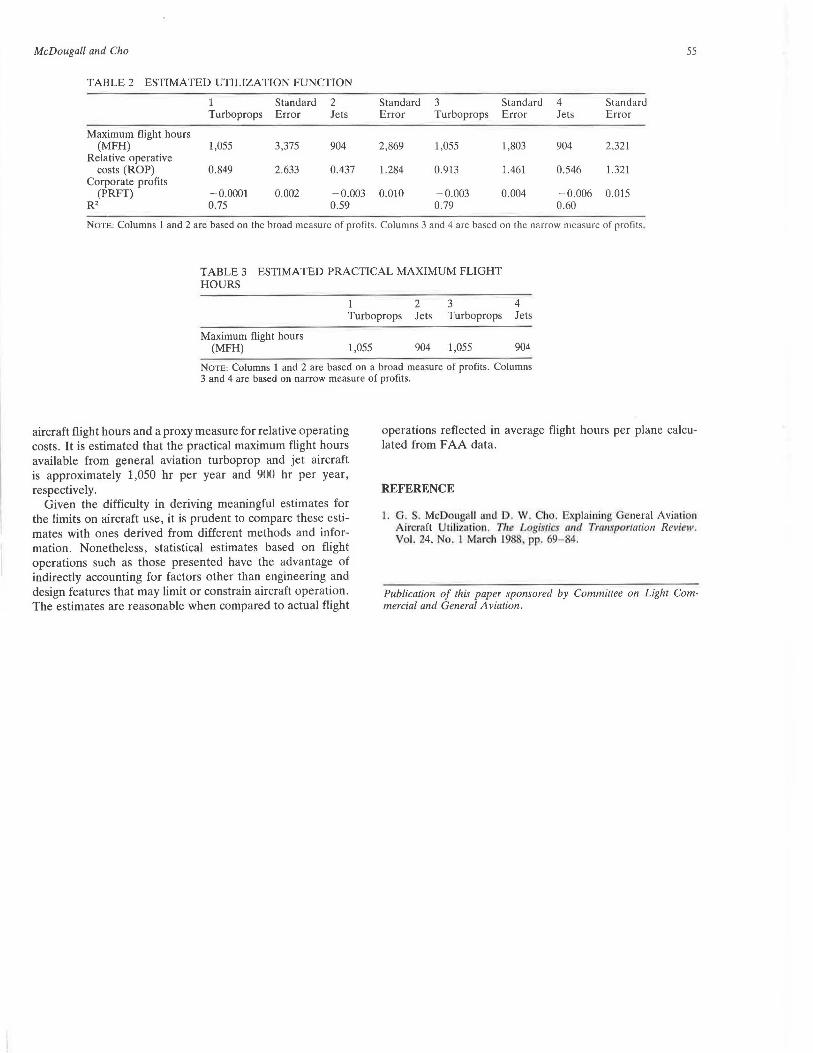
in Table 2 with estimates for practical maximum flight hours repeated in Table 3 for ease of reference. In each table, estimates under the broad measure of corporate profits are summarized in columns 1 and 2, respectively. Columns 3 and 4 present estimales when profits for the petroleum and coal products sector i used . Before di ·cu ing the specific estimates for maximum flight hou1 some general comment about these estimated models are in order (see Table 2). The explanatory power of the mod Is is relatively high suggesting this modeling approach i a reasonable attempt to explain aircraft use. For the turboprop model the R 2 value are 0.75 and 0. 79, respectively. For the jet models the R 2 values are 0.59 and 0.60, respectively. It can be concluded that changes in relative operating costs and corporate profits explain a relatively large portion of the variation in average aircraft use. For both types of aircraft the model with after-tax profit from the petroleum and coal products sector performs slightly better in terms of explanatory power or statistical fit.
The estimated coefficients for ROP and PRFT, though not statistically significant, have the expected algebraic sign: an increase in ROP is associated with a decrease in the utilization rate, o:, and, therefore, average flight hours, AFH. As expected, an increase in corporate profits (measured either by PRFT or PRFTO) is associated with an increase in the utilization rate and average flight hours.
Referring to Table 3, the estimated practical maximum flight homs for turboprop aircraft is approximately 1,050 hr per year. Estimated practical maximum flight hours for general aviation jet ai rcraft is somewhat lower-approximately 900 hr per year. These estimate are robust to change in the definition of corporate profits, and they appear reasonable given the summary statistics in Table 1. Each of the upper
TABLE 1 SUMMARY STATISTICS
practical limits on aircraft operation is approximately twice the re pective mean value for average hour flown and several hundred flight hour above the maximum value observed over the sample period. It appears that these estimates ar consistent with the use observed among operators with large facilities and suppmt staff.
he data used to derive these estimates is aggregate flight information drawn from a diverse set of flight operations, including executive u e , general busin ss use, commercial and aerial application use, and even some personal use. A uch , tbese estimated upper limits are best interpreted as practical limits over the entire set of uses for general aviation turboprop and jet aircraft. It would not be surprising to find an aircraft used in some very specific and narrow manner exceeding these limits, and it is expected that Lhe estimates presented earlier are Jes than values derived trom studying only lhe engineering and design characteristics of general aviation aircraft. Nonetheless, the estimates provide some guidance concerning the capacity of general aviation turboprop and jet aircraft in providing a variety of general aviation air tran portation services.
SUMMARY
A production model linking total flight hours to fleet size and the average utilization rate is used to derive a statistical model explaining average flight h ur per plane. The model inciudes, a a production parameter, the maximum flight hours avai lable from an aircraft. The unknown parameter , including one representing maximum flight hours, are estimated using nonlinear estimation techniques applied to data on average
Variable Mean Standard Deviation Maximum Minimum
AVTUHR• S28 88 66S 384 AVJETH• 4S2 SS S16 362 ROP 1.04 0.3 1.64 0.6S PRFP lSO 3S 217 100 PRFfO• 66 20 101 40
'Values rounded to nearest unit.
McDougall and Cho 55
TABLE 2 ESTIMATED UTILIZATION FUNCTION
Standard 2 Standard 3 Standard 4 Standard Turboprops Error Jets Error Turboprops Error Jets Error
Maximum flight hours (MFH) 1,055 3,375 904 2,869 1,055 1,803 904 2,321
Relative operative costs (ROP) 0.849 2.633 0.437 1.284 0.913 1.461 0.546 1.321
Corporate profits (PRFT) -0.0001 0.002 -0.003 0.010 -0.003 0.004 - 0.006 O.o!5
Ri 0.75 0.59 0.79 0.60
NOTE: Columns 1 and 2 are based on the broad measure of profits. Columns 3 and 4 are based on the narrow measure of profits.
TABLE 3 ESTIMATED PRACTICAL MAXIMUM FLIGHT HOURS
2 3 4 Turboprops Jets Turboprops Jets
Maximum flight hours (MFH) 1,055 904 1,055 904
NOTE: Columns 1 and 2 are based on a broad measure of profits . Columns 3 and 4 are based on narrow measure of profits.
aircraft flight hours and a proxy measure for relative operating costs. It is estimated that the practical maximum flight hours available from general aviation turboprop and jet aircraft is approximately 1,050 hr per year and 900 hr per year, respectively.
Given the difficulty in deriving meaningful estimates for the limits on aircraft use, it is prudent to compare these estimates with ones derived from different methods and information. Nonetheless, statistical estimates based on flight operations such as those presented have the advantage of indirectly accounting for factors other than engineering and design features that may limit or constrain aircraft operation. The estimates are reasonable when compared to actual flight
operations reflected in average flight hours per plane calculated from FAA data .
REFERENCE
I. G. . McDougall and D. W. Cho. Explaining General Aviation Aircraft Utiliza tion . The Logistics mu/ Transportation Review. Vol. 24, No. I March 1988. pp. 69-84.
Publication of this paper sponsored by Commitlee on Light Com· mercial and General Aviation.


![[Definition of the study's scope] - United Nations Treaty Collection](https://img.pdfslide.us/doc/110x75/62064f318c2f7b1730067f09/definition-of-the-studys-scope-united-nations-treaty-collection.jpg)