Embed Size (px)
Citation preview
Transportation Research Part A 45 (2011) 148–160
Contents lists available at ScienceDirect
Transportation Research Part A
journal homepage: www.elsevier .com/locate / t ra
Estimating multimodal transit ridership with a varying fare structure
Konstantina Gkritza a,⇑, Matthew G. Karlaftis b, Fred L. Mannering c
a Department of Civil, Construction & Environmental Engineering, 404 Town Engineering Building, Iowa State University, Ames, IA 50011-3232, United Statesb School of Civil Engineering, National Technical University of Athens, 5 Iroon Polytechniou Str., Zografou Campus, Athens 15773, Greecec Charles Pankow Professor of Civil Engineering, School of Civil Engineering, 550 Stadium Mall Drive, Purdue University, West Lafayette,IN 47907-2051, United States
a r t i c l e i n f o
Article history:Received 29 May 2010Received in revised form 1 December 2010Accepted 10 December 2010
Keywords:Transit demandMultimodal transit systemsFare structureTime-seriesHigh-order serial correlationGreece
0965-8564/$ - see front matter � 2010 Elsevier Ltddoi:10.1016/j.tra.2010.12.005
⇑ Corresponding author.E-mail addresses: [email protected] (K. Gkritza)
1 The ‘social nature’ of public transportation is a f(2003) for an extensive discussion on this topic); the finatural monopoly producing socially beneficial servicKarlaftis and McCarthy, 1999). The second is the ‘Anglwhich implies that market forces are preferred over
a b s t r a c t
This paper studies public transport demand by estimating a system of equations for mul-timodal transit systems where different modes may act competitively or cooperatively.Using data from Athens, Greece, we explicitly correct for higher-order serial correlationin the error terms and investigate two, largely overlooked, questions in the transit litera-ture; first, whether a varying fare structure in a multimodal transit system affects demandand, second, what the determinants of ticket versus travelcard sales may be. Model estima-tion results suggest that the effect of fare type on ridership levels in a multimodal systemvaries by mode and by relative ticket to travelcard prices. Further, regardless of competi-tion or cooperation between modes, fare increases will have limited effects on ridership,but the magnitude of these effects does depend on the relative ticket to travelcard prices.Finally, incorrectly assuming serial independence for the error terms during model estima-tion could yield upward or downward biased parameters and hence result in incorrectinferences and policy recommendations.
� 2010 Elsevier Ltd. All rights reserved.
1. Introduction
Forecasting the demand for public transport as well as determining the exogenous factors that influence the evolution ofthis demand may be one of the most important steps in transportation planning and operations. Public transport is widelyrecognized as a social service and a powerful instrument in urban policy and the shaping of urban form.1 Research largelysupports the notion that the relationships between transit, land use and urban form are interrelated and suggests that publicpolicies can influence the scale, scope and pace of these relationships. It is expected, for example, that public transit can play animportant role in preserving and revitalizing cities, satisfying the transport needs of the less privileged and creating a betterurban environment.
However, because of the nature of the services provided by transit systems and the affinity of Western cultures towardsthe automobile, ridership and transit revenues have shown, with a few exceptions, a tendency toward a general downwardtrend over time. Decreased revenues and fiscal pressures have led transit systems to seek avenues for better management ofresources and capital investment decisions. Improved demand-estimation models whose results directly affect systeminvestments, pricing policies and fleet deployment have been among the avenues considered. To this end, considerable
. All rights reserved.
, [email protected] (M.G. Karlaftis), [email protected] (F.L. Mannering).airly hotly debated issue. On the ideological side, there are two major ‘schools of thought’ (see Macáriorst is the ‘continental’ which considers public transportation as a ‘public good’ that should be viewed as ae and thus should be financed by the public sector regardless of economic performance (Hensher, 1987;o-Saxon’ which considers public transportation as part of the service sector where efficiency is important,governmental intervention and where private participation is dominant.
K. Gkritza et al. / Transportation Research Part A 45 (2011) 148–160 149
research has been conducted in the areas of transit-demand estimation with particular emphasis on the effect of fare levelsand fare systems on ridership and the effect of a variety of external factors such as fuel price, unemployment and so on.
The effects of different factors on ridership have been the focus of a number of papers. For example, the combined effectsof a variety of factors on ridership is discussed in Crotte et al. (2008) and Paulley et al. (2006), the explicit effects of fuel pricefluctuations have been studied by Currie and Phung (2008), and issues related to service changes and the effects of the intro-duction of new modes have been addressed in Akin (2006), Koppelman (1983), Mackett and Edwards (1998) and Peng et al.(1997). Additional investigations such as the effects of weather, urban characteristics and density and the relative attractionof bus versus rail have been studied by Ben-Akiva and Morikawa (2002), Guo et al. (2007), Graham et al. (2009), Su (2010),Taylor and Miller (2003), and Vande Walle and Steenberghen (2006). Fare elasticities and the effects of price changes on de-mand have attracted significant attention in the literature as well, and extensive reviews—with different temporal and spa-tial considerations—have been undertaken by a number of authors including Cervero (1990), Dargay and Hanly (1999, 2002),de Rus (1990), Goodwin (1992), Hanly and Dargay (1999), Hensher (1998, 2008), Litman (2004), Oum et al. (1992), Preston(1998), and Paulley et al. (2006). The economic and elasticity characteristics of different payment types, with an emphasis ontravel passes, has been studied by Carbajo (1988), Fitzroy and Smith (1999) and White (1981). Interestingly, the elasticityestimates were found to vary considerably between these studies, indicating that system-specific effects and travel distancesmay be very important determinants. More recent work by Garcia-Ferrer et al. (2006) offered interesting insight into de-mand and fare interactions in multimodal transit systems by investigating urban bus and rail and suburban bus and railcharacteristics in Madrid, Spain. We note that despite the intense practical interest and potential insights that can be gainedby investigating multimodal transit systems, the difficulty in obtaining the necessary data and undertaking the complexanalyses required have resulted in relatively few studies of this type (Garcia-Ferrer et al., 2006; Tsamboulas and Antoniou,2006).
The data used in this paper offer a unique opportunity for extending the work of Garcia-Ferrer et al. (2006) and investi-gating the factors that affect public transit ridership in a multimodal context where different modes may act competitively orcooperatively and where they share externally imposed common pricing policies and strategies. To this end, we address theproblem of transit demand and explicitly recognize important operational issues such as the multimodal context of opera-tions and the complexity of the effects of fare structures and policies on ridership. In doing so, the problem is examined fromthree important operational perspectives; first, we investigate the factors that affect transit ridership by mode in a multi-modal operating environment, gaining direct insight into both the factors and the degree to which they affect ridership. Sec-ond, we estimate ridership through the choice of payment type (ticket or travelcard) thus gaining insight into the factorsaffecting ticket and travelcard sales which is an important determinant of transit-system finances that can provide usefulinsights for transit managers. Third, we estimate demand models by mode and fare type, combining insights and investigat-ing differences from the previous two perspectives, and demonstrating the complexity of setting fares (both ticket and trav-elcard prices) in a multimodal context and the degree of which these factors interact. It should be noted that, in all modelsystems estimated, we explicitly account for higher-order serial correlation, which may otherwise influence the results andlead to inappropriate policy recommendations.
2. Empirical setting
Athens covers an area of 60 km2 and has a population of approximately 3.7 million people. During the last decade thepopulation increased by about 10%, car ownership has increased considerably, and the mobility index (a congestion relatedindex that shows the percentage of time the level of service measured by the volume/capacity ratio does not reach conges-tion levels) has decreased by 7%. The modal split in Athens has changed in favor of automobile travel, which now accountsfor about 55% of daily trips. Correspondingly, public transport’s share fell from about 45% in 1983 to 32% in 2004. All told,there has been a 26% increase in travel time in the last 12 years, which clearly reflects the deterioration in traffic conditionscaused by increasing highway demand and a capacity-constrained highway network.
On the transit side, the greater Athens urban area is served by three modes of public transportation: a bus network withover 2900 (diesel and compressed natural gas, CNG) vehicles, over 350 trolley buses and a rather extensive metro (under-ground) system. Despite a clear administrative connection (all three modes are subsidiaries of a single planning authority),they are allowed to make individual decisions regarding operational issues such as network and routes served, hours of oper-ation and so on.2 The bus system is made up of 41 trunk lines, 116 central lines, 9 inter-municipal lines, 98 local-feeder lines, 8express lines, and 6 school lines, with a total annual ridership of over 450 million passengers. For the trolley bus network, with26 lines, the annual ridership is 90 million passengers while for the metro system, which serves a network of 44 km throughthree separate lines, annual ridership exceeds 100 million passengers. More than 2.5 million passengers use the integrated ser-vices provided throughout the city on working days. In the multimodal context described and for a large city such as Athens,
2 Buses (including diesel, CNG and trolley vehicles) potentially could be considered jointly as a single mode. However, in the case of Athens, diesel and CNGbuses are a separate operations company (www.ethel.gr) than trolley buses (www.athens-trolley.gr). Although this administrative separation could be ignoredin a demand model context, there are three important characteristics that require that the companies be separately considered. First, each of these twocompanies has (to some extent) the freedom to set fares and pricing policies. Second, they share many similar routes (overlapping) and do not cooperate inmany cases. And third, each of the two modes serves population segments with socioeconomic differences (because of stop location and some differences indowntown service).
150 K. Gkritza et al. / Transportation Research Part A 45 (2011) 148–160
different modes of transit cooperate in some cases (some bus lines are specifically designed to serve metro stations), but com-petitively in others (some bus lines run in parallel to metro lines, while buses and trolley buses frequently compete in the samecatchment area as described in Footnote 2). Despite this, it is still necessary to estimate aggregate demand models for the com-panies because the findings are potentially critical to operations decisions, capital investment policies, and other financialdecisions.
3. Data
Three important operational questions are investigated in this paper using monthly data from January 1995 to December2006 (a total of 144 observations), for the multimodal transit system in Athens, Greece. The variables collected for this studyare grouped as public transport, macroeconomic and demographic variables. Public transport data were obtained from theAthens’ urban planning agency (http://www.oasa.gr). The macroeconomic and demographic data were obtained from vari-ous sources including the National Statistical Service of Greece (unemployment rate, number of immigrants), the Greek Min-istry of Transportation (automobile ownership, motorcycle ownership, fuel price index) and the Bank of Greece (consumerprice index, income per capita, gross domestic product per capita). Table 1 shows the mean and the standard deviation forthe transportation, macroeconomic and demographic variables.
On aggregate at a monthly level, public transport demand equals ticket and travelcard sales.3 Fare levels were taken intoaccount through ticket prices and travelcard prices. It should be noted that the fare structure involves a flat fare for using busesand trolley buses and a zonal fare for using the metro. Students and military personnel are eligible to pay half the ticket price(reduced ticket price). In addition, two different types of travelcards are available: one that allows travel on both the bus and thetrolley bus systems and another that allows travel on all three modes of public transport (both types of travelcards are issuedmonthly). It is important to note here that travel cards and tickets are treated differently because there is no common pricingpolicy for both payment forms in the sense that increases in one form are not matched by increases in the other (at least not atthe same rate). To this end, there are frequent ‘switches’ for individuals between using single tickets or purchasing (monthly)travel cards, depending on both the prices of the two forms and the number of trips the individual makes with the travel card.Travel cards are, by-and-large, set to approximately 40 monthly trips; single bus tickets are €0.5 (per ticket; €0.7 for metro),while travel cards are €20 (for an unlimited number of monthly trips and €28 for the metro). Whenever fare changes aredecided, increases are rarely the same for both payment forms. In a recent change, the planning agency increased single fareprices by 20%, while keeping travel cards constant to encourage individuals to chose travel cards.4
Automobile and motorcycle ownership is measured as the number of vehicles and motorcycles registered in the greaterAthens region. Fuel costs are taken into account through the fuel price index (base year 1997). Finally, the consumer priceindex reflects the trends in consumer prices and inflation in Greece (base year 2005) and is used to deflate fare prices.
4. Methodology
In this paper, in addition to the transit operational questions addressed, we extend previous work (Gkritza et al., 2004) byexplicitly accounting for higher-order auto-regressive disturbances in the systems of equations developed. Seemingly unre-lated regression equation (SURE) models are estimated to capture the contemporaneous correlation among the three differ-ent transit modes (bus, trolley bus, metro) and among the different fare types (ticket and travelcard) under the assumption offirst-order as well as higher-order vector auto-regressive process for the error term, a methodological development not pre-viously employed in the transit literature. This type of model was considered appropriate for this case because ridership val-ues by mode and fare type are highly correlated (the correlation coefficients’ absolute values range from 0.684 to 0.966).Moreover, the factors that affect ridership are common among the different modes (another reason for selecting the SUREmethodology). The methodology and associated estimation results are provided under three different assumptions for serialdependence of the errors: (i) serial independent disturbances, (ii) first-order scalar auto-regressive disturbances; (iii) higher-order scalar auto-regressive disturbances.
Consider a set of M seemingly unrelated equations, each with pi independent variables and T observations, with the ithequation given by (Zellner, 1962):
3 Tra4 In t
survey
yi ¼ Xi � bi þ ei; i ¼ 1; . . . ;M ð1Þ
where yi is a T � 1 vector of observed values on the ith dependent variable, Xi is a T � pi matrix with rank pi of observations onpi independent variables, bi is a pi � 1 vector of unknown regression parameters, and ei is a T � 1 vector of error terms. It isassumed that e ¼ e1; e2; . . . ; eM has a multivariate normal density with mean E(e) = 0 and covariance Eðee0Þ ¼
P�IT ¼ V ,
whereP¼ rij is a positive symmetric matrix and IT is a T � T identity matrix and � is the Kronecker product. The generic
equation can be written, similar to a linear regression model, as:
Y ¼ Xbþ e ð2Þ
velcard sales are adjusted for demand using a corrective factor that equals travelcard use.he forthcoming analysis we have not used the 40 trips per card administrative ‘rule’ but rather ‘actual’ estimates of trips per card (from an extensiveundertaken by the Athens’ urban planning agency, this value is 72 trips per card for buses, 78 for trolley buses and 82 for the metro).
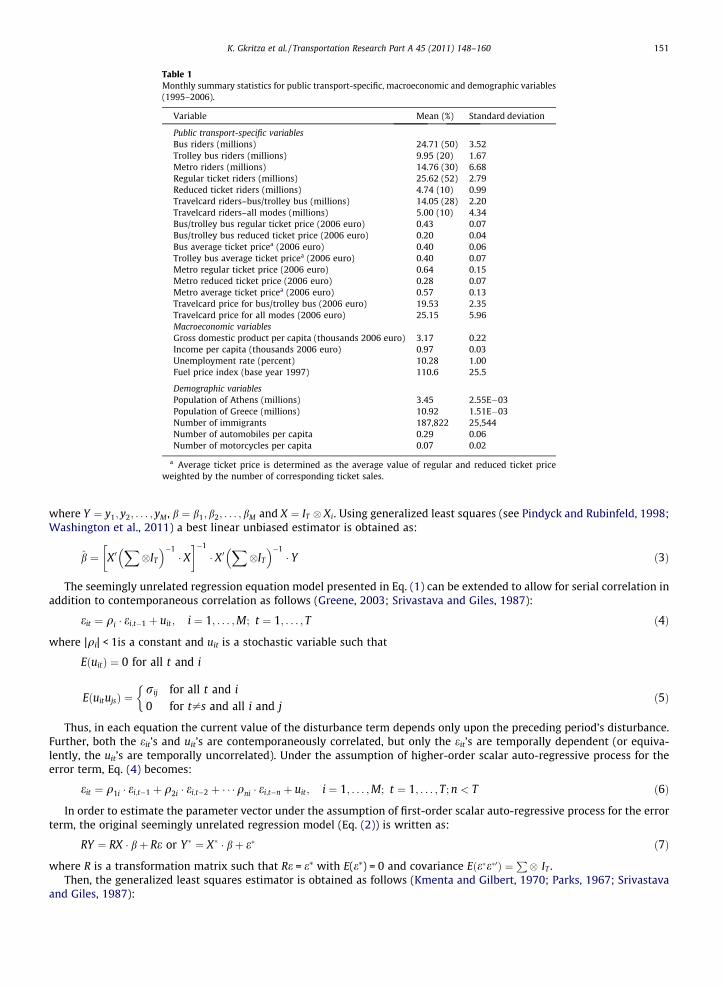
Table 1Monthly summary statistics for public transport-specific, macroeconomic and demographic variables(1995–2006).
Variable Mean (%) Standard deviation
Public transport-specific variablesBus riders (millions) 24.71 (50) 3.52Trolley bus riders (millions) 9.95 (20) 1.67Metro riders (millions) 14.76 (30) 6.68Regular ticket riders (millions) 25.62 (52) 2.79Reduced ticket riders (millions) 4.74 (10) 0.99Travelcard riders–bus/trolley bus (millions) 14.05 (28) 2.20Travelcard riders–all modes (millions) 5.00 (10) 4.34Bus/trolley bus regular ticket price (2006 euro) 0.43 0.07Bus/trolley bus reduced ticket price (2006 euro) 0.20 0.04Bus average ticket pricea (2006 euro) 0.40 0.06Trolley bus average ticket pricea (2006 euro) 0.40 0.07Metro regular ticket price (2006 euro) 0.64 0.15Metro reduced ticket price (2006 euro) 0.28 0.07Metro average ticket pricea (2006 euro) 0.57 0.13Travelcard price for bus/trolley bus (2006 euro) 19.53 2.35Travelcard price for all modes (2006 euro) 25.15 5.96Macroeconomic variablesGross domestic product per capita (thousands 2006 euro) 3.17 0.22Income per capita (thousands 2006 euro) 0.97 0.03Unemployment rate (percent) 10.28 1.00Fuel price index (base year 1997) 110.6 25.5
Demographic variablesPopulation of Athens (millions) 3.45 2.55E�03Population of Greece (millions) 10.92 1.51E�03Number of immigrants 187,822 25,544Number of automobiles per capita 0.29 0.06Number of motorcycles per capita 0.07 0.02
a Average ticket price is determined as the average value of regular and reduced ticket priceweighted by the number of corresponding ticket sales.
K. Gkritza et al. / Transportation Research Part A 45 (2011) 148–160 151
where Y ¼ y1; y2; . . . ; yM , b ¼ b1; b2; . . . ; bM and X ¼ IT � Xi. Using generalized least squares (see Pindyck and Rubinfeld, 1998;Washington et al., 2011) a best linear unbiased estimator is obtained as:
b̂ ¼ X 0X�IT
� ��1� X
� ��1
� X0X�IT
� ��1� Y ð3Þ
The seemingly unrelated regression equation model presented in Eq. (1) can be extended to allow for serial correlation inaddition to contemporaneous correlation as follows (Greene, 2003; Srivastava and Giles, 1987):
eit ¼ qi � ei;t�1 þ uit ; i ¼ 1; . . . ;M; t ¼ 1; . . . ; T ð4Þ
where |qi| < 1is a constant and uit is a stochastic variable such that
EðuitÞ ¼ 0 for all t and i
EðuitujsÞ ¼rij for all t and i
0 for t–s and all i and j
�ð5Þ
Thus, in each equation the current value of the disturbance term depends only upon the preceding period’s disturbance.Further, both the eit’s and uit’s are contemporaneously correlated, but only the eit’s are temporally dependent (or equiva-lently, the uit’s are temporally uncorrelated). Under the assumption of higher-order scalar auto-regressive process for theerror term, Eq. (4) becomes:
eit ¼ q1i � ei;t�1 þ q2i � ei;t�2 þ � � �qni � ei;t�n þ uit; i ¼ 1; . . . ;M; t ¼ 1; . . . ; T; n < T ð6Þ
In order to estimate the parameter vector under the assumption of first-order scalar auto-regressive process for the errorterm, the original seemingly unrelated regression model (Eq. (2)) is written as:
RY ¼ RX � bþ Re or Y� ¼ X� � bþ e� ð7Þ
where R is a transformation matrix such that Re = e⁄ with E(e⁄) = 0 and covariance Eðe�e�0Þ ¼P� IT .
Then, the generalized least squares estimator is obtained as follows (Kmenta and Gilbert, 1970; Parks, 1967; Srivastavaand Giles, 1987):
5 Whthat wethe tab
152 K. Gkritza et al. / Transportation Research Part A 45 (2011) 148–160
b̂ ¼ X 0R0X�IT
� ��1� RX
� ��1
� X0R0X�IT
� ��1� RY ð8Þ
Knowledge of the auto-regressive parameters qi is typically required in order to estimate Eq. (8). As in practice theseparameters are generally unknown, consistent estimators of qi should be obtained (for a list of such estimators, see Srivast-ava and Giles (1987)). In this paper, we use the maximum likelihood estimator of qi obtained by Beach and MacKinnon(1978a,b).
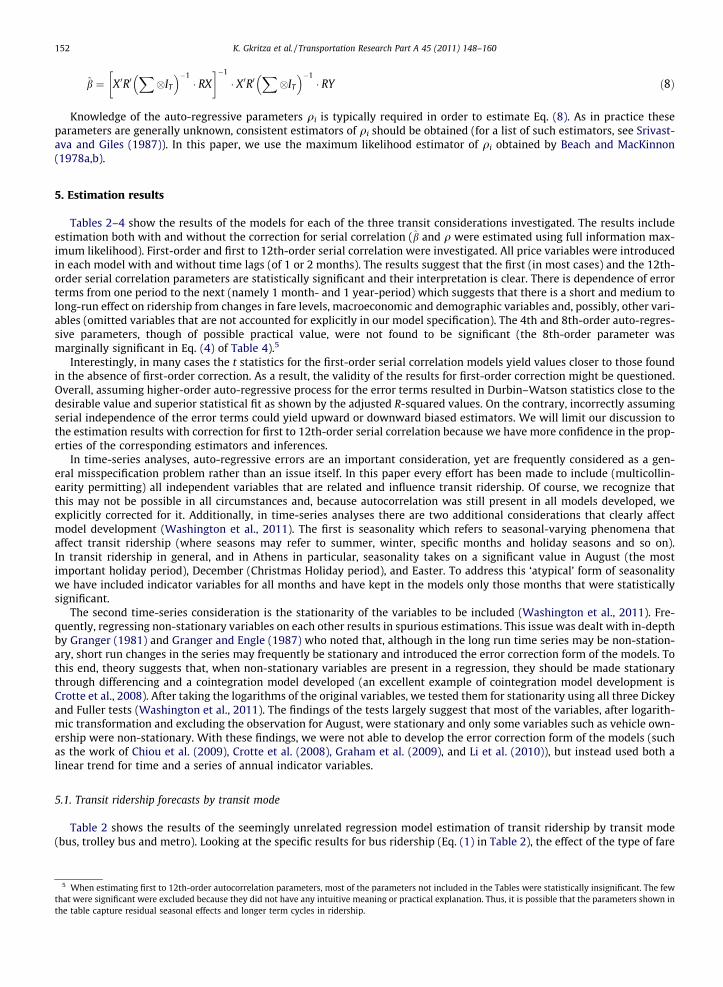
5. Estimation results
Tables 2–4 show the results of the models for each of the three transit considerations investigated. The results includeestimation both with and without the correction for serial correlation (b̂ and q were estimated using full information max-imum likelihood). First-order and first to 12th-order serial correlation were investigated. All price variables were introducedin each model with and without time lags (of 1 or 2 months). The results suggest that the first (in most cases) and the 12th-order serial correlation parameters are statistically significant and their interpretation is clear. There is dependence of errorterms from one period to the next (namely 1 month- and 1 year-period) which suggests that there is a short and medium tolong-run effect on ridership from changes in fare levels, macroeconomic and demographic variables and, possibly, other vari-ables (omitted variables that are not accounted for explicitly in our model specification). The 4th and 8th-order auto-regres-sive parameters, though of possible practical value, were not found to be significant (the 8th-order parameter wasmarginally significant in Eq. (4) of Table 4).5
Interestingly, in many cases the t statistics for the first-order serial correlation models yield values closer to those foundin the absence of first-order correction. As a result, the validity of the results for first-order correction might be questioned.Overall, assuming higher-order auto-regressive process for the error terms resulted in Durbin–Watson statistics close to thedesirable value and superior statistical fit as shown by the adjusted R-squared values. On the contrary, incorrectly assumingserial independence of the error terms could yield upward or downward biased estimators. We will limit our discussion tothe estimation results with correction for first to 12th-order serial correlation because we have more confidence in the prop-erties of the corresponding estimators and inferences.
In time-series analyses, auto-regressive errors are an important consideration, yet are frequently considered as a gen-eral misspecification problem rather than an issue itself. In this paper every effort has been made to include (multicollin-earity permitting) all independent variables that are related and influence transit ridership. Of course, we recognize thatthis may not be possible in all circumstances and, because autocorrelation was still present in all models developed, weexplicitly corrected for it. Additionally, in time-series analyses there are two additional considerations that clearly affectmodel development (Washington et al., 2011). The first is seasonality which refers to seasonal-varying phenomena thataffect transit ridership (where seasons may refer to summer, winter, specific months and holiday seasons and so on).In transit ridership in general, and in Athens in particular, seasonality takes on a significant value in August (the mostimportant holiday period), December (Christmas Holiday period), and Easter. To address this ‘atypical’ form of seasonalitywe have included indicator variables for all months and have kept in the models only those months that were statisticallysignificant.
The second time-series consideration is the stationarity of the variables to be included (Washington et al., 2011). Fre-quently, regressing non-stationary variables on each other results in spurious estimations. This issue was dealt with in-depthby Granger (1981) and Granger and Engle (1987) who noted that, although in the long run time series may be non-station-ary, short run changes in the series may frequently be stationary and introduced the error correction form of the models. Tothis end, theory suggests that, when non-stationary variables are present in a regression, they should be made stationarythrough differencing and a cointegration model developed (an excellent example of cointegration model development isCrotte et al., 2008). After taking the logarithms of the original variables, we tested them for stationarity using all three Dickeyand Fuller tests (Washington et al., 2011). The findings of the tests largely suggest that most of the variables, after logarith-mic transformation and excluding the observation for August, were stationary and only some variables such as vehicle own-ership were non-stationary. With these findings, we were not able to develop the error correction form of the models (suchas the work of Chiou et al. (2009), Crotte et al. (2008), Graham et al. (2009), and Li et al. (2010)), but instead used both alinear trend for time and a series of annual indicator variables.
5.1. Transit ridership forecasts by transit mode
Table 2 shows the results of the seemingly unrelated regression model estimation of transit ridership by transit mode(bus, trolley bus and metro). Looking at the specific results for bus ridership (Eq. (1) in Table 2), the effect of the type of fare
en estimating first to 12th-order autocorrelation parameters, most of the parameters not included in the Tables were statistically insignificant. The fewre significant were excluded because they did not have any intuitive meaning or practical explanation. Thus, it is possible that the parameters shown inle capture residual seasonal effects and longer term cycles in ridership.
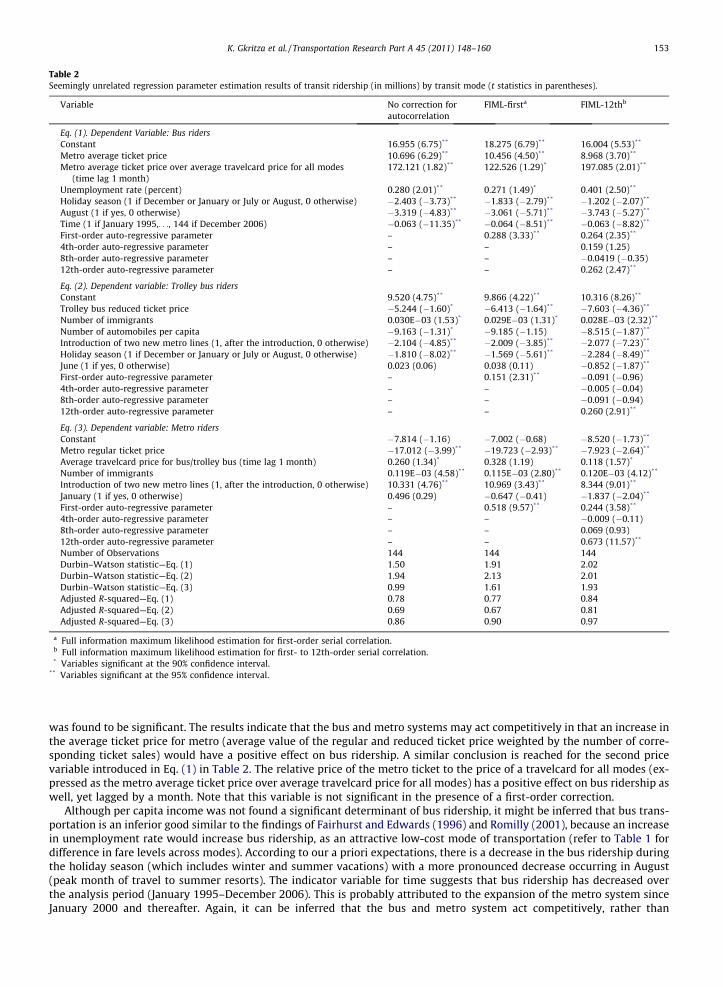
Table 2Seemingly unrelated regression parameter estimation results of transit ridership (in millions) by transit mode (t statistics in parentheses).
Variable No correction forautocorrelation
FIML-firsta FIML-12thb
Eq. (1). Dependent Variable: Bus ridersConstant 16.955 (6.75)** 18.275 (6.79)** 16.004 (5.53)**
Metro average ticket price 10.696 (6.29)** 10.456 (4.50)** 8.968 (3.70)**
Metro average ticket price over average travelcard price for all modes(time lag 1 month)
172.121 (1.82)** 122.526 (1.29)* 197.085 (2.01)**
Unemployment rate (percent) 0.280 (2.01)** 0.271 (1.49)* 0.401 (2.50)**
Holiday season (1 if December or January or July or August, 0 otherwise) �2.403 (�3.73)** �1.833 (�2.79)** �1.202 (�2.07)**
August (1 if yes, 0 otherwise) �3.319 (�4.83)** �3.061 (�5.71)** �3.743 (�5.27)**
Time (1 if January 1995,. . ., 144 if December 2006) �0.063 (�11.35)** �0.064 (�8.51)** �0.063 (�8.82)**
First-order auto-regressive parameter – 0.288 (3.33)** 0.264 (2.35)**
4th-order auto-regressive parameter – – 0.159 (1.25)8th-order auto-regressive parameter – – �0.0419 (�0.35)12th-order auto-regressive parameter – – 0.262 (2.47)**
Eq. (2). Dependent variable: Trolley bus ridersConstant 9.520 (4.75)** 9.866 (4.22)** 10.316 (8.26)**
Trolley bus reduced ticket price �5.244 (�1.60)* �6.413 (�1.64)** �7.603 (�4.36)**
Number of immigrants 0.030E�03 (1.53)* 0.029E�03 (1.31)* 0.028E�03 (2.32)**
Number of automobiles per capita �9.163 (�1.31)* �9.185 (�1.15) �8.515 (�1.87)**
Introduction of two new metro lines (1, after the introduction, 0 otherwise) �2.104 (�4.85)** �2.009 (�3.85)** �2.077 (�7.23)**
Holiday season (1 if December or January or July or August, 0 otherwise) �1.810 (�8.02)** �1.569 (�5.61)** �2.284 (�8.49)**
June (1 if yes, 0 otherwise) 0.023 (0.06) 0.038 (0.11) �0.852 (�1.87)**
First-order auto-regressive parameter – 0.151 (2.31)** �0.091 (�0.96)4th-order auto-regressive parameter – – �0.005 (�0.04)8th-order auto-regressive parameter – – �0.091 (�0.94)12th-order auto-regressive parameter – – 0.260 (2.91)**
Eq. (3). Dependent variable: Metro ridersConstant �7.814 (�1.16) �7.002 (�0.68) �8.520 (�1.73)**
Metro regular ticket price �17.012 (�3.99)** �19.723 (�2.93)** �7.923 (�2.64)**
Average travelcard price for bus/trolley bus (time lag 1 month) 0.260 (1.34)* 0.328 (1.19) 0.118 (1.57)*
Number of immigrants 0.119E�03 (4.58)** 0.115E�03 (2.80)** 0.120E�03 (4.12)**
Introduction of two new metro lines (1, after the introduction, 0 otherwise) 10.331 (4.76)** 10.969 (3.43)** 8.344 (9.01)**
January (1 if yes, 0 otherwise) 0.496 (0.29) �0.647 (�0.41) �1.837 (�2.04)**
First-order auto-regressive parameter – 0.518 (9.57)** 0.244 (3.58)**
4th-order auto-regressive parameter – – �0.009 (�0.11)8th-order auto-regressive parameter – – 0.069 (0.93)12th-order auto-regressive parameter – – 0.673 (11.57)**
Number of Observations 144 144 144Durbin–Watson statistic—Eq. (1) 1.50 1.91 2.02Durbin–Watson statistic—Eq. (2) 1.94 2.13 2.01Durbin–Watson statistic—Eq. (3) 0.99 1.61 1.93Adjusted R-squared—Eq. (1) 0.78 0.77 0.84Adjusted R-squared—Eq. (2) 0.69 0.67 0.81Adjusted R-squared—Eq. (3) 0.86 0.90 0.97
a Full information maximum likelihood estimation for first-order serial correlation.b Full information maximum likelihood estimation for first- to 12th-order serial correlation.* Variables significant at the 90% confidence interval.
** Variables significant at the 95% confidence interval.
K. Gkritza et al. / Transportation Research Part A 45 (2011) 148–160 153
was found to be significant. The results indicate that the bus and metro systems may act competitively in that an increase inthe average ticket price for metro (average value of the regular and reduced ticket price weighted by the number of corre-sponding ticket sales) would have a positive effect on bus ridership. A similar conclusion is reached for the second pricevariable introduced in Eq. (1) in Table 2. The relative price of the metro ticket to the price of a travelcard for all modes (ex-pressed as the metro average ticket price over average travelcard price for all modes) has a positive effect on bus ridership aswell, yet lagged by a month. Note that this variable is not significant in the presence of a first-order correction.
Although per capita income was not found a significant determinant of bus ridership, it might be inferred that bus trans-portation is an inferior good similar to the findings of Fairhurst and Edwards (1996) and Romilly (2001), because an increasein unemployment rate would increase bus ridership, as an attractive low-cost mode of transportation (refer to Table 1 fordifference in fare levels across modes). According to our a priori expectations, there is a decrease in the bus ridership duringthe holiday season (which includes winter and summer vacations) with a more pronounced decrease occurring in August(peak month of travel to summer resorts). The indicator variable for time suggests that bus ridership has decreased overthe analysis period (January 1995–December 2006). This is probably attributed to the expansion of the metro system sinceJanuary 2000 and thereafter. Again, it can be inferred that the bus and metro system act competitively, rather than
Table 3Seemingly unrelated regression parameter estimation results of transit ridership (in millions) by fare type (t statistics in parentheses).
Variable No correction forautocorrelation
FIML-firsta FIML-12thb
Eq. (1). Dependent Variable: Travelcard ridersConstant �18.300 (�1.80)** �21.418 (�1.48)* �20.046 (�3.15)**
Metro regular ticket price (time lag 1 month) 14.833 (4.45)** 11.794 (2.24)** 14.249 (5.32)**
Bus average ticket price (time lag 2 months) 17.159 (1.52)* 21.536 (1.33)* 17.455 (2.73)**
Average travelcard price for bus/trolley bus (time lag 2 months) �0.467 (�2.10)** �0.371 (�1.20) �0.534 (�4.65)**
Fuel price index �0.095 (�4.90)** �0.087 (�3.09)** �0.079 (�5.85)**
Number of automobiles per capita 186.334 (3.23)** 190.898 (2.32)** 195.558 (5.83)**
August (1 if yes, 0 otherwise) �7.171 (�12.58)** �5.297 (�8.64)** �3.394 (�3.61)**
Time(1 if January 1995, . . . , 144 if December 2006) �0.178 (�2.10)** �0.190 (�1.54)* �0.197 (�3.89)**
First-order auto-regressive parameter – 0.362 (4.63)** 0.203 (2.04)**
4th-order auto-regressive parameter – – �0.091 (�1.01)8th-order auto-regressive parameter – – �0.004 (�0.03)12th-order auto-regressive parameter – – 0.461 (5.01)**
Eq. (2). Dependent variable: Ticket ridersConstant 45.926 (14.98)** 45.866 (18.99)** 46.198 (10.49)**
Bus average ticket price over travelcard price for bus/trolley bus �395.202 (�2.75)** �362.156 (�2.79)** �241.019 (�2.07)**
Gross domestic product per capita �2145.34 (�1.73)** �2341.42 (�2.01)** �3350.14 (�2.06)**
Holiday season (1 if December or January or July or August, 0 otherwise) �6.408 (�14.29)** �6.400 (�13.31)** �6.112 (�8.63)**
Olympic Games season (1 if July or August or September 2004, 0 otherwise) 3.212 (2.14)** 3.338 (2.10)** 3.279 (2.05)**
October (1 if yes, 0 otherwise) 3.146 (1.91)** 2.583 (3.27)** 3.734 (3.66)**
First-order auto-regressive parameter – �0.124 (�1.24) �0.058 (�0.60)4th-order auto-regressive parameter – – 0.056 (0.63)8th-order auto-regressive parameter – – 0.162 (1.69)**
12th-order auto-regressive parameter – – 0.451 (5.22)**
Number of observations 144 144 144Durbin–Watson statistic—Eq. (1) 1.69 1.87 1.96Durbin–Watson statistic—Eq. (2) 2.23 1.96 1.89Adjusted R-squared—Eq. (1) 0.85 0.86 0.92Adjusted R-squared—Eq. (2) 0.64 0.64 0.73
a Full information maximum likelihood estimation for first-order serial correlation.b Full information maximum likelihood estimation for first- to 12th-order serial correlation.* Variables significant at the 90% confidence interval.
** Variables significant at the 95% confidence interval.
154 K. Gkritza et al. / Transportation Research Part A 45 (2011) 148–160
cooperatively, a finding largely supported by practical (and largely anecdotal) evidence regarding the inability of the twomodes to act together and, particularly, of the buses to alter routes and frequencies to become an effective hub-and-spoketype of network.
Turning to Eq. (2) in Table 2, ridership for the trolley bus system is significantly determined by ticket price, among otherfactors. An increase in the reduced ticket price for trolley bus (applicable to students and military personnel) would decreasethe ridership for this mode. Note that this finding is not significant in the absence of first to 12th-order serial correlationcorrection. The results also suggest that trolley bus ridership is positively related to the number of immigrants, and nega-tively related to per capita automobile ownership, consistent with prior research (Gkritza et al., 2004). The introductionof two new underground metro lines seems to have had a negative effect on the number of trolley bus riders, which is anexpected finding because trolley buses primarily serve the city center, an area also effectively served by the metro system.Trolley bus ridership is also lower during the holiday season, and in June compared to the other months in a year.
Similarly, Eq. (3) in Table 2 shows that metro system ridership is negatively affected by increases in the metro regularticket price, and positively affected by increases in the average travelcard price that allows travel on both metro’s competingmodes (buses and trolley buses). It was found that the response of metro riders to the latter effect was significant with lag of1 month. The results also suggest that metro ridership is positively related to the number of immigrants as was the case withtrolley bus ridership, yet the effect of the number of immigrants on metro ridership is of greater magnitude and significancethan that on trolley bus ridership. Interestingly, no other measures of economic activity were found to significantly deter-mine trolley bus or metro ridership, possibly a result of either the captive nature of their riders (Crotte et al., 2008), or ofthe generally low elasticities generally found for economic activity and transit ridership (Paulley et al., 2006). As it mighthave been expected, the expansion of the metro system seems to have a significant and positive effect on metro ridership.It is of interest to note that the t statistic for this variable is a lower value and the estimator is biased downward in the ab-sence of first to 12th-order serial correction. Last, the indicator variable for January suggests that metro ridership is lower inJanuary compared to the other months. Again, note the implications of incorrectly assuming serial independence of the errorterms for the properties of this estimator and inferences: insignificant t statistics, unstable estimators, and lower overall sta-tistical fit (adjusted R-squared value of 0.86 compared to 0.97).
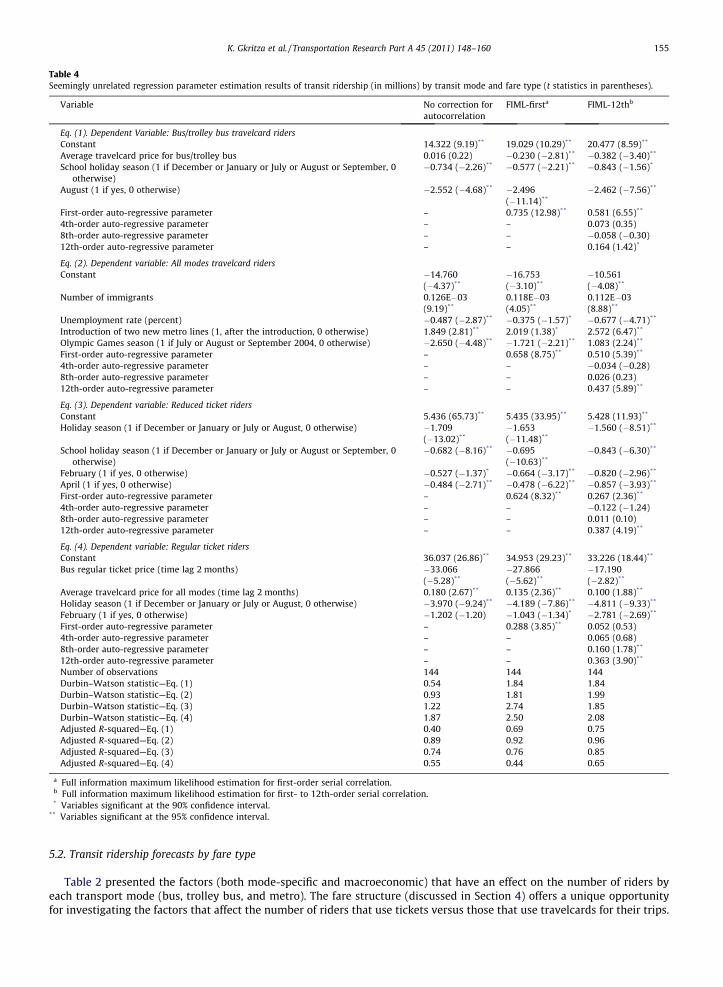
Table 4Seemingly unrelated regression parameter estimation results of transit ridership (in millions) by transit mode and fare type (t statistics in parentheses).
Variable No correction forautocorrelation
FIML-firsta FIML-12thb
Eq. (1). Dependent Variable: Bus/trolley bus travelcard ridersConstant 14.322 (9.19)** 19.029 (10.29)** 20.477 (8.59)**
Average travelcard price for bus/trolley bus 0.016 (0.22) �0.230 (�2.81)** �0.382 (�3.40)**
School holiday season (1 if December or January or July or August or September, 0otherwise)
�0.734 (�2.26)** �0.577 (�2.21)** �0.843 (�1.56)*
August (1 if yes, 0 otherwise) �2.552 (�4.68)** �2.496(�11.14)**
�2.462 (�7.56)**
First-order auto-regressive parameter – 0.735 (12.98)** 0.581 (6.55)**
4th-order auto-regressive parameter – – 0.073 (0.35)8th-order auto-regressive parameter – – �0.058 (�0.30)12th-order auto-regressive parameter – – 0.164 (1.42)*
Eq. (2). Dependent variable: All modes travelcard ridersConstant �14.760
(�4.37)**
�16.753(�3.10)**
�10.561(�4.08)**
Number of immigrants 0.126E�03(9.19)**
0.118E�03(4.05)**
0.112E�03(8.88)**
Unemployment rate (percent) �0.487 (�2.87)** �0.375 (�1.57)* �0.677 (�4.71)**
Introduction of two new metro lines (1, after the introduction, 0 otherwise) 1.849 (2.81)** 2.019 (1.38)* 2.572 (6.47)**
Olympic Games season (1 if July or August or September 2004, 0 otherwise) �2.650 (�4.48)** �1.721 (�2.21)** 1.083 (2.24)**
First-order auto-regressive parameter – 0.658 (8.75)** 0.510 (5.39)**
4th-order auto-regressive parameter – – �0.034 (�0.28)8th-order auto-regressive parameter – – 0.026 (0.23)12th-order auto-regressive parameter – – 0.437 (5.89)**
Eq. (3). Dependent variable: Reduced ticket ridersConstant 5.436 (65.73)** 5.435 (33.95)** 5.428 (11.93)**
Holiday season (1 if December or January or July or August, 0 otherwise) �1.709(�13.02)**
�1.653(�11.48)**
�1.560 (�8.51)**
School holiday season (1 if December or January or July or August or September, 0otherwise)
�0.682 (�8.16)** �0.695(�10.63)**
�0.843 (�6.30)**
February (1 if yes, 0 otherwise) �0.527 (�1.37)* �0.664 (�3.17)** �0.820 (�2.96)**
April (1 if yes, 0 otherwise) �0.484 (�2.71)** �0.478 (�6.22)** �0.857 (�3.93)**
First-order auto-regressive parameter – 0.624 (8.32)** 0.267 (2.36)**
4th-order auto-regressive parameter – – �0.122 (�1.24)8th-order auto-regressive parameter – – 0.011 (0.10)12th-order auto-regressive parameter – – 0.387 (4.19)**
Eq. (4). Dependent variable: Regular ticket ridersConstant 36.037 (26.86)** 34.953 (29.23)** 33.226 (18.44)**
Bus regular ticket price (time lag 2 months) �33.066(�5.28)**
�27.866(�5.62)**
�17.190(�2.82)**
Average travelcard price for all modes (time lag 2 months) 0.180 (2.67)** 0.135 (2.36)** 0.100 (1.88)**
Holiday season (1 if December or January or July or August, 0 otherwise) �3.970 (�9.24)** �4.189 (�7.86)** �4.811 (�9.33)**
February (1 if yes, 0 otherwise) �1.202 (�1.20) �1.043 (�1.34)* �2.781 (�2.69)**
First-order auto-regressive parameter – 0.288 (3.85)** 0.052 (0.53)4th-order auto-regressive parameter – – 0.065 (0.68)8th-order auto-regressive parameter – – 0.160 (1.78)**
12th-order auto-regressive parameter – – 0.363 (3.90)**
Number of observations 144 144 144Durbin–Watson statistic—Eq. (1) 0.54 1.84 1.84Durbin–Watson statistic—Eq. (2) 0.93 1.81 1.99Durbin–Watson statistic—Eq. (3) 1.22 2.74 1.85Durbin–Watson statistic—Eq. (4) 1.87 2.50 2.08Adjusted R-squared—Eq. (1) 0.40 0.69 0.75Adjusted R-squared—Eq. (2) 0.89 0.92 0.96Adjusted R-squared—Eq. (3) 0.74 0.76 0.85Adjusted R-squared—Eq. (4) 0.55 0.44 0.65
a Full information maximum likelihood estimation for first-order serial correlation.b Full information maximum likelihood estimation for first- to 12th-order serial correlation.* Variables significant at the 90% confidence interval.
** Variables significant at the 95% confidence interval.
K. Gkritza et al. / Transportation Research Part A 45 (2011) 148–160 155
5.2. Transit ridership forecasts by fare type
Table 2 presented the factors (both mode-specific and macroeconomic) that have an effect on the number of riders byeach transport mode (bus, trolley bus, and metro). The fare structure (discussed in Section 4) offers a unique opportunityfor investigating the factors that affect the number of riders that use tickets versus those that use travelcards for their trips.
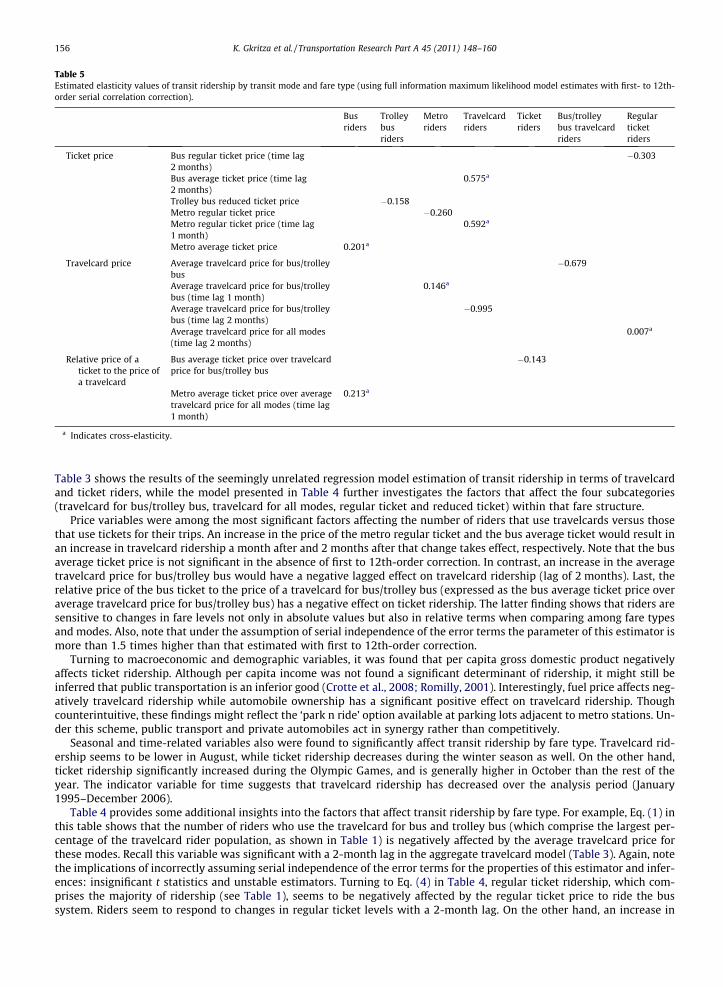
Table 5Estimated elasticity values of transit ridership by transit mode and fare type (using full information maximum likelihood model estimates with first- to 12th-order serial correlation correction).
Busriders
Trolleybusriders
Metroriders
Travelcardriders
Ticketriders
Bus/trolleybus travelcardriders
Regularticketriders
Ticket price Bus regular ticket price (time lag2 months)
�0.303
Bus average ticket price (time lag2 months)
0.575a
Trolley bus reduced ticket price �0.158Metro regular ticket price �0.260Metro regular ticket price (time lag1 month)
0.592a
Metro average ticket price 0.201a
Travelcard price Average travelcard price for bus/trolleybus
�0.679
Average travelcard price for bus/trolleybus (time lag 1 month)
0.146a
Average travelcard price for bus/trolleybus (time lag 2 months)
�0.995
Average travelcard price for all modes(time lag 2 months)
0.007a
Relative price of aticket to the price ofa travelcard
Bus average ticket price over travelcardprice for bus/trolley bus
�0.143
Metro average ticket price over averagetravelcard price for all modes (time lag1 month)
0.213a
a Indicates cross-elasticity.
156 K. Gkritza et al. / Transportation Research Part A 45 (2011) 148–160
Table 3 shows the results of the seemingly unrelated regression model estimation of transit ridership in terms of travelcardand ticket riders, while the model presented in Table 4 further investigates the factors that affect the four subcategories(travelcard for bus/trolley bus, travelcard for all modes, regular ticket and reduced ticket) within that fare structure.
Price variables were among the most significant factors affecting the number of riders that use travelcards versus thosethat use tickets for their trips. An increase in the price of the metro regular ticket and the bus average ticket would result inan increase in travelcard ridership a month after and 2 months after that change takes effect, respectively. Note that the busaverage ticket price is not significant in the absence of first to 12th-order correction. In contrast, an increase in the averagetravelcard price for bus/trolley bus would have a negative lagged effect on travelcard ridership (lag of 2 months). Last, therelative price of the bus ticket to the price of a travelcard for bus/trolley bus (expressed as the bus average ticket price overaverage travelcard price for bus/trolley bus) has a negative effect on ticket ridership. The latter finding shows that riders aresensitive to changes in fare levels not only in absolute values but also in relative terms when comparing among fare typesand modes. Also, note that under the assumption of serial independence of the error terms the parameter of this estimator ismore than 1.5 times higher than that estimated with first to 12th-order correction.
Turning to macroeconomic and demographic variables, it was found that per capita gross domestic product negativelyaffects ticket ridership. Although per capita income was not found a significant determinant of ridership, it might still beinferred that public transportation is an inferior good (Crotte et al., 2008; Romilly, 2001). Interestingly, fuel price affects neg-atively travelcard ridership while automobile ownership has a significant positive effect on travelcard ridership. Thoughcounterintuitive, these findings might reflect the ‘park n ride’ option available at parking lots adjacent to metro stations. Un-der this scheme, public transport and private automobiles act in synergy rather than competitively.
Seasonal and time-related variables also were found to significantly affect transit ridership by fare type. Travelcard rid-ership seems to be lower in August, while ticket ridership decreases during the winter season as well. On the other hand,ticket ridership significantly increased during the Olympic Games, and is generally higher in October than the rest of theyear. The indicator variable for time suggests that travelcard ridership has decreased over the analysis period (January1995–December 2006).
Table 4 provides some additional insights into the factors that affect transit ridership by fare type. For example, Eq. (1) inthis table shows that the number of riders who use the travelcard for bus and trolley bus (which comprise the largest per-centage of the travelcard rider population, as shown in Table 1) is negatively affected by the average travelcard price forthese modes. Recall this variable was significant with a 2-month lag in the aggregate travelcard model (Table 3). Again, notethe implications of incorrectly assuming serial independence of the error terms for the properties of this estimator and infer-ences: insignificant t statistics and unstable estimators. Turning to Eq. (4) in Table 4, regular ticket ridership, which com-prises the majority of ridership (see Table 1), seems to be negatively affected by the regular ticket price to ride the bussystem. Riders seem to respond to changes in regular ticket levels with a 2-month lag. On the other hand, an increase in
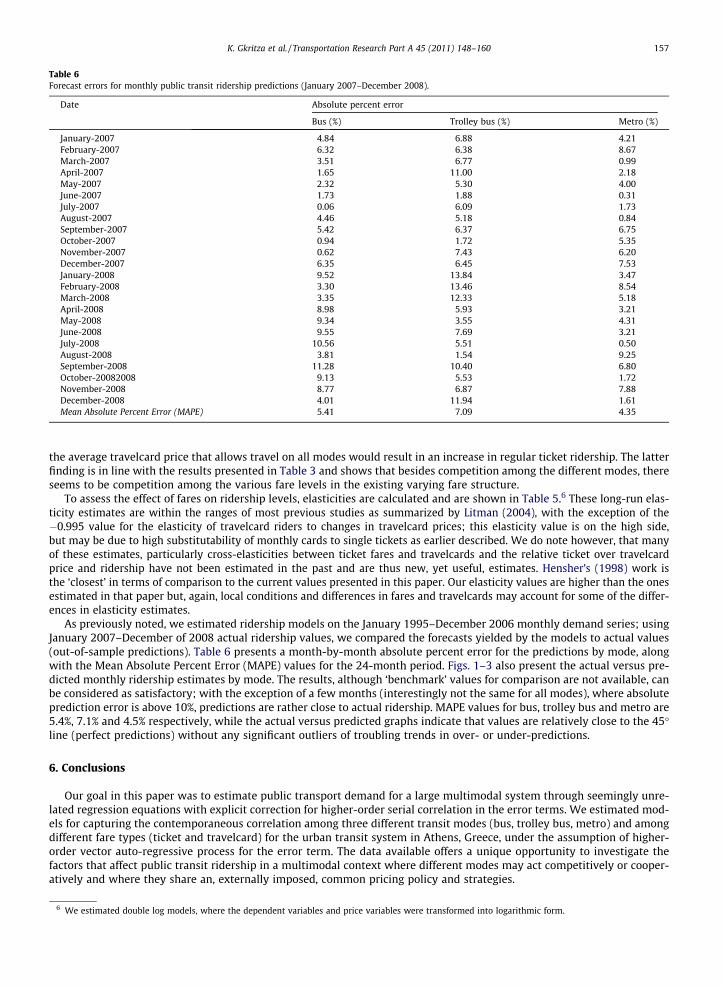
Table 6Forecast errors for monthly public transit ridership predictions (January 2007–December 2008).
Date Absolute percent error
Bus (%) Trolley bus (%) Metro (%)
January-2007 4.84 6.88 4.21February-2007 6.32 6.38 8.67March-2007 3.51 6.77 0.99April-2007 1.65 11.00 2.18May-2007 2.32 5.30 4.00June-2007 1.73 1.88 0.31July-2007 0.06 6.09 1.73August-2007 4.46 5.18 0.84September-2007 5.42 6.37 6.75October-2007 0.94 1.72 5.35November-2007 0.62 7.43 6.20December-2007 6.35 6.45 7.53January-2008 9.52 13.84 3.47February-2008 3.30 13.46 8.54March-2008 3.35 12.33 5.18April-2008 8.98 5.93 3.21May-2008 9.34 3.55 4.31June-2008 9.55 7.69 3.21July-2008 10.56 5.51 0.50August-2008 3.81 1.54 9.25September-2008 11.28 10.40 6.80October-20082008 9.13 5.53 1.72November-2008 8.77 6.87 7.88December-2008 4.01 11.94 1.61Mean Absolute Percent Error (MAPE) 5.41 7.09 4.35
K. Gkritza et al. / Transportation Research Part A 45 (2011) 148–160 157
the average travelcard price that allows travel on all modes would result in an increase in regular ticket ridership. The latterfinding is in line with the results presented in Table 3 and shows that besides competition among the different modes, thereseems to be competition among the various fare levels in the existing varying fare structure.
To assess the effect of fares on ridership levels, elasticities are calculated and are shown in Table 5.6 These long-run elas-ticity estimates are within the ranges of most previous studies as summarized by Litman (2004), with the exception of the�0.995 value for the elasticity of travelcard riders to changes in travelcard prices; this elasticity value is on the high side,but may be due to high substitutability of monthly cards to single tickets as earlier described. We do note however, that manyof these estimates, particularly cross-elasticities between ticket fares and travelcards and the relative ticket over travelcardprice and ridership have not been estimated in the past and are thus new, yet useful, estimates. Hensher’s (1998) work isthe ‘closest’ in terms of comparison to the current values presented in this paper. Our elasticity values are higher than the onesestimated in that paper but, again, local conditions and differences in fares and travelcards may account for some of the differ-ences in elasticity estimates.
As previously noted, we estimated ridership models on the January 1995–December 2006 monthly demand series; usingJanuary 2007–December of 2008 actual ridership values, we compared the forecasts yielded by the models to actual values(out-of-sample predictions). Table 6 presents a month-by-month absolute percent error for the predictions by mode, alongwith the Mean Absolute Percent Error (MAPE) values for the 24-month period. Figs. 1–3 also present the actual versus pre-dicted monthly ridership estimates by mode. The results, although ‘benchmark’ values for comparison are not available, canbe considered as satisfactory; with the exception of a few months (interestingly not the same for all modes), where absoluteprediction error is above 10%, predictions are rather close to actual ridership. MAPE values for bus, trolley bus and metro are5.4%, 7.1% and 4.5% respectively, while the actual versus predicted graphs indicate that values are relatively close to the 45�line (perfect predictions) without any significant outliers of troubling trends in over- or under-predictions.
6. Conclusions
Our goal in this paper was to estimate public transport demand for a large multimodal system through seemingly unre-lated regression equations with explicit correction for higher-order serial correlation in the error terms. We estimated mod-els for capturing the contemporaneous correlation among three different transit modes (bus, trolley bus, metro) and amongdifferent fare types (ticket and travelcard) for the urban transit system in Athens, Greece, under the assumption of higher-order vector auto-regressive process for the error term. The data available offers a unique opportunity to investigate thefactors that affect public transit ridership in a multimodal context where different modes may act competitively or cooper-atively and where they share an, externally imposed, common pricing policy and strategies.
6 We estimated double log models, where the dependent variables and price variables were transformed into logarithmic form.
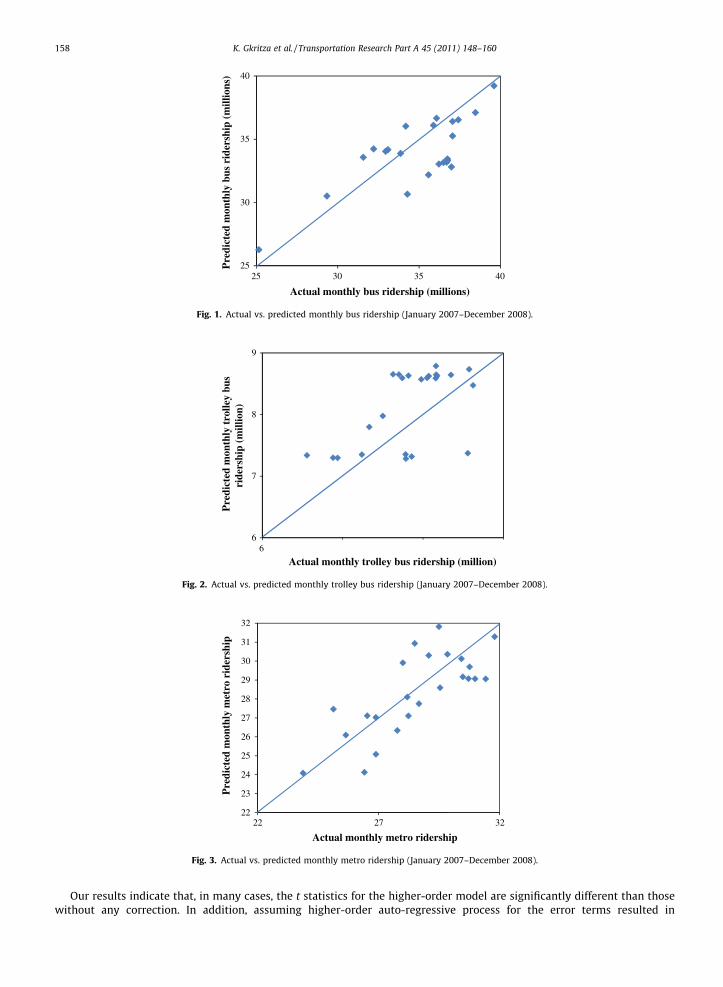
25
30
35
40
25 30 35 40
Pre
dict
ed m
onth
ly b
us r
ider
ship
(m
illio
ns)
Actual monthly bus ridership (millions)
Fig. 1. Actual vs. predicted monthly bus ridership (January 2007–December 2008).
6
7
8
9
6
Pre
dict
ed m
onth
ly t
rolle
y bu
s
ride
rshi
p (m
illio
n)
Actual monthly trolley bus ridership (million)
Fig. 2. Actual vs. predicted monthly trolley bus ridership (January 2007–December 2008).
22
23
24
25
26
27
28
29
30
31
32
322722
Pre
dict
ed m
onth
ly m
etro
rid
ersh
ip
Actual monthly metro ridership
Fig. 3. Actual vs. predicted monthly metro ridership (January 2007–December 2008).
158 K. Gkritza et al. / Transportation Research Part A 45 (2011) 148–160
Our results indicate that, in many cases, the t statistics for the higher-order model are significantly different than thosewithout any correction. In addition, assuming higher-order auto-regressive process for the error terms resulted in
K. Gkritza et al. / Transportation Research Part A 45 (2011) 148–160 159
Durbin–Watson statistics close to the desirable value and superior statistical fit. We also find that incorrectly assuming serialindependence for the error terms could yield upward or downward biased estimators depending on the dependent variableand hence result in incorrect policy recommendations.
Bus and metro systems in Athens, appear to act as competitors and an increase in the average ticket price for metro wouldhave a positive effect on bus ridership (elasticity of 0.2). A similar conclusion was reached for the relative price of the metroticket to the price of a travelcard, where an increase in this ratio leads to an increase in bus ridership as well (albeit with a1 month lag). We also note that an increase in unemployment rate increases bus ridership, a decrease in bus ridership ap-pears during the holiday season and the introduction of two new underground metro lines had a negative effect on the num-ber of bus riders. Trolley bus ridership seems to be less price responsive than metro ridership (though both fairly inelastic)with Table 5 showing that roughly a 1% change in the reduced ticket price for trolley bus would decrease the ridership forthis mode by about 0.16%, while a similar change in the regular ticket price for metro would have about a 0.26% negativeeffect on metro ridership.
Price variables were found to be among the most significant factors affecting the number of riders who use travelcardsversus those who use tickets for their trips but were inelastic. Table 5 shows a 1% increase in the price of metro or bus’ reg-ular ticket would result in almost 0.6% increase in travelcard ridership from 1 to 2 months following the changes. In contrast,a 1% increase in the average bus travelcard price would have almost a 0.7% negative effect on bus travelcard use and a 1%negative lagged effect on overall travelcard use (lag of 2 months). We also found that an increase in the regular ticket pricefor bus would have a negative lagged effect on regular ticket use (elasticity of�0.3, lag of 2 months). Finally, findings indicatethat riders are sensitive both to changes in absolute fare levels as well as in terms of the relative price of tickets to travel-cards, but the extent of this effect varies by mode. In general, it appears that fare increases, when done according to a goodbalance between ticket and travelcard prices, will lead to improved finances for the transit system without a significant de-crease in demand. Our elasticity estimates shown in Table 5 indicate that a 1% increase in the relative price of the bus ticketto the price of a travelcard would have about a 0.14% negative effect on overall ticket use.
References
Akin, D., 2006. A model for estimating increased ridership due to the integration of two urban transit models: case study of Istanbul’s metro and bus/minibus transit systems. In: Paper Presented at the Annual Meeting of the Transportation Research Board (2006), Washington DC.
Beach, C.M., MacKinnon, J.G., 1978a. A maximum likelihood procedure for regression with autocorrelated errors. Econometrica 46, 51–58.Beach, C.M., MacKinnon, J.G., 1978b. Full maximum likelihood estimation of second-order autoregressive error models. Journal of Econometrics 7, 187–198.Ben-Akiva, M., Morikawa, T., 2002. Comparing ridership attraction of rail and bus. Transport Policy 9, 107–116.Carbajo, J.C., 1988. The economics of travel passes. Journal of Transport Economics and Policy 22, 153–173.Cervero, R., 1990. Transit pricing research: a review and synthesis. Transportation 17, 117–139.Chiou, Y.-C., Wenb, C.-H., Tsaia, S.-H., Wanga, W.-Y., 2009. Integrated modeling of car/motorcycle ownership, type and usage for estimating energy
consumption and emissions. Transportation Research Part A 43, 665–684.Crotte, A., Noland, R.B., Graham, D.J., 2008. Demand estimation of metro Usage in Mexico City. In: Paper Presented at the 87th Annual Meeting of the
Transportation Research Board, Washington, DC.Currie, G., Phung, J., 2008. Understanding links between transit ridership and auto gas prices – US and Australian evidence. In: Paper Presented at the Annual
Meeting of the Transportation Research Board (2008), Washington, DC.Dargay, J.M., Hanly, M., 1999. Bus Fare Elasticities. ESRC Transport Studies Nit, University College London.Dargay, J.M., Hanly, M., 2002. The demand for local bus services in England. Journal of Transport Economics and Policy 36, 73–91.de Rus, G., 1990. Public transport demand elasticities in Spain. Journal of Transport Economics and Policy 24, 189–201.Fairhurst, M., Edwards, D., 1996. Bus travel trends in the UK. Transport Reviews 6 (2), 157–167.Fitzroy, F., Smith, I., 1999. Season tickets and the demand for public transport. Kyklos 52, 219–238.Garcia-Ferrer, A., Bujosa, M., Aranzazu de Juan Poncela, P., 2006. Demand forecast and elasticities estimation of public transport. Journal of Transport
Economics and Policy 40, 45–67.Gkritza, K., Golias, I., Karlaftis, M.G., 2004. Estimating elasticities for multi-modal public transport demand: a time-series approach. Journal of the
Transportation Research Forum 43 (2), 14–23.Goodwin, P.B., 1992. A review of new demand elasticities with special references to short and long run effects of price charges. Journal of Transport
Economics and Policy 26 (2), 155–170.Graham, D.J., Crotte, A., Anderson, R.J., 2009. A dynamic panel analysis of urban metro demand. Transportation Research Part E 45, 787–794.Granger, C.W.J., 1981. Some properties of time series data and their use in econometric model specification. Journal of Econometrics 16, 121–130.Granger, C.W.J., Engle, R., 1987. Co-integration and error-correction: representation, estimation and testing. Econometrica 55, 251–276.Greene, W.H., 2003. Econometric analysis, fifth ed. Prentice Hall.Guo, Z., Wilson, N.H.M., Rahbee, A., 2007. The impact of weather on transit ridership in Chicago. In: Paper Presented at the Annual Meeting of the
Transportation Research Board (2008), Washington, DC.Hanly, M., Dargay, J., 1999. Bus Fare Elasticities. A Literature Review. Report to the Department of the Environment, Transport and the Regions.Hensher, D., 1987. Productive efficiency and ownership of urban bus services. Transportation 14, 209–225.Hensher, D.A., 1998. Establishing a fare elasticity regime for urban passenger transport. Journal of Transport Economics and Policy 32, 221–246.Hensher, D.A., 2008. Assessing systematic sources of variation in public transport elasticities: some comparative warnings. Transportation Research Part A
42, 1031–1042.Karlaftis, M., McCarthy, P., 1999. The effect of privatization on public transit costs. Journal of Regulatory Economics 16, 27–43.Kmenta, J., Gilbert, R.F., 1970. Estimation of seemingly unrelated regressions with autoregressive disturbances. Journal of the American Statistical
Association 65, 186–197.Koppelman, F.S., 1983. Predicting transit ridership in response to transit services changes. Journal of Transportation Engineering 109 (4), 548–564.Li, Z., Rose, J.M., Hensher, D.A., 2010. Forecasting automobile petrol demand in Australia: an evaluation of empirical models. Transportation Research Part A
44, 16–38.Litman, T., 2004. Transit price elasticities and cross-elasticities. Journal of Public Transportation 7 (2), 37–58.Macário, R., 2003. Institutional frameworks, regulatory agencies and the land passenger transport industry: reflections on recent evolutions. In: Hensher,
D.A. (Ed.), Competition and Ownership in Land Passenger Transport. Elsevier Science, pp. 559–576.
160 K. Gkritza et al. / Transportation Research Part A 45 (2011) 148–160
Mackett, R.L., Edwards, M., 1998. The impact of new urban public transport systems: will the expectations be met? Transportation Research Part A 32 (4),231–245.
Oum, T.H., Waters II, W.G., Yong, J.S., 1992. Concepts of price elasticities of transport demand and recent empirical estimates. Journal of TransportEconomics and Policy 26 (2), 139–154.
Parks, R., 1967. Efficient estimation of a system of regression equations when disturbances are both serially and contemporaneously correlated. Journal ofthe American Statistical Association 62, 500–509.
Paulley, N., Balcombe, R., Mackett, R., Titheridge, H., Preston, J., Wardman, M., Shires, J., White, P., 2006. The demand for public transport: the effects of fares,quality of service, income and car ownership. Transport Policy 13, 295–306.
Peng, Z., Dueker, K.J., Strathman, J., Hopper, J., 1997. A simultaneous route-level transit patronage model: demand, supply, and inter-route relationship.Transportation 24, 159–181.
Pindyck, R.S., Rubinfeld, D.L., 1998. Econometric Models and Economic Forecasts, fourth ed. Irwin/McGraw-Hill, New Jersey.Preston, J., 1998. Public transport elasticities: time for a rethink? In: UTSG Conference Dublin. TSU856 Transport Studies Unit, University of Oxford.Romilly, P., 2001. Subsidy and local bus service deregulation in Britain. A re-evaluation. Journal of Transport Economics and Policy 35 (2), 161–194.Srivastava, V.K., Giles, D.E.A., 1987. Seemingly Unrelated Regression Equations Models: Estimation and Inference. Marcel Dekker, Inc., New York.Su, Q., 2010. Travel demand in the US urban areas: a system dynamic panel data approach. Transportation Research Part A 44, 110–117.Taylor, B.D., Miller, D., 2003. Analyzing the determination of transit ridership using a two-stage least squares regression on a national sample of urbanized
areas. In: Paper Presented at the Annual Meeting of the Transportation Research Board (2004), Washington, DC.Tsamboulas, D., Antoniou, C., 2006. Allocating revenues to public transport operators under an integrated fare system. Transportation Research Record:
Journal of the Transportation Research Board 1986, 32–57.Vande Walle, S., Steenberghen, T., 2006. Space and time related determinants of public transport use in trip chains. Transportation Research Part A 40, 151–
162.Washington, S.P., Karlaftis, M.G., Mannering, F.L., 2011. Statistical and Econometric Methods for Transportation Data Analysis, second ed. Chapman and Hall/
CRC, Boca Raton, FL.White, P., 1981. Travel card tickets in urban public transport. Journal of Transport Economics and Policy 15, 17–34.Zellner, A., 1962. An efficient method of estimating seemingly unrelated regressions and tests for aggregation bias. Journal of the American Statistical
Association 57, 348–368.