Embed Size (px)
Citation preview

Wallingford HydroSolutions Ltd
Hydra 2™
Estimating hydropower potential
User Guide

Cover photographs (clockwise from top left):
©iStockphoto.com/Kevin Eaves ©iStockphoto.com/Jennifer Byron
©iStockphoto.com/Alberto Pomares
Design: platform1design.com

Hydra 2™
User GuideMay 2011
Wallingford HydroSolutions Limited
Maclean Building, Crowmarsh Gifford,
Wallingford OX10 8BB
www.hydrosolutions.co.uk

Hydra 2™ User Guide
© Wallingford HydroSolutions Ltd 2011
All rights reserved. No part of this
publication may be reproduced or
transmitted in any form or by any means,
electronic or mechanical, including,
without limitation, photocopy, scanning,
recording or any information storage and
retrieval system, without permission in
writing from Wallingford HydroSolutions
Limited.
This user guide has been prepared by
Wallingford HydroSolutions with all
reasonable skill, care and diligence. It
has been designed to enable you to
operate the software and to provide you
with an overview of the methods used
in the software. You are responsible for
the interpretation of the information
presented in this user guide and formal
training in the use of the methods is
strongly recommended.
In no event will Wallingford
HydroSolutions be liable to you for
any damages, including lost profits,
lost savings or other incidental or
consequential damages arising from your
use of the information in this user guide
even if we have been advised of the
possibility of such damages.
Development Team
Wallingford HydroSolutions Ltd.
(WHS) software development team
are responsible for the development
of the Hydra 2TM software.
Document History
V1.0
May 2011
WHS Development Team
Technical Specification
Minimum recommended specification
Base computer
Intel or equivalent PC with CD drive
Chip
Pentium IV or equivalent
RAM
1Gb
Free drive space
20Mb
Operating system
Windows XP, Windows Vista,
Windows 7
Hydra 2™ User Guide
Contents
1 Overview� 6
2 Appropriate use of Hydra 2TM 7
3 How� to use this guide 8
4 Getting started 9
4.1 Installing the software
4.2 Activating the software licence and logging in
5 Defining the river flow� regime 11
6 Setting the flow�s conditions 13
7 Setting the hydraulic head conditions 16
7.1 Changing default parameters
8 Hydropow�er energy estimates 20
8.1 Exporting
8.2 Turbine data
9 References 26
10 Glossary 27
10.1 General concepts
10.2 Flow definitions
10.3 Headloss calculations
10.4 Allied software
Licence terms and conditions
The use of the Hydra 2TM software is governed by the terms and conditions of the
licence agreement between Wallingford HydroSolutions Limited and the User. The User
is required to accept the licence terms and conditions of use prior to installation and at
runtime. These terms and conditions can be viewed at the login screen of the software
and on the Licence Certificate. Your attention is particularly drawn to clauses relating to
your responsibilities and licence termination.
Hydra 2™ User Guide
6
1 Overview�
The initial planning of hydropower schemes includes an assessment of the
energy generation potential of a particular site on a river. This is primarily
dependant on two site conditions; the flow regime (which defines the
amount of water available throughout a year) and the hydraulic head
(the change in elevation between intake and outlet of the scheme).
Environmental constraints, such as maximum take and residual flow
conditions may also apply and impact on the predicted annual energy
production. Typically, the viability of a number of sites is compared and a
number of turbines trialled to identify the optimum scheme.
Hydra 2 is a decision-support tool that estimates annual energy
generation for hydropower schemes. Flexible environmental flow
constraints, consistent with current regulatory guidelines, can be added.
Nett head conditions can be calculated using headloss formulae for
trashracks, friction losses and minor losses. Appropriate turbines are
automatically selected and analysed. Results are rapidly produced,
enabling multiple schemes to be assessed in a consistent and timely
manner.
The power calculations and headloss formulae implemented within
Hydra 2 are consistent with the Guide on how to develop a small
hydropower plant published by the European Small Hydropower
Association (ESHA) (2004).
Hydra 2™ User Guide
7
2 Appropriate use of Hydra 2TM
Hydra 2 is a decision-support tool that enables the feasibility of small
hydropower schemes to be assessed in a rapid, efficient and consistent
manner. Hydra 2 is designed for run-of-river hydropower schemes
without significant storage. The flows in the river that are able to
generate power are assumed to be described by an annual flow duration
curve (FDC).
The software should not be considered a substitute for professional
expertise. It is strongly recommended that the software is used by
competent hydropower engineers who have suitable training and
experience in the development of hydropower schemes.
The energy estimates produced by the software are directly dependent
on the supplied FDC and hydraulic head details. The hydrological and
hydraulic expertise used to derive these data should be commensurate
with the level of accuracy of the analysis.
The turbine operating envelopes and efficiency curve data included in the
software are typical for the selection of turbines. These data may differ
to turbine manufacturers’ specifications for an individual turbine. The
current version of Hydra 2 does not enable you to edit this turbine data.
The default component efficiency parameters are typical for small
hydropower schemes and the associated turbine types. These data may
differ to manufacturers’ specifications for an individual component. These
data can be edited.
Environmental regulatory standards will define the residual flow
conditions for a scheme which will in turn constrain the amount of water
that can be utilised for power generation. It is important that these
residual flow conditions are agreed with the relevant authorities prior to
modelling schemes with the software.
Hydra 2™ User Guide
8
3 How� to use this guide
This user guide describes how to setup the Hydra 2 software and the
functionality of the system.
■ 4 Getting started shows you how to install and run the software.
■ 5 Defining the river flow� regime describes how the river flow
regime details are added via ‘paste from clipboard’ or imported
directly from a LowFlows flow estimate file.
■ 6 Setting the flow� conditions guides you through the process of
defining the provisional rated flow and residual (environmental) flow
conditions associated with the scheme.
■ 7 Setting the hydraulic head conditions illustrates how the nett
system head can be defined either as a simple fixed percentage of the
gross head or via headloss calculations (trashrack losses, friction losses
and minor losses).
■ 8 Hydropow�er energy estimates puts it all together and shows you
how the estimates of energy generation potential are displayed and
can be exported from the system.
■ 9 References lists literature for further reading.
■ 10 Glossary contains details of commonly used terminology.
The table below shows the conventions used in the text.
Convention Explanation
Grey Bold Text/name appearing in the screen currently displayed.

Hydra 2™ User Guide
9
4 Getting started
4.1 Installing the softw�areTo install the Hydra 2 software place the CD in your CD drive and run the
setup.exe file.
The installation will prepare to install the software, displaying the
Preparing to install… screen. The Installation Welcome screen
will then be displayed. Continue with the installation to the Licence
Agreement screen, Figure 4.1. You must read and accept the Licence
Terms and Conditions of the software prior to continuing with the
installation.
Figure 4.1� Licence Agreement screen
The Destination Folder screen will then be displayed, Figure 4.2. You
will be asked to specify where the software should be located; a default
location is supplied.
Figure 4.2� Destination Folder screen

Hydra 2™ User Guide
10
The Ready to Install screen enables you to view the installation details.
Continue by selecting Install which will begin the installation. Following
completion, select Finish, after which you should restart your PC.
4.2 Activating the softw�are licence and logging inHydra 2 is protected by a licence held on the USB dongle which is
supplied with the software. You must insert the dongle into the computer
whenever you run the software.
The first time you use the software, you need to click Brow�se licence...
in the login screen (Figure 4.3) and browse to the Hydra.lic file on the
USB dongle. During subsequent uses the software will automatically
look for the licence in the same place. However, if the drive letter of the
dongle changes (for example when you are using it on another computer)
you may need to browse to the file again.
If the licence file is valid you will see a message on the login screen
confirming that you have a valid licence for the software.
Figure 4.3 Login screen
You must then agree to the Licence terms and conditions before running
the software. Click Accept to confirm that you have read and accepted
the Licence terms and conditions presented in the login screen. The
software will then start and you will see the Set Data Origin screen.
Hydra 2 enables you to save key information entered for a specific site as
a project file. This file can then be recalled for subsequent analysis. For
first time use of the software, you will need to choose to Define a new�
Hydra 2 project.
Hydra 2™ User Guide
11
5 Defining the river flow� regime
The Hydra 2 software produces estimates of energy generation potential
based on a description of the flow regime for a point on a river. The
first inputs required are an estimate of the annual flow duration curve
(FDC) and an estimate of catchment annual mean flow (MF). These
could be derived from gauged data using hydrometric analysis software
such as HydroTools or estimated from hydrological models, such as the
LowFlows suite, see the Glossary for details. You can enter the FDC data
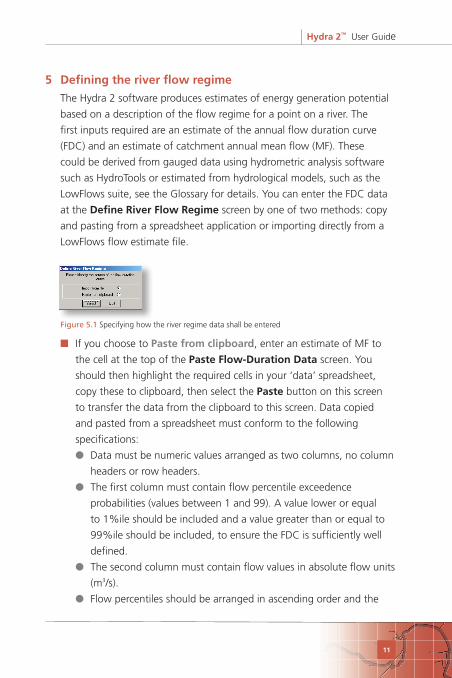
at the Define River Flow� Regime screen by one of two methods: copy
and pasting from a spreadsheet application or importing directly from a
LowFlows flow estimate file.
Figure 5.1� Specifying how the river regime data shall be entered
■ If you choose to Paste from clipboard, enter an estimate of MF to
the cell at the top of the Paste Flow�-Duration Data screen. You
should then highlight the required cells in your ‘data’ spreadsheet,
copy these to clipboard, then select the Paste button on this screen
to transfer the data from the clipboard to this screen. Data copied
and pasted from a spreadsheet must conform to the following
specifications:
● Data must be numeric values arranged as two columns, no column
headers or row headers.
● The first column must contain flow percentile exceedence
probabilities (values between 1 and 99). A value lower or equal
to 1%ile should be included and a value greater than or equal to
99%ile should be included, to ensure the FDC is sufficiently well
defined.
● The second column must contain flow values in absolute flow units
(m3/s).
● Flow percentiles should be arranged in ascending order and the
Hydra 2™ User Guide
12
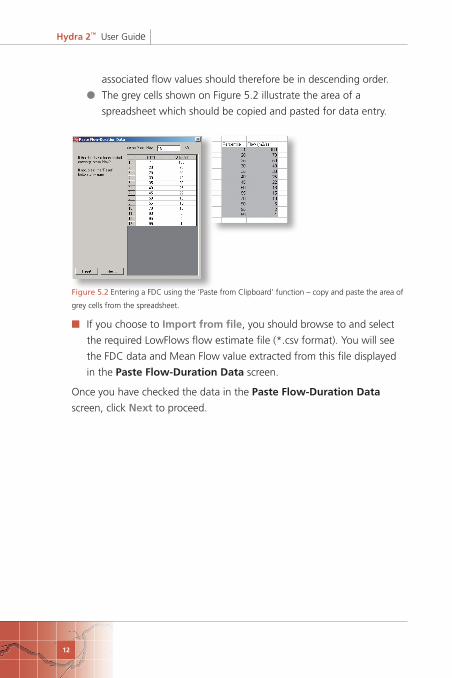
associated flow values should therefore be in descending order.
● The grey cells shown on Figure 5.2 illustrate the area of a
spreadsheet which should be copied and pasted for data entry.
Figure 5.2� Entering a FDC using the ‘Paste from Clipboard’ function – copy and paste the area of
grey cells from the spreadsheet.
■ If you choose to Import from file, you should browse to and select
the required LowFlows flow estimate file (*.csv format). You will see
the FDC data and Mean Flow value extracted from this file displayed
in the Paste Flow�-Duration Data screen.
Once you have checked the data in the Paste Flow�-Duration Data
screen, click Next to proceed.
Hydra 2™ User Guide
13
6 Setting the flow�s conditions
The energy generated by a hydropower scheme is dependent on the
river flows available and the applicable residual flow conditions. The
provisional rated flow (Qprovrtd) defines the upper limit of ‘useable’ flows
from the FDC for the river. The residual flow (Qres) defines the lower
limit of flows that can be used. When the river flow regime falls to below
the Qres, water cannot be used to generate energy and must be left to
support downstream environmental requirements.
The Define Residual Flow� screen enables you to set the Qres flow to be
constant (ie. one value of Qres applies across the full FDC) or varying (ie.
the value of Qres can vary across flow percentiles). This provides flexibility
required to meet regulatory conditions.
Figure 6.1� Choosing how to define the residual flow
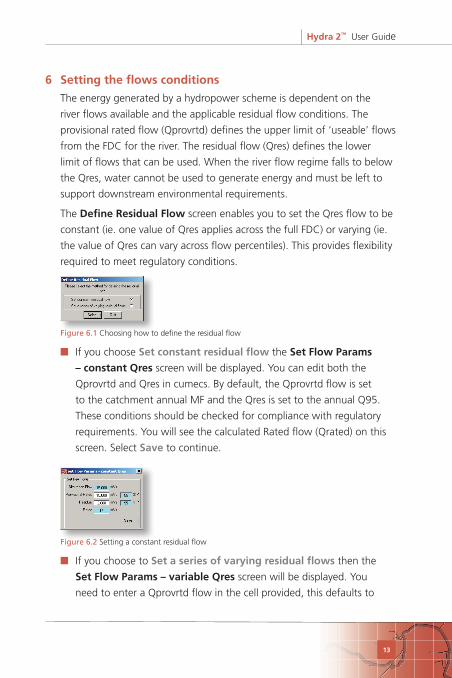
■ If you choose Set constant residual flow� the Set Flow� Params
– constant Qres screen will be displayed. You can edit both the
Qprovrtd and Qres in cumecs. By default, the Qprovrtd flow is set
to the catchment annual MF and the Qres is set to the annual Q95.
These conditions should be checked for compliance with regulatory
requirements. You will see the calculated Rated flow (Qrated) on this
screen. Select Save to continue.
Figure 6.2� Setting a constant residual flow
■ If you choose to Set a series of varying residual flow�s then the
Set Flow� Params – variable Qres screen will be displayed. You
need to enter a Qprovrtd flow in the cell provided, this defaults to
Hydra 2™ User Guide
14
the catchment MF. The variable Qres values are added by a ‘paste
from clipboard’ function. You should highlight the required cells in a
spreadsheet, copy these to the clipboard, then select the Paste button
to transfer the data to this screen. The format of the data copied to
clipboard must conform to the following specifications:
● Data must be numeric values arranged as two columns, no column
headers or row headers.
● The first column must contain flow percentile exceedence
probabilities (values between 1 and 99). These define the points
at which Qres will vary across the FDC x-axis. These should be
arranged in increasing order.
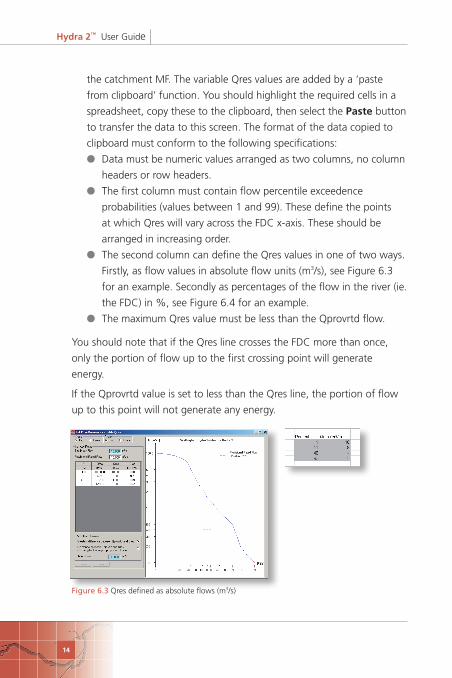
● The second column can define the Qres values in one of two ways.
Firstly, as flow values in absolute flow units (m3/s), see Figure 6.3
for an example. Secondly as percentages of the flow in the river (ie.
the FDC) in %, see Figure 6.4 for an example.
● The maximum Qres value must be less than the Qprovrtd flow.
You should note that if the Qres line crosses the FDC more than once,
only the portion of flow up to the first crossing point will generate
energy.
If the Qprovrtd value is set to less than the Qres line, the portion of flow
up to this point will not generate any energy.
Figure 6.3 Qres defined as absolute flows (m3/s)
Hydra 2™ User Guide
15
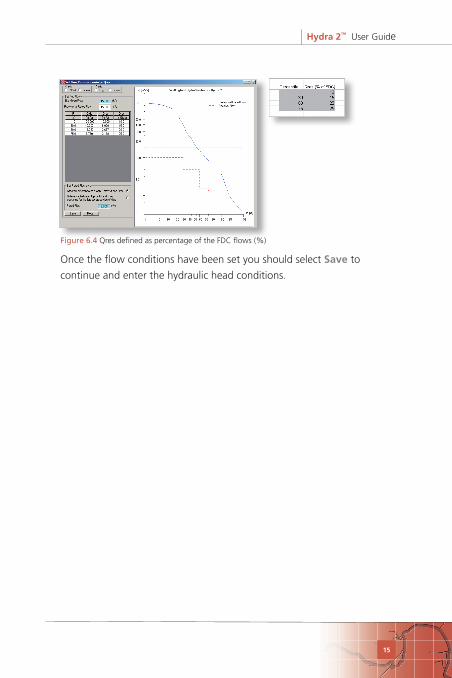
Figure 6.4 Qres defined as percentage of the FDC flows (%)
Once the flow conditions have been set you should select Save to
continue and enter the hydraulic head conditions.

Hydra 2™ User Guide
16
7 Setting the hydraulic head conditions
The energy generated from a hydropower scheme depends on the
available flows and the available head. The gross head of the system
refers to the change in elevation between the intake and tail race. The
nett head is a smaller value which accounts for headlosses through the
system between the intake and tail race.
The Define Nett Head screen provides you with two methods for
defining nett head.
Figure 7.1� Choosing how to define the nett head
■ You may choose to simply nominate the nett head as a Simple
percentage of gross head. The percentage value entered here
reflects the total headlosses in the system. Typical values are between
5–10%. The nett head is calculated, shown in blue highlight, and you
proceed by selecting Save.
Figure 7.2� Setting nett head as a simple percentage of gross head
■ If you wish to enter detailed information to calculate the nett head
choose Include friction and minor losses. This allows you to
estimate the headlosses for individual hydraulic components; an inlet
trashrack, penstock sections and minor losses. You will need to enter
data on the Define Head Losses screen (Figure 7.3) which consists of
a number of panels described below:
● Summary – You need to add the Gross Hydraulic Head (m) in
this panel. The previously calculated Qrated is shown and the Nett
Hydraulic Head (m) is updated as you add information to define
the headloss components. Cells appear in pink highlight if the
Hydra 2™ User Guide
17
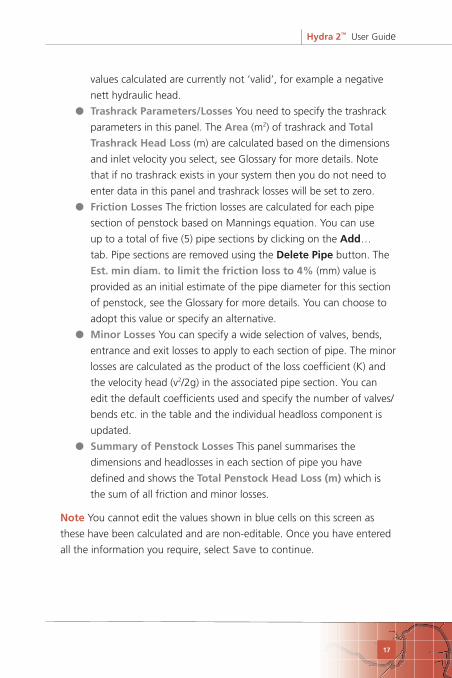
values calculated are currently not ‘valid’, for example a negative
nett hydraulic head.
● Trashrack Parameters/Losses You need to specify the trashrack
parameters in this panel. The Area (m2) of trashrack and Total
Trashrack Head Loss (m) are calculated based on the dimensions
and inlet velocity you select, see Glossary for more details. Note
that if no trashrack exists in your system then you do not need to
enter data in this panel and trashrack losses will be set to zero.
● Friction Losses The friction losses are calculated for each pipe
section of penstock based on Mannings equation. You can use
up to a total of five (5) pipe sections by clicking on the Add…
tab. Pipe sections are removed using the Delete Pipe button. The
Est. min diam. to limit the friction loss to 4% (mm) value is
provided as an initial estimate of the pipe diameter for this section
of penstock, see the Glossary for more details. You can choose to
adopt this value or specify an alternative.
● Minor Losses You can specify a wide selection of valves, bends,
entrance and exit losses to apply to each section of pipe. The minor
losses are calculated as the product of the loss coefficient (K) and
the velocity head (v2/2g) in the associated pipe section. You can
edit the default coefficients used and specify the number of valves/
bends etc. in the table and the individual headloss component is
updated.
● Summary of Penstock Losses This panel summarises the
dimensions and headlosses in each section of pipe you have
defined and shows the Total Penstock Head Loss (m) which is
the sum of all friction and minor losses.
Note You cannot edit the values shown in blue cells on this screen as
these have been calculated and are non-editable. Once you have entered
all the information you require, select Save to continue.
Hydra 2™ User Guide
18
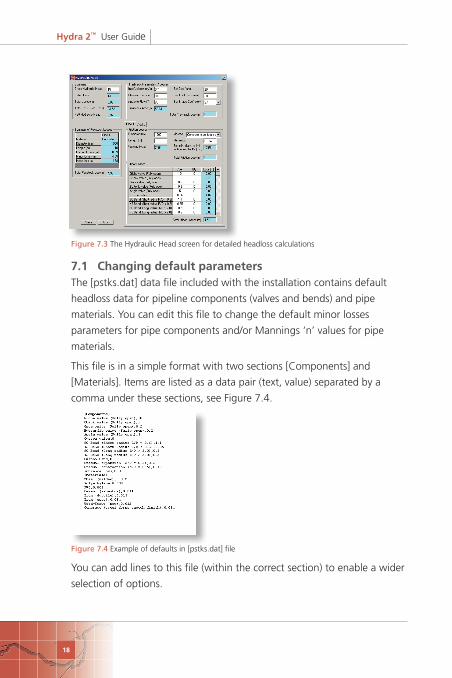
Figure 7.3 The Hydraulic Head screen for detailed headloss calculations
7.1 Changing default parameters The [pstks.dat] data file included with the installation contains default
headloss data for pipeline components (valves and bends) and pipe
materials. You can edit this file to change the default minor losses
parameters for pipe components and/or Mannings ‘n’ values for pipe
materials.
This file is in a simple format with two sections [Components] and
[Materials]. Items are listed as a data pair (text, value) separated by a
comma under these sections, see Figure 7.4.
Figure 7.4 Example of defaults in [pstks.dat] file
You can add lines to this file (within the correct section) to enable a wider
selection of options.

Hydra 2™ User Guide
19
You can remove lines from this file, providing you always retain at least
one data line in the [Components] section and one in the [Materials]
section.
You can modify the existing lines in this file, changing the descriptive
text and/or value. The maximum number of items in the [Component]
or [Materials] list is 20. The maximum number of characters in the
descriptive text item is 40.
Hydra 2™ User Guide
20
8 Hydropow�er energy estimates
Once the river flow regime has been defined and the flow and head
conditions have been set, the main screen displays results of the energy
calculations, see Figure 8.1. The system nett head and rated flow are
plotted on the turbine operating envelopes to identify which turbines are
operable. You can view this by the Plot Head/Flow� button. The annual
energy produced by each operable turbine is then calculated as detailed
below.
The potential energy lost by water flowing at rate Q (m3/s) with a
hydraulic head of H (m) can be converted to power by the following:
P = Q × H × γP is the power produced (kW)
Q is the available flow for power generation (m3/s)
H is the head (m)
γ is the specific weight of water (9.81kN/m3)
The portion of river flows throughout a year that can be used to generate
power are defined by the usable flow envelop shown on the Flow�
Duration tab. This envelope is bounded by the Generating Flow line
and the Minimum Flow line, see the Glossary for more details. The total
annual energy is obtained by integrating the power equation across the
usable flow envelope, accounting for turbine efficiencies at each flow.
E = ηgearbox × ηgenerator × ηtransformer × h × ∫ (P × ηturbine)E is the gross annual energy produced (kWh/yr)
ηturbine is the efficiency of the turbine, a ƒ(Q), derived from efficiency curves
ηgearbox is the gearbox efficiency (if relevant)
ηgenerator is the generator efficiency
η transformer is the transformer efficiency
h is the number of hours the turbine operates per year
Hydra 2™ User Guide
21
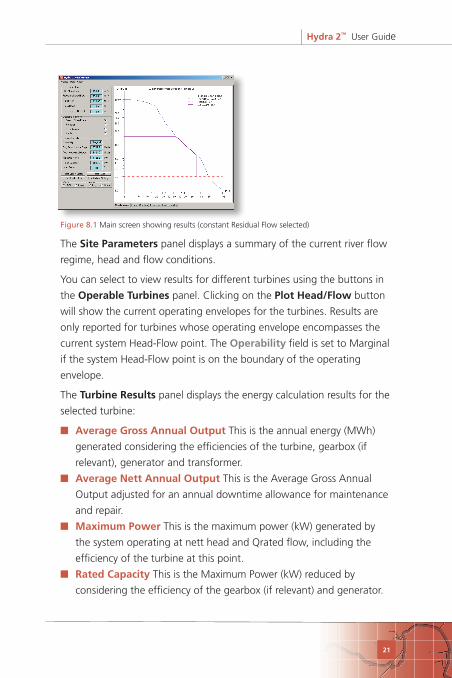
Figure 8.1� Main screen showing results (constant Residual Flow selected)
The Site Parameters panel displays a summary of the current river flow
regime, head and flow conditions.
You can select to view results for different turbines using the buttons in
the Operable Turbines panel. Clicking on the Plot Head/Flow� button
will show the current operating envelopes for the turbines. Results are
only reported for turbines whose operating envelope encompasses the
current system Head-Flow point. The Operability field is set to Marginal
if the system Head-Flow point is on the boundary of the operating
envelope.
The Turbine Results panel displays the energy calculation results for the
selected turbine:
■ Average Gross Annual Output This is the annual energy (MWh)
generated considering the efficiencies of the turbine, gearbox (if
relevant), generator and transformer.
■ Average Nett Annual Output This is the Average Gross Annual
Output adjusted for an annual downtime allowance for maintenance
and repair.
■ Maximum Pow�er This is the maximum power (kW) generated by
the system operating at nett head and Qrated flow, including the
efficiency of the turbine at this point.
■ Rated Capacity This is the Maximum Power (kW) reduced by
considering the efficiency of the gearbox (if relevant) and generator.
Hydra 2™ User Guide
22
■ Load Factor Describes the proportion of the year that the system
operates at full power. Economically viable mini-hydro schemes
typically have Load Factors between 50% to 70% (BHA, 2005). The
value is calculated as:
Load Factor = (Ave Nett Ann Output ×1000) / (Rated Capacity × 8760)
where Ave Nett Ann Output is in (MWh) and Rated Capacity is in (kW).
The higher the Qprovrtd value chosen, the smaller fraction of the year
that the system will operate at maximum capacity. There is a trade-off
between selecting a higher system flow (with an associated lower Load
Factor but higher turbine costs) and a lower system flow which means
that the (less expensive) turbines will work at maximum capacity for more
of the year (a higher Load Factor).
You can choose to reset the Head or Flow conditions by selecting the
Reset Qres / Qrated or Reset Head buttons.
The Edit Turbine Settings button enables you to edit the efficiency and
downtime parameters used for each turbine. Your edits can be saved as
defaults for use in subsequent projects.
Three plot windows display different information regarding the current
scheme and the currently selected turbine.
■ The Flow� Duration plot shows the river regime FDC, the residual flow
(Qres), the provisional rated flow (Qprovrtd), minimum flow (Qmin)
and the generating flow. This plot window illustrates the usable flow
envelope which generates energy against the river flow regime and
flow conditions.
■ The Energy Duration plot illustrates the distribution of gross energy
generated within a year.
■ The Energy vs Flow� Probability plot illustrates how much energy
(gross) is generated when the river regime is running at each flow
percentile.
Note You can copy the image from each of the plot windows to the
clipboard by a double L-click with the mouse. You can then paste them
into documents etc.
Hydra 2™ User Guide
23
8.1 Working w�ith Hydra 2 project filesThe Save project option under the Project menu enables you to save
the current data as a project file. You can recall project files when starting
up the software and switch from one project file to another using the
Sw�itch project option under the Project menu.
Note If you edit the project files manually ‘outside’ the software this may
result in corruption of the files and instability in the power generation
algorithms.
8.2 ExportingThe Export option under the Project menu on the Main screen enables
up to three types of data to be copied to the clipboard and subsequently
pasted into documents/spreadsheets etc.
■ Choosing Energy generation summary will enable you to copy the
data from the Turbine Results panel, for all operable turbines.
■ The Flow� / energy-duration details for current turbine… will
copy the flow regime FDC, and flow condition lines from the Flow�
Duration plot window for the currently selected turbine.
■ If detailed headloss calculations have been performed you will be able
to choose the option Head loss details which will copy summary
data relating to your definition of headlosses in system components.
The Help / About menu provides access to the software documentation.
Hydra 2™ User Guide
24
8.3 Turbine dataThe turbines included in the software are shown below, together with
typical design head ranges.
Turbine Type Typical Design Head (m) (BHA, 2005)
Pelton Impulse >50m (High)
Turgo Impulse >10m (Medium to High)
Crossflow (or Banki) Impulse <50m (Low to Medium)
Kaplan Reaction <10m (Low)
Semi Kaplan Reaction <10m (Low)
Francis (Open flume) Reaction <10m (Low)
Francis (Spiral case) Reaction 10–50m (Medium)
Propeller Reaction <10m (Low)
MPCL Archimedean Screw Reaction <10m (Low)
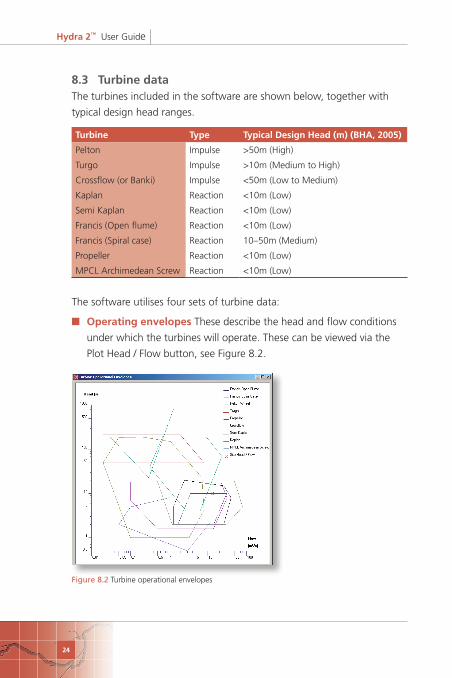
The software utilises four sets of turbine data:
■ Operating envelopes These describe the head and flow conditions
under which the turbines will operate. These can be viewed via the
Plot Head / Flow button, see Figure 8.2.
Figure 8.2� Turbine operational envelopes
Hydra 2™ User Guide
25
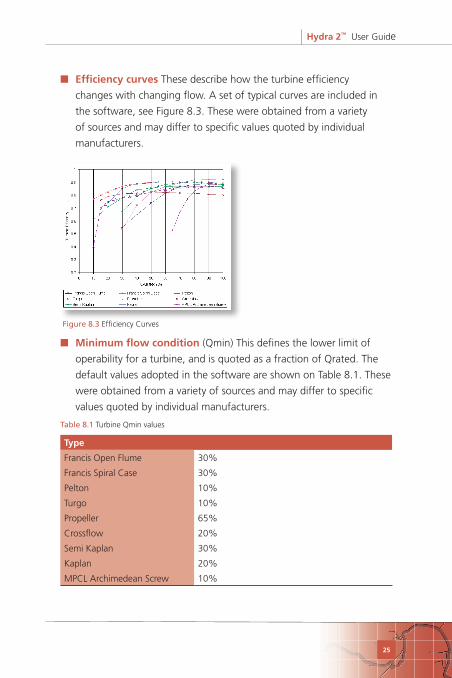
■ Efficiency curves These describe how the turbine efficiency
changes with changing flow. A set of typical curves are included in
the software, see Figure 8.3. These were obtained from a variety
of sources and may differ to specific values quoted by individual
manufacturers.
Figure 8.3 Efficiency Curves
■ Minimum flow� condition (Qmin) This defines the lower limit of
operability for a turbine, and is quoted as a fraction of Qrated. The
default values adopted in the software are shown on Table 8.1. These
were obtained from a variety of sources and may differ to specific
values quoted by individual manufacturers.
Table 8.1� Turbine Qmin values
Type
Francis Open Flume 30%
Francis Spiral Case 30%
Pelton 10%
Turgo 10%
Propeller 65%
Crossflow 20%
Semi Kaplan 30%
Kaplan 20%
MPCL Archimedean Screw 10%
Hydra 2™ User Guide
26
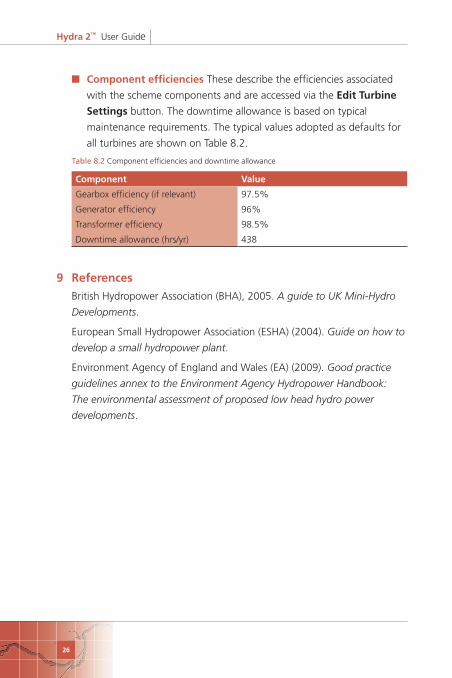
■ Component efficiencies These describe the efficiencies associated
with the scheme components and are accessed via the Edit Turbine
Settings button. The downtime allowance is based on typical
maintenance requirements. The typical values adopted as defaults for
all turbines are shown on Table 8.2.
Table 8.2� Component efficiencies and downtime allowance
Component Value
Gearbox efficiency (if relevant) 97.5%
Generator efficiency 96%
Transformer efficiency 98.5%
Downtime allowance (hrs/yr) 438
9 References
British Hydropower Association (BHA), 2005. A guide to UK Mini-Hydro
Developments.
European Small Hydropower Association (ESHA) (2004). Guide on how to
develop a small hydropower plant.
Environment Agency of England and Wales (EA) (2009). Good practice
guidelines annex to the Environment Agency Hydropower Handbook:
The environmental assessment of proposed low head hydro power
developments.
Hydra 2™ User Guide
27
10 Glossary
10.1 General conceptsFlow� duration curves The flow duration curve (FDC) illustrates the
percentage of time a particular river flow is equalled or exceeded. A
popular design statistic is the Q95 flow; this is the flow that is equalled
or exceeded for 95% of the time. The flow duration curve is therefore an
inverse cumulative frequency diagram of flow values.
A FDC is commonly plotted with the x-axis expressed as a probability
axis and the logarithm of flow shown on the y-axis. It is also common
practice, when comparing the flow duration curves for two or more
catchments, to express the individual catchment daily flows on the FDC as
a percentage of the long-term mean flow for the catchment (%MF). This
removes the majority of the influence of hydrological scale (how large
and how wet the catchment is).
Flow-duration statistics are commonly used to describe the dependability
of flows for hydropower development. FDCs can be derived from
observed data for gauged catchments, using software such as HydroTools.
Where no gauged data is available, FDCs may be estimated by a variety of
techniques including the regional hydrological model deployed within the
LowFlows software suite.
10.2 Flow� definitionsMean flow� The annual mean flow (MF) of a catchment is the average
flow generated from a catchment over a year. For gauged catchments,
this could be calculated from observed daily flow records. It could also
be estimated from hydrological models such as those included in the
LowFlows software suite.
Provisional rated flow� (Qprovrtd) is the initial estimate of the maximum
flow available to generate power. Typically this is set to the catchment
annual mean flow but this may vary with regulatory requirements.
Residual flow� (Qres) defines the flows which cannot be used to
generate power and must be left in the river to support downstream
Hydra 2™ User Guide
28
requirements. Within Hydra 2, Qres can be set as constant across the flow
regime or can be set to vary at specific flow percentiles.
Rated flow� (Qrated) This is the difference between Qprovrtd and
Qres and hence defines the design flow for the hydropower scheme.
All components of the scheme (intake, penstock, turbine etc.) will be
designed to operate optimally at this flow rate.
Minimum flow� (Qmin) This is the minimum flow at which a turbine
can operate. Qmin is defined as a fraction of the Qrated, typically 20%
to 30% depending on the turbine. The Qmin line on the Flow Duration
plot window defines the lower boundary of the flow envelope used to
generate power for the current system.
Generating flow� The generating flow shown on the Flow Duration
plot window defines the upper boundary of the flow envelope used to
generate power for the current system.
10.3 Headloss calculationsTrashrack calculations A trashrack is used to screen for debris at the
intake structure to protect the turbines. The headloss through a trashrack
is calculated as described in ESHA (2004) using the Kirschmer equation
which assumes the trashrack is perpendicular to the flow direction. The
cleaner coefficient defaults to 0.8 which is appropriate if the trashrack
has automatic cleaners. The inlet velocity to the trashrack should
typically be in the range of 0.25m/s to 1.0m/s and may be dependent on
requirements of the fish species occurring in the river, see EA (2009). The
bar shape coefficient describes the shape of the trash rack bars (in cross
section) and range from 2.4 for a rectangular shape (high resistance to
flow) to 0.8 for a rounded leading edge and tapered trailing edge (low
resistance to flow), see ESHA (2004) for more details.
Estimate of minimum pipe diameter An estimate of the minimum
pipe diameter for a penstock section is made assuming that it is desirable
to limit the friction losses in that pipe section to 4% of the gross head.
This is a typical first-pass assumption for small hydropower schemes
(ESHA, 2004).
Hydra 2™ User Guide
29
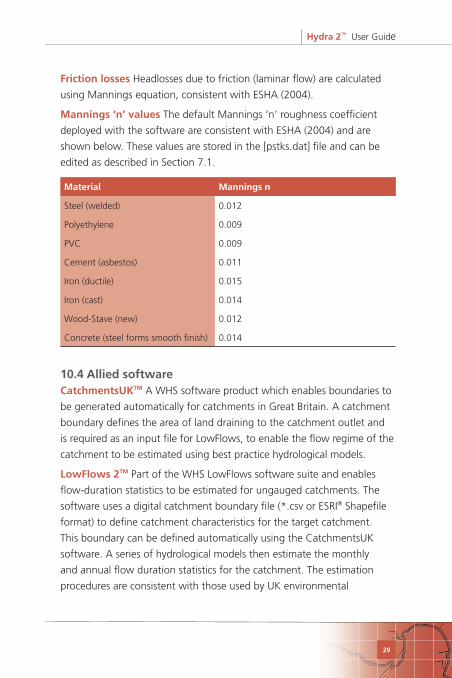
Friction losses Headlosses due to friction (laminar flow) are calculated
using Mannings equation, consistent with ESHA (2004).
Mannings ‘n’ values The default Mannings ‘n’ roughness coefficient
deployed with the software are consistent with ESHA (2004) and are
shown below. These values are stored in the [pstks.dat] file and can be
edited as described in Section 7.1.
Material Mannings n
Steel (welded) 0.012
Polyethylene 0.009
PVC 0.009
Cement (asbestos) 0.011
Iron (ductile) 0.015
Iron (cast) 0.014
Wood-Stave (new) 0.012
Concrete (steel forms smooth finish) 0.014
10.4 Allied softw�areCatchmentsUKTM A WHS software product which enables boundaries to
be generated automatically for catchments in Great Britain. A catchment
boundary defines the area of land draining to the catchment outlet and
is required as an input file for LowFlows, to enable the flow regime of the
catchment to be estimated using best practice hydrological models.
Low�Flow�s 2TM Part of the WHS LowFlows software suite and enables
flow-duration statistics to be estimated for ungauged catchments. The
software uses a digital catchment boundary file (*.csv or ESRI® Shapefile
format) to define catchment characteristics for the target catchment.
This boundary can be defined automatically using the CatchmentsUK
software. A series of hydrological models then estimate the monthly
and annual flow duration statistics for the catchment. The estimation
procedures are consistent with those used by UK environmental
Hydra 2™ User Guide
30
regulators. The flow estimate file produced by LowFlows 2 can be directly
imported into Hydra 2 to define the river flow regime for hydropower
analysis.
HydroToolsTM A WHS software product which provides a comprehensive
suite of tools for analysing river flow data to support both water resource,
hydropower and flood management design. Flow-duration statistics,
flow frequency (low and high flows) analysis and base flow separation
can be performed on data sets of gauged flows. The software includes a
convenient database for archiving hydrometric data.

Hydra 2™ User Guide
31

© Wallingford HydroSoutions Ltd 2011. All rights reserved.
www.hydrosolutions.co.uk