Embed Size (px)
Citation preview

Estimating Food and Drink Elasticities
Richard Tiffin, Kelvin Balcombe, Matthew Salois, Ariane Kehlbacher
November 23, 2011

Contents
Executive Summary 4
1 Project Overview 7
2 Literature Review 82.1 Data . . . . . . . . . . . . . . . . . . . . . . . . . . . . . . . . . . . . . . . 82.2 Model selection . . . . . . . . . . . . . . . . . . . . . . . . . . . . . . . . . 82.3 The dynamic and household level AIDS . . . . . . . . . . . . . . . . . . . . 102.4 Applications of the AIDS to food demand in Europe . . . . . . . . . . . . . 102.5 The National Food Survey 2000 . . . . . . . . . . . . . . . . . . . . . . . . 11
3 Part I: Dynamic AIDS Model 143.1 Interpretation of Results from the DAIDS Model . . . . . . . . . . . . . . . 14
3.1.1 Results of the Food and non-Food Model . . . . . . . . . . . . . . . 153.1.2 Results of the Level 1 Model . . . . . . . . . . . . . . . . . . . . . . 16
4 Part II: Household Level AIDS Model 204.1 Elasticity Computation . . . . . . . . . . . . . . . . . . . . . . . . . . . . . 20
4.1.1 Price and expenditure elasticities . . . . . . . . . . . . . . . . . . . 204.1.2 Nutrient elasticities . . . . . . . . . . . . . . . . . . . . . . . . . . . 21
4.2 Data and Aggregation . . . . . . . . . . . . . . . . . . . . . . . . . . . . . 214.3 Model Evaluation . . . . . . . . . . . . . . . . . . . . . . . . . . . . . . . . 22
5 Interpretation of Results from the Household Level AIDS Model 235.1 Level 1 Model . . . . . . . . . . . . . . . . . . . . . . . . . . . . . . . . . . 245.2 Level 2 Models . . . . . . . . . . . . . . . . . . . . . . . . . . . . . . . . . 265.3 Level 3 Models . . . . . . . . . . . . . . . . . . . . . . . . . . . . . . . . . 305.4 Subsamples . . . . . . . . . . . . . . . . . . . . . . . . . . . . . . . . . . . 335.5 Nutrient elasticities . . . . . . . . . . . . . . . . . . . . . . . . . . . . . . . 375.6 Fruits and vegetable demand . . . . . . . . . . . . . . . . . . . . . . . . . . 395.7 Meat demand of low income households . . . . . . . . . . . . . . . . . . . . 41
6 Comparison with the National Food Survey 2000 44
7 Policy Scenarios 457.1 Scenario I: A fruit and vegetables subsidy of five percent and its effect on
low income households . . . . . . . . . . . . . . . . . . . . . . . . . . . . . 457.2 Scenario II: A change in price of dairy and eggs . . . . . . . . . . . . . . . 477.3 Scenario III: A short run shock to the price of the meat group . . . . . . . 487.4 Scenario IV: A demand side shock based on an e-coli food scare . . . . . . 497.5 Scenario V: A supply side shock based on a failed wheat harvest . . . . . . 49
Glossary 52
Appendices 54
A The Almost Ideal Demand System 63
1
B The Infrequency of Purchase Model 64
C Bayesian Inference 67
D Sample Sizes 71
E Censoring 72
F Significance 78
G Uncompensated Elasticity Estimates 85G.1 Level 1 . . . . . . . . . . . . . . . . . . . . . . . . . . . . . . . . . . . . . . 85G.2 Level 2 . . . . . . . . . . . . . . . . . . . . . . . . . . . . . . . . . . . . . . 88G.3 Level 3 . . . . . . . . . . . . . . . . . . . . . . . . . . . . . . . . . . . . . . 115G.4 Subsamples . . . . . . . . . . . . . . . . . . . . . . . . . . . . . . . . . . . 129
H Compensated Elasticity Estimates 147H.1 Level 1 . . . . . . . . . . . . . . . . . . . . . . . . . . . . . . . . . . . . . . 147H.2 Level 2 . . . . . . . . . . . . . . . . . . . . . . . . . . . . . . . . . . . . . . 149H.3 Level 3 . . . . . . . . . . . . . . . . . . . . . . . . . . . . . . . . . . . . . . 161H.4 Subsamples . . . . . . . . . . . . . . . . . . . . . . . . . . . . . . . . . . . 174
I Nutrient Elasticity Estimates 193
2
List of Tables
1 Different types of AIDS models . . . . . . . . . . . . . . . . . . . . . . . . 72 Short and Long run elasticities - Food & Non-Food Model . . . . . . . . . 163 DAIDS parameter estimates - Level 1 . . . . . . . . . . . . . . . . . . . . . 184 Long run elasticity estimates - Level 1 . . . . . . . . . . . . . . . . . . . . 195 Short run elasticity estimates - Level 1 . . . . . . . . . . . . . . . . . . . . 196 Aggregation of food groups . . . . . . . . . . . . . . . . . . . . . . . . . . . 227 Own price elasticities - Level 1 . . . . . . . . . . . . . . . . . . . . . . . . . 248 Cross price elasticities - Level 1 . . . . . . . . . . . . . . . . . . . . . . . . 259 Expenditure elasticities - Level 1 . . . . . . . . . . . . . . . . . . . . . . . 2610 Own price elasticities - Level 2 . . . . . . . . . . . . . . . . . . . . . . . . . 2711 Cross price elasticities - Level 2 . . . . . . . . . . . . . . . . . . . . . . . . 2812 Expenditure elasticities - Level 2 . . . . . . . . . . . . . . . . . . . . . . . 3013 Own price elasticities - Level 3 . . . . . . . . . . . . . . . . . . . . . . . . . 3114 Cross price elasticities - Level 3 . . . . . . . . . . . . . . . . . . . . . . . . 3215 Expenditure elasticities - Level 3 . . . . . . . . . . . . . . . . . . . . . . . 3216 Own price elasticities - Subsamples . . . . . . . . . . . . . . . . . . . . . . 3417 Cross price elasticities - Subsamples . . . . . . . . . . . . . . . . . . . . . . 3518 Expenditure elasticities - Subsamples . . . . . . . . . . . . . . . . . . . . . 3719 Selected nutrient elasticities - 2001/02 . . . . . . . . . . . . . . . . . . . . 3820 Own price elasticities of fruits and vegetables . . . . . . . . . . . . . . . . . 3921 Cross price elasticities of other food groups and fruits & nuts . . . . . . . . 4022 Cross price elasticities of other food groups and vegetables . . . . . . . . . 4023 Expenditure elasticities of fruits and vegetables . . . . . . . . . . . . . . . 4124 Compensated cross price elasticities of selected fresh fruits and veg. . . . . 4125 Expenditure and own price elasticities for meat of low income households
and total sample . . . . . . . . . . . . . . . . . . . . . . . . . . . . . . . . 4226 Cross price elasticities between other food groups and meat . . . . . . . . . 4327 Compensated cross price elasticities of different meats - Total sample . . . 4428 Comparison of selected own price elasticities . . . . . . . . . . . . . . . . . 4529 Uncompensated Elasticities - Households in lowest income quintile 2009 . 4630 Conditional uncompensated Elasticities - Level 1: 2009 . . . . . . . . . . . 4731 Selected Nutrient elasticities - 2009 . . . . . . . . . . . . . . . . . . . . . . 4832 Nutrient elasticities for the Dairy & Egg group - 2009 . . . . . . . . . . . 4833 Short run compensated cross price elasticities of meat and other food groups 4934 Unconditional uncompensated price and expenditure elasticities . . . . . . 51
3

Executive Summary
The health and social impacts of food consumption have risen up the policy agenda. Ro-bust and detailed evidence is now needed on how consumption of different foods is relatedto food prices and household expenditure. In order to be able to model the effects of dif-ferent scenarios on food and drink purchases by different population groups Defra needsupdated and detailed evidence on how UK consumers’ food and drink purchases respondto food price and expenditure changes, using existing Family Food Module of the LivingCosts and Food Survey data. This data was chosen because it is publicly available andwhich means that the elasticity estimates provided in this report are open to verification.
The National Food Survey 2000 reports estimates of elasticities of demand using FamilyFood data. The approach it uses to estimate these elasticities is now recognised to beoutdated from both an economic and statistical point of view. Overcoming these short-comings, this project provides a set of new food demand elasticities that give informationon how changes in food prices and food expenditure affect food consumption by the UKpopulation and relevant subgroups. In addition, a set of elasticities is provided that showhow changes in food prices and food expenditure affect the intake of various nutrients bythe UK population.
The literature review critically examines different models that can be used to estimate de-mand elasticities, namely the Linear and Quadratic Expenditure System, the Rotterdammodel and the Almost Ideal Demand System (AIDS). An advantage of the Rotterdamand the AIDS model is that they allow theoretical restrictions to be tested statisticallyrather than imposing them directly on the functional form. Several studies that comparethe AIDS with other models find the former to be the preferred model. Accordingly, nu-merous applications of the dynamic and the static version of the AIDS model have beenapplied to food demand analysis in Europe. An application of the AIDS to food demandin the UK is the National Food Survey 2000. It has some shortcomings with regard to theway it handles zero purchases and the imposition of curvature on the underlying demandfunction. This project intends to overcome these shortcomings by using the Infrequencyof Purchase Model approach and employing Bayesian estimation procedures.
The first part of the project involves providing Defra with a robust model (presentedin Part I) for use with aggregated time series data and the means to use it to calculatedemand elasticities based on new data as it becomes available from the Family FoodModule of the Living Costs and Food Survey. Defra has been provided with code to runthe dynamic AIDS using GAUSS software and with the according documentation of themodel. Defra is now in a position to obtain short run and long run elasticities for specificproduct categories and subsamples such as low income households. If new data pointsbecome available these can be easily included in the model to keep it up to date. Thelimitation of this model arises from the fact that it assumes that preferences do not changeover time and that the rate at which the food shares return to their equilibrium is set tobe common across each of the goods.
The dynamic AIDS (DAIDS) in part I of the project provides information on the ex-tent to which changes in prices and food expenditure influence consumption over timewhilst accounting for habit formation and inventory adjustments, i.e. households con-
4
suming from stocks. The results can be used to simulate policy scenarios that focus onhow demand changes in the short and long run in response to price changes. An ap-plication of the DAIDS to demand for food and non-food items finds that consumers’responsiveness to changes in the price of non-food items in the long run is very similar tothat in the short run. Moreover, we find that an increase in the price of non-food itemsand the resultant decrease in real income lead households to reduce their food consump-tion. The application of the DAIDS to the seven main food groups including dairy & eggproducts, meat, fish, fats & starches, fruit, vegetables and alcohol, finds that expenditureshares for all food groups except meat are affected by seasonality. Furthermore, we findthat if the prices of fruits & nuts, alcohol and dairy & egg products increase consumersappear to continue buying these products out of habit despite their higher prices and onlyin the long run they make the effort to look for cheaper alternatives. Another finding isthat as food expenditure rises demand for meat and alcohol rises whereby the demandincrease is stronger in the long run than in the short run. The converse is true in the caseof the fish, fruits & nuts and vegetable group, demand for which increases more in theshort run then in the long run if food expenditure rises.
In part II of the project we estimate the household level AIDS using Family Food Moduleof the Living Costs and Food Survey data for the years 2001/02 to 2009. The householdlevel AIDS measures the extent to which food price differences influence differences infood consumption between households that are identical in all respects other than theprice they face or the food expenditure they have at their disposal. We provide elasticityestimates for Government regions and specific groups at risk of social exclusion such aslow income households and households with children. We adopt a hierarchical approachto the estimation of elasticities where at the highest level foods are grouped into broadcategories but in lower levels these will be disaggregated into nutritionally meaningfulgroupings. The detailed coverage of the categories currently available in the Family FoodModule of the Living Costs and Food Survey data in the estimation allows us to ex-amine how food demand responds to changes in the prices of specific food groups. Wealso provide nutrient elasticities that show how households’ intake of various nutrients isaffected by differences in food prices and in food expenditure. The demand and nutrientelasticity estimates provided in this part of the project can be used to model the effectsof different scenarios on food and drink purchases by different population groups in theUK; the precision of the elasticity estimates can be assessed through their standard errors.
One focus of this project is on fruit and vegetable consumption. We find that differ-ences in the own prices of fruits and vegetables tend to have a stronger effect on fruitconsumption than on vegetable consumption. We find that the diet of households whoface a lower price for fresh vegetables is better in terms of quantity of fresh vegetablesconsumed than that of identical households that face higher prices for fresh vegetables.The same applies but to a lesser extent to the price of fresh fruits and fruit consumption.Furthermore, households increase their consumption of fish and meat products at the ex-pense of their fruit consumption, if faced with lower prices for fish and meat products. Iffaced with higher prices for fresh fruits, consumers substitute them with canned fruits andjuice and likewise if faced with higher vegetable prices they substitute them with cannedproduce. The expenditure elasticities reveal that differences in income and therefore infood expenditure result in comparatively larger differences between households in termsof their consumption of vegetables and comparatively smaller differences between house-
5
holds in terms of their consumption of fruits. Overall, compared to other food groupsincome has a relatively small impact on the composition of households’ diet with regardto fruits and vegetables.
Another focus of this project is on meat demand in low income households. We findthat the expenditure elasticities for meat of low income households tend to be for mostyears lower than those of the total UK population. Because the expenditure elasticitiesexplain to what extent differences in household expenditure explain differences in meatdemand we conclude that meat consumption by low income households is less affectedby changes in income than it is the case for the total UK population. Moreover, thedifference in terms of quantity of meat consumed between households that face differentmeat prices but are otherwise identical is larger in the case of low income households.Another finding is that meat consumption of low income households is less affected bydifferences in meat prices than is meat consumption by UK households. Finally, low in-come households facing higher alcohol prices consume more meat substituting alcohol formeat, whereas UK households in the same situation have a lower meat consumption; andif beef prices are high consumers substitute white meat for red meat.
To measure the impact of price and food expenditure changes on households’ nutrientintake we obtain nutrient demand elasticities. A key finding with regard to these nutrientelasticities is that differences in the prices of fats & starch products and of dairy & eggproducts result in large differences between otherwise identical households with regardto their intake of fats and energy on the one hand but also on their intake of importantvitamins and micronutrients on the other hand. This means that while higher prices forthese food groups would lead to households consuming less fat and energy, they wouldalso consume less vitamins and micronutrients so that the overall effect of a higher pricesfor dairy & egg products and fats & starches is ambiguous.
The last part of the report contains a set of five policy scenarios providing examplesto Defra on how to use the elasticity estimates obtained from the dynamic AIDS modeland the household level AIDS model in the simulation of different policy scenarios.
To aid the understanding of this report, a glossary is enclosed.
6
1 Project Overview
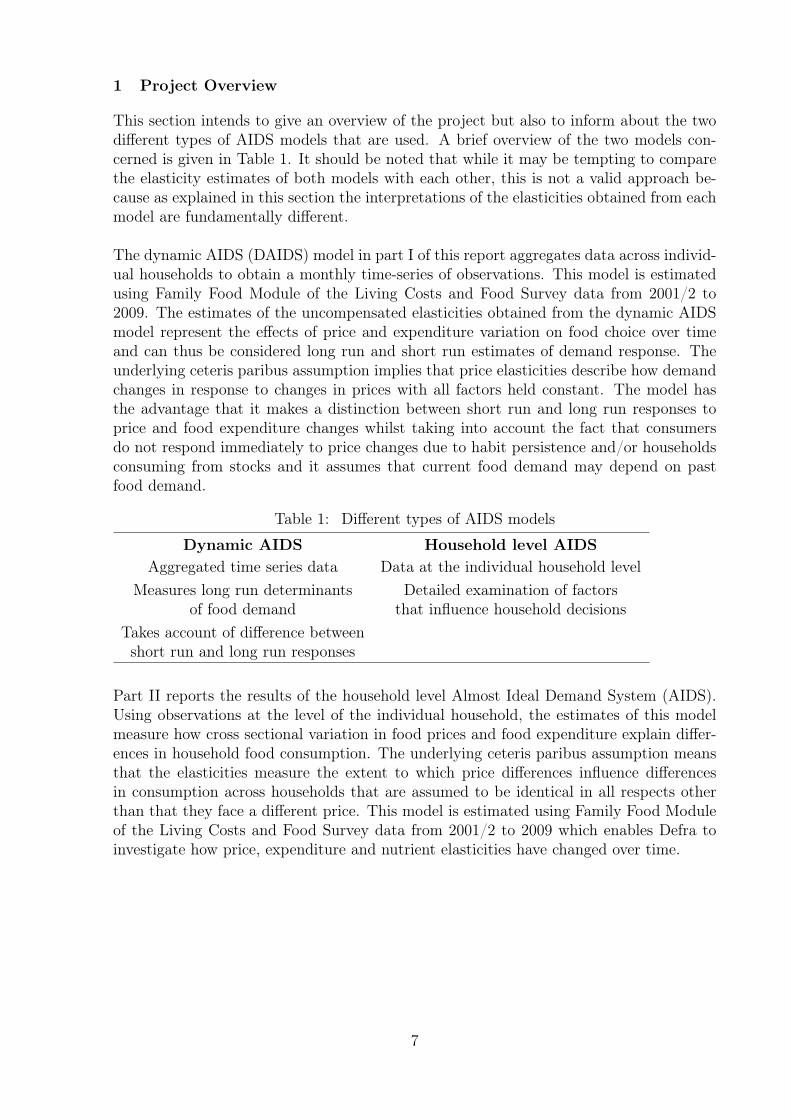
This section intends to give an overview of the project but also to inform about the twodifferent types of AIDS models that are used. A brief overview of the two models con-cerned is given in Table 1. It should be noted that while it may be tempting to comparethe elasticity estimates of both models with each other, this is not a valid approach be-cause as explained in this section the interpretations of the elasticities obtained from eachmodel are fundamentally different.
The dynamic AIDS (DAIDS) model in part I of this report aggregates data across individ-ual households to obtain a monthly time-series of observations. This model is estimatedusing Family Food Module of the Living Costs and Food Survey data from 2001/2 to2009. The estimates of the uncompensated elasticities obtained from the dynamic AIDSmodel represent the effects of price and expenditure variation on food choice over timeand can thus be considered long run and short run estimates of demand response. Theunderlying ceteris paribus assumption implies that price elasticities describe how demandchanges in response to changes in prices with all factors held constant. The model hasthe advantage that it makes a distinction between short run and long run responses toprice and food expenditure changes whilst taking into account the fact that consumersdo not respond immediately to price changes due to habit persistence and/or householdsconsuming from stocks and it assumes that current food demand may depend on pastfood demand.
Table 1: Different types of AIDS models
Dynamic AIDS Household level AIDS
Aggregated time series data Data at the individual household level
Measures long run determinants Detailed examination of factorsof food demand that influence household decisions
Takes account of difference betweenshort run and long run responses
Part II reports the results of the household level Almost Ideal Demand System (AIDS).Using observations at the level of the individual household, the estimates of this modelmeasure how cross sectional variation in food prices and food expenditure explain differ-ences in household food consumption. The underlying ceteris paribus assumption meansthat the elasticities measure the extent to which price differences influence differencesin consumption across households that are assumed to be identical in all respects otherthan that they face a different price. This model is estimated using Family Food Moduleof the Living Costs and Food Survey data from 2001/2 to 2009 which enables Defra toinvestigate how price, expenditure and nutrient elasticities have changed over time.
7

2 Literature Review
Demand models provide information regarding the ways in which consumers will respondto changes in prices, income, and their socio-demographic circumstances. Moreover, theyassist in the evaluation of supply side shocks and of policy interventions that are designedto address these problems such as interventions that are targeted at particular socio-demographic groups or more general instruments, such as taxes or subsidies on certainfoods. This section critically discusses the different approaches that can be used to obtainfood demand elasticities. It inform understanding of existing evidence and the choice ofmodel that is used in this study to estimate price and expenditure elasticities. The basisfor literature selected in this review has been the expert knowledge of the research team.
2.1 Data
Different kinds of data can be used to estimate food price and expenditure elasticities inthe UK. One example is scanner data as provided by Kantar Worldpanel. This kind ofdata allows disaggregation at a very high level, for example, according to product brands.For the purpose of this study, however, the Family Food Module of the Living Costs andFood Survey data are entirely sufficient and the fact that the data sets for each year arepublicly available means that the elasticity estimates obtained are open to verification.
2.2 Model selection
Empirical studies on demand modelling in the past were based on single equation meth-ods, which suffer from specific limitations. Single equation models fail to recognise thatdecisions on how to allocate the budget between different goods are taken simultaneouslyand are therefore connected. Recognising this and formally incorporating an economicmodel leads to a set of restrictions. Imposing these on the model and estimating theequations jointly so as to recognise the correlation between decisions regarding differentgoods leads to an increase in efficiency. The linear expenditure system developed by Stone[1954] to represent household demand for various goods overcomes these limitations byincluding a group of equations, one for each good, in the system and estimating themsimultaneously. A restrictive and somewhat unrealistic assumptions of the linear expen-diture system is that marginal budget shares are independent of the level of expenditure,so that rich households and poor households spend the same fraction of an extra poundon each good. Specifying demand systems quadratic in expenditure as does the QuadraticExpenditure System by Howe et al. [1979] relaxes the assumption that demand systemsare linear in expenditure [Pollak and Wales, 1994]. A study that compares the QuadraticExpenditure System with the AIDS model has been carried out by Katchova and Chern[2004]. Analysing the value and significance of the common coefficient of the two models,they find the AIDS to be a more suitable model than the Quadratic Expenditure System.
Both, the linear expenditure system and its generalisation, the quadratic expendituresystem, are derived by algebraically imposing the theoretical restrictions of adding up,homogeneity, symmetry and negativity on a particular functional form. According toDeaton and Muellbauer [1980] an alternative approach is to to use restrictions statisticallywhich means that economic theory is validated by subjecting the theoretical restrictionsto statistical tests. The Rotterdam Model and the AIDS are both models that can beestimated with theoretical restrictions easily imposed by the researcher on the parameters
8
and statistically tested.
The Rotterdam model proposed by Barten [1964] and Theil [1965] uses Marshallian andHicksian demand functions. Unlike the AIDS model which uses logarithms, the Rotter-dam model uses differentials. Limitations of the Rotterdam model are that it does notsatisfy integrability conditions which are necessary to derive the fundamental demandequations [Brown and Deaton, 1972, pp.1160-64] and that it imposes constant budgetshares meaning that income elasticities do not change as income changes.
The AIDS model can be used to generate systems of demand equations that can beestimated over broadly defined groups of commodities. Budget shares are not assumedconstant thus income elasticities change with income changes. Of all simultaneous de-mand equations systems, the AIDS by Deaton and Muellbauer [1980] has proved mostpopular in the analysis of consumer behaviour since its inception in 1980. The modelhas become a staple of demand theory and has been used in numerous empirical studies.The reasons for the popularity of the AIDS are that it is derived from a formal economicmodel of consumer behaviour; homogeneity and symmetry restrictions depend only on theestimated parameters and are therefore easily tested and/or imposed; it gives an arbitraryfirst-order approximation to any demand system; it satisfies the axioms of choice exactly;it aggregates perfectly across consumers without invoking parallel linear Engel curves; andit has a functional form which is consistent with known household-budget data [Deatonand Muellbauer, 1980, Alston and Chalfant, 1993, Eales and Unnevehr, 1994].
The Rotterdam Model and the AIDS are similar in that they are both locally flexiblefunctional forms meaning that they are both capable of providing a second order approx-imation to the behaviour of any theoretically plausible demand system at a point in theprice-expenditure space. They also both have identical data requirements, are equallyparsimonious with respect to number of parameters, and are linear in parameters [Alstonand Chalfant, 1993]. The Rotterdam and the AIDS model can be used to test homogene-ity and symmetry through linear restrictions on fixed parameters, yet the AIDS has theadvantage of being explicitly derived from utility maximisation [Phlips, 1983]. Accordingto Banks et al. [1997] for goods such as food, the AIDS provides a robust description ofconsumer behaviour. A study comparing the two model has been carried out by Bar-nett and Seck [2008]. Using Monte Carlo techniques they recover the true elasticities ofdemand from the Rotterdam and AIDS model. Barnett and Seck [2008] find that theRotterdam and the fully nonlinear AIDS models perform well, when substitution amonggoods is low. They also find that the higher the level of aggregation, the lower the elas-ticity of substitution among aggregates. Therefore, when modelling consumer demand atthe aggregate level, both models may yield correct estimates of the elasticities of substi-tution and both models perform well when the elasticities of substitutions among goodsis moderately high. However, when substitution among all goods is very high, the AIDSmodel outperforms the Rotterdam model. The Rotterdam model appears better at re-covering the true elasticities, when exact aggregation within weakly separable branchesof a utility tree is implemented. When attempting to build consistent aggregates, theRotterdam appears to perform better. Within weakly separable branches of the utilitytree, the non linear AIDS model may classify substitutes as complements or overestimatethe elasticities of substitution among goods [Barnett and Seck, 2008]. In a study by Al-ston and Chalfant [1993] the AIDS model is rejected in favour of the Rotterdam model.
9
These findings are, however, refuted by Lafrance [1998] who shows that the least squarestest used by Alston and Chalfant is biased. Another study comparing the AIDS and theRotterdam model was carried out by Erkan [2006]. Using a model selection procedure byAmemiya [1985] the author concludes that the AIDS is superior to the Rotterdam model.Investigating consumer demand in Taiwan, Lee et al. [1994] test alternative differentialdemand models combining the features of the Rotterdam model and the AIDS. Theyfind AIDS-type demand responses to describe Taiwanese consumer behaviour better thanother specifications.
2.3 The dynamic and household level AIDS
There are two different versions of the AIDS model. The static AIDS is estimated on indi-vidual household data which make use of the demographic detail and extensive variationin expenditure levels between households. It implicitly assumes that there is no differencebetween short and long run behaviour, such that the consumer is always in equilibrium.By contrast, the dynamic AIDS is estimated on time series data and makes use of thevariation in expenditure over time. It takes into account that many factors such as habitpersistence, imperfect information and incorrect expectation, often cause the consumerto be out of equilibrium until full adjustment takes place [Anderson and Blundell, 1984].The dynamic AIDS model specifies how demand system parameters change over time. Ageneral procedure for obtaining a dynamic specification of a demand system originallyproposed by Stone [1954] in the context of the linear equation system is to allow some orall of its parameters to depend on past consumption. Houthakker and Lester [1966] pro-posed and estimated a model in which past consumption influences consumption patternsthrough a state variable which they interpret as a psychological stock of habits. Blan-ciforti and Green [1983] incorporate habit effects which allows to examine the temporalrelationships between price and income elasticity estimates. They find that habit forma-tion is the reason for the autocorrelation found in the residuals of the demand equations.These type of effects can be modelled using lagged dependent variables in the dynamicregression. The inclusion of lagged dependent as independent variables further avoids theproblem of spurious regressions (regressions where the error has a trend).Time series variables that are linked by a stable long run relationship but whose differenceconstitutes a stationary time series are called cointegrated variables. Pesaran and Shin[1995] propose a cointegration approach to the estimation of the DAIDS model based onthe Vector Error Correction model. They show that this model can be used to test theexistence of a long-run relationship between underlying variables and to provide consis-tent, unbiased estimators of long-run parameters provided the AIDS model represents acointegrated relationship, where all the variables are difference stationary. However, theirapproach did not enable the imposition of curvature restrictions which are important forthe stability of sample estimates.
2.4 Applications of the AIDS to food demand in Europe
Our literature review finds several application of the dynamic AIDS models to food de-mand in Europe. Accounting for habit formation and inventory adjustments, Molina[1994] examine food demand in Spain from 1964-1989. They find that bread, cereals,meat, fish, milk and eggs are necessities where as vegetables and fruits are luxuries thoughmost of the elasticities are close to unity. Several studies have a focus on meat and/or fishdemand. [Burton, 1992] observe variation in meat and fish consumption in Britain since
10
1960. By incorporating systematic demand shifters they decompose variation in consump-tion into changes which are due to changes in relative prices and expenditure and thosewhich may be attributable to shifts in consumer preferences and find that tastes changedin recent years in favour of chicken and fish and against red meats. Likewise, Klonaris[2001] who estimate the DAIDS for meat demand in Greece, find evidence of a gradualchange in consumption in the 1980s away from beef, lamb, and mutton towards pork andchicken. Looking at retail demand for fish in the UK, Fousekis and Revell [2004] findhaddock, salmon, flatfish, shellfish, and smoked fish to be expenditure elastic, implyingthat income growth will strongly increase demand for these species. Jaffry and Brown[2008] examine demand for canned tuna in the UK between 1995 to 1999. They find allproducts to have negative and inelastic own price elasticities; tuna in brine and sauceto be a normal good, while tuna in oil was demonstrated to be a luxury good with thelatter being a substitute for tuna in sauce. Two studies examine the effects of adver-tising and food scares on food demand. A DAIDS study with a focus on the effects ofadvertising on demand for fresh vegetables in Norway by Rickertsen et al. [1995] findsno significant positive effects of advertising on vegetable consumption. Mazzocchi et al.[2006] examine the effects of the BSE crisis (1996 and 2000) and the 1999 Dioxin crisison food demand in Italy. They find that while the dioxin crisis had only a small effect onmeat consumption, the BSE scares led to a structural shift in preferences measured bya decrease in the beef expenditure share which has been absorbed by chicken expenditure.
Our literature review of applications of the static AIDS to food demand in Europe findsnumerous studies. Examples include Fulponi’s [1989] analysis of French food and meatdemand; Mergos and Donatos’s [1989] study of Greek food demand; and a study byMoro and Sckokai [2000] who use a Quadratic AIDS to investigate whether the socio-demographic structure of the population is a determinant of trends in food consumptionin Italy. Studies with reference to the UK have been carried out inter alia by Burtonet al. [1996] who use Family Expenditure Survey data for the period 1973 to 1993 tolook particularly at meat consumption by single adult households. They find the effectsof socioeconomic characteristics on meat demand to vary markedly over the period un-der investigation and trends with respect to the age and gender of the householder arediscernible. Introducing a Bayesian method of estimating multivariate sample selectionmodels Tiffin and Arnoult [2010] examine food demand in the UK whilst accounting forcensoring arising from infrequency of purchase. Their results emphasise the role played bylow incomes and socio-economic circumstances in leading to poor diets and also indicatethat the presence of children in a household has a negative impact on dietary quality.Thus, in our study we particularly look at food demand by low income households andby households with children by estimating elasticities for these two subsamples amongstothers.
2.5 The National Food Survey 2000
Like the present study, the National Food Survey 2000 reports annual estimates of elas-ticities of demand for a range of food groups in the UK until 1989. The approach used toestimate these elasticities was recognised to be inappropriate from both an economic andstatistical perspective. From the economic perspective the lack of connection to a formaleconomic model and the failure to account for the complex interrelationships that existbetween demands for related food products were recognised as being significant flaws. Thefinal report for the National Food Survey [HMSO, 2004] once again reported estimates
11
of price and income elasticities. The approach adopted sought to address the flaws thatwere identified in the earlier work by estimating an AIDS [Deaton and Muellbauer, 1980].Nevertheless, the National Food Survey 2000 does not take account of two importantissues described hereafter.
The first issue is the incidence of zero purchases, so called censoring, which occurs forsome food products and some households. The National Food Survey 2000 does not takeaccount of censoring in the demand model estimation. However, the behavioural informa-tion contained in censored observations has significant econometric as well as economicimplications. There are two explanations for why censoring might occur. The first expla-nation is that prices and/or income levels combined with consumer preferences are suchthat the good is unattractive. This is sometimes referred to as a corner solution and canbe modelled with the Tobit model [Tobin, 1958]. Studies using this approach to modelzero observations have been carried out by for example Yen [1993], Garcia and Labeaga[1996], Burton et al. [1996], Burton et al. [2000] and Aristei and Pieroni [2008].
A second explanation for censoring, which we assume in our model is that censoringoccurs in the demand system because a particular good has not been purchased by ahousehold during the time that it is surveyed as it is consuming from stocks purchasedin other time periods. This is referred to as infrequency of purchase and has been usedin several studies [Cragg, 1971, Blundell and Meghir, 1987, Tiffin and Arnoult, 2010].Whilst allowing for both infrequency of purchase as well as true corner solutions wouldbe preferable, such an approach introduces an identification problem since the source ofa zero may be either a non-purchase, a corner solution or both. Previous work on theFamily Food Module of the Living Costs and Food Survey data showed that this so calledinfrequency of purchase model approach is better to model zero observations in the Fam-ily Food Module of the Living Costs and Food Survey data than for example the tobitmodel which assumes that a good was not consumed because the combination of prices,income and preferences rendered the good unattractive [Arnoult and Tiffin, 2008]. Theinfrequency of purchase model used in this study to accommodate censoring draws onBlundell and Meghir [1987]. A detailed description of the model is given in Appendix B.The underlying assumption of the model is that latent consumption for all goods is non-zero which effectively means that we assume all censoring to be the result of infrequencyof purchase.
The second issue not addressed by the National Food Survey 2000 in the elasticity estima-tion is related to curvature of the underlying function representing demand preferences.Imposing concavity is important because its absence can lead to implausible results suchas positively sloping demand functions and unrealistic patterns of substitution. The im-position of inequality restrictions arising from the curvature in the AIDS can be difficultto deal with however, especially using classical methods. HMSO [2004] focuses on theimposition of only those restrictions that can be imposed through the use of linear equal-ities: symmetry, homogeneity and adding-up. By contrast, concavity, which necessitatesthe use of non-linear inequality restrictions, is ignored.A number of approaches to imposing curvature are reported in the literature includingthe use of constrained least squares or maximum likelihood and numerical Bayesian ap-proaches. The majority of these approaches, including Tiffin and Aguiar [1995] and Tiffinand Tiffin [1999], impose the restriction at a single point in the sample. This approach is
12

referred to as local concavity. Gallant and Golub [1984] argue that it is more reasonableto impose curvature at all of the points used in the estimation of the model whilst Terrell[1996] proposes an alternative in which curvature is imposed over a grid which covers theregion in which inferences are to be made. Tiffin et al. [2010] offer a straightforward andefficient way of handling the imposition of curvature in a way which results in adherencebeyond a single point in the sample, as advocated by Gallant and Golub [1984] makingthe model more appropriate for simulation over a range of prices and incomes.
Details of the household level AIDS model we estimate are given in Appendix A. Unlikethe National Food Survey 2000 it addresses both censoring and curvature in the estimationof the elasticities. In addition, we adopt a hierarchical approach to the estimation of elas-ticities [Edgerton, 1997]. Thus, in this report we provide more detailed information thanhas been done by the National Food Survey 2000 on how sensitive UK consumers’ pur-chases of specific food and drink product categories are to price and expenditure changes.The approach allows a more detailed coverage of the food and drink categories currentlyavailable in the Family Food Module of the Living Costs and Food Survey data. At thehighest level, foods are grouped into seven very broad categories but at lower levels theseare disaggregated into nutritionally meaningful groupings. A hierarchical approach is keyto uncovering demand reactions to food price changes, especially in the fruit and vegetableand meat groups. Cross-price elasticities in a disaggregated model may reveal importantsubstitution possibilities in these subgroups.
A recent development in the literature has been to measure the impact of price andexpenditure changes on nutrient intakes by converting the demand elasticities to nutri-ent demand elasticities. These nutrient elasticities provide information on how intake ofspecific nutrients, such as saturated fat or protein, may change as a result of changesin price and expenditure. The technique developed by Huang [1996] and Huang [1999]can be used to link the demand model to nutrient availability. The basic premise of thisapproach is that changes in the price of a particular food or in total expenditure affect theconsumption of all food items and therefore simultaneously change intakes in a variety ofdifferent nutrients.
To conclude, the AIDS model was chosen as the most appropriate model in this study be-cause as stated above it is derived from a formal economic model of consumer behaviour;homogeneity and symmetry restrictions depend only on the estimated parameters andare therefore easily tested and/or imposed; it gives an arbitrary first-order approximationto any demand system; it satisfies the axioms of choice exactly; it aggregates perfectlyacross consumers without invoking parallel linear Engel curves; and it has a functionalform which is consistent with known household-budget data. Moreover, because the Fam-ily Food Module of the Living Costs and Food Survey collects data for each householdsover a period of two weeks only there are zero observations in the data that arise becauseconsumers consume from stocks. Taking this into account, we use the infrequency ofpurchase model. Finally, to avoid implausible results such as positively sloping demandfunctions and unrealistic patterns of substitution we impose concavity using non-linearinequality restrictions.
13
3 Part I: Dynamic AIDS Model
The first part of the project consists of providing Defra with a DAIDS model and themeans to use it to calculate new price elasticities based on new data as it become avail-able. The data in the DAIDS consists of the cross sectional observations of the FamilyFood Module of the Living Costs and Food Surveys 2001/02 to 2009 aggregated overmonthly periods to give a single observation for each month which represents food con-sumption in all households in the survey. The model takes into account the fact that theresponsiveness of food demand to changes in food expenditures and food prices is notalways instantaneous. It assumes that consumers do not respond immediately to pricechanges due to habit persistence and/or inventory adjustment behaviour on the part ofconsumers and it assumes that current food demand may depend on past food demand.The DAIDS assumes that the preferences that underpin the construction of the modelare stable with respect to time. Should this be the case, then the time series approachwhich aggregates over all consumers, will provide robust estimates that characterise bothshort run and long run responses. The model provided to DEFRA is relatively easy toupdate and quick to run given new data. By providing this model, DEFRA can updatetheir estimates on a periodic basis. This model has been chosen because it is both quickand stable to estimate. Its limitations arise from the fact that it assumes that preferencesare stable over time. Moreover, the rate at which the system returns to equilibrium isset to be common across goods in each model, however, without this assumption estima-tion imposing symmetry restrictions can become intractable. Other models may, undersome circumstances, have superior or more general theoretical properties in a numberrespects. First, they may have more flexible functional forms and longer and more com-plex lag structures. Second, models may explicitly take into account stochastic trendsin the data, either by testing and imposing restrictions within a vector-autoregressiveframework. Alternatively, they may have parameters that evolve through time. However,in each case these models may require further parameters to be estimated, pretests thatdetermine the precise nature of the model for each data set, and/or may impose otherconditions that are inconsistent with the data. Such models require much more time toestimate and greater expertise by the user, and may ultimately produce less robust results.
A description of the DAIDS model, the Bayesian estimation procedure and the com-putation of elasticities is given in the DAIDS documentation which has been provided toDefra alongside the GAUSS code for Defra to run the model. Defra is now in a positionto obtain short run and long run elasticities for specific food groups and subsamples suchas low income households. Moreover, if new data points become available these can beeasily included by Defra in the model to keep it up to date.
3.1 Interpretation of Results from the DAIDS Model
To assist Defra with the interpretation of the results produced by the DAIDS model thissection discusses selected results obtained from the DAIDS model using monthly datafrom April 2001 to December 2009. The short run elasticities refer to a time period ofone month and the long run elasticities refer to a time period of a year. In general itis expected that the long run elasticities are larger than the short run elasticities. Thereason being that if the price of a product increases, consumers will at first continuebuying the product with the higher price out of habit. However, once they realise thatthe price rise is permanent they will make an effort and look for alternatives. In addition,
14

more substitutes are usually available in the long run. Hence, demand for most productsis expected to be more elastic in the long run than in the short run. The elasticitiesobtained from the DAIDS are uncompensated elasticities. For an explanation on howthese differ from the compensated elasticities the reader is referred to section 5.
3.1.1 Results of the Food and non-Food Model
The results of the DAIDS for the food and non-food groups are reported in Table 2 whichshows the short and long run uncompensated price and expenditure elasticities and theirstandard deviations. To estimate the model we use Bayesian estimation procedures whereMarkov Chain Monte Carlo (MCMC) repetitions of the estimation procedure provide aset of 10,000 individual estimates of the parameters of the model representing the range ofplausible values that are supported by the data. The MCMC approach permits precisionto be assessed through the use of standard deviations from the Monte Carlo Simulation.For a detailed description of the Bayesian estimation procedures the reader is referred toAppendix C. Figure 2 plots the number of repetitions against the ergodic means of theparameters and indicates that the model has converged. The ergodic mean is the meanof the generated values until the current iteration. A model that has converged shouldhave stationary ergodic means as depicted in Figure 1.
Figure 1: Example of a converged model with the trace plot fluctuating around a stablemean
Looking at the standard deviations, we find that with the exception of the own priceelasticity of food, the short run elasticity estimates are significantly different from zerobecause the elasticity estimates divided by their standard deviations have a t-value greaterthan 1.96. The only significant long run elasticity estimates are the own price elasticityof the non-food group and its expenditure elasticity.
15

Table 2: Short and Long run elasticities - Food & Non-Food Model
Short run elasticities Long run elasticities
Food Non-Food Expend. Food Non-Food Expend.
Food -0.073 -0.634* 0.706* Food -1.016 0.300 0.716
(0.142) (0.196) (0.135) (0.620) (0.744) (0.443)
Non-food 0.005* -0.996* 1.002* Non-Food 0.000 -1.002* 1.002*
(0.001) (0.001) (0.001) (0.004) (0.005) (0.003)
* The approximate 95% Bayesian confidence interval excluded zero.
In our discussion we focus on the significant elasticity estimates. As expected, theown price elasticities of the non-food group are larger in the long run than they are inthe short run. They indicate that demand for non-food items is own price inelastic in theshort run and own price elastic in the long run. However, the difference between the twoelasticity estimates is very small suggesting that consumers’ responsiveness to changesin the price of non-food items in the long run is very similar to that in the short run.The short run cross price elasticities further reveal that non-food and food items havea complementary relationship in the short run where a 1% increase in the price of non-food items leads to a 0.6% quantity reduction of food consumed. The large expenditureelasticity of non-food items (1.002) indicates that this reduction in food consumption ismainly due to a reduction in real income. By contrast, a change in the price of food itemsonly marginally affects demand for non-food items in the short run. The expenditureelasticities of the non-food group are the same in the long run and in the short runsuggesting that consumers’ response to changes in expenditure in terms of quantity ofnon-food items consumed is the same in the long run and in the short run. Moreover, theexpenditure elasticities indicate that non food items are expenditure elastic goods bothin the short run and in the long run meaning that spending on non-food items increasesas a proportion of real income as consumer real incomes increase. Finally, the short runexpenditure elasticities of food items indicate inelastic demand which means that evenif their real income was to increase consumers would continue to purchase significantquantities of food items where a 1% decrease in income would lead to a 0.7% reductionof the quantity of food consumed.
3.1.2 Results of the Level 1 Model
This section discusses the DAIDS results of the level 1 model which consists of the sevenmain food groups. The parameter estimates presented in Table 3 are used to compute theelasticities. All the coefficients of seasonal dummy variables (s1, ..., s11) are significant inthe budget share equations for dairy & eggs and fats & starches and they are significantfor most of the coefficients of the budget share equations of fish, fruits, vegetables andalcohol. Only the budge share equation for meat has no significant dummy variables.Hence, there is marked seasonal variation in expenditure on all food groups except formeat. The long run and short run uncompensated elasticities of the level 1 model andtheir standard deviations are reported in Tables 5 and 4, respectively. The top row showsthe food groups affected by a price change whilst the first column shows the food groupswhose quantities consumed changes as a result of a price change.
This discussion is limited to the significant elasticity estimates. In both the short run
16
and long run elasticity matrices, all own-price elasticities are negative and significant,which is consistent with economic theory. The own price elasticities further reveal thatdemand for the fruits & nuts group and for alcohol is inelastic in the short run and elasticin the long run. Similarly, while being inelastic in the short run, demand for dairy &egg products is almost unit elastic in the long run. This implies that consumers’ priceresponsiveness is stronger in the long run then in the short run in the case of fruits &nuts, alcohol and the dairy & egg products. Hence, if the price of fruits & nuts, alcoholand the dairy & egg products increases consumers may continue buying the product withthe higher price out of habit and only at a later point in time make an effort and look foralternatives.
The short run cross price elasticities between the meat group and the fats & starchesgroup are of a similar magnitude as the long-run elasticity indicating only small changesin consumers’ responsiveness to changes in the price of fats & starches between the shortand long run in terms of a change in demand for meat.
Because the Family Food Module of the Living Costs and Food Survey contains onlyinformation about the amount of money that households spend on food, we can onlyderive the expenditure elasticities. However, these do give an indication of the patternof responses that would be observed if we were measuring the impact of a difference inincome on demand though the magnitude of the response to a difference in income is likelyto be smaller than the response to a change in expenditure. The pattern of response wouldhowever be preserved. If it is assumed that the income elasticity of all food expenditure isone, the expenditure elasticities are equivalent to income elasticities. Looking at the longrun expenditure elasticities in Table 4 meat, fats & starches are all expenditure elastic,indicating that these are classified as luxury goods meaning that as household incomesincrease the demand for these food groups expands even more rapidly. Comparing shortand long run elasticities we find that the short run expenditure elasticities of the dairy &eggs group and the fats & starches group are similar to the long run elasticities indicatingthat consumer demand for these food groups changes little in response to changes in foodexpenditure between the short and long run. Demand for the meat group and for alcoholis more expenditure elastic in the long run than in the short run indicating that increasedfood expenditure leads to increased demand for meat and alcohol with the demand in-crease being stronger in the long run than in the short run. The converse is true forthe remaining food groups, fish, fruits, and vegetables, demand for which increases morein the short run then in the long run as a result of an increase in food expenditure. Itmay be the case that purchase of fish, fruits and vegetables is less a matter of habit butmore of a concious purchase decision with consumers being more aware of the existenceof substitutes.
For a comparison of these results with some of the results of the National Food Sur-vey 2000 the reader is referred to Section 6.
17
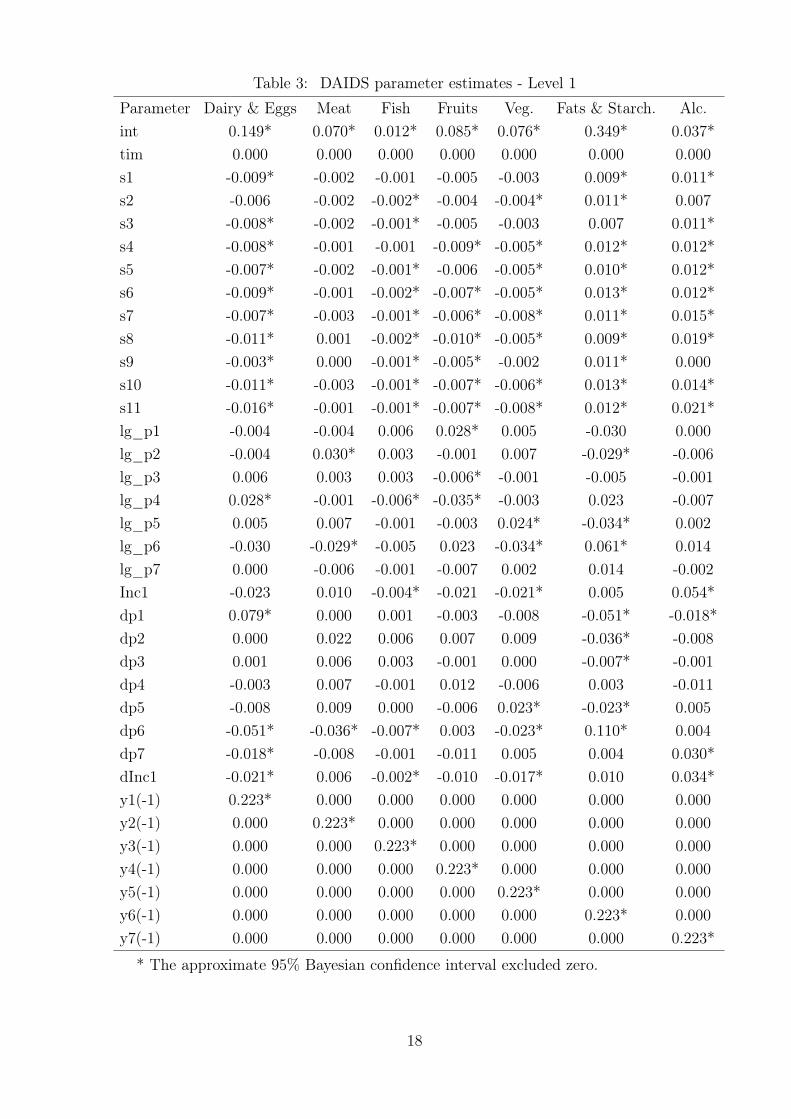
Table 3: DAIDS parameter estimates - Level 1
Parameter Dairy & Eggs Meat Fish Fruits Veg. Fats & Starch. Alc.
int 0.149* 0.070* 0.012* 0.085* 0.076* 0.349* 0.037*
tim 0.000 0.000 0.000 0.000 0.000 0.000 0.000
s1 -0.009* -0.002 -0.001 -0.005 -0.003 0.009* 0.011*
s2 -0.006 -0.002 -0.002* -0.004 -0.004* 0.011* 0.007
s3 -0.008* -0.002 -0.001* -0.005 -0.003 0.007 0.011*
s4 -0.008* -0.001 -0.001 -0.009* -0.005* 0.012* 0.012*
s5 -0.007* -0.002 -0.001* -0.006 -0.005* 0.010* 0.012*
s6 -0.009* -0.001 -0.002* -0.007* -0.005* 0.013* 0.012*
s7 -0.007* -0.003 -0.001* -0.006* -0.008* 0.011* 0.015*
s8 -0.011* 0.001 -0.002* -0.010* -0.005* 0.009* 0.019*
s9 -0.003* 0.000 -0.001* -0.005* -0.002 0.011* 0.000
s10 -0.011* -0.003 -0.001* -0.007* -0.006* 0.013* 0.014*
s11 -0.016* -0.001 -0.001* -0.007* -0.008* 0.012* 0.021*
lg_p1 -0.004 -0.004 0.006 0.028* 0.005 -0.030 0.000
lg_p2 -0.004 0.030* 0.003 -0.001 0.007 -0.029* -0.006
lg_p3 0.006 0.003 0.003 -0.006* -0.001 -0.005 -0.001
lg_p4 0.028* -0.001 -0.006* -0.035* -0.003 0.023 -0.007
lg_p5 0.005 0.007 -0.001 -0.003 0.024* -0.034* 0.002
lg_p6 -0.030 -0.029* -0.005 0.023 -0.034* 0.061* 0.014
lg_p7 0.000 -0.006 -0.001 -0.007 0.002 0.014 -0.002
Inc1 -0.023 0.010 -0.004* -0.021 -0.021* 0.005 0.054*
dp1 0.079* 0.000 0.001 -0.003 -0.008 -0.051* -0.018*
dp2 0.000 0.022 0.006 0.007 0.009 -0.036* -0.008
dp3 0.001 0.006 0.003 -0.001 0.000 -0.007* -0.001
dp4 -0.003 0.007 -0.001 0.012 -0.006 0.003 -0.011
dp5 -0.008 0.009 0.000 -0.006 0.023* -0.023* 0.005
dp6 -0.051* -0.036* -0.007* 0.003 -0.023* 0.110* 0.004
dp7 -0.018* -0.008 -0.001 -0.011 0.005 0.004 0.030*
dInc1 -0.021* 0.006 -0.002* -0.010 -0.017* 0.010 0.034*
y1(-1) 0.223* 0.000 0.000 0.000 0.000 0.000 0.000
y2(-1) 0.000 0.223* 0.000 0.000 0.000 0.000 0.000
y3(-1) 0.000 0.000 0.223* 0.000 0.000 0.000 0.000
y4(-1) 0.000 0.000 0.000 0.223* 0.000 0.000 0.000
y5(-1) 0.000 0.000 0.000 0.000 0.223* 0.000 0.000
y6(-1) 0.000 0.000 0.000 0.000 0.000 0.223* 0.000
y7(-1) 0.000 0.000 0.000 0.000 0.000 0.000 0.223*
* The approximate 95% Bayesian confidence interval excluded zero.
18
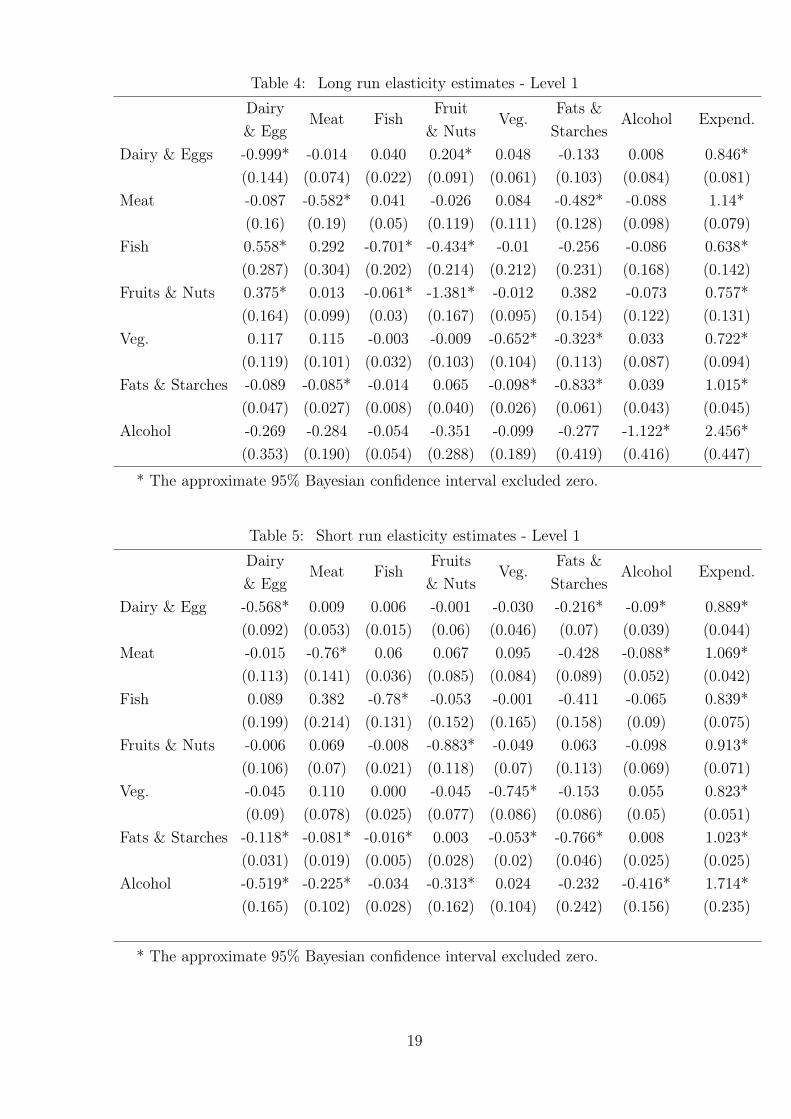
Table 4: Long run elasticity estimates - Level 1
DairyMeat Fish
FruitVeg.
Fats &Alcohol Expend.
& Egg & Nuts Starches
Dairy & Eggs -0.999* -0.014 0.040 0.204* 0.048 -0.133 0.008 0.846*
(0.144) (0.074) (0.022) (0.091) (0.061) (0.103) (0.084) (0.081)
Meat -0.087 -0.582* 0.041 -0.026 0.084 -0.482* -0.088 1.14*
(0.16) (0.19) (0.05) (0.119) (0.111) (0.128) (0.098) (0.079)
Fish 0.558* 0.292 -0.701* -0.434* -0.01 -0.256 -0.086 0.638*
(0.287) (0.304) (0.202) (0.214) (0.212) (0.231) (0.168) (0.142)
Fruits & Nuts 0.375* 0.013 -0.061* -1.381* -0.012 0.382 -0.073 0.757*
(0.164) (0.099) (0.03) (0.167) (0.095) (0.154) (0.122) (0.131)
Veg. 0.117 0.115 -0.003 -0.009 -0.652* -0.323* 0.033 0.722*
(0.119) (0.101) (0.032) (0.103) (0.104) (0.113) (0.087) (0.094)
Fats & Starches -0.089 -0.085* -0.014 0.065 -0.098* -0.833* 0.039 1.015*
(0.047) (0.027) (0.008) (0.040) (0.026) (0.061) (0.043) (0.045)
Alcohol -0.269 -0.284 -0.054 -0.351 -0.099 -0.277 -1.122* 2.456*
(0.353) (0.190) (0.054) (0.288) (0.189) (0.419) (0.416) (0.447)
* The approximate 95% Bayesian confidence interval excluded zero.
Table 5: Short run elasticity estimates - Level 1
DairyMeat Fish
FruitsVeg.
Fats &Alcohol Expend.
& Egg & Nuts Starches
Dairy & Egg -0.568* 0.009 0.006 -0.001 -0.030 -0.216* -0.09* 0.889*
(0.092) (0.053) (0.015) (0.06) (0.046) (0.07) (0.039) (0.044)
Meat -0.015 -0.76* 0.06 0.067 0.095 -0.428 -0.088* 1.069*
(0.113) (0.141) (0.036) (0.085) (0.084) (0.089) (0.052) (0.042)
Fish 0.089 0.382 -0.78* -0.053 -0.001 -0.411 -0.065 0.839*
(0.199) (0.214) (0.131) (0.152) (0.165) (0.158) (0.09) (0.075)
Fruits & Nuts -0.006 0.069 -0.008 -0.883* -0.049 0.063 -0.098 0.913*
(0.106) (0.07) (0.021) (0.118) (0.07) (0.113) (0.069) (0.071)
Veg. -0.045 0.110 0.000 -0.045 -0.745* -0.153 0.055 0.823*
(0.09) (0.078) (0.025) (0.077) (0.086) (0.086) (0.05) (0.051)
Fats & Starches -0.118* -0.081* -0.016* 0.003 -0.053* -0.766* 0.008 1.023*
(0.031) (0.019) (0.005) (0.028) (0.02) (0.046) (0.025) (0.025)
Alcohol -0.519* -0.225* -0.034 -0.313* 0.024 -0.232 -0.416* 1.714*
(0.165) (0.102) (0.028) (0.162) (0.104) (0.242) (0.156) (0.235)
* The approximate 95% Bayesian confidence interval excluded zero.
19

4 Part II: Household Level AIDS Model
4.1 Elasticity Computation
This section describes the procedures that are used to compute the price, expenditureand nutrient elasticities. The coefficients that are used to compute the elasticities areobtained from the household level AIDS model (Appendix A) which is estimated usingthe infrequency of purchase approach (Appendix B) and Bayesian estimation procedures(Appendix C).
4.1.1 Price and expenditure elasticities
The uncompensated price elasticities are calculated as
ǫij = −δij +γijwi
− ωisjsi
(1)
where γij and ωi are the means of the draws in the MCMC sample corresponding tothe parameters defined in equation 27; si is the mean value of the ith share across allobservations in the data set; and
δii = 1
δij = 0 i 6= j(2)
The expenditure elasticities were calculated as
ǫi = 1 +ωi
si(3)
and the compensated (Hicksian) price elasticities were calculated as
ǫ⋆ij = −δij +γijsi
+ sj (4)
The price elasticities obtained from a given estimated model assume that expenditure al-location within groups is performed independently meaning that expenditure on a certainfood group within that model remains constant as the price change takes place. For ex-ample, the own price elasticity for beef, which is obtained from the meat system, assumesthat the total expenditure on all types of meat in the model remains constant. Since adecrease in the price of beef is likely to induce consumers to spend more on all types ofmeat, this assumption is generally unrealistic. Assuming weak separability of consumerpreferences and low variability of group price indexes with expenditure allows combin-ing estimated conditional elasticities to obtain unconditional elasticities over stages andmodelling conditional demand at each budgeting stage independently [Edgerton, 1997].Conditional elasticities therefore assume that expenditure is constant within the groupof which the good in question is a member. The conditional elasticities allow, for exam-ple, the nominal expenditure on meat to change as a result of a change in the price forbeef. Accordingly, in this study the uncompensated conditional elasticities of the level 1and level 2 models are combined to obtain overall unconditional elasticities reported inAppendix G.2. Following Edgerton [1997], the unconditional expenditure elasticities arecalculated from the conditional elasticities as follows
Ei = E(m)i • E(m) (5)
20

where E(m)i is the conditional expenditure elasticity of the food i within food group mand E(m) is group expenditure elasticity for the mth food group. This formula can beused to convert expenditure elasticities to income elasticities. If it is assumed that theincome elasticity of all food expenditure is one, the expenditure elasticities are equivalentto an income elasticity. If the income elasticity of food differs from one, it provides afactor by which the expenditure elasticity can be adjusted to obtain the income elasticityof the good in question.
The total uncompensated price elasticity for the ith food (in the mth group) can bewritten as
eij = δmne(r)ij + E(m)iw(n)je(m)(n) (6)
where δmn is Kronecker delta equal to 1 for m = n and 0 otherwise; e(r)ij is the withingroup price elasticity between the ith and jth food within the mth food group; w(n)j isthe budget share of food j within food group n; and e(m)(n) is the uncompensated groupprice elasticity for the mth and nth food group.
4.1.2 Nutrient elasticities
Given the demand structure for food and the bundle of nutrient attributes each food prod-uct contains, it is possible to derive the implied relationship between nutrient availabilityand changes in food prices and food expenditure [Huang, 1996, 1999]. The basic premiseof the approach in Huang [1996] is that changes in the price of a particular food or in foodexpenditure will affect the consumption of all food items and will simultaneously changeintakes in a variety of different nutrients. The nutrient demand elasticity matrix, N , forthe case of l nutrients and n foods can be obtained as a product of multiplying matrix Sby matrix D as follows
N = S ∗D (7)
where N is the l× (n+1) matrix of nutrient demand elasticities in response to changes offood prices and food expenditure; S is the l×n matrix with entries of each row indicating afood’s share of a particular nutrient; and D is the n×(n+1) matrix of demand elasticities.In the present study the procedure is applied to estimate nutrient elasticities of the level1 model which are elasticities for l = 45 nutrients in response to changes in the prices ofn = 7 main food group prices plus food expenditure. Information on nutrient values ofeach MAFF code is compiled from the EFS 2003-04 conversion table. The results for allnine data sets are reported in Appendix I, a selection of which are discussed in detail insection 5.5.
4.2 Data and Aggregation
The data used in this study is the UK Government’s Family Food Module of the LivingCosts and Food Survey from April 2001 to December 2009. Participating householdsvoluntarily record food purchases for consumption at home for a two week period using afood diary. The data is stratified by Government Office Region, socioeconomic group, andcar ownership. The survey is carried out throughout the UK and throughout the year inorder to capture seasonal variations. Households were excluded from the sample if theydid not consume any of the food groups in a model. Models are estimated at differentlevels of aggregation as reported in Table 6. The sample sizes of the respective modelsare reported in Appendix D.
21
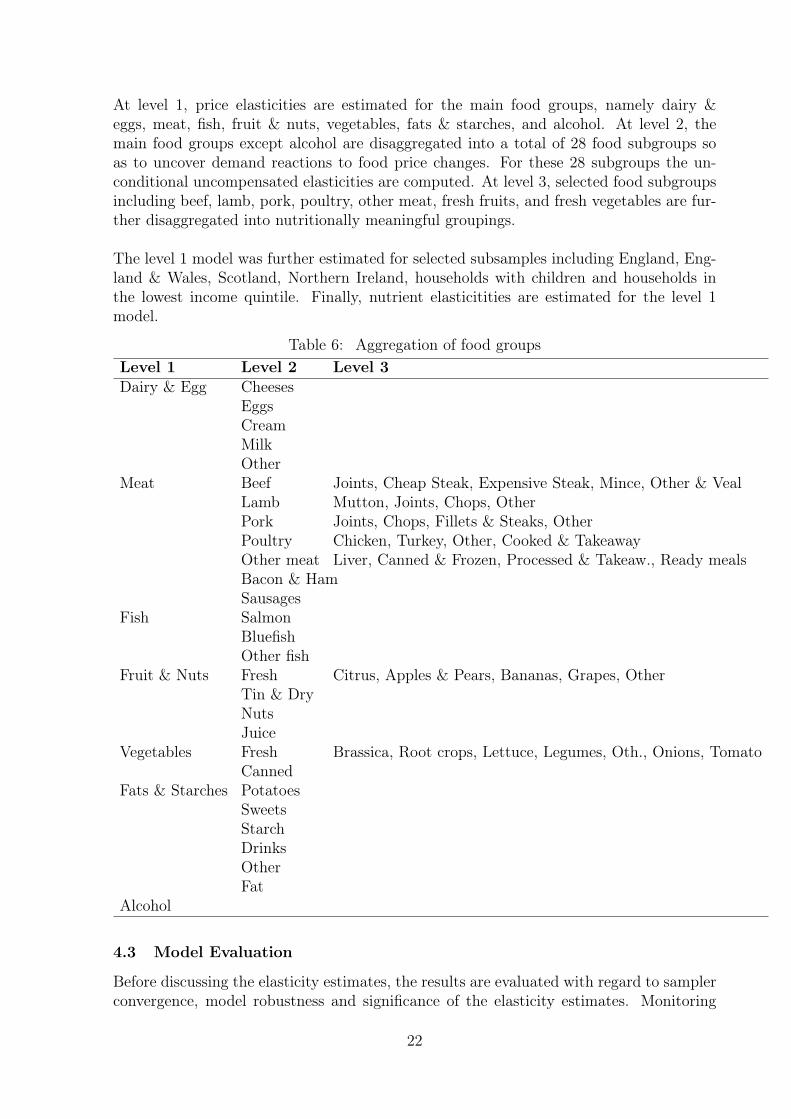
At level 1, price elasticities are estimated for the main food groups, namely dairy &eggs, meat, fish, fruit & nuts, vegetables, fats & starches, and alcohol. At level 2, themain food groups except alcohol are disaggregated into a total of 28 food subgroups soas to uncover demand reactions to food price changes. For these 28 subgroups the un-conditional uncompensated elasticities are computed. At level 3, selected food subgroupsincluding beef, lamb, pork, poultry, other meat, fresh fruits, and fresh vegetables are fur-ther disaggregated into nutritionally meaningful groupings.
The level 1 model was further estimated for selected subsamples including England, Eng-land & Wales, Scotland, Northern Ireland, households with children and households inthe lowest income quintile. Finally, nutrient elasticitities are estimated for the level 1model.
Table 6: Aggregation of food groups
Level 1 Level 2 Level 3Dairy & Egg Cheeses
EggsCreamMilkOther
Meat Beef Joints, Cheap Steak, Expensive Steak, Mince, Other & VealLamb Mutton, Joints, Chops, OtherPork Joints, Chops, Fillets & Steaks, OtherPoultry Chicken, Turkey, Other, Cooked & TakeawayOther meat Liver, Canned & Frozen, Processed & Takeaw., Ready mealsBacon & HamSausages
Fish SalmonBluefishOther fish
Fruit & Nuts Fresh Citrus, Apples & Pears, Bananas, Grapes, OtherTin & DryNutsJuice
Vegetables Fresh Brassica, Root crops, Lettuce, Legumes, Oth., Onions, TomatoCanned
Fats & Starches PotatoesSweetsStarchDrinksOtherFat
Alcohol
4.3 Model Evaluation
Before discussing the elasticity estimates, the results are evaluated with regard to samplerconvergence, model robustness and significance of the elasticity estimates. Monitoring
22
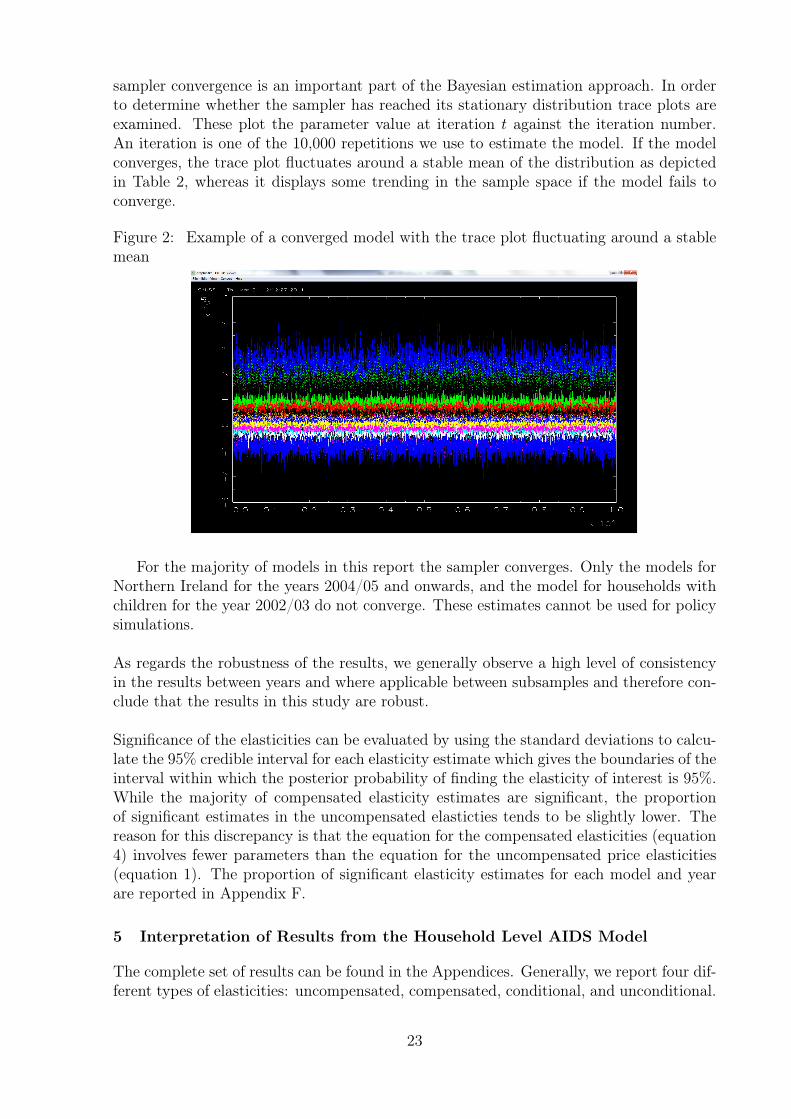
sampler convergence is an important part of the Bayesian estimation approach. In orderto determine whether the sampler has reached its stationary distribution trace plots areexamined. These plot the parameter value at iteration t against the iteration number.An iteration is one of the 10,000 repetitions we use to estimate the model. If the modelconverges, the trace plot fluctuates around a stable mean of the distribution as depictedin Table 2, whereas it displays some trending in the sample space if the model fails toconverge.
Figure 2: Example of a converged model with the trace plot fluctuating around a stablemean
For the majority of models in this report the sampler converges. Only the models forNorthern Ireland for the years 2004/05 and onwards, and the model for households withchildren for the year 2002/03 do not converge. These estimates cannot be used for policysimulations.
As regards the robustness of the results, we generally observe a high level of consistencyin the results between years and where applicable between subsamples and therefore con-clude that the results in this study are robust.
Significance of the elasticities can be evaluated by using the standard deviations to calcu-late the 95% credible interval for each elasticity estimate which gives the boundaries of theinterval within which the posterior probability of finding the elasticity of interest is 95%.While the majority of compensated elasticity estimates are significant, the proportionof significant estimates in the uncompensated elasticties tends to be slightly lower. Thereason for this discrepancy is that the equation for the compensated elasticities (equation4) involves fewer parameters than the equation for the uncompensated price elasticities(equation 1). The proportion of significant elasticity estimates for each model and yearare reported in Appendix F.
5 Interpretation of Results from the Household Level AIDS Model
The complete set of results can be found in the Appendices. Generally, we report four dif-ferent types of elasticities: uncompensated, compensated, conditional, and unconditional.
23
The uncompensated elasticities consider the two effects in which a price change on de-mand can be decomposed into. The substitution effect posits that, if the price of a gooddeclines, consumers substitute toward the good that becomes comparatively less expen-sive. They therefore buy more of the relatively lower priced good and less of the othergood whose price has not declined. The income effect arises due to changes in consumers’food expenditure. If the food group in question is a normal good (positive expenditureelasticity), the income effect reinforces the substitution effect, whereas it offsets the sub-stitution effect to some extent if it is an inferior good (negative expenditure elasticity). Bycontrast, the compensated elasticities do not consider the income effect of a price changeon demand.
The conditional elasticities assume that a price decrease of one of the food groups holdsfood expenditure available to all other food groups constant. By contrast, the uncondi-tional elasticities combine elasticities across levels 1 and 2 and therefore assume that aprice decrease of one of the food groups increases food expenditure available to all otherfood groups.
This means that the unconditional uncompensated elasticities of the level 2 models aremost useful for the purpose of policy simulations because they assume that a price de-crease of one food category increases the food expenditure available to all related foodcategories (unconditional) and they capture both income and substitution effect (uncom-pensated). At the highest level of disaggregation (level 3) the compensated elasticitiestend to be more informative than the uncompensated elasticities because the substitutioneffect is stronger as households tend to be more sensitive to changes for example in theprices of individual meat products than they would be to changes in the prices of meataggregates.
Selected results are reported and discussed hereafter. Unless identified differently, theelasticity estimates discussed are the uncompensated elasticities.
5.1 Level 1 Model
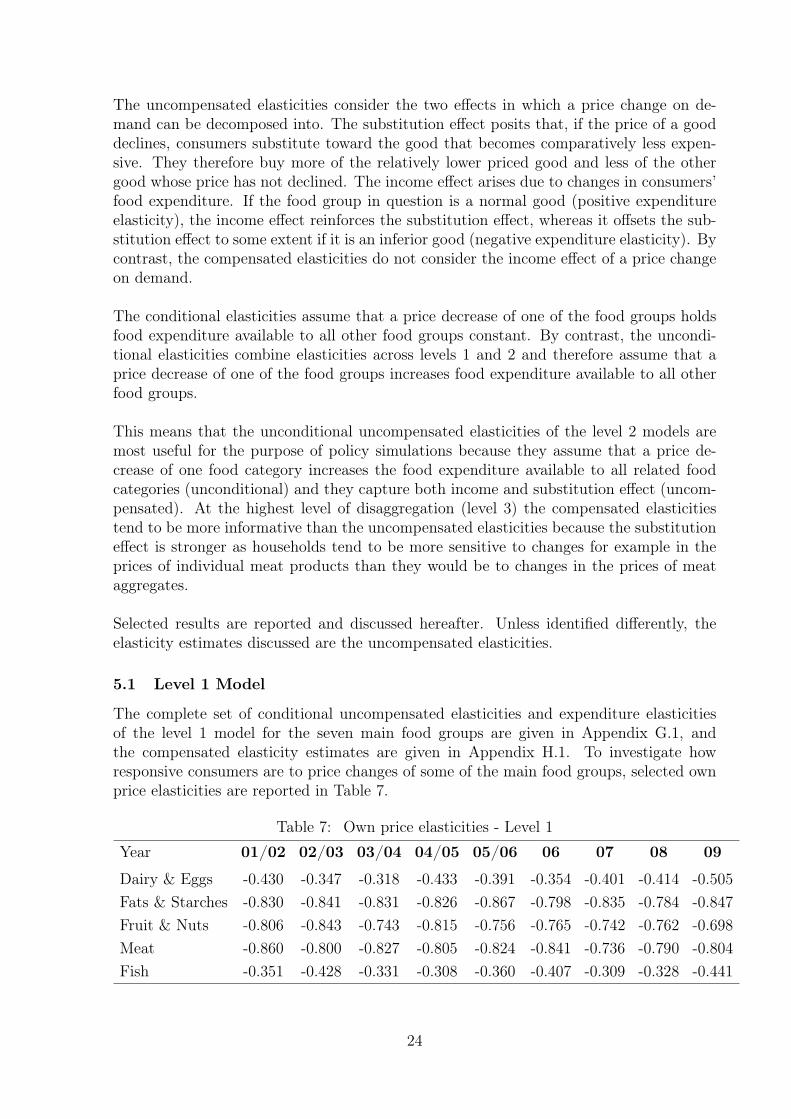
The complete set of conditional uncompensated elasticities and expenditure elasticitiesof the level 1 model for the seven main food groups are given in Appendix G.1, andthe compensated elasticity estimates are given in Appendix H.1. To investigate howresponsive consumers are to price changes of some of the main food groups, selected ownprice elasticities are reported in Table 7.
Table 7: Own price elasticities - Level 1
Year 01/02 02/03 03/04 04/05 05/06 06 07 08 09
Dairy & Eggs -0.430 -0.347 -0.318 -0.433 -0.391 -0.354 -0.401 -0.414 -0.505
Fats & Starches -0.830 -0.841 -0.831 -0.826 -0.867 -0.798 -0.835 -0.784 -0.847
Fruit & Nuts -0.806 -0.843 -0.743 -0.815 -0.756 -0.765 -0.742 -0.762 -0.698
Meat -0.860 -0.800 -0.827 -0.805 -0.824 -0.841 -0.736 -0.790 -0.804
Fish -0.351 -0.428 -0.331 -0.308 -0.360 -0.407 -0.309 -0.328 -0.441
24
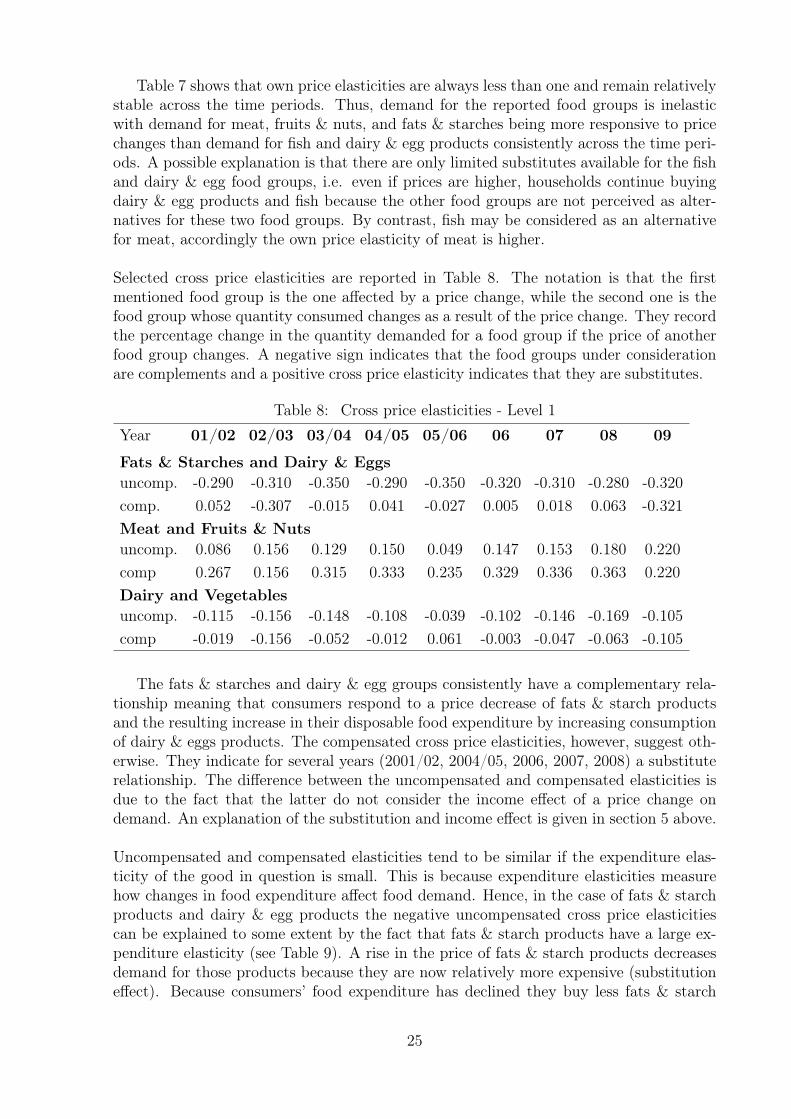
Table 7 shows that own price elasticities are always less than one and remain relativelystable across the time periods. Thus, demand for the reported food groups is inelasticwith demand for meat, fruits & nuts, and fats & starches being more responsive to pricechanges than demand for fish and dairy & egg products consistently across the time peri-ods. A possible explanation is that there are only limited substitutes available for the fishand dairy & egg food groups, i.e. even if prices are higher, households continue buyingdairy & egg products and fish because the other food groups are not perceived as alter-natives for these two food groups. By contrast, fish may be considered as an alternativefor meat, accordingly the own price elasticity of meat is higher.
Selected cross price elasticities are reported in Table 8. The notation is that the firstmentioned food group is the one affected by a price change, while the second one is thefood group whose quantity consumed changes as a result of the price change. They recordthe percentage change in the quantity demanded for a food group if the price of anotherfood group changes. A negative sign indicates that the food groups under considerationare complements and a positive cross price elasticity indicates that they are substitutes.
Table 8: Cross price elasticities - Level 1
Year 01/02 02/03 03/04 04/05 05/06 06 07 08 09
Fats & Starches and Dairy & Eggs
uncomp. -0.290 -0.310 -0.350 -0.290 -0.350 -0.320 -0.310 -0.280 -0.320
comp. 0.052 -0.307 -0.015 0.041 -0.027 0.005 0.018 0.063 -0.321
Meat and Fruits & Nuts
uncomp. 0.086 0.156 0.129 0.150 0.049 0.147 0.153 0.180 0.220
comp 0.267 0.156 0.315 0.333 0.235 0.329 0.336 0.363 0.220
Dairy and Vegetables
uncomp. -0.115 -0.156 -0.148 -0.108 -0.039 -0.102 -0.146 -0.169 -0.105
comp -0.019 -0.156 -0.052 -0.012 0.061 -0.003 -0.047 -0.063 -0.105
The fats & starches and dairy & egg groups consistently have a complementary rela-tionship meaning that consumers respond to a price decrease of fats & starch productsand the resulting increase in their disposable food expenditure by increasing consumptionof dairy & eggs products. The compensated cross price elasticities, however, suggest oth-erwise. They indicate for several years (2001/02, 2004/05, 2006, 2007, 2008) a substituterelationship. The difference between the uncompensated and compensated elasticities isdue to the fact that the latter do not consider the income effect of a price change ondemand. An explanation of the substitution and income effect is given in section 5 above.
Uncompensated and compensated elasticities tend to be similar if the expenditure elas-ticity of the good in question is small. This is because expenditure elasticities measurehow changes in food expenditure affect food demand. Hence, in the case of fats & starchproducts and dairy & egg products the negative uncompensated cross price elasticitiescan be explained to some extent by the fact that fats & starch products have a large ex-penditure elasticity (see Table 9). A rise in the price of fats & starch products decreasesdemand for those products because they are now relatively more expensive (substitutioneffect). Because consumers’ food expenditure has declined they buy less fats & starch
25

products but also less dairy & egg products (income effect) causing their uncompensatedcross price elasticities to become negative.
The cross price elasticities in Table 8 further reveal a substitute relationship betweenmeat and fruits & nuts meaning that an increase in the price of meat leads to consumerssubstituting fruit & nuts products for meat. Hence, changes in the price of meat affectfruit & nut consumption and given that the magnitude of the cross price elasticities in-creases across the time periods this substitution effect increases over time. The crossprice elasticities of dairy products & eggs and vegetables, show that these food groupsconsistently are complements. Apart from 2005/06, the complementary nature of thisrelationship is confirmed by the respective compensated cross price elasticities. Hence,decreasing prices of dairy & egg products lead to increased demand for vegetables.
Table 9 reports selected expenditure elasticities. In this study, all expenditure elastic-ities are positive indicating that food is a normal good.
Table 9: Expenditure elasticities - Level 1
Year 01/02 02/03 03/04 04/05 05/06 06 07 08 09
Dairy & Eggs 0.885 0.879 0.897 0.897 0.896 0.906 0.911 0.929 0.896
Fats & Starch 1.092 1.088 1.087 1.084 1.075 1.075 1.080 1.074 1.078
Meat 1.091 1.106 1.098 1.113 1.108 1.115 1.119 1.117 1.121
Fish 0.652 0.652 0.683 0.649 0.685 0.685 0.667 0.681 0.675
The expenditure elasticities in Table 9 give an indication of the pattern of responsesthat would be observed if we were measuring the impact of a difference in income ondemand. The size of the response to a difference in income is likely to be smaller thanthe response to a change in expenditure. This is because households who have higherincome tend to spend the additional money on things other than food such as traveland non-food items and only a small proportion of the additional income is dedicatedto food. The pattern of response would however be preserved: differences in incomeresult in comparatively large differences in the demand for fats & starches and meat, andcomparatively small increases in the demand for fish. As incomes rises, the demand forfats & starches and for meat products expands even more rapidly, and therefore spendingon these food groups increases as a proportion of food expenditure. By contrast, demandfor fish is expenditure inelastic and the fish group is therefore considered to be a necessity.Hence, there is not a big difference in terms of fish consumed between households that areidentical except for their income. Finally, the fact that there are only small variations inthe expenditure elasticity estimates over time suggests that consumers’ underlying tastesand preferences for the food groups were relatively stable across the time periods.
5.2 Level 2 Models
The results in this section allow investigating how prices and expenditure changes affectfood and drink demand at a higher level of disaggregation. The unconditional uncompen-sated elasticity estimates for the 28 food subgroups alongside their expenditure elasticitiesare given in Appendix G.2. The compensated elasticity estimates of the individual modelsare reported in Appendix H.2. The unconditional uncompensated price elasticities mea-sure the extent to which price differences influence differences in consumption between
26
households that are identical in all respects other than that they face a different price.
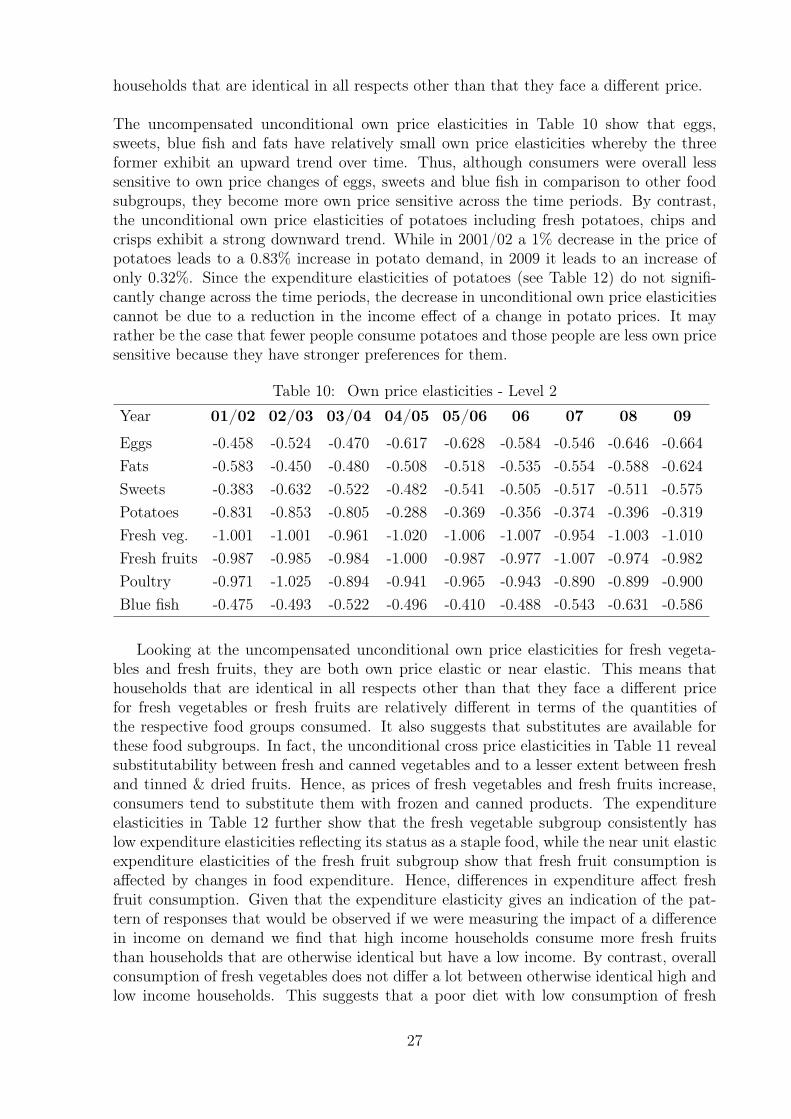
The uncompensated unconditional own price elasticities in Table 10 show that eggs,sweets, blue fish and fats have relatively small own price elasticities whereby the threeformer exhibit an upward trend over time. Thus, although consumers were overall lesssensitive to own price changes of eggs, sweets and blue fish in comparison to other foodsubgroups, they become more own price sensitive across the time periods. By contrast,the unconditional own price elasticities of potatoes including fresh potatoes, chips andcrisps exhibit a strong downward trend. While in 2001/02 a 1% decrease in the price ofpotatoes leads to a 0.83% increase in potato demand, in 2009 it leads to an increase ofonly 0.32%. Since the expenditure elasticities of potatoes (see Table 12) do not signifi-cantly change across the time periods, the decrease in unconditional own price elasticitiescannot be due to a reduction in the income effect of a change in potato prices. It mayrather be the case that fewer people consume potatoes and those people are less own pricesensitive because they have stronger preferences for them.
Table 10: Own price elasticities - Level 2
Year 01/02 02/03 03/04 04/05 05/06 06 07 08 09
Eggs -0.458 -0.524 -0.470 -0.617 -0.628 -0.584 -0.546 -0.646 -0.664
Fats -0.583 -0.450 -0.480 -0.508 -0.518 -0.535 -0.554 -0.588 -0.624
Sweets -0.383 -0.632 -0.522 -0.482 -0.541 -0.505 -0.517 -0.511 -0.575
Potatoes -0.831 -0.853 -0.805 -0.288 -0.369 -0.356 -0.374 -0.396 -0.319
Fresh veg. -1.001 -1.001 -0.961 -1.020 -1.006 -1.007 -0.954 -1.003 -1.010
Fresh fruits -0.987 -0.985 -0.984 -1.000 -0.987 -0.977 -1.007 -0.974 -0.982
Poultry -0.971 -1.025 -0.894 -0.941 -0.965 -0.943 -0.890 -0.899 -0.900
Blue fish -0.475 -0.493 -0.522 -0.496 -0.410 -0.488 -0.543 -0.631 -0.586
Looking at the uncompensated unconditional own price elasticities for fresh vegeta-bles and fresh fruits, they are both own price elastic or near elastic. This means thathouseholds that are identical in all respects other than that they face a different pricefor fresh vegetables or fresh fruits are relatively different in terms of the quantities ofthe respective food groups consumed. It also suggests that substitutes are available forthese food subgroups. In fact, the unconditional cross price elasticities in Table 11 revealsubstitutability between fresh and canned vegetables and to a lesser extent between freshand tinned & dried fruits. Hence, as prices of fresh vegetables and fresh fruits increase,consumers tend to substitute them with frozen and canned products. The expenditureelasticities in Table 12 further show that the fresh vegetable subgroup consistently haslow expenditure elasticities reflecting its status as a staple food, while the near unit elasticexpenditure elasticities of the fresh fruit subgroup show that fresh fruit consumption isaffected by changes in food expenditure. Hence, differences in expenditure affect freshfruit consumption. Given that the expenditure elasticity gives an indication of the pat-tern of responses that would be observed if we were measuring the impact of a differencein income on demand we find that high income households consume more fresh fruitsthan households that are otherwise identical but have a low income. By contrast, overallconsumption of fresh vegetables does not differ a lot between otherwise identical high andlow income households. This suggests that a poor diet with low consumption of fresh
27
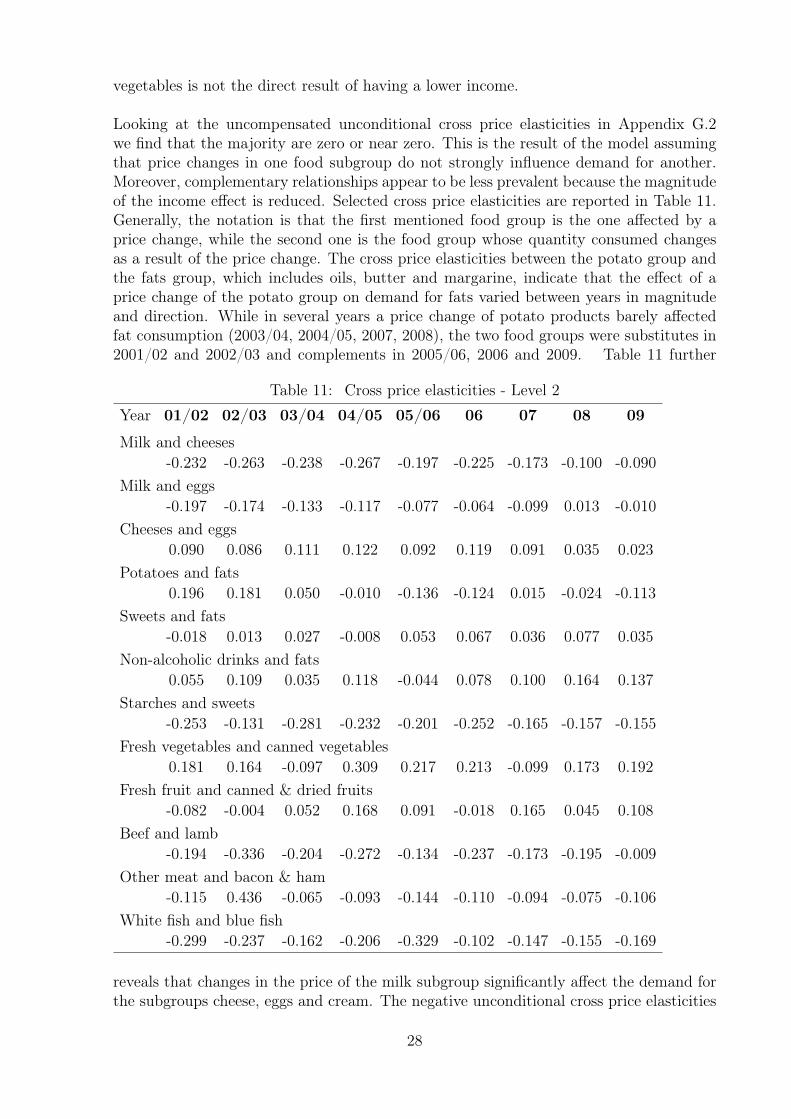
vegetables is not the direct result of having a lower income.
Looking at the uncompensated unconditional cross price elasticities in Appendix G.2we find that the majority are zero or near zero. This is the result of the model assumingthat price changes in one food subgroup do not strongly influence demand for another.Moreover, complementary relationships appear to be less prevalent because the magnitudeof the income effect is reduced. Selected cross price elasticities are reported in Table 11.Generally, the notation is that the first mentioned food group is the one affected by aprice change, while the second one is the food group whose quantity consumed changesas a result of the price change. The cross price elasticities between the potato group andthe fats group, which includes oils, butter and margarine, indicate that the effect of aprice change of the potato group on demand for fats varied between years in magnitudeand direction. While in several years a price change of potato products barely affectedfat consumption (2003/04, 2004/05, 2007, 2008), the two food groups were substitutes in2001/02 and 2002/03 and complements in 2005/06, 2006 and 2009. Table 11 further
Table 11: Cross price elasticities - Level 2
Year 01/02 02/03 03/04 04/05 05/06 06 07 08 09
Milk and cheeses
-0.232 -0.263 -0.238 -0.267 -0.197 -0.225 -0.173 -0.100 -0.090
Milk and eggs
-0.197 -0.174 -0.133 -0.117 -0.077 -0.064 -0.099 0.013 -0.010
Cheeses and eggs
0.090 0.086 0.111 0.122 0.092 0.119 0.091 0.035 0.023
Potatoes and fats
0.196 0.181 0.050 -0.010 -0.136 -0.124 0.015 -0.024 -0.113
Sweets and fats
-0.018 0.013 0.027 -0.008 0.053 0.067 0.036 0.077 0.035
Non-alcoholic drinks and fats
0.055 0.109 0.035 0.118 -0.044 0.078 0.100 0.164 0.137
Starches and sweets
-0.253 -0.131 -0.281 -0.232 -0.201 -0.252 -0.165 -0.157 -0.155
Fresh vegetables and canned vegetables
0.181 0.164 -0.097 0.309 0.217 0.213 -0.099 0.173 0.192
Fresh fruit and canned & dried fruits
-0.082 -0.004 0.052 0.168 0.091 -0.018 0.165 0.045 0.108
Beef and lamb
-0.194 -0.336 -0.204 -0.272 -0.134 -0.237 -0.173 -0.195 -0.009
Other meat and bacon & ham
-0.115 0.436 -0.065 -0.093 -0.144 -0.110 -0.094 -0.075 -0.106
White fish and blue fish
-0.299 -0.237 -0.162 -0.206 -0.329 -0.102 -0.147 -0.155 -0.169
reveals that changes in the price of the milk subgroup significantly affect the demand forthe subgroups cheese, eggs and cream. The negative unconditional cross price elasticities
28

indicate that a decline in the price of milk increases demand for both cheese and eggs.However, this effect significantly decreases across time periods. In 2001/02, a 1% decreasein the price of milk leads to an increase in demand for cheese by 0.23%, whereas it is 0.09%in 2009. Thus, the demand for cheese and eggs appears to be increasingly less affectedby changes in the price of milk. The expenditure elasticities of milk in Table 12 indicatethat from 2006 onwards milk is an expenditure elastic good. Thus, milk consumptiondiffers between households that are identical except for their income and therefore foodexpenditure. The fact that the expenditure elasticity of milk increases over time whilethe expenditure elasticity of cheese and cheese remains constant over time indicates thathouseholds increasingly respond to a price increase of milk and the resultant decrease infood expenditure by reducing their consumption of milk than by reducing their cheeseconsumption. As a result, the cross price elasticities which show the effect of a milk pricechange on cheese consumption become smaller. In addition, cheese and eggs were consis-tently substitutes but the relationship was not very strong from 2007 onwards.
Demand for the fats subgroup is significantly affected by changes in the prices of thesubgroups potatoes, sweets, and, in recent years, by changes in the prices of non-alcoholicdrinks. The mostly negative unconditional cross price elasticities between the potato andfats subgroups indicate that household facing lower prices of potato products consumemore products of the fats group. Conversely, households facing lower prices for sweets andnon-alcoholic drinks substitute these product groups with products of the fat category,therefore decreasing fats consumption. The expenditure elasticities of the fats subgroupare largely stable across time periods and moderate levels indicate that fats are stapleproducts the demand for which is relatively little affected by differences in food expendi-ture.
The starch subgroup which includes bread, flour, biscuits, rice, pasta and pizza and thesweets subgroup including sugar, jam and honey, consistently have a complementary re-lationship. That is, households facing low starch prices have higher levels of consumptionof sweets than identical households facing higher starch prices. For both food subgroups,expenditure elasticities are consistently elastic suggesting that starch and sweet consump-tion differ a lot between otherwise identical high and low income households. Furthermore,since their expenditure elasticities vary very little across time periods it appears that con-sumer preferences for the starches and sweets subgroups are stable over time.
Looking at meat elasticities, it is noticeable that the results are considerably larger forthe year 2002/03 suggesting that there may be an anomaly with the data on meat for thisyear. The unconditional cross price elasticities between the beef subgroup which includesjoints, steaks and mince and the lamb subgroup including mutton, joints, and chops arereported in Table 11. Beef and lamb products are consistently complements implyingthat households facing a low beef price consume more lamb than identical householdswho face a higher beef price. Given that both their expenditure elasticities were largewith the expenditure elasticities of the beef subgroup being consistently elastic, the com-plementary relationship appears to be largely due to the income effect of a price change.The other meat subgroup including liver, corned beef, pies, burgers, and takeaway andthe bacon & ham subgroup also have complementary relationship where decreases in theprice of other meat products are accompanied by significant increases in demand for bacon& ham. This effect is relatively stronger in the years 2001/02, 2005/06, and 2006 and 2009.
29

In regards to fish consumption patterns, the blue fish subgroup and the white fish sub-group are consistently complements, and according to their expenditure elasticities inTable 12 consumption of blue fish differs slightly more between otherwise identical highand low income household than does the consumption of white fish.
Table 12: Expenditure elasticities - Level 2
Year 01/02 02/03 03/04 04/05 05/06 06 07 08 09
Milk 0.988 0.967 0.997 0.989 0.995 1.013 1.014 1.044 1.015
Cream 0.254 0.227 0.154 0.187 0.228 0.216 0.202 0.179 0.152
Cheese 0.846 0.859 0.869 0.868 0.872 0.871 0.897 0.895 0.868
Eggs 0.534 0.536 0.523 0.544 0.530 0.532 0.546 0.591 0.555
Sweets 1.043 1.062 1.045 1.069 1.003 1.012 1.032 1.018 1.041
Starches 1.205 1.191 1.191 1.183 1.182 1.184 1.177 1.187 1.184
Potatoes 1.031 1.044 1.030 0.990 0.998 1.003 1.004 0.980 0.963
Fats 0.661 0.577 0.626 0.710 0.662 0.671 0.673 0.688 0.684
Beef 1.059 1.058 1.041 1.097 1.090 1.128 1.078 1.132 1.123
Lamb 0.870 0.915 0.864 0.878 0.904 0.900 0.911 0.911 0.893
Bacon & ham 0.945 0.925 0.940 0.943 0.955 0.966 0.979 0.996 1.025
Blue fish 0.527 0.536 0.557 0.514 0.542 0.549 0.549 0.546 0.525
White fish 0.639 0.628 0.655 0.627 0.645 0.649 0.627 0.648 0.640
Fresh veg 0.344 0.348 0.675 0.305 0.315 0.320 0.720 0.368 0.377
Fresh fruit 0.920 0.925 0.927 0.921 0.962 0.949 0.952 0.958 0.960
5.3 Level 3 Models
Level 3 models investigate the demand for beef, pork, poultry, other meat, fresh vegeta-bles, and fresh fruits in more detail. The conditional uncompensated elasticities alongsidethe expenditure elasticities and the compensated elasticities are reported in Appendix G.3and Appendix H.3, respectively. Generally, at this level of disaggregation, the level of cen-soring is high (see Table E.3 and E.4). The food groups other beef & veal, other lamb,other pork, other poultry, and liver have particular high levels of censoring. This affectsthe estimation results and makes them less reliable and the elasticity estimates should betherefore interpreted with care. In the following the uncompensated elasticities of selectedproducts are discussed. At this level of disaggregation the compensated elasticities arevery informative because the substitution effect is stronger as households tend to be moresensitive to changes, for example, in the prices of individual meat products than theywould be to changes in the prices of meat aggregates.
Selected own price elasticities of each of the disaggregated models for beef, lamb, pork,poultry, other meats and fresh fruits and vegetables are presented in Table 13. The resultsof the household level models allow detecting patterns in how price elasticities evolve overtime. For example, a trend can be observed in the own price elasticities for fresh fruitswith own price elasticities of both bananas and citrus fruits decreasing over time. More-over, we find that demand for other lamb products is elastic in most years. The same
30

applies for pork fillet & steaks but to a lesser extent. Hence, other lamb products and porkfillet & steaks are meat types for which consumers are most price sensitive. The own priceelasticities of expensive beef steak are higher than those of cheap beef steak in the periodbetween 2002/03 and 2005/06. From 2006 onwards consumers’ responsiveness to changesin the price of expensive and cheap beef steak appears to become increasingly similarbut with the own price elasticity of expensive beef steak being lower in 2007 and 2008and higher in 2006 and 2009 no clear pattern emerges. Furthermore, expensive steak isconsistently expenditure elastic (see Table 15) showing that high income household spenda comparatively higher proportion of food expenditure on expensive steak than identicalhouseholds with lower income. The fact that the expenditure elasticities of beef jointsand expensive steak are very similar implies that the expenditure proportions occupiedby the two food groups are broadly similar across time periods for households that areidentical in all respects except for their food expenditure. The expenditure elasticities ofcheap steak, though high, are consistently inelastic indicating that consumption of cheapsteak does not differ much between otherwise identical high and low income households.
Table 13: Own price elasticities - Level 3
Year 01/02 02/03 03/04 04/05 05/06 06 07 08 09
Beef: Cheap steak
-0.905 -0.853 -0.781 -0.841 -0.865 -0.922 -0.861 -0.867 -0.917
Beef: Expensive steak
-0.873 -0.897 -0.919 -0.929 -0.941 -0.893 -0.883 -0.904 -0.913
Lamb: Other
-1.061 -0.934 -0.963 -1.079 -1.045 -1.139 -1.092 -0.953 -1.121
Pork: Fillet & steak
-0.982 -1.003 -0.960 -0.949 -0.956 -0.962 -0.991 -1.022 -1.006
Fresh vegetables: Tomatoes
-0.723 -0.648 -0.720 -0.703 -0.665 -0.682 -0.689 -0.693 -0.703
Fresh vegetables: Roots
-0.681 -0.635 -0.672 -0.717 -0.685 -0.717 -0.737 -0.724 -0.769
Fresh vegetables: Other
-0.962 -0.902 -0.937 -0.904 -0.924 -0.936 -0.939 -0.911 -0.931
Fresh fruits: Bananas
-0.738 -0.690 -0.644 -0.574 -0.617 -0.645 -0.566 -0.584 -0.525
Fresh fruits: Citrus
-0.936 -0.994 -0.898 -0.804 -0.833 -0.805 -0.808 -0.863 -0.790
Table 14 report selected cross price elasticities. The first set of elasticities shows for thepoultry group the cross price elasticities how a change in the price of chicken affects de-mand for other poultry. Likewise the second set of elasticities shows how price changes forthe cooked poultry & takeaway poultry affect demand for other poultry products. Thenegative cross price elasticities of chicken and other poultry products in indicate that thesefoods are complements whose relationship varied considerably across time periods. Theexpenditure elasticities of other poultry products are greater than one and therefore elasticmeaning as food expenditure increases, demand for other poultry products expands even
31
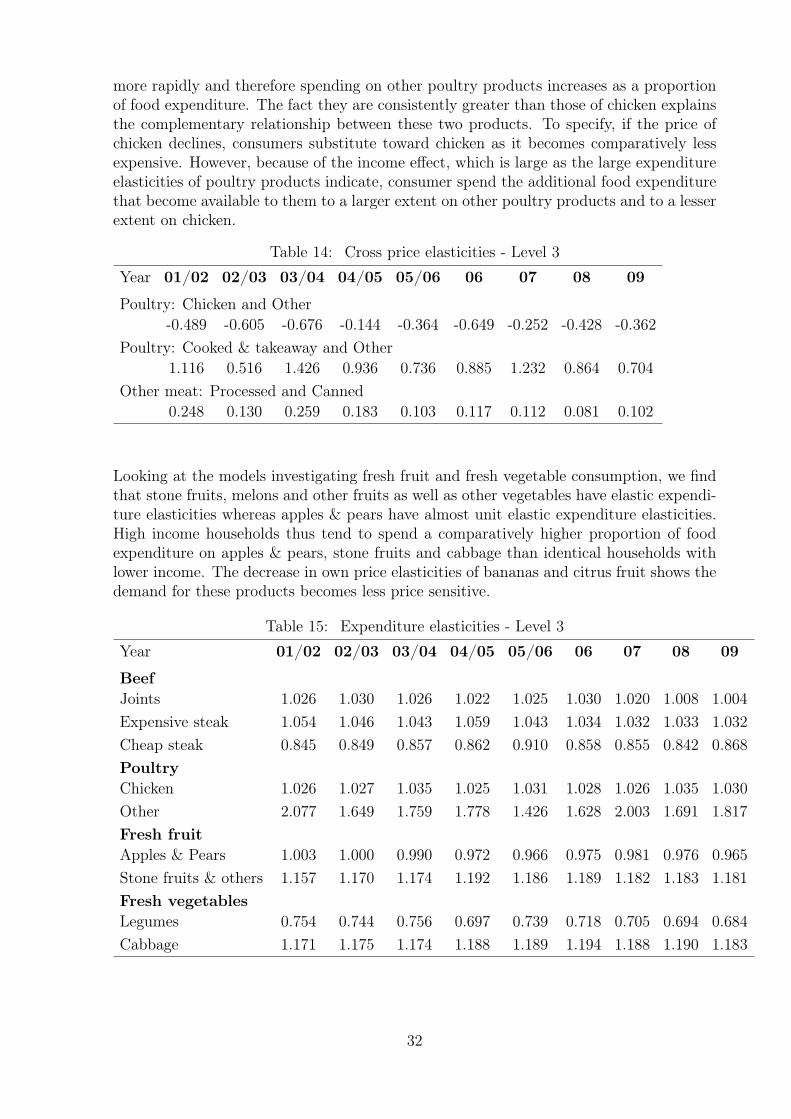
more rapidly and therefore spending on other poultry products increases as a proportionof food expenditure. The fact they are consistently greater than those of chicken explainsthe complementary relationship between these two products. To specify, if the price ofchicken declines, consumers substitute toward chicken as it becomes comparatively lessexpensive. However, because of the income effect, which is large as the large expenditureelasticities of poultry products indicate, consumer spend the additional food expenditurethat become available to them to a larger extent on other poultry products and to a lesserextent on chicken.
Table 14: Cross price elasticities - Level 3
Year 01/02 02/03 03/04 04/05 05/06 06 07 08 09
Poultry: Chicken and Other
-0.489 -0.605 -0.676 -0.144 -0.364 -0.649 -0.252 -0.428 -0.362
Poultry: Cooked & takeaway and Other
1.116 0.516 1.426 0.936 0.736 0.885 1.232 0.864 0.704
Other meat: Processed and Canned
0.248 0.130 0.259 0.183 0.103 0.117 0.112 0.081 0.102
Looking at the models investigating fresh fruit and fresh vegetable consumption, we findthat stone fruits, melons and other fruits as well as other vegetables have elastic expendi-ture elasticities whereas apples & pears have almost unit elastic expenditure elasticities.High income households thus tend to spend a comparatively higher proportion of foodexpenditure on apples & pears, stone fruits and cabbage than identical households withlower income. The decrease in own price elasticities of bananas and citrus fruit shows thedemand for these products becomes less price sensitive.
Table 15: Expenditure elasticities - Level 3
Year 01/02 02/03 03/04 04/05 05/06 06 07 08 09
Beef
Joints 1.026 1.030 1.026 1.022 1.025 1.030 1.020 1.008 1.004
Expensive steak 1.054 1.046 1.043 1.059 1.043 1.034 1.032 1.033 1.032
Cheap steak 0.845 0.849 0.857 0.862 0.910 0.858 0.855 0.842 0.868
Poultry
Chicken 1.026 1.027 1.035 1.025 1.031 1.028 1.026 1.035 1.030
Other 2.077 1.649 1.759 1.778 1.426 1.628 2.003 1.691 1.817
Fresh fruit
Apples & Pears 1.003 1.000 0.990 0.972 0.966 0.975 0.981 0.976 0.965
Stone fruits & others 1.157 1.170 1.174 1.192 1.186 1.189 1.182 1.183 1.181
Fresh vegetables
Legumes 0.754 0.744 0.756 0.697 0.739 0.718 0.705 0.694 0.684
Cabbage 1.171 1.175 1.174 1.188 1.189 1.194 1.188 1.190 1.183
32
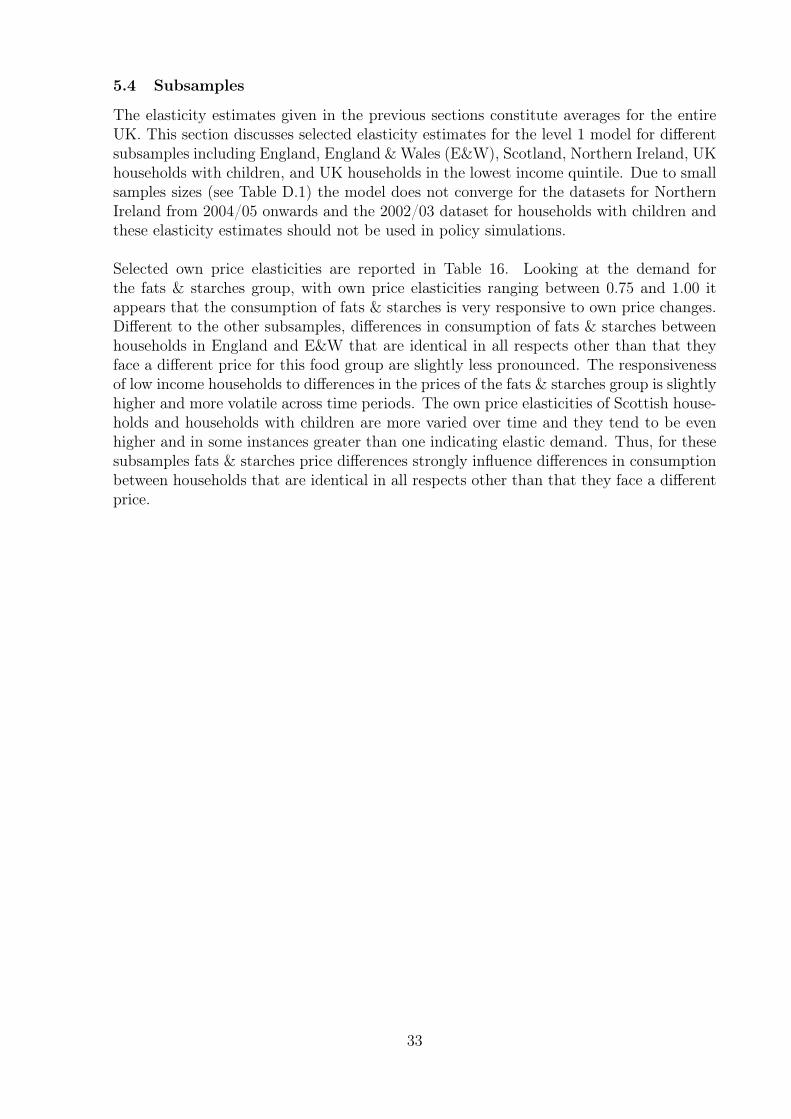
5.4 Subsamples
The elasticity estimates given in the previous sections constitute averages for the entireUK. This section discusses selected elasticity estimates for the level 1 model for differentsubsamples including England, England & Wales (E&W), Scotland, Northern Ireland, UKhouseholds with children, and UK households in the lowest income quintile. Due to smallsamples sizes (see Table D.1) the model does not converge for the datasets for NorthernIreland from 2004/05 onwards and the 2002/03 dataset for households with children andthese elasticity estimates should not be used in policy simulations.
Selected own price elasticities are reported in Table 16. Looking at the demand forthe fats & starches group, with own price elasticities ranging between 0.75 and 1.00 itappears that the consumption of fats & starches is very responsive to own price changes.Different to the other subsamples, differences in consumption of fats & starches betweenhouseholds in England and E&W that are identical in all respects other than that theyface a different price for this food group are slightly less pronounced. The responsivenessof low income households to differences in the prices of the fats & starches group is slightlyhigher and more volatile across time periods. The own price elasticities of Scottish house-holds and households with children are more varied over time and they tend to be evenhigher and in some instances greater than one indicating elastic demand. Thus, for thesesubsamples fats & starches price differences strongly influence differences in consumptionbetween households that are identical in all respects other than that they face a differentprice.
33
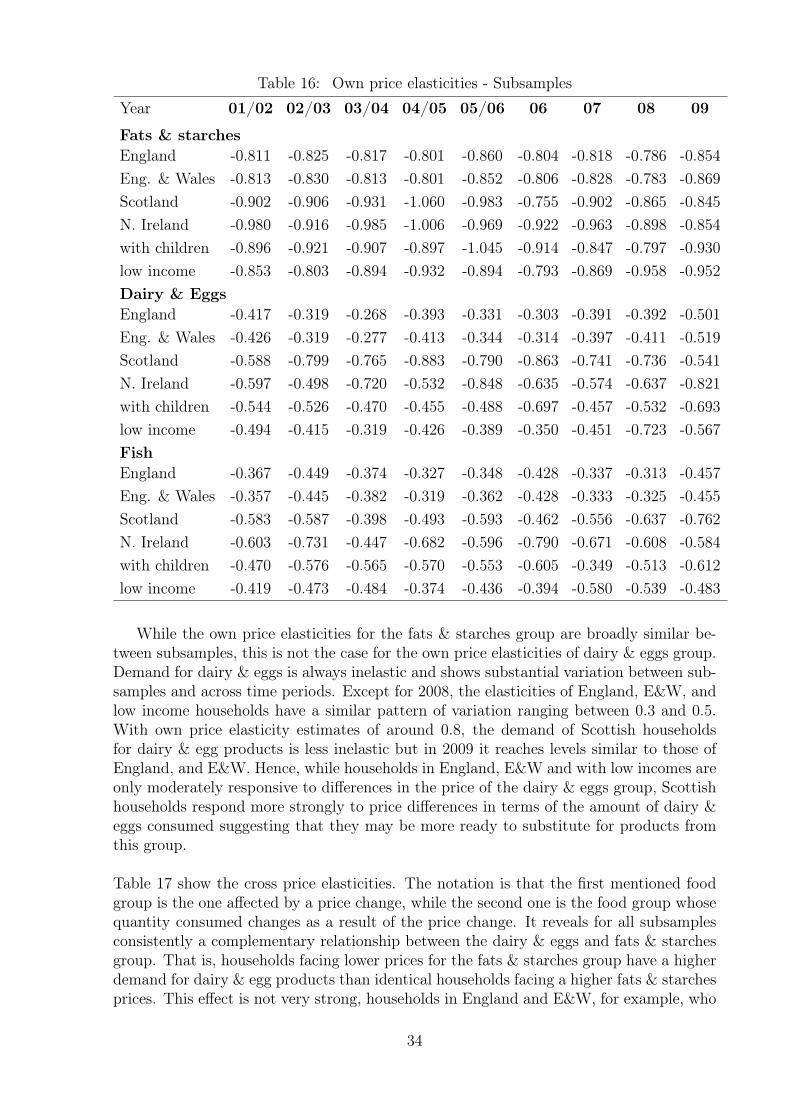
Table 16: Own price elasticities - Subsamples
Year 01/02 02/03 03/04 04/05 05/06 06 07 08 09
Fats & starches
England -0.811 -0.825 -0.817 -0.801 -0.860 -0.804 -0.818 -0.786 -0.854
Eng. & Wales -0.813 -0.830 -0.813 -0.801 -0.852 -0.806 -0.828 -0.783 -0.869
Scotland -0.902 -0.906 -0.931 -1.060 -0.983 -0.755 -0.902 -0.865 -0.845
N. Ireland -0.980 -0.916 -0.985 -1.006 -0.969 -0.922 -0.963 -0.898 -0.854
with children -0.896 -0.921 -0.907 -0.897 -1.045 -0.914 -0.847 -0.797 -0.930
low income -0.853 -0.803 -0.894 -0.932 -0.894 -0.793 -0.869 -0.958 -0.952
Dairy & Eggs
England -0.417 -0.319 -0.268 -0.393 -0.331 -0.303 -0.391 -0.392 -0.501
Eng. & Wales -0.426 -0.319 -0.277 -0.413 -0.344 -0.314 -0.397 -0.411 -0.519
Scotland -0.588 -0.799 -0.765 -0.883 -0.790 -0.863 -0.741 -0.736 -0.541
N. Ireland -0.597 -0.498 -0.720 -0.532 -0.848 -0.635 -0.574 -0.637 -0.821
with children -0.544 -0.526 -0.470 -0.455 -0.488 -0.697 -0.457 -0.532 -0.693
low income -0.494 -0.415 -0.319 -0.426 -0.389 -0.350 -0.451 -0.723 -0.567
Fish
England -0.367 -0.449 -0.374 -0.327 -0.348 -0.428 -0.337 -0.313 -0.457
Eng. & Wales -0.357 -0.445 -0.382 -0.319 -0.362 -0.428 -0.333 -0.325 -0.455
Scotland -0.583 -0.587 -0.398 -0.493 -0.593 -0.462 -0.556 -0.637 -0.762
N. Ireland -0.603 -0.731 -0.447 -0.682 -0.596 -0.790 -0.671 -0.608 -0.584
with children -0.470 -0.576 -0.565 -0.570 -0.553 -0.605 -0.349 -0.513 -0.612
low income -0.419 -0.473 -0.484 -0.374 -0.436 -0.394 -0.580 -0.539 -0.483
While the own price elasticities for the fats & starches group are broadly similar be-tween subsamples, this is not the case for the own price elasticities of dairy & eggs group.Demand for dairy & eggs is always inelastic and shows substantial variation between sub-samples and across time periods. Except for 2008, the elasticities of England, E&W, andlow income households have a similar pattern of variation ranging between 0.3 and 0.5.With own price elasticity estimates of around 0.8, the demand of Scottish householdsfor dairy & egg products is less inelastic but in 2009 it reaches levels similar to those ofEngland, and E&W. Hence, while households in England, E&W and with low incomes areonly moderately responsive to differences in the price of the dairy & eggs group, Scottishhouseholds respond more strongly to price differences in terms of the amount of dairy &eggs consumed suggesting that they may be more ready to substitute for products fromthis group.
Table 17 show the cross price elasticities. The notation is that the first mentioned foodgroup is the one affected by a price change, while the second one is the food group whosequantity consumed changes as a result of the price change. It reveals for all subsamplesconsistently a complementary relationship between the dairy & eggs and fats & starchesgroup. That is, households facing lower prices for the fats & starches group have a higherdemand for dairy & egg products than identical households facing a higher fats & starchesprices. This effect is not very strong, households in England and E&W, for example, who
34
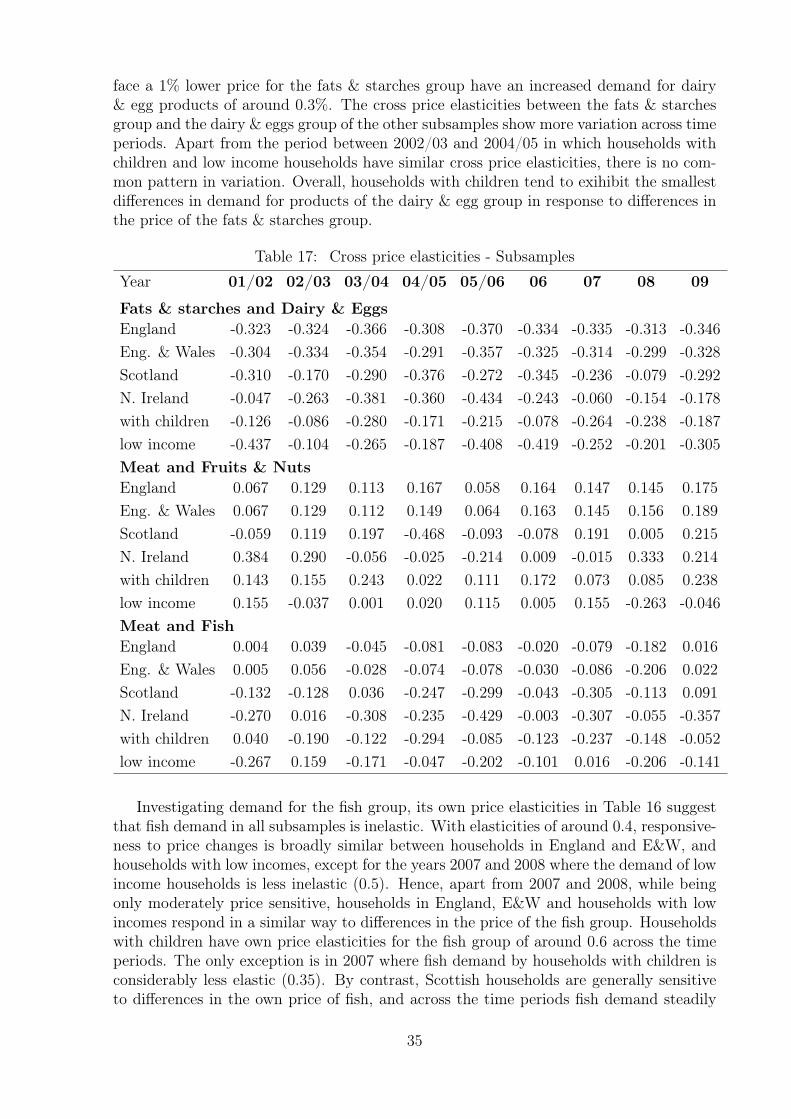
face a 1% lower price for the fats & starches group have an increased demand for dairy& egg products of around 0.3%. The cross price elasticities between the fats & starchesgroup and the dairy & eggs group of the other subsamples show more variation across timeperiods. Apart from the period between 2002/03 and 2004/05 in which households withchildren and low income households have similar cross price elasticities, there is no com-mon pattern in variation. Overall, households with children tend to exihibit the smallestdifferences in demand for products of the dairy & egg group in response to differences inthe price of the fats & starches group.
Table 17: Cross price elasticities - Subsamples
Year 01/02 02/03 03/04 04/05 05/06 06 07 08 09
Fats & starches and Dairy & Eggs
England -0.323 -0.324 -0.366 -0.308 -0.370 -0.334 -0.335 -0.313 -0.346
Eng. & Wales -0.304 -0.334 -0.354 -0.291 -0.357 -0.325 -0.314 -0.299 -0.328
Scotland -0.310 -0.170 -0.290 -0.376 -0.272 -0.345 -0.236 -0.079 -0.292
N. Ireland -0.047 -0.263 -0.381 -0.360 -0.434 -0.243 -0.060 -0.154 -0.178
with children -0.126 -0.086 -0.280 -0.171 -0.215 -0.078 -0.264 -0.238 -0.187
low income -0.437 -0.104 -0.265 -0.187 -0.408 -0.419 -0.252 -0.201 -0.305
Meat and Fruits & Nuts
England 0.067 0.129 0.113 0.167 0.058 0.164 0.147 0.145 0.175
Eng. & Wales 0.067 0.129 0.112 0.149 0.064 0.163 0.145 0.156 0.189
Scotland -0.059 0.119 0.197 -0.468 -0.093 -0.078 0.191 0.005 0.215
N. Ireland 0.384 0.290 -0.056 -0.025 -0.214 0.009 -0.015 0.333 0.214
with children 0.143 0.155 0.243 0.022 0.111 0.172 0.073 0.085 0.238
low income 0.155 -0.037 0.001 0.020 0.115 0.005 0.155 -0.263 -0.046
Meat and Fish
England 0.004 0.039 -0.045 -0.081 -0.083 -0.020 -0.079 -0.182 0.016
Eng. & Wales 0.005 0.056 -0.028 -0.074 -0.078 -0.030 -0.086 -0.206 0.022
Scotland -0.132 -0.128 0.036 -0.247 -0.299 -0.043 -0.305 -0.113 0.091
N. Ireland -0.270 0.016 -0.308 -0.235 -0.429 -0.003 -0.307 -0.055 -0.357
with children 0.040 -0.190 -0.122 -0.294 -0.085 -0.123 -0.237 -0.148 -0.052
low income -0.267 0.159 -0.171 -0.047 -0.202 -0.101 0.016 -0.206 -0.141
Investigating demand for the fish group, its own price elasticities in Table 16 suggestthat fish demand in all subsamples is inelastic. With elasticities of around 0.4, responsive-ness to price changes is broadly similar between households in England and E&W, andhouseholds with low incomes, except for the years 2007 and 2008 where the demand of lowincome households is less inelastic (0.5). Hence, apart from 2007 and 2008, while beingonly moderately price sensitive, households in England, E&W and households with lowincomes respond in a similar way to differences in the price of the fish group. Householdswith children have own price elasticities for the fish group of around 0.6 across the timeperiods. The only exception is in 2007 where fish demand by households with children isconsiderably less elastic (0.35). By contrast, Scottish households are generally sensitiveto differences in the own price of fish, and across the time periods fish demand steadily
35
becomes less inelastic increasing from 0.462 in 2006 to 0.762 in 2009. Hence, for Scottishhouseholds price differences for fish increasingly influence differences in fish consumptionbetween households that are identical in all respects other than the fish price they face.More elastic own price elasticity estimates for the fish group in the subsamples may indi-cate that they contain households who consume low quantities of fish. Generally, the factthat consumption of fish is relatively insensitive to changes of its own price is important ifpolicy makers may wish to increase the consumption of fish across households, especiallythose with children. Fish consumption has been shown to reduce the risk of coronaryheart disease and as such improving consumption may have added social health benefits.This is particularly the case with oily fish which is higher in omega-3 fatty acids. The re-sults suggest that lower prices of fish will not lead to substantially improved consumptionlevels, although the effect is slightly stronger for households with children.
The cross price elasticities between the meat group and the fish group indicate that theyare complements for most of the time periods. The cross price elasticities for England,E&W are particularly small suggesting for these households differences in the price ofmeat influence differences in the consumption fish only to a small extent between house-holds that are identical in all respects other than that they face a different price. Thelargest cross price elasticities can be found for households in Scotland and households withchildren indicating that households facing higher meat prices tend to have a lower fishconsumption than identical households facing lower meat prices. The fact that householdswith children have the largest expenditure elasticities for fish out of all subsamples (seeTable 18) suggests the income effect arising from a price increase of meat is mostly re-sponsible for households with children having lower fish consumption as a result of highermeat prices.
The fruits & nuts group and the meat group are substitutes in all subsamples for most ofthe time periods. Households in England and E&W facing a 1% lower price for meat havea lower consumption of the fruits & nuts group by around 0.1% than identical householdsfacing a higher price for meat. While the cross price elasticities of households with chil-dren show only slightly more varation across time periods than households in Englandand E&W, they vary significantly across time periods for households in Scotland. Hence,the response in terms of quantity of fruits & nuts demanded by Scottish households toprice differences of the meat group is more volatile across the time periods.
The expenditure elasticities in Table 18 show how demand for alcohol, the dairy & eggsgroup, and the fish group is affected by changes in food expenditure. In the case of al-cohol, expenditure elasticities vary little across time periods suggesting that consumers’underlying preferences for alcohol are relatively stable. Households in England, E&W, andhouseholds with children have broadly similar expenditure elasticities for alcohol meaningthat the expenditure proportions occupied by alcohol are broadly similar for householdsin these subsamples that are identical in all respects except for their food expenditure.Expenditure elasticities for Scotland are the lowest with large variations between yearsindicating that alcohol consumption by Scottish households does not differ to a lesserextent between otherwise identical high and low income households than is the case forthe other subsamples. The expenditure elasticities of the dairy & eggs group range be-tween 0.7 for households with children and 1.00 for Scottish households. Out of all thesubsamples, households with children differ the least in their dairy & egg consumption
36

between otherwise identical high and low income households. Finally, the expenditureelasticities of the fish group show that demand for fish is relatively expenditure inelasticfor all subsamples. This suggests that fish consumption does not differ markedly betweenotherwise identical high and low income households indicating that low fish consumptionis not the direct result of having a low income. This is particularly true for Scottishhouseholds who from 2004/05 onwards have the lowest expenditure elasticities out of allsamples (except for 2007) indicating that the proportion of expenditure they spend onfish tends to be smaller than is the case for the households in the other subsamples.Moreover, households with children have the highest expenditure elasticities for fish sug-gesting that if confronted with general food price inflation and therefore a reduction oftheir food expenditure, particularly families with children will reduce their consumptionof oily fish.
Table 18: Expenditure elasticities - Subsamples
Year 01/02 02/03 03/04 04/05 05/06 06 07 08 09
Alcohol
England 0.888 0.902 0.908 0.906 0.890 0.875 0.918 0.859 0.913
Eng. & Wales 0.900 0.917 0.888 0.901 0.909 0.876 0.909 0.847 0.905
Scotland 0.849 0.751 0.565 0.899 0.832 0.836 0.634 0.816 0.725
N. Ireland 0.767 0.736 0.740 0.596 0.716 0.863 0.828 0.630 0.587
with children 0.950 0.957 0.861 0.964 0.972 0.928 0.905 0.917 0.924
low income 0.827 0.908 0.847 0.916 0.829 0.828 0.905 0.893 0.792
Dairy & Eggs
England 0.894 0.872 0.902 0.900 0.912 0.924 0.915 0.933 0.903
Eng. & Wales 0.892 0.872 0.905 0.897 0.906 0.922 0.918 0.933 0.906
Scotland 0.874 0.935 0.917 0.926 0.876 0.866 1.000 0.934 0.922
N. Ireland 0.849 0.916 0.889 0.912 0.893 0.883 0.868 0.959 0.859
with children 0.791 0.764 0.839 0.795 0.821 0.874 0.867 0.905 0.860
low income 0.892 0.824 0.909 0.896 0.934 0.949 0.928 0.949 0.884
Fish
England 0.655 0.658 0.705 0.658 0.709 0.723 0.693 0.704 0.691
Eng. & Wales 0.650 0.650 0.697 0.654 0.702 0.712 0.690 0.708 0.695
Scotland 0.739 0.730 0.727 0.699 0.624 0.654 0.640 0.709 0.691
N. Ireland 0.676 0.659 0.669 0.708 0.679 0.636 0.578 0.532 0.639
with children 0.682 0.751 0.623 0.725 0.701 0.737 0.739 0.734 0.760
low income 0.672 0.631 0.762 0.716 0.648 0.725 0.722 0.591 0.696
5.5 Nutrient elasticities
The nutrient elasticities were computed as described in section 4.1.2 with selected nutrientelasticities for the year 2001/02 being reported in Table 19. The nutrient price elasticitiesshow the effects on nutrients in response to changes in the prices of the main food groupsand changes in food expenditure.
37
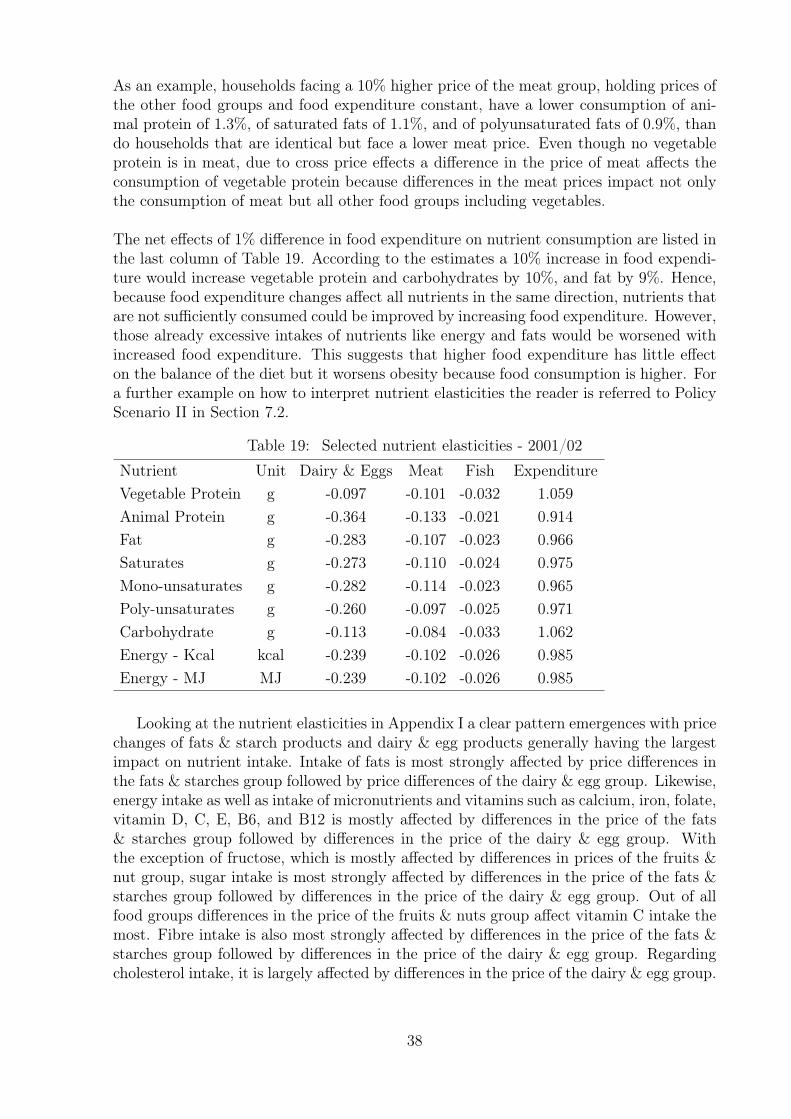
As an example, households facing a 10% higher price of the meat group, holding prices ofthe other food groups and food expenditure constant, have a lower consumption of ani-mal protein of 1.3%, of saturated fats of 1.1%, and of polyunsaturated fats of 0.9%, thando households that are identical but face a lower meat price. Even though no vegetableprotein is in meat, due to cross price effects a difference in the price of meat affects theconsumption of vegetable protein because differences in the meat prices impact not onlythe consumption of meat but all other food groups including vegetables.
The net effects of 1% difference in food expenditure on nutrient consumption are listed inthe last column of Table 19. According to the estimates a 10% increase in food expendi-ture would increase vegetable protein and carbohydrates by 10%, and fat by 9%. Hence,because food expenditure changes affect all nutrients in the same direction, nutrients thatare not sufficiently consumed could be improved by increasing food expenditure. However,those already excessive intakes of nutrients like energy and fats would be worsened withincreased food expenditure. This suggests that higher food expenditure has little effecton the balance of the diet but it worsens obesity because food consumption is higher. Fora further example on how to interpret nutrient elasticities the reader is referred to PolicyScenario II in Section 7.2.
Table 19: Selected nutrient elasticities - 2001/02
Nutrient Unit Dairy & Eggs Meat Fish Expenditure
Vegetable Protein g -0.097 -0.101 -0.032 1.059
Animal Protein g -0.364 -0.133 -0.021 0.914
Fat g -0.283 -0.107 -0.023 0.966
Saturates g -0.273 -0.110 -0.024 0.975
Mono-unsaturates g -0.282 -0.114 -0.023 0.965
Poly-unsaturates g -0.260 -0.097 -0.025 0.971
Carbohydrate g -0.113 -0.084 -0.033 1.062
Energy - Kcal kcal -0.239 -0.102 -0.026 0.985
Energy - MJ MJ -0.239 -0.102 -0.026 0.985
Looking at the nutrient elasticities in Appendix I a clear pattern emergences with pricechanges of fats & starch products and dairy & egg products generally having the largestimpact on nutrient intake. Intake of fats is most strongly affected by price differences inthe fats & starches group followed by price differences of the dairy & egg group. Likewise,energy intake as well as intake of micronutrients and vitamins such as calcium, iron, folate,vitamin D, C, E, B6, and B12 is mostly affected by differences in the price of the fats& starches group followed by differences in the price of the dairy & egg group. Withthe exception of fructose, which is mostly affected by differences in prices of the fruits &nut group, sugar intake is most strongly affected by differences in the price of the fats &starches group followed by differences in the price of the dairy & egg group. Out of allfood groups differences in the price of the fruits & nuts group affect vitamin C intake themost. Fibre intake is also most strongly affected by differences in the price of the fats &starches group followed by differences in the price of the dairy & egg group. Regardingcholesterol intake, it is largely affected by differences in the price of the dairy & egg group.
38
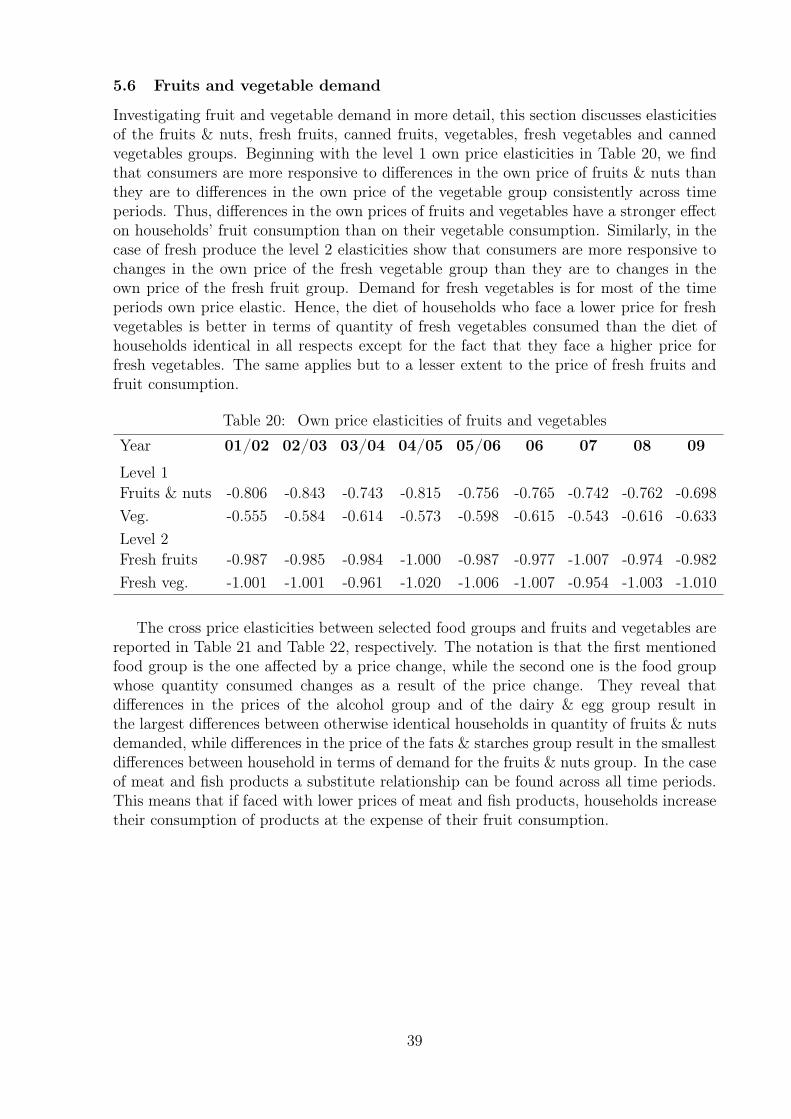
5.6 Fruits and vegetable demand
Investigating fruit and vegetable demand in more detail, this section discusses elasticitiesof the fruits & nuts, fresh fruits, canned fruits, vegetables, fresh vegetables and cannedvegetables groups. Beginning with the level 1 own price elasticities in Table 20, we findthat consumers are more responsive to differences in the own price of fruits & nuts thanthey are to differences in the own price of the vegetable group consistently across timeperiods. Thus, differences in the own prices of fruits and vegetables have a stronger effecton households’ fruit consumption than on their vegetable consumption. Similarly, in thecase of fresh produce the level 2 elasticities show that consumers are more responsive tochanges in the own price of the fresh vegetable group than they are to changes in theown price of the fresh fruit group. Demand for fresh vegetables is for most of the timeperiods own price elastic. Hence, the diet of households who face a lower price for freshvegetables is better in terms of quantity of fresh vegetables consumed than the diet ofhouseholds identical in all respects except for the fact that they face a higher price forfresh vegetables. The same applies but to a lesser extent to the price of fresh fruits andfruit consumption.
Table 20: Own price elasticities of fruits and vegetables
Year 01/02 02/03 03/04 04/05 05/06 06 07 08 09
Level 1
Fruits & nuts -0.806 -0.843 -0.743 -0.815 -0.756 -0.765 -0.742 -0.762 -0.698
Veg. -0.555 -0.584 -0.614 -0.573 -0.598 -0.615 -0.543 -0.616 -0.633
Level 2
Fresh fruits -0.987 -0.985 -0.984 -1.000 -0.987 -0.977 -1.007 -0.974 -0.982
Fresh veg. -1.001 -1.001 -0.961 -1.020 -1.006 -1.007 -0.954 -1.003 -1.010
The cross price elasticities between selected food groups and fruits and vegetables arereported in Table 21 and Table 22, respectively. The notation is that the first mentionedfood group is the one affected by a price change, while the second one is the food groupwhose quantity consumed changes as a result of the price change. They reveal thatdifferences in the prices of the alcohol group and of the dairy & egg group result inthe largest differences between otherwise identical households in quantity of fruits & nutsdemanded, while differences in the price of the fats & starches group result in the smallestdifferences between household in terms of demand for the fruits & nuts group. In the caseof meat and fish products a substitute relationship can be found across all time periods.This means that if faced with lower prices of meat and fish products, households increasetheir consumption of products at the expense of their fruit consumption.
39
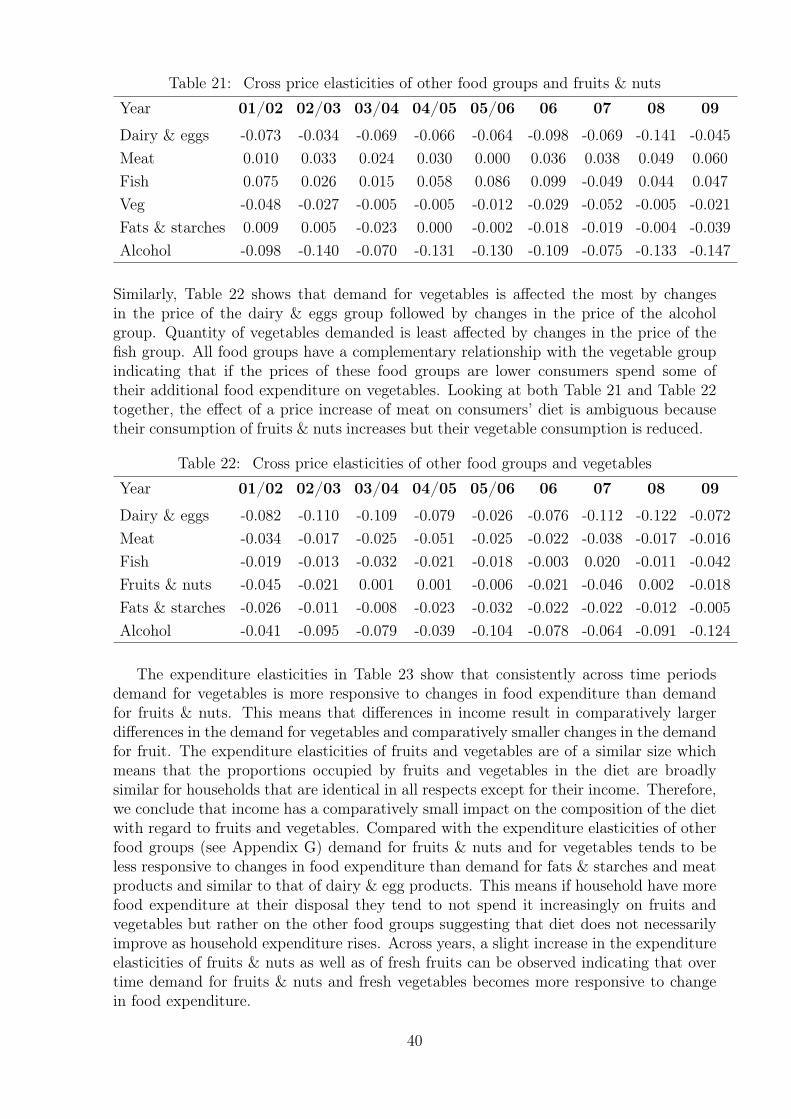
Table 21: Cross price elasticities of other food groups and fruits & nuts
Year 01/02 02/03 03/04 04/05 05/06 06 07 08 09
Dairy & eggs -0.073 -0.034 -0.069 -0.066 -0.064 -0.098 -0.069 -0.141 -0.045
Meat 0.010 0.033 0.024 0.030 0.000 0.036 0.038 0.049 0.060
Fish 0.075 0.026 0.015 0.058 0.086 0.099 -0.049 0.044 0.047
Veg -0.048 -0.027 -0.005 -0.005 -0.012 -0.029 -0.052 -0.005 -0.021
Fats & starches 0.009 0.005 -0.023 0.000 -0.002 -0.018 -0.019 -0.004 -0.039
Alcohol -0.098 -0.140 -0.070 -0.131 -0.130 -0.109 -0.075 -0.133 -0.147
Similarly, Table 22 shows that demand for vegetables is affected the most by changesin the price of the dairy & eggs group followed by changes in the price of the alcoholgroup. Quantity of vegetables demanded is least affected by changes in the price of thefish group. All food groups have a complementary relationship with the vegetable groupindicating that if the prices of these food groups are lower consumers spend some oftheir additional food expenditure on vegetables. Looking at both Table 21 and Table 22together, the effect of a price increase of meat on consumers’ diet is ambiguous becausetheir consumption of fruits & nuts increases but their vegetable consumption is reduced.
Table 22: Cross price elasticities of other food groups and vegetables
Year 01/02 02/03 03/04 04/05 05/06 06 07 08 09
Dairy & eggs -0.082 -0.110 -0.109 -0.079 -0.026 -0.076 -0.112 -0.122 -0.072
Meat -0.034 -0.017 -0.025 -0.051 -0.025 -0.022 -0.038 -0.017 -0.016
Fish -0.019 -0.013 -0.032 -0.021 -0.018 -0.003 0.020 -0.011 -0.042
Fruits & nuts -0.045 -0.021 0.001 0.001 -0.006 -0.021 -0.046 0.002 -0.018
Fats & starches -0.026 -0.011 -0.008 -0.023 -0.032 -0.022 -0.022 -0.012 -0.005
Alcohol -0.041 -0.095 -0.079 -0.039 -0.104 -0.078 -0.064 -0.091 -0.124
The expenditure elasticities in Table 23 show that consistently across time periodsdemand for vegetables is more responsive to changes in food expenditure than demandfor fruits & nuts. This means that differences in income result in comparatively largerdifferences in the demand for vegetables and comparatively smaller changes in the demandfor fruit. The expenditure elasticities of fruits and vegetables are of a similar size whichmeans that the proportions occupied by fruits and vegetables in the diet are broadlysimilar for households that are identical in all respects except for their income. Therefore,we conclude that income has a comparatively small impact on the composition of the dietwith regard to fruits and vegetables. Compared with the expenditure elasticities of otherfood groups (see Appendix G) demand for fruits & nuts and for vegetables tends to beless responsive to changes in food expenditure than demand for fats & starches and meatproducts and similar to that of dairy & egg products. This means if household have morefood expenditure at their disposal they tend to not spend it increasingly on fruits andvegetables but rather on the other food groups suggesting that diet does not necessarilyimprove as household expenditure rises. Across years, a slight increase in the expenditureelasticities of fruits & nuts as well as of fresh fruits can be observed indicating that overtime demand for fruits & nuts and fresh vegetables becomes more responsive to changein food expenditure.
40
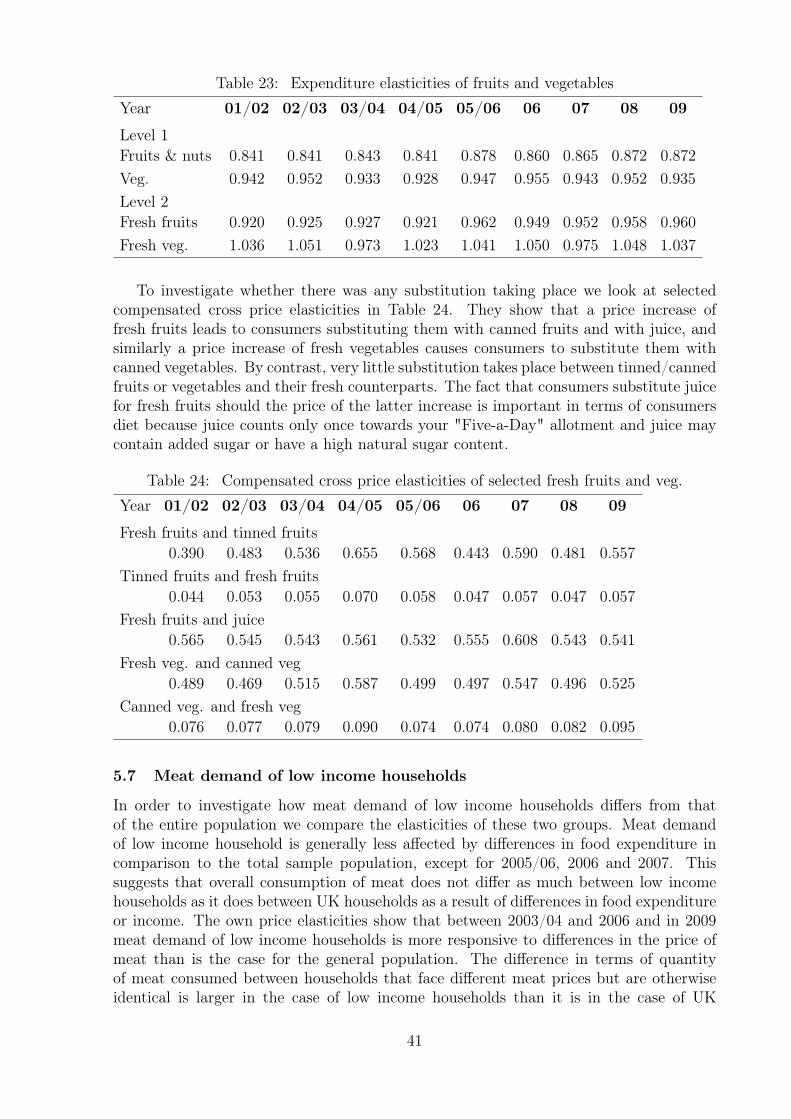
Table 23: Expenditure elasticities of fruits and vegetables
Year 01/02 02/03 03/04 04/05 05/06 06 07 08 09
Level 1
Fruits & nuts 0.841 0.841 0.843 0.841 0.878 0.860 0.865 0.872 0.872
Veg. 0.942 0.952 0.933 0.928 0.947 0.955 0.943 0.952 0.935
Level 2
Fresh fruits 0.920 0.925 0.927 0.921 0.962 0.949 0.952 0.958 0.960
Fresh veg. 1.036 1.051 0.973 1.023 1.041 1.050 0.975 1.048 1.037
To investigate whether there was any substitution taking place we look at selectedcompensated cross price elasticities in Table 24. They show that a price increase offresh fruits leads to consumers substituting them with canned fruits and with juice, andsimilarly a price increase of fresh vegetables causes consumers to substitute them withcanned vegetables. By contrast, very little substitution takes place between tinned/cannedfruits or vegetables and their fresh counterparts. The fact that consumers substitute juicefor fresh fruits should the price of the latter increase is important in terms of consumersdiet because juice counts only once towards your "Five-a-Day" allotment and juice maycontain added sugar or have a high natural sugar content.
Table 24: Compensated cross price elasticities of selected fresh fruits and veg.
Year 01/02 02/03 03/04 04/05 05/06 06 07 08 09
Fresh fruits and tinned fruits
0.390 0.483 0.536 0.655 0.568 0.443 0.590 0.481 0.557
Tinned fruits and fresh fruits
0.044 0.053 0.055 0.070 0.058 0.047 0.057 0.047 0.057
Fresh fruits and juice
0.565 0.545 0.543 0.561 0.532 0.555 0.608 0.543 0.541
Fresh veg. and canned veg
0.489 0.469 0.515 0.587 0.499 0.497 0.547 0.496 0.525
Canned veg. and fresh veg
0.076 0.077 0.079 0.090 0.074 0.074 0.080 0.082 0.095
5.7 Meat demand of low income households
In order to investigate how meat demand of low income households differs from thatof the entire population we compare the elasticities of these two groups. Meat demandof low income household is generally less affected by differences in food expenditure incomparison to the total sample population, except for 2005/06, 2006 and 2007. Thissuggests that overall consumption of meat does not differ as much between low incomehouseholds as it does between UK households as a result of differences in food expenditureor income. The own price elasticities show that between 2003/04 and 2006 and in 2009meat demand of low income households is more responsive to differences in the price ofmeat than is the case for the general population. The difference in terms of quantityof meat consumed between households that face different meat prices but are otherwiseidentical is larger in the case of low income households than it is in the case of UK
41
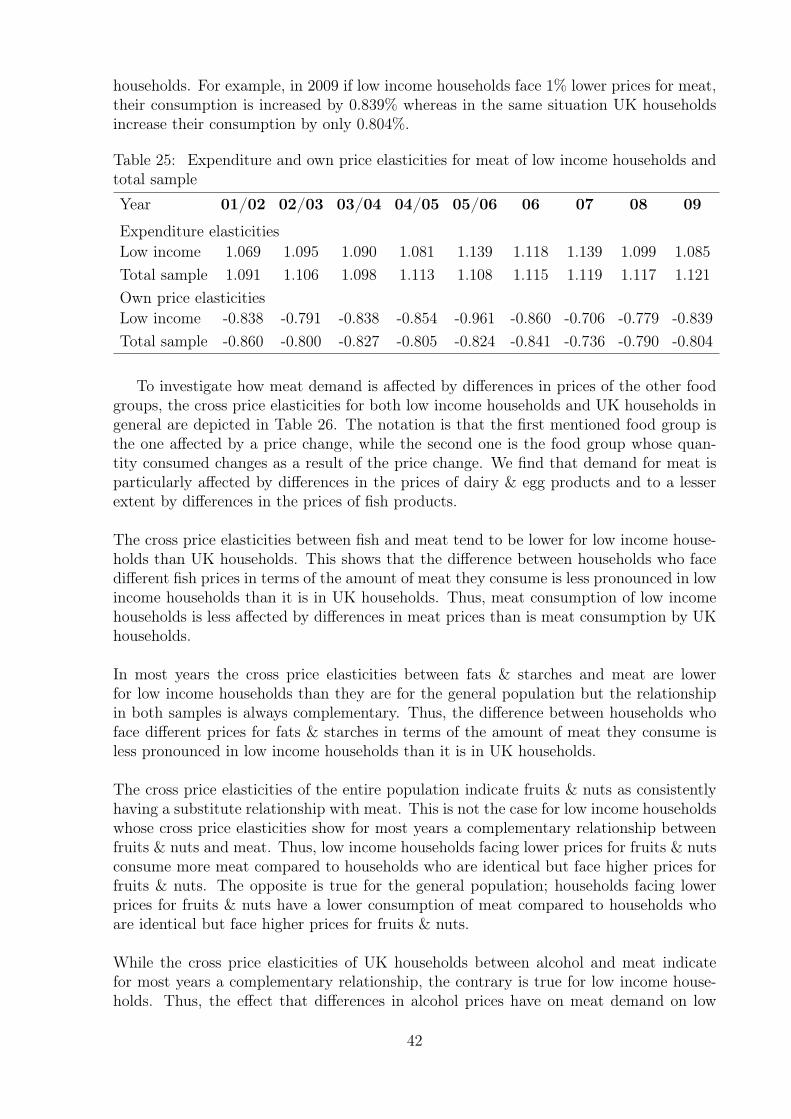
households. For example, in 2009 if low income households face 1% lower prices for meat,their consumption is increased by 0.839% whereas in the same situation UK householdsincrease their consumption by only 0.804%.
Table 25: Expenditure and own price elasticities for meat of low income households andtotal sample
Year 01/02 02/03 03/04 04/05 05/06 06 07 08 09
Expenditure elasticities
Low income 1.069 1.095 1.090 1.081 1.139 1.118 1.139 1.099 1.085
Total sample 1.091 1.106 1.098 1.113 1.108 1.115 1.119 1.117 1.121
Own price elasticities
Low income -0.838 -0.791 -0.838 -0.854 -0.961 -0.860 -0.706 -0.779 -0.839
Total sample -0.860 -0.800 -0.827 -0.805 -0.824 -0.841 -0.736 -0.790 -0.804
To investigate how meat demand is affected by differences in prices of the other foodgroups, the cross price elasticities for both low income households and UK households ingeneral are depicted in Table 26. The notation is that the first mentioned food group isthe one affected by a price change, while the second one is the food group whose quan-tity consumed changes as a result of the price change. We find that demand for meat isparticularly affected by differences in the prices of dairy & egg products and to a lesserextent by differences in the prices of fish products.
The cross price elasticities between fish and meat tend to be lower for low income house-holds than UK households. This shows that the difference between households who facedifferent fish prices in terms of the amount of meat they consume is less pronounced in lowincome households than it is in UK households. Thus, meat consumption of low incomehouseholds is less affected by differences in meat prices than is meat consumption by UKhouseholds.
In most years the cross price elasticities between fats & starches and meat are lowerfor low income households than they are for the general population but the relationshipin both samples is always complementary. Thus, the difference between households whoface different prices for fats & starches in terms of the amount of meat they consume isless pronounced in low income households than it is in UK households.
The cross price elasticities of the entire population indicate fruits & nuts as consistentlyhaving a substitute relationship with meat. This is not the case for low income householdswhose cross price elasticities show for most years a complementary relationship betweenfruits & nuts and meat. Thus, low income households facing lower prices for fruits & nutsconsume more meat compared to households who are identical but face higher prices forfruits & nuts. The opposite is true for the general population; households facing lowerprices for fruits & nuts have a lower consumption of meat compared to households whoare identical but face higher prices for fruits & nuts.
While the cross price elasticities of UK households between alcohol and meat indicatefor most years a complementary relationship, the contrary is true for low income house-holds. Thus, the effect that differences in alcohol prices have on meat demand on low
42
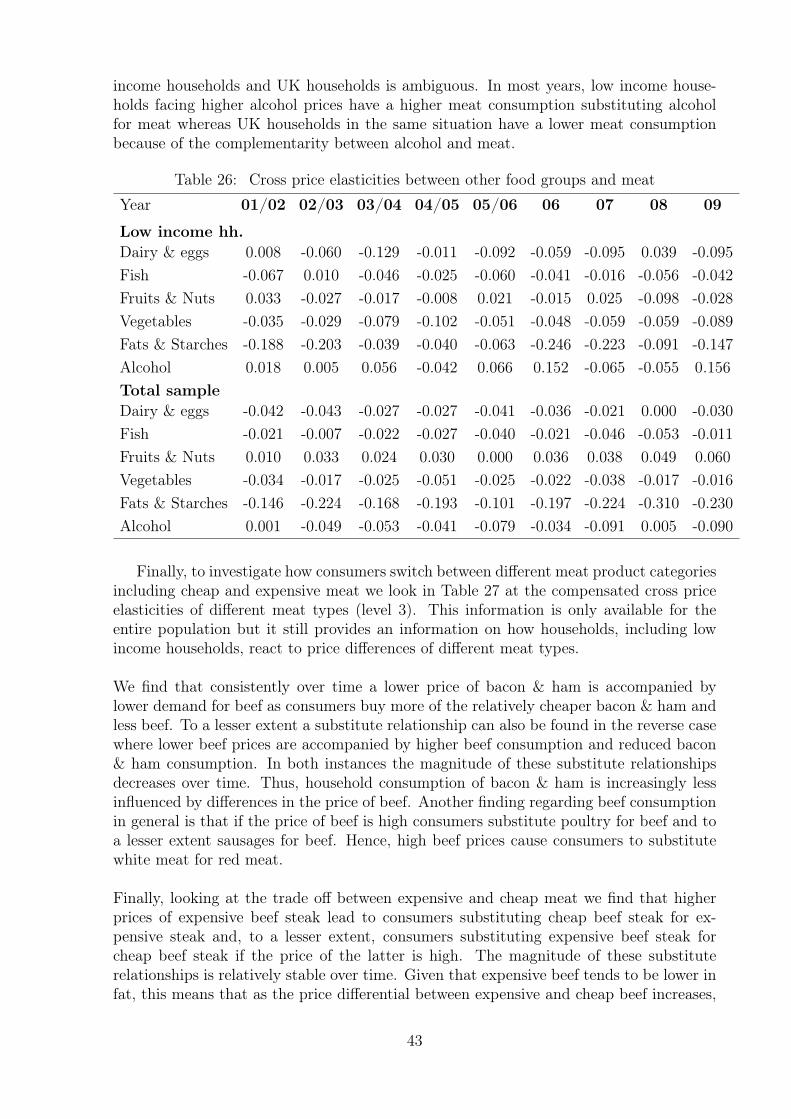
income households and UK households is ambiguous. In most years, low income house-holds facing higher alcohol prices have a higher meat consumption substituting alcoholfor meat whereas UK households in the same situation have a lower meat consumptionbecause of the complementarity between alcohol and meat.
Table 26: Cross price elasticities between other food groups and meat
Year 01/02 02/03 03/04 04/05 05/06 06 07 08 09
Low income hh.
Dairy & eggs 0.008 -0.060 -0.129 -0.011 -0.092 -0.059 -0.095 0.039 -0.095
Fish -0.067 0.010 -0.046 -0.025 -0.060 -0.041 -0.016 -0.056 -0.042
Fruits & Nuts 0.033 -0.027 -0.017 -0.008 0.021 -0.015 0.025 -0.098 -0.028
Vegetables -0.035 -0.029 -0.079 -0.102 -0.051 -0.048 -0.059 -0.059 -0.089
Fats & Starches -0.188 -0.203 -0.039 -0.040 -0.063 -0.246 -0.223 -0.091 -0.147
Alcohol 0.018 0.005 0.056 -0.042 0.066 0.152 -0.065 -0.055 0.156
Total sample
Dairy & eggs -0.042 -0.043 -0.027 -0.027 -0.041 -0.036 -0.021 0.000 -0.030
Fish -0.021 -0.007 -0.022 -0.027 -0.040 -0.021 -0.046 -0.053 -0.011
Fruits & Nuts 0.010 0.033 0.024 0.030 0.000 0.036 0.038 0.049 0.060
Vegetables -0.034 -0.017 -0.025 -0.051 -0.025 -0.022 -0.038 -0.017 -0.016
Fats & Starches -0.146 -0.224 -0.168 -0.193 -0.101 -0.197 -0.224 -0.310 -0.230
Alcohol 0.001 -0.049 -0.053 -0.041 -0.079 -0.034 -0.091 0.005 -0.090
Finally, to investigate how consumers switch between different meat product categoriesincluding cheap and expensive meat we look in Table 27 at the compensated cross priceelasticities of different meat types (level 3). This information is only available for theentire population but it still provides an information on how households, including lowincome households, react to price differences of different meat types.
We find that consistently over time a lower price of bacon & ham is accompanied bylower demand for beef as consumers buy more of the relatively cheaper bacon & ham andless beef. To a lesser extent a substitute relationship can also be found in the reverse casewhere lower beef prices are accompanied by higher beef consumption and reduced bacon& ham consumption. In both instances the magnitude of these substitute relationshipsdecreases over time. Thus, household consumption of bacon & ham is increasingly lessinfluenced by differences in the price of beef. Another finding regarding beef consumptionin general is that if the price of beef is high consumers substitute poultry for beef and toa lesser extent sausages for beef. Hence, high beef prices cause consumers to substitutewhite meat for red meat.
Finally, looking at the trade off between expensive and cheap meat we find that higherprices of expensive beef steak lead to consumers substituting cheap beef steak for ex-pensive steak and, to a lesser extent, consumers substituting expensive beef steak forcheap beef steak if the price of the latter is high. The magnitude of these substituterelationships is relatively stable over time. Given that expensive beef tends to be lower infat, this means that as the price differential between expensive and cheap beef increases,
43

consumers tend to consume more of the high fat albeit cheaper beef.
Table 27: Compensated cross price elasticities of different meats - Total sample
Year 01/02 02/03 03/04 04/05 05/06 06 07 08 09
Bacon & ham and beef
0.120 0.140 0.109 0.121 0.145 0.145 0.147 0.143 0.093
Beef and bacon & ham
0.102 0.120 0.092 0.111 0.134 0.139 0.140 0.128 0.084
Lamb and pork
0.175 0.026 0.148 0.131 0.034 0.060 0.111 0.154 0.083
Poultry and bacon & ham
0.174 0.165 0.164 0.157 0.171 0.160 0.149 0.170 0.190
Beef and poultry
0.129 0.062 0.099 0.112 0.100 0.129 0.098 0.130 0.074
Beef and sausages
0.068 0.007 0.030 0.022 0.052 0.040 0.020 0.161 0.085
Expensive beef steak and cheap beef steak
0.29 0.24 0.32 0.34 0.26 0.25 0.22 0.30 0.24
Cheap beef steak and expensive beef steak
0.11 0.10 0.11 0.12 0.12 0.12 0.09 0.13 0.12
6 Comparison with the National Food Survey 2000
The section draws out the differences and similarities between our results from the DAIDSreported in Section 3.1.2 and the estimates of the National Food Survey 2000 (NFS).Given that the time period covered in the latter is from 1998 to 2000, while the DAIDScovers 2001 to 2009 and given that the food groupings are different, the direct compar-ison between the estimates in both reports is not straight forward. Moreover, unlikethe DAIDS, the NFS does not provide short run elasticities (see Table 5) meaning it doesnot provide information on short run demand responses to price and expenditure changes.
Comparing the own price elasticities in Table 4 with those in Table 6.1 of the NFS,we find that several of the NFS estimates are not significant whereas all of the own priceelasticities in the DAIDS are significant. Large differences exist between the own priceelasticities of the dairy & eggs group in the DAIDS (-0.999) and the estimates for milk& cream (-0.36) and eggs (-0.18) in the NFS. Similarly, the own price elasticities of fruits& nuts in the DAIDS (-1.381) and fresh fruits (-0.29) and other fruits (-0.81) in the NFSare very different. In both instances, the DAIDS results reveal consumers as being muchmore responsive to own price changes of milk products and fruits than the NFS does. Bycontrast, Table 28 shows that the results of the the DAIDS and the NFS are broadly sim-ilar with regard to own price elasticities of meat products, fish, fats and starch productsand vegetables.
44

Table 28: Comparison of selected ownprice elasticities
DAIDS NFS 2000
Meat 0.58 Carcase meat 0.69
Meat products 0.52
Fish 0.70 Fresh fish 0.8
Frozen fish 0.32
Fats & 0.84 Fats 0.75
Starches Bread 0.40
Other cereal 0.94
Fresh potatoes 0.12
Sugar 0.79
Veg. 0.65 Fresh veg. 0.29
Other veg. 0.81
A comparison between the cross price elasticities is not straight forward due to the differ-ent food groupings. One exception is the cross price elasticity between fruits & nuts andfish in the DAIDS, which is -0.434, and the cross price elasticities between other fruits andprepared fish (-0.22) and other fruits and frozen fish (0.13). Hence, the DAIDS suggestsa larger complementary relationship between fruits and fish albeit including nuts in theestimation.
The long run DAIDS expenditure elasticities in Table 4 are generally larger than thosereported in the NFS in Table 6.3, and, unlike in the NFS, they are all significant. Assum-ing that consumers’ response to changes in food expenditure did not change drasticallybetween the time periods under investigation, the marked differences in expenditure elas-ticity estimates is likely due to the different estimation procedures used in the DAIDSwhich include the imposition of curvature and the estimation of the model in a cointe-grating framework.
7 Policy Scenarios
This section provides some guidance on the model and elasticity estimates that shouldbe considered in the simulation of various policy scenarios. It should be noted that thesepolicy scenarios are for illustrative purpose only, they are not under consideration by thegovernment. Although the first policy scenario involves a 5% price change, we generallyrecommand focusing on 1% price changes. For large price changes the elastacity estimatesgive a broad indication of the resultant quantity changes but they will by no means beaccurate.
7.1 Scenario I: A fruit and vegetables subsidy of five percent and its effecton low income households
The level 1 models show demand for these two food groups changes in response to pricesand food expenditure. For these models the elasticities are always conditional. Sincea fruit and vegetable subsidy implies that the price of these food groups decrease and
45
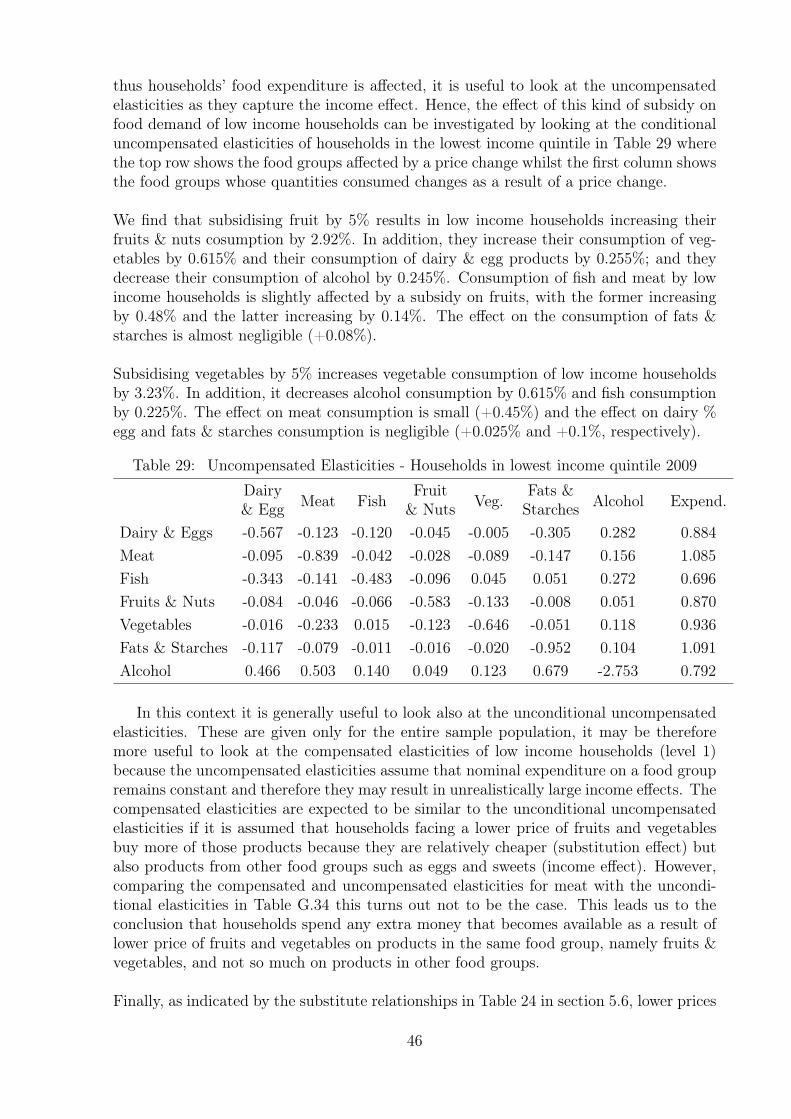
thus households’ food expenditure is affected, it is useful to look at the uncompensatedelasticities as they capture the income effect. Hence, the effect of this kind of subsidy onfood demand of low income households can be investigated by looking at the conditionaluncompensated elasticities of households in the lowest income quintile in Table 29 wherethe top row shows the food groups affected by a price change whilst the first column showsthe food groups whose quantities consumed changes as a result of a price change.
We find that subsidising fruit by 5% results in low income households increasing theirfruits & nuts cosumption by 2.92%. In addition, they increase their consumption of veg-etables by 0.615% and their consumption of dairy & egg products by 0.255%; and theydecrease their consumption of alcohol by 0.245%. Consumption of fish and meat by lowincome households is slightly affected by a subsidy on fruits, with the former increasingby 0.48% and the latter increasing by 0.14%. The effect on the consumption of fats &starches is almost negligible (+0.08%).
Subsidising vegetables by 5% increases vegetable consumption of low income householdsby 3.23%. In addition, it decreases alcohol consumption by 0.615% and fish consumptionby 0.225%. The effect on meat consumption is small (+0.45%) and the effect on dairy %egg and fats & starches consumption is negligible (+0.025% and +0.1%, respectively).
Table 29: Uncompensated Elasticities - Households in lowest income quintile 2009
DairyMeat Fish
FruitVeg.
Fats &Alcohol Expend.
& Egg & Nuts Starches
Dairy & Eggs -0.567 -0.123 -0.120 -0.045 -0.005 -0.305 0.282 0.884
Meat -0.095 -0.839 -0.042 -0.028 -0.089 -0.147 0.156 1.085
Fish -0.343 -0.141 -0.483 -0.096 0.045 0.051 0.272 0.696
Fruits & Nuts -0.084 -0.046 -0.066 -0.583 -0.133 -0.008 0.051 0.870
Vegetables -0.016 -0.233 0.015 -0.123 -0.646 -0.051 0.118 0.936
Fats & Starches -0.117 -0.079 -0.011 -0.016 -0.020 -0.952 0.104 1.091
Alcohol 0.466 0.503 0.140 0.049 0.123 0.679 -2.753 0.792
In this context it is generally useful to look also at the unconditional uncompensatedelasticities. These are given only for the entire sample population, it may be thereforemore useful to look at the compensated elasticities of low income households (level 1)because the uncompensated elasticities assume that nominal expenditure on a food groupremains constant and therefore they may result in unrealistically large income effects. Thecompensated elasticities are expected to be similar to the unconditional uncompensatedelasticities if it is assumed that households facing a lower price of fruits and vegetablesbuy more of those products because they are relatively cheaper (substitution effect) butalso products from other food groups such as eggs and sweets (income effect). However,comparing the compensated and uncompensated elasticities for meat with the uncondi-tional elasticities in Table G.34 this turns out not to be the case. This leads us to theconclusion that households spend any extra money that becomes available as a result oflower price of fruits and vegetables on products in the same food group, namely fruits &vegetables, and not so much on products in other food groups.
Finally, as indicated by the substitute relationships in Table 24 in section 5.6, lower prices
46
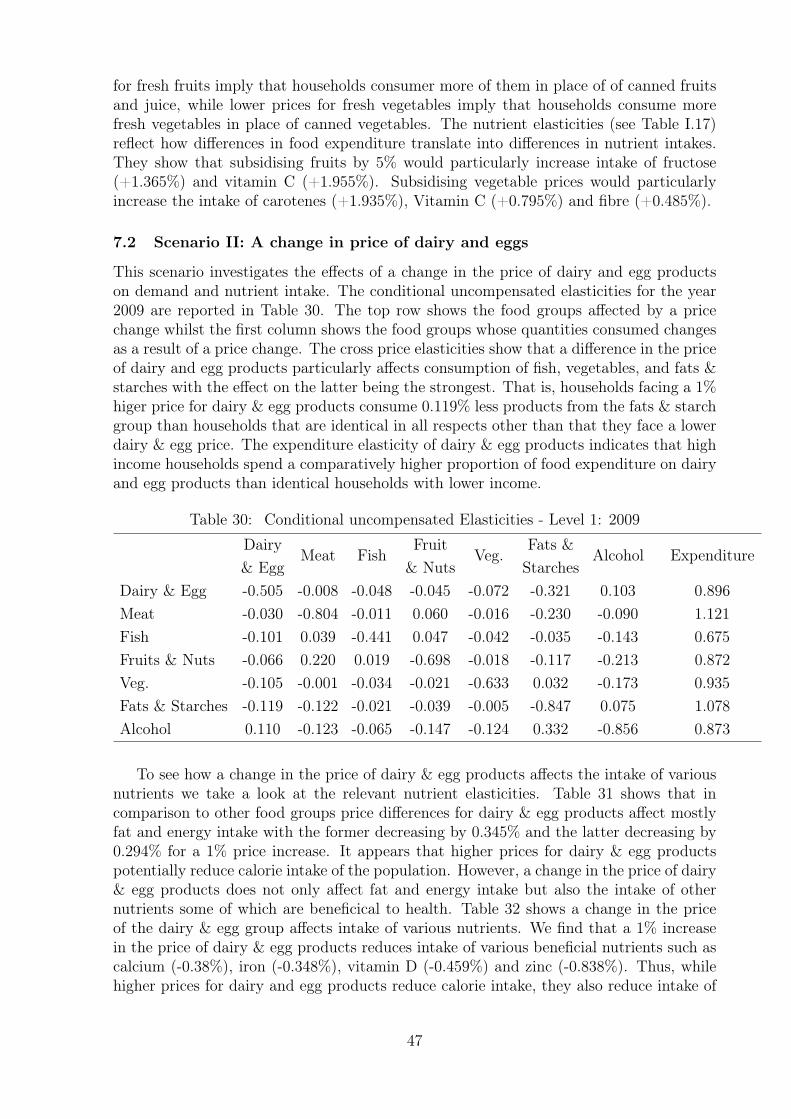
for fresh fruits imply that households consumer more of them in place of of canned fruitsand juice, while lower prices for fresh vegetables imply that households consume morefresh vegetables in place of canned vegetables. The nutrient elasticities (see Table I.17)reflect how differences in food expenditure translate into differences in nutrient intakes.They show that subsidising fruits by 5% would particularly increase intake of fructose(+1.365%) and vitamin C (+1.955%). Subsidising vegetable prices would particularlyincrease the intake of carotenes (+1.935%), Vitamin C (+0.795%) and fibre (+0.485%).
7.2 Scenario II: A change in price of dairy and eggs
This scenario investigates the effects of a change in the price of dairy and egg productson demand and nutrient intake. The conditional uncompensated elasticities for the year2009 are reported in Table 30. The top row shows the food groups affected by a pricechange whilst the first column shows the food groups whose quantities consumed changesas a result of a price change. The cross price elasticities show that a difference in the priceof dairy and egg products particularly affects consumption of fish, vegetables, and fats &starches with the effect on the latter being the strongest. That is, households facing a 1%higer price for dairy & egg products consume 0.119% less products from the fats & starchgroup than households that are identical in all respects other than that they face a lowerdairy & egg price. The expenditure elasticity of dairy & egg products indicates that highincome households spend a comparatively higher proportion of food expenditure on dairyand egg products than identical households with lower income.
Table 30: Conditional uncompensated Elasticities - Level 1: 2009
DairyMeat Fish
FruitVeg.
Fats &Alcohol Expenditure
& Egg & Nuts Starches
Dairy & Egg -0.505 -0.008 -0.048 -0.045 -0.072 -0.321 0.103 0.896
Meat -0.030 -0.804 -0.011 0.060 -0.016 -0.230 -0.090 1.121
Fish -0.101 0.039 -0.441 0.047 -0.042 -0.035 -0.143 0.675
Fruits & Nuts -0.066 0.220 0.019 -0.698 -0.018 -0.117 -0.213 0.872
Veg. -0.105 -0.001 -0.034 -0.021 -0.633 0.032 -0.173 0.935
Fats & Starches -0.119 -0.122 -0.021 -0.039 -0.005 -0.847 0.075 1.078
Alcohol 0.110 -0.123 -0.065 -0.147 -0.124 0.332 -0.856 0.873
To see how a change in the price of dairy & egg products affects the intake of variousnutrients we take a look at the relevant nutrient elasticities. Table 31 shows that incomparison to other food groups price differences for dairy & egg products affect mostlyfat and energy intake with the former decreasing by 0.345% and the latter decreasing by0.294% for a 1% price increase. It appears that higher prices for dairy & egg productspotentially reduce calorie intake of the population. However, a change in the price of dairy& egg products does not only affect fat and energy intake but also the intake of othernutrients some of which are beneficical to health. Table 32 shows a change in the priceof the dairy & egg group affects intake of various nutrients. We find that a 1% increasein the price of dairy & egg products reduces intake of various beneficial nutrients such ascalcium (-0.38%), iron (-0.348%), vitamin D (-0.459%) and zinc (-0.838%). Thus, whilehigher prices for dairy and egg products reduce calorie intake, they also reduce intake of
47

nutrients that are beneficial to health which means that the effect of a change in the priceor dairy & products is ambiguous.
Table 31: Selected Nutrient elasticities - 2009
NutrientDairy
Meat FishFruit
Veg.Fats &
Alcohol Expend.& Egg & Nuts Starches
Fat -0.345 -0.084 -0.039 -0.051 -0.052 -0.466 0.073 0.963
Saturates -0.334 -0.093 -0.037 -0.045 -0.047 -0.491 0.075 0.971
Mono-unsat. -0.344 -0.088 -0.038 -0.053 -0.050 -0.460 0.071 0.962
Poly-unsat. -0.318 -0.074 -0.038 -0.065 -0.058 -0.474 0.061 0.966
Energy - Kcal -0.294 -0.091 -0.036 -0.056 -0.049 -0.502 0.051 0.979
Table 32: Nutrient elasticities for the Dairy & Egg group - 2009
Vegetable Protein -0.109 Fructose -0.112
Animal Protein -0.437 Sucrose -0.134
Fat -0.345 Maltose -0.116
Saturates -0.334 Lactose -0.361
Mono-unsaturates -0.344 Other sugars -0.158
Poly-unsaturates -0.318 Total sugars -0.149
Carbohydrate -0.133 Non-milk extr sugars -0.132
Energy - Kcal -0.294 Alcohol 0.110
Energy - MJ -0.293 Fibre:Southgate -0.111
Calcium -0.380 Fibre:Englyst -0.113
Iron -0.348 Potassium -0.251
Retinol -0.450 Magnesium -0.250
Carotene -0.140 Copper -0.281
Retinol equivalent -0.426 Zinc -0.383
Thiamin -0.251 Vitamin B6 -0.277
Riboflavin -0.424 Vitamin B12 -0.469
Niacin Equivalent -0.336 Phosphorus -0.395
Vitamin C -0.101 Manganese -0.116
Vitamin D -0.459 Biotin -0.443
Folate -0.384 Pantothenic acid -0.417
Sodium -0.262 Vitamin E -0.310
Starch -0.118 Cholesterol -0.489
Glucose -0.115
7.3 Scenario III: A short run shock to the price of the meat group
A policy scenario that involves the price of the meat group increasing within a month andit subsequently reverting to its previous level, requires the use of the elasticity estimates
48

from the DAIDS. The household level model cannot give information about this kind ofshort run response. Another situation in which the results of the DAIDS are preferredto those of the household level model is when there are anomalies in the results of thehousehold level model such as unrealistically large elasticity estimates arising from highlevels of censoring.
The DAIDS results are already given in Table 5 in Section 3.1. The top row showsthe food groups affected by a price change whilst the first column shows the food groupswhose quantities consumed changes as a result of a price change. The large own price elas-ticity of meat shows that a 1% increase in the price of the meat group leads consumers todecrease their meat consumption by 0.76% in the short run. Moreover, being unit elasticthe expenditure elasticity of meat (1.069) indicates that a decrease in food expenditureleads households to decrease their meat consumption in the short run by a proportionateamount. By contrast, if the price of meat was to stay at its higher level, consumers reducetheir meat consumption over the year more than proportionately, namely by 1.14% as in-dicated by the long run expenditure elasticity. The significant cross price elasticities inTable 33 show that in the short run a 1% increase in the price of meat leads to householdsreducing their consumption of fats & starches and alcohol by 0.081% and 0.225%, respec-tively. It should be noted that because these elasticities represent short run responses toprice changes they cannot be used to examine, for example, how households’ diets changeover time.
Table 33: Short run compensated cross price elasticities of meat and other food groups
DairyMeat Fish
FruitVeg.
Fats &Alcohol
& Egg & Nuts Starches
0.009 -0.76* 0.382 0.069 0.11 -0.081* -0.225
(0.053) (0.141) (0.214) (0.070) (0.078) (0.019) (0.102)
7.4 Scenario IV: A demand side shock based on an e-coli food scare
An e-coli food scare constitutes a demand side shock because it affects consumers’ pur-chasing behaviour. Food prices and food expenditure are not affected by this kind ofshock and therefore the price and expenditure elasticities reported herein cannot be usedto simulate this type of policy scenario.
7.5 Scenario V: A supply side shock based on a failed wheat harvest
Assuming that a failed harvest leads to an increase in the price of wheat which in turnleads to an increase in the prices of livestock and bakery products, we look in particularat the beef, pork and bacon & ham groups which capture the effect of changes in the priceof livestock, and also at the starches group which captures the effect of higher prices forbakery products. The unconditional uncompensated elasticities are used in this scenariobecause they assume that a price increase of one food category decreases the food ex-penditure available to all related food categories (unconditional) and they capture bothincome and substitution effect (uncompensated). Accordingly, selected uncompensatedunconditional elasticities (level 2) are reported in Table 34. The top row shows the foodgroups affected by a price change whilst the first column shows the food groups whosequantities consumed changes as a result of a price change.
49
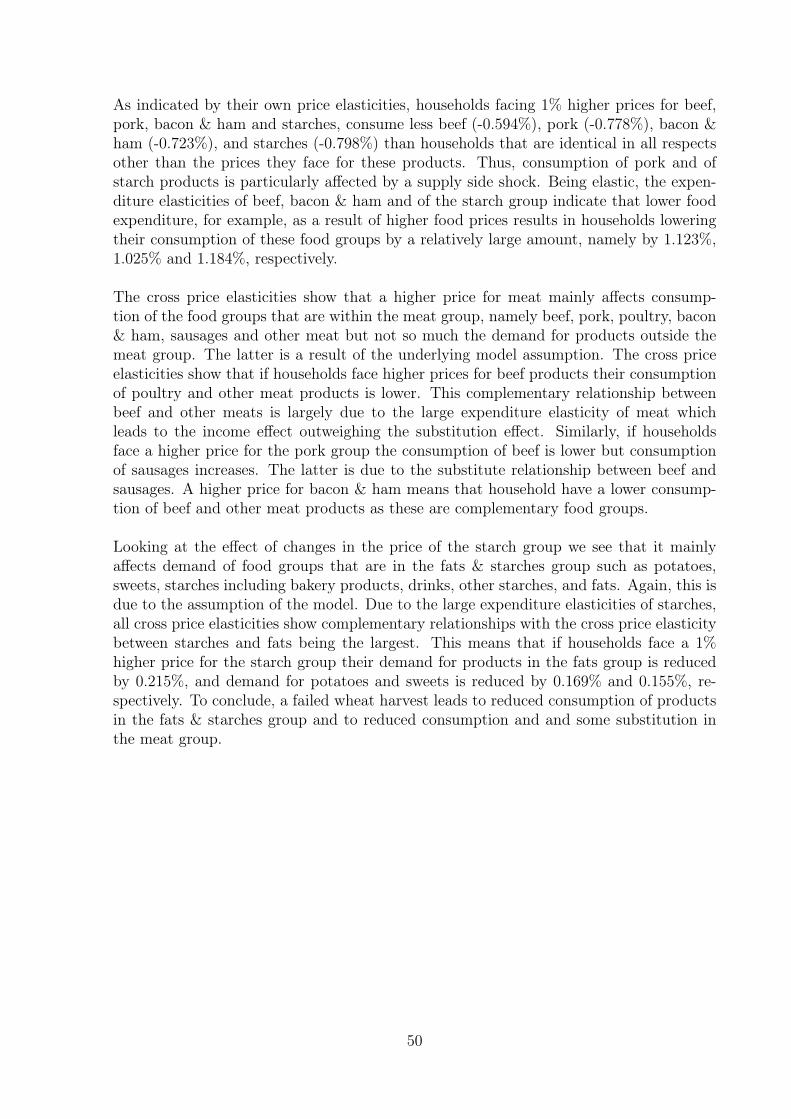
As indicated by their own price elasticities, households facing 1% higher prices for beef,pork, bacon & ham and starches, consume less beef (-0.594%), pork (-0.778%), bacon &ham (-0.723%), and starches (-0.798%) than households that are identical in all respectsother than the prices they face for these products. Thus, consumption of pork and ofstarch products is particularly affected by a supply side shock. Being elastic, the expen-diture elasticities of beef, bacon & ham and of the starch group indicate that lower foodexpenditure, for example, as a result of higher food prices results in households loweringtheir consumption of these food groups by a relatively large amount, namely by 1.123%,1.025% and 1.184%, respectively.
The cross price elasticities show that a higher price for meat mainly affects consump-tion of the food groups that are within the meat group, namely beef, pork, poultry, bacon& ham, sausages and other meat but not so much the demand for products outside themeat group. The latter is a result of the underlying model assumption. The cross priceelasticities show that if households face higher prices for beef products their consumptionof poultry and other meat products is lower. This complementary relationship betweenbeef and other meats is largely due to the large expenditure elasticity of meat whichleads to the income effect outweighing the substitution effect. Similarly, if householdsface a higher price for the pork group the consumption of beef is lower but consumptionof sausages increases. The latter is due to the substitute relationship between beef andsausages. A higher price for bacon & ham means that household have a lower consump-tion of beef and other meat products as these are complementary food groups.
Looking at the effect of changes in the price of the starch group we see that it mainlyaffects demand of food groups that are in the fats & starches group such as potatoes,sweets, starches including bakery products, drinks, other starches, and fats. Again, this isdue to the assumption of the model. Due to the large expenditure elasticities of starches,all cross price elasticities show complementary relationships with the cross price elasticitybetween starches and fats being the largest. This means that if households face a 1%higher price for the starch group their demand for products in the fats group is reducedby 0.215%, and demand for potatoes and sweets is reduced by 0.169% and 0.155%, re-spectively. To conclude, a failed wheat harvest leads to reduced consumption of productsin the fats & starches group and to reduced consumption and and some substitution inthe meat group.
50
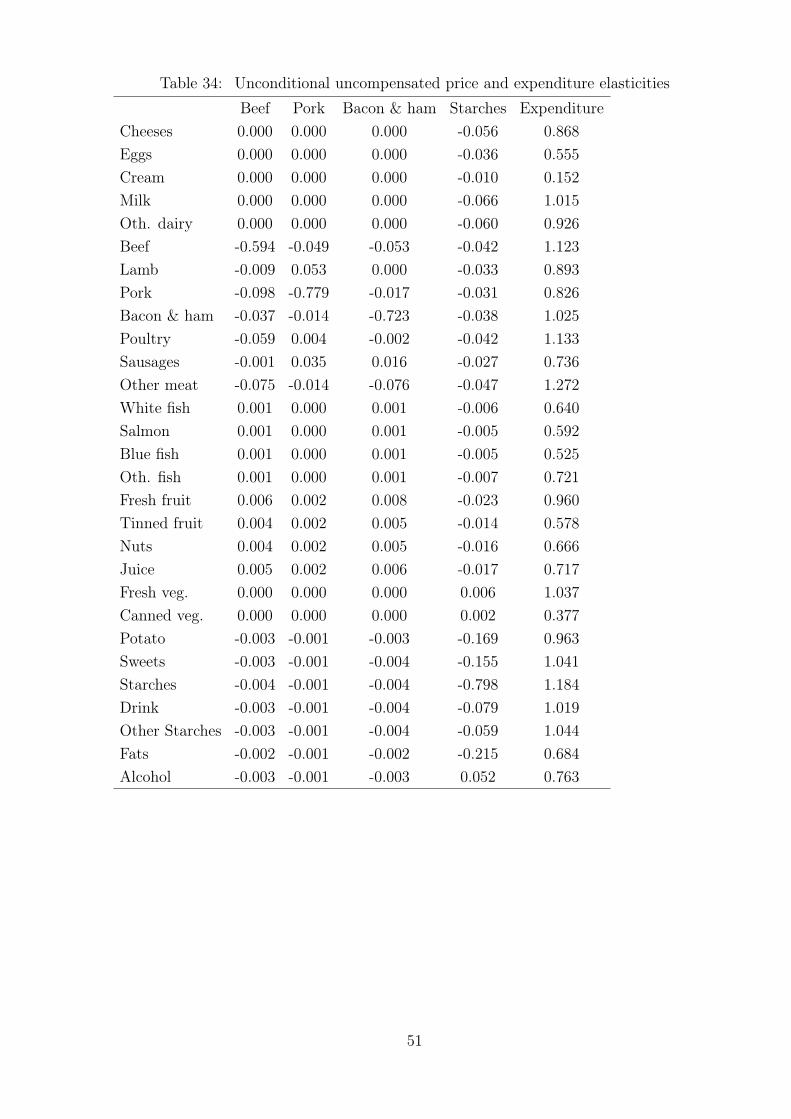
Table 34: Unconditional uncompensated price and expenditure elasticities
Beef Pork Bacon & ham Starches Expenditure
Cheeses 0.000 0.000 0.000 -0.056 0.868
Eggs 0.000 0.000 0.000 -0.036 0.555
Cream 0.000 0.000 0.000 -0.010 0.152
Milk 0.000 0.000 0.000 -0.066 1.015
Oth. dairy 0.000 0.000 0.000 -0.060 0.926
Beef -0.594 -0.049 -0.053 -0.042 1.123
Lamb -0.009 0.053 0.000 -0.033 0.893
Pork -0.098 -0.779 -0.017 -0.031 0.826
Bacon & ham -0.037 -0.014 -0.723 -0.038 1.025
Poultry -0.059 0.004 -0.002 -0.042 1.133
Sausages -0.001 0.035 0.016 -0.027 0.736
Other meat -0.075 -0.014 -0.076 -0.047 1.272
White fish 0.001 0.000 0.001 -0.006 0.640
Salmon 0.001 0.000 0.001 -0.005 0.592
Blue fish 0.001 0.000 0.001 -0.005 0.525
Oth. fish 0.001 0.000 0.001 -0.007 0.721
Fresh fruit 0.006 0.002 0.008 -0.023 0.960
Tinned fruit 0.004 0.002 0.005 -0.014 0.578
Nuts 0.004 0.002 0.005 -0.016 0.666
Juice 0.005 0.002 0.006 -0.017 0.717
Fresh veg. 0.000 0.000 0.000 0.006 1.037
Canned veg. 0.000 0.000 0.000 0.002 0.377
Potato -0.003 -0.001 -0.003 -0.169 0.963
Sweets -0.003 -0.001 -0.004 -0.155 1.041
Starches -0.004 -0.001 -0.004 -0.798 1.184
Drink -0.003 -0.001 -0.004 -0.079 1.019
Other Starches -0.003 -0.001 -0.004 -0.059 1.044
Fats -0.002 -0.001 -0.002 -0.215 0.684
Alcohol -0.003 -0.001 -0.003 0.052 0.763
51
Glossary
Compensated elasticity: Calculated from Hicksian demand functions which assumethat a change in demand as a result of a price change of a food group will leave the con-sumer at the same utility level as she had prior to the price change. This means that thatthe consumer is assumed to be compensated for a price increase through a rise of incomeand therefore the income effect is disregarded. Only the substitution effect is considered.
Complement: A complementary good is a good with a negative cross elasticity of de-mand. This means a good’s demand increases when the price of another food group isdecreased.
Conditional elasticities: Assume that a price decrease of one of the food group holdsfood expenditure available to all other food groups constant.
Cross price elasticities: Are the off diagonal elements in the elasticity matrix. Theyrecord the percentage change in the quantity demanded for a food group if the price ofanother food group changes by 1%. A negative sign indicates that the food groups un-der consideration are complements while a positive sign indicates that they are substitutes.
Elastic demand: If elasticity is less than -1.
Expenditure elasticity: Measures the effect of a 1% change in food expenditure asa whole on the demand for each food group and therefore gives an indication of howdemand would change as food expenditure changes. A positive expenditure elasticity in-dicates a normal good where increases in food expenditure lead to increases in demand. Anegative expenditure elasticity is associated with an inferior good, the demand for whichdecreases as food expenditure rises.
Income effect: Arises due to changes consumers’ food expenditure. Buying the samequantity of a good at a lower price leaves consumers with more food expenditure attheir disposal some of which they will spend on the food group in question so that totalquantity bought rises. If the food group in question is a normal good (positive expendi-ture elasticity), the income effect reinforces the substitution effect, whereas it offsets thesubstitution effect to some extent if it is an inferior good (negative expenditure elasticity).
Income elasticity: Measures the responsiveness of the demand for a food group toa change in the consumers’ income. Can be computed as:
% change in quantity demanded
% change in income=
% change in food expenditure
% change in income×% change in quantity demanded
% change in food expenditure
where the last term are the expenditure elasticities provided in this report.
Inelastic demand: If elasticity is between -1 and 0.
Long run elasticity: Measure the total response of demand to changes in prices, i.e.what happens if price stays like this for the rest of the year.
Luxury A good with a expenditure elasticity of more than one.
Necessity A good with a expenditure elasticity of less than one.
52

Normal good A good with a positive income elasticity of demand.
Nutrient elasticity: Measures how a change in the price of a food group affects in-take of various nutrients.
Own price elasticities: Are the on-diagonal elements in the elasticity matrix. Theymeasure the percentage change in demand that would occur if the price of a food groupchanges by 1% and they always have a negative sign because a change in prices causes thequantity demanded to change in the opposite direction. Own price elasticities betweenzero and one in absolute value are described as inelastic, and elasticities greater than onein absolute value are described as elastic.
Short run elasticity: Measure how demand responds within a month to changes inprices.
Substitute: A substitute good is a good with a positive cross elasticity of demand.Demand for this kind of good increases if the price of another good increases.
Substitution effect: The effect observed with changes in relative price of goods. Forexample, if the price of a good declines, consumers substitute toward the good that be-comes comparatively cheaper. They therefore buy more of the relatively cheaper goodand less of the other good whose price has not declined.
Uncompensated elasticity: Calculated from Marshallian demand functions and there-fore considers both the substitution and income effect. Assumes that consumers maximisetheir utility subject to a budget constraint whilst holding food prices fixed.
Unconditional elasticities: Assume that a price decrease of one of the food groupsincreases food expenditure available to the other food groups.
Utility maximisation Utility is a measure of relative satisfaction. Each consumer isassumed to arrange consumption such that the utility she gains is as high as possible.
53

Appendices
List of Tables
D.1 Sample sizes . . . . . . . . . . . . . . . . . . . . . . . . . . . . . . . . . . 71E.1 Censoring in Level 1 and 2 Models . . . . . . . . . . . . . . . . . . . . . . 72E.2 Censoring in Level 2 Models (cont.) . . . . . . . . . . . . . . . . . . . . . 73E.3 Censoring in Level 3 Models . . . . . . . . . . . . . . . . . . . . . . . . . 74E.4 Censoring in Level 3 Models (cont.) . . . . . . . . . . . . . . . . . . . . . 75E.5 Censoring in Subsamples . . . . . . . . . . . . . . . . . . . . . . . . . . . 76E.6 Censoring in Subsamples (cont.) . . . . . . . . . . . . . . . . . . . . . . . 77F.1 Percentage of significant elasticity estimates - Level 1 . . . . . . . . . . . 78F.2 Percentage of significant elasticity estimates - Level 2: Dairy & Eggs . . . 78F.3 Percentage of significant elasticity estimates - Level 2: Meat . . . . . . . 78F.4 Percentage of significant elasticity estimates - Level 2: Fish . . . . . . . . 79F.5 Percentage of significant elasticity estimates - Level 2: Fruits & Nuts . . 79F.6 Percentage of significant elasticity estimates - Level 2: Vegetables . . . . 79F.7 Percentage of significant elasticity estimates - Level 2: Fats & Starches . 80F.8 Percentage of significant elasticity estimates - Level 3: Beef . . . . . . . . 80F.9 Percentage of significant elasticity estimates - Level 3: Lamb . . . . . . . 80F.10 Percentage of significant elasticity estimates - Level 3: Pork . . . . . . . . 81F.11 Percentage of significant elasticity estimates - Level 3: Poultry . . . . . . 81F.12 Percentage of significant elasticity estimates - Level 3: Other meat . . . . 81F.13 Percentage of significant elasticity estimates - Level 3: Fresh fruits . . . . 82F.14 Percentage of significant elasticity estimates - Level 3: Fresh vegetables . 82F.15 Percentage of significant elasticity estimates - Subsamples: England . . . 82F.16 Percentage of significant elasticity estimates - Subsamples: England &
Wales . . . . . . . . . . . . . . . . . . . . . . . . . . . . . . . . . . . . . . 83F.17 Percentage of significant elasticity estimates - Subsamples: Scotland . . . 83F.18 Percentage of significant elasticity estimates - Subsampels: Northern Ireland 83F.19 Percentage of significant elasticity estimates - Subsamples: Households in
lowest income quintile . . . . . . . . . . . . . . . . . . . . . . . . . . . . . 84F.20 Percentage of significant elasticity estimates - Subsamples: Households
with children . . . . . . . . . . . . . . . . . . . . . . . . . . . . . . . . . . 84G.1 Uncompensated Elasticities - Level 1: 2001/02 . . . . . . . . . . . . . . . 85G.2 Uncompensated Elasticities - Level 1: 2002/03 . . . . . . . . . . . . . . . 85G.3 Uncompensated Elasticities - Level 1: 2003/04 . . . . . . . . . . . . . . . 85G.4 Uncompensated Elasticities - Level 1: 2004/05 . . . . . . . . . . . . . . . 86G.5 Uncompensated Elasticities - Level 1: 2005/06 . . . . . . . . . . . . . . . 86G.6 Uncompensated Elasticities - Level 1: 2006 . . . . . . . . . . . . . . . . 86G.7 Uncompensated Elasticities - Level 1: 2007 . . . . . . . . . . . . . . . . 87G.8 Uncompensated Elasticities - Level 1: 2008 . . . . . . . . . . . . . . . . 87G.9 Uncompensated Elasticities - Level 1: 2009 . . . . . . . . . . . . . . . . 87G.10 Uncompensated Elasticities - Level 2: 2001/02 . . . . . . . . . . . . . . . 88G.11 Uncompensated Elasticities - Level 2: 2001/02 (cont.) . . . . . . . . . . 89G.12 Uncompensated Elasticities - Level 2: 2001/02 (cont.) . . . . . . . . . . 90
54
G.13 Uncompensated Elasticities - Level 2: 2002/03 . . . . . . . . . . . . . . . 91G.14 Uncompensated Elasticities - Level 2: 2002/03 (cont.) . . . . . . . . . . 92G.15 Uncompensated Elasticities - Level 2: 2002/03 (cont.) . . . . . . . . . . 93G.16 Uncompensated Elasticities - Level 2: 2003/04 . . . . . . . . . . . . . . . 94G.17 Uncompensated Elasticities - Level 2: 2003/04 (cont.) . . . . . . . . . . 95G.18 Uncompensated Elasticities - Level 2: 2003/04 (cont.) . . . . . . . . . . 96G.19 Uncompensated Elasticities - Level 2: 2004/05 . . . . . . . . . . . . . . . 97G.20 Uncompensated Elasticities - Level 2: 2004/05 (cont.) . . . . . . . . . . 98G.21 Uncompensated Elasticities - Level 2: 2004/05 (cont.) . . . . . . . . . . 99G.22 Uncompensated Elasticities - Level 2: 2005/06 . . . . . . . . . . . . . . . 100G.23 Uncompensated Elasticities - Level 2: 2005/06 (cont.) . . . . . . . . . . 101G.24 Uncompensated Elasticities - Level 2: 2005/06 (cont.) . . . . . . . . . . 102G.25 Uncompensated Elasticities - Level 2: 2006 . . . . . . . . . . . . . . . . . 103G.26 Uncompensated Elasticities - Level 2: 2006 (cont.) . . . . . . . . . . . . 104G.27 Uncompensated Elasticities - Level 2: 2006 (cont.) . . . . . . . . . . . . 105G.28 Uncompensated Elasticities - Level 2: 2007 . . . . . . . . . . . . . . . . . 106G.29 Uncompensated Elasticities - Level 2: 2007 (cont.) . . . . . . . . . . . . 107G.30 Uncompensated Elasticities - Level 2: 2007 (cont.) . . . . . . . . . . . . 108G.31 Uncompensated Elasticities - Level 2: 2008 . . . . . . . . . . . . . . . . . 109G.32 Uncompensated Elasticities - Level 2: 2008 (cont.) . . . . . . . . . . . . 110G.33 Uncompensated Elasticities - Level 2: 2008 (cont.) . . . . . . . . . . . . 111G.34 Uncompensated Elasticities - Level 2: 2009 . . . . . . . . . . . . . . . . . 112G.35 Uncompensated Elasticities - Level 2: 2009 (cont.) . . . . . . . . . . . . 113G.36 Uncompensated Elasticities - Level 2: 2009 (cont.) . . . . . . . . . . . . 114G.37 Uncompensated Elasticities - Level 3: Beef 2001/02 . . . . . . . . . . . . 115G.38 Uncompensated Elasticities - Level 3: Beef 2002/03 . . . . . . . . . . . . 115G.39 Uncompensated Elasticities - Level 3: Beef 2003/04 . . . . . . . . . . . . 115G.40 Uncompensated Elasticities - Level 3: Beef 2004/05 . . . . . . . . . . . . 115G.41 Uncompensated Elasticities - Level 3: Beef 2005/06 . . . . . . . . . . . . 116G.42 Uncompensated Elasticities - Level 3: Beef 2006 . . . . . . . . . . . . . . 116G.43 Uncompensated Elasticities - Level 3: Beef 2007 . . . . . . . . . . . . . . 116G.44 Uncompensated Elasticities - Level 3: Beef 2008 . . . . . . . . . . . . . . 116G.45 Uncompensated Elasticities - Level 3: Beef 2009 . . . . . . . . . . . . . . 116G.46 Uncompensated Elasticities - Level 3: Lamb 2001/02 . . . . . . . . . . . 117G.47 Uncompensated Elasticities - Level 3: Lamb 2002/03 . . . . . . . . . . . 117G.48 Uncompensated Elasticities - Level 3: Lamb 2003/04 . . . . . . . . . . . 117G.49 Uncompensated Elasticities - Level 3: Lamb 2004/05 . . . . . . . . . . . 117G.50 Uncompensated Elasticities - Level 3: Lamb 2005/06 . . . . . . . . . . . 117G.51 Uncompensated Elasticities - Level 3: Lamb 2006 . . . . . . . . . . . . . 118G.52 Uncompensated Elasticities - Level 3: Lamb 2007 . . . . . . . . . . . . . 118G.53 Uncompensated Elasticities - Level 3: Lamb 2008 . . . . . . . . . . . . . 118G.54 Uncompensated Elasticities - Level 3: Lamb 2009 . . . . . . . . . . . . . 118G.55 Uncompensated Elasticities - Level 3: Pork 2001/02 . . . . . . . . . . . . 118G.56 Uncompensated Elasticities - Level 3: Pork 2002/03 . . . . . . . . . . . . 119G.57 Uncompensated Elasticities - Level 3: Pork 2003/04 . . . . . . . . . . . . 119G.58 Uncompensated Elasticities - Level 3: Pork 2004/05 . . . . . . . . . . . . 119G.59 Uncompensated Elasticities - Level 3: Pork 2005/06 . . . . . . . . . . . . 119G.60 Uncompensated Elasticities - Level 3: Pork 2006 . . . . . . . . . . . . . . 119
55

G.61 Uncompensated Elasticities - Level 3: Pork 2007 . . . . . . . . . . . . . . 120G.62 Uncompensated Elasticities - Level 3: Pork 2008 . . . . . . . . . . . . . . 120G.63 Uncompensated Elasticities - Level 3: Pork 2009 . . . . . . . . . . . . . . 120G.64 Uncompensated Elasticities - Level 3: Poultry 2001/02 . . . . . . . . . . 120G.65 Uncompensated Elasticities - Level 3: Poultry 2002/03 . . . . . . . . . . 120G.66 Uncompensated Elasticities - Level 3: Poultry 2003/04 . . . . . . . . . . 121G.67 Uncompensated Elasticities - Level 3: Poultry 2004/05 . . . . . . . . . . 121G.68 Uncompensated Elasticities - Level 3: Poultry 2005/06 . . . . . . . . . . 121G.69 Uncompensated Elasticities - Level 3: Poultry 2006 . . . . . . . . . . . . 121G.70 Uncompensated Elasticities - Level 3: Poultry 2007 . . . . . . . . . . . . 121G.71 Uncompensated Elasticities - Level 3: Poultry 2008 . . . . . . . . . . . . 122G.72 Uncompensated Elasticities - Level 3: Poultry 2009 . . . . . . . . . . . . 122G.73 Uncompensated Elasticities - Level 3: Other Meat 2001/02 . . . . . . . . 122G.74 Uncompensated Elasticities - Level 3: Other Meat 2002/03 . . . . . . . . 122G.75 Uncompensated Elasticities - Level 3: Other Meat 2003/04 . . . . . . . . 122G.76 Uncompensated Elasticities - Level 3: Other Meat 2004/05 . . . . . . . . 123G.77 Uncompensated Elasticities - Level 3: Other Meat 2005/06 . . . . . . . . 123G.78 Uncompensated Elasticities - Level 3: Other Meat 2006 . . . . . . . . . 123G.79 Uncompensated Elasticities - Level 3: Other Meat 2007 . . . . . . . . . 123G.80 Uncompensated Elasticities - Level 3: Other Meat 2008 . . . . . . . . . 123G.81 Uncompensated Elasticities - Level 3: Other Meat 2009 . . . . . . . . . 124G.82 Uncompensated Elasticities - Level 3: Fresh Fruits 2001/02 . . . . . . . 124G.83 Uncompensated Elasticities - Level 3: Fresh Fruits 2002/03 . . . . . . . 124G.84 Uncompensated Elasticities - Level 3: Fresh Fruits 2003/04 . . . . . . . 124G.85 Uncompensated Elasticities - Level 3: Fresh Fruits 2004/05 . . . . . . . 125G.86 Uncompensated Elasticities - Level 3: Fresh Fruits 2005/06 . . . . . . . 125G.87 Uncompensated Elasticities - Level 3: Fresh Fruits 2006 . . . . . . . . . 125G.88 Uncompensated Elasticities - Level 3: Fresh Fruits 2007 . . . . . . . . . 125G.89 Uncompensated Elasticities - Level 3: Fresh Fruits 2008 . . . . . . . . . 126G.90 Uncompensated Elasticities - Level 3: Fresh Fruits 2009 . . . . . . . . . 126G.91 Uncompensated Elasticities - Level 3: Fresh Vegetables 2001/02 . . . . . 126G.92 Uncompensated Elasticities - Level 3: Fresh Vegetables 2002/03 . . . . . 126G.93 Uncompensated Elasticities - Level 3: Fresh Vegetables 2003/04 . . . . . 127G.94 Uncompensated Elasticities - Level 3: Fresh Vegetables 2004/05 . . . . . 127G.95 Uncompensated Elasticities - Level 3: Fresh Vegetables 2005/06 . . . . . 127G.96 Uncompensated Elasticities - Level 3: Fresh Vegetables 2006 . . . . . . . 127G.97 Uncompensated Elasticities - Level 3: Fresh Vegetables 2007 . . . . . . . 128G.98 Uncompensated Elasticities - Level 3: Fresh Vegetables 2008 . . . . . . . 128G.99 Uncompensated Elasticities - Level 3: Fresh Vegetables 2009 . . . . . . . 128G.100 Uncompensated Elasticities - Subsamples: England 2001/02 . . . . . . . 129G.101 Uncompensated Elasticities - Subsamples: England 2002/03 . . . . . . . 129G.102 Uncompensated Elasticities - Subsamples: England 2003/04 . . . . . . . 129G.103 Uncompensated Elasticities - Subsamples: England 2004/05 . . . . . . . 130G.104 Uncompensated Elasticities - Subsamples: England 2005/06 . . . . . . . 130G.105 Uncompensated Elasticities - Subsamples: England 2006 . . . . . . . . . 130G.106 Uncompensated Elasticities - Subsamples: England 2007 . . . . . . . . . 131G.107 Uncompensated Elasticities - Subsamples: England 2008 . . . . . . . . . 131G.108 Uncompensated Elasticities - Subsamples: England 2009 . . . . . . . . . 131
56

G.109 Uncompensated Elasticities - Subsamples: England & Wales 2001/02 . . 132G.110 Uncompensated Elasticities - Subsamples: England & Wales 2002/03 . . 132G.111 Uncompensated Elasticities - Subsamples: England & Wales 2003/04 . . 132G.112 Uncompensated Elasticities - Subsamples: England & Wales 2004/05 . . 133G.113 Uncompensated Elasticities - Subsamples: England & Wales 2005/06 . . 133G.114 Uncompensated Elasticities - Subsamples: England & Wales 2006 . . . . 133G.115 Uncompensated Elasticities - Subsamples: England & Wales 2007 . . . . 134G.116 Uncompensated Elasticities - Subsamples: England & Wales 2008 . . . . 134G.117 Uncompensated Elasticities - Subsamples: England & Wales 2009 . . . . 134G.118 Uncompensated Elasticities - Subsamples: Scotland 2001/02 . . . . . . . 135G.119 Uncompensated Elasticities - Subsamples: Scotland 2002/03 . . . . . . . 135G.120 Uncompensated Elasticities - Subsamples: Scotland 2003/04 . . . . . . . 135G.121 Uncompensated Elasticities - Subsamples: Scotland 2004/05 . . . . . . . 136G.122 Uncompensated Elasticities - Subsamples: Scotland 2005/06 . . . . . . . 136G.123 Uncompensated Elasticities - Subsamples: Scotland 2006 . . . . . . . . . 136G.124 Uncompensated Elasticities - Subsamples: Scotland 2007 . . . . . . . . . 137G.125 Uncompensated Elasticities - Subsamples: Scotland 2008 . . . . . . . . . 137G.126 Uncompensated Elasticities - Subsamples: Scotland 2009 . . . . . . . . . 137G.127 Uncompensated Elasticities - Subsamples: Northern Ireland 2001/02 . . . 138G.128 Uncompensated Elasticities - Subsamples: Northern Ireland 2002/03 . . . 138G.129 Uncompensated Elasticities - Subsamples: Northern Ireland 2003/04 . . . 138G.130 Uncompensated Elasticities - Subsamples: Northern Ireland 2004/05 . . . 139G.131 Uncompensated Elasticities - Subsamples: Northern Ireland 2005/06 . . . 139G.132 Uncompensated Elasticities - Subsamples: Northern Ireland 2006 . . . . . 139G.133 Uncompensated Elasticities - Subsamples: Northern Ireland 2007 . . . . . 140G.134 Uncompensated Elasticities - Subsamples: Northern Ireland 2008 . . . . . 140G.135 Uncompensated Elasticities - Subsamples: Northern Ireland 2009 . . . . . 140G.136 Uncompensated Elasticities - Subsamples: Households in lowest income
quintile 2001/02 . . . . . . . . . . . . . . . . . . . . . . . . . . . . . . . 141G.137 Uncompensated Elasticities - Subsamples: Households in lowest income
quintile 2002/03 . . . . . . . . . . . . . . . . . . . . . . . . . . . . . . . 141G.138 Uncompensated Elasticities - Subsamples: Households in lowest income
quintile 2003/04 . . . . . . . . . . . . . . . . . . . . . . . . . . . . . . . 141G.139 Uncompensated Elasticities - Subsamples: Households in lowest income
quintile 2004/05 . . . . . . . . . . . . . . . . . . . . . . . . . . . . . . . 142G.140 Uncompensated Elasticities - Subsamples: Households in lowest income
quintile 2005/06 . . . . . . . . . . . . . . . . . . . . . . . . . . . . . . . 142G.141 Uncompensated Elasticities - Subsamples: Households in lowest income
quintile 2006 . . . . . . . . . . . . . . . . . . . . . . . . . . . . . . . . . 142G.142 Uncompensated Elasticities - Subsamples: Households in lowest income
quintile 2007 . . . . . . . . . . . . . . . . . . . . . . . . . . . . . . . . . 143G.143 Uncompensated Elasticities - Subsamples: Households in lowest income
quintile 2008 . . . . . . . . . . . . . . . . . . . . . . . . . . . . . . . . . 143G.144 Uncompensated Elasticities - Subsamples: Households in lowest income
quintile 2009 . . . . . . . . . . . . . . . . . . . . . . . . . . . . . . . . . 143G.145 Uncompensated Elasticities - Subsamples: Households w/ children 2001/02
144
57
G.146 Uncompensated Elasticities - Subsamples: Households w/ children 2002/03144
G.147 Uncompensated Elasticities - Subsamples: Households w/ children 2003/04144
G.148 Uncompensated Elasticities - Subsamples: Households w/ children 2004/05145
G.149 Uncompensated Elasticities - Subsamples: Households w/ children 2005/06145
G.150 Uncompensated Elasticities - Subsamples: Households w/ children 2006 145G.151 Uncompensated Elasticities - Subsamples: Households w/ children 2007 146G.152 Uncompensated Elasticities - Subsamples: Households w/ children 2008 146G.153 Uncompensated Elasticities - Subsamples: Households w/ children 2009 146H.1 Compensated Elasticities - Level 1: 2001/02 . . . . . . . . . . . . . . . . 147H.2 Compensated Elasticities - Level 1: 2002/03 . . . . . . . . . . . . . . . . 147H.3 Compensated Elasticities - Level 1: 2003/04 . . . . . . . . . . . . . . . . 147H.4 Compensated Elasticities - Level 1: 2004/05 . . . . . . . . . . . . . . . . 148H.5 Compensated Elasticities - Level 1: 2005/06 . . . . . . . . . . . . . . . . 148H.6 Compensated Elasticities - Level 1: 2006 . . . . . . . . . . . . . . . . . . 148H.7 Compensated Elasticities - Level 1: 2007 . . . . . . . . . . . . . . . . . . 148H.8 Compensated Elasticities - Level 1: 2008 . . . . . . . . . . . . . . . . . . 149H.9 Compensated Elasticities - Level 1: 2009 . . . . . . . . . . . . . . . . . . 149H.10 Compensated Elasticities - Level 2: Dairy & Eggs 2001/02 . . . . . . . . 149H.11 Compensated Elasticities - Level 2: Dairy & Eggs 2002/03 . . . . . . . . 149H.12 Compensated Elasticities - Level 2: Dairy & Eggs 2003/04 . . . . . . . . 150H.13 Compensated Elasticities - Level 2: Dairy & Eggs 2004/05 . . . . . . . . 150H.14 Compensated Elasticities - Level 2: Dairy & Eggs 2005/06 . . . . . . . . 150H.15 Compensated Elasticities - Level 2: Dairy & Eggs 2006 . . . . . . . . . . 150H.16 Compensated Elasticities - Level 2: Dairy & Eggs 2007 . . . . . . . . . . 150H.17 Compensated Elasticities - Level 2: Dairy & Eggs 2008 . . . . . . . . . . 151H.18 Compensated Elasticities - Level 2: Dairy & Eggs 2009 . . . . . . . . . . 151H.19 Compensated Elasticities - Level 2: Meat 2001/02 . . . . . . . . . . . . . 151H.20 Compensated Elasticities - Level 2: Meat 2002/03 . . . . . . . . . . . . . 151H.21 Compensated Elasticities - Level 2: Meat 2003/04 . . . . . . . . . . . . . 152H.22 Compensated Elasticities - Level 2: Meat 2004/05 . . . . . . . . . . . . . 152H.23 Compensated Elasticities - Level 2: Meat 2005/06 . . . . . . . . . . . . . 152H.24 Compensated Elasticities - Level 2: Meat 2006 . . . . . . . . . . . . . . 152H.25 Compensated Elasticities - Level 2: Meat 2007 . . . . . . . . . . . . . . 153H.26 Compensated Elasticities - Level 2: Meat 2008 . . . . . . . . . . . . . . 153H.27 Compensated Elasticities - Level 2: Meat 2009 . . . . . . . . . . . . . . 153H.28 Compensated Elasticities - Level 2: Fish 2001/02 . . . . . . . . . . . . . 153H.29 Compensated Elasticities - Level 2: Fish 2002/03 . . . . . . . . . . . . . 154H.30 Compensated Elasticities - Level 2: Fish 2003/04 . . . . . . . . . . . . . 154H.31 Compensated Elasticities - Level 2: Fish 2004/05 . . . . . . . . . . . . . 154H.32 Compensated Elasticities - Level 2: Fish 2005/06 . . . . . . . . . . . . . 154H.33 Compensated Elasticities - Level 2: Fish 2006 . . . . . . . . . . . . . . . 154H.34 Compensated Elasticities - Level 2: Fish 2007 . . . . . . . . . . . . . . . 155H.35 Compensated Elasticities - Level 2: Fish 2008 . . . . . . . . . . . . . . . 155H.36 Compensated Elasticities - Level 2: Fish 2009 . . . . . . . . . . . . . . . 155
58

H.37 Compensated Elasticities - Level 2: Fruits & Nuts 2001/02 . . . . . . . . 156H.38 Compensated Elasticities - Level 2: Fruits & Nuts 2002/03 . . . . . . . . 156H.39 Compensated Elasticities - Level 2: Fruits & Nuts 2003/04 . . . . . . . . 156H.40 Compensated Elasticities - Level 2: Fruits & Nuts 2004/05 . . . . . . . . 156H.41 Compensated Elasticities - Level 2: Fruits & Nuts 2005/06 . . . . . . . . 156H.42 Compensated Elasticities - Level 2: Fruits & Nuts 2006 . . . . . . . . . . 157H.43 Compensated Elasticities - Level 2: Fruits & Nuts 2007 . . . . . . . . . . 157H.44 Compensated Elasticities - Level 2: Fruits & Nuts 2008 . . . . . . . . . . 157H.45 Compensated Elasticities - Level 2: Fruits & Nuts 2009 . . . . . . . . . . 157H.46 Compensated Elasticities - Level 2: Vegetables 2001/02 . . . . . . . . . . 157H.47 Compensated Elasticities - Level 2: Vegetables 2002/03 . . . . . . . . . . 157H.48 Compensated Elasticities - Level 2: Vegetables 2003/04 . . . . . . . . . . 158H.49 Compensated Elasticities - Level 2: Vegetables 2004/05 . . . . . . . . . . 158H.50 Compensated Elasticities - Level 2: Vegetables 2005/06 . . . . . . . . . . 158H.51 Compensated Elasticities - Level 2: Vegetables 2006 . . . . . . . . . . . 158H.52 Compensated Elasticities - Level 2: Vegetables 2007 . . . . . . . . . . . 158H.53 Compensated Elasticities - Level 2: Vegetables 2008 . . . . . . . . . . . 158H.54 Compensated Elasticities - Level 2: Vegetables 2009 . . . . . . . . . . . . 158H.55 Compensated Elasticities - Level 2: Fats & Starches 2001/02 . . . . . . . 159H.56 Compensated Elasticities - Level 2: Fats & Starches 2002/03 . . . . . . . 159H.57 Compensated Elasticities - Level 2: Fats & Starches 2003/04 . . . . . . . 159H.58 Compensated Elasticities - Level 2: Fats & Starches 2004/05 . . . . . . . 159H.59 Compensated Elasticities - Level 2: Fats & Starches 2005/06 . . . . . . . 160H.60 Compensated Elasticities - Level 2: Fats & Starches 2006 . . . . . . . . . 160H.61 Compensated Elasticities - Level 2: Fats & Starches 2007 . . . . . . . . . 160H.62 Compensated Elasticities - Level 2: Fats & Starches 2008 . . . . . . . . . 160H.63 Compensated Elasticities - Level 2: Fats & Starches 2009 . . . . . . . . . 161H.64 Compensated Elasticities - Level 3: Beef 2001/02 . . . . . . . . . . . . . 161H.65 Compensated Elasticities - Level 3: Beef 2002/03 . . . . . . . . . . . . . 161H.66 Compensated Elasticities - Level 3: Beef 2003/04 . . . . . . . . . . . . . 161H.67 Compensated Elasticities - Level 3: Beef 2004/05 . . . . . . . . . . . . . 162H.68 Compensated Elasticities - Level 3: Beef 2005/06 . . . . . . . . . . . . . 162H.69 Compensated Elasticities - Level 3: Beef 2006 . . . . . . . . . . . . . . . 162H.70 Compensated Elasticities - Level 3: Beef 2007 . . . . . . . . . . . . . . . 162H.71 Compensated Elasticities - Level 3: Beef 2008 . . . . . . . . . . . . . . . 162H.72 Compensated Elasticities - Level 3: Beef 2009 . . . . . . . . . . . . . . . 163H.73 Compensated Elasticities - Level 3: Lamb 2001/02 . . . . . . . . . . . . . 163H.74 Compensated Elasticities - Level 3: Lamb 2002/03 . . . . . . . . . . . . . 163H.75 Compensated Elasticities - Level 3: Lamb 2003/04 . . . . . . . . . . . . . 163H.76 Compensated Elasticities - Level 3: Lamb 2004/05 . . . . . . . . . . . . . 163H.77 Compensated Elasticities - Level 3: Lamb 2005/06 . . . . . . . . . . . . . 164H.78 Compensated Elasticities - Level 3: Lamb 2006 . . . . . . . . . . . . . . . 164H.79 Compensated Elasticities - Level 3: Lamb 2007 . . . . . . . . . . . . . . . 164H.80 Compensated Elasticities - Level 3: Lamb 2008 . . . . . . . . . . . . . . . 164H.81 Compensated Elasticities - Level 3: Lamb 2009 . . . . . . . . . . . . . . . 164H.82 Compensated Elasticities - Level 3: Pork 2001/02 . . . . . . . . . . . . . 165H.83 Compensated Elasticities - Level 3: Pork 2002/03 . . . . . . . . . . . . . 165H.84 Compensated Elasticities - Level 3: Pork 2003/04 . . . . . . . . . . . . . 165
59
H.85 Compensated Elasticities - Level 3: Pork 2004/05 . . . . . . . . . . . . . 165H.86 Compensated Elasticities - Level 3: Pork 2005/06 . . . . . . . . . . . . . 165H.87 Compensated Elasticities - Level 3: Pork 2006 . . . . . . . . . . . . . . . 166H.88 Compensated Elasticities - Level 3: Pork 2007 . . . . . . . . . . . . . . . 166H.89 Compensated Elasticities - Level 3: Pork 2008 . . . . . . . . . . . . . . . 166H.90 Compensated Elasticities - Level 3: Pork 2009 . . . . . . . . . . . . . . . 166H.91 Compensated Elasticities - Level 3: Poultry 2001/02 . . . . . . . . . . . . 166H.92 Compensated Elasticities - Level 3: Poultry 2002/03 . . . . . . . . . . . . 167H.93 Compensated Elasticities - Level 3: Poultry 2003/04 . . . . . . . . . . . . 167H.94 Compensated Elasticities - Level 3: Poultry 2004/05 . . . . . . . . . . . . 167H.95 Compensated Elasticities - Level 3: Poultry 2005/06 . . . . . . . . . . . . 167H.96 Compensated Elasticities - Level 3: Poultry 2006 . . . . . . . . . . . . . . 167H.97 Compensated Elasticities - Level 3: Poultry 2007 . . . . . . . . . . . . . . 168H.98 Compensated Elasticities - Level 3: Poultry 2008 . . . . . . . . . . . . . . 168H.99 Compensated Elasticities - Level 3: Poultry 2009 . . . . . . . . . . . . . . 168H.100 Compensated Elasticities - Level 3: Other Meat 2001/02 . . . . . . . . . 168H.101 Compensated Elasticities - Level 3: Other Meat 2002/03 . . . . . . . . . 168H.102 Compensated Elasticities - Level 3: Other Meat 2003/04 . . . . . . . . . 169H.103 Compensated Elasticities - Level 3: Other Meat 2004/05 . . . . . . . . . 169H.104 Compensated Elasticities - Level 3: Other Meat 2005/06 . . . . . . . . . 169H.105 Compensated Elasticities - Level 3: Other Meat 2006 . . . . . . . . . . . 169H.106 Compensated Elasticities - Level 3: Other Meat 2007 . . . . . . . . . . . 169H.107 Compensated Elasticities - Level 3: Other Meat 2008 . . . . . . . . . . . 170H.108 Compensated Elasticities - Level 3: Other Meat 2009 . . . . . . . . . . . 170H.109 Compensated Elasticities - Level 3: Fresh Fruits 2001/02 . . . . . . . . . 170H.110 Compensated Elasticities - Level 3: Fresh Fruits 2002/03 . . . . . . . . . 170H.111 Compensated Elasticities - Level 3: Fresh Fruits 2003/04 . . . . . . . . . 170H.112 Compensated Elasticities - Level 3: Fresh Fruits 2004/05 . . . . . . . . . 171H.113 Compensated Elasticities - Level 3: Fresh Fruits 2005/06 . . . . . . . . . 171H.114 Compensated Elasticities - Level 3: Fresh Fruits 2006 . . . . . . . . . . . 171H.115 Compensated Elasticities - Level 3: Fresh Fruits 2007 . . . . . . . . . . . 171H.116 Compensated Elasticities - Level 3: Fresh Fruits 2008 . . . . . . . . . . . 171H.117 Compensated Elasticities - Level 3: Fresh Fruits 2009 . . . . . . . . . . . 172H.118 Compensated Elasticities - Level 3: Fresh Vegetables 2001/02 . . . . . . . 172H.119 Compensated Elasticities - Level 3: Fresh Vegetables 2002/03 . . . . . . . 172H.120 Compensated Elasticities - Level 3: Fresh Vegetables 2003/04 . . . . . . . 172H.121 Compensated Elasticities - Level 3: Fresh Vegetables 2004/05 . . . . . . . 173H.122 Compensated Elasticities - Level 3: Fresh Vegetables 2005/06 . . . . . . . 173H.123 Compensated Elasticities - Level 3: Fresh Vegetables 2006 . . . . . . . . 173H.124 Compensated Elasticities - Level 3: Fresh Vegetables 2007 . . . . . . . . 173H.125 Compensated Elasticities - Level 3: Fresh Vegetables 2008 . . . . . . . . 174H.126 Compensated Elasticities - Level 3: Fresh Vegetables 2009 . . . . . . . . 174H.127 Compensated Elasticities - Subsamples: England 2001/02 . . . . . . . . . 174H.128 Compensated Elasticities - Subsamples: England 2002/03 . . . . . . . . . 175H.129 Compensated Elasticities - Subsamples: England 2003/04 . . . . . . . . . 175H.130 Compensated Elasticities - Subsamples: England 2004/05 . . . . . . . . . 175H.131 Compensated Elasticities - Subsamples: England 2005/06 . . . . . . . . . 176H.132 Compensated Elasticities - Subsamples: England 2006 . . . . . . . . . . . 176
60
H.133 Compensated Elasticities - Subsamples: England 2007 . . . . . . . . . . . 176H.134 Compensated Elasticities - Subsamples: England 2008 . . . . . . . . . . . 177H.135 Compensated Elasticities - Subsamples: England 2009 . . . . . . . . . . . 177H.136 Compensated Elasticities - Subsamples: England & Wales 2001/02 . . . . 177H.137 Compensated Elasticities - Subsamples: England & Wales 2002/03 . . . . 178H.138 Compensated Elasticities - Subsamples: England & Wales 2003/04 . . . . 178H.139 Compensated Elasticities - Subsamples: England & Wales 2004/05 . . . . 178H.140 Compensated Elasticities - Subsamples: England & Wales 2005/06 . . . . 179H.141 Compensated Elasticities - Subsamples: England & Wales 2006 . . . . . . 179H.142 Compensated Elasticities - Subsamples: England & Wales 2007 . . . . . . 179H.143 Compensated Elasticities - Subsamples: England & Wales 2008 . . . . . . 180H.144 Compensated Elasticities - Subsamples: England & Wales 2009 . . . . . . 180H.145 Compensated Elasticities - Subsamples: Scotland 2001/02 . . . . . . . . . 180H.146 Compensated Elasticities - Subsamples: Scotland 2002/03 . . . . . . . . . 181H.147 Compensated Elasticities - Subsamples: Scotland 2003/04 . . . . . . . . . 181H.148 Compensated Elasticities - Subsamples: Scotland 2004/05 . . . . . . . . . 181H.149 Compensated Elasticities - Subsamples: Scotland 2005/06 . . . . . . . . . 182H.150 Compensated Elasticities - Subsamples: Scotland 2006 . . . . . . . . . . 182H.151 Compensated Elasticities - Subsamples: Scotland 2007 . . . . . . . . . . 182H.152 Compensated Elasticities - Subsamples: Scotland 2008 . . . . . . . . . . 183H.153 Compensated Elasticities - Subsamples: Scotland 2009 . . . . . . . . . . 183H.154 Compensated Elasticities - Subsamples: Northern Ireland 2001/02 . . . . 183H.155 Compensated Elasticities - Subsamples: Northern Ireland 2002/03 . . . . 184H.156 Compensated Elasticities - Subsamples: Northern Ireland 2003/04 . . . . 184H.157 Compensated Elasticities - Subsamples: Northern Ireland 2004/05 . . . . 184H.158 Compensated Elasticities - Subsamples: Northern Ireland 2005/06 . . . . 185H.159 Compensated Elasticities - Subsamples: Northern Ireland 2006 . . . . . . 185H.160 Compensated Elasticities - Subsamples: Northern Ireland 2007 . . . . . . 185H.161 Compensated Elasticities - Subsamples: Northern Ireland 2008 . . . . . . 186H.162 Compensated Elasticities - Subsamples: Northern Ireland 2009 . . . . . . 186H.163 Compensated Elasticities - Subsamples: Households in lowest income
quintile 2001/02 . . . . . . . . . . . . . . . . . . . . . . . . . . . . . . . . 186H.164 Compensated Elasticities - Subsamples: Households in lowest income
quintile 2002/03 . . . . . . . . . . . . . . . . . . . . . . . . . . . . . . . . 187H.165 Compensated Elasticities - Subsamples: Households in lowest income
quintile 2003/04 . . . . . . . . . . . . . . . . . . . . . . . . . . . . . . . . 187H.166 Compensated Elasticities - Subsamples: Households in lowest income
quintile 2004/05 . . . . . . . . . . . . . . . . . . . . . . . . . . . . . . . . 187H.167 Compensated Elasticities - Subsamples: Households in lowest income
quintile 2005/06 . . . . . . . . . . . . . . . . . . . . . . . . . . . . . . . . 188H.168 Compensated Elasticities - Subsamples: Households in lowest income
quintile 2006 . . . . . . . . . . . . . . . . . . . . . . . . . . . . . . . . . . 188H.169 Compensated Elasticities - Subsamples: Households in lowest income
quintile 2007 . . . . . . . . . . . . . . . . . . . . . . . . . . . . . . . . . . 188H.170 Compensated Elasticities - Subsamples: Households in lowest income
quintile 2008 . . . . . . . . . . . . . . . . . . . . . . . . . . . . . . . . . . 189H.171 Compensated Elasticities - Subsamples: Households in lowest income
quintile 2009 . . . . . . . . . . . . . . . . . . . . . . . . . . . . . . . . . . 189
61
H.172 Compensated Elasticities - Subsamples: Households w/ children 2001/02 189H.173 Compensated Elasticities - Subsamples: Households w/ children 2002/03 190H.174 Compensated Elasticities - Subsamples: Households w/ children 2003/04 190H.175 Compensated Elasticities - Subsamples: Households w/ children 2004/05 190H.176 Compensated Elasticities - Subsamples: Households w/ children 2005/06 191H.177 Compensated Elasticities - Subsamples: Households w/ children 2006 . . 191H.178 Compensated Elasticities - Subsamples: Households w/ children 2007 . . 191H.179 Compensated Elasticities - Subsamples: Households w/ children 2008 . . 192H.180 Compensated Elasticities - Subsamples: Households w/ children 2009 . . 192I.1 Nutrient elasticities - 2001/02 . . . . . . . . . . . . . . . . . . . . . . . . 193I.2 Nutrient elasticities - 2001/02 (cont.) . . . . . . . . . . . . . . . . . . . . 194I.3 Nutrient elasticities - 2002/03 . . . . . . . . . . . . . . . . . . . . . . . . 195I.4 Nutrient elasticities - 2002/03 (cont.) . . . . . . . . . . . . . . . . . . . . 196I.5 Nutrient elasticities - 2003/04 . . . . . . . . . . . . . . . . . . . . . . . . 197I.6 Nutrient elasticities - 2003/04 (cont.) . . . . . . . . . . . . . . . . . . . . 198I.7 Nutrient elasticities - 2004/05 . . . . . . . . . . . . . . . . . . . . . . . . 199I.8 Nutrient elasticities - 2004/05 (cont.) . . . . . . . . . . . . . . . . . . . . 200I.9 Nutrient elasticities - 2005/06 . . . . . . . . . . . . . . . . . . . . . . . . 201I.10 Nutrient elasticities - 2005/06 (cont.) . . . . . . . . . . . . . . . . . . . . 202I.11 Nutrient elasticities - 2006 . . . . . . . . . . . . . . . . . . . . . . . . . . 203I.12 Nutrient elasticities - 2006 (cont.) . . . . . . . . . . . . . . . . . . . . . 204I.13 Nutrient elasticities - 2007 . . . . . . . . . . . . . . . . . . . . . . . . . . 205I.14 Nutrient elasticities - 2007 (cont.) . . . . . . . . . . . . . . . . . . . . . 206I.15 Nutrient elasticities - 2008 . . . . . . . . . . . . . . . . . . . . . . . . . . 207I.16 Nutrient elasticities - 2008 (cont.) . . . . . . . . . . . . . . . . . . . . . 208I.17 Nutrient elasticities - 2009 . . . . . . . . . . . . . . . . . . . . . . . . . . 209I.18 Nutrient elasticities - 2009 (cont.) . . . . . . . . . . . . . . . . . . . . . 210
62

A The Almost Ideal Demand System
The AIDS by Deaton and Muellbauer [1980] relates the value shares to the logarithm oftotal expenditure, that is
si = αi + βiloge (8)
where si is the share of total expenditure e accounted for by expenditure on the ith good.The parameters α and β are made functions of prices thereby extending (8) to includethe effects of prices. The cost function is defined as
logc(u,p) = α(p) + uβ(p) (9)
where
α(p) = α0 +∑
k
αklogpk +1
2
∑
k
∑
l
γ∗
kllogpklogpl (10)
andβ(p) = β0
∏pβk
k (11)
Substituting and differentiating in equation (9), the budget share form of the AIDS isobtained:
si = αi +∑
δijlogpj + βilog(e/P) (12)
where P is the price index defined by
logP = α0 +∑
k
αklogpk +1
2
∑
k
∑
l
γkllogpklogpl (13)
and the parameters γ are defined by
γij =1
2(γ∗
ij + γ∗
ji) = γij (14)
Adding up requires for all j:
∑
k
αk = 1,∑
k
βk = 0,∑
k
γkj = 0 (15)
Homogeneity is satisfied if and only if, for all j
∑
k
γjk = 0 (16)
and symmetry is satisfied ifγij = γji (17)
From equation (12) we obtain the linear-approximate AIDS model:
sih = αi +m∑
j=1
γijln(pjh) + βiln(ehPh
) + uih (18)
i = 1, ...,m (19)
h = 1, ..., T (20)
(v1h), ...(v(m−1)T )′ ∼ N(0,Σ) (21)
63
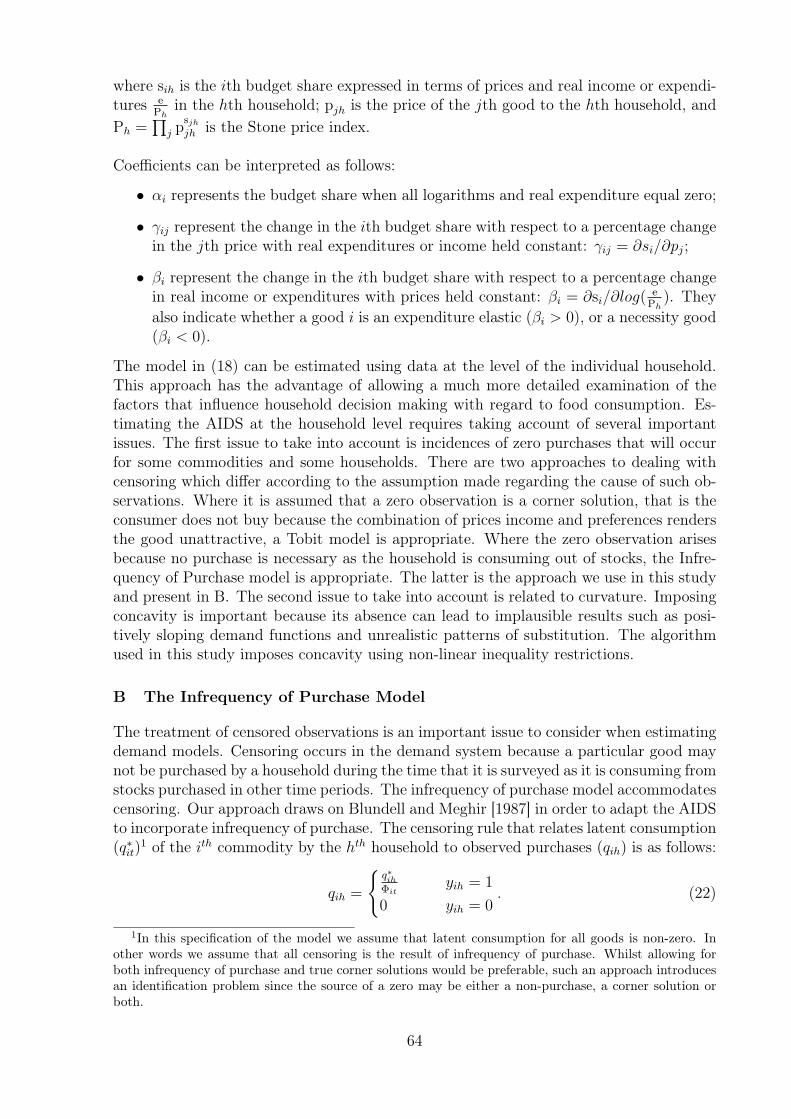
where sih is the ith budget share expressed in terms of prices and real income or expendi-tures e
Phin the hth household; pjh is the price of the jth good to the hth household, and
Ph =∏
j psjh
jh is the Stone price index.
Coefficients can be interpreted as follows:
• αi represents the budget share when all logarithms and real expenditure equal zero;
• γij represent the change in the ith budget share with respect to a percentage changein the jth price with real expenditures or income held constant: γij = ∂si/∂pj;
• βi represent the change in the ith budget share with respect to a percentage changein real income or expenditures with prices held constant: βi = ∂si/∂log(
e
Ph). They
also indicate whether a good i is an expenditure elastic (βi > 0), or a necessity good(βi < 0).
The model in (18) can be estimated using data at the level of the individual household.This approach has the advantage of allowing a much more detailed examination of thefactors that influence household decision making with regard to food consumption. Es-timating the AIDS at the household level requires taking account of several importantissues. The first issue to take into account is incidences of zero purchases that will occurfor some commodities and some households. There are two approaches to dealing withcensoring which differ according to the assumption made regarding the cause of such ob-servations. Where it is assumed that a zero observation is a corner solution, that is theconsumer does not buy because the combination of prices income and preferences rendersthe good unattractive, a Tobit model is appropriate. Where the zero observation arisesbecause no purchase is necessary as the household is consuming out of stocks, the Infre-quency of Purchase model is appropriate. The latter is the approach we use in this studyand present in B. The second issue to take into account is related to curvature. Imposingconcavity is important because its absence can lead to implausible results such as posi-tively sloping demand functions and unrealistic patterns of substitution. The algorithmused in this study imposes concavity using non-linear inequality restrictions.
B The Infrequency of Purchase Model
The treatment of censored observations is an important issue to consider when estimatingdemand models. Censoring occurs in the demand system because a particular good maynot be purchased by a household during the time that it is surveyed as it is consuming fromstocks purchased in other time periods. The infrequency of purchase model accommodatescensoring. Our approach draws on Blundell and Meghir [1987] in order to adapt the AIDSto incorporate infrequency of purchase. The censoring rule that relates latent consumption(q∗it)
1 of the ith commodity by the hth household to observed purchases (qih) is as follows:
qih =
q∗ih
Φityih = 1
0 yih = 0. (22)
1In this specification of the model we assume that latent consumption for all goods is non-zero. In
other words we assume that all censoring is the result of infrequency of purchase. Whilst allowing for
both infrequency of purchase and true corner solutions would be preferable, such an approach introduces
an identification problem since the source of a zero may be either a non-purchase, a corner solution or
both.
64
Φih is the probability that a purchase is made (p (yih = 1)) and yih is a binary variablewhich takes the value 1 when a purchase occurs. The censoring rule (22) implies thatthere are two aspects to the latency of q∗ih according to whether qih is observed or not. Incases where a purchase is made, latent consumption is related to observed purchases asfollows:
q∗ih = qihΦih ∀i ∈ C (23)
where:C = i : yih = 1 . (24)
The latency in the observations where qih is observed is addressed in the AIDS by definingthe consumption shares for observations where a purchase is observed as follows:
sih =pihq
∗ih∑
i∈C pihq∗ih∀i ∈ C (25)
where pih is the price of the ith good to the hth household and q∗ih is defined in equation 23.In cases where no purchase is made q∗ih is non-zero as the good in question is consumed fromstocks. In this case latent consumption cannot be computed using (23) because qih is itselfunobserved. Instead a data augmentation algorithm, which we discuss in Appendix C,is used to replace the observed zeros with estimated values for latent consumption. Theshares computed using (25) for observations where a purchase is observed sum to one byconstruction and therefore once they are combined with the latent shares correspondingto observations where no purchase is made, the adding up restriction will be violated.An additional source of latency is introduced into the model for the shares, defined inequation 25, where a purchase is made. The effect of this is to adjust the shares definedin equation 25 to ensure that the combined latent shares for goods where a purchase ismade and those where one is not satisfy the adding up restriction. Thus we define latentshares for the cases where purchases are observed as follows:
s∗ih = sih
(1−
∑
i/∈C
s∗ih
)∀i ∈ C (26)
The AIDS, with one equation dropped to avoid singularity of the covariance matrix, isthen expressed in terms of the latent shares as follows:
s∗ = X1Λ+ v (27)
where:
X1=I(m−1) ⊗ x1, (28)
x1=(x11 . . . ,x1H)′ , (29)
x1h =
(1, ln p1,h, · · · , ln pm,h, ln
(ehPh
))′
, (30)
s∗ = (s∗1,1, · · · , s∗
1,H , s∗
2,1, . . . , s∗
2,H , . . . , s∗
(m−1),1, . . . s∗
(m−1),H)′, (31)
Λ=(α1, γ11, . . . γ1,m, ω1 . . . , α(m−1), γ(m−1)1, . . . γ(m−1),m, ω(m−1),
)′, (32)
v=(v1,1, · · · , v1,H , v2,1, . . . , v2,H , . . . , v(m−1),1, . . . v(m−1),H)′ (33)
pjh is the price of the jth good to the hth household eh is total expenditure, Ph =∏
j psjhjh
is Stone’s price index. The underlying theory requires that the model satisfies symmetry
γij = γji for all i,j, (34)
65
homogeneity ∑
j
γij = 0 for all j (35)
and concavity. Concavity implies that the Slutsky matrix (M) which has the elements:
Mij = γij + ωiωj ln( e
P
)− siδij + sisj (36)
δii = 1, δij = 0 : i 6= j (37)
is negative semi-definite. The restrictions required for symmetry and homogeneity can bewritten in the form
RΛ∗ = 0 (38)
where R is an r × (m − 1) ((m− 1) + 2) matrix defining the restrictions and Λ∗ is therestricted Λ. In order to impose these restrictions we reparameterise the model as follows.First define the (km− r)× km orthonormal matrix R⊥ such that:
RR′
⊥ = 0 (39)
R⊥R′
⊥ = I. (40)
The restricted Λ can be expressed as:
Λ∗ = R′
⊥Λ (41)
where Λ is a (k(m− 1)− r) × 1 vector of distinct parameters, and r is the number ofrestrictions. The restricted model can be written:
s∗ = X1R′
⊥Λ+ v (42)
s∗ = WΛ+ v (43)
where:W=X1R
′
⊥. (44)
Equation 43 is the basis for estimation and the restricted parameter vector is recoveredusing equation 41. To complete the IPM, the demand equations in 27 are combined withm probit equations to give the complete model:
s∗ = WΛ + v (45)
y∗ = X2Γ + u (46)
where y∗ is an mH × 1 vector of latent variables based on the binary variable yih definedin equation 22:
y∗ih
> 0
≤ 0
yih = 1
yih = 0, (47)
e =
(v
u
)∼ N (0,Σ⊗ IH) , (48)
X2 = Im⊗x2 (49)
x2 = (x21 . . . ,x2H)′
(50)
66
where x2 is a vector of constants which means that we assume all households to be iden-tical with regard to their household specific characteristics that determine the probabilityof the household making a purchase in a given time period, and stocks being exhaustedin a purely random manner.
Since the dependent variables in the probit equations (46) are unobserved, data aug-mentation is also used in their estimation. With the introduction of the probit equationsthe probability that is necessary for the computation of the latent shares in equation 23can be obtained as:
Φih = p (yih = 1) = p (y∗ih > 0) = p (uih > −x2hΓi) = Φ (x2hΓi) (51)
where Γi is the sub-vector of Γ corresponding to the ith probit equation.
C Bayesian Inference
We apply Bayesian inference to the parameters of the model by sampling from the pos-terior distribution of the parameters in the model and presenting the summary statisticsof this sample. The Gibbs sampler (see Casella and George [1992]) allows one to samplefrom a marginal distribution by using the conditional distributions of the parameters. Inmost applications parameters are grouped into blocks and the conditional distributionsfor these blocks are used as the basis for the sampler. If the dependent variables in 45and 46 were observable, the full system comprising both sets of equation could be treatedas a set of seemingly unrelated equations (SUR) and estimation using a Gibbs samplerwould be straightforward. Writing the complete system in 45 and 46 as:
z∗ = Xβ + e (52)
where:
z∗ =(s∗
′
,y∗′)′,X=
(W 0
0 X2
), β=
(Λ
′
,Γ′)′. (53)
and s∗′
includes the recovered fitted values of the dropped share equation, and Λ′
includesthe recovered parameters of the dropped share equation.Assuming a diffuse prior (Zellner [1971, p 241]):
p(β,Σ−1
)= p (β) p
(Σ−1
)∝∣∣Σ−1
∣∣−(m+1
2 )(54)
the conditional posterior distributions for the two blocks of parameters β and Σ are:
p (β|z,X,Σ) ∼ MVN((
Σ−1 ⊗X′X)−1 (
Σ−1 ⊗X′)z∗,Σ−1 ⊗X′X
)(55)
p (Σ|y,X, β) ∼ IW (e′e,H) (56)
where:
e =
v1,1 . . . vm,1 u1,1 . . . um,1
......
......
v1,H . . . vm,H u1,H . . . um,H
(57)
As has been stated above, the theoretically derived property of concavity requires thatthe Slutsky matrix of the cost function (see equation 36) to be negative semi-definite.
67
This is incorporated in the estimation by introducing an informative prior in the formof an indicator function which takes the value one when the parameter vector β leadsto a negative semi-definite Slutsky matrix and zero otherwise. In practice this resultsin an accept:reject step in the algorithm in which only those draws on the distributionin equation 55 which satisfy this restriction are retained in the sample that is used forinference.
We have noted above that some elements of z∗ are not observed however. In order tocomplete the algorithm we therefore employ data augmentation. Data augmentation wasintroduced by Tanner and Wong [1987] as a method for conducting inference on the fullposterior in the presence of latent data. Albert and Chib [1993] show how data augmenta-tion can be accomplished using the Gibbs sampler. They show that where the conditionaldistributions of the latent data can be obtained, these data can be treated as anotherblock of unknowns in the algorithm. In section B we argued that there were three typesof latency in our model. The first type of latency is common to all limited dependentvariable models and is referred to as missing data. In our model we have two types ofmissing data. In the share equations, where no purchase is made the shares are missing.In the probit equations the continuous variable (y∗ih) which underlies the observed binaryvariable is missing. The remaining two sources of latency apply to the observations wherea purchase is made. In these cases latency exists first because the observed purchases donot correspond to actual consumption and second because the adding up restriction willnot hold once consumption of the commodities where no purchase is made is accountedfor. In all three cases the conditional distributions of the latent data are used in thealgorithm to simulate values.
Let us turn to the derivation of these distributions. First consider the conditionals for themissing data. Because the observations for individual households are assumed to be inde-pendent we can make the latent draws household by household. In order to introduce theconditional distributions therefore we define z∗h and z∗h to include only the elements of z∗
and z∗ = Xβ respectively corresponding to the hth household. It is also more convenientto draw the latent variables commodity by commodity. Therefore, defining the precisionmatrix Ω = Σ−1, the conditional mean (µht) and variance (Vi) of the individual elementsof z∗are [Geweke, 2005, Theorem 5.3.1]:
µih = z∗ih +ΣiΣ−1−i
(z∗−i,h − z∗−i,h
)= z∗ih + Ω−1
ii Ω−i
(z∗i,h − z∗i,h
)(58)
Vi = Σii −ΣiΣ−1−iΣ
′
i = Ω−1−i (59)
where Σii is the ith on-diagonal element of Σ, Σi is the ith row of Σ excluding Σii, andΣ−i is the matrix within Σ excluding both the ith column and ith row. Ωii and Ωi aresimilarly defined. z∗ih is the fitted value of z∗ih for the hth household and y−i,h and y−i,h arevectors within yh and yh respectively, with their ith elements removed. The conditionaldistributions for the missing data in the probit equations are:
yih = 0 : y∗ih|y∗
i,h, β,X,Σ ∼ TN [y∗ih| −∞, 0] (µih, Vi) I(yih = 0)∀i, h (60)
yih = 1 : y∗ih|y∗
i,h, β,X,Σ ∼ TN [y∗ih|0,∞] (µih, Vi) I(yih = 1)∀i, h (61)
where TN is a truncated normal distribution over the interval [−∞, 0] with mean µih
and variance Vi and I is an indicator variables with a value of one if (yih = 0), and zerootherwise.
68
The conditional distribution in the share equations are:
sih = 0 : s∗ih|y∗
i,h,Θ,X,Σ ∼ TN[s∗ih|0, (1−∑
i
s∗−ih)] (µih, Vi) I(yih = 0)∀i /∈ C, h (62)
where TN is a truncated distribution over the interval [0, (1 −∑
i s∗−ih)] and s∗
−ih is avector within s∗ih with the ith element removed.
For the remaining two types of latency, in observations where a purchase is made, thelatent data are a linear transformation of the observed data. This data can therefore besimulated by applying the transformations in 23 and 26 sequentially to the observed data.
To achieve identification of the probit equations it is necessary to restrict the covariancematrix:
Σ =
(Σvv Σvu
Σuv Σuu
). (63)
and we impose the restriction that Σuu = I. Instead of using equation 56 as the basis formaking draws on Σ, we obtain the conditional posterior distributions for the sub-matriceswithin Σ as follows. Define the following H ×m matrices:
v =
v11 v21 · · · vm1
......
...
v1H v2H · · · vmH
(64)
u =
u11 u21 · · · um1
......
...
u1H u2H · · · umH
(65)
From the properties of the multivariate normal the conditional mean and variance are:
E(v|u) = ΣvuΣ−1uuu (66)
E(v
′
v|u)
= Σε = Σvv − ΣvuΣ−1uuΣ
′
vu (67)
where 66 is a regression of v on u. Under the assumption that Σuu = I we can thereforeparameterise the covariance matrix as:
Σ =
(Σvv Σvu
Σuv Σuu
)=
( (Σε + ρρ
′)
ρ
ρ′
I
). (68)
where ρ = Σvu. Recognising from equations 66 and 67, with the assumption Σuu = I, thatρ and Σε are the coefficient vector and covariance matrix of the error term ε respectivelyin the following seemingly unrelated regression:
v = ρu+ ε (69)
ε ∼ N (0,Σε) and assuming a diffuse prior we use the following conditional posteriors:
ρ|Σε ∼ N[(u′Σ−1
ε u)−1
u′v ,(u′Σ−1
ε u)−1]
(70)
Σε|δ ∼ IW (ε′ε,H) (71)
69
together with the relations in 68 as the basis for sampling the restricted covariance matrix.
The estimation algorithm can then be stated as:
1. Assume starting values for z∗ and Σ.
2. Use the most recently drawn values of z∗ from steps 5 and 6 and Σ from step 7 (orthose assumed in step 1 if this is the first pass), draw the parameter vector β fromthe normal distribution in equation 55.
3. Recover the missing coefficients of the dropped share equation and include them inΛ so that β includes the parameters of the m probit and the m share equations.
4. Use the appropriate elements of the β draw to compute the Slutsky matrix usingequation 36 and check to see whether it is negative semi-definite. If it is, add thedraw to the sample. If it is not, revert to the previous draw of β.
5. Using the parameter vector β drawn in 2, compute the full z∗ = Xβ. Using theappropriate elements in z∗ and the full Σ from step 7 (or that assumed in step 1 if thisis the first pass), compute the mean and variance of the conditional distributionsusing equations 58 and 59. Use these in the truncated normal distributions inequations 60 and 61 to draw the latent data for the probit equations.
6. Obtain the latent data for the share equations:
(a) Where the share is censored use the appropriate elements in the full z∗ fromstep 5 and the full Σ from step 7 (or that assumed in step 1 if this is the firstpass) to compute the mean and variance of the conditional distribution usingequations 58 and 59. Use these to make a draw on the distribution in equation62.
(b) Where a purchase is observed compute the probability of a purchase usingequation 51 and the latent shares using equations 25 and 26.
7. Using the full β from step 2 and z∗ from steps 5 and 6, draw the full variance-covariance matrix Σ:
(a) Draw ρ from the normal distribution in equation 70.
(b) Draw Σε from the inverse Wishart distribution in equation 71.
(c) Construct the complete matrix using equation 68.
(d) Exclude the coefficients of the dropped share equation from Λ as well as therespective elements of Σ.
8. Return to step 2.
70
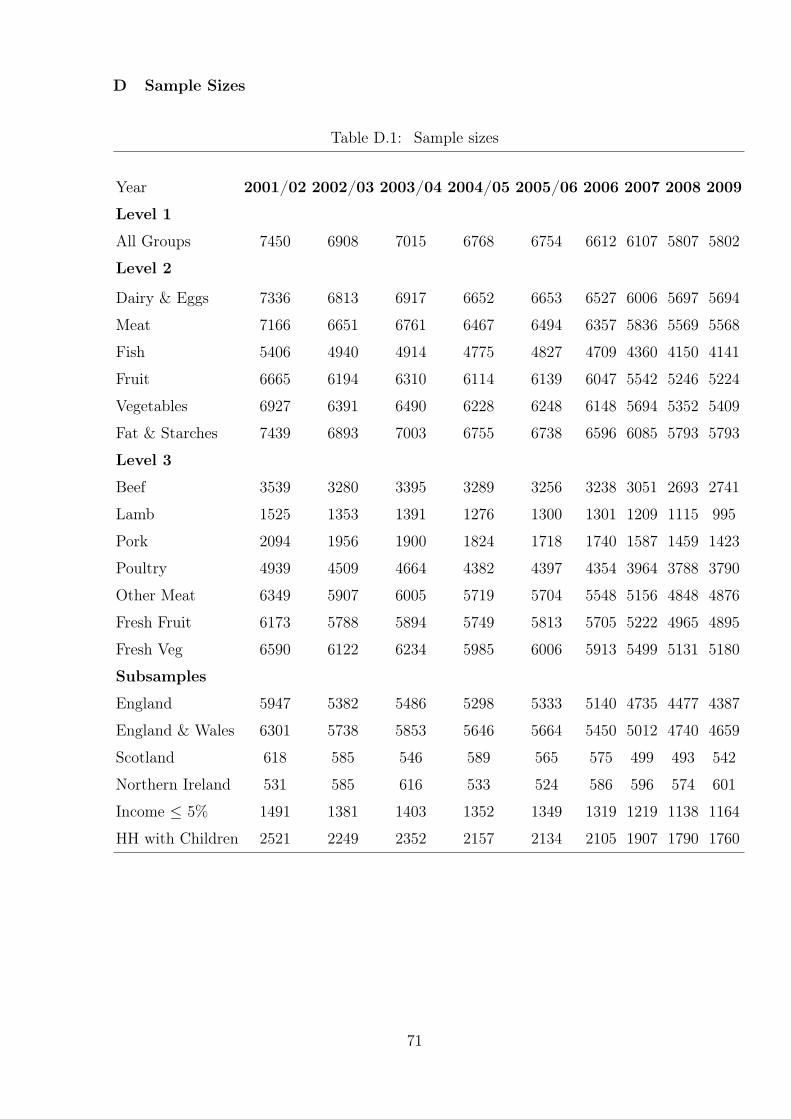
D Sample Sizes
Table D.1: Sample sizes
Year 2001/02 2002/03 2003/04 2004/05 2005/06 2006 2007 2008 2009
Level 1
All Groups 7450 6908 7015 6768 6754 6612 6107 5807 5802
Level 2
Dairy & Eggs 7336 6813 6917 6652 6653 6527 6006 5697 5694
Meat 7166 6651 6761 6467 6494 6357 5836 5569 5568
Fish 5406 4940 4914 4775 4827 4709 4360 4150 4141
Fruit 6665 6194 6310 6114 6139 6047 5542 5246 5224
Vegetables 6927 6391 6490 6228 6248 6148 5694 5352 5409
Fat & Starches 7439 6893 7003 6755 6738 6596 6085 5793 5793
Level 3
Beef 3539 3280 3395 3289 3256 3238 3051 2693 2741
Lamb 1525 1353 1391 1276 1300 1301 1209 1115 995
Pork 2094 1956 1900 1824 1718 1740 1587 1459 1423
Poultry 4939 4509 4664 4382 4397 4354 3964 3788 3790
Other Meat 6349 5907 6005 5719 5704 5548 5156 4848 4876
Fresh Fruit 6173 5788 5894 5749 5813 5705 5222 4965 4895
Fresh Veg 6590 6122 6234 5985 6006 5913 5499 5131 5180
Subsamples
England 5947 5382 5486 5298 5333 5140 4735 4477 4387
England & Wales 6301 5738 5853 5646 5664 5450 5012 4740 4659
Scotland 618 585 546 589 565 575 499 493 542
Northern Ireland 531 585 616 533 524 586 596 574 601
Income ≤ 5% 1491 1381 1403 1352 1349 1319 1219 1138 1164
HH with Children 2521 2249 2352 2157 2134 2105 1907 1790 1760
71

E Censoring
Table E.1: Censoring in Level 1 and 2 Models
Year 2001/02 2002/03 2003/04 2004/05 2005/06 2006 2007 2008 2009
Top Level Model
Dairy & Egg 0.02 0.01 0.01 0.02 0.01 0.01 0.02 0.02 0.02
Meat 0.04 0.037 0.04 0.04 0.04 0.04 0.04 0.04 0.04
Fish 0.27 0.29 0.30 0.29 0.29 0.29 0.29 0.29 0.29
Fruit & Nuts 0.11 0.10 0.10 0.10 0.09 0.09 0.09 0.10 0.10
Vegetables 0.05 0.05 0.05 0.06 0.05 0.05 0.05 0.06 0.05
Fats & Starches 0.00 0.00 0.00 0.00 0.00 0.00 0.00 0.00 0.00
Alcohol 0.49 0.48 0.47 0.48 0.47 0.47 0.47 0.49 0.48
Dairy & Eggs
Cheeses 0.26 0.27 0.28 0.28 0.27 0.27 0.26 0.27 0.26
Eggs 0.41 0.40 0.40 0.42 0.42 0.43 0.42 0.41 0.43
Cream 0.78 0.79 0.78 0.78 0.77 0.76 0.77 0.77 0.77
Milk 0.05 0.05 0.06 0.05 0.05 0.05 0.06 0.06 0.05
Other 0.32 0.31 0.31 0.30 0.29 0.29 0.29 0.29 0.27
Meat
Beef 0.51 0.51 0.50 0.49 0.50 0.49 0.48 0.52 0.51
Lamb 0.79 0.80 0.79 0.80 0.80 0.79 0.79 0.80 0.82
Pork 0.71 0.71 0.72 0.72 0.74 0.73 0.73 0.74 0.74
Bacon & Ham 0.26 0.25 0.25 0.25 0.27 0.28 0.27 0.27 0.27
Poultry 0.31 0.32 0.31 0.32 0.32 0.32 0.32 0.32 0.32
Sausages 0.58 0.59 0.58 0.59 0.61 0.60 0.59 0.61 0.59
Other meat 0.10 0.10 0.10 0.10 0.11 0.12 0.12 0.12 0.11
72

Table E.2: Censoring in Level 2 Models (cont.)
Year 2001/02 2002/03 2003/04 2004/05 2005/06 2006 2007 2008 2009
Fish
White fish 0.65 0.65 0.71 0.73 0.75 0.74 0.75 0.75 0.76
Salmon 0.80 0.81 0.80 0.79 0.79 0.78 0.79 0.78 0.77
Bluefish 0.85 0.84 0.83 0.82 0.81 0.81 0.80 0.83 0.82
Other fish 0.18 0.17 0.16 0.13 0.15 0.14 0.14 0.15 0.14
Fruit & Nuts
Fresh 0.07 0.07 0.07 0.06 0.05 0.06 0.06 0.05 0.06
Tinned & Dried 0.66 0.64 0.67 0.65 0.65 0.63 0.65 0.66 0.68
Nuts 0.76 0.77 0.76 0.72 0.71 0.71 0.71 0.72 0.71
Juice 0.49 0.49 0.51 0.56 0.48 0.47 0.48 0.49 0.52
Vegetables
Fresh 0.05 0.04 0.04 0.04 0.04 0.04 0.03 0.04 0.04
Canned 0.31 0.33 0.34 0.34 0.35 0.35 0.37 0.35 0.36
Fat & Starches
Potatoes 0.09 0.09 0.10 0.10 0.10 0.09 0.09 0.10 0.10
Sweets 0.15 0.15 0.16 0.16 0.17 0.17 0.16 0.17 0.16
Starch 0.00 0.00 0.01 0.01 0.014 0.01 0.01 0.01 0.00
Drinks 0.13 0.13 0.11 0.13 0.14 0.13 0.14 0.14 0.14
Other 0.14 0.14 0.14 0.15 0.15 0.14 0.14 0.15 0.14
Fat 0.25 0.25 0.27 0.27 0.27 0.27 0.28 0.28 0.29
73
Table E.3: Censoring in Level 3 Models
Year 2001/02 2002/03 2003/04 2004/05 2005/06 2006 2007 2008 2009
Beef
Joints 0.75 0.76 0.75 0.78 0.79 0.76 0.78 0.80 0.81
Cheap Steak 0.77 0.77 0.78 0.77 0.75 0.74 0.76 0.77 0.73
Expens. Steak 0.64 0.63 0.63 0.63 0.66 0.66 0.65 0.67 0.69
Mince 0.42 0.41 0.43 0.47 0.42 0.40 0.38 0.38 0.38
Other & veal 0.98 0.99 0.99 0.99 0.99 0.99 0.99 0.99 0.99
Lamb
Mutton 0.99 0.99 0.99 0.99 0.99 0.99 0.99 0.99 0.99
Joints 0.57 0.57 0.59 0.60 0.60 0.60 0.56 0.60 0.62
Chops 0.48 0.49 0.48 0.45 0.45 0.45 0.46 0.46 0.46
Other 0.83 0.83 0.81 0.85 0.84 0.82 0.87 0.83 0.82
Pork
Joints 0.73 0.73 0.76 0.74 0.76 0.74 0.72 0.74 0.74
Chops 0.52 0.54 0.62 0.62 0.60 0.61 0.66 0.65 0.64
Fillets & Steaks 0.63 0.60 0.66 0.67 0.68 0.67 0.66 0.65 0.67
Other 0.92 0.93 0.77 0.77 0.77 0.79 0.79 0.77 0.77
Poultry
Chicken 0.31 0.32 0.28 0.30 0.28 0.28 0.26 0.25 0.24
Turkey 0.82 0.83 0.83 0.84 0.86 0.87 0.88 0.89 0.90
Other 0.99 0.98 0.98 0.98 0.98 0.98 0.98 0.98 0.98
Cooked &0.45 0.45 0.46 0.45 0.49 0.48 0.50 0.53 0.52
Takeaway
74
Table E.4: Censoring in Level 3 Models (cont.)
Year 2001/02 2002/03 2003/04 2004/05 2005/06 2006 2007 2008 2009
Other Meat
Liver 0.94 0.93 0.93 0.95 0.95 0.95 0.95 0.95 0.95
Canned & Frozen 0.68 0.67 0.66 0.65 0.64 0.64 0.65 0.66 0.64
Processed0.10 0.12 0.11 0.10 0.11 0.10 0.12 0.11 0.10
& Takeaway
Ready meals 0.57 0.56 0.55 0.57 0.58 0.59 0.59 0.59 0.59
Fresh Fruit
Citrus 0.50 0.47 0.47 0.48 0.48 0.49 0.49 0.48 0.50
Apples & Pears 0.30 0.31 0.32 0.31 0.31 0.32 0.32 0.34 0.36
Bananas 0.26 0.25 0.256 0.25 0.25 0.25 0.23 0.25 0.27
Grapes 0.66 0.66 0.64 0.63 0.59 0.58 0.60 0.60 0.63
Other 0.51 0.49 0.49 0.45 0.42 0.41 0.40 0.40 0.39
Fresh Vegetables
Brassica 0.43 0.43 0.45 0.42 0.41 0.43 0.44 0.44 0.47
Root crops 0.39 0.39 0.41 0.38 0.36 0.36 0.35 0.33 0.36
Lettuce 0.45 0.44 0.42 0.42 0.42 0.41 0.42 0.45 0.45
Legumes 0.81 0.80 0.80 0.80 0.79 0.79 0.78 0.79 0.80
Other 0.26 0.24 0.24 0.23 0.22 0.22 0.20 0.21 0.20
Onions 0.42 0.41 0.42 0.42 0.41 0.40 0.40 0.41 0.41
Tomatoes 0.35 0.346 0.35 0.34 0.34 0.34 0.34 0.35 0.36
75

Table E.5: Censoring in Subsamples
Year 2001/02 2002/03 2003/04 2004/05 2005/06 2006 2007 2008 2009
England
Dairy & Egg 0.02 0.01 0.01 0.02 0.02 0.02 0.02 0.02 0.02
Meat 0.04 0.04 0.04 0.05 0.04 0.04 0.05 0.04 0.04
Fish 0.27 0.27 0.29 0.29 0.27 0.27 0.27 0.27 0.28
Fruit & Nuts 0.10 0.10 0.10 0.10 0.09 0.08 0.09 0.10 0.09
Vegetables 0.05 0.05 0.05 0.06 0.05 0.05 0.05 0.06 0.05
Fats & Starches 0.00 0.00 0.00 0.00 0.00 0.00 0.00 0.00 0.00
Alcohol 0.48 0.47 0.46 0.47 0.47 0.47 0.46 0.49 0.48
England & Wales
Dairy & Egg 0.02 0.01 0.01 0.02 0.02 0.01 0.02 0.02 0.02
Meat 0.04 0.04 0.04 0.05 0.04 0.04 0.05 0.04 0.04
Fish 0.27 0.27 0.29 0.29 0.28 0.28 0.28 0.28 0.28
Fruit & Nuts 0.10 0.10 0.10 0.09 0.09 0.08 0.09 0.09 0.10
Vegetables 0.048 0.06 0.05 0.06 0.05 0.05 0.05 0.06 0.05
Fats & Starches 0.00 0.00 0.00 0.00 0.00 0.00 0.00 0.0.00 0.00
Alcohol 0.47 0.47 0.46 0.47 0.46 0.47 0.46 0.49 0.47
Scotland
Dairy & Egg 0.01 0.01 0.01 0.02 0.01 0.00 0.02 0.02 0.02
Meat 0.03 0.02 0.03 0.02 0.04 0.023 0.04 0.03 0.03
Fish 0.26 0.32 0.33 0.30 0.33 0.33 0.31 0.30 0.30
Fruit & Nuts 0.14 0.13 0.14 0.12 0.10 0.09 0.12 0.13 0.13
Vegetables 0.06 0.06 0.08 0.08 0.08 0.06 0.06 0.00 0.06
Fats & Starches 0.00 0.00 0.00 0.00 0.00 0.00 0.00 0.01 0.00
Alcohol 0.46 0.47 0.47 0.49 0.46 0.45 0.47 0.48 0.46
76
Table E.6: Censoring in Subsamples (cont.)
Year 2001/02 2002/03 2003/04 2004/05 2005/06 2006 2007 2008 2009
Northern Ireland
Dairy & Egg 0.01 0.01 0.01 0.01 0.01 0.01 0.02 0.01 0.01
Meat 0.03 0.02 0.03 0.02 0.02 0.02 0.02 0.02 0.02
Fish 0.32 0.38 0.37 0.37 0.33 0.34 0.35 0.35 0.33
Fruit & Nuts 0.13 0.12 0.088 0.11 0.09 0.09 0.12 0.09 0.10
Vegetables 0.05 0.07 0.06 0.06 0.06 0.07 0.06 0.05 0.03
Fats & Starches 0.00 0.00 0.00 0.00 0.00 0.00 0.00 0.00 0.00
Alcohol 0.59 0.58 0.58 0.60 0.54 0.54 0.54 0.52 0.54
Lowest Income Quintile
Dairy & Egg 0.02 0.01 0.01 0.02 0.02 0.02 0.02 0.02 0.03
Meat 0.04 0.04 0.02 0.04 0.03 0.03 0.04 0.05 0.05
Fish 0.27 0.28 0.28 0.27 0.28 0.28 0.27 0.38 0.35
Fruit & Nuts 0.14 0.12 0.13 0.11 0.12 0.10 0.12 0.17 0.17
Vegetables 0.06 0.06 0.06 0.07 0.06 0.06 0.05 0.00 0.09
Fats & Starches 0.00 0.00 0.00 0.00 0.00 0.00 0.00 0.09 0.00
Alcohol 0.47 0.45 0.45 0.47 0.50 0.47 0.44 0.67 0.64
Children
Dairy & Egg 0.01 0.01 0.01 0.01 0.01 0.01 0.01 0.01 0.01
Meat 0.02 0.02 0.02 0.03 0.21 0.03 0.03 0.02 0.03
Fish 0.28 0.28 0.29 0.31 0.29 0.29 0.29 0.27 0.27
Fruit & Nuts 0.08 0.09 0.08 0.08 0.07 0.07 0.07 0.07 0.07
Vegetables 0.05 0.05 0.05 0.05 0.04 0.04 0.04 0.04 0.03
Fats & Starches 0.00 0.00 0.00 0.00 0.00 0.00 0.00 0.00 0.00
Alcohol 0.41 0.42 0.42 0.42 0.42690 0.43 0.43 0.44 0.43
77
F Significance
Table F.1: Percentage of significant elasticity estimates - Level 1
Year Uncompensated Compensated Expenditure
2001/02 44.90 59.18 100.00
2002/03 42.86 51.02 100.00
2003/04 36.73 55.10 100.00
2004/05 44.90 59.18 100.00
2005/06 46.94 55.10 100.00
2006 46.94 59.18 100.00
2007 46.94 42.86 100.00
2008 44.90 63.27 100.00
2009 48.98 55.10 100.00
Table F.2: Percentage of significant elasticity estimates - Level 2: Dairy & Eggs
Year Uncompensated Compensated Expenditure
2001/02 48.00 68.00 80.00
2002/03 44.00 60.00 80.00
2003/04 60.00 68.00 80.00
2004/05 44.00 68.00 80.00
2005/06 56.00 76.00 80.00
2006 60.00 76.00 80.00
2007 56.00 68.00 80.00
2008 56.00 76.00 80.00
2009 64.00 84.00 80.00
Table F.3: Percentage of significant elasticity estimates - Level 2: Meat
Year Uncompensated Compensated Expenditure
2001/02 32.65 75.51 100.00
2002/03 51.02 51.02 100.00
2003/04 28.57 63.27 100.00
2004/05 28.57 63.27 100.00
2005/06 22.45 63.27 100.00
2006 26.53 63.27 100.00
2007 24.49 63.27 100.00
2008 26.53 59.18 100.00
2009 26.53 59.18 100.00
78
Table F.4: Percentage of significant elasticity estimates - Level 2: Fish
Year Uncompensated Compensated Expenditure
2001/02 50.00 62.50 100.00
2002/03 43.75 62.50 100.00
2003/04 25.00 62.50 100.00
2004/05 43.75 62.50 100.00
2005/06 50.00 62.50 100.00
2006 43.75 62.50 100.00
2007 37.50 62.50 100.00
2008 31.25 62.50 100.00
2009 31.25 62.50 100.00
Table F.5: Percentage of significant elasticity estimates - Level 2: Fruits & Nuts
Year Uncompensated Compensated Expenditure
2001/02 37.50 75.00 100.00
2002/03 43.75 75.00 100.00
2003/04 43.75 75.00 100.00
2004/05 37.50 62.50 100.00
2005/06 43.75 75.00 100.00
2006 43.75 75.00 100.00
2007 37.50 87.50 100.00
2008 43.75 87.50 100.00
2009 43.75 75.00 100.00
Table F.6: Percentage of significant elasticity estimates - Level 2: Vegetables
Year Uncompensated Compensated Expenditure
2001/02 75.00 100.00 100.00
2002/03 75.00 100.00 100.00
2003/04 100.00 100.00 100.00
2004/05 75.00 100.00 100.00
2005/06 75.00 100.00 100.00
2006 75.00 100.00 100.00
2007 100.00 100.00 100.00
2008 75.00 100.00 100.00
2009 75.00 100.00 100.00
79
Table F.7: Percentage of significant elasticity estimates - Level 2: Fats & Starches
Year Uncompensated Compensated Expenditure
2001/02 38.89 55.56 83.33
2002/03 47.22 72.22 83.33
2003/04 47.22 66.67 83.33
2004/05 58.33 66.67 83.33
2005/06 55.56 72.22 83.33
2006 61.11 61.11 83.33
2007 58.33 50.00 83.33
2008 55.56 61.11 83.33
2009 47.22 61.11 83.33
Table F.8: Percentage of significant elasticity estimates - Level 3: Beef
Year Uncompensated Compensated Expenditure
2001/02 24.00 68.00 80.00
2002/03 24.00 60.00 80.00
2003/04 32.00 60.00 80.00
2004/05 24.00 52.00 80.00
2005/06 20.00 60.00 80.00
2006 32.00 68.00 80.00
2007 28.00 68.00 80.00
2008 20.00 60.00 80.00
2009 24.00 60.00 80.00
Table F.9: Percentage of significant elasticity estimates - Level 3: Lamb
Year Uncompensated Compensated Expenditure
2001/02 25.00 50.00 75.00
2002/03 25.00 50.00 75.00
2003/04 25.00 37.50 75.00
2004/05 25.00 50.00 100.00
2005/06 25.00 37.50 75.00
2006 25.00 50.00 75.00
2007 25.00 37.50 75.00
2008 25.00 37.50 75.00
2009 37.50 37.50 0.00
80
Table F.10: Percentage of significant elasticity estimates - Level 3: Pork
Year Uncompensated Compensated Expenditure
2001/02 25.00 62.50 75.00
2002/03 25.00 62.50 75.00
2003/04 25.00 87.50 100.00
2004/05 25.00 87.50 100.00
2005/06 25.00 62.50 100.00
2006 25.00 62.50 100.00
2007 25.00 75.00 100.00
2008 25.00 75.00 100.00
2009 25.00 75.00 100.00
Table F.11: Percentage of significant elasticity estimates - Level 3: Poultry
Year Uncompensated Compensated Expenditure
2001/02 25.00 75.00 100.00
2002/03 37.50 75.00 100.00
2003/04 37.50 75.00 100.00
2004/05 25.00 75.00 100.00
2005/06 37.50 75.00 100.00
2006 25.00 75.00 100.00
2007 37.50 75.00 100.00
2008 25.00 75.00 100.00
2009 37.50 75.00 100.00
Table F.12: Percentage of significant elasticity estimates - Level 3: Other meat
Year Uncompensated Compensated Expenditure
2001/02 37.50 62.50 50.00
2002/03 43.75 50.00 100.00
2003/04 37.50 50.00 50.00
2004/05 43.75 62.50 100.00
2005/06 43.75 50.00 100.00
2006 43.75 50.00 75.00
2007 37.50 50.00 100.00
2008 43.75 50.00 100.00
2009 43.75 50.00 100.00
81
Table F.13: Percentage of significant elasticity estimates - Level 3: Fresh fruits
Year Uncompensated Compensated Expenditure
2001/02 48.00 92.00 100.00
2002/03 44.00 84.00 100.00
2003/04 48.00 92.00 100.00
2004/05 56.00 100.00 100.00
2005/06 60.00 92.00 100.00
2006 48.00 92.00 100.00
2007 52.00 84.00 100.00
2008 40.00 84.00 100.00
2009 48.00 84.00 100.00
Table F.14: Percentage of significant elasticity estimates - Level 3: Fresh vegetables
Year Uncompensated Compensated Expenditure
2001/02 44.90 87.76 100.00
2002/03 46.94 83.67 100.00
2003/04 36.73 83.67 100.00
2004/05 42.86 75.51 100.00
2005/06 46.94 75.51 100.00
2006 40.82 71.43 100.00
2007 30.61 83.67 100.00
2008 30.61 71.43 100.00
2009 34.69 79.59 100.00
Table F.15: Percentage of significant elasticity estimates - Subsamples: England
Year Uncompensated Compensated Expenditure
2001/02 44.90 59.18 100.00
2002/03 40.82 51.02 100.00
2003/04 34.69 51.02 100.00
2004/05 51.02 59.18 100.00
2005/06 42.86 51.02 100.00
2006 42.86 51.02 100.00
2007 42.86 42.86 100.00
2008 38.78 67.35 100.00
2009 46.94 59.18 100.00
82
Table F.16: Percentage of significant elasticity estimates - Subsamples: England & Wales
Year Uncompensated Compensated Expenditure
2001/02 51.02 59.18 100.00
2002/03 40.82 55.10 100.00
2003/04 36.73 51.02 100.00
2004/05 46.94 59.18 100.00
2005/06 44.90 51.02 100.00
2006 42.86 51.02 100.00
2007 38.78 42.86 100.00
2008 42.86 67.35 100.00
2009 44.90 63.27 100.00
Table F.17: Percentage of significant elasticity estimates - Subsamples: Scotland
Year Uncompensated Compensated Expenditure
2001/02 20.41 30.61 85.71
2002/03 24.49 18.37 85.71
2003/04 36.73 30.61 85.71
2004/05 32.65 34.69 85.71
2005/06 24.49 30.61 71.43
2006 38.78 30.61 85.71
2007 26.53 30.61 85.71
2008 28.57 22.45 85.71
2009 28.57 30.61 85.71
Table F.18: Percentage of significant elasticity estimates - Subsampels: Northern Ireland
Year Uncompensated Compensated Expenditure
2001/02 26.53 38.78 71.43
2002/03 20.41 30.61 71.43
2003/04 36.73 46.94 71.43
2004/05 34.69 26.53 71.43
2005/06 22.45 34.69 71.43
2006 34.69 30.61 71.43
2007 22.45 22.45 71.43
2008 22.45 30.61 71.43
2009 26.53 34.69 71.43
83
Table F.19: Percentage of significant elasticity estimates - Subsamples: Households inlowest income quintile
Year Uncompensated Compensated Expenditure
2001/02 34.69 38.78 85.71
2002/03 28.57 30.61 85.71
2003/04 28.57 30.61 85.71
2004/05 34.69 30.61 100.00
2005/06 20.41 34.69 85.71
2006 22.45 34.69 85.71
2007 32.65 34.69 85.71
2008 24.49 26.53 85.71
2009 30.61 34.69 85.71
Table F.20: Percentage of significant elasticity estimates - Subsamples: Households withchildren
Year Uncompensated Compensated Expenditure
2001/02 20.41 46.94 100.00
2002/03 30.61 51.02 100.00
2003/04 38.78 42.86 85.71
2004/05 24.49 42.86 100.00
2005/06 22.45 51.02 100.00
2006 18.37 51.02 85.71
2007 30.61 42.86 85.71
2008 30.61 51.02 85.71
2009 40.82 46.94 85.71
84

G Uncompensated Elasticity Estimates
G.1 Level 1
Table G.1: Uncompensated Elasticities - Level 1: 2001/02
DairyMeat Fish
FruitVeg.
Fats &Alcohol Expenditure
& Egg & Nuts Starches
Dairy & Egg -0.430 -0.044 -0.013 -0.073 -0.082 -0.286 0.042 0.885
Meat -0.042 -0.860 -0.021 0.010 -0.034 -0.146 0.001 1.091
Fish -0.009 -0.012 -0.351 0.075 -0.019 -0.171 -0.165 0.652
Fruit & Nuts -0.103 0.086 0.038 -0.806 -0.045 0.143 -0.153 0.841
Veg. -0.115 -0.062 -0.023 -0.048 -0.555 -0.072 -0.066 0.942
Fats & Starches -0.098 -0.083 -0.038 0.009 -0.026 -0.830 -0.026 1.092
Alcohol 0.038 0.046 -0.073 -0.098 -0.041 -0.010 -0.751 0.889
Table G.2: Uncompensated Elasticities - Level 1: 2002/03
DairyMeat Fish
FruitVeg.
Fats &Alcohol Expenditure
& Egg & Nuts Starches
Dairy & Egg -0.347 -0.040 -0.015 -0.034 -0.110 -0.307 -0.026 0.879
Meat -0.043 -0.800 -0.007 0.033 -0.017 -0.224 -0.049 1.106
Fish -0.013 0.063 -0.428 0.026 -0.013 -0.178 -0.108 0.652
Fruits & Nuts -0.044 0.156 0.007 -0.843 -0.021 0.118 -0.214 0.841
Veg. -0.156 -0.014 -0.020 -0.027 -0.584 -0.004 -0.148 0.952
Fats & Starches -0.106 -0.126 -0.038 0.005 -0.011 -0.841 0.030 1.088
Alcohol -0.024 -0.044 -0.049 -0.140 -0.095 0.178 -0.703 0.877
Table G.3: Uncompensated Elasticities - Level 1: 2003/04
DairyMeat Fish
FruitVeg.
Fats &Alcohol Expenditure
& Egg & Nuts Starches
Dairy & Egg -0.318 -0.014 -0.040 -0.069 -0.109 -0.348 0.000 0.897
Meat -0.027 -0.827 -0.022 0.024 -0.025 -0.168 -0.053 1.098
Fish -0.078 -0.029 -0.331 0.015 -0.032 -0.077 -0.150 0.683
Fruits & Nuts -0.094 0.129 0.002 -0.743 0.001 -0.031 -0.108 0.843
Veg. -0.148 -0.035 -0.027 -0.005 -0.614 0.018 -0.123 0.933
Fats & Starches -0.116 -0.097 -0.025 -0.023 -0.008 -0.831 0.013 1.087
Alcohol 0.003 -0.053 -0.061 -0.070 -0.079 0.122 -0.737 0.874
85
Table G.4: Uncompensated Elasticities - Level 1: 2004/05
DairyMeat Fish
FruitVeg.
Fats &Alcohol Expenditure
& Egg & Nuts Starches
Dairy & Egg -0.433 -0.010 -0.030 -0.066 -0.079 -0.292 0.014 0.897
Meat -0.027 -0.805 -0.027 0.030 -0.051 -0.193 -0.041 1.113
Fish -0.047 -0.037 -0.308 0.058 -0.021 -0.161 -0.133 0.649
Fruits & Nuts -0.088 0.150 0.026 -0.815 0.001 0.088 -0.202 0.841
Veg. -0.108 -0.103 -0.024 -0.005 -0.573 -0.052 -0.062 0.928
Fats & Starches -0.101 -0.107 -0.037 0.000 -0.023 -0.826 0.010 1.084
Alcohol 0.013 -0.028 -0.059 -0.131 -0.039 0.104 -0.748 0.887
Table G.5: Uncompensated Elasticities - Level 1: 2005/06
DairyMeat Fish
FruitVeg.
Fats &Alcohol Expenditure
& Egg & Nuts Starches
Dairy & Egg -0.391 -0.038 -0.033 -0.064 -0.026 -0.352 0.007 0.896
Meat -0.041 -0.824 -0.040 0.000 -0.025 -0.101 -0.079 1.108
Fish -0.056 -0.101 -0.360 0.086 -0.018 -0.078 -0.158 0.685
Fruits & Nuts -0.082 0.049 0.039 -0.756 -0.006 0.060 -0.181 0.878
Veg. -0.039 -0.030 -0.021 -0.012 -0.598 -0.096 -0.151 0.947
Fats & Starches -0.121 -0.052 -0.027 -0.002 -0.032 -0.867 0.026 1.075
Alcohol 0.006 -0.103 -0.071 -0.130 -0.104 0.146 -0.644 0.899
Table G.6: Uncompensated Elasticities - Level 1: 2006
DairyMeat Fish
FruitVeg.
Fats &Alcohol Expenditure
& Egg & Nuts Starches
Dairy & Egg -0.354 -0.029 -0.044 -0.098 -0.076 -0.325 0.019 0.906
Meat -0.036 -0.841 -0.021 0.036 -0.022 -0.197 -0.034 1.115
Fish -0.077 -0.006 -0.407 0.099 -0.003 -0.099 -0.190 0.685
Fruits & Nuts -0.119 0.147 0.047 -0.765 -0.021 -0.003 -0.144 0.860
Veg. -0.102 -0.024 -0.014 -0.029 -0.615 -0.057 -0.114 0.955
Fats & Starches -0.111 -0.106 -0.030 -0.018 -0.022 -0.798 0.011 1.075
Alcohol 0.020 -0.017 -0.087 -0.109 -0.078 0.103 -0.721 0.889
86

Table G.7: Uncompensated Elasticities - Level 1: 2007
DairyMeat Fish
FruitVeg.
Fats &Alcohol Expenditure
& Egg & Nuts Starches
Dairy & Egg -0.401 0.001 0.003 -0.069 -0.112 -0.312 -0.020 0.911
Meat -0.021 -0.736 -0.046 0.038 -0.038 -0.224 -0.091 1.119
Fish 0.032 -0.117 -0.309 -0.049 0.020 -0.090 -0.155 0.667
Fruits & Nuts -0.085 0.153 -0.036 -0.742 -0.046 -0.007 -0.102 0.865
Veg. -0.146 -0.060 -0.001 -0.052 -0.543 -0.045 -0.095 0.943
Fats & Starches -0.108 -0.122 -0.030 -0.019 -0.022 -0.835 0.056 1.080
Alcohol -0.016 -0.122 -0.073 -0.075 -0.064 0.256 -0.783 0.876
Table G.8: Uncompensated Elasticities - Level 1: 2008
DairyMeat Fish
FruitVeg.
Fats &Alcohol Expenditure
& Egg & Nuts Starches
Dairy & Egg -0.414 0.039 -0.054 -0.141 -0.122 -0.280 0.043 0.929
Meat 0.000 -0.790 -0.053 0.049 -0.017 -0.310 0.005 1.117
Fish -0.107 -0.155 -0.328 0.044 -0.011 -0.018 -0.106 0.681
Fruits & Nuts -0.191 0.180 0.016 -0.762 0.002 0.056 -0.174 0.872
Veg. -0.169 -0.010 -0.018 -0.005 -0.616 -0.009 -0.125 0.952
Fats & Starches -0.101 -0.168 -0.020 -0.004 -0.012 -0.784 0.014 1.074
Alcohol 0.055 0.067 -0.054 -0.133 -0.091 0.134 -0.826 0.847
Table G.9: Uncompensated Elasticities - Level 1: 2009
DairyMeat Fish
FruitVeg.
Fats &Alcohol Expenditure
& Egg & Nuts Starches
Dairy & Egg -0.505 -0.008 -0.048 -0.045 -0.072 -0.321 0.103 0.896
Meat -0.030 -0.804 -0.011 0.060 -0.016 -0.230 -0.090 1.121
Fish -0.101 0.039 -0.441 0.047 -0.042 -0.035 -0.143 0.675
Fruits & Nuts -0.066 0.220 0.019 -0.698 -0.018 -0.117 -0.213 0.872
Veg. -0.105 -0.001 -0.034 -0.021 -0.633 0.032 -0.173 0.935
Fats & Starches -0.119 -0.122 -0.021 -0.039 -0.005 -0.847 0.075 1.078
Alcohol 0.110 -0.123 -0.065 -0.147 -0.124 0.332 -0.856 0.873
87

G.2
Level2
Table G.10: Uncompensated Elasticities - Level 2: 2001/02
Cheese Eggs Cream Milk Other dairy Beef Lamb Pork Bacon & Ham Poultry Sausages
Cheese -0.621 0.002 -0.040 -0.232 -0.003 -0.001 0.000 0.000 -0.001 -0.002 0.000
Eggs 0.090 -0.458 -0.029 -0.197 0.029 -0.001 0.000 0.000 -0.001 -0.001 0.000
Cream -0.257 -0.067 -0.423 0.525 -0.046 0.000 0.000 0.000 0.000 -0.001 0.000
Milk -0.184 -0.072 0.011 -0.666 -0.132 -0.001 -0.001 -0.001 -0.002 -0.002 0.000
Other dairy -0.025 -0.021 -0.022 -0.215 -0.693 -0.001 0.000 -0.001 -0.002 -0.002 0.000
Beef -0.001 0.000 0.000 -0.002 -0.001 -0.671 -0.085 -0.046 -0.021 0.013 -0.016
Lamb -0.001 0.000 0.000 -0.002 -0.001 -0.194 -0.755 0.140 0.054 0.100 -0.016
Pork -0.001 0.000 0.000 -0.002 -0.001 -0.085 0.139 -0.877 0.066 0.054 -0.081
Bacon & Ham -0.001 0.000 0.000 -0.002 -0.001 -0.005 0.015 0.017 -0.781 0.014 0.016
Poultry -0.001 0.000 0.000 -0.002 -0.001 0.006 0.017 0.003 -0.007 -0.971 0.002
Sausages -0.001 0.000 0.000 -0.001 -0.001 -0.009 -0.011 -0.096 0.091 0.077 -0.640
Other meat -0.001 0.000 0.000 -0.003 -0.001 -0.061 -0.031 -0.013 -0.087 -0.037 -0.023
White fish 0.000 0.000 0.000 0.000 0.000 0.000 0.000 0.000 0.000 0.000 0.000
Salmon 0.000 0.000 0.000 0.000 0.000 0.000 0.000 0.000 0.000 0.000 0.000
Blue fish 0.000 0.000 0.000 0.000 0.000 0.000 0.000 0.000 0.000 0.000 0.000
Other fish 0.000 0.000 0.000 0.000 0.000 0.000 0.000 0.000 0.000 -0.001 0.000
Fresh fruit -0.003 -0.001 0.000 -0.006 -0.003 0.002 0.001 0.001 0.003 0.004 0.001
Tinned & dried fruit -0.002 -0.001 0.000 -0.004 -0.002 0.002 0.001 0.001 0.002 0.002 0.001
Nuts -0.002 -0.001 0.000 -0.004 -0.002 0.002 0.001 0.001 0.002 0.002 0.001
Juice -0.002 -0.001 0.000 -0.005 -0.002 0.002 0.001 0.001 0.003 0.003 0.001
Fresh veg. -0.003 -0.001 0.000 -0.007 -0.003 -0.002 -0.001 -0.001 -0.002 -0.003 -0.001
Canned veg. -0.001 0.000 0.000 -0.002 -0.001 -0.001 0.000 0.000 -0.001 -0.001 0.000
Potatoes -0.002 -0.001 0.000 -0.005 -0.002 -0.002 -0.001 -0.001 -0.003 -0.003 -0.001
Sweets -0.003 -0.001 0.000 -0.005 -0.002 -0.002 -0.001 -0.001 -0.003 -0.003 -0.001
Starches -0.003 -0.001 0.000 -0.006 -0.003 -0.002 -0.001 -0.001 -0.003 -0.004 -0.001
Non-alc. Drink -0.003 -0.001 0.000 -0.005 -0.002 -0.002 -0.001 -0.001 -0.003 -0.003 -0.001
Other Starches -0.002 -0.001 0.000 -0.005 -0.002 -0.002 -0.001 -0.001 -0.003 -0.003 -0.001
Fats -0.002 -0.001 0.000 -0.003 -0.001 -0.001 -0.001 -0.001 -0.002 -0.002 0.000
Alcohol 0.001 0.000 0.000 0.002 0.001 0.001 0.000 0.000 0.001 0.002 0.000
88
Table G.11: Uncompensated Elasticities - Level 2: 2001/02 (cont.)
Other meat White fish Salmon Blue fish Other fish Fresh fruit Tinned & dried fruit Nuts Juice
Cheese -0.004 0.000 0.000 0.000 0.000 -0.003 0.000 0.000 -0.001
Eggs -0.002 0.000 0.000 0.000 0.000 -0.002 0.000 0.000 -0.001
Cream -0.001 0.000 0.000 0.000 0.000 -0.001 0.000 0.000 0.000
Milk -0.004 0.000 0.000 0.000 0.000 -0.004 0.000 0.000 -0.001
Other dairy -0.004 0.000 0.000 0.000 0.000 -0.004 0.000 0.000 -0.001
Beef -0.115 0.000 0.000 0.000 -0.001 0.001 0.000 0.000 0.000
Lamb -0.102 0.000 0.000 0.000 0.000 0.000 0.000 0.000 0.000
Pork 0.059 0.000 0.000 0.000 0.000 0.000 0.000 0.000 0.000
Bacon & Ham -0.115 0.000 0.000 0.000 0.000 0.000 0.000 0.000 0.000
Poultry -0.011 0.000 0.000 0.000 -0.001 0.001 0.000 0.000 0.000
Sausages -0.021 0.000 0.000 0.000 0.000 0.000 0.000 0.000 0.000
Other meat -0.874 0.000 0.000 0.000 -0.001 0.001 0.000 0.000 0.000
White fish -0.001 -0.692 -0.043 -0.113 -0.103 0.004 0.000 0.000 0.001
Salmon -0.001 -0.077 -0.732 -0.050 -0.021 0.003 0.000 0.000 0.001
Blue fish -0.001 -0.299 -0.057 -0.475 0.046 0.003 0.000 0.000 0.001
Other fish -0.001 -0.065 -0.021 -0.013 -0.928 0.004 0.000 0.000 0.001
Fresh fruit 0.008 0.000 0.000 0.000 0.001 -0.987 -0.039 -0.008 -0.045
Tinned & dried fruit 0.005 0.000 0.000 0.000 0.001 -0.082 -0.696 0.009 0.079
Nuts 0.005 0.000 0.000 0.000 0.001 0.189 0.012 -0.822 -0.057
Juice 0.007 0.000 0.000 0.000 0.001 -0.027 0.021 -0.032 -0.828
Fresh veg. -0.006 0.000 0.000 0.000 -0.001 -0.003 0.000 0.000 -0.001
Canned veg. -0.002 0.000 0.000 0.000 0.000 -0.001 0.000 0.000 0.000
Potatoes -0.007 0.000 0.000 0.000 -0.001 0.000 0.000 0.000 0.000
Sweets -0.007 0.000 0.000 0.000 -0.001 0.000 0.000 0.000 0.000
Starches -0.008 0.000 0.000 0.000 -0.001 0.000 0.000 0.000 0.000
Non-alc. Drink -0.007 0.000 0.000 0.000 -0.001 0.000 0.000 0.000 0.000
Other Starches -0.007 0.000 0.000 0.000 -0.001 0.000 0.000 0.000 0.000
Fats -0.004 0.000 0.000 0.000 -0.001 0.000 0.000 0.000 0.000
Alcohol 0.004 -0.001 0.000 0.000 -0.002 -0.004 -0.001 0.000 -0.001
89
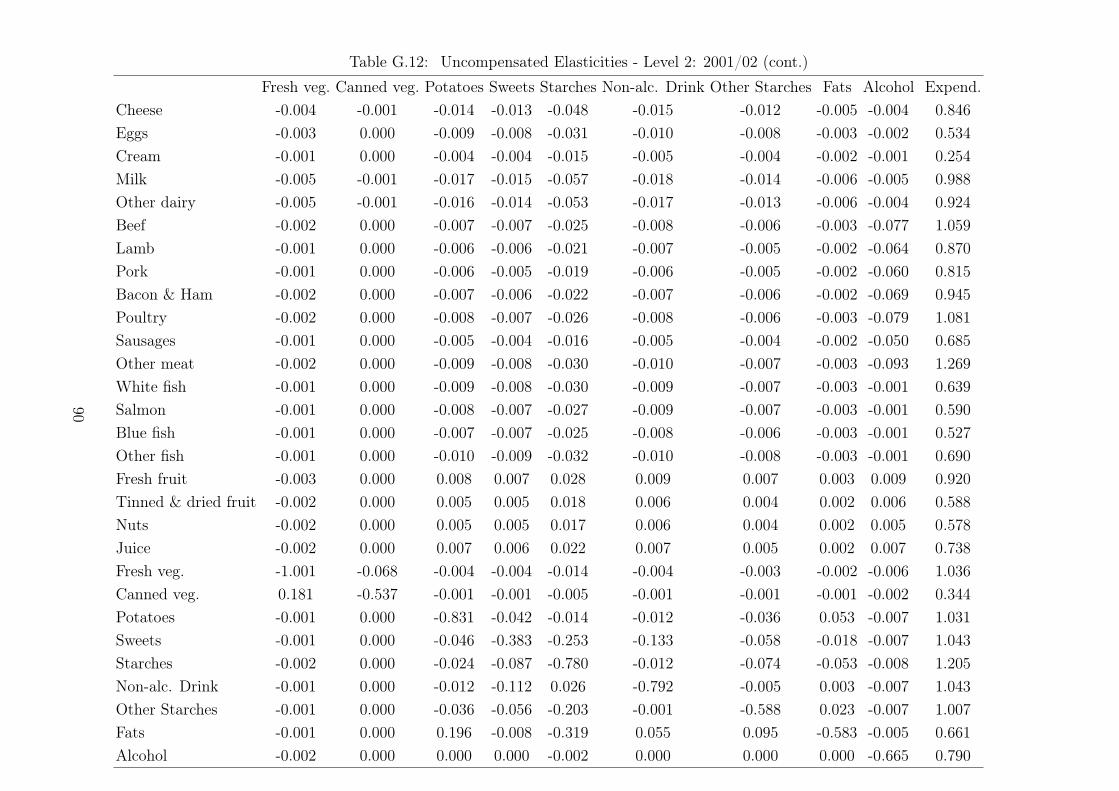
Table G.12: Uncompensated Elasticities - Level 2: 2001/02 (cont.)
Fresh veg. Canned veg. Potatoes Sweets Starches Non-alc. Drink Other Starches Fats Alcohol Expend.
Cheese -0.004 -0.001 -0.014 -0.013 -0.048 -0.015 -0.012 -0.005 -0.004 0.846
Eggs -0.003 0.000 -0.009 -0.008 -0.031 -0.010 -0.008 -0.003 -0.002 0.534
Cream -0.001 0.000 -0.004 -0.004 -0.015 -0.005 -0.004 -0.002 -0.001 0.254
Milk -0.005 -0.001 -0.017 -0.015 -0.057 -0.018 -0.014 -0.006 -0.005 0.988
Other dairy -0.005 -0.001 -0.016 -0.014 -0.053 -0.017 -0.013 -0.006 -0.004 0.924
Beef -0.002 0.000 -0.007 -0.007 -0.025 -0.008 -0.006 -0.003 -0.077 1.059
Lamb -0.001 0.000 -0.006 -0.006 -0.021 -0.007 -0.005 -0.002 -0.064 0.870
Pork -0.001 0.000 -0.006 -0.005 -0.019 -0.006 -0.005 -0.002 -0.060 0.815
Bacon & Ham -0.002 0.000 -0.007 -0.006 -0.022 -0.007 -0.006 -0.002 -0.069 0.945
Poultry -0.002 0.000 -0.008 -0.007 -0.026 -0.008 -0.006 -0.003 -0.079 1.081
Sausages -0.001 0.000 -0.005 -0.004 -0.016 -0.005 -0.004 -0.002 -0.050 0.685
Other meat -0.002 0.000 -0.009 -0.008 -0.030 -0.010 -0.007 -0.003 -0.093 1.269
White fish -0.001 0.000 -0.009 -0.008 -0.030 -0.009 -0.007 -0.003 -0.001 0.639
Salmon -0.001 0.000 -0.008 -0.007 -0.027 -0.009 -0.007 -0.003 -0.001 0.590
Blue fish -0.001 0.000 -0.007 -0.007 -0.025 -0.008 -0.006 -0.003 -0.001 0.527
Other fish -0.001 0.000 -0.010 -0.009 -0.032 -0.010 -0.008 -0.003 -0.001 0.690
Fresh fruit -0.003 0.000 0.008 0.007 0.028 0.009 0.007 0.003 0.009 0.920
Tinned & dried fruit -0.002 0.000 0.005 0.005 0.018 0.006 0.004 0.002 0.006 0.588
Nuts -0.002 0.000 0.005 0.005 0.017 0.006 0.004 0.002 0.005 0.578
Juice -0.002 0.000 0.007 0.006 0.022 0.007 0.005 0.002 0.007 0.738
Fresh veg. -1.001 -0.068 -0.004 -0.004 -0.014 -0.004 -0.003 -0.002 -0.006 1.036
Canned veg. 0.181 -0.537 -0.001 -0.001 -0.005 -0.001 -0.001 -0.001 -0.002 0.344
Potatoes -0.001 0.000 -0.831 -0.042 -0.014 -0.012 -0.036 0.053 -0.007 1.031
Sweets -0.001 0.000 -0.046 -0.383 -0.253 -0.133 -0.058 -0.018 -0.007 1.043
Starches -0.002 0.000 -0.024 -0.087 -0.780 -0.012 -0.074 -0.053 -0.008 1.205
Non-alc. Drink -0.001 0.000 -0.012 -0.112 0.026 -0.792 -0.005 0.003 -0.007 1.043
Other Starches -0.001 0.000 -0.036 -0.056 -0.203 -0.001 -0.588 0.023 -0.007 1.007
Fats -0.001 0.000 0.196 -0.008 -0.319 0.055 0.095 -0.583 -0.005 0.661
Alcohol -0.002 0.000 0.000 0.000 -0.002 0.000 0.000 0.000 -0.665 0.790
90
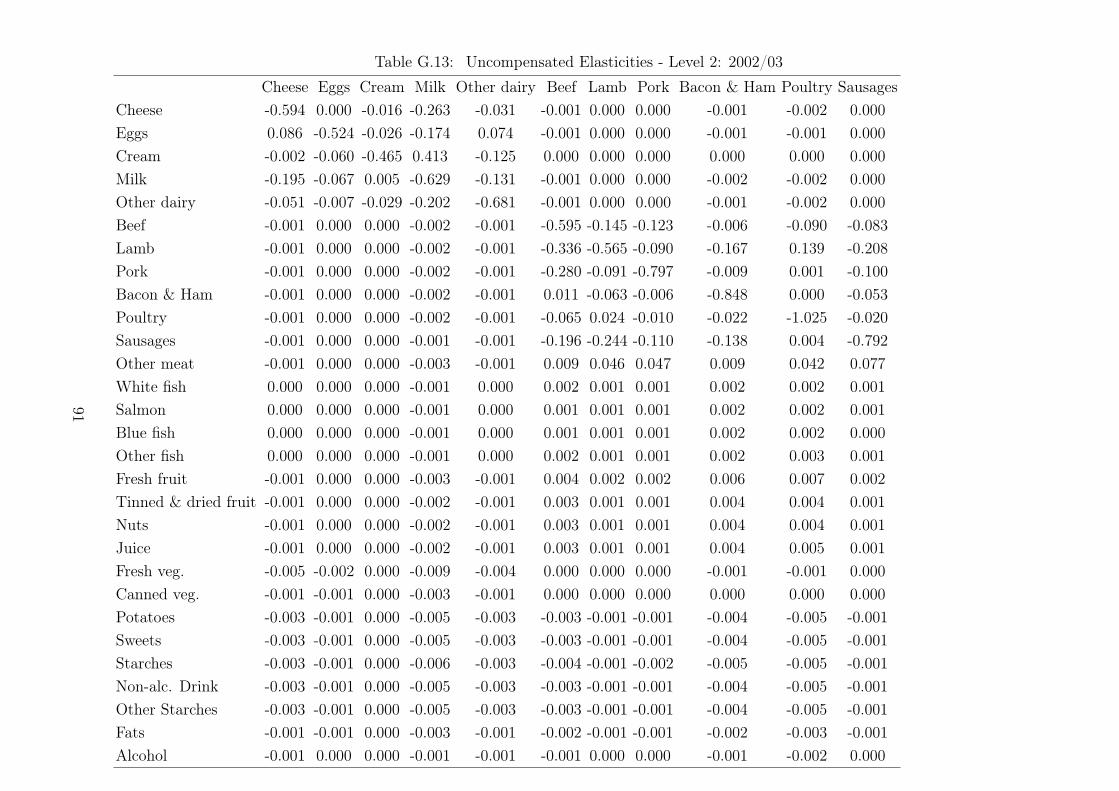
Table G.13: Uncompensated Elasticities - Level 2: 2002/03
Cheese Eggs Cream Milk Other dairy Beef Lamb Pork Bacon & Ham Poultry Sausages
Cheese -0.594 0.000 -0.016 -0.263 -0.031 -0.001 0.000 0.000 -0.001 -0.002 0.000
Eggs 0.086 -0.524 -0.026 -0.174 0.074 -0.001 0.000 0.000 -0.001 -0.001 0.000
Cream -0.002 -0.060 -0.465 0.413 -0.125 0.000 0.000 0.000 0.000 0.000 0.000
Milk -0.195 -0.067 0.005 -0.629 -0.131 -0.001 0.000 0.000 -0.002 -0.002 0.000
Other dairy -0.051 -0.007 -0.029 -0.202 -0.681 -0.001 0.000 0.000 -0.001 -0.002 0.000
Beef -0.001 0.000 0.000 -0.002 -0.001 -0.595 -0.145 -0.123 -0.006 -0.090 -0.083
Lamb -0.001 0.000 0.000 -0.002 -0.001 -0.336 -0.565 -0.090 -0.167 0.139 -0.208
Pork -0.001 0.000 0.000 -0.002 -0.001 -0.280 -0.091 -0.797 -0.009 0.001 -0.100
Bacon & Ham -0.001 0.000 0.000 -0.002 -0.001 0.011 -0.063 -0.006 -0.848 0.000 -0.053
Poultry -0.001 0.000 0.000 -0.002 -0.001 -0.065 0.024 -0.010 -0.022 -1.025 -0.020
Sausages -0.001 0.000 0.000 -0.001 -0.001 -0.196 -0.244 -0.110 -0.138 0.004 -0.792
Other meat -0.001 0.000 0.000 -0.003 -0.001 0.009 0.046 0.047 0.009 0.042 0.077
White fish 0.000 0.000 0.000 -0.001 0.000 0.002 0.001 0.001 0.002 0.002 0.001
Salmon 0.000 0.000 0.000 -0.001 0.000 0.001 0.001 0.001 0.002 0.002 0.001
Blue fish 0.000 0.000 0.000 -0.001 0.000 0.001 0.001 0.001 0.002 0.002 0.000
Other fish 0.000 0.000 0.000 -0.001 0.000 0.002 0.001 0.001 0.002 0.003 0.001
Fresh fruit -0.001 0.000 0.000 -0.003 -0.001 0.004 0.002 0.002 0.006 0.007 0.002
Tinned & dried fruit -0.001 0.000 0.000 -0.002 -0.001 0.003 0.001 0.001 0.004 0.004 0.001
Nuts -0.001 0.000 0.000 -0.002 -0.001 0.003 0.001 0.001 0.004 0.004 0.001
Juice -0.001 0.000 0.000 -0.002 -0.001 0.003 0.001 0.001 0.004 0.005 0.001
Fresh veg. -0.005 -0.002 0.000 -0.009 -0.004 0.000 0.000 0.000 -0.001 -0.001 0.000
Canned veg. -0.001 -0.001 0.000 -0.003 -0.001 0.000 0.000 0.000 0.000 0.000 0.000
Potatoes -0.003 -0.001 0.000 -0.005 -0.003 -0.003 -0.001 -0.001 -0.004 -0.005 -0.001
Sweets -0.003 -0.001 0.000 -0.005 -0.003 -0.003 -0.001 -0.001 -0.004 -0.005 -0.001
Starches -0.003 -0.001 0.000 -0.006 -0.003 -0.004 -0.001 -0.002 -0.005 -0.005 -0.001
Non-alc. Drink -0.003 -0.001 0.000 -0.005 -0.003 -0.003 -0.001 -0.001 -0.004 -0.005 -0.001
Other Starches -0.003 -0.001 0.000 -0.005 -0.003 -0.003 -0.001 -0.001 -0.004 -0.005 -0.001
Fats -0.001 -0.001 0.000 -0.003 -0.001 -0.002 -0.001 -0.001 -0.002 -0.003 -0.001
Alcohol -0.001 0.000 0.000 -0.001 -0.001 -0.001 0.000 0.000 -0.001 -0.002 0.000
91
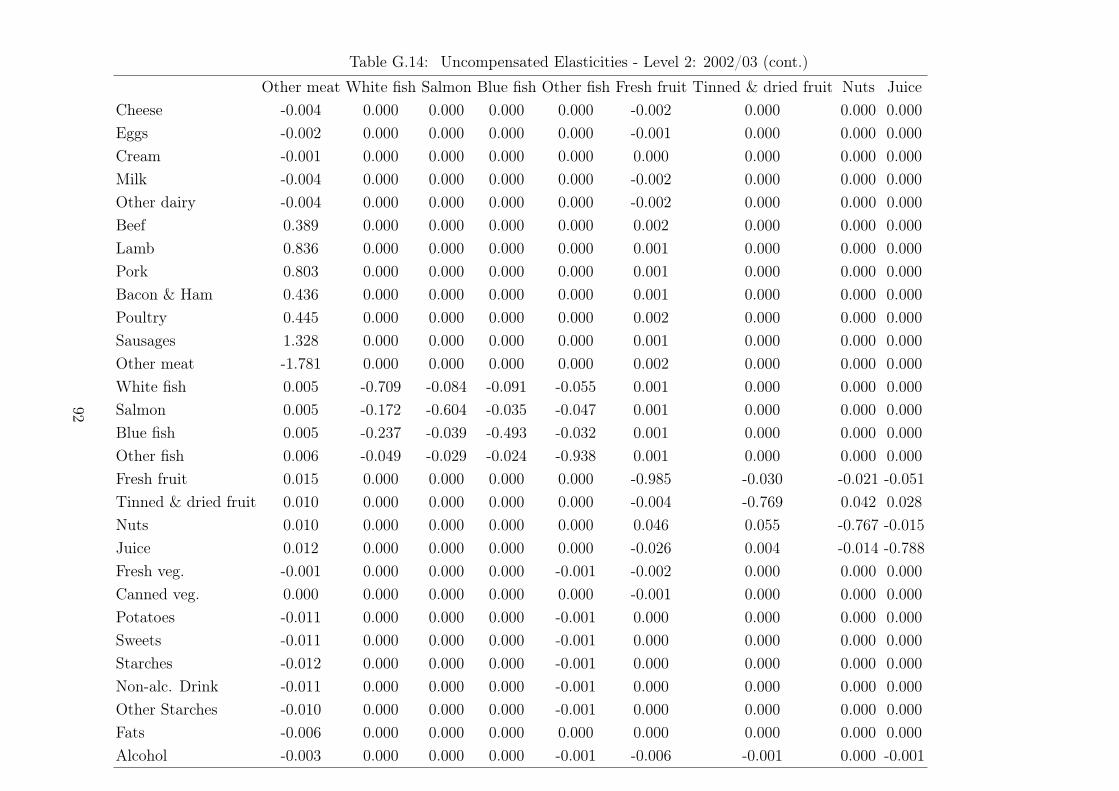
Table G.14: Uncompensated Elasticities - Level 2: 2002/03 (cont.)
Other meat White fish Salmon Blue fish Other fish Fresh fruit Tinned & dried fruit Nuts Juice
Cheese -0.004 0.000 0.000 0.000 0.000 -0.002 0.000 0.000 0.000
Eggs -0.002 0.000 0.000 0.000 0.000 -0.001 0.000 0.000 0.000
Cream -0.001 0.000 0.000 0.000 0.000 0.000 0.000 0.000 0.000
Milk -0.004 0.000 0.000 0.000 0.000 -0.002 0.000 0.000 0.000
Other dairy -0.004 0.000 0.000 0.000 0.000 -0.002 0.000 0.000 0.000
Beef 0.389 0.000 0.000 0.000 0.000 0.002 0.000 0.000 0.000
Lamb 0.836 0.000 0.000 0.000 0.000 0.001 0.000 0.000 0.000
Pork 0.803 0.000 0.000 0.000 0.000 0.001 0.000 0.000 0.000
Bacon & Ham 0.436 0.000 0.000 0.000 0.000 0.001 0.000 0.000 0.000
Poultry 0.445 0.000 0.000 0.000 0.000 0.002 0.000 0.000 0.000
Sausages 1.328 0.000 0.000 0.000 0.000 0.001 0.000 0.000 0.000
Other meat -1.781 0.000 0.000 0.000 0.000 0.002 0.000 0.000 0.000
White fish 0.005 -0.709 -0.084 -0.091 -0.055 0.001 0.000 0.000 0.000
Salmon 0.005 -0.172 -0.604 -0.035 -0.047 0.001 0.000 0.000 0.000
Blue fish 0.005 -0.237 -0.039 -0.493 -0.032 0.001 0.000 0.000 0.000
Other fish 0.006 -0.049 -0.029 -0.024 -0.938 0.001 0.000 0.000 0.000
Fresh fruit 0.015 0.000 0.000 0.000 0.000 -0.985 -0.030 -0.021 -0.051
Tinned & dried fruit 0.010 0.000 0.000 0.000 0.000 -0.004 -0.769 0.042 0.028
Nuts 0.010 0.000 0.000 0.000 0.000 0.046 0.055 -0.767 -0.015
Juice 0.012 0.000 0.000 0.000 0.000 -0.026 0.004 -0.014 -0.788
Fresh veg. -0.001 0.000 0.000 0.000 -0.001 -0.002 0.000 0.000 0.000
Canned veg. 0.000 0.000 0.000 0.000 0.000 -0.001 0.000 0.000 0.000
Potatoes -0.011 0.000 0.000 0.000 -0.001 0.000 0.000 0.000 0.000
Sweets -0.011 0.000 0.000 0.000 -0.001 0.000 0.000 0.000 0.000
Starches -0.012 0.000 0.000 0.000 -0.001 0.000 0.000 0.000 0.000
Non-alc. Drink -0.011 0.000 0.000 0.000 -0.001 0.000 0.000 0.000 0.000
Other Starches -0.010 0.000 0.000 0.000 -0.001 0.000 0.000 0.000 0.000
Fats -0.006 0.000 0.000 0.000 0.000 0.000 0.000 0.000 0.000
Alcohol -0.003 0.000 0.000 0.000 -0.001 -0.006 -0.001 0.000 -0.001
92

Table G.15: Uncompensated Elasticities - Level 2: 2002/03 (cont.)
Fresh veg. Canned veg. Potatoes Sweets Starches Non-alc. Drink Other Starches Fats Alcohol Expend.
Cheese -0.006 -0.001 -0.015 -0.014 -0.054 -0.017 -0.013 -0.006 -0.004 0.859
Eggs -0.004 -0.001 -0.009 -0.008 -0.034 -0.010 -0.008 -0.004 -0.002 0.536
Cream -0.002 0.000 -0.004 -0.004 -0.014 -0.004 -0.003 -0.002 -0.001 0.227
Milk -0.006 -0.001 -0.017 -0.015 -0.061 -0.019 -0.015 -0.007 -0.004 0.967
Other dairy -0.006 -0.001 -0.016 -0.015 -0.058 -0.018 -0.014 -0.006 -0.004 0.923
Beef -0.001 0.000 -0.010 -0.010 -0.038 -0.012 -0.009 -0.004 -0.071 1.058
Lamb -0.001 0.000 -0.009 -0.008 -0.033 -0.010 -0.008 -0.004 -0.061 0.915
Pork -0.001 0.000 -0.008 -0.008 -0.031 -0.010 -0.008 -0.003 -0.057 0.846
Bacon & Ham -0.001 0.000 -0.009 -0.008 -0.034 -0.010 -0.008 -0.004 -0.062 0.925
Poultry -0.001 0.000 -0.011 -0.010 -0.040 -0.012 -0.010 -0.004 -0.073 1.092
Sausages -0.001 0.000 -0.007 -0.006 -0.025 -0.008 -0.006 -0.003 -0.046 0.682
Other meat -0.001 0.000 -0.013 -0.012 -0.047 -0.015 -0.011 -0.005 -0.087 1.293
White fish -0.001 0.000 -0.008 -0.008 -0.031 -0.010 -0.008 -0.003 0.006 0.628
Salmon -0.001 0.000 -0.008 -0.007 -0.028 -0.009 -0.007 -0.003 0.005 0.573
Blue fish -0.001 0.000 -0.007 -0.007 -0.026 -0.008 -0.006 -0.003 0.005 0.536
Other fish -0.001 0.000 -0.009 -0.009 -0.034 -0.011 -0.008 -0.004 0.006 0.695
Fresh fruit -0.001 0.000 0.006 0.006 0.023 0.007 0.006 0.003 0.016 0.925
Tinned & dried fruit -0.001 0.000 0.004 0.004 0.015 0.005 0.004 0.002 0.010 0.598
Nuts -0.001 0.000 0.004 0.004 0.015 0.005 0.004 0.002 0.010 0.580
Juice -0.001 0.000 0.005 0.004 0.018 0.005 0.004 0.002 0.012 0.701
Fresh veg. -1.001 -0.074 0.000 0.000 -0.001 0.000 0.000 0.000 -0.001 1.051
Canned veg. 0.164 -0.519 0.000 0.000 0.000 0.000 0.000 0.000 0.000 0.348
Potatoes -0.001 0.000 -0.853 -0.042 -0.018 -0.016 -0.018 0.048 -0.011 1.044
Sweets -0.001 0.000 -0.047 -0.632 -0.131 -0.062 -0.057 0.013 -0.011 1.062
Starches -0.001 0.000 -0.021 -0.047 -0.829 -0.027 -0.054 -0.048 -0.013 1.191
Non-alc. Drink -0.001 0.000 -0.015 -0.049 -0.029 -0.820 -0.007 0.016 -0.011 1.048
Other Starches -0.001 0.000 -0.015 -0.050 -0.133 -0.004 -0.587 -0.085 -0.011 1.015
Fats 0.000 0.000 0.181 0.082 -0.240 0.109 -0.179 -0.450 -0.006 0.577
Alcohol -0.004 -0.001 0.008 0.007 0.028 0.009 0.007 0.003 -0.625 0.769
93
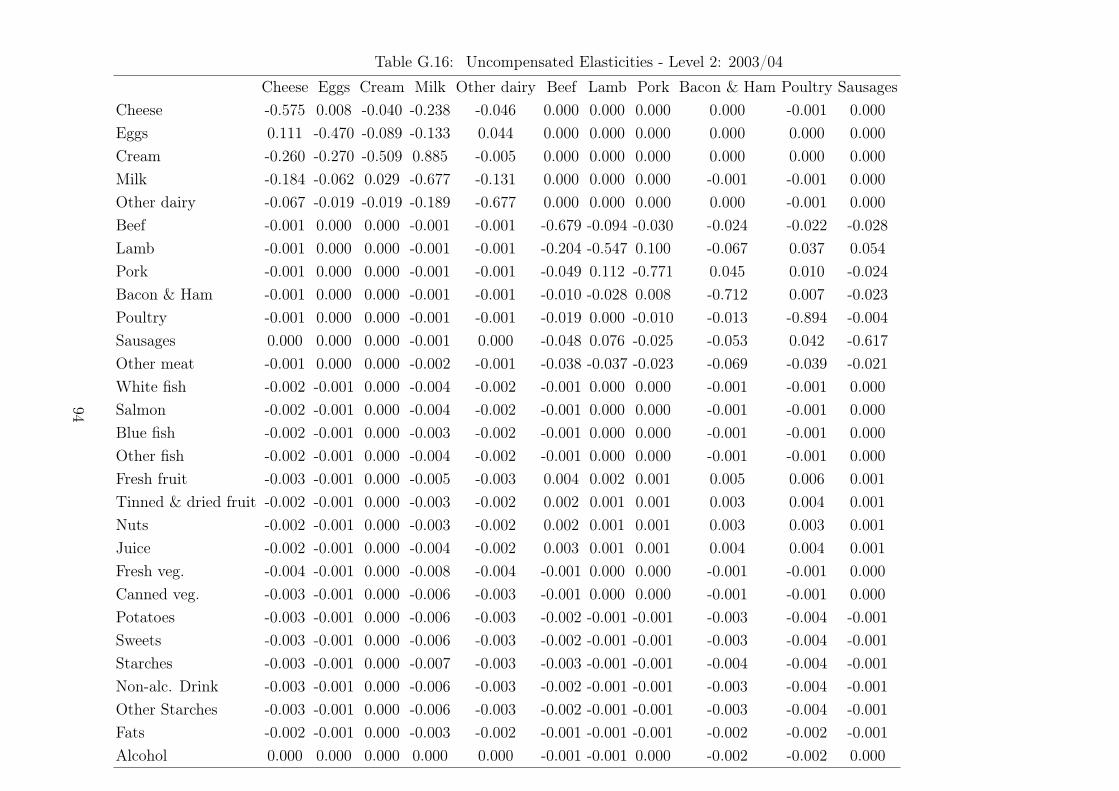
Table G.16: Uncompensated Elasticities - Level 2: 2003/04
Cheese Eggs Cream Milk Other dairy Beef Lamb Pork Bacon & Ham Poultry Sausages
Cheese -0.575 0.008 -0.040 -0.238 -0.046 0.000 0.000 0.000 0.000 -0.001 0.000
Eggs 0.111 -0.470 -0.089 -0.133 0.044 0.000 0.000 0.000 0.000 0.000 0.000
Cream -0.260 -0.270 -0.509 0.885 -0.005 0.000 0.000 0.000 0.000 0.000 0.000
Milk -0.184 -0.062 0.029 -0.677 -0.131 0.000 0.000 0.000 -0.001 -0.001 0.000
Other dairy -0.067 -0.019 -0.019 -0.189 -0.677 0.000 0.000 0.000 0.000 -0.001 0.000
Beef -0.001 0.000 0.000 -0.001 -0.001 -0.679 -0.094 -0.030 -0.024 -0.022 -0.028
Lamb -0.001 0.000 0.000 -0.001 -0.001 -0.204 -0.547 0.100 -0.067 0.037 0.054
Pork -0.001 0.000 0.000 -0.001 -0.001 -0.049 0.112 -0.771 0.045 0.010 -0.024
Bacon & Ham -0.001 0.000 0.000 -0.001 -0.001 -0.010 -0.028 0.008 -0.712 0.007 -0.023
Poultry -0.001 0.000 0.000 -0.001 -0.001 -0.019 0.000 -0.010 -0.013 -0.894 -0.004
Sausages 0.000 0.000 0.000 -0.001 0.000 -0.048 0.076 -0.025 -0.053 0.042 -0.617
Other meat -0.001 0.000 0.000 -0.002 -0.001 -0.038 -0.037 -0.023 -0.069 -0.039 -0.021
White fish -0.002 -0.001 0.000 -0.004 -0.002 -0.001 0.000 0.000 -0.001 -0.001 0.000
Salmon -0.002 -0.001 0.000 -0.004 -0.002 -0.001 0.000 0.000 -0.001 -0.001 0.000
Blue fish -0.002 -0.001 0.000 -0.003 -0.002 -0.001 0.000 0.000 -0.001 -0.001 0.000
Other fish -0.002 -0.001 0.000 -0.004 -0.002 -0.001 0.000 0.000 -0.001 -0.001 0.000
Fresh fruit -0.003 -0.001 0.000 -0.005 -0.003 0.004 0.002 0.001 0.005 0.006 0.001
Tinned & dried fruit -0.002 -0.001 0.000 -0.003 -0.002 0.002 0.001 0.001 0.003 0.004 0.001
Nuts -0.002 -0.001 0.000 -0.003 -0.002 0.002 0.001 0.001 0.003 0.003 0.001
Juice -0.002 -0.001 0.000 -0.004 -0.002 0.003 0.001 0.001 0.004 0.004 0.001
Fresh veg. -0.004 -0.001 0.000 -0.008 -0.004 -0.001 0.000 0.000 -0.001 -0.001 0.000
Canned veg. -0.003 -0.001 0.000 -0.006 -0.003 -0.001 0.000 0.000 -0.001 -0.001 0.000
Potatoes -0.003 -0.001 0.000 -0.006 -0.003 -0.002 -0.001 -0.001 -0.003 -0.004 -0.001
Sweets -0.003 -0.001 0.000 -0.006 -0.003 -0.002 -0.001 -0.001 -0.003 -0.004 -0.001
Starches -0.003 -0.001 0.000 -0.007 -0.003 -0.003 -0.001 -0.001 -0.004 -0.004 -0.001
Non-alc. Drink -0.003 -0.001 0.000 -0.006 -0.003 -0.002 -0.001 -0.001 -0.003 -0.004 -0.001
Other Starches -0.003 -0.001 0.000 -0.006 -0.003 -0.002 -0.001 -0.001 -0.003 -0.004 -0.001
Fats -0.002 -0.001 0.000 -0.003 -0.002 -0.001 -0.001 -0.001 -0.002 -0.002 -0.001
Alcohol 0.000 0.000 0.000 0.000 0.000 -0.001 -0.001 0.000 -0.002 -0.002 0.000
94
Table G.17: Uncompensated Elasticities - Level 2: 2003/04 (cont.)
Other meat White fish Salmon Blue fish Other fish Fresh fruit Tinned & dried fruit Nuts Juice
Cheese -0.001 0.000 0.000 0.000 -0.001 -0.004 0.000 0.000 -0.001
Eggs -0.001 0.000 0.000 0.000 -0.001 -0.002 0.000 0.000 0.000
Cream 0.000 0.000 0.000 0.000 0.000 -0.001 0.000 0.000 0.000
Milk -0.001 0.000 0.000 0.000 -0.001 -0.004 0.000 0.000 -0.001
Other dairy -0.001 0.000 0.000 0.000 -0.001 -0.004 0.000 0.000 -0.001
Beef -0.035 0.000 0.000 0.000 -0.001 0.001 0.000 0.000 0.000
Lamb -0.129 0.000 0.000 0.000 0.000 0.001 0.000 0.000 0.000
Pork -0.015 0.000 0.000 0.000 0.000 0.001 0.000 0.000 0.000
Bacon & Ham -0.065 0.000 0.000 0.000 0.000 0.001 0.000 0.000 0.000
Poultry -0.010 0.000 0.000 0.000 -0.001 0.001 0.000 0.000 0.000
Sausages 0.002 0.000 0.000 0.000 0.000 0.001 0.000 0.000 0.000
Other meat -0.902 0.000 0.000 0.000 -0.001 0.001 0.000 0.000 0.000
White fish -0.003 -0.774 -0.048 -0.078 -0.032 0.001 0.000 0.000 0.000
Salmon -0.002 -0.074 -0.676 -0.057 -0.063 0.001 0.000 0.000 0.000
Blue fish -0.002 -0.162 -0.068 -0.522 -0.041 0.001 0.000 0.000 0.000
Other fish -0.003 -0.031 -0.030 -0.026 -0.943 0.001 0.000 0.000 0.000
Fresh fruit 0.013 0.000 0.000 0.000 0.000 -0.984 -0.023 -0.022 -0.049
Tinned & dried fruit 0.008 0.000 0.000 0.000 0.000 0.052 -0.792 -0.027 0.084
Nuts 0.008 0.000 0.000 0.000 0.000 0.062 -0.028 -0.633 -0.042
Juice 0.010 0.000 0.000 0.000 0.000 -0.033 0.029 -0.028 -0.782
Fresh veg. -0.003 0.000 0.000 0.000 -0.001 0.000 0.000 0.000 0.000
Canned veg. -0.002 0.000 0.000 0.000 0.000 0.000 0.000 0.000 0.000
Potatoes -0.008 0.000 0.000 0.000 -0.001 -0.001 0.000 0.000 0.000
Sweets -0.008 0.000 0.000 0.000 -0.001 -0.001 0.000 0.000 0.000
Starches -0.010 0.000 0.000 0.000 -0.001 -0.001 0.000 0.000 0.000
Non-alc. Drink -0.009 0.000 0.000 0.000 -0.001 -0.001 0.000 0.000 0.000
Other Starches -0.008 0.000 0.000 0.000 -0.001 -0.001 0.000 0.000 0.000
Fats -0.005 0.000 0.000 0.000 0.000 -0.001 0.000 0.000 0.000
Alcohol -0.004 0.000 0.000 0.000 -0.001 -0.003 0.000 0.000 -0.001
95

Table G.18: Uncompensated Elasticities - Level 2: 2003/04 (cont.)
Fresh veg. Canned veg. Potatoes Sweets Starches Non-alc. Drink Other Starches Fats Alcohol Expend.
Cheese -0.006 -0.001 -0.016 -0.015 -0.059 -0.020 -0.015 -0.006 -0.001 0.869
Eggs -0.003 -0.001 -0.010 -0.009 -0.036 -0.012 -0.009 -0.004 -0.001 0.523
Cream -0.001 0.000 -0.003 -0.003 -0.011 -0.003 -0.003 -0.001 0.000 0.154
Milk -0.007 -0.001 -0.019 -0.018 -0.068 -0.022 -0.017 -0.007 -0.001 0.997
Other dairy -0.006 -0.001 -0.018 -0.017 -0.064 -0.021 -0.016 -0.007 -0.001 0.945
Beef -0.001 0.000 -0.008 -0.007 -0.028 -0.009 -0.007 -0.003 -0.075 1.041
Lamb -0.001 0.000 -0.006 -0.006 -0.023 -0.008 -0.006 -0.002 -0.062 0.864
Pork -0.001 0.000 -0.006 -0.005 -0.021 -0.007 -0.005 -0.002 -0.057 0.790
Bacon & Ham -0.001 0.000 -0.007 -0.007 -0.025 -0.008 -0.006 -0.003 -0.068 0.940
Poultry -0.001 0.000 -0.008 -0.008 -0.029 -0.010 -0.007 -0.003 -0.078 1.086
Sausages -0.001 0.000 -0.005 -0.005 -0.019 -0.006 -0.005 -0.002 -0.051 0.712
Other meat -0.002 0.000 -0.010 -0.009 -0.035 -0.011 -0.009 -0.004 -0.093 1.289
White fish -0.002 0.000 -0.004 -0.003 -0.013 -0.004 -0.003 -0.001 -0.003 0.655
Salmon -0.002 0.000 -0.003 -0.003 -0.012 -0.004 -0.003 -0.001 -0.002 0.611
Blue fish -0.001 0.000 -0.003 -0.003 -0.011 -0.004 -0.003 -0.001 -0.002 0.557
Other fish -0.002 0.000 -0.004 -0.004 -0.014 -0.005 -0.004 -0.001 -0.003 0.724
Fresh fruit 0.000 0.000 -0.002 -0.002 -0.006 -0.002 -0.001 -0.001 0.014 0.927
Tinned & dried fruit 0.000 0.000 -0.001 -0.001 -0.004 -0.001 -0.001 0.000 0.009 0.587
Nuts 0.000 0.000 -0.001 -0.001 -0.004 -0.001 -0.001 0.000 0.008 0.550
Juice 0.000 0.000 -0.001 -0.001 -0.005 -0.002 -0.001 0.000 0.010 0.699
Fresh veg. -0.961 -0.056 0.001 0.001 0.003 0.001 0.001 0.000 -0.003 0.973
Canned veg. -0.097 -0.609 0.001 0.001 0.002 0.001 0.001 0.000 -0.002 0.675
Potatoes 0.000 0.000 -0.805 -0.010 -0.023 -0.023 -0.026 0.002 -0.009 1.030
Sweets 0.000 0.000 -0.012 -0.522 -0.281 -0.021 -0.089 0.027 -0.009 1.045
Starches 0.000 0.000 -0.024 -0.089 -0.775 -0.028 -0.052 -0.055 -0.010 1.191
Non-alc. Drink 0.000 0.000 -0.023 -0.018 -0.032 -0.778 -0.051 -0.006 -0.009 1.056
Other Starches 0.000 0.000 -0.025 -0.084 -0.124 -0.057 -0.594 0.021 -0.009 1.006
Fats 0.000 0.000 0.050 0.117 -0.354 0.035 0.095 -0.480 -0.005 0.626
Alcohol -0.004 -0.001 0.005 0.005 0.019 0.006 0.005 0.002 -0.658 0.764
96
Table G.19: Uncompensated Elasticities - Level 2: 2004/05
Cheese Eggs Cream Milk Other dairy Beef Lamb Pork Bacon & Ham Poultry Sausages
Cheese -0.605 0.012 -0.035 -0.267 -0.008 0.000 0.000 0.000 0.000 0.000 0.000
Eggs 0.122 -0.617 -0.037 -0.117 0.083 0.000 0.000 0.000 0.000 0.000 0.000
Cream -0.223 -0.100 -0.417 0.689 -0.144 0.000 0.000 0.000 0.000 0.000 0.000
Milk -0.205 -0.059 0.020 -0.626 -0.160 0.000 0.000 0.000 0.000 0.000 0.000
Other dairy -0.031 -0.008 -0.030 -0.226 -0.697 0.000 0.000 0.000 0.000 0.000 0.000
Beef -0.001 0.000 0.000 -0.001 -0.001 -0.632 -0.109 -0.051 -0.015 -0.020 -0.033
Lamb -0.001 0.000 0.000 -0.001 -0.001 -0.272 -0.591 0.096 -0.081 0.122 0.043
Pork -0.001 0.000 0.000 -0.001 -0.001 -0.105 0.097 -0.691 0.071 0.038 -0.112
Bacon & Ham -0.001 0.000 0.000 -0.001 -0.001 0.003 -0.030 0.019 -0.700 0.001 -0.011
Poultry -0.001 0.000 0.000 -0.001 -0.001 -0.017 0.021 -0.003 -0.021 -0.941 -0.001
Sausages 0.000 0.000 0.000 -0.001 0.000 -0.061 0.057 -0.129 -0.010 0.059 -0.605
Other meat -0.001 0.000 0.000 -0.002 -0.001 -0.051 -0.026 -0.020 -0.077 -0.029 -0.013
White fish -0.001 0.000 0.000 -0.002 -0.001 -0.001 0.000 0.000 -0.001 -0.001 0.000
Salmon -0.001 0.000 0.000 -0.002 -0.001 -0.001 0.000 0.000 -0.001 -0.001 0.000
Blue fish -0.001 0.000 0.000 -0.002 -0.001 -0.001 0.000 0.000 -0.001 -0.001 0.000
Other fish -0.001 0.000 0.000 -0.003 -0.001 -0.001 0.000 0.000 -0.001 -0.002 0.000
Fresh fruit -0.003 -0.001 0.000 -0.005 -0.003 0.004 0.002 0.002 0.005 0.006 0.002
Tinned & dried fruit -0.002 -0.001 0.000 -0.003 -0.002 0.003 0.001 0.001 0.003 0.004 0.001
Nuts -0.002 -0.001 0.000 -0.003 -0.002 0.003 0.001 0.001 0.004 0.004 0.001
Juice -0.002 -0.001 0.000 -0.004 -0.002 0.003 0.001 0.001 0.004 0.005 0.001
Fresh veg. -0.003 -0.001 0.000 -0.006 -0.003 -0.003 -0.001 -0.001 -0.004 -0.004 -0.001
Canned veg. -0.001 0.000 0.000 -0.002 -0.001 -0.001 0.000 0.000 -0.001 -0.001 0.000
Potatoes -0.002 -0.001 0.000 -0.005 -0.002 -0.003 -0.001 -0.001 -0.003 -0.004 -0.001
Sweets -0.003 -0.001 0.000 -0.005 -0.003 -0.003 -0.001 -0.001 -0.003 -0.004 -0.001
Starches -0.003 -0.001 0.000 -0.006 -0.003 -0.003 -0.001 -0.001 -0.004 -0.005 -0.001
Non-alc. Drink -0.003 -0.001 0.000 -0.005 -0.003 -0.003 -0.001 -0.001 -0.003 -0.004 -0.001
Other Starches -0.002 -0.001 0.000 -0.005 -0.003 -0.003 -0.001 -0.001 -0.003 -0.004 -0.001
Fats -0.002 -0.001 0.000 -0.003 -0.002 -0.002 -0.001 -0.001 -0.002 -0.003 -0.001
Alcohol 0.000 0.000 0.000 0.001 0.000 -0.001 0.000 0.000 -0.001 -0.001 0.000
97

Table G.20: Uncompensated Elasticities - Level 2: 2004/05 (cont.)
Other meat White fish Salmon Blue fish Other fish Fresh fruit Tinned & dried fruit Nuts Juice
Cheese -0.001 0.000 0.000 0.000 -0.001 -0.004 0.000 0.000 -0.001
Eggs -0.001 0.000 0.000 0.000 0.000 -0.002 0.000 0.000 0.000
Cream 0.000 0.000 0.000 0.000 0.000 -0.001 0.000 0.000 0.000
Milk -0.001 0.000 0.000 0.000 -0.001 -0.004 0.000 0.000 -0.001
Other dairy -0.001 0.000 0.000 0.000 -0.001 -0.004 0.000 0.000 -0.001
Beef -0.084 0.000 0.000 0.000 -0.001 0.002 0.000 0.000 0.000
Lamb -0.073 0.000 0.000 0.000 -0.001 0.001 0.000 0.000 0.000
Pork 0.000 0.000 0.000 0.000 -0.001 0.001 0.000 0.000 0.000
Bacon & Ham -0.093 0.000 0.000 0.000 -0.001 0.001 0.000 0.000 0.000
Poultry -0.003 0.000 0.000 0.000 -0.001 0.002 0.000 0.000 0.000
Sausages 0.067 0.000 0.000 0.000 0.000 0.001 0.000 0.000 0.000
Other meat -0.889 0.000 0.000 0.000 -0.001 0.002 0.000 0.000 0.000
White fish -0.003 -0.659 -0.041 -0.105 -0.131 0.003 0.000 0.000 0.001
Salmon -0.003 -0.055 -0.711 -0.039 -0.042 0.003 0.000 0.000 0.000
Blue fish -0.003 -0.206 -0.042 -0.496 -0.023 0.003 0.000 0.000 0.000
Other fish -0.003 -0.061 -0.028 -0.026 -0.915 0.003 0.000 0.000 0.001
Fresh fruit 0.015 0.000 0.000 0.000 0.001 -1.000 -0.012 -0.029 -0.040
Tinned & dried fruit 0.009 0.000 0.000 0.000 0.000 0.168 -0.839 0.012 -0.029
Nuts 0.010 0.000 0.000 0.000 0.001 -0.016 0.008 -0.722 -0.006
Juice 0.011 0.000 0.000 0.000 0.001 -0.007 -0.024 -0.009 -0.762
Fresh veg. -0.010 0.000 0.000 0.000 -0.001 0.000 0.000 0.000 0.000
Canned veg. -0.003 0.000 0.000 0.000 0.000 0.000 0.000 0.000 0.000
Potatoes -0.009 0.000 0.000 0.000 -0.001 0.000 0.000 0.000 0.000
Sweets -0.009 0.000 0.000 0.000 -0.001 0.000 0.000 0.000 0.000
Starches -0.010 0.000 0.000 0.000 -0.001 0.000 0.000 0.000 0.000
Non-alc. Drink -0.009 0.000 0.000 0.000 -0.001 0.000 0.000 0.000 0.000
Other Starches -0.009 0.000 0.000 0.000 -0.001 0.000 0.000 0.000 0.000
Fats -0.006 0.000 0.000 0.000 -0.001 0.000 0.000 0.000 0.000
Alcohol -0.002 0.000 0.000 0.000 -0.001 -0.006 -0.001 -0.001 -0.001
98
Table G.21: Uncompensated Elasticities - Level 2: 2004/05 (cont.)
Fresh veg. Canned veg. Potatoes Sweets Starches Non-alc. Drink Other Starches Fats Alcohol Expend.
Cheese -0.004 -0.001 -0.014 -0.013 -0.050 -0.016 -0.012 -0.005 -0.001 0.868
Eggs -0.003 0.000 -0.009 -0.008 -0.031 -0.010 -0.008 -0.003 -0.001 0.544
Cream -0.001 0.000 -0.003 -0.003 -0.011 -0.003 -0.003 -0.001 0.000 0.187
Milk -0.005 -0.001 -0.016 -0.015 -0.057 -0.018 -0.014 -0.006 -0.001 0.989
Other dairy -0.005 -0.001 -0.015 -0.014 -0.055 -0.017 -0.014 -0.006 -0.001 0.953
Beef -0.003 0.000 -0.009 -0.009 -0.034 -0.011 -0.008 -0.003 -0.073 1.097
Lamb -0.002 0.000 -0.007 -0.007 -0.027 -0.009 -0.007 -0.003 -0.059 0.878
Pork -0.002 0.000 -0.007 -0.007 -0.025 -0.008 -0.006 -0.003 -0.054 0.817
Bacon & Ham -0.002 0.000 -0.008 -0.008 -0.029 -0.009 -0.007 -0.003 -0.063 0.943
Poultry -0.003 0.000 -0.009 -0.009 -0.034 -0.011 -0.009 -0.004 -0.075 1.123
Sausages -0.002 0.000 -0.006 -0.006 -0.022 -0.007 -0.005 -0.002 -0.048 0.724
Other meat -0.003 -0.001 -0.011 -0.010 -0.039 -0.012 -0.010 -0.004 -0.086 1.285
White fish -0.001 0.000 -0.008 -0.007 -0.028 -0.009 -0.007 -0.003 -0.003 0.627
Salmon -0.001 0.000 -0.007 -0.007 -0.025 -0.008 -0.006 -0.003 -0.003 0.568
Blue fish -0.001 0.000 -0.006 -0.006 -0.023 -0.007 -0.006 -0.002 -0.003 0.514
Other fish -0.001 0.000 -0.008 -0.008 -0.030 -0.010 -0.008 -0.003 -0.004 0.690
Fresh fruit 0.000 0.000 0.005 0.004 0.017 0.005 0.004 0.002 0.015 0.921
Tinned & dried fruit 0.000 0.000 0.003 0.003 0.011 0.003 0.003 0.001 0.010 0.586
Nuts 0.000 0.000 0.003 0.003 0.012 0.004 0.003 0.001 0.010 0.627
Juice 0.000 0.000 0.003 0.003 0.013 0.004 0.003 0.001 0.011 0.684
Fresh veg. -1.020 -0.052 -0.003 -0.003 -0.010 -0.003 -0.003 -0.001 -0.010 1.023
Canned veg. 0.309 -0.629 -0.001 -0.001 -0.003 -0.001 -0.001 0.000 -0.003 0.305
Potatoes -0.001 0.000 -0.288 -0.129 -0.234 -0.021 -0.166 -0.014 -0.009 0.990
Sweets -0.001 0.000 -0.139 -0.482 -0.232 -0.067 0.009 -0.008 -0.010 1.069
Starches -0.001 0.000 -0.085 -0.075 -0.734 -0.035 -0.047 -0.040 -0.011 1.183
Non-alc. Drink -0.001 0.000 -0.023 -0.054 -0.056 -0.784 -0.004 0.023 -0.009 1.044
Other Starches -0.001 0.000 -0.172 0.016 -0.108 0.000 -0.595 -0.009 -0.009 1.011
Fats -0.001 0.000 -0.010 0.014 -0.232 0.118 0.006 -0.508 -0.006 0.710
Alcohol -0.002 0.000 0.004 0.004 0.016 0.005 0.004 0.002 -0.668 0.787
99

Table G.22: Uncompensated Elasticities - Level 2: 2005/06
Cheese Eggs Cream Milk Other dairy Beef Lamb Pork Bacon & Ham Poultry Sausages
Cheese -0.574 0.001 -0.046 -0.197 -0.088 -0.001 0.000 0.000 -0.001 -0.001 0.000
Eggs 0.092 -0.628 -0.024 -0.077 0.087 -0.001 0.000 0.000 -0.001 -0.001 0.000
Cream -0.330 -0.055 -0.443 0.760 -0.169 0.000 0.000 0.000 0.000 0.000 0.000
Milk -0.162 -0.053 0.026 -0.684 -0.159 -0.001 0.000 0.000 -0.001 -0.002 0.000
Other dairy -0.105 -0.006 -0.033 -0.219 -0.611 -0.001 0.000 0.000 -0.001 -0.002 0.000
Beef -0.001 0.000 0.000 -0.002 -0.001 -0.661 -0.064 -0.028 0.010 -0.037 -0.023
Lamb -0.001 0.000 0.000 -0.002 -0.001 -0.134 -0.608 -0.007 -0.084 0.079 -0.025
Pork -0.001 0.000 0.000 -0.002 -0.001 -0.048 -0.005 -0.760 0.020 0.064 -0.033
Bacon & Ham -0.001 0.000 0.000 -0.002 -0.001 0.024 -0.035 0.001 -0.671 0.007 -0.011
Poultry -0.001 0.000 0.000 -0.002 -0.001 -0.029 0.011 0.003 -0.015 -0.965 -0.015
Sausages -0.001 0.000 0.000 -0.001 -0.001 -0.029 -0.024 -0.032 -0.007 -0.002 -0.579
Other meat -0.001 0.000 0.000 -0.002 -0.001 -0.071 -0.019 -0.012 -0.093 -0.008 -0.014
White fish -0.001 0.000 0.000 -0.003 -0.001 -0.002 -0.001 -0.001 -0.003 -0.004 -0.001
Salmon -0.001 0.000 0.000 -0.003 -0.001 -0.002 -0.001 -0.001 -0.003 -0.004 -0.001
Blue fish -0.001 0.000 0.000 -0.002 -0.001 -0.002 -0.001 -0.001 -0.003 -0.003 -0.001
Other fish -0.002 -0.001 0.000 -0.003 -0.002 -0.003 -0.001 -0.001 -0.003 -0.004 -0.001
Fresh fruit -0.002 -0.001 0.000 -0.005 -0.002 0.001 0.001 0.001 0.002 0.002 0.000
Tinned & dried fruit -0.002 -0.001 0.000 -0.003 -0.002 0.001 0.000 0.000 0.001 0.001 0.000
Nuts -0.002 -0.001 0.000 -0.003 -0.002 0.001 0.000 0.000 0.001 0.001 0.000
Juice -0.002 -0.001 0.000 -0.004 -0.002 0.001 0.000 0.000 0.001 0.002 0.000
Fresh veg. -0.001 0.000 0.000 -0.002 -0.001 -0.001 0.000 0.000 -0.001 -0.001 0.000
Canned veg. 0.000 0.000 0.000 -0.001 0.000 0.000 0.000 0.000 0.000 0.000 0.000
Potatoes -0.003 -0.001 0.000 -0.006 -0.003 -0.001 -0.001 0.000 -0.002 -0.002 0.000
Sweets -0.003 -0.001 0.000 -0.006 -0.003 -0.001 -0.001 0.000 -0.002 -0.002 0.000
Starches -0.004 -0.001 0.000 -0.007 -0.004 -0.001 -0.001 -0.001 -0.002 -0.002 -0.001
Non-alc. Drink -0.003 -0.001 0.000 -0.006 -0.003 -0.001 -0.001 0.000 -0.002 -0.002 0.000
Other Starches -0.003 -0.001 0.000 -0.006 -0.003 -0.001 -0.001 0.000 -0.002 -0.002 0.000
Fats -0.002 -0.001 0.000 -0.004 -0.002 -0.001 0.000 0.000 -0.001 -0.001 0.000
Alcohol 0.000 0.000 0.000 0.000 0.000 -0.002 -0.001 -0.001 -0.003 -0.004 -0.001
100

Table G.23: Uncompensated Elasticities - Level 2: 2005/06 (cont.)
Other meat White fish Salmon Blue fish Other fish Fresh fruit Tinned & dried fruit Nuts Juice
Cheese -0.003 0.000 0.000 0.000 -0.001 -0.004 0.000 0.000 -0.001
Eggs -0.002 0.000 0.000 0.000 -0.001 -0.002 0.000 0.000 0.000
Cream -0.001 0.000 0.000 0.000 0.000 -0.001 0.000 0.000 0.000
Milk -0.004 0.000 0.000 0.000 -0.001 -0.004 0.000 0.000 -0.001
Other dairy -0.003 0.000 0.000 0.000 -0.001 -0.004 0.000 0.000 -0.001
Beef -0.144 0.000 0.000 0.000 -0.001 0.000 0.000 0.000 0.000
Lamb -0.006 0.000 0.000 0.000 -0.001 0.000 0.000 0.000 0.000
Pork 0.055 0.000 0.000 0.000 -0.001 0.000 0.000 0.000 0.000
Bacon & Ham -0.144 0.000 0.000 0.000 -0.001 0.000 0.000 0.000 0.000
Poultry 0.038 0.000 0.000 0.000 -0.001 0.000 0.000 0.000 0.000
Sausages 0.059 0.000 0.000 0.000 -0.001 0.000 0.000 0.000 0.000
Other meat -0.889 0.000 0.000 0.000 -0.001 0.000 0.000 0.000 0.000
White fish -0.008 -0.650 0.009 -0.177 -0.096 0.005 0.000 0.000 0.001
Salmon -0.008 0.019 -0.703 -0.077 -0.122 0.004 0.000 0.000 0.001
Blue fish -0.007 -0.329 -0.088 -0.410 0.059 0.004 0.000 0.000 0.001
Other fish -0.009 -0.049 -0.041 -0.015 -0.928 0.005 0.001 0.001 0.001
Fresh fruit 0.005 0.000 0.000 0.000 0.001 -0.987 -0.018 -0.021 -0.049
Tinned & dried fruit 0.003 0.000 0.000 0.000 0.001 0.091 -0.779 -0.014 0.013
Nuts 0.003 0.000 0.000 0.000 0.001 0.050 -0.016 -0.673 -0.093
Juice 0.004 0.000 0.000 0.000 0.001 -0.035 -0.003 -0.052 -0.728
Fresh veg. -0.003 0.000 0.000 0.000 -0.001 -0.001 0.000 0.000 0.000
Canned veg. -0.001 0.000 0.000 0.000 0.000 0.000 0.000 0.000 0.000
Potatoes -0.004 0.000 0.000 0.000 -0.001 0.000 0.000 0.000 0.000
Sweets -0.004 0.000 0.000 0.000 -0.001 0.000 0.000 0.000 0.000
Starches -0.005 0.000 0.000 0.000 -0.001 0.000 0.000 0.000 0.000
Non-alc. Drink -0.004 0.000 0.000 0.000 -0.001 0.000 0.000 0.000 0.000
Other Starches -0.004 0.000 0.000 0.000 -0.001 0.000 0.000 0.000 0.000
Fats -0.003 0.000 0.000 0.000 0.000 0.000 0.000 0.000 0.000
Alcohol -0.008 0.000 0.000 0.000 -0.002 -0.007 -0.001 -0.001 -0.001
101

Table G.24: Uncompensated Elasticities - Level 2: 2005/06 (cont.)
Fresh veg. Canned veg. Potatoes Sweets Starches Non-alc. Drink Other Starches Fats Alcohol Expend.
Cheese -0.001 0.000 -0.016 -0.015 -0.061 -0.018 -0.015 -0.006 -0.003 0.872
Eggs -0.001 0.000 -0.010 -0.009 -0.037 -0.011 -0.009 -0.004 -0.002 0.530
Cream 0.000 0.000 -0.004 -0.004 -0.016 -0.005 -0.004 -0.002 -0.001 0.228
Milk -0.002 0.000 -0.018 -0.017 -0.070 -0.020 -0.017 -0.007 -0.004 0.995
Other dairy -0.002 0.000 -0.017 -0.016 -0.066 -0.019 -0.016 -0.007 -0.004 0.938
Beef -0.001 0.000 -0.005 -0.004 -0.018 -0.005 -0.004 -0.002 -0.077 1.090
Lamb -0.001 0.000 -0.004 -0.004 -0.015 -0.004 -0.004 -0.001 -0.064 0.904
Pork -0.001 0.000 -0.003 -0.003 -0.013 -0.004 -0.003 -0.001 -0.057 0.815
Bacon & Ham -0.001 0.000 -0.004 -0.004 -0.015 -0.005 -0.004 -0.002 -0.067 0.955
Poultry -0.001 0.000 -0.005 -0.004 -0.018 -0.005 -0.004 -0.002 -0.079 1.120
Sausages -0.001 0.000 -0.003 -0.003 -0.011 -0.003 -0.003 -0.001 -0.050 0.706
Other meat -0.002 0.000 -0.005 -0.005 -0.021 -0.006 -0.005 -0.002 -0.090 1.273
White fish -0.001 0.000 -0.003 -0.003 -0.013 -0.004 -0.003 -0.001 -0.009 0.645
Salmon -0.001 0.000 -0.003 -0.003 -0.013 -0.004 -0.003 -0.001 -0.009 0.623
Blue fish -0.001 0.000 -0.003 -0.003 -0.011 -0.003 -0.003 -0.001 -0.008 0.542
Other fish -0.001 0.000 -0.004 -0.004 -0.015 -0.004 -0.004 -0.001 -0.010 0.730
Fresh fruit 0.000 0.000 0.003 0.003 0.012 0.003 0.003 0.001 0.005 0.962
Tinned & dried fruit 0.000 0.000 0.002 0.002 0.008 0.002 0.002 0.001 0.003 0.617
Nuts 0.000 0.000 0.002 0.002 0.008 0.002 0.002 0.001 0.003 0.656
Juice 0.000 0.000 0.002 0.002 0.009 0.003 0.002 0.001 0.004 0.732
Fresh veg. -1.006 -0.064 -0.005 -0.005 -0.019 -0.006 -0.005 -0.002 -0.003 1.041
Canned veg. 0.217 -0.541 -0.001 -0.001 -0.006 -0.002 -0.001 -0.001 -0.001 0.315
Potatoes -0.002 0.000 -0.369 -0.102 -0.223 0.019 -0.142 -0.064 -0.005 0.998
Sweets -0.002 0.000 -0.110 -0.541 -0.201 -0.057 -0.029 0.053 -0.005 1.003
Starches -0.002 0.000 -0.079 -0.068 -0.762 -0.036 -0.053 -0.047 -0.005 1.182
Non-alc. Drink -0.002 0.000 0.013 -0.049 -0.054 -0.761 -0.026 -0.029 -0.005 1.026
Other Starches -0.002 0.000 -0.145 -0.030 -0.135 -0.030 -0.630 0.066 -0.005 1.024
Fats -0.001 0.000 -0.136 0.167 -0.267 -0.044 0.214 -0.518 -0.003 0.662
Alcohol -0.005 -0.001 0.006 0.006 0.023 0.007 0.006 0.002 -0.567 0.809
102

Table G.25: Uncompensated Elasticities - Level 2: 2006
Cheese Eggs Cream Milk Other dairy Beef Lamb Pork Bacon & Ham Poultry Sausages
Cheese -0.558 0.010 -0.033 -0.225 -0.083 -0.001 0.000 0.000 -0.001 -0.001 0.000
Eggs 0.119 -0.584 -0.027 -0.064 0.013 0.000 0.000 0.000 -0.001 -0.001 0.000
Cream -0.185 -0.062 -0.427 0.680 -0.225 0.000 0.000 0.000 0.000 0.000 0.000
Milk -0.184 -0.049 0.022 -0.694 -0.129 -0.001 0.000 0.000 -0.001 -0.001 0.000
Other dairy -0.101 -0.028 -0.038 -0.164 -0.638 -0.001 0.000 0.000 -0.001 -0.001 0.000
Beef -0.001 0.000 0.000 -0.002 -0.001 -0.608 -0.100 -0.022 0.002 -0.011 -0.029
Lamb -0.001 0.000 0.000 -0.001 -0.001 -0.237 -0.475 0.017 -0.063 0.056 -0.014
Pork -0.001 0.000 0.000 -0.001 -0.001 -0.028 0.022 -0.766 0.042 0.055 -0.020
Bacon & Ham -0.001 0.000 0.000 -0.002 -0.001 0.021 -0.026 0.008 -0.724 -0.003 -0.003
Poultry -0.001 0.000 0.000 -0.002 -0.001 -0.007 0.005 0.001 -0.021 -0.943 -0.007
Sausages -0.001 0.000 0.000 -0.001 -0.001 -0.046 -0.009 -0.019 0.024 0.038 -0.606
Other meat -0.001 0.000 0.000 -0.002 -0.001 -0.097 -0.026 -0.021 -0.083 -0.026 -0.020
White fish -0.002 -0.001 0.000 -0.004 -0.002 0.000 0.000 0.000 0.000 0.000 0.000
Salmon -0.002 -0.001 0.000 -0.004 -0.002 0.000 0.000 0.000 0.000 0.000 0.000
Blue fish -0.002 -0.001 0.000 -0.003 -0.002 0.000 0.000 0.000 0.000 0.000 0.000
Other fish -0.002 -0.001 0.000 -0.004 -0.002 0.000 0.000 0.000 0.000 0.000 0.000
Fresh fruit -0.003 -0.001 0.000 -0.007 -0.004 0.004 0.002 0.002 0.005 0.006 0.001
Tinned & dried fruit -0.002 -0.001 0.000 -0.004 -0.002 0.003 0.001 0.001 0.003 0.004 0.001
Nuts -0.002 -0.001 0.000 -0.004 -0.002 0.003 0.001 0.001 0.003 0.004 0.001
Juice -0.003 -0.001 0.000 -0.005 -0.003 0.003 0.001 0.001 0.004 0.005 0.001
Fresh veg. -0.003 -0.001 0.000 -0.006 -0.003 -0.001 0.000 0.000 -0.001 -0.001 0.000
Canned veg. -0.001 0.000 0.000 -0.002 -0.001 0.000 0.000 0.000 0.000 0.000 0.000
Potatoes -0.003 -0.001 0.000 -0.005 -0.003 -0.003 -0.001 -0.001 -0.003 -0.004 -0.001
Sweets -0.003 -0.001 0.000 -0.005 -0.003 -0.003 -0.001 -0.001 -0.003 -0.004 -0.001
Starches -0.003 -0.001 0.000 -0.006 -0.003 -0.003 -0.001 -0.001 -0.004 -0.005 -0.001
Non-alc. Drink -0.003 -0.001 0.000 -0.005 -0.003 -0.003 -0.001 -0.001 -0.003 -0.004 -0.001
Other Starches -0.003 -0.001 0.000 -0.005 -0.003 -0.003 -0.001 -0.001 -0.003 -0.004 -0.001
Fats -0.002 -0.001 0.000 -0.003 -0.002 -0.002 -0.001 -0.001 -0.002 -0.003 -0.001
Alcohol 0.000 0.000 0.000 0.001 0.000 0.000 0.000 0.000 0.000 -0.001 0.000
103
Table G.26: Uncompensated Elasticities - Level 2: 2006 (cont.)
Other meat White fish Salmon Blue fish Other fish Fresh fruit Tinned & dried fruit Nuts Juice
Cheese -0.002 0.000 0.000 0.000 -0.001 -0.006 -0.001 -0.001 -0.001
Eggs -0.001 0.000 0.000 0.000 -0.001 -0.003 0.000 0.000 -0.001
Cream -0.001 0.000 0.000 0.000 0.000 -0.001 0.000 0.000 0.000
Milk -0.003 0.000 0.000 0.000 -0.001 -0.006 -0.001 -0.001 -0.002
Other dairy -0.003 0.000 0.000 0.000 -0.001 -0.006 -0.001 -0.001 -0.001
Beef -0.209 0.000 0.000 0.000 -0.001 0.002 0.000 0.000 0.001
Lamb -0.063 0.000 0.000 0.000 0.000 0.002 0.000 0.000 0.000
Pork -0.013 0.000 0.000 0.000 0.000 0.002 0.000 0.000 0.000
Bacon & Ham -0.110 0.000 0.000 0.000 -0.001 0.002 0.000 0.000 0.000
Poultry 0.003 0.000 0.000 0.000 -0.001 0.002 0.000 0.000 0.001
Sausages 0.004 0.000 0.000 0.000 0.000 0.001 0.000 0.000 0.000
Other meat -0.836 0.000 0.000 0.000 -0.001 0.002 0.000 0.000 0.001
White fish 0.000 -0.763 -0.019 -0.065 -0.074 0.006 0.001 0.001 0.001
Salmon 0.000 -0.023 -0.677 -0.136 -0.063 0.005 0.001 0.001 0.001
Blue fish 0.000 -0.102 -0.172 -0.488 -0.018 0.005 0.001 0.000 0.001
Other fish -0.001 -0.043 -0.030 -0.026 -0.934 0.006 0.001 0.001 0.001
Fresh fruit 0.013 0.000 0.000 0.000 0.001 -0.977 -0.031 -0.026 -0.047
Tinned & dried fruit 0.008 0.000 0.000 0.000 0.001 -0.018 -0.745 0.019 0.064
Nuts 0.009 0.000 0.000 0.000 0.001 0.019 0.018 -0.664 -0.068
Juice 0.010 0.000 0.000 0.000 0.001 -0.008 0.015 -0.038 -0.799
Fresh veg. -0.002 0.000 0.000 0.000 0.000 -0.002 0.000 0.000 0.000
Canned veg. -0.001 0.000 0.000 0.000 0.000 -0.001 0.000 0.000 0.000
Potatoes -0.008 0.000 0.000 0.000 -0.001 -0.001 0.000 0.000 0.000
Sweets -0.008 0.000 0.000 0.000 -0.001 -0.001 0.000 0.000 0.000
Starches -0.010 0.000 0.000 0.000 -0.001 -0.001 0.000 0.000 0.000
Non-alc. Drink -0.008 0.000 0.000 0.000 -0.001 -0.001 0.000 0.000 0.000
Other Starches -0.008 0.000 0.000 0.000 -0.001 -0.001 0.000 0.000 0.000
Fats -0.005 0.000 0.000 0.000 -0.001 -0.001 0.000 0.000 0.000
Alcohol -0.001 -0.001 0.000 0.000 -0.002 -0.006 -0.001 -0.001 -0.001
104
Table G.27: Uncompensated Elasticities - Level 2: 2006 (cont.)
Fresh veg. Canned veg. Potatoes Sweets Starches Non-alc. Drink Other Starches Fats Alcohol Expend.
Cheese -0.004 -0.001 -0.015 -0.013 -0.055 -0.017 -0.014 -0.006 -0.003 0.871
Eggs -0.003 0.000 -0.009 -0.008 -0.034 -0.010 -0.008 -0.003 -0.002 0.532
Cream -0.001 0.000 -0.004 -0.003 -0.014 -0.004 -0.003 -0.001 -0.001 0.216
Milk -0.005 -0.001 -0.017 -0.015 -0.064 -0.020 -0.016 -0.007 -0.003 1.013
Other dairy -0.005 -0.001 -0.016 -0.014 -0.060 -0.018 -0.015 -0.006 -0.003 0.949
Beef -0.001 0.000 -0.009 -0.008 -0.035 -0.011 -0.009 -0.004 -0.080 1.128
Lamb -0.001 0.000 -0.007 -0.007 -0.028 -0.009 -0.007 -0.003 -0.064 0.900
Pork -0.001 0.000 -0.007 -0.006 -0.025 -0.008 -0.006 -0.003 -0.058 0.817
Bacon & Ham -0.001 0.000 -0.008 -0.007 -0.030 -0.009 -0.007 -0.003 -0.068 0.966
Poultry -0.001 0.000 -0.009 -0.008 -0.035 -0.011 -0.009 -0.004 -0.079 1.119
Sausages -0.001 0.000 -0.006 -0.005 -0.022 -0.007 -0.005 -0.002 -0.050 0.709
Other meat -0.001 0.000 -0.011 -0.010 -0.040 -0.012 -0.010 -0.004 -0.091 1.280
White fish 0.000 0.000 -0.004 -0.004 -0.017 -0.005 -0.004 -0.002 -0.001 0.649
Salmon 0.000 0.000 -0.004 -0.004 -0.016 -0.005 -0.004 -0.002 -0.001 0.633
Blue fish 0.000 0.000 -0.004 -0.003 -0.014 -0.004 -0.004 -0.001 0.000 0.549
Other fish 0.000 0.000 -0.005 -0.004 -0.019 -0.006 -0.005 -0.002 -0.001 0.727
Fresh fruit -0.001 0.000 0.000 0.000 -0.001 0.000 0.000 0.000 0.015 0.949
Tinned & dried fruit -0.001 0.000 0.000 0.000 0.000 0.000 0.000 0.000 0.010 0.597
Nuts -0.001 0.000 0.000 0.000 0.000 0.000 0.000 0.000 0.010 0.610
Juice -0.001 0.000 0.000 0.000 -0.001 0.000 0.000 0.000 0.012 0.729
Fresh veg. -1.007 -0.065 -0.003 -0.003 -0.011 -0.003 -0.003 -0.001 -0.002 1.050
Canned veg. 0.213 -0.539 -0.001 -0.001 -0.003 -0.001 -0.001 0.000 -0.001 0.320
Potatoes -0.001 0.000 -0.356 -0.107 -0.199 0.000 -0.140 -0.059 -0.009 1.003
Sweets -0.001 0.000 -0.118 -0.505 -0.252 -0.056 -0.005 0.067 -0.009 1.012
Starches -0.001 0.000 -0.072 -0.078 -0.754 -0.038 -0.028 -0.048 -0.011 1.184
Non-alc. Drink -0.001 0.000 -0.001 -0.044 -0.053 -0.725 -0.055 0.012 -0.009 1.007
Other Starches -0.001 0.000 -0.141 -0.005 -0.038 -0.064 -0.649 0.021 -0.009 1.021
Fats -0.001 0.000 -0.124 0.197 -0.285 0.078 0.092 -0.535 -0.006 0.671
Alcohol -0.004 -0.001 0.004 0.004 0.016 0.005 0.004 0.002 -0.639 0.791
105
Table G.28: Uncompensated Elasticities - Level 2: 2007
Cheese Eggs Cream Milk Other dairy Beef Lamb Pork Bacon & Ham Poultry Sausages
Cheese -0.616 0.000 -0.053 -0.173 -0.076 0.000 0.000 0.000 0.000 0.000 0.000
Eggs 0.091 -0.546 -0.029 -0.099 0.025 0.000 0.000 0.000 0.000 0.000 0.000
Cream -0.402 -0.077 -0.515 0.831 -0.043 0.000 0.000 0.000 0.000 0.000 0.000
Milk -0.148 -0.063 0.030 -0.717 -0.139 0.000 0.000 0.000 0.000 0.000 0.000
Other dairy -0.094 -0.027 -0.022 -0.189 -0.644 0.000 0.000 0.000 0.000 0.000 0.000
Beef -0.001 0.000 0.000 -0.001 -0.001 -0.574 -0.074 -0.049 0.015 -0.038 -0.034
Lamb 0.000 0.000 0.000 -0.001 0.000 -0.173 -0.605 0.065 -0.041 0.036 -0.012
Pork 0.000 0.000 0.000 -0.001 0.000 -0.109 0.073 -0.679 -0.026 0.053 -0.055
Bacon & Ham -0.001 0.000 0.000 -0.001 0.000 0.025 -0.018 -0.015 -0.719 -0.012 0.007
Poultry -0.001 0.000 0.000 -0.001 -0.001 -0.033 0.000 0.001 -0.027 -0.890 -0.005
Sausages 0.000 0.000 0.000 -0.001 0.000 -0.061 -0.004 -0.055 0.058 0.048 -0.572
Other meat -0.001 0.000 0.000 -0.001 -0.001 -0.084 -0.023 -0.015 -0.076 -0.028 -0.022
White fish 0.001 0.000 0.000 0.001 0.001 -0.003 -0.001 -0.001 -0.003 -0.004 -0.001
Salmon 0.001 0.000 0.000 0.001 0.001 -0.003 -0.001 -0.001 -0.003 -0.004 -0.001
Blue fish 0.001 0.000 0.000 0.001 0.001 -0.003 -0.001 -0.001 -0.003 -0.004 -0.001
Other fish 0.001 0.000 0.000 0.002 0.001 -0.003 -0.001 -0.001 -0.004 -0.005 -0.001
Fresh fruit -0.003 -0.001 0.000 -0.005 -0.003 0.005 0.002 0.002 0.005 0.007 0.002
Tinned & dried fruit -0.001 -0.001 0.000 -0.003 -0.001 0.003 0.001 0.001 0.003 0.004 0.001
Nuts -0.002 -0.001 0.000 -0.003 -0.002 0.003 0.001 0.001 0.003 0.004 0.001
Juice -0.002 -0.001 0.000 -0.004 -0.002 0.004 0.001 0.001 0.004 0.005 0.001
Fresh veg. -0.004 -0.002 0.000 -0.007 -0.004 -0.002 -0.001 -0.001 -0.002 -0.002 -0.001
Canned veg. -0.003 -0.001 0.000 -0.005 -0.003 -0.001 0.000 0.000 -0.001 -0.002 0.000
Potatoes -0.003 -0.001 0.000 -0.005 -0.003 -0.003 -0.001 -0.001 -0.004 -0.004 -0.001
Sweets -0.003 -0.001 0.000 -0.005 -0.003 -0.003 -0.001 -0.001 -0.004 -0.005 -0.001
Starches -0.003 -0.001 0.000 -0.006 -0.003 -0.004 -0.001 -0.001 -0.004 -0.005 -0.001
Non-alc. Drink -0.003 -0.001 0.000 -0.005 -0.003 -0.003 -0.001 -0.001 -0.004 -0.005 -0.001
Other Starches -0.003 -0.001 0.000 -0.005 -0.003 -0.003 -0.001 -0.001 -0.004 -0.005 -0.001
Fats -0.002 -0.001 0.000 -0.003 -0.002 -0.002 -0.001 -0.001 -0.002 -0.003 -0.001
Alcohol 0.000 0.000 0.000 -0.001 0.000 -0.003 -0.001 -0.001 -0.003 -0.004 -0.001
106

Table G.29: Uncompensated Elasticities - Level 2: 2007 (cont.)
Other meat White fish Salmon Blue fish Other fish Fresh fruit Tinned & dried fruit Nuts Juice
Cheese 0.000 0.000 0.000 0.000 0.000 -0.004 0.000 0.000 -0.001
Eggs 0.000 0.000 0.000 0.000 0.000 -0.002 0.000 0.000 -0.001
Cream 0.000 0.000 0.000 0.000 0.000 -0.001 0.000 0.000 0.000
Milk 0.000 0.000 0.000 0.000 0.000 -0.005 0.000 0.000 -0.001
Other dairy 0.000 0.000 0.000 0.000 0.000 -0.004 0.000 0.000 -0.001
Beef -0.156 0.000 0.000 0.000 -0.001 0.002 0.000 0.000 0.001
Lamb -0.039 0.000 0.000 0.000 -0.001 0.002 0.000 0.000 0.000
Pork 0.037 0.000 0.000 0.000 -0.001 0.002 0.000 0.000 0.000
Bacon & Ham -0.094 0.000 0.000 0.000 -0.001 0.002 0.000 0.000 0.000
Poultry 0.003 0.000 0.000 0.000 -0.001 0.002 0.000 0.000 0.001
Sausages 0.003 0.000 0.000 0.000 -0.001 0.001 0.000 0.000 0.000
Other meat -0.850 0.000 0.000 0.000 -0.002 0.003 0.000 0.000 0.001
White fish -0.009 -0.746 -0.078 -0.099 0.013 -0.003 0.000 0.000 -0.001
Salmon -0.009 -0.105 -0.645 -0.061 -0.061 -0.003 0.000 0.000 -0.001
Blue fish -0.008 -0.147 -0.062 -0.543 -0.045 -0.002 0.000 0.000 -0.001
Other fish -0.010 -0.017 -0.031 -0.032 -0.952 -0.003 0.000 0.000 -0.001
Fresh fruit 0.014 0.000 0.000 0.000 -0.001 -1.007 -0.014 -0.022 -0.034
Tinned & dried fruit 0.008 0.000 0.000 0.000 -0.001 0.165 -0.791 -0.033 0.038
Nuts 0.009 0.000 0.000 0.000 -0.001 0.069 -0.034 -0.729 0.026
Juice 0.011 0.000 0.000 0.000 -0.001 0.021 -0.002 -0.003 -0.874
Fresh veg. -0.005 0.000 0.000 0.000 0.000 -0.003 0.000 0.000 -0.001
Canned veg. -0.004 0.000 0.000 0.000 0.000 -0.002 0.000 0.000 -0.001
Potatoes -0.009 0.000 0.000 0.000 -0.001 -0.001 0.000 0.000 0.000
Sweets -0.010 0.000 0.000 0.000 -0.001 -0.001 0.000 0.000 0.000
Starches -0.011 0.000 0.000 0.000 -0.001 -0.001 0.000 0.000 0.000
Non-alc. Drink -0.010 0.000 0.000 0.000 -0.001 -0.001 0.000 0.000 0.000
Other Starches -0.010 0.000 0.000 0.000 -0.001 -0.001 0.000 0.000 0.000
Fats -0.006 0.000 0.000 0.000 -0.001 -0.001 0.000 0.000 0.000
Alcohol -0.009 -0.001 0.000 0.000 -0.002 -0.004 0.000 0.000 -0.001
107
Table G.30: Uncompensated Elasticities - Level 2: 2007 (cont.)
Fresh veg. Canned veg. Potatoes Sweets Starches Non-alc. Drink Other Starches Fats Alcohol Expend.
Cheese -0.007 -0.001 -0.015 -0.013 -0.055 -0.016 -0.013 -0.006 0.000 0.897
Eggs -0.004 -0.001 -0.009 -0.008 -0.033 -0.010 -0.008 -0.003 0.000 0.546
Cream -0.001 0.000 -0.003 -0.003 -0.012 -0.004 -0.003 -0.001 0.000 0.202
Milk -0.008 -0.001 -0.017 -0.015 -0.062 -0.018 -0.015 -0.006 0.000 1.014
Other dairy -0.007 -0.001 -0.016 -0.014 -0.058 -0.017 -0.014 -0.006 0.000 0.954
Beef -0.002 0.000 -0.010 -0.009 -0.038 -0.011 -0.009 -0.004 -0.066 1.078
Lamb -0.002 0.000 -0.009 -0.008 -0.032 -0.009 -0.008 -0.003 -0.056 0.911
Pork -0.002 0.000 -0.008 -0.007 -0.030 -0.009 -0.007 -0.003 -0.052 0.837
Bacon & Ham -0.002 0.000 -0.009 -0.008 -0.035 -0.010 -0.008 -0.004 -0.060 0.979
Poultry -0.002 0.000 -0.011 -0.010 -0.040 -0.011 -0.010 -0.004 -0.069 1.126
Sausages -0.001 0.000 -0.007 -0.006 -0.025 -0.007 -0.006 -0.003 -0.043 0.691
Other meat -0.003 0.000 -0.012 -0.011 -0.046 -0.013 -0.011 -0.005 -0.080 1.300
White fish 0.001 0.000 -0.004 -0.004 -0.015 -0.004 -0.004 -0.002 -0.010 0.627
Salmon 0.001 0.000 -0.004 -0.003 -0.014 -0.004 -0.003 -0.001 -0.010 0.600
Blue fish 0.001 0.000 -0.004 -0.003 -0.013 -0.004 -0.003 -0.001 -0.009 0.549
Other fish 0.001 0.000 -0.005 -0.004 -0.017 -0.005 -0.004 -0.002 -0.012 0.711
Fresh fruit -0.003 0.000 0.000 0.000 -0.001 0.000 0.000 0.000 0.016 0.952
Tinned & dried fruit -0.002 0.000 0.000 0.000 -0.001 0.000 0.000 0.000 0.009 0.549
Nuts -0.002 0.000 0.000 0.000 -0.001 0.000 0.000 0.000 0.010 0.591
Juice -0.002 0.000 0.000 0.000 -0.001 0.000 0.000 0.000 0.013 0.758
Fresh veg. -0.954 -0.048 -0.002 -0.002 -0.008 -0.002 -0.002 -0.001 -0.006 0.975
Canned veg. -0.099 -0.641 -0.002 -0.001 -0.006 -0.002 -0.001 -0.001 -0.004 0.720
Potatoes -0.001 0.000 -0.374 -0.086 -0.275 -0.024 -0.104 -0.008 -0.011 1.004
Sweets -0.001 0.000 -0.096 -0.517 -0.165 -0.087 -0.066 0.036 -0.011 1.032
Starches -0.001 0.000 -0.093 -0.055 -0.754 -0.029 -0.036 -0.054 -0.012 1.177
Non-alc. Drink -0.001 0.000 -0.026 -0.074 -0.042 -0.764 -0.018 0.019 -0.011 1.041
Other Starches -0.001 0.000 -0.110 -0.062 -0.079 -0.019 -0.640 0.012 -0.011 1.034
Fats -0.001 0.000 0.015 0.124 -0.338 0.100 0.069 -0.554 -0.007 0.673
Alcohol -0.003 -0.001 0.011 0.010 0.040 0.011 0.010 0.004 -0.711 0.767
108
Table G.31: Uncompensated Elasticities - Level 2: 2008
Cheese Eggs Cream Milk Other dairy Beef Lamb Pork Bacon & Ham Poultry Sausages
Cheese -0.609 -0.014 -0.057 -0.100 -0.113 0.001 0.000 0.000 0.001 0.001 0.000
Eggs 0.035 -0.646 -0.031 0.013 0.039 0.001 0.000 0.000 0.001 0.001 0.000
Cream -0.426 -0.085 -0.533 0.985 -0.120 0.000 0.000 0.000 0.000 0.000 0.000
Milk -0.102 -0.039 0.038 -0.807 -0.133 0.001 0.000 0.000 0.001 0.002 0.000
Other dairy -0.133 -0.021 -0.030 -0.178 -0.616 0.001 0.000 0.000 0.001 0.002 0.000
Beef 0.000 0.000 0.000 0.000 0.000 -0.702 -0.083 -0.019 -0.004 -0.003 0.010
Lamb 0.000 0.000 0.000 0.000 0.000 -0.195 -0.546 0.116 -0.114 0.035 -0.007
Pork 0.000 0.000 0.000 0.000 0.000 -0.021 0.116 -0.801 -0.051 0.064 -0.032
Bacon & Ham 0.000 0.000 0.000 0.000 0.000 0.012 -0.042 -0.023 -0.708 0.001 -0.017
Poultry 0.000 0.000 0.000 0.000 0.000 0.000 0.000 0.006 -0.015 -0.899 0.001
Sausages 0.000 0.000 0.000 0.000 0.000 0.076 -0.001 -0.031 -0.024 0.068 -0.643
Other meat 0.000 0.000 0.000 0.000 0.000 -0.079 -0.025 -0.021 -0.067 -0.053 -0.029
White fish -0.003 -0.001 0.000 -0.005 -0.003 -0.004 -0.001 -0.002 -0.005 -0.006 -0.001
Salmon -0.003 -0.001 0.000 -0.005 -0.003 -0.004 -0.001 -0.001 -0.004 -0.006 -0.001
Blue fish -0.002 -0.001 0.000 -0.005 -0.002 -0.003 -0.001 -0.001 -0.004 -0.005 -0.001
Other fish -0.003 -0.001 0.000 -0.006 -0.003 -0.004 -0.002 -0.002 -0.005 -0.007 -0.001
Fresh fruit -0.006 -0.002 -0.001 -0.011 -0.006 0.005 0.002 0.002 0.006 0.008 0.002
Tinned & dried fruit -0.003 -0.001 0.000 -0.006 -0.003 0.003 0.001 0.001 0.004 0.005 0.001
Nuts -0.004 -0.002 0.000 -0.007 -0.004 0.003 0.001 0.001 0.004 0.005 0.001
Juice -0.005 -0.002 0.000 -0.009 -0.005 0.004 0.002 0.002 0.005 0.006 0.001
Fresh veg. -0.005 -0.002 0.000 -0.010 -0.005 0.000 0.000 0.000 0.000 0.000 0.000
Canned veg. -0.002 -0.001 0.000 -0.003 -0.002 0.000 0.000 0.000 0.000 0.000 0.000
Potatoes -0.003 -0.001 0.000 -0.005 -0.003 -0.004 -0.002 -0.002 -0.005 -0.006 -0.001
Sweets -0.003 -0.001 0.000 -0.005 -0.003 -0.004 -0.002 -0.002 -0.005 -0.006 -0.001
Starches -0.003 -0.001 0.000 -0.006 -0.003 -0.005 -0.002 -0.002 -0.006 -0.007 -0.002
Non-alc. Drink -0.003 -0.001 0.000 -0.005 -0.003 -0.004 -0.002 -0.002 -0.005 -0.006 -0.001
Other Starches -0.003 -0.001 0.000 -0.005 -0.003 -0.004 -0.002 -0.002 -0.005 -0.006 -0.001
Fats -0.002 -0.001 0.000 -0.003 -0.002 -0.003 -0.001 -0.001 -0.003 -0.004 -0.001
Alcohol 0.001 0.001 0.000 0.002 0.001 0.001 0.001 0.001 0.002 0.002 0.001
109

Table G.32: Uncompensated Elasticities - Level 2: 2008 (cont.)
Other meat White fish Salmon Blue fish Other fish Fresh fruit Tinned & dried fruit Nuts Juice
Cheese 0.003 0.000 0.000 0.000 -0.001 -0.008 -0.001 -0.001 -0.002
Eggs 0.002 0.000 0.000 0.000 -0.001 -0.005 -0.001 0.000 -0.001
Cream 0.001 0.000 0.000 0.000 0.000 -0.002 0.000 0.000 0.000
Milk 0.004 0.000 0.000 0.000 -0.002 -0.009 -0.001 -0.001 -0.002
Other dairy 0.003 0.000 0.000 0.000 -0.002 -0.009 -0.001 -0.001 -0.002
Beef -0.168 0.000 0.000 0.000 -0.002 0.003 0.000 0.000 0.001
Lamb -0.069 0.000 0.000 0.000 -0.001 0.002 0.000 0.000 0.001
Pork -0.022 0.000 0.000 0.000 -0.001 0.002 0.000 0.000 0.000
Bacon & Ham -0.075 0.000 0.000 0.000 -0.001 0.003 0.000 0.000 0.001
Poultry -0.048 0.000 0.000 0.000 -0.001 0.003 0.000 0.000 0.001
Sausages -0.071 0.000 0.000 0.000 -0.001 0.002 0.000 0.000 0.000
Other meat -0.814 0.000 0.000 0.000 -0.002 0.003 0.000 0.000 0.001
White fish -0.012 -0.675 -0.076 -0.087 -0.084 0.002 0.000 0.000 0.001
Salmon -0.011 -0.100 -0.723 -0.048 0.002 0.002 0.000 0.000 0.001
Blue fish -0.010 -0.155 -0.058 -0.631 0.066 0.002 0.000 0.000 0.000
Other fish -0.013 -0.046 -0.021 -0.013 -0.953 0.003 0.000 0.000 0.001
Fresh fruit 0.016 0.000 0.000 0.000 0.000 -0.974 -0.026 -0.026 -0.050
Tinned & dried fruit 0.009 0.000 0.000 0.000 0.000 0.045 -0.798 0.077 0.046
Nuts 0.010 0.000 0.000 0.000 0.000 0.000 0.071 -0.708 -0.058
Juice 0.013 0.000 0.000 0.000 0.000 -0.042 0.004 -0.034 -0.773
Fresh veg. -0.001 0.000 0.000 0.000 -0.001 0.000 0.000 0.000 0.000
Canned veg. 0.000 0.000 0.000 0.000 0.000 0.000 0.000 0.000 0.000
Potatoes -0.012 0.000 0.000 0.000 -0.001 0.000 0.000 0.000 0.000
Sweets -0.013 0.000 0.000 0.000 -0.001 0.000 0.000 0.000 0.000
Starches -0.015 0.000 0.000 0.000 -0.001 0.000 0.000 0.000 0.000
Non-alc. Drink -0.013 0.000 0.000 0.000 -0.001 0.000 0.000 0.000 0.000
Other Starches -0.013 0.000 0.000 0.000 -0.001 0.000 0.000 0.000 0.000
Fats -0.009 0.000 0.000 0.000 0.000 0.000 0.000 0.000 0.000
Alcohol 0.005 0.000 0.000 0.000 -0.001 -0.006 -0.001 -0.001 -0.001
110
Table G.33: Uncompensated Elasticities - Level 2: 2008 (cont.)
Fresh veg. Canned veg. Potatoes Sweets Starches Non-alc. Drink Other Starches Fats Alcohol Expend.
Cheese -0.007 -0.001 -0.013 -0.012 -0.049 -0.014 -0.011 -0.006 0.003 0.895
Eggs -0.004 -0.001 -0.008 -0.008 -0.032 -0.009 -0.008 -0.004 0.002 0.591
Cream -0.001 0.000 -0.002 -0.002 -0.010 -0.003 -0.002 -0.001 0.001 0.179
Milk -0.008 -0.001 -0.015 -0.014 -0.057 -0.016 -0.013 -0.006 0.004 1.044
Other dairy -0.007 -0.001 -0.014 -0.013 -0.054 -0.015 -0.013 -0.006 0.004 0.979
Beef -0.001 0.000 -0.015 -0.014 -0.057 -0.016 -0.013 -0.006 -0.069 1.132
Lamb -0.001 0.000 -0.012 -0.011 -0.046 -0.013 -0.011 -0.005 -0.056 0.911
Pork -0.001 0.000 -0.011 -0.011 -0.044 -0.012 -0.010 -0.005 -0.053 0.873
Bacon & Ham -0.001 0.000 -0.013 -0.012 -0.050 -0.014 -0.012 -0.006 -0.061 0.996
Poultry -0.001 0.000 -0.014 -0.014 -0.056 -0.016 -0.013 -0.006 -0.068 1.117
Sausages -0.001 0.000 -0.009 -0.009 -0.037 -0.010 -0.009 -0.004 -0.045 0.731
Other meat -0.001 0.000 -0.016 -0.015 -0.064 -0.018 -0.015 -0.007 -0.078 1.270
White fish -0.001 0.000 -0.001 -0.001 -0.003 -0.001 -0.001 0.000 -0.013 0.648
Salmon -0.001 0.000 -0.001 -0.001 -0.003 -0.001 -0.001 0.000 -0.012 0.610
Blue fish -0.001 0.000 -0.001 -0.001 -0.003 -0.001 -0.001 0.000 -0.011 0.546
Other fish -0.001 0.000 -0.001 -0.001 -0.003 -0.001 -0.001 0.000 -0.014 0.726
Fresh fruit 0.000 0.000 0.003 0.003 0.011 0.003 0.003 0.001 0.017 0.958
Tinned & dried fruit 0.000 0.000 0.002 0.002 0.007 0.002 0.002 0.001 0.010 0.560
Nuts 0.000 0.000 0.002 0.002 0.007 0.002 0.002 0.001 0.011 0.618
Juice 0.000 0.000 0.002 0.002 0.009 0.002 0.002 0.001 0.013 0.752
Fresh veg. -1.003 -0.070 0.000 0.000 -0.002 0.000 0.000 0.000 -0.001 1.048
Canned veg. 0.173 -0.550 0.000 0.000 -0.001 0.000 0.000 0.000 0.000 0.368
Potatoes -0.001 0.000 -0.396 -0.094 -0.200 -0.016 -0.106 -0.023 -0.013 0.980
Sweets -0.001 0.000 -0.103 -0.511 -0.157 -0.119 -0.055 0.077 -0.014 1.018
Starches -0.001 0.000 -0.072 -0.054 -0.752 -0.019 -0.051 -0.064 -0.016 1.187
Non-alc. Drink -0.001 0.000 -0.018 -0.101 -0.001 -0.798 -0.003 0.049 -0.014 1.021
Other Starches -0.001 0.000 -0.111 -0.052 -0.128 -0.001 -0.574 0.008 -0.014 1.005
Fats 0.000 0.000 -0.024 0.200 -0.386 0.164 0.048 -0.588 -0.009 0.688
Alcohol -0.004 -0.001 0.005 0.005 0.021 0.006 0.005 0.002 -0.748 0.718
111
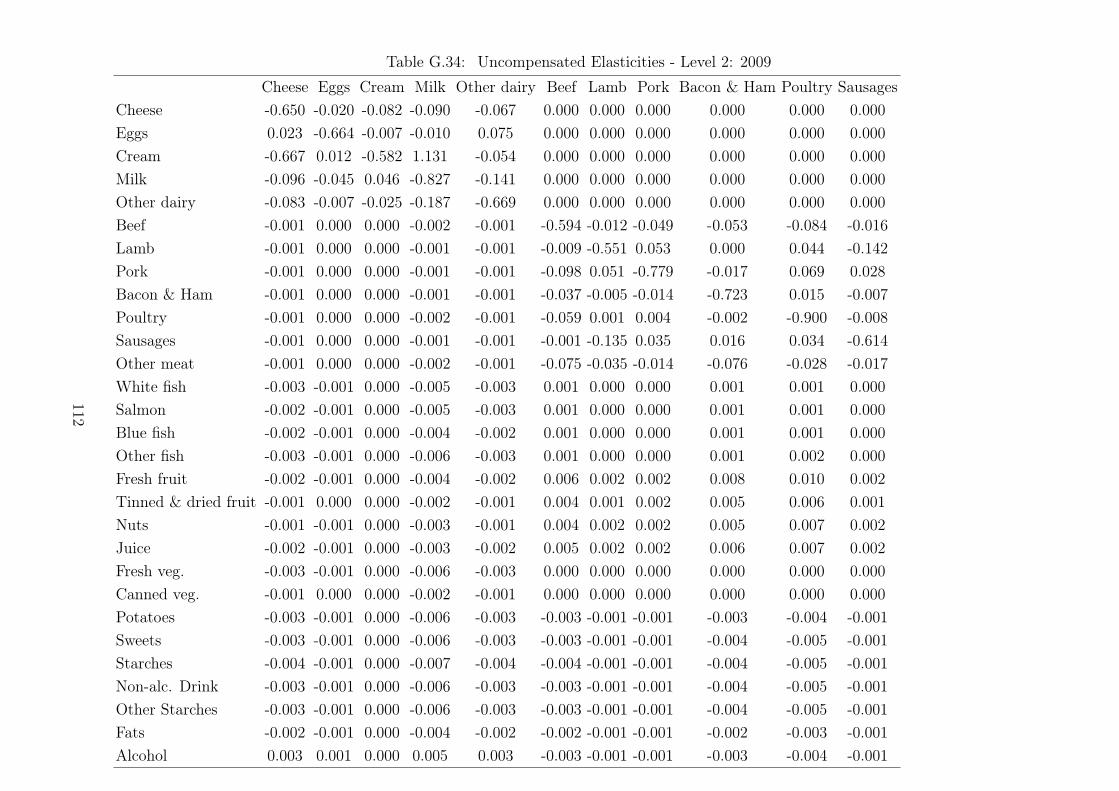
Table G.34: Uncompensated Elasticities - Level 2: 2009
Cheese Eggs Cream Milk Other dairy Beef Lamb Pork Bacon & Ham Poultry Sausages
Cheese -0.650 -0.020 -0.082 -0.090 -0.067 0.000 0.000 0.000 0.000 0.000 0.000
Eggs 0.023 -0.664 -0.007 -0.010 0.075 0.000 0.000 0.000 0.000 0.000 0.000
Cream -0.667 0.012 -0.582 1.131 -0.054 0.000 0.000 0.000 0.000 0.000 0.000
Milk -0.096 -0.045 0.046 -0.827 -0.141 0.000 0.000 0.000 0.000 0.000 0.000
Other dairy -0.083 -0.007 -0.025 -0.187 -0.669 0.000 0.000 0.000 0.000 0.000 0.000
Beef -0.001 0.000 0.000 -0.002 -0.001 -0.594 -0.012 -0.049 -0.053 -0.084 -0.016
Lamb -0.001 0.000 0.000 -0.001 -0.001 -0.009 -0.551 0.053 0.000 0.044 -0.142
Pork -0.001 0.000 0.000 -0.001 -0.001 -0.098 0.051 -0.779 -0.017 0.069 0.028
Bacon & Ham -0.001 0.000 0.000 -0.001 -0.001 -0.037 -0.005 -0.014 -0.723 0.015 -0.007
Poultry -0.001 0.000 0.000 -0.002 -0.001 -0.059 0.001 0.004 -0.002 -0.900 -0.008
Sausages -0.001 0.000 0.000 -0.001 -0.001 -0.001 -0.135 0.035 0.016 0.034 -0.614
Other meat -0.001 0.000 0.000 -0.002 -0.001 -0.075 -0.035 -0.014 -0.076 -0.028 -0.017
White fish -0.003 -0.001 0.000 -0.005 -0.003 0.001 0.000 0.000 0.001 0.001 0.000
Salmon -0.002 -0.001 0.000 -0.005 -0.003 0.001 0.000 0.000 0.001 0.001 0.000
Blue fish -0.002 -0.001 0.000 -0.004 -0.002 0.001 0.000 0.000 0.001 0.001 0.000
Other fish -0.003 -0.001 0.000 -0.006 -0.003 0.001 0.000 0.000 0.001 0.002 0.000
Fresh fruit -0.002 -0.001 0.000 -0.004 -0.002 0.006 0.002 0.002 0.008 0.010 0.002
Tinned & dried fruit -0.001 0.000 0.000 -0.002 -0.001 0.004 0.001 0.002 0.005 0.006 0.001
Nuts -0.001 -0.001 0.000 -0.003 -0.001 0.004 0.002 0.002 0.005 0.007 0.002
Juice -0.002 -0.001 0.000 -0.003 -0.002 0.005 0.002 0.002 0.006 0.007 0.002
Fresh veg. -0.003 -0.001 0.000 -0.006 -0.003 0.000 0.000 0.000 0.000 0.000 0.000
Canned veg. -0.001 0.000 0.000 -0.002 -0.001 0.000 0.000 0.000 0.000 0.000 0.000
Potatoes -0.003 -0.001 0.000 -0.006 -0.003 -0.003 -0.001 -0.001 -0.003 -0.004 -0.001
Sweets -0.003 -0.001 0.000 -0.006 -0.003 -0.003 -0.001 -0.001 -0.004 -0.005 -0.001
Starches -0.004 -0.001 0.000 -0.007 -0.004 -0.004 -0.001 -0.001 -0.004 -0.005 -0.001
Non-alc. Drink -0.003 -0.001 0.000 -0.006 -0.003 -0.003 -0.001 -0.001 -0.004 -0.005 -0.001
Other Starches -0.003 -0.001 0.000 -0.006 -0.003 -0.003 -0.001 -0.001 -0.004 -0.005 -0.001
Fats -0.002 -0.001 0.000 -0.004 -0.002 -0.002 -0.001 -0.001 -0.002 -0.003 -0.001
Alcohol 0.003 0.001 0.000 0.005 0.003 -0.003 -0.001 -0.001 -0.003 -0.004 -0.001
112

Table G.35: Uncompensated Elasticities - Level 2: 2009 (cont.)
Other meat White fish Salmon Blue fish Other fish Fresh fruit Tinned & dried fruit Nuts Juice
Cheese -0.001 0.000 0.000 0.000 -0.001 -0.002 0.000 0.000 -0.001
Eggs 0.000 0.000 0.000 0.000 -0.001 -0.002 0.000 0.000 0.000
Cream 0.000 0.000 0.000 0.000 0.000 0.000 0.000 0.000 0.000
Milk -0.001 0.000 0.000 0.000 -0.002 -0.003 0.000 0.000 -0.001
Other dairy -0.001 0.000 0.000 0.000 -0.001 -0.003 0.000 0.000 -0.001
Beef -0.152 0.000 0.000 0.000 0.000 0.003 0.000 0.000 0.001
Lamb -0.160 0.000 0.000 0.000 0.000 0.003 0.000 0.000 0.001
Pork 0.040 0.000 0.000 0.000 0.000 0.002 0.000 0.000 0.001
Bacon & Ham -0.106 0.000 0.000 0.000 0.000 0.003 0.000 0.000 0.001
Poultry -0.005 0.000 0.000 0.000 0.000 0.003 0.000 0.000 0.001
Sausages 0.036 0.000 0.000 0.000 0.000 0.002 0.000 0.000 0.000
Other meat -0.843 0.000 0.000 0.000 0.000 0.004 0.000 0.000 0.001
White fish 0.003 -0.743 -0.040 -0.100 -0.043 0.002 0.000 0.000 0.001
Salmon 0.003 -0.039 -0.719 0.000 -0.097 0.002 0.000 0.000 0.000
Blue fish 0.002 -0.169 0.012 -0.586 -0.016 0.002 0.000 0.000 0.000
Other fish 0.003 -0.031 -0.045 -0.026 -0.941 0.003 0.000 0.000 0.001
Fresh fruit 0.020 0.000 0.000 0.000 0.001 -0.982 -0.019 -0.028 -0.047
Tinned & dried fruit 0.012 0.000 0.000 0.000 0.000 0.108 -0.793 0.004 0.033
Nuts 0.014 0.000 0.000 0.000 0.000 -0.018 -0.003 -0.767 0.042
Juice 0.015 0.000 0.000 0.000 0.000 -0.017 0.004 0.017 -0.808
Fresh veg. 0.000 0.000 0.000 0.000 -0.001 -0.001 0.000 0.000 0.000
Canned veg. 0.000 0.000 0.000 0.000 0.000 0.000 0.000 0.000 0.000
Potatoes -0.009 0.000 0.000 0.000 -0.001 -0.002 0.000 0.000 0.000
Sweets -0.010 0.000 0.000 0.000 -0.001 -0.002 0.000 0.000 0.000
Starches -0.011 0.000 0.000 0.000 -0.001 -0.002 0.000 0.000 0.000
Non-alc. Drink -0.009 0.000 0.000 0.000 -0.001 -0.002 0.000 0.000 0.000
Other Starches -0.010 0.000 0.000 0.000 -0.001 -0.002 0.000 0.000 0.000
Fats -0.006 0.000 0.000 0.000 0.000 -0.001 0.000 0.000 0.000
Alcohol -0.009 0.000 0.000 0.000 -0.002 -0.007 -0.001 -0.001 -0.001
113
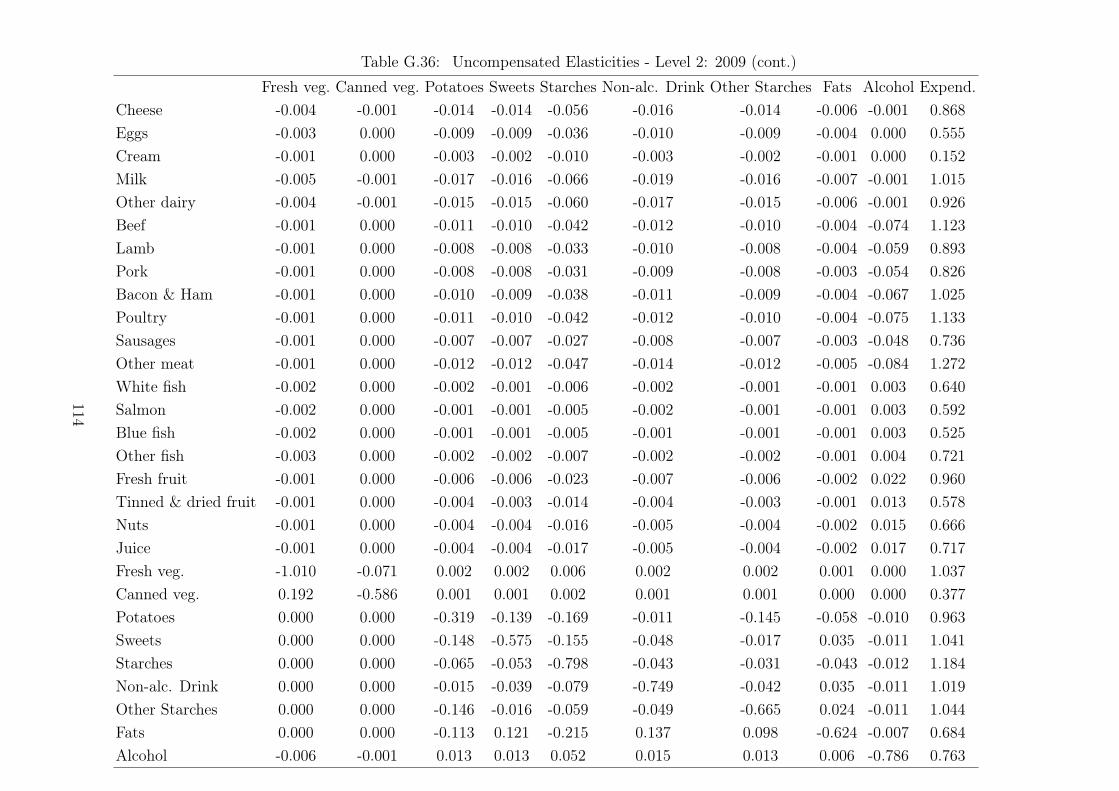
Table G.36: Uncompensated Elasticities - Level 2: 2009 (cont.)
Fresh veg. Canned veg. Potatoes Sweets Starches Non-alc. Drink Other Starches Fats Alcohol Expend.
Cheese -0.004 -0.001 -0.014 -0.014 -0.056 -0.016 -0.014 -0.006 -0.001 0.868
Eggs -0.003 0.000 -0.009 -0.009 -0.036 -0.010 -0.009 -0.004 0.000 0.555
Cream -0.001 0.000 -0.003 -0.002 -0.010 -0.003 -0.002 -0.001 0.000 0.152
Milk -0.005 -0.001 -0.017 -0.016 -0.066 -0.019 -0.016 -0.007 -0.001 1.015
Other dairy -0.004 -0.001 -0.015 -0.015 -0.060 -0.017 -0.015 -0.006 -0.001 0.926
Beef -0.001 0.000 -0.011 -0.010 -0.042 -0.012 -0.010 -0.004 -0.074 1.123
Lamb -0.001 0.000 -0.008 -0.008 -0.033 -0.010 -0.008 -0.004 -0.059 0.893
Pork -0.001 0.000 -0.008 -0.008 -0.031 -0.009 -0.008 -0.003 -0.054 0.826
Bacon & Ham -0.001 0.000 -0.010 -0.009 -0.038 -0.011 -0.009 -0.004 -0.067 1.025
Poultry -0.001 0.000 -0.011 -0.010 -0.042 -0.012 -0.010 -0.004 -0.075 1.133
Sausages -0.001 0.000 -0.007 -0.007 -0.027 -0.008 -0.007 -0.003 -0.048 0.736
Other meat -0.001 0.000 -0.012 -0.012 -0.047 -0.014 -0.012 -0.005 -0.084 1.272
White fish -0.002 0.000 -0.002 -0.001 -0.006 -0.002 -0.001 -0.001 0.003 0.640
Salmon -0.002 0.000 -0.001 -0.001 -0.005 -0.002 -0.001 -0.001 0.003 0.592
Blue fish -0.002 0.000 -0.001 -0.001 -0.005 -0.001 -0.001 -0.001 0.003 0.525
Other fish -0.003 0.000 -0.002 -0.002 -0.007 -0.002 -0.002 -0.001 0.004 0.721
Fresh fruit -0.001 0.000 -0.006 -0.006 -0.023 -0.007 -0.006 -0.002 0.022 0.960
Tinned & dried fruit -0.001 0.000 -0.004 -0.003 -0.014 -0.004 -0.003 -0.001 0.013 0.578
Nuts -0.001 0.000 -0.004 -0.004 -0.016 -0.005 -0.004 -0.002 0.015 0.666
Juice -0.001 0.000 -0.004 -0.004 -0.017 -0.005 -0.004 -0.002 0.017 0.717
Fresh veg. -1.010 -0.071 0.002 0.002 0.006 0.002 0.002 0.001 0.000 1.037
Canned veg. 0.192 -0.586 0.001 0.001 0.002 0.001 0.001 0.000 0.000 0.377
Potatoes 0.000 0.000 -0.319 -0.139 -0.169 -0.011 -0.145 -0.058 -0.010 0.963
Sweets 0.000 0.000 -0.148 -0.575 -0.155 -0.048 -0.017 0.035 -0.011 1.041
Starches 0.000 0.000 -0.065 -0.053 -0.798 -0.043 -0.031 -0.043 -0.012 1.184
Non-alc. Drink 0.000 0.000 -0.015 -0.039 -0.079 -0.749 -0.042 0.035 -0.011 1.019
Other Starches 0.000 0.000 -0.146 -0.016 -0.059 -0.049 -0.665 0.024 -0.011 1.044
Fats 0.000 0.000 -0.113 0.121 -0.215 0.137 0.098 -0.624 -0.007 0.684
Alcohol -0.006 -0.001 0.013 0.013 0.052 0.015 0.013 0.006 -0.786 0.763
114
G.3 Level 3
Table G.37: Uncompensated Elasticities - Level 3: Beef 2001/02
Joints Cheap Steak Exp. Steak Mince Other & veal Expend.
Joints -0.676 0.083 0.327 0.202 0.065 1.026
Cheap Steak 0.179 -0.799 0.293 0.194 0.133 0.845
Exp. Steak 0.262 0.108 -0.515 0.189 -0.045 1.054
Mince 0.221 0.098 0.257 -0.739 0.164 0.894
Other & veal 1.424 1.340 -1.215 3.284 -4.833 2.642
Table G.38: Uncompensated Elasticities - Level 3: Beef 2002/03
Joints Cheap Steak Exp. Steak Mince Other & veal Expend.
Joints -0.913 -0.040 -0.071 -0.034 0.026 1.030
Cheap Steak -0.030 -0.853 -0.040 -0.039 0.114 0.849
Exp. Steak -0.060 -0.043 -0.897 -0.066 0.021 1.046
Mince 0.000 -0.027 -0.037 -0.962 0.127 0.899
Other & veal 0.104 1.398 -0.091 3.076 -8.184 3.697
Table G.39: Uncompensated Elasticities - Level 3: Beef 2003/04
Joints Cheap Steak Exp. Steak Mince Other & veal Expend.
Joints -0.966 -0.022 -0.060 -0.028 0.050 1.02646
Cheap Steak -0.002 -0.781 0.016 -0.134 0.044 0.85745
Exp. Steak -0.049 -0.017 -0.919 -0.080 0.022 1.043056
Mince 0.006 -0.071 -0.059 -0.935 0.171 0.887748
Other & veal 0.874 0.303 -0.044 4.447 -9.400 3.819459
Table G.40: Uncompensated Elasticities - Level 3: Beef 2004/05
Joints Cheap Steak Exp. Steak Mince Other & veal Expend.
Joints -0.959 -0.068 -0.017 -0.022 0.044 1.022
Cheap Steak -0.088 -0.841 0.016 -0.102 0.152 0.862
Exp. Steak -0.020 -0.020 -0.929 -0.068 -0.023 1.059
Mince 0.011 -0.058 -0.038 -0.944 0.144 0.884
Other & veal 0.550 1.546 -1.366 2.721 -6.165 2.714
115
Table G.41: Uncompensated Elasticities - Level 3: Beef 2005/06
Joints Cheap Steak Exp. Steak Mince Other & veal Expend.
Joints -1.022 -0.029 -0.010 -0.011 0.047 1.025
Cheap Steak -0.018 -0.865 -0.037 -0.092 0.103 0.910
Exp. Steak -0.012 -0.038 -0.941 -0.061 0.008 1.043
Mince 0.017 -0.055 -0.034 -0.960 0.120 0.912
Other & veal 0.787 1.398 -0.261 2.794 -7.430 2.712
Table G.42: Uncompensated Elasticities - Level 3: Beef 2006
Joints Cheap Steak Exp. Steak Mince Other & veal Expend.
Joints -0.970 -0.026 -0.041 -0.049 0.056 1.030
Cheap Steak -0.002 -0.922 -0.015 -0.079 0.161 0.858
Exp. Steak -0.037 -0.033 -0.893 -0.065 -0.006 1.034
Mince -0.020 -0.052 -0.041 -0.968 0.165 0.916
Other & veal 1.871 4.107 -1.940 7.694 -17.683 5.951
Table G.43: Uncompensated Elasticities - Level 3: Beef 2007
Joints Cheap Steak Exp. Steak Mince Other & veal Expend.
Joints -0.869 -0.101 -0.031 -0.091 0.073 1.020
Cheap Steak -0.128 -0.861 -0.065 -0.049 0.249 0.855
Exp. Steak -0.024 -0.051 -0.883 -0.055 -0.018 1.032
Mince -0.048 -0.032 -0.026 -0.965 0.148 0.924
Other & veal 3.387 9.931 -4.958 11.579 -29.809 9.870
Table G.44: Uncompensated Elasticities - Level 3: Beef 2008
Joints Cheap Steak Exp. Steak Mince Other & veal Expend.
Joints -0.918 -0.095 -0.093 -0.046 0.144 1.008
Cheap Steak -0.116 -0.867 0.029 -0.018 0.129 0.842
Exp. Steak -0.070 -0.014 -0.904 -0.070 0.024 1.033
Mince -0.019 -0.023 -0.045 -0.965 0.101 0.952
Other & veal 7.480 4.032 -0.004 6.850 -26.297 7.940
Table G.45: Uncompensated Elasticities - Level 3: Beef 2009
Joints Cheap Steak Exp. Steak Mince Other & veal Expend.
Joints -0.919 -0.032 -0.070 -0.044 0.061 1.004
Cheap Steak -0.014 -0.917 -0.029 -0.045 0.136 0.868
Exp. Steak -0.054 -0.042 -0.913 -0.085 0.062 1.032
Mince -0.019 -0.037 -0.058 -0.970 0.127 0.956
Other & veal 1.539 3.558 2.260 6.503 -19.745 5.885
116

Table G.46: Uncompensated Elasticities - Level 3: Lamb 2001/02
Mutton Joints Chops Other Expend.
Mutton -5.618 -0.074 0.462 2.649 2.581
Joints 0.013 -0.994 -0.018 -0.024 1.022
Chops 0.027 -0.005 -0.989 -0.017 0.985
Other 0.237 -0.003 0.005 -1.061 0.822
Table G.47: Uncompensated Elasticities - Level 3: Lamb 2002/03
Mutton Joints Chops Other Expend.
Mutton -5.166 1.199 0.438 1.412 2.116
Joints 0.046 -0.997 -0.028 -0.052 1.031
Chops 0.030 -0.015 -1.004 0.001 0.988
Other 0.183 -0.104 0.083 -0.934 0.771
Table G.48: Uncompensated Elasticities - Level 3: Lamb 2003/04
Mutton Joints Chops Other Expend.
Mutton -6.266 1.750 -0.366 3.283 1.599
Joints 0.041 -0.993 -0.026 -0.061 1.039
Chops -0.003 -0.011 -0.966 -0.018 0.998
Other 0.289 -0.139 0.019 -0.963 0.794
Table G.49: Uncompensated Elasticities - Level 3: Lamb 2004/05
Mutton Joints Chops Other Expend.
Mutton -2.278 -0.082 0.049 0.945 1.366
Joints 0.003 -0.971 -0.039 -0.028 1.035
Chops 0.010 -0.025 -0.983 0.003 0.995
Other 0.206 -0.014 0.097 -1.079 0.789
Table G.50: Uncompensated Elasticities - Level 3: Lamb 2005/06
Mutton Joints Chops Other Expend.
Mutton -3.124 0.733 0.213 1.083 1.096
Joints 0.036 -0.999 -0.033 -0.033 1.029
Chops 0.013 -0.025 -0.987 -0.007 1.006
Other 0.217 -0.052 0.043 -1.045 0.837
117
Table G.51: Uncompensated Elasticities - Level 3: Lamb 2006
Mutton Joints Chops Other Expend.
Mutton -4.435 0.954 0.386 1.708 1.386
Joints 0.040 -0.999 -0.042 -0.019 1.020
Chops 0.020 -0.039 -0.988 -0.004 1.011
Other 0.232 0.010 0.059 -1.139 0.838
Table G.52: Uncompensated Elasticities - Level 3: Lamb 2007
Mutton Joints Chops Other Expend.
Mutton -26.524 5.119 2.854 12.909 5.642
Joints 0.045 -1.005 -0.024 -0.040 1.024
Chops 0.036 -0.011 -0.982 -0.028 0.984
Other 0.481 -0.107 -0.041 -1.092 0.759
Table G.53: Uncompensated Elasticities - Level 3: Lamb 2008
Mutton Joints Chops Other Expend.
Mutton -5.482 0.670 0.620 2.100 2.092
Joints 0.032 -0.985 -0.012 -0.042 1.007
Chops 0.031 -0.013 -0.997 -0.031 1.010
Other 0.221 -0.073 -0.030 -0.953 0.835
Table G.54: Uncompensated Elasticities - Level 3: Lamb 2009
Mutton Joints Chops Other Expend.
Mutton -44.649 6.599 3.398 20.763 13.889
Joints 0.040 -1.005 -0.027 -0.023 1.016
Chops 0.031 -0.015 -0.988 -0.009 0.981
Other 0.250 -0.009 0.022 -1.121 0.858
Table G.55: Uncompensated Elasticities - Level 3: Pork 2001/02
Joints Chops Fillets & Steak Other Expend.
Joints -0.991 -0.020 -0.041 0.030 1.022
Chops -0.009 -0.951 -0.043 0.006 0.998
Fillets & Steak -0.032 -0.052 -0.982 0.068 0.997
Other 0.179 0.066 0.380 -1.540 0.916
118

Table G.56: Uncompensated Elasticities - Level 3: Pork 2002/03
Joints Chops Fillets & Steak Other Expend.
Joints -1.013 -0.004 -0.062 0.058 1.021
Chops 0.002 -0.965 -0.039 0.001 1.001
Fillets & Steak -0.045 -0.039 -1.003 0.094 0.993
Other 0.443 0.041 0.803 -2.191 0.904
Table G.57: Uncompensated Elasticities - Level 3: Pork 2003/04
Joints Chops Fillets & Steak Other Expend.
Joints -0.962 0.001 -0.036 -0.051 1.048
Chops 0.016 -0.996 -0.018 0.006 0.993
Fillets & Steak -0.028 -0.027 -0.960 -0.008 1.023
Other -0.042 0.038 0.023 -0.914 0.895
Table G.58: Uncompensated Elasticities - Level 3: Pork 2004/05
Joints Chops Fillets & Steak Other Expend.
Joints -0.965 0.024 -0.060 -0.049 1.049
Chops 0.033 -0.995 -0.035 -0.016 1.013
Fillets & Steak -0.058 -0.044 -0.949 0.033 1.018
Other -0.038 0.018 0.102 -0.928 0.846
Table G.59: Uncompensated Elasticities - Level 3: Pork 2005/06
Joints Chops Fillets & Steak Other Expend.
Joints -0.940 -0.050 -0.026 -0.024 1.040
Chops -0.036 -0.915 -0.019 -0.040 1.010
Fillets & Steak -0.018 -0.022 -0.956 -0.016 1.012
Other -0.001 -0.043 0.005 -0.854 0.892
Table G.60: Uncompensated Elasticities - Level 3: Pork 2006
Joints Chops Fillets & Steak Other Expend.
Joints -0.946 -0.032 -0.043 -0.032 1.053
Chops -0.015 -0.925 -0.018 -0.037 0.995
Fillets & Steak -0.037 -0.027 -0.962 0.003 1.023
Other -0.010 -0.037 0.054 -0.856 0.849
119
Table G.61: Uncompensated Elasticities - Level 3: Pork 2007
Joints Chops Fillets & Steak Other Expend.
Joints -0.980 0.004 -0.049 -0.027 1.051
Chops 0.023 -0.938 -0.027 -0.057 0.999
Fillets & Steak -0.049 -0.030 -0.991 0.049 1.020
Other 0.007 -0.065 0.157 -0.926 0.828
Table G.62: Uncompensated Elasticities - Level 3: Pork 2008
Joints Chops Fillets & Steak Other Expend.
Joints -0.958 -0.010 -0.045 -0.038 1.050
Chops 0.001 -0.904 -0.026 -0.079 1.008
Fillets & Steak -0.038 -0.025 -1.022 0.070 1.015
Other -0.018 -0.102 0.188 -0.913 0.844
Table G.63: Uncompensated Elasticities - Level 3: Pork 2009
Joints Chops Fillets & Steak Other Expend.
Joints -0.959 -0.013 -0.039 -0.045 1.056
Chops 0.007 -0.920 -0.023 -0.049 0.986
Fillets & Steak -0.031 -0.031 -1.006 0.052 1.016
Other -0.034 -0.057 0.117 -0.923 0.897
Table G.64: Uncompensated Elasticities - Level 3: Poultry 2001/02
Chicken Turkey Other poultry Cooked & Takeaw. Expend.
Chicken -0.996 -0.006 0.003 -0.026 1.026
Turkey 0.009 -1.071 0.073 0.026 0.963
Other poultry -0.489 0.653 -3.356 1.116 2.077
Cooked & Takeaw. 0.009 0.018 0.061 -1.003 0.915
Table G.65: Uncompensated Elasticities - Level 3: Poultry 2002/03
Chicken Turkey Other poultry Cooked & Takeaw. Expend.
Chicken -0.994 -0.016 -0.007 -0.009 1.027
Turkey -0.034 -1.118 0.190 0.017 0.944
Other poultry -0.605 1.073 -2.633 0.516 1.649
Cooked & Takeaw. 0.042 0.009 0.048 -1.021 0.922
120
Table G.66: Uncompensated Elasticities - Level 3: Poultry 2003/04
Chicken Turkey Other poultry Cooked & Takeaw. Expend.
Chicken -1.001 -0.008 -0.005 -0.020 1.035
Turkey 0.022 -1.113 0.083 0.084 0.924
Other poultry -0.676 0.495 -3.003 1.426 1.759
Cooked & Takeaw. 0.032 0.036 0.094 -1.066 0.904
Table G.67: Uncompensated Elasticities - Level 3: Poultry 2004/05
Chicken Turkey Other poultry Cooked & Takeaw. Expend.
Chicken -1.000 -0.016 0.009 -0.017 1.025
Turkey -0.041 -1.024 0.062 0.045 0.957
Other poultry -0.144 0.321 -2.892 0.936 1.778
Cooked & Takeaw. 0.028 0.024 0.074 -1.041 0.914
Table G.68: Uncompensated Elasticities - Level 3: Poultry 2005/06
Chicken Turkey Other poultry Cooked & Takeaw. Expend.
Chicken -0.993 -0.011 -0.004 -0.022 1.031
Turkey -0.014 -1.047 0.059 0.066 0.936
Other poultry -0.364 0.187 -1.986 0.736 1.426
Cooked & Takeaw. 0.022 0.025 0.078 -1.036 0.911
Table G.69: Uncompensated Elasticities - Level 3: Poultry 2006
Chicken Turkey Other poultry Cooked & Takeaw. Expend.
Chicken -0.990 -0.009 -0.006 -0.023 1.028
Turkey -0.018 -1.027 0.047 0.046 0.953
Other poultry -0.649 0.229 -2.093 0.885 1.628
Cooked & Takeaw. 0.017 0.018 0.057 -1.010 0.917
Table G.70: Uncompensated Elasticities - Level 3: Poultry 2007
Chicken Turkey Other poultry Cooked & Takeaw. Expend.
Chicken -1.000 -0.011 0.009 -0.025 1.026
Turkey -0.033 -1.006 0.028 0.046 0.965
Other poultry -0.252 0.073 -3.056 1.232 2.003
Cooked & Takeaw. 0.027 0.026 0.095 -1.034 0.886
121

Table G.71: Uncompensated Elasticities - Level 3: Poultry 2008
Chicken Turkey Other poultry Cooked & Takeaw. Expend.
Chicken -0.998 -0.018 0.000 -0.018 1.035
Turkey -0.068 -0.942 0.050 0.041 0.920
Other poultry -0.428 0.169 -2.296 0.864 1.691
Cooked & Takeaw. 0.052 0.018 0.080 -1.029 0.880
Table G.72: Uncompensated Elasticities - Level 3: Poultry 2009
Chicken Turkey Other poultry Cooked & Takeaw. Expend.
Chicken -0.991 -0.030 0.005 -0.015 1.030
Turkey -0.178 -0.910 0.045 0.098 0.944
Other poultry -0.362 0.117 -2.277 0.704 1.817
Cooked & Takeaw. 0.065 0.039 0.075 -1.051 0.872
Table G.73: Uncompensated Elasticities - Level 3: Other Meat 2001/02
LiverCanned Processed
Ready meals Expend.& Frozen & Takeaw.
Liver -1.969 -0.542 1.356 -0.388 1.543
Canned & Frozen -0.075 -0.651 0.248 0.102 0.375
Processed & Takeaw. 0.022 -0.021 -0.983 -0.090 1.072
Ready meals -0.011 -0.003 -0.184 -0.706 0.903
Table G.74: Uncompensated Elasticities - Level 3: Other Meat 2002/03
LiverCanned Processed
Ready meals Expend.& Frozen & Takeaw.
Liver -2.180 -0.208 0.641 0.036 1.712
Canned & Frozen -0.021 -0.586 0.130 0.039 0.438
Processed & Takeaw. 0.014 -0.026 -0.969 -0.084 1.065
Ready meals 0.009 -0.018 -0.160 -0.742 0.911
Table G.75: Uncompensated Elasticities - Level 3: Other Meat 2003/04
LiverCanned Processed
Ready meals Expend.& Frozen & Takeaw.
Liver -1.938 0.223 0.488 -0.322 1.550
Canned & Frozen 0.049 -0.657 0.259 -0.035 0.384
Processed & Takeaw. 0.012 -0.019 -0.981 -0.083 1.072
Ready meals -0.008 -0.042 -0.149 -0.717 0.916
122
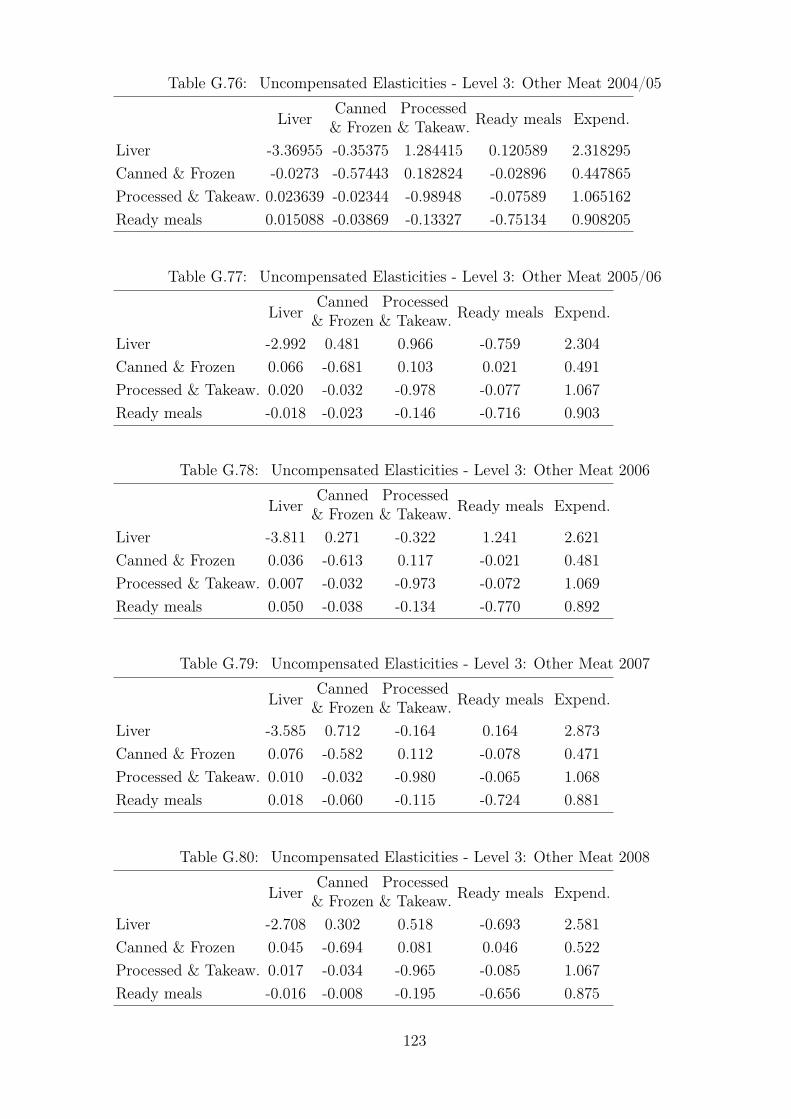
Table G.76: Uncompensated Elasticities - Level 3: Other Meat 2004/05
LiverCanned Processed
Ready meals Expend.& Frozen & Takeaw.
Liver -3.36955 -0.35375 1.284415 0.120589 2.318295
Canned & Frozen -0.0273 -0.57443 0.182824 -0.02896 0.447865
Processed & Takeaw. 0.023639 -0.02344 -0.98948 -0.07589 1.065162
Ready meals 0.015088 -0.03869 -0.13327 -0.75134 0.908205
Table G.77: Uncompensated Elasticities - Level 3: Other Meat 2005/06
LiverCanned Processed
Ready meals Expend.& Frozen & Takeaw.
Liver -2.992 0.481 0.966 -0.759 2.304
Canned & Frozen 0.066 -0.681 0.103 0.021 0.491
Processed & Takeaw. 0.020 -0.032 -0.978 -0.077 1.067
Ready meals -0.018 -0.023 -0.146 -0.716 0.903
Table G.78: Uncompensated Elasticities - Level 3: Other Meat 2006
LiverCanned Processed
Ready meals Expend.& Frozen & Takeaw.
Liver -3.811 0.271 -0.322 1.241 2.621
Canned & Frozen 0.036 -0.613 0.117 -0.021 0.481
Processed & Takeaw. 0.007 -0.032 -0.973 -0.072 1.069
Ready meals 0.050 -0.038 -0.134 -0.770 0.892
Table G.79: Uncompensated Elasticities - Level 3: Other Meat 2007
LiverCanned Processed
Ready meals Expend.& Frozen & Takeaw.
Liver -3.585 0.712 -0.164 0.164 2.873
Canned & Frozen 0.076 -0.582 0.112 -0.078 0.471
Processed & Takeaw. 0.010 -0.032 -0.980 -0.065 1.068
Ready meals 0.018 -0.060 -0.115 -0.724 0.881
Table G.80: Uncompensated Elasticities - Level 3: Other Meat 2008
LiverCanned Processed
Ready meals Expend.& Frozen & Takeaw.
Liver -2.708 0.302 0.518 -0.693 2.581
Canned & Frozen 0.045 -0.694 0.081 0.046 0.522
Processed & Takeaw. 0.017 -0.034 -0.965 -0.085 1.067
Ready meals -0.016 -0.008 -0.195 -0.656 0.875
123
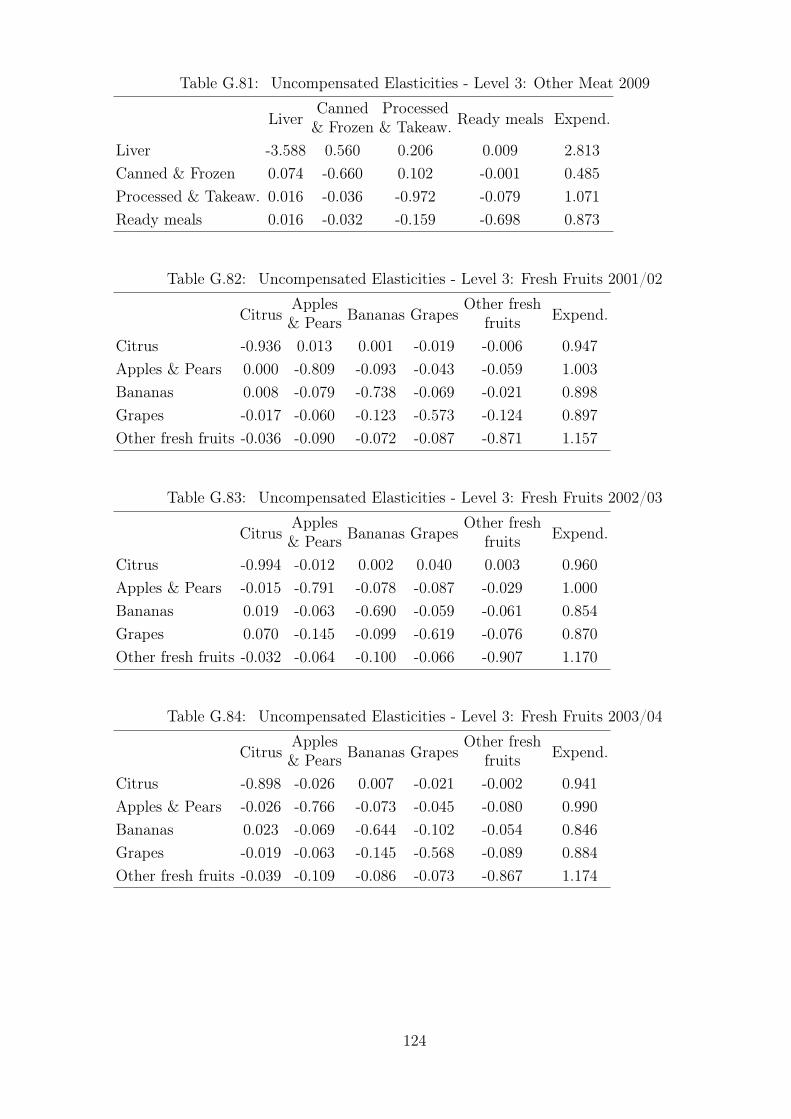
Table G.81: Uncompensated Elasticities - Level 3: Other Meat 2009
LiverCanned Processed
Ready meals Expend.& Frozen & Takeaw.
Liver -3.588 0.560 0.206 0.009 2.813
Canned & Frozen 0.074 -0.660 0.102 -0.001 0.485
Processed & Takeaw. 0.016 -0.036 -0.972 -0.079 1.071
Ready meals 0.016 -0.032 -0.159 -0.698 0.873
Table G.82: Uncompensated Elasticities - Level 3: Fresh Fruits 2001/02
CitrusApples
Bananas GrapesOther fresh
Expend.& Pears fruits
Citrus -0.936 0.013 0.001 -0.019 -0.006 0.947
Apples & Pears 0.000 -0.809 -0.093 -0.043 -0.059 1.003
Bananas 0.008 -0.079 -0.738 -0.069 -0.021 0.898
Grapes -0.017 -0.060 -0.123 -0.573 -0.124 0.897
Other fresh fruits -0.036 -0.090 -0.072 -0.087 -0.871 1.157
Table G.83: Uncompensated Elasticities - Level 3: Fresh Fruits 2002/03
CitrusApples
Bananas GrapesOther fresh
Expend.& Pears fruits
Citrus -0.994 -0.012 0.002 0.040 0.003 0.960
Apples & Pears -0.015 -0.791 -0.078 -0.087 -0.029 1.000
Bananas 0.019 -0.063 -0.690 -0.059 -0.061 0.854
Grapes 0.070 -0.145 -0.099 -0.619 -0.076 0.870
Other fresh fruits -0.032 -0.064 -0.100 -0.066 -0.907 1.170
Table G.84: Uncompensated Elasticities - Level 3: Fresh Fruits 2003/04
CitrusApples
Bananas GrapesOther fresh
Expend.& Pears fruits
Citrus -0.898 -0.026 0.007 -0.021 -0.002 0.941
Apples & Pears -0.026 -0.766 -0.073 -0.045 -0.080 0.990
Bananas 0.023 -0.069 -0.644 -0.102 -0.054 0.846
Grapes -0.019 -0.063 -0.145 -0.568 -0.089 0.884
Other fresh fruits -0.039 -0.109 -0.086 -0.073 -0.867 1.174
124
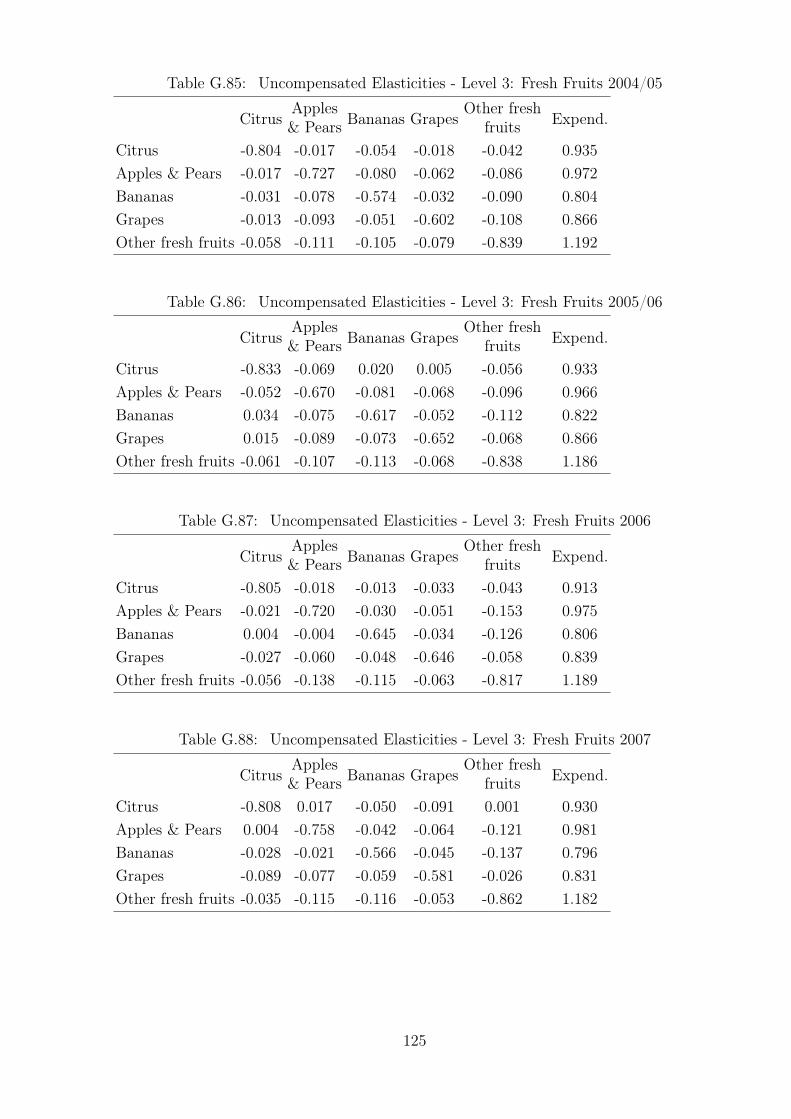
Table G.85: Uncompensated Elasticities - Level 3: Fresh Fruits 2004/05
CitrusApples
Bananas GrapesOther fresh
Expend.& Pears fruits
Citrus -0.804 -0.017 -0.054 -0.018 -0.042 0.935
Apples & Pears -0.017 -0.727 -0.080 -0.062 -0.086 0.972
Bananas -0.031 -0.078 -0.574 -0.032 -0.090 0.804
Grapes -0.013 -0.093 -0.051 -0.602 -0.108 0.866
Other fresh fruits -0.058 -0.111 -0.105 -0.079 -0.839 1.192
Table G.86: Uncompensated Elasticities - Level 3: Fresh Fruits 2005/06
CitrusApples
Bananas GrapesOther fresh
Expend.& Pears fruits
Citrus -0.833 -0.069 0.020 0.005 -0.056 0.933
Apples & Pears -0.052 -0.670 -0.081 -0.068 -0.096 0.966
Bananas 0.034 -0.075 -0.617 -0.052 -0.112 0.822
Grapes 0.015 -0.089 -0.073 -0.652 -0.068 0.866
Other fresh fruits -0.061 -0.107 -0.113 -0.068 -0.838 1.186
Table G.87: Uncompensated Elasticities - Level 3: Fresh Fruits 2006
CitrusApples
Bananas GrapesOther fresh
Expend.& Pears fruits
Citrus -0.805 -0.018 -0.013 -0.033 -0.043 0.913
Apples & Pears -0.021 -0.720 -0.030 -0.051 -0.153 0.975
Bananas 0.004 -0.004 -0.645 -0.034 -0.126 0.806
Grapes -0.027 -0.060 -0.048 -0.646 -0.058 0.839
Other fresh fruits -0.056 -0.138 -0.115 -0.063 -0.817 1.189
Table G.88: Uncompensated Elasticities - Level 3: Fresh Fruits 2007
CitrusApples
Bananas GrapesOther fresh
Expend.& Pears fruits
Citrus -0.808 0.017 -0.050 -0.091 0.001 0.930
Apples & Pears 0.004 -0.758 -0.042 -0.064 -0.121 0.981
Bananas -0.028 -0.021 -0.566 -0.045 -0.137 0.796
Grapes -0.089 -0.077 -0.059 -0.581 -0.026 0.831
Other fresh fruits -0.035 -0.115 -0.116 -0.053 -0.862 1.182
125
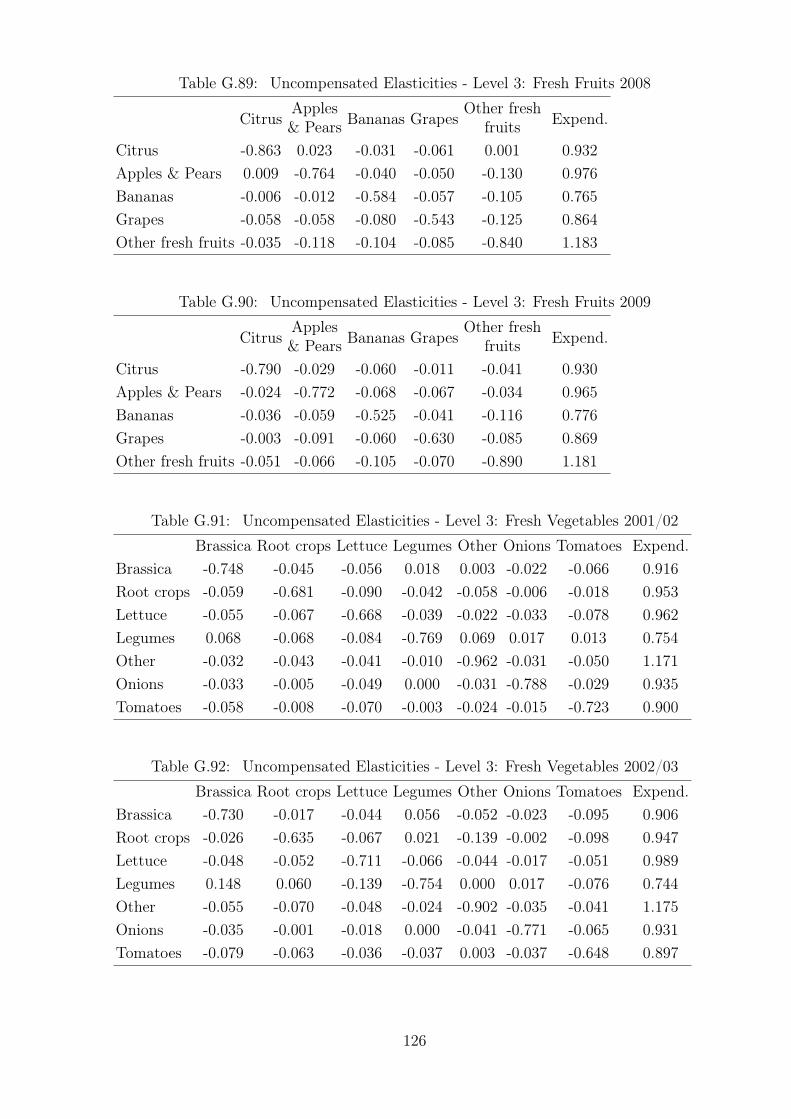
Table G.89: Uncompensated Elasticities - Level 3: Fresh Fruits 2008
CitrusApples
Bananas GrapesOther fresh
Expend.& Pears fruits
Citrus -0.863 0.023 -0.031 -0.061 0.001 0.932
Apples & Pears 0.009 -0.764 -0.040 -0.050 -0.130 0.976
Bananas -0.006 -0.012 -0.584 -0.057 -0.105 0.765
Grapes -0.058 -0.058 -0.080 -0.543 -0.125 0.864
Other fresh fruits -0.035 -0.118 -0.104 -0.085 -0.840 1.183
Table G.90: Uncompensated Elasticities - Level 3: Fresh Fruits 2009
CitrusApples
Bananas GrapesOther fresh
Expend.& Pears fruits
Citrus -0.790 -0.029 -0.060 -0.011 -0.041 0.930
Apples & Pears -0.024 -0.772 -0.068 -0.067 -0.034 0.965
Bananas -0.036 -0.059 -0.525 -0.041 -0.116 0.776
Grapes -0.003 -0.091 -0.060 -0.630 -0.085 0.869
Other fresh fruits -0.051 -0.066 -0.105 -0.070 -0.890 1.181
Table G.91: Uncompensated Elasticities - Level 3: Fresh Vegetables 2001/02
Brassica Root crops Lettuce Legumes Other Onions Tomatoes Expend.
Brassica -0.748 -0.045 -0.056 0.018 0.003 -0.022 -0.066 0.916
Root crops -0.059 -0.681 -0.090 -0.042 -0.058 -0.006 -0.018 0.953
Lettuce -0.055 -0.067 -0.668 -0.039 -0.022 -0.033 -0.078 0.962
Legumes 0.068 -0.068 -0.084 -0.769 0.069 0.017 0.013 0.754
Other -0.032 -0.043 -0.041 -0.010 -0.962 -0.031 -0.050 1.171
Onions -0.033 -0.005 -0.049 0.000 -0.031 -0.788 -0.029 0.935
Tomatoes -0.058 -0.008 -0.070 -0.003 -0.024 -0.015 -0.723 0.900
Table G.92: Uncompensated Elasticities - Level 3: Fresh Vegetables 2002/03
Brassica Root crops Lettuce Legumes Other Onions Tomatoes Expend.
Brassica -0.730 -0.017 -0.044 0.056 -0.052 -0.023 -0.095 0.906
Root crops -0.026 -0.635 -0.067 0.021 -0.139 -0.002 -0.098 0.947
Lettuce -0.048 -0.052 -0.711 -0.066 -0.044 -0.017 -0.051 0.989
Legumes 0.148 0.060 -0.139 -0.754 0.000 0.017 -0.076 0.744
Other -0.055 -0.070 -0.048 -0.024 -0.902 -0.035 -0.041 1.175
Onions -0.035 -0.001 -0.018 0.000 -0.041 -0.771 -0.065 0.931
Tomatoes -0.079 -0.063 -0.036 -0.037 0.003 -0.037 -0.648 0.897
126
Table G.93: Uncompensated Elasticities - Level 3: Fresh Vegetables 2003/04
Brassica Root crops Lettuce Legumes Other Onions Tomatoes Expend.
Brassica -0.746 -0.051 -0.052 0.004 0.036 -0.026 -0.077 0.912
Root crops -0.066 -0.672 -0.049 -0.019 -0.053 -0.001 -0.059 0.919
Lettuce -0.051 -0.037 -0.716 -0.054 -0.065 -0.020 -0.036 0.979
Legumes 0.029 -0.018 -0.114 -0.648 -0.012 0.037 -0.030 0.756
Other -0.019 -0.041 -0.060 -0.026 -0.937 -0.037 -0.053 1.174
Onions -0.036 0.000 -0.025 0.015 -0.049 -0.770 -0.044 0.910
Tomatoes -0.063 -0.038 -0.027 -0.020 -0.029 -0.026 -0.720 0.922
Table G.94: Uncompensated Elasticities - Level 3: Fresh Vegetables 2004/05
Brassica Root crops Lettuce Legumes Other Onions Tomatoes Expend.
Brassica -0.679 -0.052 -0.093 0.027 -0.012 -0.014 -0.071 0.894
Root crops -0.065 -0.717 -0.050 0.050 -0.088 -0.009 -0.067 0.945
Lettuce -0.087 -0.039 -0.699 -0.051 -0.047 -0.013 -0.023 0.959
Legumes 0.089 0.131 -0.104 -0.654 -0.181 0.087 -0.066 0.697
Other -0.041 -0.055 -0.054 -0.054 -0.904 -0.035 -0.046 1.188
Onions -0.023 -0.007 -0.015 0.041 -0.042 -0.794 -0.074 0.915
Tomatoes -0.060 -0.044 -0.014 -0.034 -0.006 -0.042 -0.703 0.902
Table G.95: Uncompensated Elasticities - Level 3: Fresh Vegetables 2005/06
Brassica Root crops Lettuce Legumes Other Onions Tomatoes Expend.
Brassica -0.750 -0.056 -0.054 0.001 0.024 0.000 -0.061 0.896
Root crops -0.067 -0.685 -0.035 -0.009 -0.073 0.005 -0.069 0.933
Lettuce -0.056 -0.031 -0.672 -0.057 -0.076 -0.012 -0.042 0.946
Legumes 0.021 0.003 -0.113 -0.630 -0.047 0.044 -0.017 0.739
Other -0.028 -0.054 -0.064 -0.033 -0.924 -0.031 -0.054 1.189
Onions -0.005 0.007 -0.018 0.018 -0.035 -0.812 -0.087 0.934
Tomatoes -0.054 -0.051 -0.033 -0.015 -0.028 -0.049 -0.665 0.895
Table G.96: Uncompensated Elasticities - Level 3: Fresh Vegetables 2006
Brassica Root crops Lettuce Legumes Other Onions Tomatoes Expend.
Brassica -0.697 -0.054 -0.080 0.033 0.004 -0.008 -0.085 0.886
Root crops -0.063 -0.717 -0.062 -0.005 -0.087 -0.002 -0.016 0.952
Lettuce -0.073 -0.049 -0.704 -0.059 -0.012 -0.016 -0.015 0.928
Legumes 0.096 0.017 -0.129 -0.663 0.034 0.006 -0.077 0.718
Other -0.035 -0.058 -0.042 -0.020 -0.936 -0.033 -0.071 1.194
Onions -0.016 0.000 -0.025 -0.007 -0.036 -0.773 -0.066 0.923
Tomatoes -0.069 -0.006 -0.011 -0.036 -0.060 -0.036 -0.682 0.901
127

Table G.97: Uncompensated Elasticities - Level 3: Fresh Vegetables 2007
Brassica Root crops Lettuce Legumes Other Onions Tomatoes Expend.
Brassica -0.760 -0.047 -0.024 0.010 0.027 -0.003 -0.114 0.911
Root crops -0.053 -0.737 -0.080 0.006 -0.038 0.015 -0.049 0.936
Lettuce -0.025 -0.068 -0.719 -0.039 -0.061 -0.014 -0.013 0.938
Legumes 0.048 0.040 -0.065 -0.657 -0.066 0.024 -0.028 0.705
Other -0.024 -0.042 -0.058 -0.037 -0.939 -0.038 -0.050 1.188
Onions -0.004 0.022 -0.017 0.004 -0.052 -0.800 -0.060 0.908
Tomatoes -0.095 -0.035 -0.008 -0.022 -0.024 -0.037 -0.689 0.910
Table G.98: Uncompensated Elasticities - Level 3: Fresh Vegetables 2008
Brassica Root crops Lettuce Legumes Other Onions Tomatoes Expend.
Brassica -0.729 -0.054 -0.023 0.013 -0.023 0.005 -0.062 0.873
Root crops -0.061 -0.724 -0.022 -0.011 -0.092 0.010 -0.051 0.950
Lettuce -0.027 -0.017 -0.704 -0.059 -0.064 -0.017 -0.029 0.916
Legumes 0.052 0.004 -0.126 -0.677 0.075 0.008 -0.030 0.694
Other -0.045 -0.062 -0.058 -0.013 -0.911 -0.038 -0.061 1.190
Onions -0.002 0.013 -0.026 -0.008 -0.052 -0.821 -0.047 0.944
Tomatoes -0.056 -0.038 -0.024 -0.020 -0.049 -0.028 -0.693 0.910
Table G.99: Uncompensated Elasticities - Level 3: Fresh Vegetables 2009
Brassica Root crops Lettuce Legumes Other Onions Tomatoes Expend.
Brassica -0.811 -0.041 0.008 0.012 -0.041 0.031 -0.063 0.904
Root crops -0.045 -0.769 -0.003 0.050 -0.078 -0.040 -0.067 0.952
Lettuce 0.005 0.000 -0.786 -0.032 -0.020 -0.027 -0.066 0.925
Legumes 0.057 0.163 -0.054 -0.764 -0.045 -0.014 -0.026 0.684
Other -0.046 -0.056 -0.039 -0.030 -0.931 -0.028 -0.052 1.183
Onions 0.038 -0.047 -0.034 -0.018 -0.012 -0.824 -0.017 0.914
Tomatoes -0.049 -0.049 -0.053 -0.019 -0.024 -0.010 -0.703 0.907
128
G.4 Subsamples
Table G.100: Uncompensated Elasticities - Subsamples: England 2001/02
DairyMeat Fish
FruitVeg.
Fats &Alcohol Expend.
& Egg & Nuts Starches
Dairy & Eggs -0.417 -0.032 0.001 -0.068 -0.080 -0.323 0.024 0.894
Meat -0.036 -0.863 -0.018 0.007 -0.039 -0.146 0.009 1.086
Fish 0.027 0.004 -0.367 0.093 -0.036 -0.214 -0.162 0.655
Fruits & Nuts -0.094 0.067 0.048 -0.797 -0.034 0.108 -0.162 0.865
Vegetables -0.110 -0.075 -0.033 -0.037 -0.547 -0.108 -0.048 0.957
Fats & Starches -0.109 -0.083 -0.044 0.004 -0.034 -0.811 -0.013 1.089
Alcohol 0.023 0.058 -0.073 -0.106 -0.028 0.032 -0.793 0.888
Table G.101: Uncompensated Elasticities - Subsamples: England 2002/03
DairyMeat Fish
FruitVeg.
Fats &Alcohol Expend.
& Egg & Nuts Starches
Dairy & Eggs -0.319 -0.033 -0.029 -0.041 -0.105 -0.324 -0.020 0.872
Meat -0.040 -0.789 -0.011 0.027 -0.016 -0.237 -0.034 1.101
Fish -0.048 0.039 -0.449 0.032 -0.008 -0.156 -0.068 0.658
Fruits & Nuts -0.054 0.129 0.010 -0.814 -0.011 0.127 -0.238 0.850
Vegetables -0.146 -0.013 -0.017 -0.018 -0.573 -0.046 -0.145 0.958
Fats & Starches -0.113 -0.134 -0.037 0.008 -0.020 -0.825 0.033 1.088
Alcohol -0.021 -0.020 -0.036 -0.160 -0.097 0.177 -0.744 0.902
Table G.102: Uncompensated Elasticities - Subsamples: England 2003/04
DairyMeat Fish
FruitVeg.
Fats &Alcohol Expend.
& Egg & Nuts Starches
Dairy & Eggs -0.268 -0.031 -0.033 -0.060 -0.117 -0.366 -0.028 0.902
Meat -0.035 -0.833 -0.025 0.021 -0.038 -0.136 -0.045 1.090
Fish -0.060 -0.045 -0.374 0.011 -0.040 -0.085 -0.112 0.705
Fruits & Nuts -0.078 0.113 0.000 -0.704 0.032 -0.088 -0.124 0.848
Vegetables -0.154 -0.068 -0.031 0.022 -0.595 -0.004 -0.112 0.941
Fats & Starches -0.124 -0.079 -0.026 -0.035 -0.012 -0.817 0.011 1.082
Alcohol -0.026 -0.043 -0.049 -0.083 -0.075 0.098 -0.730 0.908
129
Table G.103: Uncompensated Elasticities - Subsamples: England 2004/05
DairyMeat Fish
FruitVeg.
Fats &Alcohol Expend.
& Egg & Nuts Starches
Dairy & Eggs -0.393 -0.017 -0.017 -0.079 -0.104 -0.308 0.017 0.900
Meat -0.030 -0.806 -0.037 0.039 -0.053 -0.179 -0.046 1.113
Fish -0.015 -0.081 -0.327 0.087 0.002 -0.225 -0.099 0.658
Fruits & Nuts -0.104 0.167 0.043 -0.809 0.032 0.023 -0.200 0.848
Vegetables -0.137 -0.102 -0.011 0.023 -0.566 -0.081 -0.058 0.932
Fats & Starches -0.107 -0.098 -0.046 -0.013 -0.030 -0.801 0.014 1.080
Alcohol 0.015 -0.039 -0.048 -0.132 -0.038 0.108 -0.772 0.906
Table G.104: Uncompensated Elasticities - Subsamples: England 2005/06
DairyMeat Fish
FruitVeg.
Fats &Alcohol Expend.
& Egg & Nuts Starches
Dairy & Eggs -0.331 -0.041 -0.038 -0.087 -0.025 -0.370 -0.019 0.912
Meat -0.042 -0.831 -0.036 0.007 -0.030 -0.091 -0.076 1.099
Fish -0.066 -0.083 -0.348 0.071 -0.003 -0.139 -0.141 0.709
Fruits & Nuts -0.113 0.058 0.031 -0.777 0.008 0.051 -0.163 0.905
Vegetables -0.038 -0.047 -0.013 0.002 -0.616 -0.122 -0.134 0.968
Fats & Starches -0.128 -0.047 -0.035 -0.002 -0.038 -0.860 0.039 1.071
Alcohol -0.016 -0.096 -0.066 -0.117 -0.093 0.187 -0.690 0.890
Table G.105: Uncompensated Elasticities - Subsamples: England 2006
DairyMeat Fish
FruitVeg.
Fats &Alcohol Expend.
& Egg & Nuts Starches
Dairy & Eggs -0.303 -0.021 -0.042 -0.115 -0.079 -0.334 -0.030 0.924
Meat -0.030 -0.866 -0.023 0.050 -0.023 -0.208 -0.002 1.100
Fish -0.072 -0.020 -0.428 0.078 -0.005 -0.070 -0.205 0.723
Fruits & Nuts -0.139 0.164 0.035 -0.781 -0.018 0.029 -0.176 0.886
Vegetables -0.104 -0.029 -0.015 -0.025 -0.613 -0.063 -0.124 0.973
Fats & Starches -0.115 -0.115 -0.026 -0.009 -0.024 -0.804 0.019 1.075
Alcohol -0.023 0.043 -0.094 -0.133 -0.086 0.130 -0.713 0.875
130
Table G.106: Uncompensated Elasticities - Subsamples: England 2007
DairyMeat Fish
FruitVeg.
Fats &Alcohol Expend.
& Egg & Nuts Starches
Dairy & Eggs -0.391 0.013 -0.002 -0.039 -0.125 -0.335 -0.036 0.915
Meat -0.014 -0.738 -0.038 0.039 -0.043 -0.217 -0.098 1.109
Fish 0.019 -0.079 -0.337 -0.077 0.009 -0.098 -0.130 0.693
Fruits & Nuts -0.045 0.147 -0.052 -0.742 -0.036 -0.030 -0.103 0.861
Vegetables -0.158 -0.069 -0.007 -0.042 -0.514 -0.083 -0.078 0.951
Fats & Starches -0.118 -0.118 -0.031 -0.025 -0.031 -0.818 0.067 1.075
Alcohol -0.033 -0.133 -0.064 -0.079 -0.056 0.259 -0.812 0.918
Table G.107: Uncompensated Elasticities - Subsamples: England 2008
DairyMeat Fish
FruitVeg.
Fats &Alcohol Expend.
& Egg & Nuts Starches
Dairy & Eggs -0.392 0.097 -0.053 -0.154 -0.155 -0.313 0.036 0.933
Meat 0.034 -0.828 -0.060 0.040 -0.010 -0.293 0.010 1.106
Fish -0.103 -0.182 -0.313 -0.035 -0.010 -0.027 -0.035 0.704
Fruits & Nuts -0.209 0.145 -0.029 -0.725 0.016 0.055 -0.139 0.884
Vegetables -0.209 0.006 -0.017 0.009 -0.595 -0.044 -0.115 0.967
Fats & Starches -0.113 -0.158 -0.021 -0.003 -0.019 -0.786 0.027 1.072
Alcohol 0.048 0.071 -0.023 -0.106 -0.085 0.173 -0.936 0.859
Table G.108: Uncompensated Elasticities - Subsamples: England 2009
DairyMeat Fish
FruitVeg.
Fats &Alcohol Expend.
& Egg & Nuts Starches
Dairy & Eggs -0.501 0.031 -0.067 -0.050 -0.075 -0.346 0.104 0.903
Meat -0.005 -0.816 -0.015 0.050 -0.034 -0.212 -0.071 1.104
Fish -0.146 0.016 -0.457 0.054 -0.073 -0.002 -0.084 0.691
Fruits & Nuts -0.073 0.175 0.023 -0.638 0.004 -0.116 -0.261 0.885
Vegetables -0.109 -0.052 -0.051 -0.002 -0.615 0.040 -0.172 0.961
Fats & Starches -0.130 -0.113 -0.017 -0.039 0.000 -0.854 0.083 1.071
Alcohol 0.107 -0.093 -0.044 -0.185 -0.128 0.329 -0.898 0.913
131
Table G.109: Uncompensated Elasticities - Subsamples: England & Wales 2001/02
DairyMeat Fish
FruitVeg.
Fats &Alcohol Expend.
& Egg & Nuts Starches
Dairy & Eggs -0.426 -0.030 -0.012 -0.071 -0.079 -0.304 0.030 0.892
Meat -0.034 -0.863 -0.018 0.006 -0.043 -0.142 0.008 1.085
Fish -0.003 0.005 -0.357 0.095 -0.018 -0.206 -0.166 0.650
Fruits & Nuts -0.099 0.067 0.049 -0.808 -0.034 0.120 -0.152 0.856
Vegetables -0.109 -0.086 -0.023 -0.037 -0.535 -0.099 -0.063 0.954
Fats & Starches -0.104 -0.081 -0.043 0.006 -0.032 -0.813 -0.023 1.089
Alcohol 0.026 0.054 -0.075 -0.099 -0.040 -0.006 -0.760 0.900
Table G.110: Uncompensated Elasticities - Subsamples: England & Wales 2002/03
DairyMeat Fish
FruitVeg.
Fats &Alcohol Expend.
& Egg & Nuts Starches
Dairy & Eggs -0.319 -0.040 -0.028 -0.038 -0.101 -0.334 -0.012 0.872
Meat -0.043 -0.798 -0.008 0.027 -0.013 -0.219 -0.042 1.096
Fish -0.045 0.056 -0.445 0.049 -0.025 -0.167 -0.073 0.650
Fruits & Nuts -0.051 0.129 0.019 -0.823 -0.021 0.128 -0.238 0.855
Vegetables -0.140 -0.006 -0.027 -0.027 -0.567 -0.045 -0.144 0.956
Fats & Starches -0.116 -0.124 -0.038 0.009 -0.020 -0.830 0.034 1.086
Alcohol -0.015 -0.040 -0.039 -0.160 -0.097 0.171 -0.736 0.917
Table G.111: Uncompensated Elasticities - Subsamples: England & Wales 2003/04
DairyMeat Fish
FruitVeg.
Fats &Alcohol Expend.
& Egg & Nuts Starches
Dairy & Eggs -0.277 -0.025 -0.038 -0.060 -0.122 -0.354 -0.028 0.905
Meat -0.032 -0.829 -0.022 0.020 -0.042 -0.134 -0.055 1.093
Fish -0.073 -0.028 -0.382 0.029 -0.044 -0.104 -0.095 0.697
Fruits & Nuts -0.080 0.112 0.010 -0.712 0.033 -0.105 -0.109 0.850
Vegetables -0.161 -0.081 -0.033 0.024 -0.585 -0.002 -0.103 0.941
Fats & Starches -0.120 -0.078 -0.028 -0.038 -0.012 -0.813 0.004 1.086
Alcohol -0.024 -0.058 -0.042 -0.071 -0.067 0.084 -0.710 0.888
132
Table G.112: Uncompensated Elasticities - Subsamples: England & Wales 2004/05
DairyMeat Fish
FruitVeg.
Fats &Alcohol Expend.
& Egg & Nuts Starches
Dairy & Eggs -0.413 -0.007 -0.021 -0.067 -0.101 -0.291 0.003 0.897
Meat -0.026 -0.803 -0.035 0.032 -0.053 -0.193 -0.036 1.115
Fish -0.024 -0.074 -0.319 0.070 0.008 -0.215 -0.100 0.654
Fruits & Nuts -0.088 0.149 0.033 -0.824 0.026 0.076 -0.213 0.842
Vegetables -0.134 -0.101 -0.008 0.017 -0.567 -0.092 -0.045 0.930
Fats & Starches -0.102 -0.106 -0.045 -0.002 -0.033 -0.801 0.006 1.083
Alcohol 0.002 -0.019 -0.048 -0.140 -0.029 0.086 -0.753 0.901
Table G.113: Uncompensated Elasticities - Subsamples: England & Wales 2005/06
DairyMeat Fish
FruitVeg.
Fats &Alcohol Expend.
& Egg & Nuts Starches
Dairy & Eggs -0.344 -0.042 -0.032 -0.083 -0.029 -0.357 -0.020 0.906
Meat -0.042 -0.831 -0.035 0.008 -0.025 -0.103 -0.073 1.100
Fish -0.053 -0.078 -0.362 0.078 -0.003 -0.135 -0.150 0.702
Fruits & Nuts -0.107 0.064 0.035 -0.783 -0.009 0.061 -0.154 0.894
Vegetables -0.042 -0.033 -0.013 -0.014 -0.606 -0.122 -0.131 0.962
Fats & Starches -0.125 -0.054 -0.034 0.000 -0.038 -0.852 0.033 1.070
Alcohol -0.019 -0.093 -0.069 -0.111 -0.092 0.160 -0.685 0.909
Table G.114: Uncompensated Elasticities - Subsamples: England & Wales 2006
DairyMeat Fish
FruitVeg.
Fats &Alcohol Expend.
& Egg & Nuts Starches
Dairy & Eggs -0.314 -0.041 -0.033 -0.120 -0.066 -0.325 -0.023 0.922
Meat -0.040 -0.855 -0.025 0.049 -0.021 -0.196 -0.012 1.100
Fish -0.053 -0.030 -0.428 0.081 0.000 -0.094 -0.187 0.712
Fruits & Nuts -0.145 0.163 0.036 -0.778 -0.028 0.028 -0.161 0.884
Vegetables -0.088 -0.024 -0.012 -0.035 -0.616 -0.071 -0.128 0.974
Fats & Starches -0.113 -0.108 -0.029 -0.010 -0.026 -0.806 0.016 1.076
Alcohol -0.017 0.024 -0.086 -0.121 -0.088 0.121 -0.710 0.876
133

Table G.115: Uncompensated Elasticities - Subsamples: England & Wales 2007
DairyMeat Fish
FruitVeg.
Fats &Alcohol Expend.
& Egg & Nuts Starches
Dairy & Eggs -0.397 0.016 -0.001 -0.053 -0.134 -0.314 -0.033 0.918
Meat -0.012 -0.747 -0.040 0.038 -0.035 -0.220 -0.092 1.108
Fish 0.022 -0.086 -0.333 -0.079 0.024 -0.089 -0.149 0.690
Fruits & Nuts -0.064 0.145 -0.054 -0.743 -0.040 -0.022 -0.088 0.865
Vegetables -0.170 -0.051 0.000 -0.046 -0.530 -0.073 -0.088 0.958
Fats & Starches -0.112 -0.121 -0.030 -0.022 -0.028 -0.828 0.065 1.075
Alcohol -0.030 -0.124 -0.071 -0.066 -0.062 0.260 -0.816 0.909
Table G.116: Uncompensated Elasticities - Subsamples: England & Wales 2008
DairyMeat Fish
FruitVeg.
Fats &Alcohol Expend.
& Egg & Nuts Starches
Dairy & Eggs -0.411 0.094 -0.050 -0.150 -0.155 -0.299 0.039 0.933
Meat 0.031 -0.818 -0.065 0.043 -0.011 -0.301 0.009 1.111
Fish -0.098 -0.206 -0.325 0.000 0.002 -0.031 -0.049 0.708
Fruits & Nuts -0.204 0.156 -0.008 -0.731 0.004 0.052 -0.153 0.885
Vegetables -0.210 0.004 -0.011 -0.003 -0.592 -0.039 -0.116 0.966
Fats & Starches -0.109 -0.163 -0.021 -0.004 -0.018 -0.783 0.024 1.073
Alcohol 0.051 0.073 -0.028 -0.116 -0.084 0.167 -0.910 0.847
Table G.117: Uncompensated Elasticities - Subsamples: England & Wales 2009
DairyMeat Fish
FruitVeg.
Fats &Alcohol Expend.
& Egg & Nuts Starches
Dairy & Eggs -0.519 0.020 -0.054 -0.042 -0.075 -0.328 0.093 0.906
Meat -0.012 -0.816 -0.014 0.054 -0.027 -0.212 -0.078 1.106
Fish -0.114 0.022 -0.455 0.047 -0.072 -0.013 -0.109 0.695
Fruits & Nuts -0.061 0.189 0.019 -0.637 0.006 -0.128 -0.270 0.882
Vegetables -0.109 -0.036 -0.050 0.000 -0.595 0.012 -0.179 0.959
Fats & Starches -0.124 -0.113 -0.019 -0.042 -0.007 -0.869 0.102 1.072
Alcohol 0.097 -0.104 -0.054 -0.190 -0.132 0.394 -0.917 0.905
134
Table G.118: Uncompensated Elasticities - Subsamples: Scotland 2001/02
DairyMeat Fish
FruitVeg.
Fats &Alcohol Expend.
& Egg & Nuts Starches
Dairy & Eggs -0.588 -0.175 -0.076 -0.025 -0.107 -0.310 0.407 0.874
Meat -0.100 -0.908 -0.038 -0.036 -0.003 -0.166 0.132 1.119
Fish -0.178 -0.132 -0.583 -0.150 -0.187 -0.087 0.577 0.739
Fruits & Nuts -0.033 -0.059 -0.096 -0.770 -0.120 0.063 0.202 0.813
Vegetables -0.169 0.037 -0.122 -0.125 -0.758 -0.180 0.421 0.896
Fats & Starches -0.098 -0.087 -0.022 -0.007 -0.041 -0.902 0.071 1.086
Alcohol 0.309 0.286 0.169 0.096 0.207 0.307 -2.224 0.849
Table G.119: Uncompensated Elasticities - Subsamples: Scotland 2002/03
DairyMeat Fish
FruitVeg.
Fats &Alcohol Expend.
& Egg & Nuts Starches
Dairy & Eggs -0.799 -0.145 0.064 0.008 -0.172 -0.170 0.278 0.935
Meat -0.084 -0.713 -0.037 0.014 -0.093 -0.290 0.093 1.109
Fish 0.189 -0.128 -0.587 -0.309 -0.209 -0.277 0.591 0.730
Fruits & Nuts 0.027 0.119 -0.191 -0.934 -0.089 -0.199 0.467 0.799
Vegetables -0.262 -0.279 -0.130 -0.095 -0.624 -0.010 0.414 0.987
Fats & Starches -0.059 -0.159 -0.041 -0.050 -0.009 -0.906 0.135 1.089
Alcohol 0.263 0.259 0.198 0.261 0.258 0.594 -2.585 0.751
Table G.120: Uncompensated Elasticities - Subsamples: Scotland 2003/04
DairyMeat Fish
FruitVeg.
Fats &Alcohol Expend.
& Egg & Nuts Starches
Dairy & Eggs -0.765 -0.020 -0.146 -0.261 -0.083 -0.290 0.649 0.917
Meat -0.029 -0.789 -0.009 0.040 0.005 -0.467 0.124 1.125
Fish -0.354 0.036 -0.398 -0.371 -0.175 -0.178 0.713 0.727
Fruits & Nuts -0.407 0.197 -0.233 -0.961 -0.116 -0.049 0.661 0.907
Vegetables -0.137 0.053 -0.117 -0.121 -0.973 -0.263 0.578 0.979
Fats & Starches -0.091 -0.270 -0.032 -0.021 -0.050 -0.931 0.271 1.124
Alcohol 0.557 0.363 0.231 0.363 0.322 1.112 -3.512 0.565
135

Table G.121: Uncompensated Elasticities - Subsamples: Scotland 2004/05
DairyMeat Fish
FruitVeg.
Fats &Alcohol Expend.
& Egg & Nuts Starches
Dairy & Eggs -0.883 0.004 -0.183 -0.028 -0.157 -0.376 0.695 0.926
Meat -0.013 -0.709 -0.059 -0.158 -0.113 -0.026 0.001 1.078
Fish -0.446 -0.247 -0.493 -0.204 -0.286 0.127 0.850 0.699
Fruits & Nuts -0.038 -0.468 -0.125 -0.656 -0.148 -0.057 0.595 0.897
Vegetables -0.245 -0.354 -0.181 -0.159 -0.611 0.085 0.483 0.982
Fats & Starches -0.111 -0.010 -0.001 -0.021 0.009 -1.060 0.135 1.059
Alcohol 0.566 0.040 0.261 0.326 0.261 0.482 -2.835 0.899
Table G.122: Uncompensated Elasticities - Subsamples: Scotland 2005/06
DairyMeat Fish
FruitVeg.
Fats &Alcohol Expend.
& Egg & Nuts Starches
Dairy & Eggs -0.790 -0.059 -0.170 0.043 -0.165 -0.272 0.538 0.876
Meat -0.052 -0.907 -0.076 -0.049 -0.051 -0.118 0.127 1.126
Fish -0.392 -0.299 -0.593 0.058 -0.304 0.162 0.744 0.624
Fruits & Nuts 0.056 -0.093 0.021 -0.767 -0.035 -0.249 0.179 0.888
Vegetables -0.237 -0.112 -0.188 -0.039 -0.678 0.058 0.291 0.904
Fats & Starches -0.093 -0.061 -0.002 -0.064 -0.003 -0.983 0.109 1.097
Alcohol 0.420 0.278 0.227 0.108 0.164 0.423 -2.452 0.832
Table G.123: Uncompensated Elasticities - Subsamples: Scotland 2006
DairyMeat Fish
FruitVeg.
Fats &Alcohol Expend.
& Egg & Nuts Starches
Dairy & Eggs -0.863 0.089 -0.198 0.031 -0.228 -0.345 0.648 0.866
Meat 0.011 -0.959 -0.031 -0.045 -0.012 -0.238 0.105 1.169
Fish -0.414 -0.043 -0.462 0.079 -0.257 -0.191 0.634 0.654
Fruits & Nuts 0.035 -0.078 0.035 -0.880 -0.059 -0.380 0.399 0.928
Vegetables -0.335 0.023 -0.182 -0.062 -0.674 -0.043 0.392 0.881
Fats & Starches -0.107 -0.113 -0.040 -0.084 -0.020 -0.755 0.051 1.067
Alcohol 0.504 0.254 0.216 0.243 0.210 0.244 -2.506 0.836
136
Table G.124: Uncompensated Elasticities - Subsamples: Scotland 2007
DairyMeat Fish
FruitVeg.
Fats &Alcohol Expend.
& Egg & Nuts Starches
Dairy & Eggs -0.741 -0.226 -0.024 -0.155 -0.117 -0.236 0.500 1.000
Meat -0.117 -0.772 -0.085 0.055 -0.083 -0.356 0.248 1.110
Fish -0.017 -0.305 -0.556 0.023 -0.194 -0.327 0.735 0.640
Fruits & Nuts -0.193 0.191 0.000 -0.761 -0.027 -0.302 0.164 0.928
Vegetables -0.174 -0.238 -0.145 -0.036 -0.586 -0.137 0.322 0.995
Fats & Starches -0.072 -0.196 -0.059 -0.075 -0.031 -0.902 0.240 1.096
Alcohol 0.520 0.613 0.317 0.146 0.233 1.058 -3.521 0.634
Table G.125: Uncompensated Elasticities - Subsamples: Scotland 2008
DairyMeat Fish
FruitVeg.
Fats &Alcohol Expend.
& Egg & Nuts Starches
Dairy & Eggs -0.736 -0.404 -0.083 -0.120 -0.081 -0.079 0.569 0.934
Meat -0.229 -0.800 -0.042 -0.018 -0.098 -0.259 0.310 1.136
Fish -0.182 -0.113 -0.637 0.127 -0.168 -0.461 0.725 0.709
Fruits & Nuts -0.161 0.005 0.063 -1.040 0.042 -0.170 0.374 0.887
Vegetables -0.126 -0.257 -0.115 0.044 -0.790 -0.001 0.312 0.933
Fats & Starches -0.036 -0.126 -0.067 -0.048 -0.009 -0.865 0.089 1.063
Alcohol 0.586 0.676 0.289 0.278 0.209 0.414 -3.269 0.816
Table G.126: Uncompensated Elasticities - Subsamples: Scotland 2009
DairyMeat Fish
FruitVeg.
Fats &Alcohol Expend.
& Egg & Nuts Starches
Dairy & Eggs -0.541 -0.248 -0.047 -0.085 -0.116 -0.292 0.406 0.922
Meat -0.148 -0.698 0.000 0.054 -0.028 -0.298 -0.013 1.131
Fish -0.098 0.091 -0.762 -0.018 -0.126 -0.520 0.742 0.691
Fruits & Nuts -0.121 0.215 -0.018 -1.098 -0.232 -0.228 0.612 0.869
Vegetables -0.182 -0.046 -0.084 -0.247 -0.744 -0.151 0.508 0.946
Fats & Starches -0.100 -0.157 -0.072 -0.059 -0.038 -0.845 0.175 1.096
Alcohol 0.414 0.062 0.272 0.408 0.333 0.750 -2.964 0.725
137
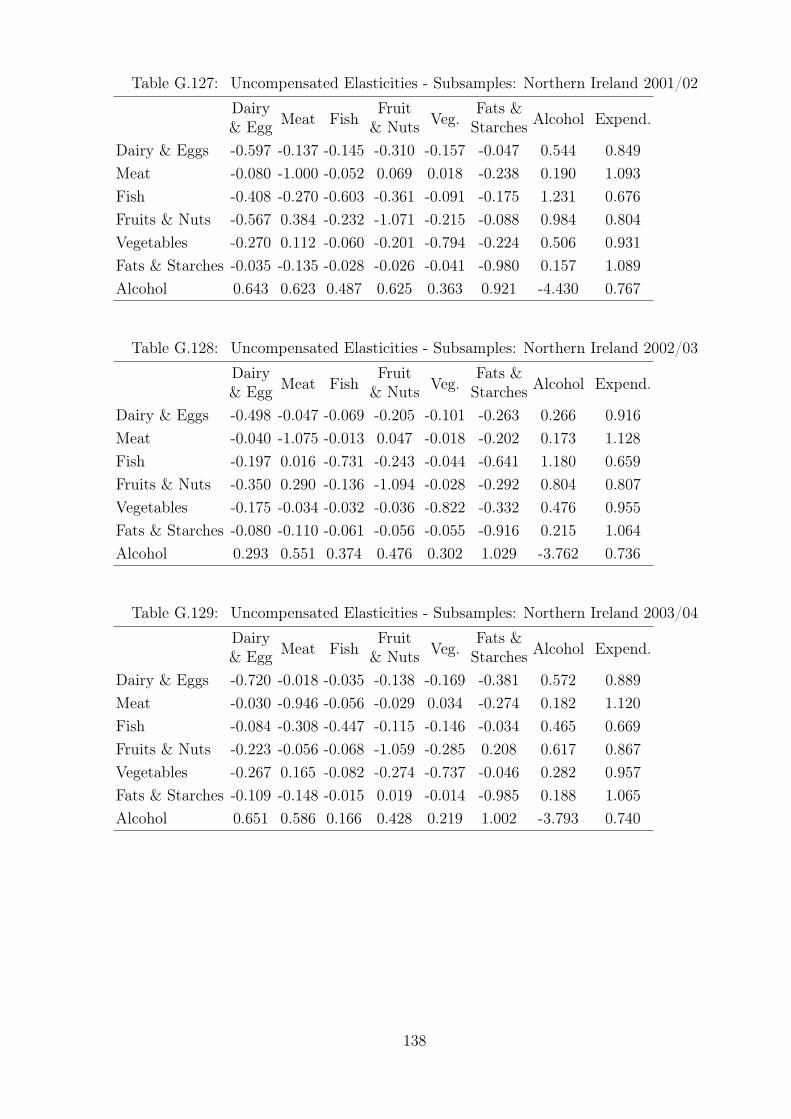
Table G.127: Uncompensated Elasticities - Subsamples: Northern Ireland 2001/02
DairyMeat Fish
FruitVeg.
Fats &Alcohol Expend.
& Egg & Nuts Starches
Dairy & Eggs -0.597 -0.137 -0.145 -0.310 -0.157 -0.047 0.544 0.849
Meat -0.080 -1.000 -0.052 0.069 0.018 -0.238 0.190 1.093
Fish -0.408 -0.270 -0.603 -0.361 -0.091 -0.175 1.231 0.676
Fruits & Nuts -0.567 0.384 -0.232 -1.071 -0.215 -0.088 0.984 0.804
Vegetables -0.270 0.112 -0.060 -0.201 -0.794 -0.224 0.506 0.931
Fats & Starches -0.035 -0.135 -0.028 -0.026 -0.041 -0.980 0.157 1.089
Alcohol 0.643 0.623 0.487 0.625 0.363 0.921 -4.430 0.767
Table G.128: Uncompensated Elasticities - Subsamples: Northern Ireland 2002/03
DairyMeat Fish
FruitVeg.
Fats &Alcohol Expend.
& Egg & Nuts Starches
Dairy & Eggs -0.498 -0.047 -0.069 -0.205 -0.101 -0.263 0.266 0.916
Meat -0.040 -1.075 -0.013 0.047 -0.018 -0.202 0.173 1.128
Fish -0.197 0.016 -0.731 -0.243 -0.044 -0.641 1.180 0.659
Fruits & Nuts -0.350 0.290 -0.136 -1.094 -0.028 -0.292 0.804 0.807
Vegetables -0.175 -0.034 -0.032 -0.036 -0.822 -0.332 0.476 0.955
Fats & Starches -0.080 -0.110 -0.061 -0.056 -0.055 -0.916 0.215 1.064
Alcohol 0.293 0.551 0.374 0.476 0.302 1.029 -3.762 0.736
Table G.129: Uncompensated Elasticities - Subsamples: Northern Ireland 2003/04
DairyMeat Fish
FruitVeg.
Fats &Alcohol Expend.
& Egg & Nuts Starches
Dairy & Eggs -0.720 -0.018 -0.035 -0.138 -0.169 -0.381 0.572 0.889
Meat -0.030 -0.946 -0.056 -0.029 0.034 -0.274 0.182 1.120
Fish -0.084 -0.308 -0.447 -0.115 -0.146 -0.034 0.465 0.669
Fruits & Nuts -0.223 -0.056 -0.068 -1.059 -0.285 0.208 0.617 0.867
Vegetables -0.267 0.165 -0.082 -0.274 -0.737 -0.046 0.282 0.957
Fats & Starches -0.109 -0.148 -0.015 0.019 -0.014 -0.985 0.188 1.065
Alcohol 0.651 0.586 0.166 0.428 0.219 1.002 -3.793 0.740
138
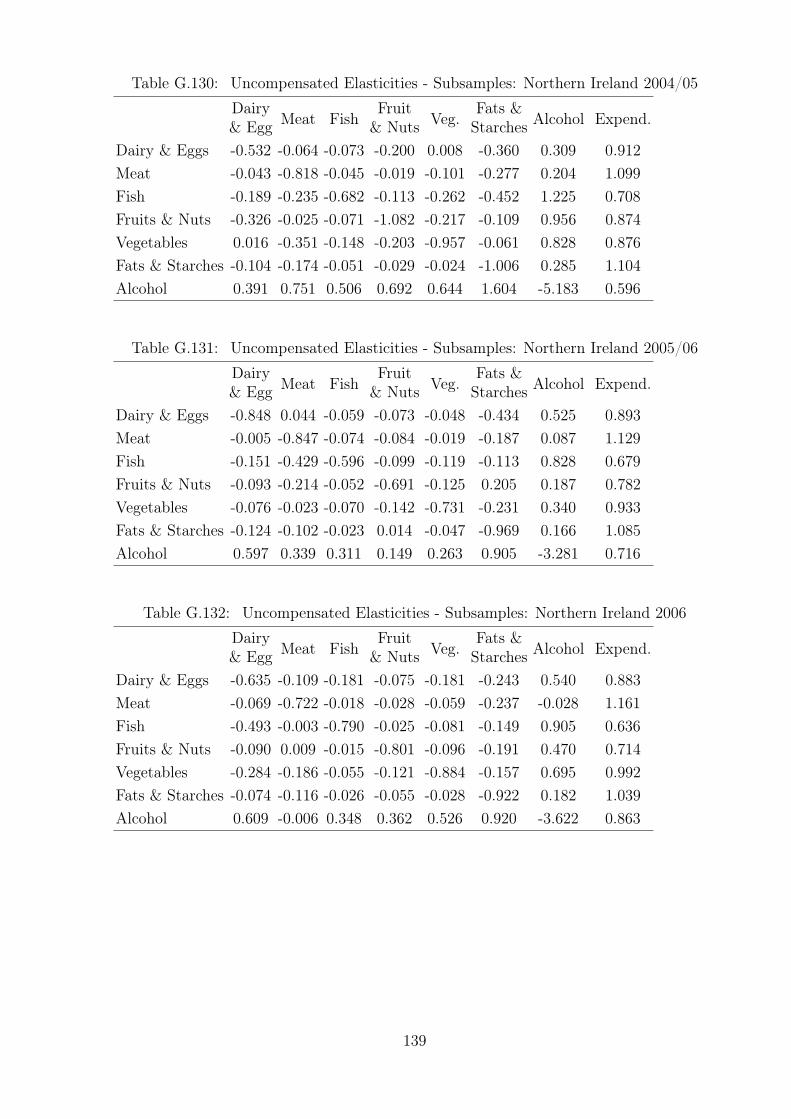
Table G.130: Uncompensated Elasticities - Subsamples: Northern Ireland 2004/05
DairyMeat Fish
FruitVeg.
Fats &Alcohol Expend.
& Egg & Nuts Starches
Dairy & Eggs -0.532 -0.064 -0.073 -0.200 0.008 -0.360 0.309 0.912
Meat -0.043 -0.818 -0.045 -0.019 -0.101 -0.277 0.204 1.099
Fish -0.189 -0.235 -0.682 -0.113 -0.262 -0.452 1.225 0.708
Fruits & Nuts -0.326 -0.025 -0.071 -1.082 -0.217 -0.109 0.956 0.874
Vegetables 0.016 -0.351 -0.148 -0.203 -0.957 -0.061 0.828 0.876
Fats & Starches -0.104 -0.174 -0.051 -0.029 -0.024 -1.006 0.285 1.104
Alcohol 0.391 0.751 0.506 0.692 0.644 1.604 -5.183 0.596
Table G.131: Uncompensated Elasticities - Subsamples: Northern Ireland 2005/06
DairyMeat Fish
FruitVeg.
Fats &Alcohol Expend.
& Egg & Nuts Starches
Dairy & Eggs -0.848 0.044 -0.059 -0.073 -0.048 -0.434 0.525 0.893
Meat -0.005 -0.847 -0.074 -0.084 -0.019 -0.187 0.087 1.129
Fish -0.151 -0.429 -0.596 -0.099 -0.119 -0.113 0.828 0.679
Fruits & Nuts -0.093 -0.214 -0.052 -0.691 -0.125 0.205 0.187 0.782
Vegetables -0.076 -0.023 -0.070 -0.142 -0.731 -0.231 0.340 0.933
Fats & Starches -0.124 -0.102 -0.023 0.014 -0.047 -0.969 0.166 1.085
Alcohol 0.597 0.339 0.311 0.149 0.263 0.905 -3.281 0.716
Table G.132: Uncompensated Elasticities - Subsamples: Northern Ireland 2006
DairyMeat Fish
FruitVeg.
Fats &Alcohol Expend.
& Egg & Nuts Starches
Dairy & Eggs -0.635 -0.109 -0.181 -0.075 -0.181 -0.243 0.540 0.883
Meat -0.069 -0.722 -0.018 -0.028 -0.059 -0.237 -0.028 1.161
Fish -0.493 -0.003 -0.790 -0.025 -0.081 -0.149 0.905 0.636
Fruits & Nuts -0.090 0.009 -0.015 -0.801 -0.096 -0.191 0.470 0.714
Vegetables -0.284 -0.186 -0.055 -0.121 -0.884 -0.157 0.695 0.992
Fats & Starches -0.074 -0.116 -0.026 -0.055 -0.028 -0.922 0.182 1.039
Alcohol 0.609 -0.006 0.348 0.362 0.526 0.920 -3.622 0.863
139

Table G.133: Uncompensated Elasticities - Subsamples: Northern Ireland 2007
DairyMeat Fish
FruitVeg.
Fats &Alcohol Expend.
& Egg & Nuts Starches
Dairy & Eggs -0.574 0.038 -0.108 -0.183 -0.234 -0.060 0.251 0.868
Meat -0.010 -0.839 -0.058 -0.020 -0.034 -0.278 0.113 1.126
Fish -0.269 -0.307 -0.671 -0.096 -0.147 -0.253 1.165 0.578
Fruits & Nuts -0.231 -0.015 -0.054 -0.863 -0.165 0.029 0.393 0.905
Vegetables -0.336 -0.077 -0.087 -0.188 -0.832 0.052 0.581 0.889
Fats & Starches -0.030 -0.159 -0.036 -0.006 -0.002 -0.963 0.140 1.057
Alcohol 0.261 0.402 0.427 0.328 0.419 0.731 -3.396 0.828
Table G.134: Uncompensated Elasticities - Subsamples: Northern Ireland 2008
DairyMeat Fish
FruitVeg.
Fats &Alcohol Expend.
& Egg & Nuts Starches
Dairy & Eggs -0.637 -0.080 -0.129 -0.206 -0.089 -0.154 0.336 0.959
Meat -0.052 -0.742 -0.030 0.076 -0.019 -0.424 0.066 1.125
Fish -0.320 -0.055 -0.608 0.030 -0.242 0.161 0.502 0.532
Fruits & Nuts -0.301 0.333 0.004 -0.955 -0.175 0.092 0.140 0.862
Vegetables -0.140 -0.023 -0.152 -0.190 -0.811 -0.025 0.403 0.937
Fats & Starches -0.055 -0.257 -0.006 0.000 -0.015 -0.898 0.136 1.095
Alcohol 0.435 0.303 0.208 0.126 0.321 0.786 -2.810 0.630
Table G.135: Uncompensated Elasticities - Subsamples: Northern Ireland 2009
DairyMeat Fish
FruitVeg.
Fats &Alcohol Expend.
& Egg & Nuts Starches
Dairy & Eggs -0.821 -0.039 -0.121 -0.153 -0.227 -0.178 0.681 0.859
Meat -0.048 -0.987 -0.065 0.040 0.002 -0.378 0.255 1.181
Fish -0.344 -0.357 -0.584 -0.109 0.005 -0.049 0.799 0.639
Fruits & Nuts -0.249 0.214 -0.066 -1.035 -0.106 -0.188 0.491 0.938
Vegetables -0.348 0.082 -0.005 -0.098 -0.942 -0.076 0.510 0.877
Fats & Starches -0.065 -0.202 -0.018 -0.038 -0.025 -0.854 0.125 1.077
Alcohol 0.758 0.822 0.285 0.358 0.379 0.749 -3.938 0.587
140
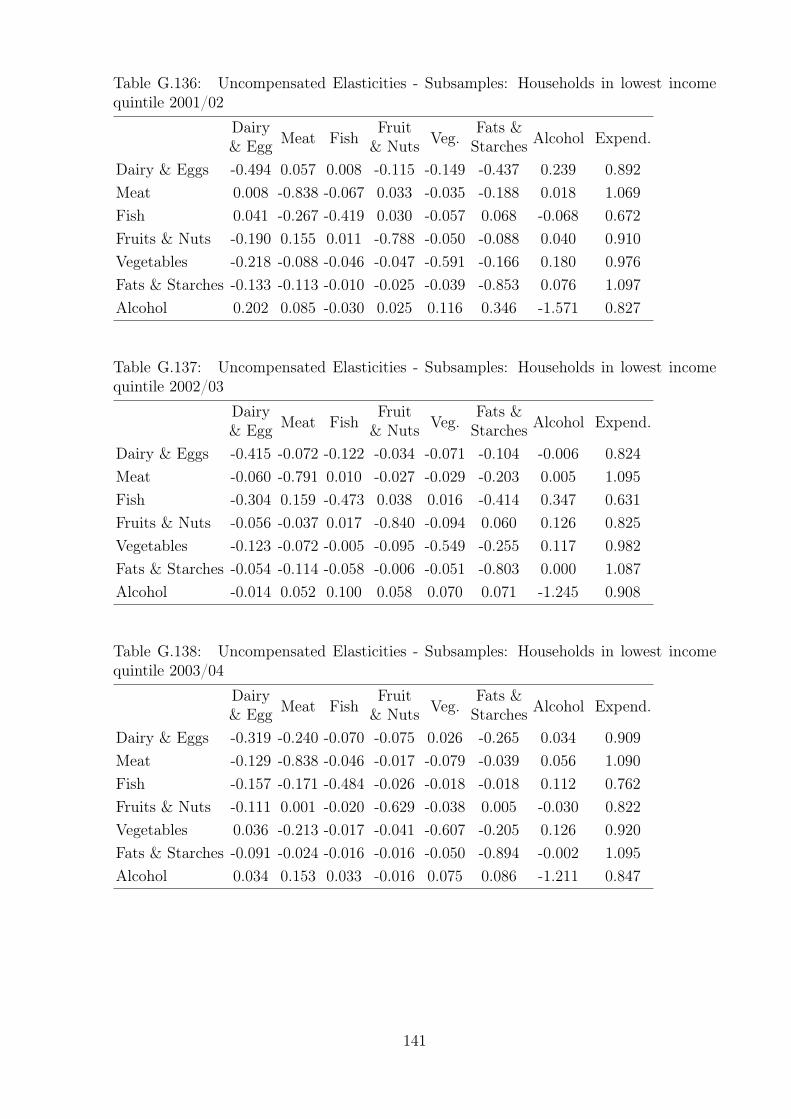
Table G.136: Uncompensated Elasticities - Subsamples: Households in lowest incomequintile 2001/02
DairyMeat Fish
FruitVeg.
Fats &Alcohol Expend.
& Egg & Nuts Starches
Dairy & Eggs -0.494 0.057 0.008 -0.115 -0.149 -0.437 0.239 0.892
Meat 0.008 -0.838 -0.067 0.033 -0.035 -0.188 0.018 1.069
Fish 0.041 -0.267 -0.419 0.030 -0.057 0.068 -0.068 0.672
Fruits & Nuts -0.190 0.155 0.011 -0.788 -0.050 -0.088 0.040 0.910
Vegetables -0.218 -0.088 -0.046 -0.047 -0.591 -0.166 0.180 0.976
Fats & Starches -0.133 -0.113 -0.010 -0.025 -0.039 -0.853 0.076 1.097
Alcohol 0.202 0.085 -0.030 0.025 0.116 0.346 -1.571 0.827
Table G.137: Uncompensated Elasticities - Subsamples: Households in lowest incomequintile 2002/03
DairyMeat Fish
FruitVeg.
Fats &Alcohol Expend.
& Egg & Nuts Starches
Dairy & Eggs -0.415 -0.072 -0.122 -0.034 -0.071 -0.104 -0.006 0.824
Meat -0.060 -0.791 0.010 -0.027 -0.029 -0.203 0.005 1.095
Fish -0.304 0.159 -0.473 0.038 0.016 -0.414 0.347 0.631
Fruits & Nuts -0.056 -0.037 0.017 -0.840 -0.094 0.060 0.126 0.825
Vegetables -0.123 -0.072 -0.005 -0.095 -0.549 -0.255 0.117 0.982
Fats & Starches -0.054 -0.114 -0.058 -0.006 -0.051 -0.803 0.000 1.087
Alcohol -0.014 0.052 0.100 0.058 0.070 0.071 -1.245 0.908
Table G.138: Uncompensated Elasticities - Subsamples: Households in lowest incomequintile 2003/04
DairyMeat Fish
FruitVeg.
Fats &Alcohol Expend.
& Egg & Nuts Starches
Dairy & Eggs -0.319 -0.240 -0.070 -0.075 0.026 -0.265 0.034 0.909
Meat -0.129 -0.838 -0.046 -0.017 -0.079 -0.039 0.056 1.090
Fish -0.157 -0.171 -0.484 -0.026 -0.018 -0.018 0.112 0.762
Fruits & Nuts -0.111 0.001 -0.020 -0.629 -0.038 0.005 -0.030 0.822
Vegetables 0.036 -0.213 -0.017 -0.041 -0.607 -0.205 0.126 0.920
Fats & Starches -0.091 -0.024 -0.016 -0.016 -0.050 -0.894 -0.002 1.095
Alcohol 0.034 0.153 0.033 -0.016 0.075 0.086 -1.211 0.847
141
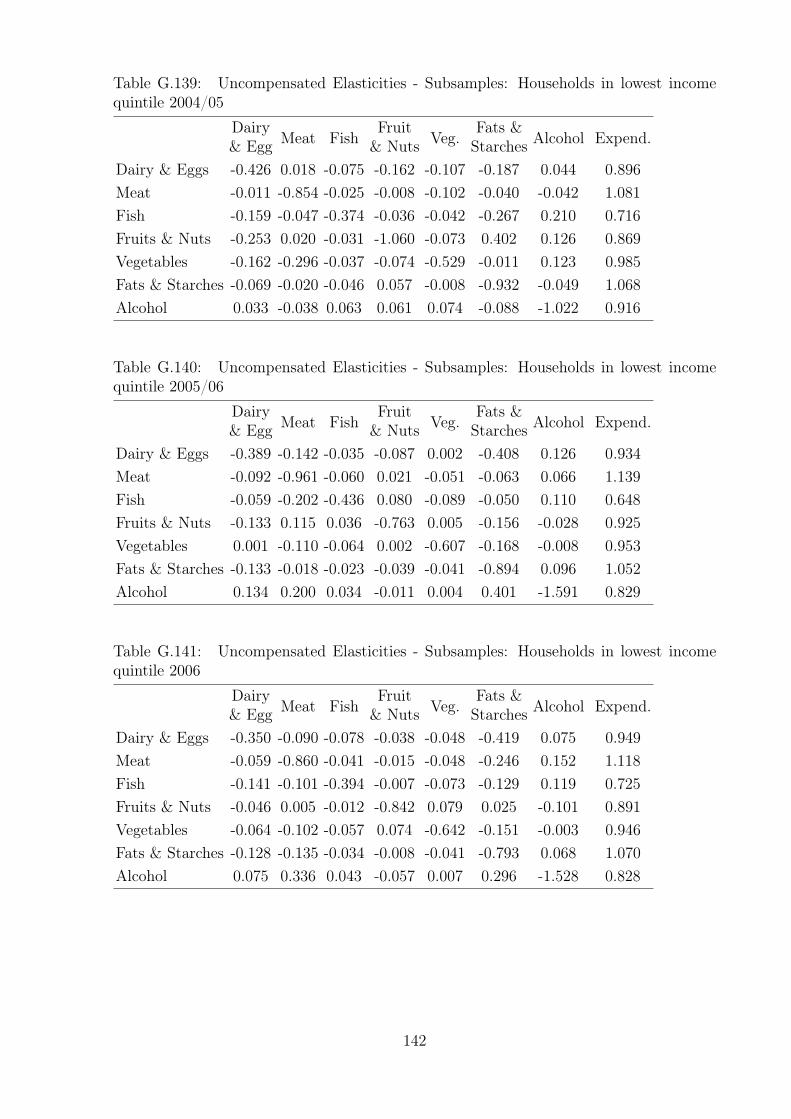
Table G.139: Uncompensated Elasticities - Subsamples: Households in lowest incomequintile 2004/05
DairyMeat Fish
FruitVeg.
Fats &Alcohol Expend.
& Egg & Nuts Starches
Dairy & Eggs -0.426 0.018 -0.075 -0.162 -0.107 -0.187 0.044 0.896
Meat -0.011 -0.854 -0.025 -0.008 -0.102 -0.040 -0.042 1.081
Fish -0.159 -0.047 -0.374 -0.036 -0.042 -0.267 0.210 0.716
Fruits & Nuts -0.253 0.020 -0.031 -1.060 -0.073 0.402 0.126 0.869
Vegetables -0.162 -0.296 -0.037 -0.074 -0.529 -0.011 0.123 0.985
Fats & Starches -0.069 -0.020 -0.046 0.057 -0.008 -0.932 -0.049 1.068
Alcohol 0.033 -0.038 0.063 0.061 0.074 -0.088 -1.022 0.916
Table G.140: Uncompensated Elasticities - Subsamples: Households in lowest incomequintile 2005/06
DairyMeat Fish
FruitVeg.
Fats &Alcohol Expend.
& Egg & Nuts Starches
Dairy & Eggs -0.389 -0.142 -0.035 -0.087 0.002 -0.408 0.126 0.934
Meat -0.092 -0.961 -0.060 0.021 -0.051 -0.063 0.066 1.139
Fish -0.059 -0.202 -0.436 0.080 -0.089 -0.050 0.110 0.648
Fruits & Nuts -0.133 0.115 0.036 -0.763 0.005 -0.156 -0.028 0.925
Vegetables 0.001 -0.110 -0.064 0.002 -0.607 -0.168 -0.008 0.953
Fats & Starches -0.133 -0.018 -0.023 -0.039 -0.041 -0.894 0.096 1.052
Alcohol 0.134 0.200 0.034 -0.011 0.004 0.401 -1.591 0.829
Table G.141: Uncompensated Elasticities - Subsamples: Households in lowest incomequintile 2006
DairyMeat Fish
FruitVeg.
Fats &Alcohol Expend.
& Egg & Nuts Starches
Dairy & Eggs -0.350 -0.090 -0.078 -0.038 -0.048 -0.419 0.075 0.949
Meat -0.059 -0.860 -0.041 -0.015 -0.048 -0.246 0.152 1.118
Fish -0.141 -0.101 -0.394 -0.007 -0.073 -0.129 0.119 0.725
Fruits & Nuts -0.046 0.005 -0.012 -0.842 0.079 0.025 -0.101 0.891
Vegetables -0.064 -0.102 -0.057 0.074 -0.642 -0.151 -0.003 0.946
Fats & Starches -0.128 -0.135 -0.034 -0.008 -0.041 -0.793 0.068 1.070
Alcohol 0.075 0.336 0.043 -0.057 0.007 0.296 -1.528 0.828
142
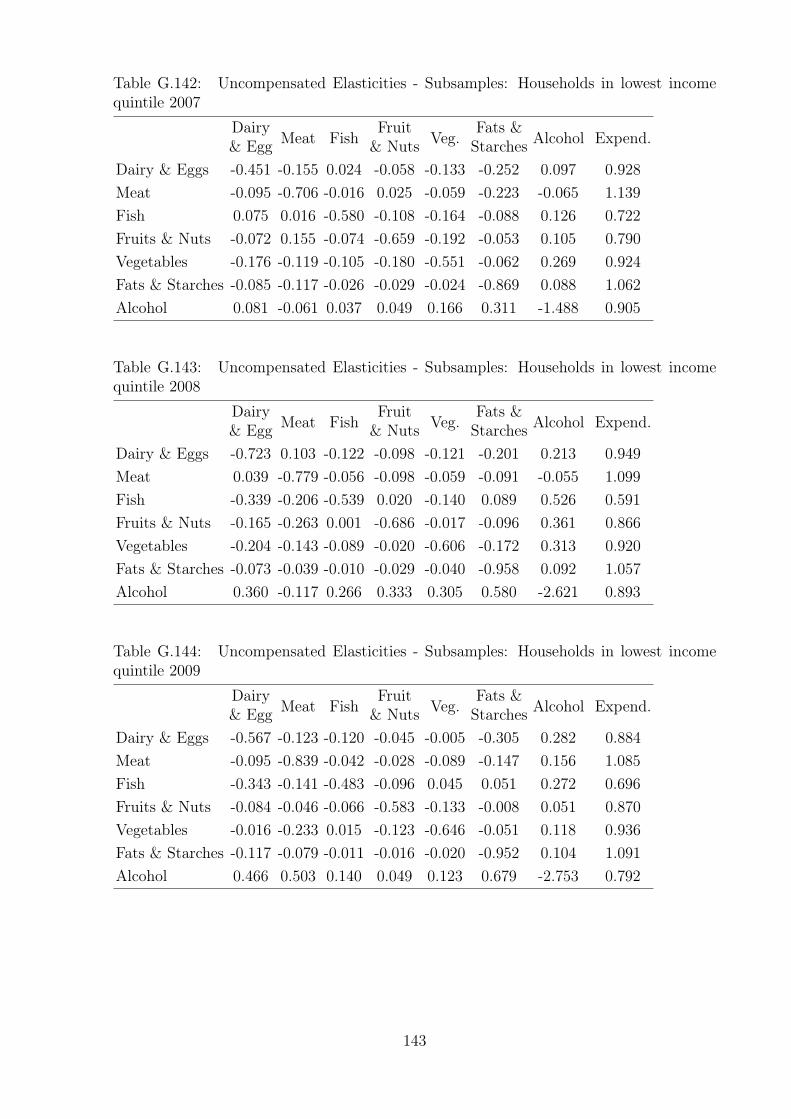
Table G.142: Uncompensated Elasticities - Subsamples: Households in lowest incomequintile 2007
DairyMeat Fish
FruitVeg.
Fats &Alcohol Expend.
& Egg & Nuts Starches
Dairy & Eggs -0.451 -0.155 0.024 -0.058 -0.133 -0.252 0.097 0.928
Meat -0.095 -0.706 -0.016 0.025 -0.059 -0.223 -0.065 1.139
Fish 0.075 0.016 -0.580 -0.108 -0.164 -0.088 0.126 0.722
Fruits & Nuts -0.072 0.155 -0.074 -0.659 -0.192 -0.053 0.105 0.790
Vegetables -0.176 -0.119 -0.105 -0.180 -0.551 -0.062 0.269 0.924
Fats & Starches -0.085 -0.117 -0.026 -0.029 -0.024 -0.869 0.088 1.062
Alcohol 0.081 -0.061 0.037 0.049 0.166 0.311 -1.488 0.905
Table G.143: Uncompensated Elasticities - Subsamples: Households in lowest incomequintile 2008
DairyMeat Fish
FruitVeg.
Fats &Alcohol Expend.
& Egg & Nuts Starches
Dairy & Eggs -0.723 0.103 -0.122 -0.098 -0.121 -0.201 0.213 0.949
Meat 0.039 -0.779 -0.056 -0.098 -0.059 -0.091 -0.055 1.099
Fish -0.339 -0.206 -0.539 0.020 -0.140 0.089 0.526 0.591
Fruits & Nuts -0.165 -0.263 0.001 -0.686 -0.017 -0.096 0.361 0.866
Vegetables -0.204 -0.143 -0.089 -0.020 -0.606 -0.172 0.313 0.920
Fats & Starches -0.073 -0.039 -0.010 -0.029 -0.040 -0.958 0.092 1.057
Alcohol 0.360 -0.117 0.266 0.333 0.305 0.580 -2.621 0.893
Table G.144: Uncompensated Elasticities - Subsamples: Households in lowest incomequintile 2009
DairyMeat Fish
FruitVeg.
Fats &Alcohol Expend.
& Egg & Nuts Starches
Dairy & Eggs -0.567 -0.123 -0.120 -0.045 -0.005 -0.305 0.282 0.884
Meat -0.095 -0.839 -0.042 -0.028 -0.089 -0.147 0.156 1.085
Fish -0.343 -0.141 -0.483 -0.096 0.045 0.051 0.272 0.696
Fruits & Nuts -0.084 -0.046 -0.066 -0.583 -0.133 -0.008 0.051 0.870
Vegetables -0.016 -0.233 0.015 -0.123 -0.646 -0.051 0.118 0.936
Fats & Starches -0.117 -0.079 -0.011 -0.016 -0.020 -0.952 0.104 1.091
Alcohol 0.466 0.503 0.140 0.049 0.123 0.679 -2.753 0.792
143
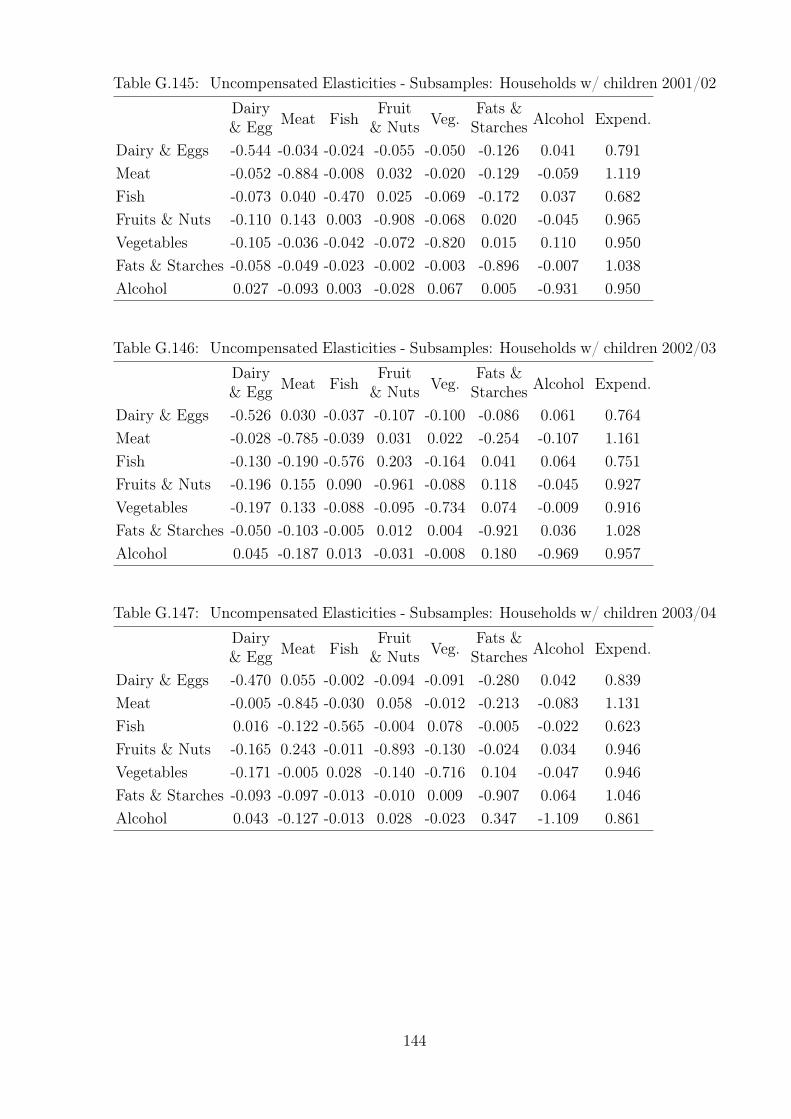
Table G.145: Uncompensated Elasticities - Subsamples: Households w/ children 2001/02
DairyMeat Fish
FruitVeg.
Fats &Alcohol Expend.
& Egg & Nuts Starches
Dairy & Eggs -0.544 -0.034 -0.024 -0.055 -0.050 -0.126 0.041 0.791
Meat -0.052 -0.884 -0.008 0.032 -0.020 -0.129 -0.059 1.119
Fish -0.073 0.040 -0.470 0.025 -0.069 -0.172 0.037 0.682
Fruits & Nuts -0.110 0.143 0.003 -0.908 -0.068 0.020 -0.045 0.965
Vegetables -0.105 -0.036 -0.042 -0.072 -0.820 0.015 0.110 0.950
Fats & Starches -0.058 -0.049 -0.023 -0.002 -0.003 -0.896 -0.007 1.038
Alcohol 0.027 -0.093 0.003 -0.028 0.067 0.005 -0.931 0.950
Table G.146: Uncompensated Elasticities - Subsamples: Households w/ children 2002/03
DairyMeat Fish
FruitVeg.
Fats &Alcohol Expend.
& Egg & Nuts Starches
Dairy & Eggs -0.526 0.030 -0.037 -0.107 -0.100 -0.086 0.061 0.764
Meat -0.028 -0.785 -0.039 0.031 0.022 -0.254 -0.107 1.161
Fish -0.130 -0.190 -0.576 0.203 -0.164 0.041 0.064 0.751
Fruits & Nuts -0.196 0.155 0.090 -0.961 -0.088 0.118 -0.045 0.927
Vegetables -0.197 0.133 -0.088 -0.095 -0.734 0.074 -0.009 0.916
Fats & Starches -0.050 -0.103 -0.005 0.012 0.004 -0.921 0.036 1.028
Alcohol 0.045 -0.187 0.013 -0.031 -0.008 0.180 -0.969 0.957
Table G.147: Uncompensated Elasticities - Subsamples: Households w/ children 2003/04
DairyMeat Fish
FruitVeg.
Fats &Alcohol Expend.
& Egg & Nuts Starches
Dairy & Eggs -0.470 0.055 -0.002 -0.094 -0.091 -0.280 0.042 0.839
Meat -0.005 -0.845 -0.030 0.058 -0.012 -0.213 -0.083 1.131
Fish 0.016 -0.122 -0.565 -0.004 0.078 -0.005 -0.022 0.623
Fruits & Nuts -0.165 0.243 -0.011 -0.893 -0.130 -0.024 0.034 0.946
Vegetables -0.171 -0.005 0.028 -0.140 -0.716 0.104 -0.047 0.946
Fats & Starches -0.093 -0.097 -0.013 -0.010 0.009 -0.907 0.064 1.046
Alcohol 0.043 -0.127 -0.013 0.028 -0.023 0.347 -1.109 0.861
144

Table G.148: Uncompensated Elasticities - Subsamples: Households w/ children 2004/05
DairyMeat Fish
FruitVeg.
Fats &Alcohol Expend.
& Egg & Nuts Starches
Dairy & Eggs -0.455 0.002 0.000 -0.075 -0.127 -0.171 0.032 0.795
Meat -0.034 -0.871 -0.050 -0.008 -0.013 -0.120 -0.031 1.128
Fish 0.007 -0.294 -0.570 0.036 -0.041 0.068 0.069 0.725
Fruits & Nuts -0.133 0.022 0.011 -0.942 -0.006 0.097 0.038 0.915
Vegetables -0.241 -0.007 -0.026 -0.009 -0.745 -0.015 0.104 0.939
Fats & Starches -0.069 -0.044 -0.004 0.008 -0.008 -0.897 -0.020 1.035
Alcohol 0.015 -0.030 0.012 0.021 0.058 -0.051 -0.988 0.964
Table G.149: Uncompensated Elasticities - Subsamples: Households w/ children 2005/06
DairyMeat Fish
FruitVeg.
Fats &Alcohol Expend.
& Egg & Nuts Starches
Dairy & Eggs -0.488 -0.037 -0.049 -0.118 -0.038 -0.215 0.125 0.821
Meat -0.053 -0.958 -0.027 0.026 -0.020 -0.060 -0.044 1.136
Fish -0.150 -0.085 -0.553 0.023 -0.075 0.146 -0.007 0.701
Fruits & Nuts -0.183 0.111 0.002 -0.858 -0.039 0.137 -0.123 0.954
Vegetables -0.073 -0.016 -0.044 -0.042 -0.808 0.147 -0.076 0.913
Fats & Starches -0.081 -0.009 0.001 0.020 0.016 -1.045 0.067 1.031
Alcohol 0.115 -0.057 -0.011 -0.093 -0.053 0.283 -1.157 0.972
Table G.150: Uncompensated Elasticities - Subsamples: Households w/ children 2006
DairyMeat Fish
FruitVeg.
Fats &Alcohol Expend.
& Egg & Nuts Starches
Dairy & Eggs -0.697 -0.027 -0.069 -0.044 -0.053 -0.078 0.093 0.874
Meat -0.042 -0.938 -0.031 0.046 -0.041 -0.130 -0.006 1.143
Fish -0.215 -0.123 -0.605 0.097 -0.102 0.149 0.061 0.737
Fruits & Nuts -0.066 0.172 0.033 -0.792 0.012 -0.159 -0.128 0.929
Vegetables -0.085 -0.081 -0.051 0.009 -0.694 -0.053 -0.014 0.969
Fats & Starches -0.037 -0.046 0.003 -0.040 -0.014 -0.914 0.032 1.015
Alcohol 0.094 0.033 0.013 -0.102 -0.008 0.156 -1.115 0.928
145
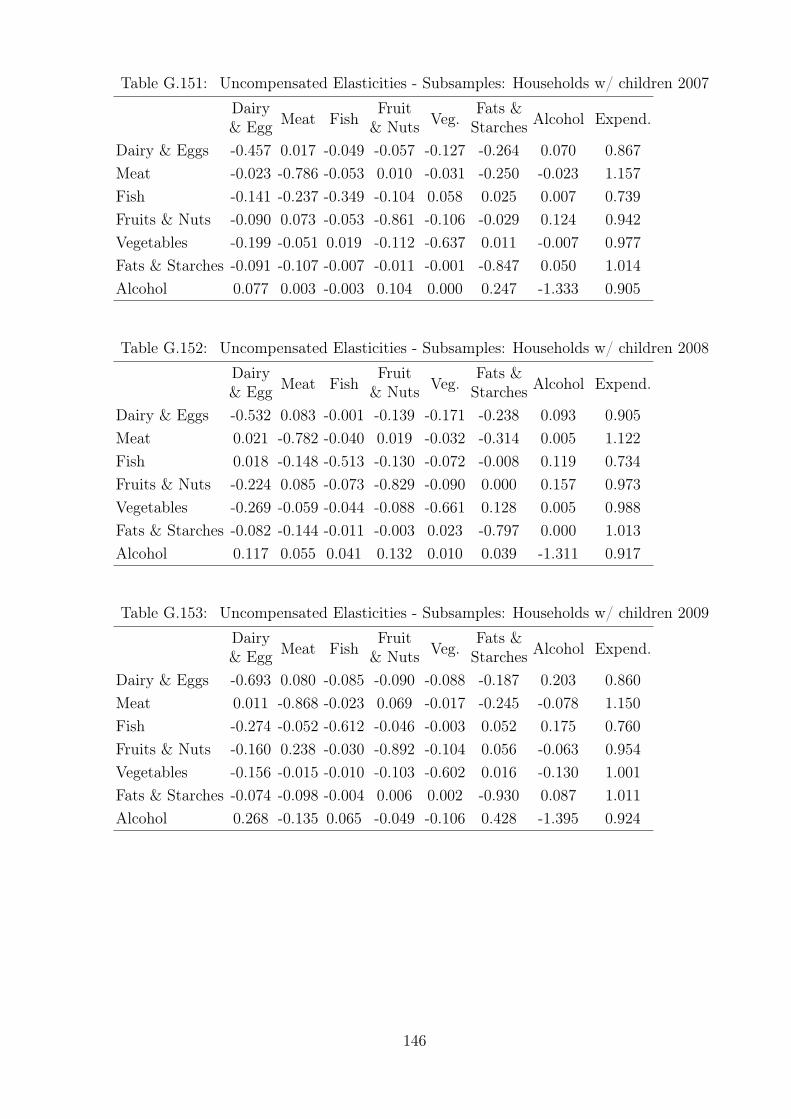
Table G.151: Uncompensated Elasticities - Subsamples: Households w/ children 2007
DairyMeat Fish
FruitVeg.
Fats &Alcohol Expend.
& Egg & Nuts Starches
Dairy & Eggs -0.457 0.017 -0.049 -0.057 -0.127 -0.264 0.070 0.867
Meat -0.023 -0.786 -0.053 0.010 -0.031 -0.250 -0.023 1.157
Fish -0.141 -0.237 -0.349 -0.104 0.058 0.025 0.007 0.739
Fruits & Nuts -0.090 0.073 -0.053 -0.861 -0.106 -0.029 0.124 0.942
Vegetables -0.199 -0.051 0.019 -0.112 -0.637 0.011 -0.007 0.977
Fats & Starches -0.091 -0.107 -0.007 -0.011 -0.001 -0.847 0.050 1.014
Alcohol 0.077 0.003 -0.003 0.104 0.000 0.247 -1.333 0.905
Table G.152: Uncompensated Elasticities - Subsamples: Households w/ children 2008
DairyMeat Fish
FruitVeg.
Fats &Alcohol Expend.
& Egg & Nuts Starches
Dairy & Eggs -0.532 0.083 -0.001 -0.139 -0.171 -0.238 0.093 0.905
Meat 0.021 -0.782 -0.040 0.019 -0.032 -0.314 0.005 1.122
Fish 0.018 -0.148 -0.513 -0.130 -0.072 -0.008 0.119 0.734
Fruits & Nuts -0.224 0.085 -0.073 -0.829 -0.090 0.000 0.157 0.973
Vegetables -0.269 -0.059 -0.044 -0.088 -0.661 0.128 0.005 0.988
Fats & Starches -0.082 -0.144 -0.011 -0.003 0.023 -0.797 0.000 1.013
Alcohol 0.117 0.055 0.041 0.132 0.010 0.039 -1.311 0.917
Table G.153: Uncompensated Elasticities - Subsamples: Households w/ children 2009
DairyMeat Fish
FruitVeg.
Fats &Alcohol Expend.
& Egg & Nuts Starches
Dairy & Eggs -0.693 0.080 -0.085 -0.090 -0.088 -0.187 0.203 0.860
Meat 0.011 -0.868 -0.023 0.069 -0.017 -0.245 -0.078 1.150
Fish -0.274 -0.052 -0.612 -0.046 -0.003 0.052 0.175 0.760
Fruits & Nuts -0.160 0.238 -0.030 -0.892 -0.104 0.056 -0.063 0.954
Vegetables -0.156 -0.015 -0.010 -0.103 -0.602 0.016 -0.130 1.001
Fats & Starches -0.074 -0.098 -0.004 0.006 0.002 -0.930 0.087 1.011
Alcohol 0.268 -0.135 0.065 -0.049 -0.106 0.428 -1.395 0.924
146
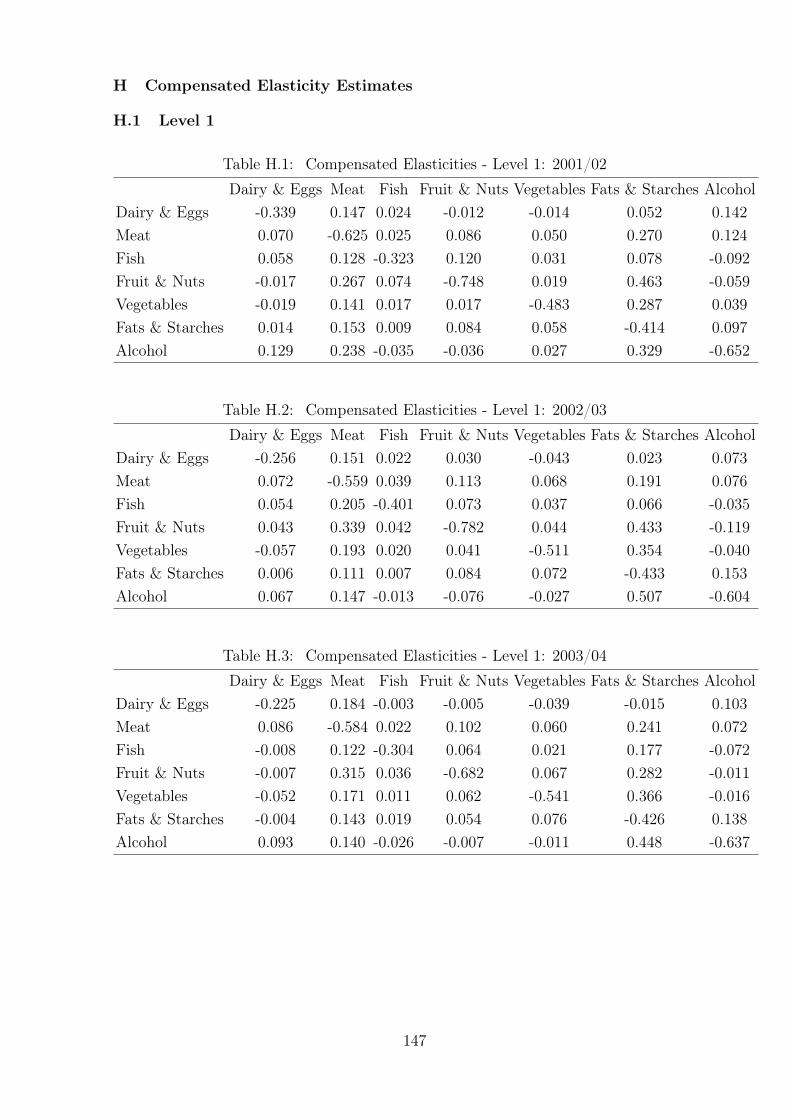
H Compensated Elasticity Estimates
H.1 Level 1
Table H.1: Compensated Elasticities - Level 1: 2001/02
Dairy & Eggs Meat Fish Fruit & Nuts Vegetables Fats & Starches Alcohol
Dairy & Eggs -0.339 0.147 0.024 -0.012 -0.014 0.052 0.142
Meat 0.070 -0.625 0.025 0.086 0.050 0.270 0.124
Fish 0.058 0.128 -0.323 0.120 0.031 0.078 -0.092
Fruit & Nuts -0.017 0.267 0.074 -0.748 0.019 0.463 -0.059
Vegetables -0.019 0.141 0.017 0.017 -0.483 0.287 0.039
Fats & Starches 0.014 0.153 0.009 0.084 0.058 -0.414 0.097
Alcohol 0.129 0.238 -0.035 -0.036 0.027 0.329 -0.652
Table H.2: Compensated Elasticities - Level 1: 2002/03
Dairy & Eggs Meat Fish Fruit & Nuts Vegetables Fats & Starches Alcohol
Dairy & Eggs -0.256 0.151 0.022 0.030 -0.043 0.023 0.073
Meat 0.072 -0.559 0.039 0.113 0.068 0.191 0.076
Fish 0.054 0.205 -0.401 0.073 0.037 0.066 -0.035
Fruit & Nuts 0.043 0.339 0.042 -0.782 0.044 0.433 -0.119
Vegetables -0.057 0.193 0.020 0.041 -0.511 0.354 -0.040
Fats & Starches 0.006 0.111 0.007 0.084 0.072 -0.433 0.153
Alcohol 0.067 0.147 -0.013 -0.076 -0.027 0.507 -0.604
Table H.3: Compensated Elasticities - Level 1: 2003/04
Dairy & Eggs Meat Fish Fruit & Nuts Vegetables Fats & Starches Alcohol
Dairy & Eggs -0.225 0.184 -0.003 -0.005 -0.039 -0.015 0.103
Meat 0.086 -0.584 0.022 0.102 0.060 0.241 0.072
Fish -0.008 0.122 -0.304 0.064 0.021 0.177 -0.072
Fruit & Nuts -0.007 0.315 0.036 -0.682 0.067 0.282 -0.011
Vegetables -0.052 0.171 0.011 0.062 -0.541 0.366 -0.016
Fats & Starches -0.004 0.143 0.019 0.054 0.076 -0.426 0.138
Alcohol 0.093 0.140 -0.026 -0.007 -0.011 0.448 -0.637
147

Table H.4: Compensated Elasticities - Level 1: 2004/05
Dairy & Eggs Meat Fish Fruit & Nuts Vegetables Fats & Starches Alcohol
Dairy & Eggs -0.341 0.185 0.008 -0.001 -0.009 0.041 0.117
Meat 0.088 -0.562 0.020 0.111 0.035 0.220 0.087
Fish 0.020 0.104 -0.280 0.105 0.029 0.079 -0.058
Fruit & Nuts -0.002 0.333 0.062 -0.754 0.067 0.400 -0.105
Vegetables -0.012 0.099 0.016 0.062 -0.501 0.292 0.044
Fats & Starches 0.011 0.129 0.009 0.078 0.061 -0.424 0.134
Alcohol 0.105 0.165 -0.021 -0.067 0.030 0.433 -0.646
Table H.5: Compensated Elasticities - Level 1: 2005/06
Dairy & Eggs Meat Fish Fruit & Nuts Vegetables Fats & Starches Alcohol
Dairy & Eggs -0.297 0.153 0.007 0.008 0.047 -0.027 0.109
Meat 0.076 -0.588 0.009 0.089 0.066 0.302 0.047
Fish 0.017 0.045 -0.330 0.141 0.038 0.171 -0.081
Fruit & Nuts 0.010 0.235 0.078 -0.686 0.065 0.379 -0.082
Vegetables 0.061 0.171 0.020 0.064 -0.521 0.247 -0.043
Fats & Starches -0.008 0.177 0.021 0.083 0.055 -0.476 0.148
Alcohol 0.101 0.088 -0.031 -0.058 -0.031 0.473 -0.542
Table H.6: Compensated Elasticities - Level 1: 2006
Dairy & Eggs Meat Fish Fruit & Nuts Vegetables Fats & Starches Alcohol
Dairy & Eggs -0.260 0.163 -0.003 -0.023 -0.002 0.005 0.120
Meat 0.080 -0.605 0.030 0.128 0.068 0.209 0.090
Fish -0.006 0.139 -0.376 0.156 0.052 0.149 -0.114
Fruit & Nuts -0.030 0.329 0.086 -0.694 0.049 0.309 -0.048
Vegetables -0.003 0.178 0.029 0.049 -0.537 0.291 -0.008
Fats & Starches 0.001 0.121 0.019 0.070 0.065 -0.407 0.130
Alcohol 0.112 0.171 -0.046 -0.036 -0.006 0.426 -0.622
Table H.7: Compensated Elasticities - Level 1: 2007
Dairy & Eggs Meat Fish Fruit & Nuts Vegetables Fats & Starches Alcohol
Dairy & Eggs -0.305 0.194 0.044 0.004 -0.037 0.018 0.081
Meat 0.096 -0.500 0.005 0.129 0.054 0.182 0.034
Fish 0.102 0.024 -0.279 0.005 0.075 0.152 -0.080
Fruit & Nuts 0.006 0.336 0.003 -0.672 0.025 0.307 -0.005
Vegetables -0.047 0.139 0.041 0.025 -0.465 0.297 0.011
Fats & Starches 0.005 0.106 0.019 0.069 0.068 -0.443 0.177
Alcohol 0.076 0.063 -0.033 -0.004 0.008 0.574 -0.685
148
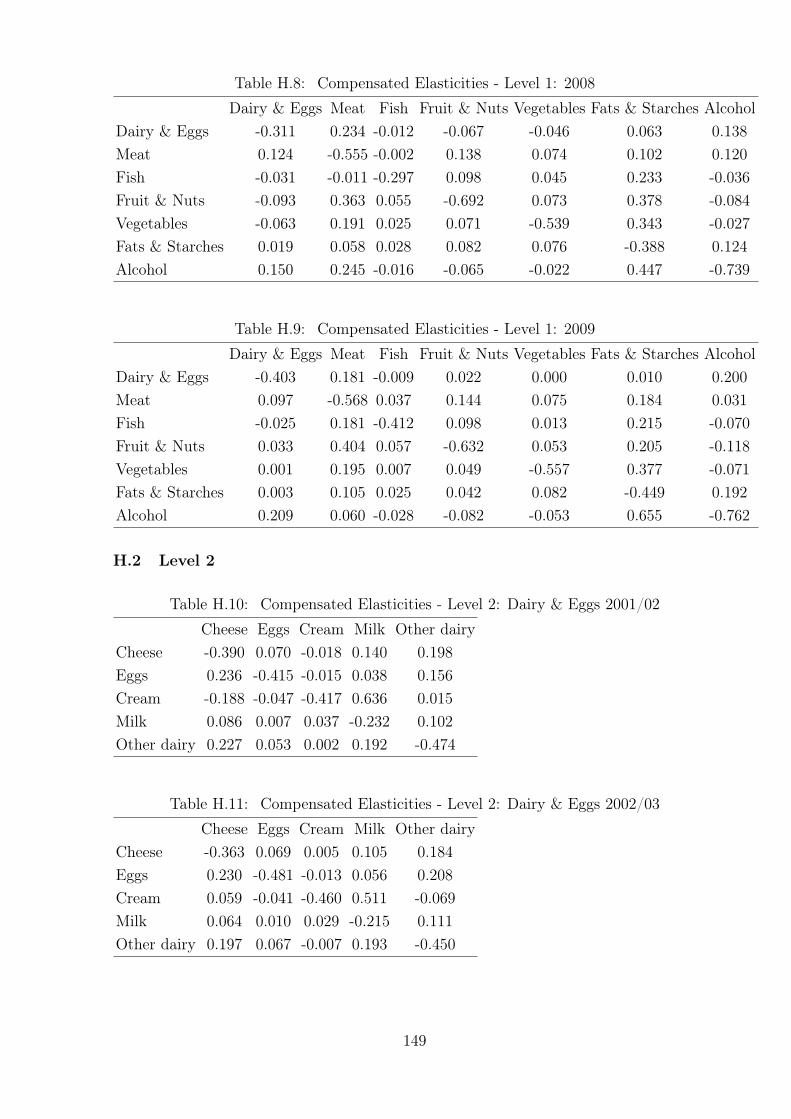
Table H.8: Compensated Elasticities - Level 1: 2008
Dairy & Eggs Meat Fish Fruit & Nuts Vegetables Fats & Starches Alcohol
Dairy & Eggs -0.311 0.234 -0.012 -0.067 -0.046 0.063 0.138
Meat 0.124 -0.555 -0.002 0.138 0.074 0.102 0.120
Fish -0.031 -0.011 -0.297 0.098 0.045 0.233 -0.036
Fruit & Nuts -0.093 0.363 0.055 -0.692 0.073 0.378 -0.084
Vegetables -0.063 0.191 0.025 0.071 -0.539 0.343 -0.027
Fats & Starches 0.019 0.058 0.028 0.082 0.076 -0.388 0.124
Alcohol 0.150 0.245 -0.016 -0.065 -0.022 0.447 -0.739
Table H.9: Compensated Elasticities - Level 1: 2009
Dairy & Eggs Meat Fish Fruit & Nuts Vegetables Fats & Starches Alcohol
Dairy & Eggs -0.403 0.181 -0.009 0.022 0.000 0.010 0.200
Meat 0.097 -0.568 0.037 0.144 0.075 0.184 0.031
Fish -0.025 0.181 -0.412 0.098 0.013 0.215 -0.070
Fruit & Nuts 0.033 0.404 0.057 -0.632 0.053 0.205 -0.118
Vegetables 0.001 0.195 0.007 0.049 -0.557 0.377 -0.071
Fats & Starches 0.003 0.105 0.025 0.042 0.082 -0.449 0.192
Alcohol 0.209 0.060 -0.028 -0.082 -0.053 0.655 -0.762
H.2 Level 2
Table H.10: Compensated Elasticities - Level 2: Dairy & Eggs 2001/02
Cheese Eggs Cream Milk Other dairy
Cheese -0.390 0.070 -0.018 0.140 0.198
Eggs 0.236 -0.415 -0.015 0.038 0.156
Cream -0.188 -0.047 -0.417 0.636 0.015
Milk 0.086 0.007 0.037 -0.232 0.102
Other dairy 0.227 0.053 0.002 0.192 -0.474
Table H.11: Compensated Elasticities - Level 2: Dairy & Eggs 2002/03
Cheese Eggs Cream Milk Other dairy
Cheese -0.363 0.069 0.005 0.105 0.184
Eggs 0.230 -0.481 -0.013 0.056 0.208
Cream 0.059 -0.041 -0.460 0.511 -0.069
Milk 0.064 0.010 0.029 -0.215 0.111
Other dairy 0.197 0.067 -0.007 0.193 -0.450
149
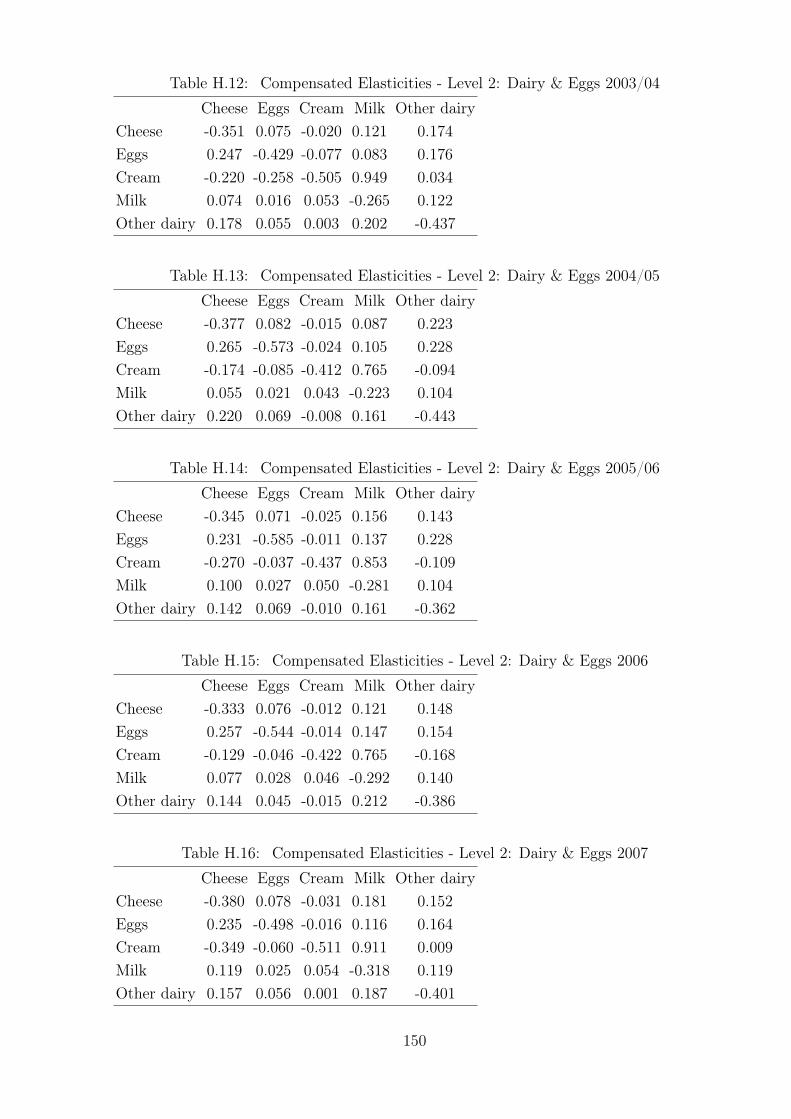
Table H.12: Compensated Elasticities - Level 2: Dairy & Eggs 2003/04
Cheese Eggs Cream Milk Other dairy
Cheese -0.351 0.075 -0.020 0.121 0.174
Eggs 0.247 -0.429 -0.077 0.083 0.176
Cream -0.220 -0.258 -0.505 0.949 0.034
Milk 0.074 0.016 0.053 -0.265 0.122
Other dairy 0.178 0.055 0.003 0.202 -0.437
Table H.13: Compensated Elasticities - Level 2: Dairy & Eggs 2004/05
Cheese Eggs Cream Milk Other dairy
Cheese -0.377 0.082 -0.015 0.087 0.223
Eggs 0.265 -0.573 -0.024 0.105 0.228
Cream -0.174 -0.085 -0.412 0.765 -0.094
Milk 0.055 0.021 0.043 -0.223 0.104
Other dairy 0.220 0.069 -0.008 0.161 -0.443
Table H.14: Compensated Elasticities - Level 2: Dairy & Eggs 2005/06
Cheese Eggs Cream Milk Other dairy
Cheese -0.345 0.071 -0.025 0.156 0.143
Eggs 0.231 -0.585 -0.011 0.137 0.228
Cream -0.270 -0.037 -0.437 0.853 -0.109
Milk 0.100 0.027 0.050 -0.281 0.104
Other dairy 0.142 0.069 -0.010 0.161 -0.362
Table H.15: Compensated Elasticities - Level 2: Dairy & Eggs 2006
Cheese Eggs Cream Milk Other dairy
Cheese -0.333 0.076 -0.012 0.121 0.148
Eggs 0.257 -0.544 -0.014 0.147 0.154
Cream -0.129 -0.046 -0.422 0.765 -0.168
Milk 0.077 0.028 0.046 -0.292 0.140
Other dairy 0.144 0.045 -0.015 0.212 -0.386
Table H.16: Compensated Elasticities - Level 2: Dairy & Eggs 2007
Cheese Eggs Cream Milk Other dairy
Cheese -0.380 0.078 -0.031 0.181 0.152
Eggs 0.235 -0.498 -0.016 0.116 0.164
Cream -0.349 -0.060 -0.511 0.911 0.009
Milk 0.119 0.025 0.054 -0.318 0.119
Other dairy 0.157 0.056 0.001 0.187 -0.401
150
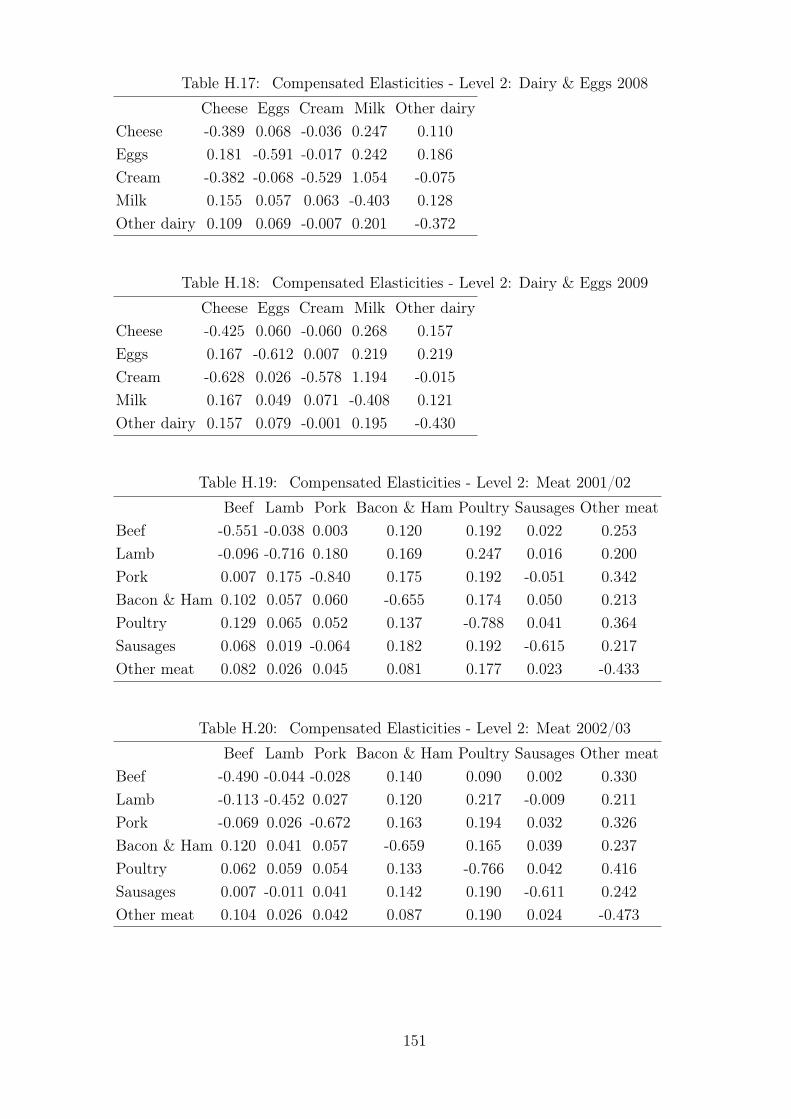
Table H.17: Compensated Elasticities - Level 2: Dairy & Eggs 2008
Cheese Eggs Cream Milk Other dairy
Cheese -0.389 0.068 -0.036 0.247 0.110
Eggs 0.181 -0.591 -0.017 0.242 0.186
Cream -0.382 -0.068 -0.529 1.054 -0.075
Milk 0.155 0.057 0.063 -0.403 0.128
Other dairy 0.109 0.069 -0.007 0.201 -0.372
Table H.18: Compensated Elasticities - Level 2: Dairy & Eggs 2009
Cheese Eggs Cream Milk Other dairy
Cheese -0.425 0.060 -0.060 0.268 0.157
Eggs 0.167 -0.612 0.007 0.219 0.219
Cream -0.628 0.026 -0.578 1.194 -0.015
Milk 0.167 0.049 0.071 -0.408 0.121
Other dairy 0.157 0.079 -0.001 0.195 -0.430
Table H.19: Compensated Elasticities - Level 2: Meat 2001/02
Beef Lamb Pork Bacon & Ham Poultry Sausages Other meat
Beef -0.551 -0.038 0.003 0.120 0.192 0.022 0.253
Lamb -0.096 -0.716 0.180 0.169 0.247 0.016 0.200
Pork 0.007 0.175 -0.840 0.175 0.192 -0.051 0.342
Bacon & Ham 0.102 0.057 0.060 -0.655 0.174 0.050 0.213
Poultry 0.129 0.065 0.052 0.137 -0.788 0.041 0.364
Sausages 0.068 0.019 -0.064 0.182 0.192 -0.615 0.217
Other meat 0.082 0.026 0.045 0.081 0.177 0.023 -0.433
Table H.20: Compensated Elasticities - Level 2: Meat 2002/03
Beef Lamb Pork Bacon & Ham Poultry Sausages Other meat
Beef -0.490 -0.044 -0.028 0.140 0.090 0.002 0.330
Lamb -0.113 -0.452 0.027 0.120 0.217 -0.009 0.211
Pork -0.069 0.026 -0.672 0.163 0.194 0.032 0.326
Bacon & Ham 0.120 0.041 0.057 -0.659 0.165 0.039 0.237
Poultry 0.062 0.059 0.054 0.133 -0.766 0.042 0.416
Sausages 0.007 -0.011 0.041 0.142 0.190 -0.611 0.242
Other meat 0.104 0.026 0.042 0.087 0.190 0.024 -0.473
151
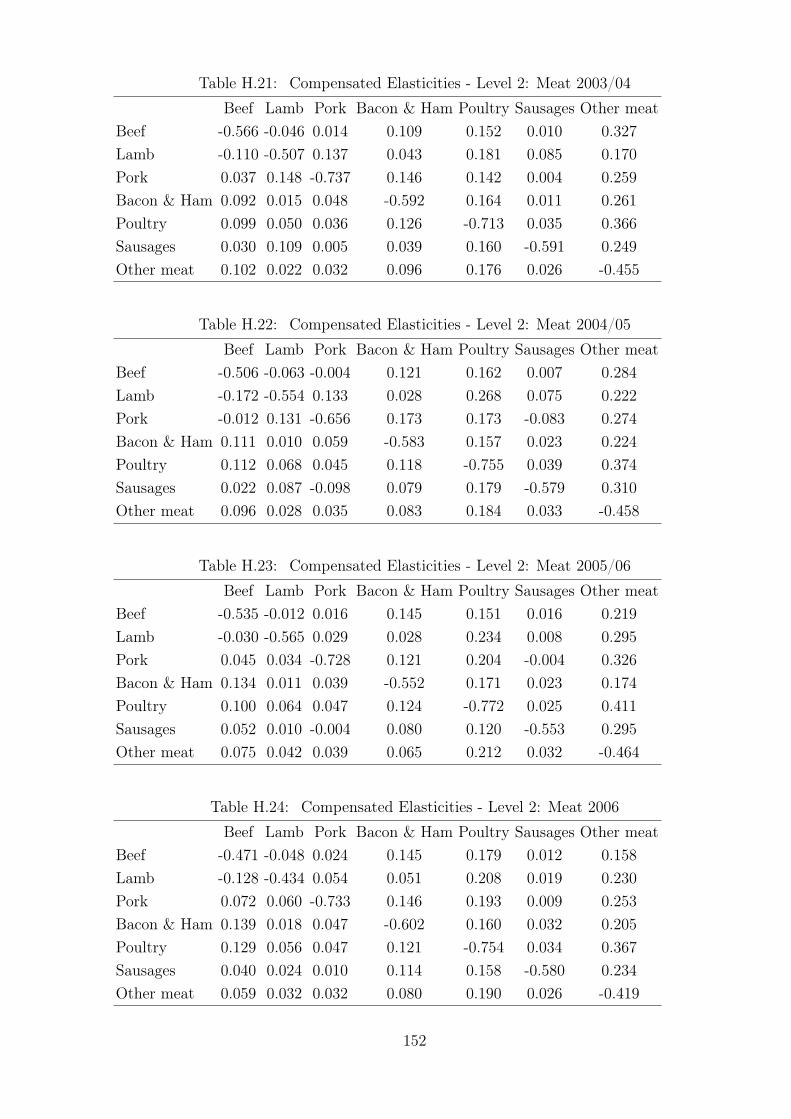
Table H.21: Compensated Elasticities - Level 2: Meat 2003/04
Beef Lamb Pork Bacon & Ham Poultry Sausages Other meat
Beef -0.566 -0.046 0.014 0.109 0.152 0.010 0.327
Lamb -0.110 -0.507 0.137 0.043 0.181 0.085 0.170
Pork 0.037 0.148 -0.737 0.146 0.142 0.004 0.259
Bacon & Ham 0.092 0.015 0.048 -0.592 0.164 0.011 0.261
Poultry 0.099 0.050 0.036 0.126 -0.713 0.035 0.366
Sausages 0.030 0.109 0.005 0.039 0.160 -0.591 0.249
Other meat 0.102 0.022 0.032 0.096 0.176 0.026 -0.455
Table H.22: Compensated Elasticities - Level 2: Meat 2004/05
Beef Lamb Pork Bacon & Ham Poultry Sausages Other meat
Beef -0.506 -0.063 -0.004 0.121 0.162 0.007 0.284
Lamb -0.172 -0.554 0.133 0.028 0.268 0.075 0.222
Pork -0.012 0.131 -0.656 0.173 0.173 -0.083 0.274
Bacon & Ham 0.111 0.010 0.059 -0.583 0.157 0.023 0.224
Poultry 0.112 0.068 0.045 0.118 -0.755 0.039 0.374
Sausages 0.022 0.087 -0.098 0.079 0.179 -0.579 0.310
Other meat 0.096 0.028 0.035 0.083 0.184 0.033 -0.458
Table H.23: Compensated Elasticities - Level 2: Meat 2005/06
Beef Lamb Pork Bacon & Ham Poultry Sausages Other meat
Beef -0.535 -0.012 0.016 0.145 0.151 0.016 0.219
Lamb -0.030 -0.565 0.029 0.028 0.234 0.008 0.295
Pork 0.045 0.034 -0.728 0.121 0.204 -0.004 0.326
Bacon & Ham 0.134 0.011 0.039 -0.552 0.171 0.023 0.174
Poultry 0.100 0.064 0.047 0.124 -0.772 0.025 0.411
Sausages 0.052 0.010 -0.004 0.080 0.120 -0.553 0.295
Other meat 0.075 0.042 0.039 0.065 0.212 0.032 -0.464
Table H.24: Compensated Elasticities - Level 2: Meat 2006
Beef Lamb Pork Bacon & Ham Poultry Sausages Other meat
Beef -0.471 -0.048 0.024 0.145 0.179 0.012 0.158
Lamb -0.128 -0.434 0.054 0.051 0.208 0.019 0.230
Pork 0.072 0.060 -0.733 0.146 0.193 0.009 0.253
Bacon & Ham 0.139 0.018 0.047 -0.602 0.160 0.032 0.205
Poultry 0.129 0.056 0.047 0.121 -0.754 0.034 0.367
Sausages 0.040 0.024 0.010 0.114 0.158 -0.580 0.234
Other meat 0.059 0.032 0.032 0.080 0.190 0.026 -0.419
152
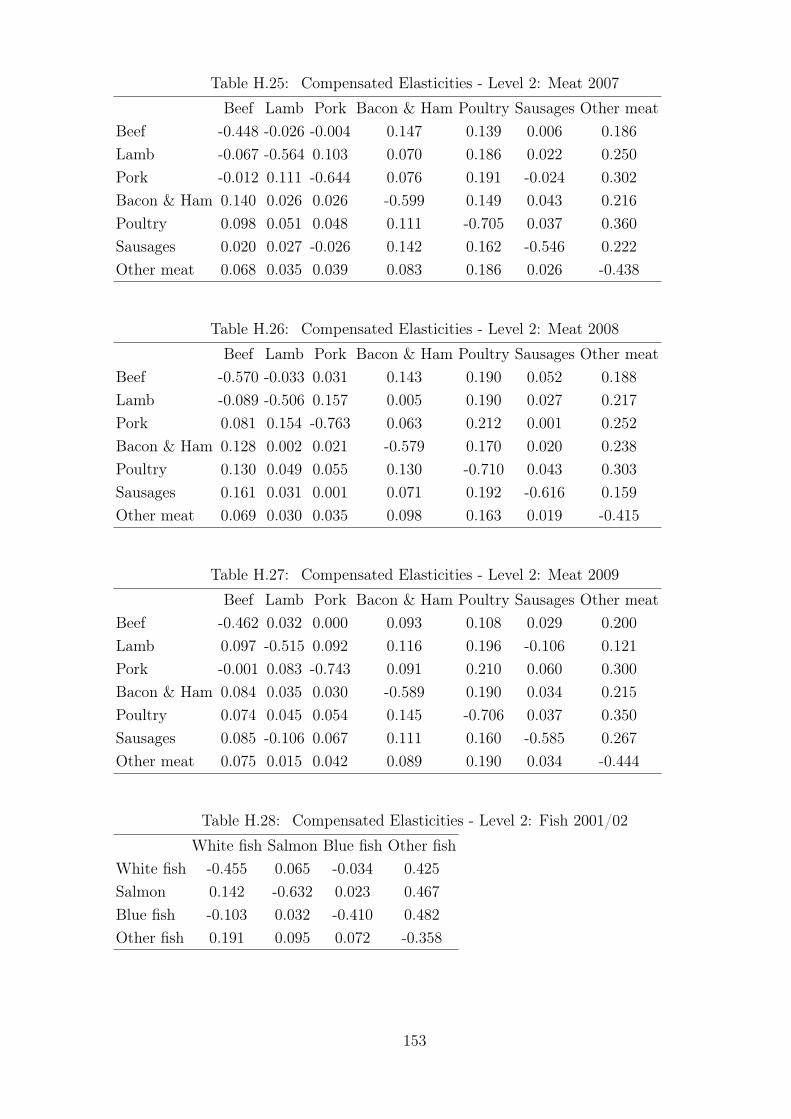
Table H.25: Compensated Elasticities - Level 2: Meat 2007
Beef Lamb Pork Bacon & Ham Poultry Sausages Other meat
Beef -0.448 -0.026 -0.004 0.147 0.139 0.006 0.186
Lamb -0.067 -0.564 0.103 0.070 0.186 0.022 0.250
Pork -0.012 0.111 -0.644 0.076 0.191 -0.024 0.302
Bacon & Ham 0.140 0.026 0.026 -0.599 0.149 0.043 0.216
Poultry 0.098 0.051 0.048 0.111 -0.705 0.037 0.360
Sausages 0.020 0.027 -0.026 0.142 0.162 -0.546 0.222
Other meat 0.068 0.035 0.039 0.083 0.186 0.026 -0.438
Table H.26: Compensated Elasticities - Level 2: Meat 2008
Beef Lamb Pork Bacon & Ham Poultry Sausages Other meat
Beef -0.570 -0.033 0.031 0.143 0.190 0.052 0.188
Lamb -0.089 -0.506 0.157 0.005 0.190 0.027 0.217
Pork 0.081 0.154 -0.763 0.063 0.212 0.001 0.252
Bacon & Ham 0.128 0.002 0.021 -0.579 0.170 0.020 0.238
Poultry 0.130 0.049 0.055 0.130 -0.710 0.043 0.303
Sausages 0.161 0.031 0.001 0.071 0.192 -0.616 0.159
Other meat 0.069 0.030 0.035 0.098 0.163 0.019 -0.415
Table H.27: Compensated Elasticities - Level 2: Meat 2009
Beef Lamb Pork Bacon & Ham Poultry Sausages Other meat
Beef -0.462 0.032 0.000 0.093 0.108 0.029 0.200
Lamb 0.097 -0.515 0.092 0.116 0.196 -0.106 0.121
Pork -0.001 0.083 -0.743 0.091 0.210 0.060 0.300
Bacon & Ham 0.084 0.035 0.030 -0.589 0.190 0.034 0.215
Poultry 0.074 0.045 0.054 0.145 -0.706 0.037 0.350
Sausages 0.085 -0.106 0.067 0.111 0.160 -0.585 0.267
Other meat 0.075 0.015 0.042 0.089 0.190 0.034 -0.444
Table H.28: Compensated Elasticities - Level 2: Fish 2001/02
White fish Salmon Blue fish Other fish
White fish -0.455 0.065 -0.034 0.425
Salmon 0.142 -0.632 0.023 0.467
Blue fish -0.103 0.032 -0.410 0.482
Other fish 0.191 0.095 0.072 -0.358
153
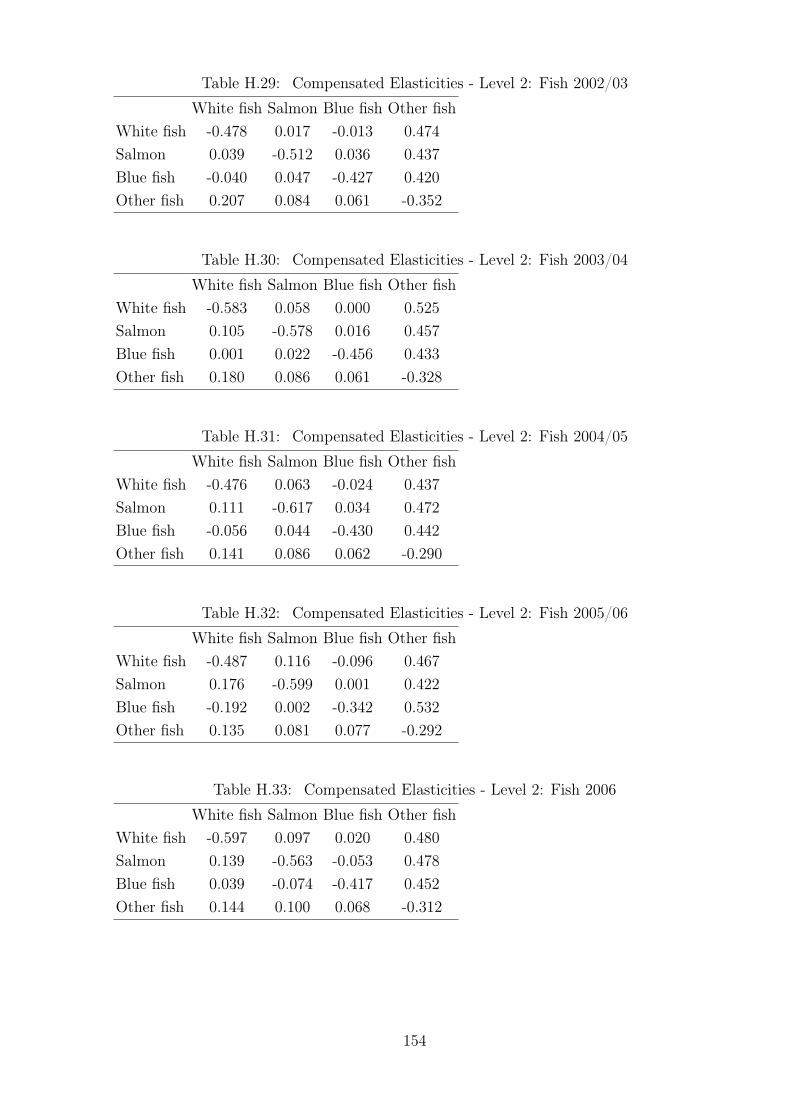
Table H.29: Compensated Elasticities - Level 2: Fish 2002/03
White fish Salmon Blue fish Other fish
White fish -0.478 0.017 -0.013 0.474
Salmon 0.039 -0.512 0.036 0.437
Blue fish -0.040 0.047 -0.427 0.420
Other fish 0.207 0.084 0.061 -0.352
Table H.30: Compensated Elasticities - Level 2: Fish 2003/04
White fish Salmon Blue fish Other fish
White fish -0.583 0.058 0.000 0.525
Salmon 0.105 -0.578 0.016 0.457
Blue fish 0.001 0.022 -0.456 0.433
Other fish 0.180 0.086 0.061 -0.328
Table H.31: Compensated Elasticities - Level 2: Fish 2004/05
White fish Salmon Blue fish Other fish
White fish -0.476 0.063 -0.024 0.437
Salmon 0.111 -0.617 0.034 0.472
Blue fish -0.056 0.044 -0.430 0.442
Other fish 0.141 0.086 0.062 -0.290
Table H.32: Compensated Elasticities - Level 2: Fish 2005/06
White fish Salmon Blue fish Other fish
White fish -0.487 0.116 -0.096 0.467
Salmon 0.176 -0.599 0.001 0.422
Blue fish -0.192 0.002 -0.342 0.532
Other fish 0.135 0.081 0.077 -0.292
Table H.33: Compensated Elasticities - Level 2: Fish 2006
White fish Salmon Blue fish Other fish
White fish -0.597 0.097 0.020 0.480
Salmon 0.139 -0.563 -0.053 0.478
Blue fish 0.039 -0.074 -0.417 0.452
Other fish 0.144 0.100 0.068 -0.312
154

Table H.34: Compensated Elasticities - Level 2: Fish 2007
White fish Salmon Blue fish Other fish
White fish -0.591 0.030 -0.007 0.568
Salmon 0.043 -0.541 0.028 0.470
Blue fish -0.012 0.033 -0.462 0.441
Other fish 0.158 0.091 0.073 -0.323
Table H.35: Compensated Elasticities - Level 2: Fish 2008
White fish Salmon Blue fish Other fish
White fish -0.507 0.041 -0.006 0.472
Salmon 0.058 -0.612 0.028 0.526
Blue fish -0.013 0.041 -0.563 0.535
Other fish 0.142 0.111 0.077 -0.330
Table H.36: Compensated Elasticities - Level 2: Fish 2009
White fish Salmon Blue fish Other fish
White fish -0.591 0.081 -0.023 0.533
Salmon 0.102 -0.607 0.071 0.434
Blue fish -0.045 0.111 -0.522 0.456
Other fish 0.141 0.091 0.061 -0.293
155

Table H.37: Compensated Elasticities - Level 2: Fruits & Nuts 2001/02
Fresh fruits Tinned & dried Nuts Juice
Fresh fruits -0.249 0.044 0.060 0.146
Tinned & dried 0.390 -0.643 0.052 0.201
Nuts 0.652 0.064 -0.779 0.063
Juice 0.565 0.088 0.022 -0.675
Table H.38: Compensated Elasticities - Level 2: Fruits & Nuts 2002/03
Fresh fruits Tinned & dried Nuts Juice
Fresh fruits -0.232 0.053 0.045 0.133
Tinned & dried 0.483 -0.715 0.084 0.148
Nuts 0.518 0.107 -0.726 0.101
Juice 0.545 0.067 0.036 -0.648
Table H.39: Compensated Elasticities - Level 2: Fruits & Nuts 2003/04
Fresh fruits Tinned & dried Nuts Juice
Fresh fruits -0.220 0.055 0.046 0.119
Tinned & dried 0.536 -0.742 0.016 0.190
Nuts 0.515 0.019 -0.592 0.058
Juice 0.543 0.088 0.024 -0.655
Table H.40: Compensated Elasticities - Level 2: Fruits & Nuts 2004/05
Fresh fruits Tinned & dried Nuts Juice
Fresh fruits -0.234 0.070 0.056 0.108
Tinned & dried 0.655 -0.787 0.066 0.065
Nuts 0.506 0.063 -0.664 0.095
Juice 0.561 0.036 0.055 -0.652
Table H.41: Compensated Elasticities - Level 2: Fruits & Nuts 2005/06
Fresh fruits Tinned & dried Nuts Juice
Fresh fruits -0.242 0.058 0.062 0.122
Tinned & dried 0.568 -0.730 0.039 0.123
Nuts 0.557 0.036 -0.617 0.024
Juice 0.532 0.055 0.011 -0.598
156

Table H.42: Compensated Elasticities - Level 2: Fruits & Nuts 2006
Fresh fruits Tinned & dried Nuts Juice
Fresh fruits -0.244 0.047 0.052 0.145
Tinned & dried 0.443 -0.697 0.069 0.185
Nuts 0.490 0.068 -0.613 0.055
Juice 0.555 0.075 0.023 -0.652
Table H.43: Compensated Elasticities - Level 2: Fruits & Nuts 2007
Fresh fruits Tinned & dried Nuts Juice
Fresh fruits -0.270 0.057 0.054 0.159
Tinned & dried 0.590 -0.750 0.010 0.150
Nuts 0.526 0.010 -0.682 0.146
Juice 0.608 0.055 0.057 -0.720
Table H.44: Compensated Elasticities - Level 2: Fruits & Nuts 2008
Fresh fruits Tinned & dried Nuts Juice
Fresh fruits -0.229 0.047 0.048 0.134
Tinned & dried 0.481 -0.755 0.120 0.154
Nuts 0.481 0.118 -0.660 0.061
Juice 0.543 0.061 0.024 -0.628
Table H.45: Compensated Elasticities - Level 2: Fruits & Nuts 2009
Fresh fruits Tinned & dried Nuts Juice
Fresh fruits -0.235 0.057 0.056 0.122
Tinned & dried 0.557 -0.746 0.055 0.134
Nuts 0.500 0.050 -0.709 0.159
Juice 0.541 0.061 0.080 -0.682
Table H.46: Compensated Elasticities - Level 2: Vegetables 2001/02
Fresh veg. Canned veg.
Fresh veg. -0.076 0.076
Canned veg. 0.489 -0.489
Table H.47: Compensated Elasticities - Level 2: Vegetables 2002/03
Fresh veg. Canned veg.
Fresh veg. -0.077 0.077
Canned veg. 0.469 -0.469
157
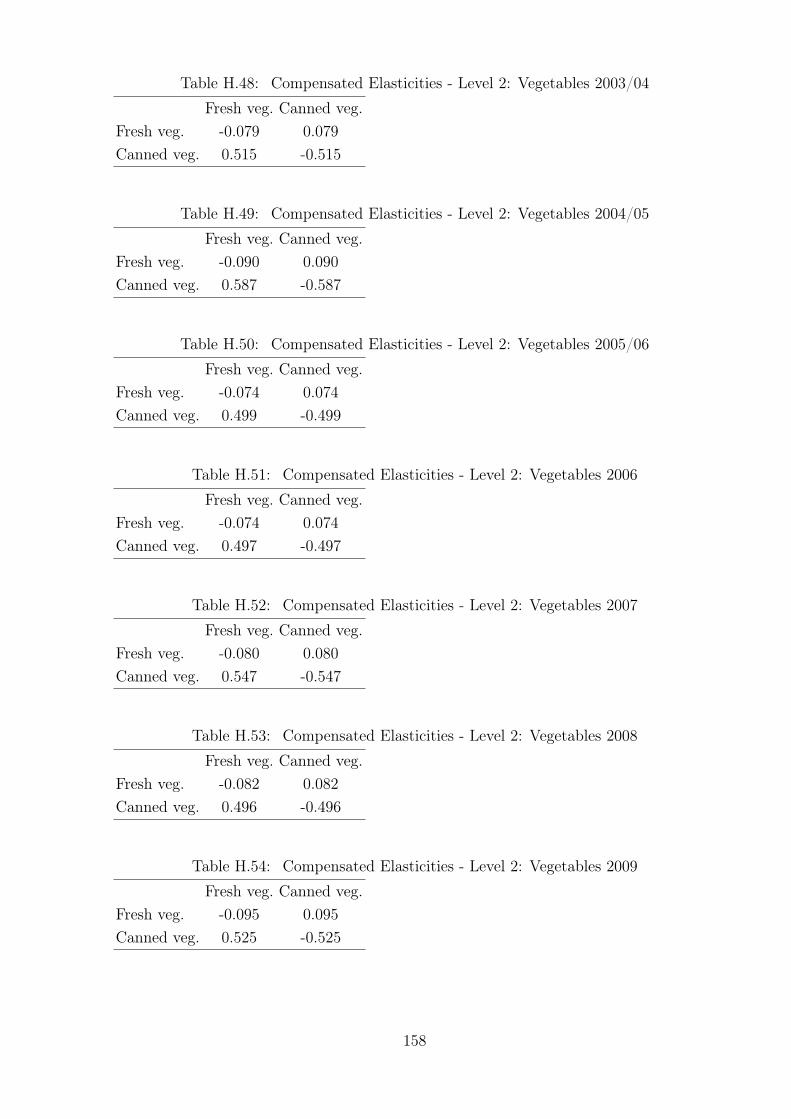
Table H.48: Compensated Elasticities - Level 2: Vegetables 2003/04
Fresh veg. Canned veg.
Fresh veg. -0.079 0.079
Canned veg. 0.515 -0.515
Table H.49: Compensated Elasticities - Level 2: Vegetables 2004/05
Fresh veg. Canned veg.
Fresh veg. -0.090 0.090
Canned veg. 0.587 -0.587
Table H.50: Compensated Elasticities - Level 2: Vegetables 2005/06
Fresh veg. Canned veg.
Fresh veg. -0.074 0.074
Canned veg. 0.499 -0.499
Table H.51: Compensated Elasticities - Level 2: Vegetables 2006
Fresh veg. Canned veg.
Fresh veg. -0.074 0.074
Canned veg. 0.497 -0.497
Table H.52: Compensated Elasticities - Level 2: Vegetables 2007
Fresh veg. Canned veg.
Fresh veg. -0.080 0.080
Canned veg. 0.547 -0.547
Table H.53: Compensated Elasticities - Level 2: Vegetables 2008
Fresh veg. Canned veg.
Fresh veg. -0.082 0.082
Canned veg. 0.496 -0.496
Table H.54: Compensated Elasticities - Level 2: Vegetables 2009
Fresh veg. Canned veg.
Fresh veg. -0.095 0.095
Canned veg. 0.525 -0.525
158

Table H.55: Compensated Elasticities - Level 2: Fats & Starches 2001/02
Potatoes Sweets Starches Non-alc. Drinks Other starches Fats
Potatoes -0.716 0.065 0.375 0.115 0.068 0.092
Sweets 0.070 -0.275 0.140 -0.005 0.047 0.022
Starches 0.111 0.038 -0.326 0.137 0.047 -0.007
Non-alc. Drinks 0.105 -0.004 0.420 -0.663 0.100 0.042
Other starches 0.076 0.049 0.176 0.124 -0.487 0.062
Fats 0.270 0.060 -0.070 0.136 0.162 -0.558
Table H.56: Compensated Elasticities - Level 2: Fats & Starches 2002/03
Potatoes Sweets Starches Non-alc. Drinks Other starches Fats
Potatoes -0.740 0.063 0.387 0.112 0.090 0.089
Sweets 0.067 -0.525 0.281 0.069 0.053 0.054
Starches 0.107 0.073 -0.367 0.120 0.069 -0.002
Non-alc. Drinks 0.098 0.056 0.378 -0.690 0.101 0.057
Other starches 0.094 0.052 0.261 0.121 -0.482 -0.046
Fats 0.243 0.140 -0.016 0.180 -0.120 -0.427
Table H.57: Compensated Elasticities - Level 2: Fats & Starches 2003/04
Potatoes Sweets Starches Non-alc. Drinks Other starches Fats
Potatoes -0.694 0.094 0.372 0.109 0.079 0.040
Sweets 0.101 -0.417 0.119 0.113 0.017 0.066
Starches 0.105 0.031 -0.319 0.125 0.069 -0.011
Non-alc. Drinks 0.092 0.089 0.372 -0.643 0.056 0.033
Other starches 0.085 0.017 0.261 0.072 -0.493 0.058
Fats 0.118 0.180 -0.114 0.115 0.159 -0.457
Table H.58: Compensated Elasticities - Level 2: Fats & Starches 2004/05
Potatoes Sweets Starches Non-alc. Drinks Other starches Fats
Potatoes -0.183 -0.025 0.146 0.102 -0.063 0.023
Sweets -0.026 -0.370 0.178 0.066 0.120 0.032
Starches 0.040 0.048 -0.279 0.112 0.075 0.004
Non-alc. Drinks 0.087 0.055 0.345 -0.654 0.104 0.063
Other starches -0.065 0.121 0.280 0.126 -0.491 0.029
Fats 0.065 0.088 0.040 0.207 0.080 -0.481
159

Table H.59: Compensated Elasticities - Level 2: Fats & Starches 2005/06
Potatoes Sweets Starches Non-alc. Drinks Other starches Fats
Potatoes -0.262 -0.002 0.182 0.141 -0.035 -0.024
Sweets -0.002 -0.441 0.207 0.066 0.078 0.092
Starches 0.048 0.051 -0.283 0.110 0.074 0.000
Non-alc. Drinks 0.123 0.054 0.362 -0.635 0.083 0.012
Other starches -0.035 0.073 0.281 0.096 -0.521 0.106
Fats -0.065 0.234 0.002 0.037 0.285 -0.492
Table H.60: Compensated Elasticities - Level 2: Fats & Starches 2006
Potatoes Sweets Starches Non-alc. Drinks Other starches Fats
Potatoes -0.251 -0.011 0.196 0.121 -0.035 -0.020
Sweets -0.012 -0.409 0.146 0.066 0.101 0.107
Starches 0.052 0.036 -0.288 0.105 0.097 -0.002
Non-alc. Drinks 0.104 0.052 0.344 -0.603 0.051 0.052
Other starches -0.035 0.093 0.364 0.059 -0.542 0.061
Fats -0.054 0.261 -0.021 0.159 0.163 -0.508
Table H.61: Compensated Elasticities - Level 2: Fats & Starches 2007
Potatoes Sweets Starches Non-alc. Drinks Other starches Fats
Potatoes -0.266 0.013 0.124 0.095 0.002 0.033
Sweets 0.015 -0.415 0.245 0.035 0.043 0.077
Starches 0.034 0.061 -0.285 0.111 0.087 -0.007
Non-alc. Drinks 0.086 0.029 0.372 -0.640 0.092 0.061
Other starches 0.002 0.040 0.332 0.104 -0.531 0.053
Fats 0.087 0.191 -0.070 0.179 0.140 -0.527
Table H.62: Compensated Elasticities - Level 2: Fats & Starches 2008
Potatoes Sweets Starches Non-alc. Drinks Other starches Fats
Potatoes -0.297 0.000 0.190 0.095 -0.008 0.020
Sweets 0.000 -0.413 0.249 -0.004 0.046 0.122
Starches 0.049 0.060 -0.279 0.115 0.068 -0.012
Non-alc. Drinks 0.086 -0.003 0.406 -0.682 0.099 0.094
Other starches -0.009 0.045 0.272 0.113 -0.474 0.052
Fats 0.046 0.266 -0.112 0.242 0.117 -0.557
160
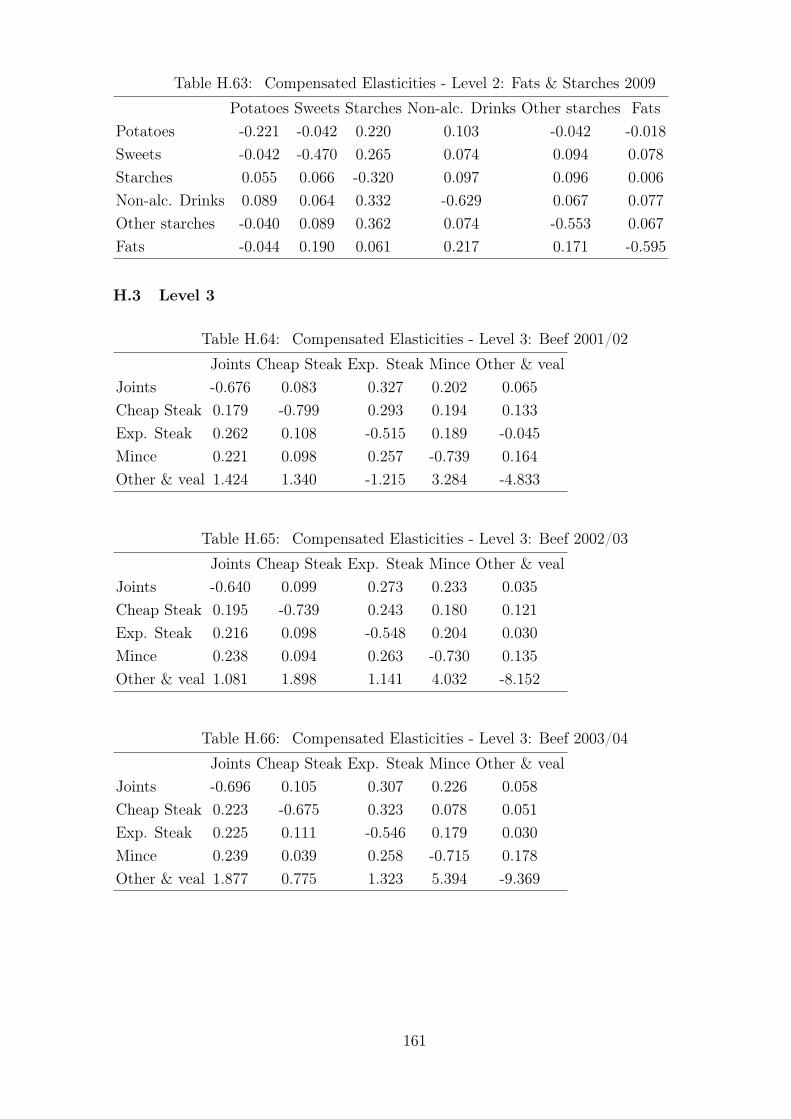
Table H.63: Compensated Elasticities - Level 2: Fats & Starches 2009
Potatoes Sweets Starches Non-alc. Drinks Other starches Fats
Potatoes -0.221 -0.042 0.220 0.103 -0.042 -0.018
Sweets -0.042 -0.470 0.265 0.074 0.094 0.078
Starches 0.055 0.066 -0.320 0.097 0.096 0.006
Non-alc. Drinks 0.089 0.064 0.332 -0.629 0.067 0.077
Other starches -0.040 0.089 0.362 0.074 -0.553 0.067
Fats -0.044 0.190 0.061 0.217 0.171 -0.595
H.3 Level 3
Table H.64: Compensated Elasticities - Level 3: Beef 2001/02
Joints Cheap Steak Exp. Steak Mince Other & veal
Joints -0.676 0.083 0.327 0.202 0.065
Cheap Steak 0.179 -0.799 0.293 0.194 0.133
Exp. Steak 0.262 0.108 -0.515 0.189 -0.045
Mince 0.221 0.098 0.257 -0.739 0.164
Other & veal 1.424 1.340 -1.215 3.284 -4.833
Table H.65: Compensated Elasticities - Level 3: Beef 2002/03
Joints Cheap Steak Exp. Steak Mince Other & veal
Joints -0.640 0.099 0.273 0.233 0.035
Cheap Steak 0.195 -0.739 0.243 0.180 0.121
Exp. Steak 0.216 0.098 -0.548 0.204 0.030
Mince 0.238 0.094 0.263 -0.730 0.135
Other & veal 1.081 1.898 1.141 4.032 -8.152
Table H.66: Compensated Elasticities - Level 3: Beef 2003/04
Joints Cheap Steak Exp. Steak Mince Other & veal
Joints -0.696 0.105 0.307 0.226 0.058
Cheap Steak 0.223 -0.675 0.323 0.078 0.051
Exp. Steak 0.225 0.111 -0.546 0.179 0.030
Mince 0.239 0.039 0.258 -0.715 0.178
Other & veal 1.877 0.775 1.323 5.394 -9.369
161

Table H.67: Compensated Elasticities - Level 3: Beef 2004/05
Joints Cheap Steak Exp. Steak Mince Other & veal
Joints -0.709 0.066 0.362 0.226 0.055
Cheap Steak 0.123 -0.728 0.336 0.108 0.162
Exp. Steak 0.240 0.118 -0.537 0.190 -0.011
Mince 0.228 0.058 0.289 -0.729 0.154
Other & veal 1.216 1.900 -0.361 3.381 -6.135
Table H.68: Compensated Elasticities - Level 3: Beef 2005/06
Joints Cheap Steak Exp. Steak Mince Other & veal
Joints -0.771 0.129 0.331 0.255 0.056
Cheap Steak 0.204 -0.725 0.265 0.144 0.112
Exp. Steak 0.243 0.123 -0.594 0.210 0.018
Mince 0.240 0.085 0.269 -0.723 0.128
Other & veal 1.450 1.815 0.640 3.498 -7.404
Table H.69: Compensated Elasticities - Level 3: Beef 2006
Joints Cheap Steak Exp. Steak Mince Other & veal
Joints -0.688 0.123 0.281 0.222 0.061
Cheap Steak 0.233 -0.798 0.253 0.147 0.165
Exp. Steak 0.247 0.117 -0.570 0.207 -0.001
Mince 0.231 0.081 0.246 -0.727 0.169
Other & veal 3.503 4.970 -0.079 9.261 -17.654
Table H.70: Compensated Elasticities - Level 3: Beef 2007
Joints Cheap Steak Exp. Steak Mince Other & veal
Joints -0.638 0.040 0.311 0.210 0.077
Cheap Steak 0.066 -0.743 0.222 0.204 0.251
Exp. Steak 0.210 0.092 -0.537 0.250 -0.015
Mince 0.161 0.096 0.283 -0.691 0.151
Other & veal 5.626 11.299 -1.647 14.500 -29.779
Table H.71: Compensated Elasticities - Level 3: Beef 2008
Joints Cheap Steak Exp. Steak Mince Other & veal
Joints -0.696 0.043 0.231 0.274 0.148
Cheap Steak 0.070 -0.752 0.300 0.250 0.132
Exp. Steak 0.158 0.128 -0.571 0.258 0.028
Mince 0.190 0.108 0.261 -0.663 0.104
Other & veal 9.228 5.118 2.552 9.370 -26.269
162
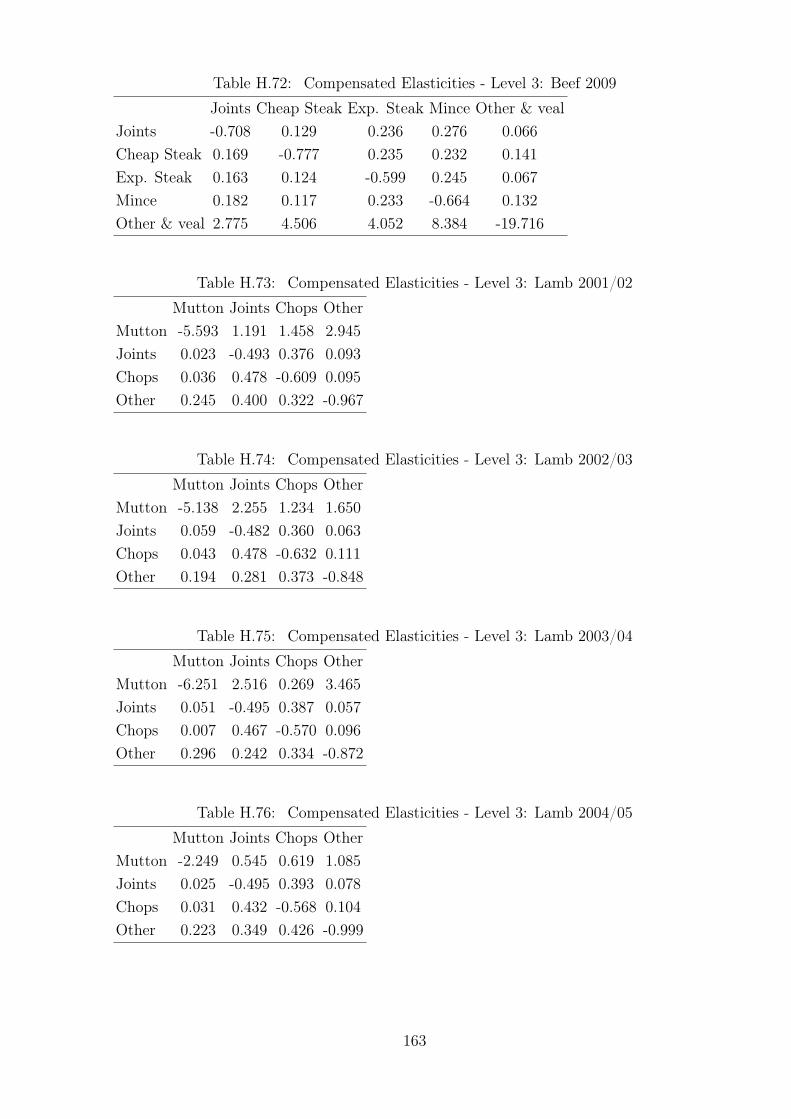
Table H.72: Compensated Elasticities - Level 3: Beef 2009
Joints Cheap Steak Exp. Steak Mince Other & veal
Joints -0.708 0.129 0.236 0.276 0.066
Cheap Steak 0.169 -0.777 0.235 0.232 0.141
Exp. Steak 0.163 0.124 -0.599 0.245 0.067
Mince 0.182 0.117 0.233 -0.664 0.132
Other & veal 2.775 4.506 4.052 8.384 -19.716
Table H.73: Compensated Elasticities - Level 3: Lamb 2001/02
Mutton Joints Chops Other
Mutton -5.593 1.191 1.458 2.945
Joints 0.023 -0.493 0.376 0.093
Chops 0.036 0.478 -0.609 0.095
Other 0.245 0.400 0.322 -0.967
Table H.74: Compensated Elasticities - Level 3: Lamb 2002/03
Mutton Joints Chops Other
Mutton -5.138 2.255 1.234 1.650
Joints 0.059 -0.482 0.360 0.063
Chops 0.043 0.478 -0.632 0.111
Other 0.194 0.281 0.373 -0.848
Table H.75: Compensated Elasticities - Level 3: Lamb 2003/04
Mutton Joints Chops Other
Mutton -6.251 2.516 0.269 3.465
Joints 0.051 -0.495 0.387 0.057
Chops 0.007 0.467 -0.570 0.096
Other 0.296 0.242 0.334 -0.872
Table H.76: Compensated Elasticities - Level 3: Lamb 2004/05
Mutton Joints Chops Other
Mutton -2.249 0.545 0.619 1.085
Joints 0.025 -0.495 0.393 0.078
Chops 0.031 0.432 -0.568 0.104
Other 0.223 0.349 0.426 -0.999
163
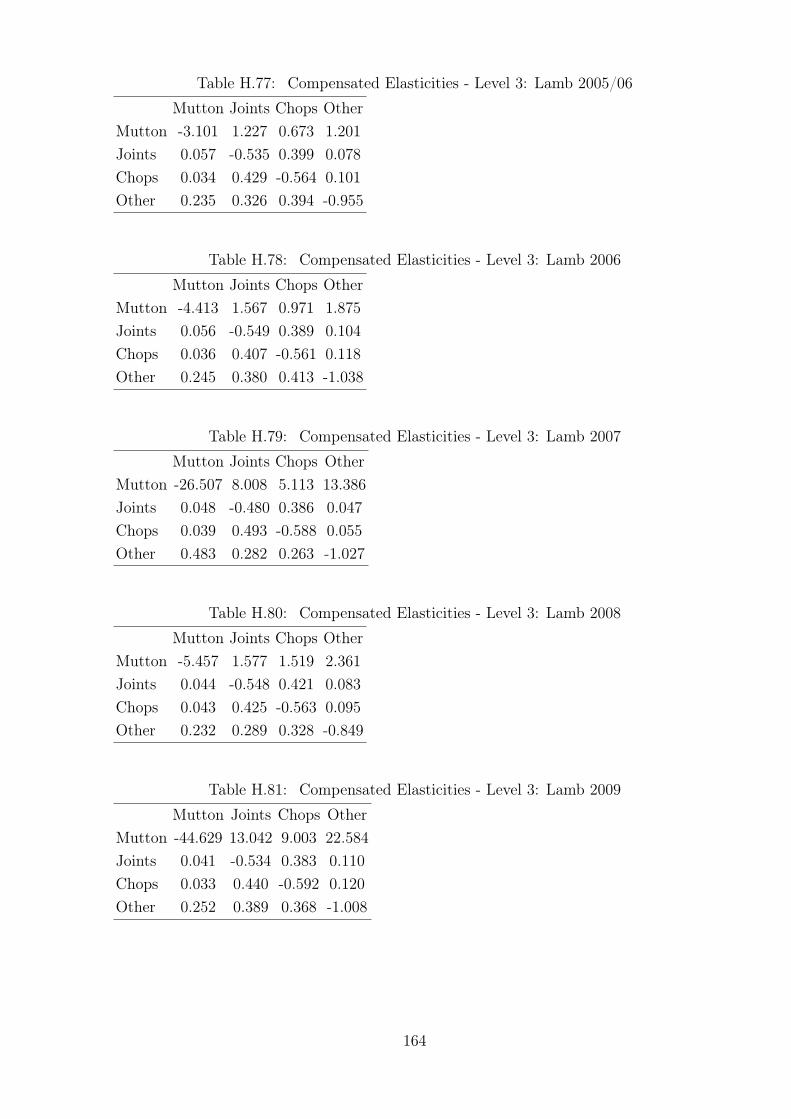
Table H.77: Compensated Elasticities - Level 3: Lamb 2005/06
Mutton Joints Chops Other
Mutton -3.101 1.227 0.673 1.201
Joints 0.057 -0.535 0.399 0.078
Chops 0.034 0.429 -0.564 0.101
Other 0.235 0.326 0.394 -0.955
Table H.78: Compensated Elasticities - Level 3: Lamb 2006
Mutton Joints Chops Other
Mutton -4.413 1.567 0.971 1.875
Joints 0.056 -0.549 0.389 0.104
Chops 0.036 0.407 -0.561 0.118
Other 0.245 0.380 0.413 -1.038
Table H.79: Compensated Elasticities - Level 3: Lamb 2007
Mutton Joints Chops Other
Mutton -26.507 8.008 5.113 13.386
Joints 0.048 -0.480 0.386 0.047
Chops 0.039 0.493 -0.588 0.055
Other 0.483 0.282 0.263 -1.027
Table H.80: Compensated Elasticities - Level 3: Lamb 2008
Mutton Joints Chops Other
Mutton -5.457 1.577 1.519 2.361
Joints 0.044 -0.548 0.421 0.083
Chops 0.043 0.425 -0.563 0.095
Other 0.232 0.289 0.328 -0.849
Table H.81: Compensated Elasticities - Level 3: Lamb 2009
Mutton Joints Chops Other
Mutton -44.629 13.042 9.003 22.584
Joints 0.041 -0.534 0.383 0.110
Chops 0.033 0.440 -0.592 0.120
Other 0.252 0.389 0.368 -1.008
164
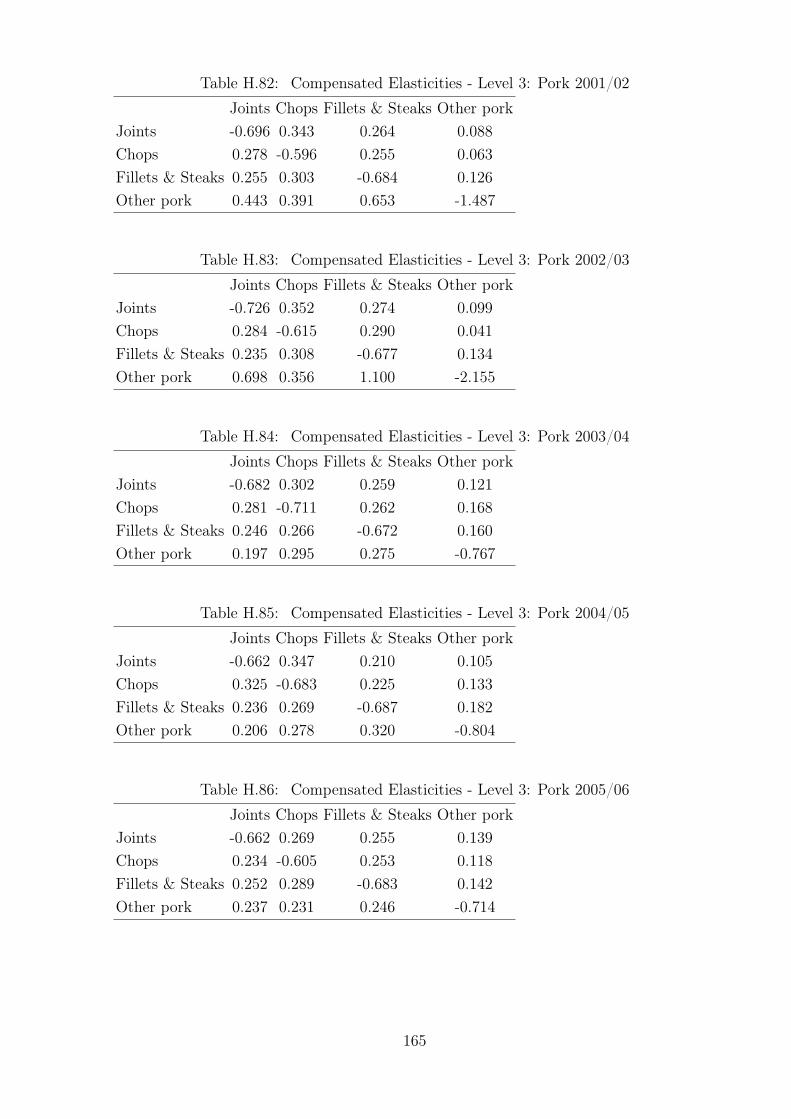
Table H.82: Compensated Elasticities - Level 3: Pork 2001/02
Joints Chops Fillets & Steaks Other pork
Joints -0.696 0.343 0.264 0.088
Chops 0.278 -0.596 0.255 0.063
Fillets & Steaks 0.255 0.303 -0.684 0.126
Other pork 0.443 0.391 0.653 -1.487
Table H.83: Compensated Elasticities - Level 3: Pork 2002/03
Joints Chops Fillets & Steaks Other pork
Joints -0.726 0.352 0.274 0.099
Chops 0.284 -0.615 0.290 0.041
Fillets & Steaks 0.235 0.308 -0.677 0.134
Other pork 0.698 0.356 1.100 -2.155
Table H.84: Compensated Elasticities - Level 3: Pork 2003/04
Joints Chops Fillets & Steaks Other pork
Joints -0.682 0.302 0.259 0.121
Chops 0.281 -0.711 0.262 0.168
Fillets & Steaks 0.246 0.266 -0.672 0.160
Other pork 0.197 0.295 0.275 -0.767
Table H.85: Compensated Elasticities - Level 3: Pork 2004/05
Joints Chops Fillets & Steaks Other pork
Joints -0.662 0.347 0.210 0.105
Chops 0.325 -0.683 0.225 0.133
Fillets & Steaks 0.236 0.269 -0.687 0.182
Other pork 0.206 0.278 0.320 -0.804
Table H.86: Compensated Elasticities - Level 3: Pork 2005/06
Joints Chops Fillets & Steaks Other pork
Joints -0.662 0.269 0.255 0.139
Chops 0.234 -0.605 0.253 0.118
Fillets & Steaks 0.252 0.289 -0.683 0.142
Other pork 0.237 0.231 0.246 -0.714
165
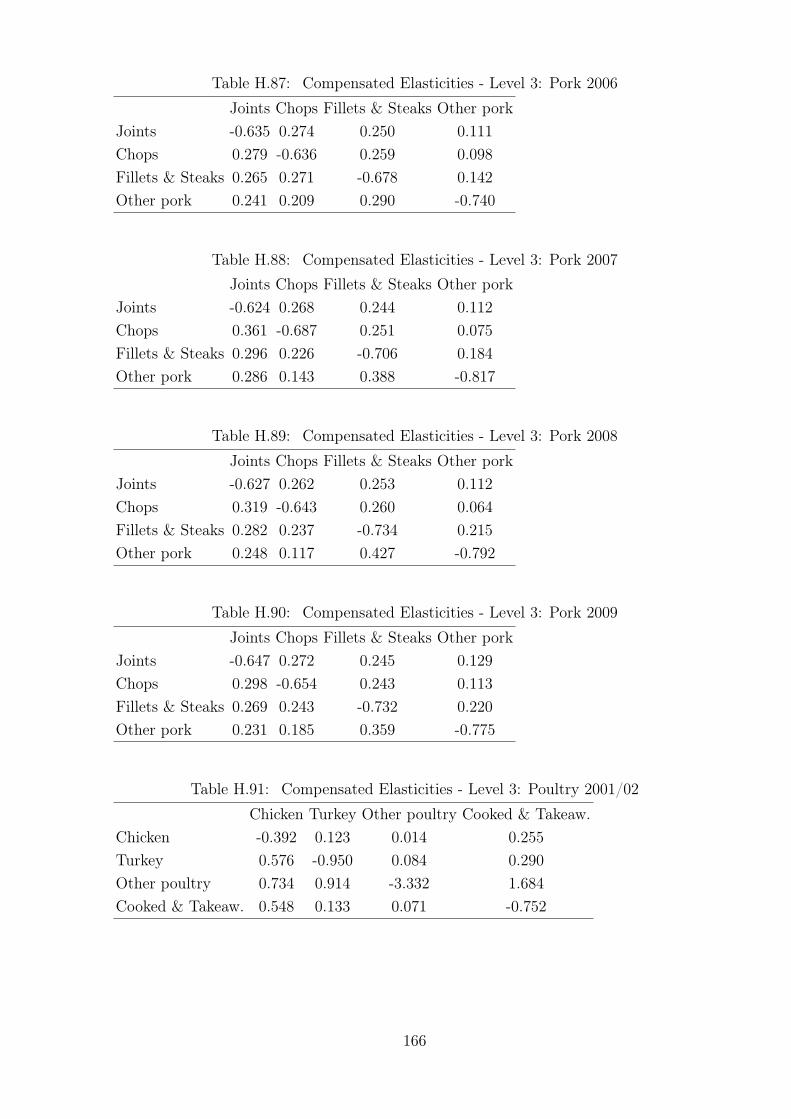
Table H.87: Compensated Elasticities - Level 3: Pork 2006
Joints Chops Fillets & Steaks Other pork
Joints -0.635 0.274 0.250 0.111
Chops 0.279 -0.636 0.259 0.098
Fillets & Steaks 0.265 0.271 -0.678 0.142
Other pork 0.241 0.209 0.290 -0.740
Table H.88: Compensated Elasticities - Level 3: Pork 2007
Joints Chops Fillets & Steaks Other pork
Joints -0.624 0.268 0.244 0.112
Chops 0.361 -0.687 0.251 0.075
Fillets & Steaks 0.296 0.226 -0.706 0.184
Other pork 0.286 0.143 0.388 -0.817
Table H.89: Compensated Elasticities - Level 3: Pork 2008
Joints Chops Fillets & Steaks Other pork
Joints -0.627 0.262 0.253 0.112
Chops 0.319 -0.643 0.260 0.064
Fillets & Steaks 0.282 0.237 -0.734 0.215
Other pork 0.248 0.117 0.427 -0.792
Table H.90: Compensated Elasticities - Level 3: Pork 2009
Joints Chops Fillets & Steaks Other pork
Joints -0.647 0.272 0.245 0.129
Chops 0.298 -0.654 0.243 0.113
Fillets & Steaks 0.269 0.243 -0.732 0.220
Other pork 0.231 0.185 0.359 -0.775
Table H.91: Compensated Elasticities - Level 3: Poultry 2001/02
Chicken Turkey Other poultry Cooked & Takeaw.
Chicken -0.392 0.123 0.014 0.255
Turkey 0.576 -0.950 0.084 0.290
Other poultry 0.734 0.914 -3.332 1.684
Cooked & Takeaw. 0.548 0.133 0.071 -0.752
166
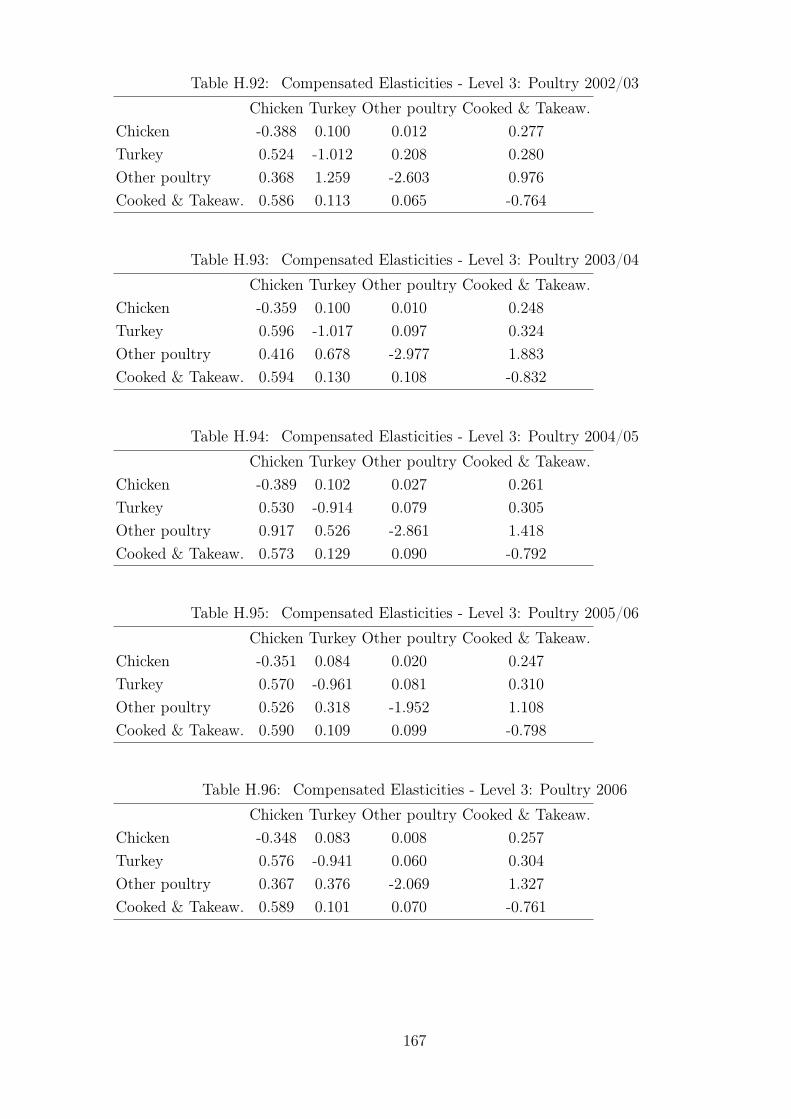
Table H.92: Compensated Elasticities - Level 3: Poultry 2002/03
Chicken Turkey Other poultry Cooked & Takeaw.
Chicken -0.388 0.100 0.012 0.277
Turkey 0.524 -1.012 0.208 0.280
Other poultry 0.368 1.259 -2.603 0.976
Cooked & Takeaw. 0.586 0.113 0.065 -0.764
Table H.93: Compensated Elasticities - Level 3: Poultry 2003/04
Chicken Turkey Other poultry Cooked & Takeaw.
Chicken -0.359 0.100 0.010 0.248
Turkey 0.596 -1.017 0.097 0.324
Other poultry 0.416 0.678 -2.977 1.883
Cooked & Takeaw. 0.594 0.130 0.108 -0.832
Table H.94: Compensated Elasticities - Level 3: Poultry 2004/05
Chicken Turkey Other poultry Cooked & Takeaw.
Chicken -0.389 0.102 0.027 0.261
Turkey 0.530 -0.914 0.079 0.305
Other poultry 0.917 0.526 -2.861 1.418
Cooked & Takeaw. 0.573 0.129 0.090 -0.792
Table H.95: Compensated Elasticities - Level 3: Poultry 2005/06
Chicken Turkey Other poultry Cooked & Takeaw.
Chicken -0.351 0.084 0.020 0.247
Turkey 0.570 -0.961 0.081 0.310
Other poultry 0.526 0.318 -1.952 1.108
Cooked & Takeaw. 0.590 0.109 0.099 -0.798
Table H.96: Compensated Elasticities - Level 3: Poultry 2006
Chicken Turkey Other poultry Cooked & Takeaw.
Chicken -0.348 0.083 0.008 0.257
Turkey 0.576 -0.941 0.060 0.304
Other poultry 0.367 0.376 -2.069 1.327
Cooked & Takeaw. 0.589 0.101 0.070 -0.761
167
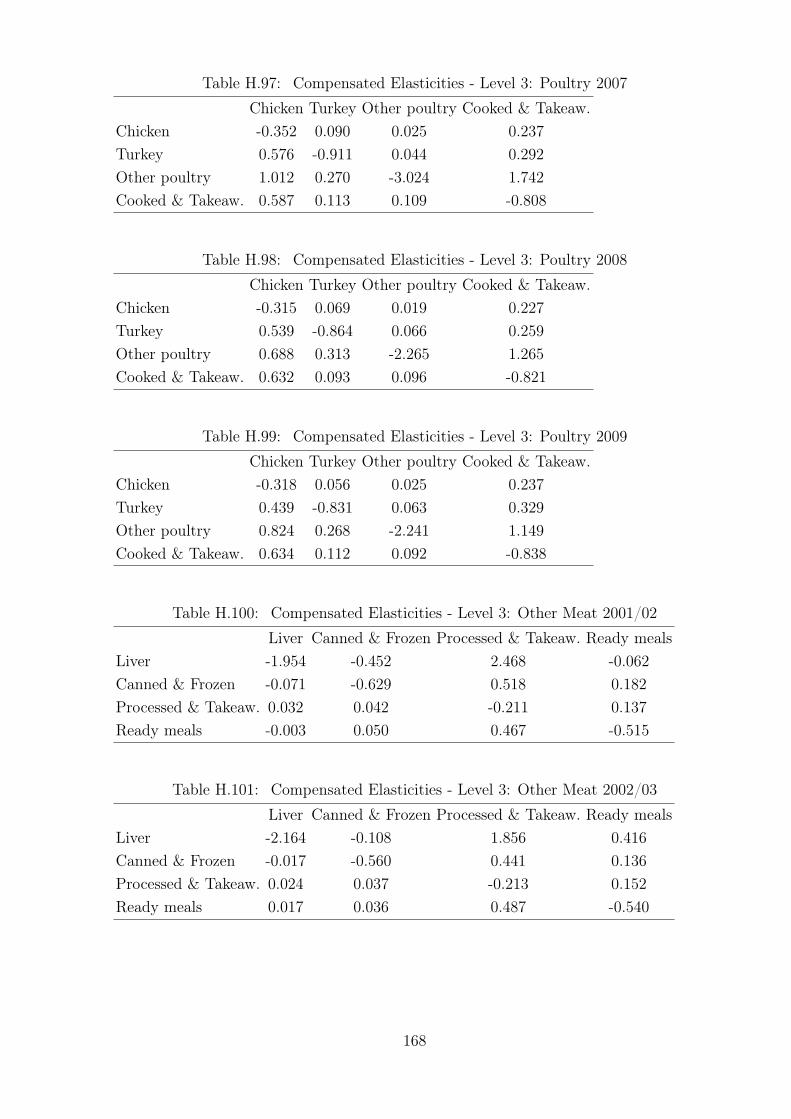
Table H.97: Compensated Elasticities - Level 3: Poultry 2007
Chicken Turkey Other poultry Cooked & Takeaw.
Chicken -0.352 0.090 0.025 0.237
Turkey 0.576 -0.911 0.044 0.292
Other poultry 1.012 0.270 -3.024 1.742
Cooked & Takeaw. 0.587 0.113 0.109 -0.808
Table H.98: Compensated Elasticities - Level 3: Poultry 2008
Chicken Turkey Other poultry Cooked & Takeaw.
Chicken -0.315 0.069 0.019 0.227
Turkey 0.539 -0.864 0.066 0.259
Other poultry 0.688 0.313 -2.265 1.265
Cooked & Takeaw. 0.632 0.093 0.096 -0.821
Table H.99: Compensated Elasticities - Level 3: Poultry 2009
Chicken Turkey Other poultry Cooked & Takeaw.
Chicken -0.318 0.056 0.025 0.237
Turkey 0.439 -0.831 0.063 0.329
Other poultry 0.824 0.268 -2.241 1.149
Cooked & Takeaw. 0.634 0.112 0.092 -0.838
Table H.100: Compensated Elasticities - Level 3: Other Meat 2001/02
Liver Canned & Frozen Processed & Takeaw. Ready meals
Liver -1.954 -0.452 2.468 -0.062
Canned & Frozen -0.071 -0.629 0.518 0.182
Processed & Takeaw. 0.032 0.042 -0.211 0.137
Ready meals -0.003 0.050 0.467 -0.515
Table H.101: Compensated Elasticities - Level 3: Other Meat 2002/03
Liver Canned & Frozen Processed & Takeaw. Ready meals
Liver -2.164 -0.108 1.856 0.416
Canned & Frozen -0.017 -0.560 0.441 0.136
Processed & Takeaw. 0.024 0.037 -0.213 0.152
Ready meals 0.017 0.036 0.487 -0.540
168

Table H.102: Compensated Elasticities - Level 3: Other Meat 2003/04
Liver Canned & Frozen Processed & Takeaw. Ready meals
Liver -1.923 0.317 1.578 0.028
Canned & Frozen 0.053 -0.634 0.529 0.051
Processed & Takeaw. 0.023 0.045 -0.227 0.159
Ready meals 0.001 0.014 0.495 -0.510
Table H.103: Compensated Elasticities - Level 3: Other Meat 2004/05
Liver Canned & Frozen Processed & Takeaw. Ready meals
Liver -3.352 -0.202 2.924 0.630
Canned & Frozen -0.024 -0.545 0.500 0.069
Processed & Takeaw. 0.032 0.046 -0.236 0.158
Ready meals 0.022 0.021 0.509 -0.552
Table H.104: Compensated Elasticities - Level 3: Other Meat 2005/06
Liver Canned & Frozen Processed & Takeaw. Ready meals
Liver -2.974 0.651 2.601 -0.279
Canned & Frozen 0.069 -0.645 0.452 0.124
Processed & Takeaw. 0.029 0.047 -0.221 0.145
Ready meals -0.011 0.044 0.494 -0.527
Table H.105: Compensated Elasticities - Level 3: Other Meat 2006
Liver Canned & Frozen Processed & Takeaw. Ready meals
Liver -3.795 0.466 1.569 1.761
Canned & Frozen 0.039 -0.577 0.464 0.074
Processed & Takeaw. 0.013 0.048 -0.201 0.140
Ready meals 0.055 0.028 0.510 -0.593
Table H.106: Compensated Elasticities - Level 3: Other Meat 2007
Liver Canned & Frozen Processed & Takeaw. Ready meals
Liver -3.567 0.923 1.936 0.708
Canned & Frozen 0.079 -0.547 0.457 0.011
Processed & Takeaw. 0.017 0.046 -0.200 0.137
Ready meals 0.024 0.004 0.529 -0.557
169
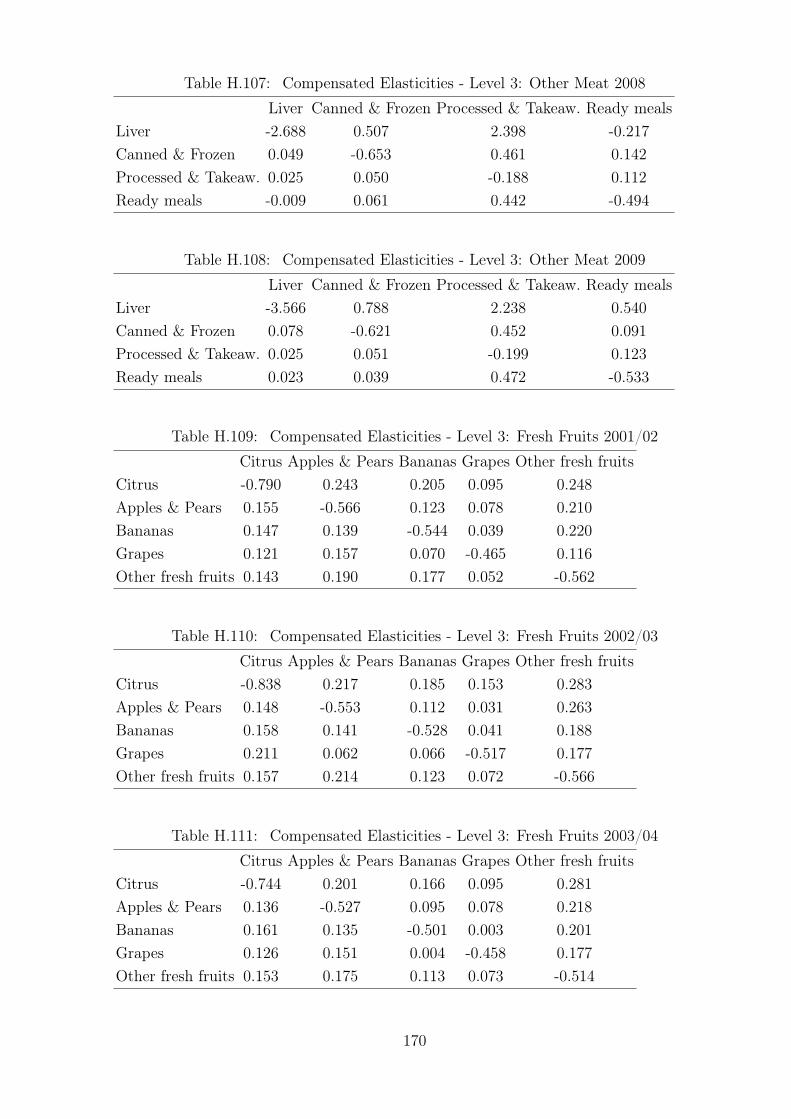
Table H.107: Compensated Elasticities - Level 3: Other Meat 2008
Liver Canned & Frozen Processed & Takeaw. Ready meals
Liver -2.688 0.507 2.398 -0.217
Canned & Frozen 0.049 -0.653 0.461 0.142
Processed & Takeaw. 0.025 0.050 -0.188 0.112
Ready meals -0.009 0.061 0.442 -0.494
Table H.108: Compensated Elasticities - Level 3: Other Meat 2009
Liver Canned & Frozen Processed & Takeaw. Ready meals
Liver -3.566 0.788 2.238 0.540
Canned & Frozen 0.078 -0.621 0.452 0.091
Processed & Takeaw. 0.025 0.051 -0.199 0.123
Ready meals 0.023 0.039 0.472 -0.533
Table H.109: Compensated Elasticities - Level 3: Fresh Fruits 2001/02
Citrus Apples & Pears Bananas Grapes Other fresh fruits
Citrus -0.790 0.243 0.205 0.095 0.248
Apples & Pears 0.155 -0.566 0.123 0.078 0.210
Bananas 0.147 0.139 -0.544 0.039 0.220
Grapes 0.121 0.157 0.070 -0.465 0.116
Other fresh fruits 0.143 0.190 0.177 0.052 -0.562
Table H.110: Compensated Elasticities - Level 3: Fresh Fruits 2002/03
Citrus Apples & Pears Bananas Grapes Other fresh fruits
Citrus -0.838 0.217 0.185 0.153 0.283
Apples & Pears 0.148 -0.553 0.112 0.031 0.263
Bananas 0.158 0.141 -0.528 0.041 0.188
Grapes 0.211 0.062 0.066 -0.517 0.177
Other fresh fruits 0.157 0.214 0.123 0.072 -0.566
Table H.111: Compensated Elasticities - Level 3: Fresh Fruits 2003/04
Citrus Apples & Pears Bananas Grapes Other fresh fruits
Citrus -0.744 0.201 0.166 0.095 0.281
Apples & Pears 0.136 -0.527 0.095 0.078 0.218
Bananas 0.161 0.135 -0.501 0.003 0.201
Grapes 0.126 0.151 0.004 -0.458 0.177
Other fresh fruits 0.153 0.175 0.113 0.073 -0.514
170
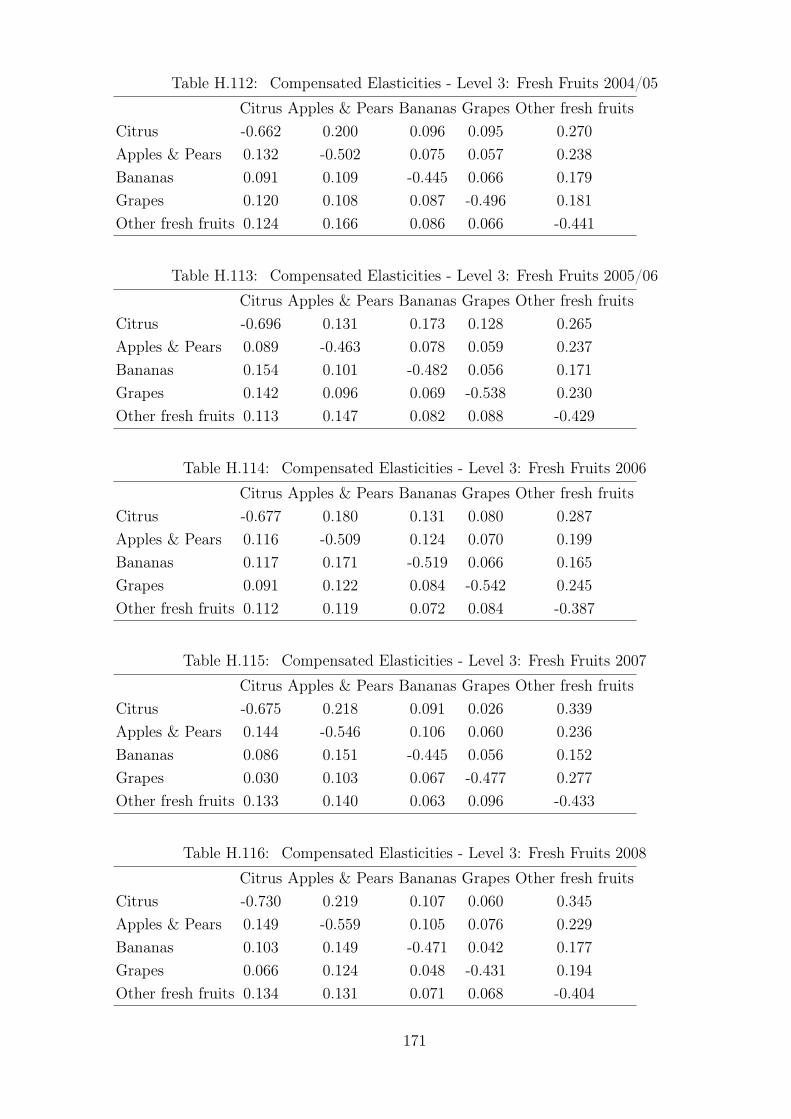
Table H.112: Compensated Elasticities - Level 3: Fresh Fruits 2004/05
Citrus Apples & Pears Bananas Grapes Other fresh fruits
Citrus -0.662 0.200 0.096 0.095 0.270
Apples & Pears 0.132 -0.502 0.075 0.057 0.238
Bananas 0.091 0.109 -0.445 0.066 0.179
Grapes 0.120 0.108 0.087 -0.496 0.181
Other fresh fruits 0.124 0.166 0.086 0.066 -0.441
Table H.113: Compensated Elasticities - Level 3: Fresh Fruits 2005/06
Citrus Apples & Pears Bananas Grapes Other fresh fruits
Citrus -0.696 0.131 0.173 0.128 0.265
Apples & Pears 0.089 -0.463 0.078 0.059 0.237
Bananas 0.154 0.101 -0.482 0.056 0.171
Grapes 0.142 0.096 0.069 -0.538 0.230
Other fresh fruits 0.113 0.147 0.082 0.088 -0.429
Table H.114: Compensated Elasticities - Level 3: Fresh Fruits 2006
Citrus Apples & Pears Bananas Grapes Other fresh fruits
Citrus -0.677 0.180 0.131 0.080 0.287
Apples & Pears 0.116 -0.509 0.124 0.070 0.199
Bananas 0.117 0.171 -0.519 0.066 0.165
Grapes 0.091 0.122 0.084 -0.542 0.245
Other fresh fruits 0.112 0.119 0.072 0.084 -0.387
Table H.115: Compensated Elasticities - Level 3: Fresh Fruits 2007
Citrus Apples & Pears Bananas Grapes Other fresh fruits
Citrus -0.675 0.218 0.091 0.026 0.339
Apples & Pears 0.144 -0.546 0.106 0.060 0.236
Bananas 0.086 0.151 -0.445 0.056 0.152
Grapes 0.030 0.103 0.067 -0.477 0.277
Other fresh fruits 0.133 0.140 0.063 0.096 -0.433
Table H.116: Compensated Elasticities - Level 3: Fresh Fruits 2008
Citrus Apples & Pears Bananas Grapes Other fresh fruits
Citrus -0.730 0.219 0.107 0.060 0.345
Apples & Pears 0.149 -0.559 0.105 0.076 0.229
Bananas 0.103 0.149 -0.471 0.042 0.177
Grapes 0.066 0.124 0.048 -0.431 0.194
Other fresh fruits 0.134 0.131 0.071 0.068 -0.404
171

Table H.117: Compensated Elasticities - Level 3: Fresh Fruits 2009
Citrus Apples & Pears Bananas Grapes Other fresh fruits
Citrus -0.658 0.170 0.076 0.109 0.303
Apples & Pears 0.113 -0.566 0.073 0.057 0.323
Bananas 0.074 0.107 -0.411 0.059 0.172
Grapes 0.120 0.094 0.067 -0.518 0.237
Other fresh fruits 0.116 0.186 0.068 0.082 -0.452
Table H.118: Compensated Elasticities - Level 3: Fresh Vegetables 2001/02
Brassica Root crops Lettuce Legumes Other fresh veg. Onions Tomatoes
Brassica -0.628 0.055 0.081 0.065 0.297 0.063 0.067
Root crops 0.066 -0.577 0.052 0.006 0.248 0.083 0.121
Lettuce 0.071 0.038 -0.525 0.010 0.287 0.057 0.063
Legumes 0.167 0.014 0.028 -0.730 0.311 0.087 0.123
Other fresh veg. 0.121 0.084 0.133 0.049 -0.586 0.078 0.120
Onions 0.089 0.097 0.090 0.048 0.269 -0.701 0.107
Tomatoes 0.060 0.090 0.064 0.043 0.265 0.069 -0.592
Table H.119: Compensated Elasticities - Level 3: Fresh Vegetables 2002/03
Brassica Root crops Lettuce Legumes Other fresh veg. Onions Tomatoes
Brassica -0.615 0.078 0.090 0.106 0.236 0.062 0.042
Root crops 0.095 -0.536 0.073 0.073 0.162 0.087 0.046
Lettuce 0.078 0.052 -0.565 -0.011 0.271 0.076 0.099
Legumes 0.242 0.139 -0.029 -0.712 0.237 0.087 0.036
Other fresh veg. 0.095 0.054 0.126 0.042 -0.528 0.075 0.137
Onions 0.084 0.097 0.120 0.052 0.255 -0.683 0.075
Tomatoes 0.036 0.032 0.097 0.013 0.288 0.047 -0.513
Table H.120: Compensated Elasticities - Level 3: Fresh Vegetables 2003/04
Brassica Root crops Lettuce Legumes Other fresh veg. Onions Tomatoes
Brassica -0.632 0.038 0.088 0.055 0.330 0.055 0.065
Root crops 0.048 -0.582 0.092 0.032 0.244 0.081 0.084
Lettuce 0.071 0.059 -0.566 0.001 0.251 0.067 0.117
Legumes 0.123 0.057 0.002 -0.605 0.232 0.104 0.088
Other fresh veg. 0.128 0.074 0.119 0.040 -0.559 0.067 0.130
Onions 0.078 0.089 0.115 0.066 0.244 -0.689 0.098
Tomatoes 0.052 0.053 0.115 0.032 0.268 0.056 -0.576
172
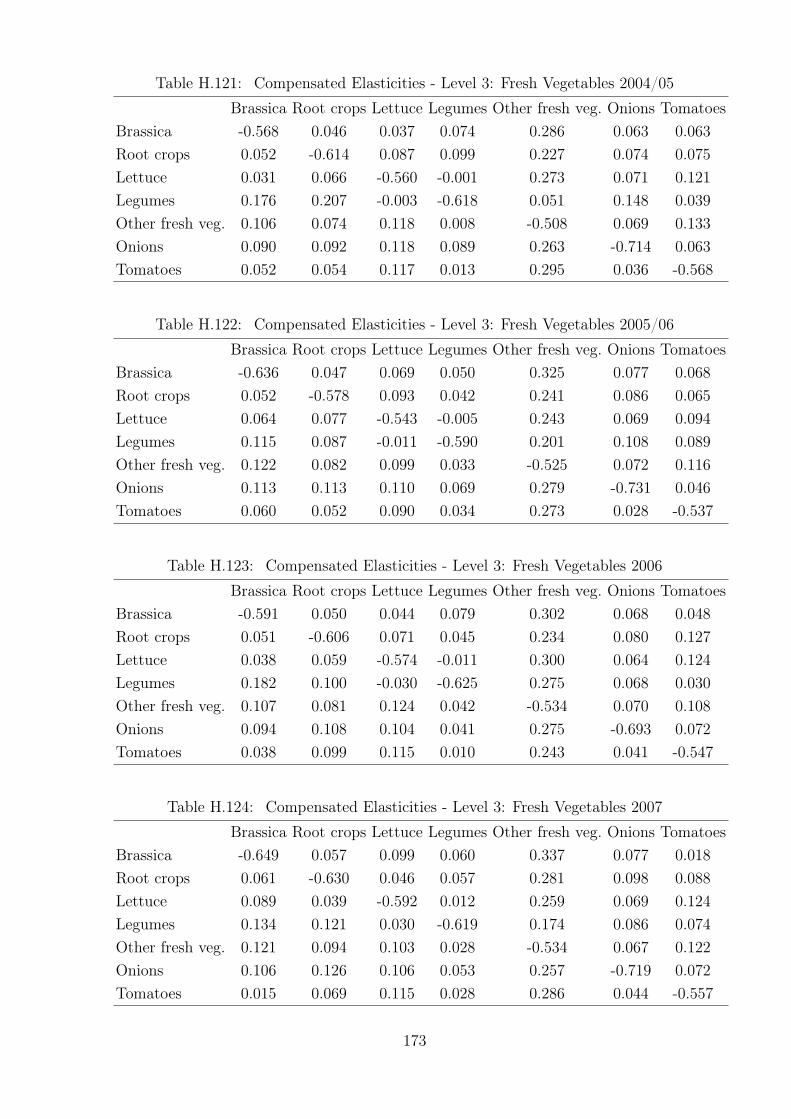
Table H.121: Compensated Elasticities - Level 3: Fresh Vegetables 2004/05
Brassica Root crops Lettuce Legumes Other fresh veg. Onions Tomatoes
Brassica -0.568 0.046 0.037 0.074 0.286 0.063 0.063
Root crops 0.052 -0.614 0.087 0.099 0.227 0.074 0.075
Lettuce 0.031 0.066 -0.560 -0.001 0.273 0.071 0.121
Legumes 0.176 0.207 -0.003 -0.618 0.051 0.148 0.039
Other fresh veg. 0.106 0.074 0.118 0.008 -0.508 0.069 0.133
Onions 0.090 0.092 0.118 0.089 0.263 -0.714 0.063
Tomatoes 0.052 0.054 0.117 0.013 0.295 0.036 -0.568
Table H.122: Compensated Elasticities - Level 3: Fresh Vegetables 2005/06
Brassica Root crops Lettuce Legumes Other fresh veg. Onions Tomatoes
Brassica -0.636 0.047 0.069 0.050 0.325 0.077 0.068
Root crops 0.052 -0.578 0.093 0.042 0.241 0.086 0.065
Lettuce 0.064 0.077 -0.543 -0.005 0.243 0.069 0.094
Legumes 0.115 0.087 -0.011 -0.590 0.201 0.108 0.089
Other fresh veg. 0.122 0.082 0.099 0.033 -0.525 0.072 0.116
Onions 0.113 0.113 0.110 0.069 0.279 -0.731 0.046
Tomatoes 0.060 0.052 0.090 0.034 0.273 0.028 -0.537
Table H.123: Compensated Elasticities - Level 3: Fresh Vegetables 2006
Brassica Root crops Lettuce Legumes Other fresh veg. Onions Tomatoes
Brassica -0.591 0.050 0.044 0.079 0.302 0.068 0.048
Root crops 0.051 -0.606 0.071 0.045 0.234 0.080 0.127
Lettuce 0.038 0.059 -0.574 -0.011 0.300 0.064 0.124
Legumes 0.182 0.100 -0.030 -0.625 0.275 0.068 0.030
Other fresh veg. 0.107 0.081 0.124 0.042 -0.534 0.070 0.108
Onions 0.094 0.108 0.104 0.041 0.275 -0.693 0.072
Tomatoes 0.038 0.099 0.115 0.010 0.243 0.041 -0.547
Table H.124: Compensated Elasticities - Level 3: Fresh Vegetables 2007
Brassica Root crops Lettuce Legumes Other fresh veg. Onions Tomatoes
Brassica -0.649 0.057 0.099 0.060 0.337 0.077 0.018
Root crops 0.061 -0.630 0.046 0.057 0.281 0.098 0.088
Lettuce 0.089 0.039 -0.592 0.012 0.259 0.069 0.124
Legumes 0.134 0.121 0.030 -0.619 0.174 0.086 0.074
Other fresh veg. 0.121 0.094 0.103 0.028 -0.534 0.067 0.122
Onions 0.106 0.126 0.106 0.053 0.257 -0.719 0.072
Tomatoes 0.015 0.069 0.115 0.028 0.286 0.044 -0.557
173
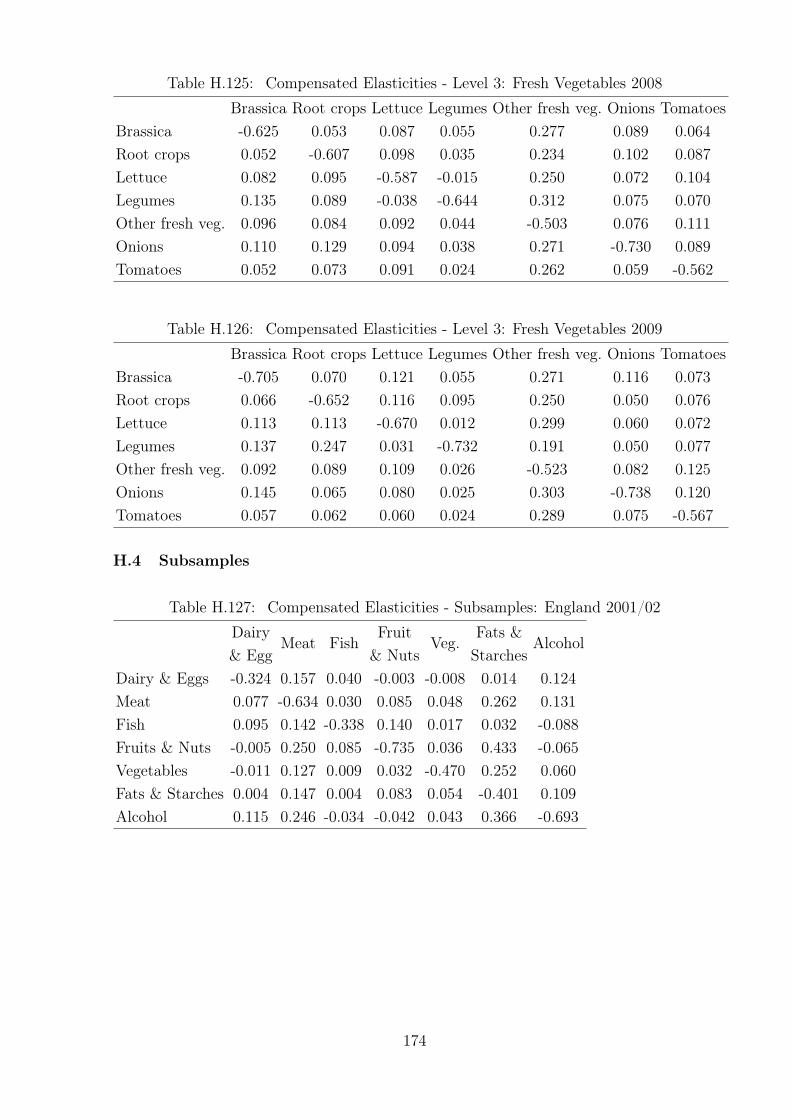
Table H.125: Compensated Elasticities - Level 3: Fresh Vegetables 2008
Brassica Root crops Lettuce Legumes Other fresh veg. Onions Tomatoes
Brassica -0.625 0.053 0.087 0.055 0.277 0.089 0.064
Root crops 0.052 -0.607 0.098 0.035 0.234 0.102 0.087
Lettuce 0.082 0.095 -0.587 -0.015 0.250 0.072 0.104
Legumes 0.135 0.089 -0.038 -0.644 0.312 0.075 0.070
Other fresh veg. 0.096 0.084 0.092 0.044 -0.503 0.076 0.111
Onions 0.110 0.129 0.094 0.038 0.271 -0.730 0.089
Tomatoes 0.052 0.073 0.091 0.024 0.262 0.059 -0.562
Table H.126: Compensated Elasticities - Level 3: Fresh Vegetables 2009
Brassica Root crops Lettuce Legumes Other fresh veg. Onions Tomatoes
Brassica -0.705 0.070 0.121 0.055 0.271 0.116 0.073
Root crops 0.066 -0.652 0.116 0.095 0.250 0.050 0.076
Lettuce 0.113 0.113 -0.670 0.012 0.299 0.060 0.072
Legumes 0.137 0.247 0.031 -0.732 0.191 0.050 0.077
Other fresh veg. 0.092 0.089 0.109 0.026 -0.523 0.082 0.125
Onions 0.145 0.065 0.080 0.025 0.303 -0.738 0.120
Tomatoes 0.057 0.062 0.060 0.024 0.289 0.075 -0.567
H.4 Subsamples
Table H.127: Compensated Elasticities - Subsamples: England 2001/02
DairyMeat Fish
FruitVeg.
Fats &Alcohol
& Egg & Nuts Starches
Dairy & Eggs -0.324 0.157 0.040 -0.003 -0.008 0.014 0.124
Meat 0.077 -0.634 0.030 0.085 0.048 0.262 0.131
Fish 0.095 0.142 -0.338 0.140 0.017 0.032 -0.088
Fruits & Nuts -0.005 0.250 0.085 -0.735 0.036 0.433 -0.065
Vegetables -0.011 0.127 0.009 0.032 -0.470 0.252 0.060
Fats & Starches 0.004 0.147 0.004 0.083 0.054 -0.401 0.109
Alcohol 0.115 0.246 -0.034 -0.042 0.043 0.366 -0.693
174
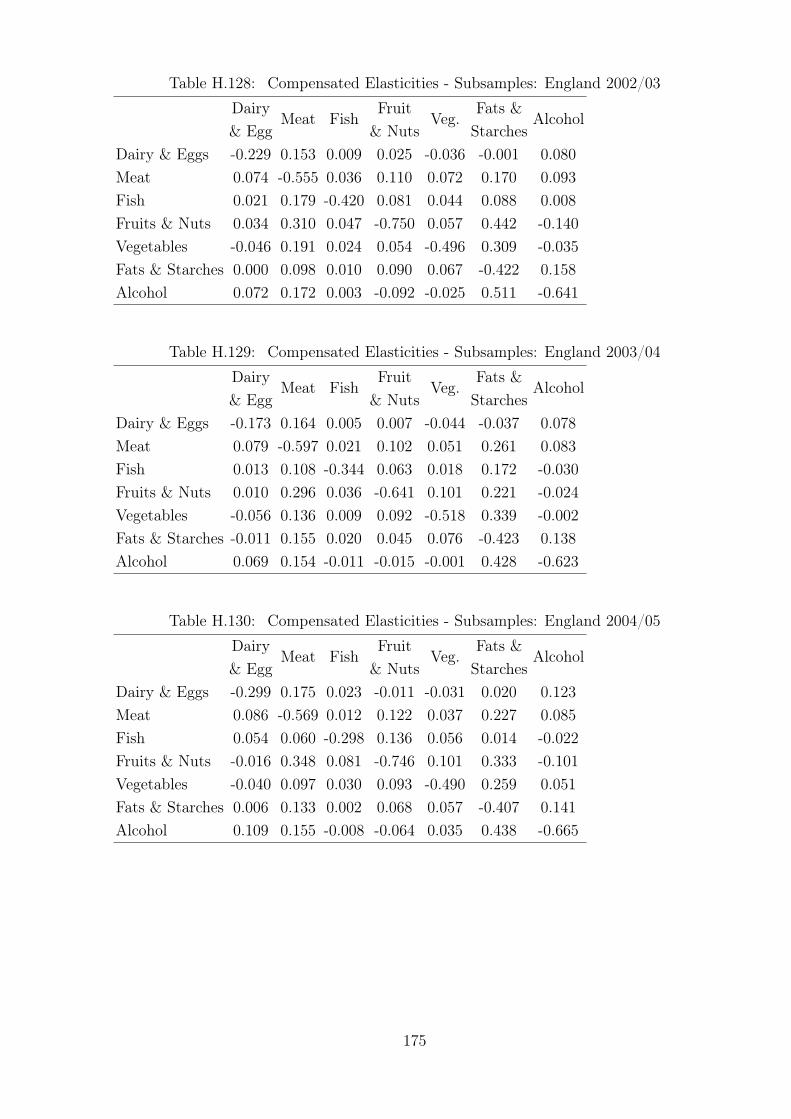
Table H.128: Compensated Elasticities - Subsamples: England 2002/03
DairyMeat Fish
FruitVeg.
Fats &Alcohol
& Egg & Nuts Starches
Dairy & Eggs -0.229 0.153 0.009 0.025 -0.036 -0.001 0.080
Meat 0.074 -0.555 0.036 0.110 0.072 0.170 0.093
Fish 0.021 0.179 -0.420 0.081 0.044 0.088 0.008
Fruits & Nuts 0.034 0.310 0.047 -0.750 0.057 0.442 -0.140
Vegetables -0.046 0.191 0.024 0.054 -0.496 0.309 -0.035
Fats & Starches 0.000 0.098 0.010 0.090 0.067 -0.422 0.158
Alcohol 0.072 0.172 0.003 -0.092 -0.025 0.511 -0.641
Table H.129: Compensated Elasticities - Subsamples: England 2003/04
DairyMeat Fish
FruitVeg.
Fats &Alcohol
& Egg & Nuts Starches
Dairy & Eggs -0.173 0.164 0.005 0.007 -0.044 -0.037 0.078
Meat 0.079 -0.597 0.021 0.102 0.051 0.261 0.083
Fish 0.013 0.108 -0.344 0.063 0.018 0.172 -0.030
Fruits & Nuts 0.010 0.296 0.036 -0.641 0.101 0.221 -0.024
Vegetables -0.056 0.136 0.009 0.092 -0.518 0.339 -0.002
Fats & Starches -0.011 0.155 0.020 0.045 0.076 -0.423 0.138
Alcohol 0.069 0.154 -0.011 -0.015 -0.001 0.428 -0.623
Table H.130: Compensated Elasticities - Subsamples: England 2004/05
DairyMeat Fish
FruitVeg.
Fats &Alcohol
& Egg & Nuts Starches
Dairy & Eggs -0.299 0.175 0.023 -0.011 -0.031 0.020 0.123
Meat 0.086 -0.569 0.012 0.122 0.037 0.227 0.085
Fish 0.054 0.060 -0.298 0.136 0.056 0.014 -0.022
Fruits & Nuts -0.016 0.348 0.081 -0.746 0.101 0.333 -0.101
Vegetables -0.040 0.097 0.030 0.093 -0.490 0.259 0.051
Fats & Starches 0.006 0.133 0.002 0.068 0.057 -0.407 0.141
Alcohol 0.109 0.155 -0.008 -0.064 0.035 0.438 -0.665
175
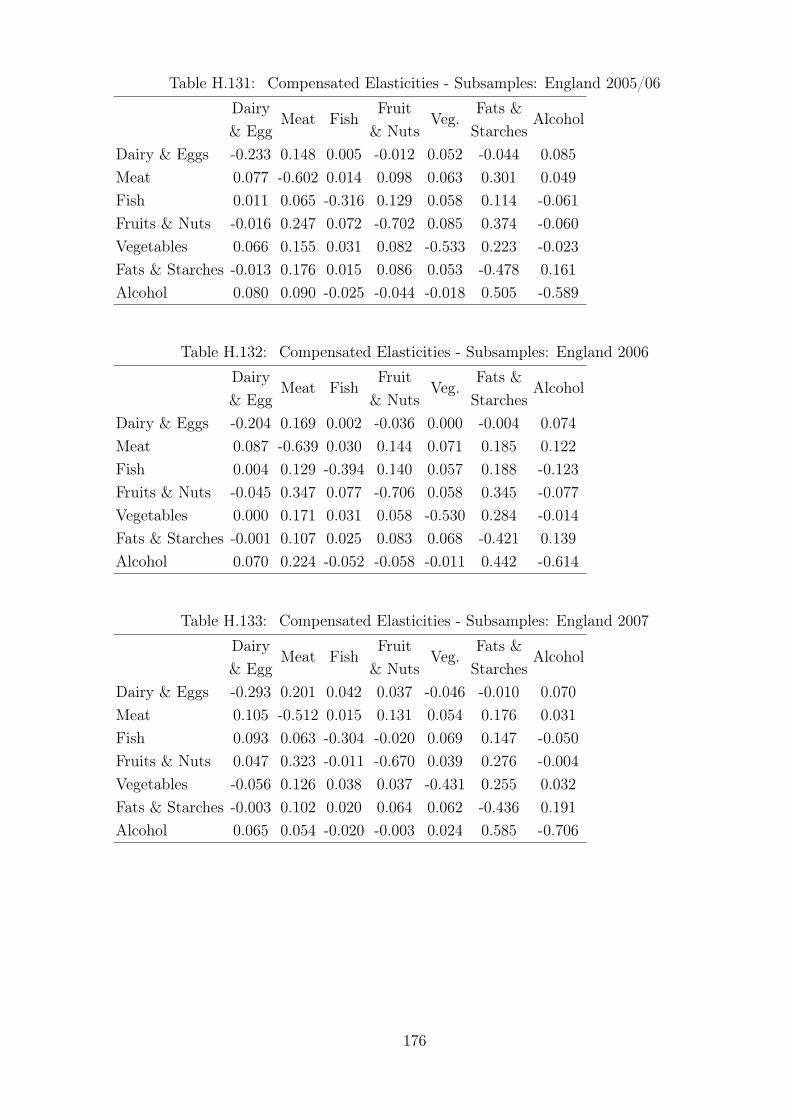
Table H.131: Compensated Elasticities - Subsamples: England 2005/06
DairyMeat Fish
FruitVeg.
Fats &Alcohol
& Egg & Nuts Starches
Dairy & Eggs -0.233 0.148 0.005 -0.012 0.052 -0.044 0.085
Meat 0.077 -0.602 0.014 0.098 0.063 0.301 0.049
Fish 0.011 0.065 -0.316 0.129 0.058 0.114 -0.061
Fruits & Nuts -0.016 0.247 0.072 -0.702 0.085 0.374 -0.060
Vegetables 0.066 0.155 0.031 0.082 -0.533 0.223 -0.023
Fats & Starches -0.013 0.176 0.015 0.086 0.053 -0.478 0.161
Alcohol 0.080 0.090 -0.025 -0.044 -0.018 0.505 -0.589
Table H.132: Compensated Elasticities - Subsamples: England 2006
DairyMeat Fish
FruitVeg.
Fats &Alcohol
& Egg & Nuts Starches
Dairy & Eggs -0.204 0.169 0.002 -0.036 0.000 -0.004 0.074
Meat 0.087 -0.639 0.030 0.144 0.071 0.185 0.122
Fish 0.004 0.129 -0.394 0.140 0.057 0.188 -0.123
Fruits & Nuts -0.045 0.347 0.077 -0.706 0.058 0.345 -0.077
Vegetables 0.000 0.171 0.031 0.058 -0.530 0.284 -0.014
Fats & Starches -0.001 0.107 0.025 0.083 0.068 -0.421 0.139
Alcohol 0.070 0.224 -0.052 -0.058 -0.011 0.442 -0.614
Table H.133: Compensated Elasticities - Subsamples: England 2007
DairyMeat Fish
FruitVeg.
Fats &Alcohol
& Egg & Nuts Starches
Dairy & Eggs -0.293 0.201 0.042 0.037 -0.046 -0.010 0.070
Meat 0.105 -0.512 0.015 0.131 0.054 0.176 0.031
Fish 0.093 0.063 -0.304 -0.020 0.069 0.147 -0.050
Fruits & Nuts 0.047 0.323 -0.011 -0.670 0.039 0.276 -0.004
Vegetables -0.056 0.126 0.038 0.037 -0.431 0.255 0.032
Fats & Starches -0.003 0.102 0.020 0.064 0.062 -0.436 0.191
Alcohol 0.065 0.054 -0.020 -0.003 0.024 0.585 -0.706
176
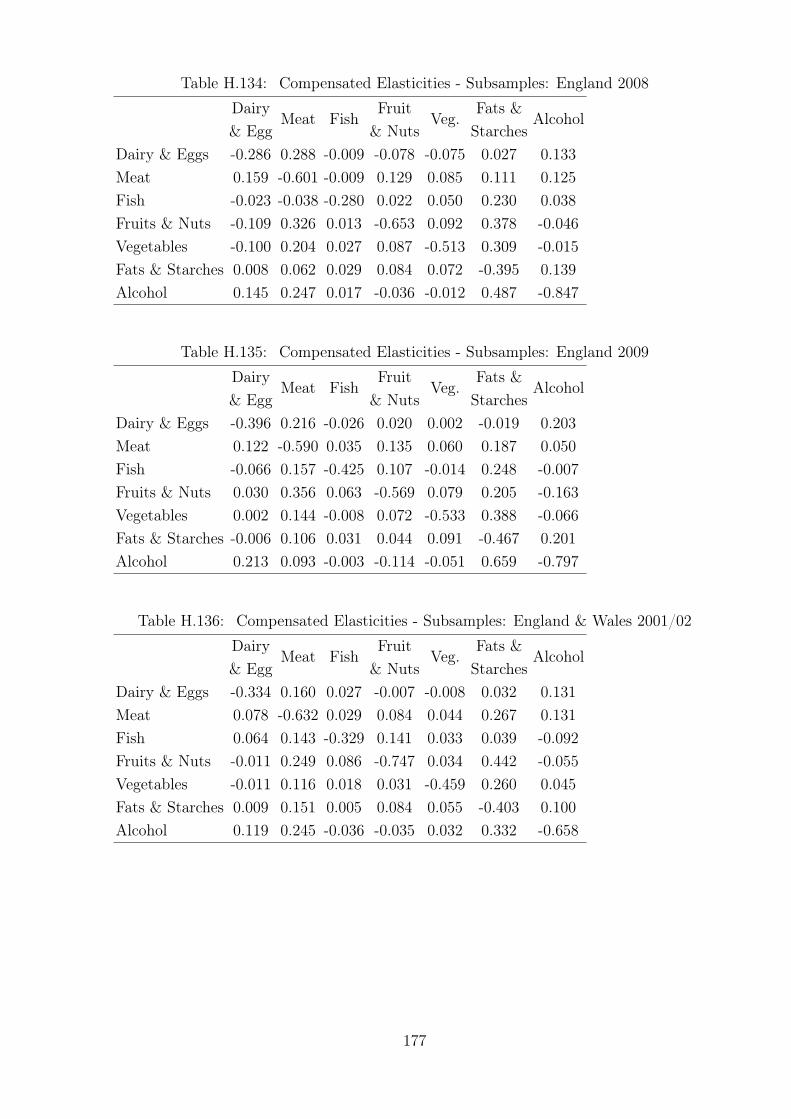
Table H.134: Compensated Elasticities - Subsamples: England 2008
DairyMeat Fish
FruitVeg.
Fats &Alcohol
& Egg & Nuts Starches
Dairy & Eggs -0.286 0.288 -0.009 -0.078 -0.075 0.027 0.133
Meat 0.159 -0.601 -0.009 0.129 0.085 0.111 0.125
Fish -0.023 -0.038 -0.280 0.022 0.050 0.230 0.038
Fruits & Nuts -0.109 0.326 0.013 -0.653 0.092 0.378 -0.046
Vegetables -0.100 0.204 0.027 0.087 -0.513 0.309 -0.015
Fats & Starches 0.008 0.062 0.029 0.084 0.072 -0.395 0.139
Alcohol 0.145 0.247 0.017 -0.036 -0.012 0.487 -0.847
Table H.135: Compensated Elasticities - Subsamples: England 2009
DairyMeat Fish
FruitVeg.
Fats &Alcohol
& Egg & Nuts Starches
Dairy & Eggs -0.396 0.216 -0.026 0.020 0.002 -0.019 0.203
Meat 0.122 -0.590 0.035 0.135 0.060 0.187 0.050
Fish -0.066 0.157 -0.425 0.107 -0.014 0.248 -0.007
Fruits & Nuts 0.030 0.356 0.063 -0.569 0.079 0.205 -0.163
Vegetables 0.002 0.144 -0.008 0.072 -0.533 0.388 -0.066
Fats & Starches -0.006 0.106 0.031 0.044 0.091 -0.467 0.201
Alcohol 0.213 0.093 -0.003 -0.114 -0.051 0.659 -0.797
Table H.136: Compensated Elasticities - Subsamples: England & Wales 2001/02
DairyMeat Fish
FruitVeg.
Fats &Alcohol
& Egg & Nuts Starches
Dairy & Eggs -0.334 0.160 0.027 -0.007 -0.008 0.032 0.131
Meat 0.078 -0.632 0.029 0.084 0.044 0.267 0.131
Fish 0.064 0.143 -0.329 0.141 0.033 0.039 -0.092
Fruits & Nuts -0.011 0.249 0.086 -0.747 0.034 0.442 -0.055
Vegetables -0.011 0.116 0.018 0.031 -0.459 0.260 0.045
Fats & Starches 0.009 0.151 0.005 0.084 0.055 -0.403 0.100
Alcohol 0.119 0.245 -0.036 -0.035 0.032 0.332 -0.658
177

Table H.137: Compensated Elasticities - Subsamples: England & Wales 2002/03
DairyMeat Fish
FruitVeg.
Fats &Alcohol
& Egg & Nuts Starches
Dairy & Eggs -0.228 0.146 0.009 0.027 -0.031 -0.011 0.088
Meat 0.071 -0.564 0.040 0.109 0.074 0.187 0.083
Fish 0.022 0.195 -0.417 0.098 0.027 0.074 0.002
Fruits & Nuts 0.038 0.312 0.056 -0.759 0.047 0.445 -0.140
Vegetables -0.041 0.198 0.015 0.044 -0.491 0.309 -0.034
Fats & Starches -0.003 0.108 0.009 0.090 0.066 -0.427 0.158
Alcohol 0.080 0.155 0.001 -0.092 -0.024 0.511 -0.631
Table H.138: Compensated Elasticities - Subsamples: England & Wales 2003/04
DairyMeat Fish
FruitVeg.
Fats &Alcohol
& Egg & Nuts Starches
Dairy & Eggs -0.183 0.172 0.000 0.006 -0.049 -0.024 0.077
Meat 0.082 -0.591 0.024 0.101 0.046 0.266 0.073
Fish -0.001 0.124 -0.353 0.080 0.012 0.151 -0.013
Fruits & Nuts 0.009 0.297 0.045 -0.650 0.102 0.206 -0.010
Vegetables -0.063 0.124 0.006 0.093 -0.509 0.342 0.006
Fats & Starches -0.007 0.158 0.017 0.042 0.076 -0.416 0.130
Alcohol 0.069 0.135 -0.005 -0.006 0.004 0.408 -0.606
Table H.139: Compensated Elasticities - Subsamples: England & Wales 2004/05
DairyMeat Fish
FruitVeg.
Fats &Alcohol
& Egg & Nuts Starches
Dairy & Eggs -0.319 0.185 0.018 -0.001 -0.029 0.037 0.108
Meat 0.090 -0.565 0.014 0.114 0.037 0.215 0.095
Fish 0.044 0.066 -0.290 0.119 0.060 0.024 -0.023
Fruits & Nuts -0.001 0.330 0.070 -0.762 0.093 0.384 -0.115
Vegetables -0.037 0.098 0.033 0.086 -0.492 0.248 0.064
Fats & Starches 0.010 0.126 0.003 0.078 0.055 -0.405 0.133
Alcohol 0.096 0.174 -0.009 -0.073 0.044 0.416 -0.648
178
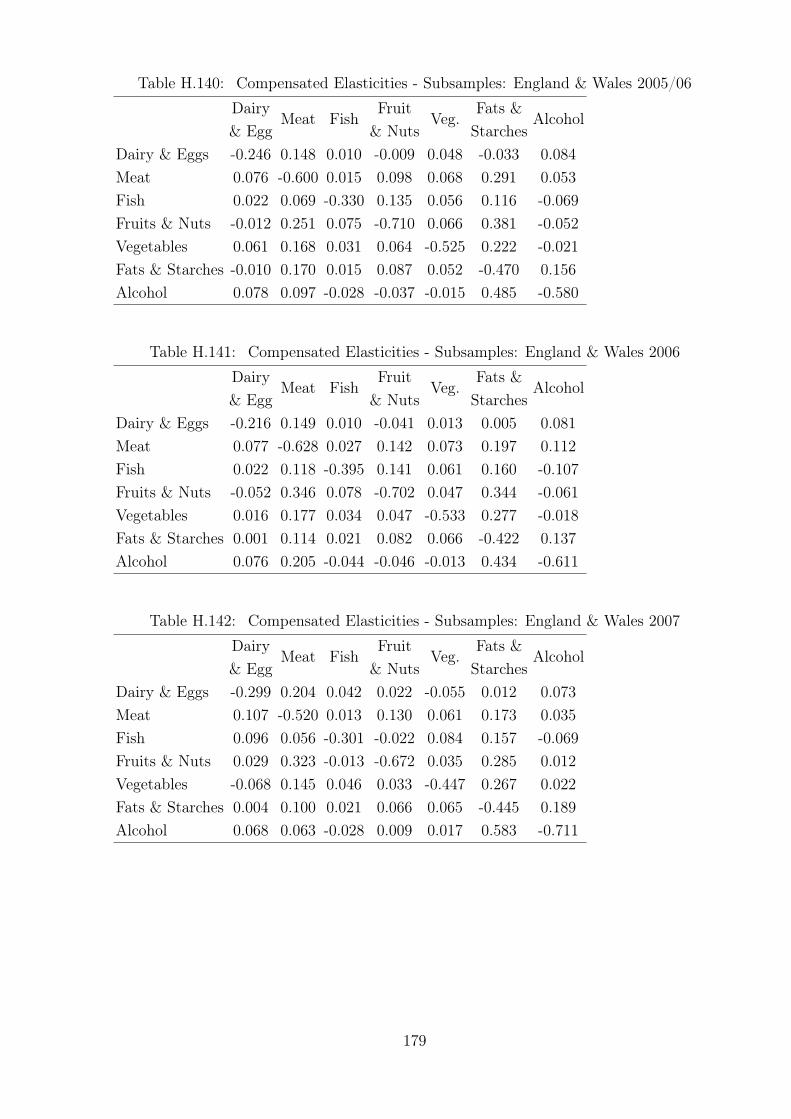
Table H.140: Compensated Elasticities - Subsamples: England & Wales 2005/06
DairyMeat Fish
FruitVeg.
Fats &Alcohol
& Egg & Nuts Starches
Dairy & Eggs -0.246 0.148 0.010 -0.009 0.048 -0.033 0.084
Meat 0.076 -0.600 0.015 0.098 0.068 0.291 0.053
Fish 0.022 0.069 -0.330 0.135 0.056 0.116 -0.069
Fruits & Nuts -0.012 0.251 0.075 -0.710 0.066 0.381 -0.052
Vegetables 0.061 0.168 0.031 0.064 -0.525 0.222 -0.021
Fats & Starches -0.010 0.170 0.015 0.087 0.052 -0.470 0.156
Alcohol 0.078 0.097 -0.028 -0.037 -0.015 0.485 -0.580
Table H.141: Compensated Elasticities - Subsamples: England & Wales 2006
DairyMeat Fish
FruitVeg.
Fats &Alcohol
& Egg & Nuts Starches
Dairy & Eggs -0.216 0.149 0.010 -0.041 0.013 0.005 0.081
Meat 0.077 -0.628 0.027 0.142 0.073 0.197 0.112
Fish 0.022 0.118 -0.395 0.141 0.061 0.160 -0.107
Fruits & Nuts -0.052 0.346 0.078 -0.702 0.047 0.344 -0.061
Vegetables 0.016 0.177 0.034 0.047 -0.533 0.277 -0.018
Fats & Starches 0.001 0.114 0.021 0.082 0.066 -0.422 0.137
Alcohol 0.076 0.205 -0.044 -0.046 -0.013 0.434 -0.611
Table H.142: Compensated Elasticities - Subsamples: England & Wales 2007
DairyMeat Fish
FruitVeg.
Fats &Alcohol
& Egg & Nuts Starches
Dairy & Eggs -0.299 0.204 0.042 0.022 -0.055 0.012 0.073
Meat 0.107 -0.520 0.013 0.130 0.061 0.173 0.035
Fish 0.096 0.056 -0.301 -0.022 0.084 0.157 -0.069
Fruits & Nuts 0.029 0.323 -0.013 -0.672 0.035 0.285 0.012
Vegetables -0.068 0.145 0.046 0.033 -0.447 0.267 0.022
Fats & Starches 0.004 0.100 0.021 0.066 0.065 -0.445 0.189
Alcohol 0.068 0.063 -0.028 0.009 0.017 0.583 -0.711
179
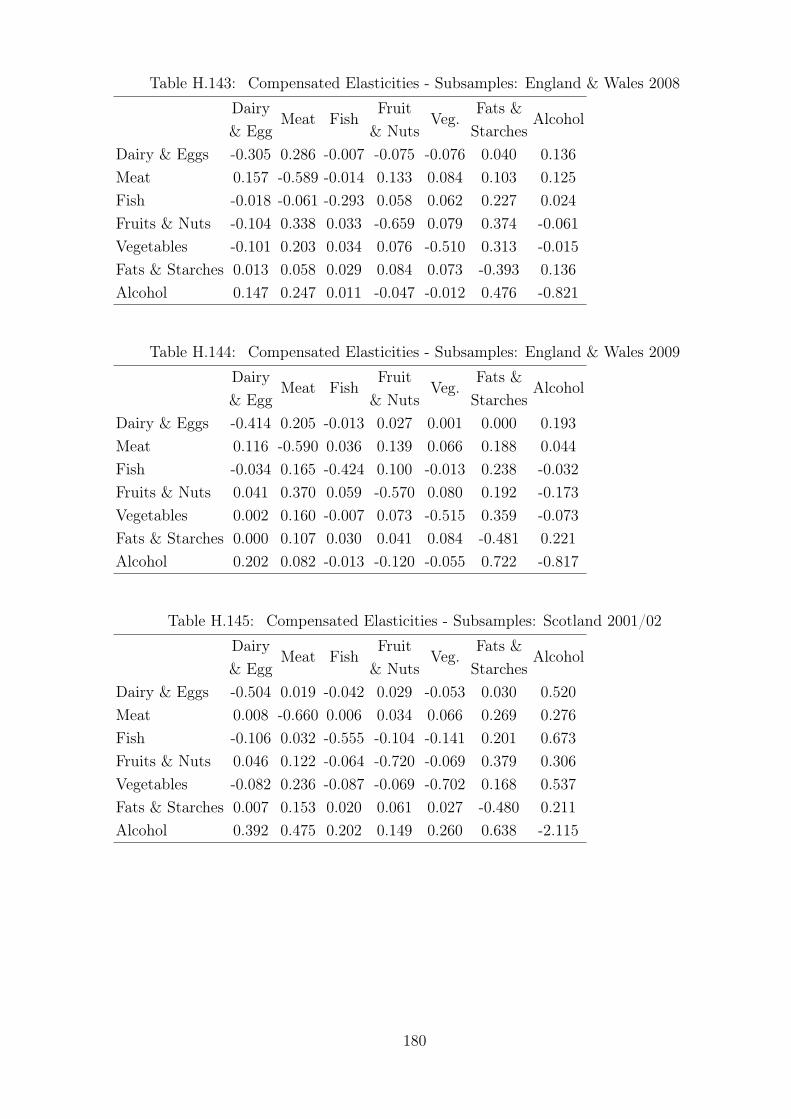
Table H.143: Compensated Elasticities - Subsamples: England & Wales 2008
DairyMeat Fish
FruitVeg.
Fats &Alcohol
& Egg & Nuts Starches
Dairy & Eggs -0.305 0.286 -0.007 -0.075 -0.076 0.040 0.136
Meat 0.157 -0.589 -0.014 0.133 0.084 0.103 0.125
Fish -0.018 -0.061 -0.293 0.058 0.062 0.227 0.024
Fruits & Nuts -0.104 0.338 0.033 -0.659 0.079 0.374 -0.061
Vegetables -0.101 0.203 0.034 0.076 -0.510 0.313 -0.015
Fats & Starches 0.013 0.058 0.029 0.084 0.073 -0.393 0.136
Alcohol 0.147 0.247 0.011 -0.047 -0.012 0.476 -0.821
Table H.144: Compensated Elasticities - Subsamples: England & Wales 2009
DairyMeat Fish
FruitVeg.
Fats &Alcohol
& Egg & Nuts Starches
Dairy & Eggs -0.414 0.205 -0.013 0.027 0.001 0.000 0.193
Meat 0.116 -0.590 0.036 0.139 0.066 0.188 0.044
Fish -0.034 0.165 -0.424 0.100 -0.013 0.238 -0.032
Fruits & Nuts 0.041 0.370 0.059 -0.570 0.080 0.192 -0.173
Vegetables 0.002 0.160 -0.007 0.073 -0.515 0.359 -0.073
Fats & Starches 0.000 0.107 0.030 0.041 0.084 -0.481 0.221
Alcohol 0.202 0.082 -0.013 -0.120 -0.055 0.722 -0.817
Table H.145: Compensated Elasticities - Subsamples: Scotland 2001/02
DairyMeat Fish
FruitVeg.
Fats &Alcohol
& Egg & Nuts Starches
Dairy & Eggs -0.504 0.019 -0.042 0.029 -0.053 0.030 0.520
Meat 0.008 -0.660 0.006 0.034 0.066 0.269 0.276
Fish -0.106 0.032 -0.555 -0.104 -0.141 0.201 0.673
Fruits & Nuts 0.046 0.122 -0.064 -0.720 -0.069 0.379 0.306
Vegetables -0.082 0.236 -0.087 -0.069 -0.702 0.168 0.537
Fats & Starches 0.007 0.153 0.020 0.061 0.027 -0.480 0.211
Alcohol 0.392 0.475 0.202 0.149 0.260 0.638 -2.115
180

Table H.146: Compensated Elasticities - Subsamples: Scotland 2002/03
DairyMeat Fish
FruitVeg.
Fats &Alcohol
& Egg & Nuts Starches
Dairy & Eggs -0.705 0.062 0.100 0.067 -0.109 0.198 0.386
Meat 0.028 -0.468 0.006 0.085 -0.018 0.147 0.221
Fish 0.262 0.034 -0.559 -0.262 -0.160 0.010 0.675
Fruits & Nuts 0.107 0.296 -0.160 -0.883 -0.035 0.115 0.559
Vegetables -0.163 -0.060 -0.092 -0.033 -0.558 0.378 0.527
Fats & Starches 0.051 0.083 0.001 0.019 0.065 -0.477 0.260
Alcohol 0.338 0.425 0.227 0.309 0.309 0.890 -2.498
Table H.147: Compensated Elasticities - Subsamples: Scotland 2003/04
DairyMeat Fish
FruitVeg.
Fats &Alcohol
& Egg & Nuts Starches
Dairy & Eggs -0.676 0.189 -0.111 -0.205 -0.027 0.071 0.758
Meat 0.080 -0.532 0.033 0.110 0.074 -0.024 0.258
Fish -0.284 0.202 -0.370 -0.326 -0.130 0.109 0.800
Fruits & Nuts -0.319 0.404 -0.199 -0.904 -0.060 0.308 0.770
Vegetables -0.042 0.277 -0.080 -0.061 -0.912 0.123 0.695
Fats & Starches 0.017 -0.014 0.010 0.048 0.019 -0.487 0.406
Alcohol 0.611 0.492 0.252 0.398 0.357 1.335 -3.445
Table H.148: Compensated Elasticities - Subsamples: Scotland 2004/05
DairyMeat Fish
FruitVeg.
Fats &Alcohol
& Egg & Nuts Starches
Dairy & Eggs -0.790 0.206 -0.147 0.035 -0.096 -0.018 0.810
Meat 0.095 -0.475 -0.017 -0.085 -0.042 0.390 0.134
Fish -0.376 -0.095 -0.465 -0.157 -0.240 0.397 0.937
Fruits & Nuts 0.052 -0.272 -0.090 -0.595 -0.089 0.289 0.706
Vegetables -0.146 -0.140 -0.143 -0.092 -0.547 0.464 0.604
Fats & Starches -0.005 0.220 0.040 0.051 0.079 -0.651 0.266
Alcohol 0.656 0.236 0.296 0.387 0.320 0.829 -2.724
181

Table H.149: Compensated Elasticities - Subsamples: Scotland 2005/06
DairyMeat Fish
FruitVeg.
Fats &Alcohol
& Egg & Nuts Starches
Dairy & Eggs -0.704 0.130 -0.135 0.107 -0.104 0.058 0.649
Meat 0.059 -0.664 -0.031 0.034 0.027 0.306 0.270
Fish -0.331 -0.164 -0.568 0.104 -0.261 0.397 0.823
Fruits & Nuts 0.144 0.098 0.057 -0.702 0.026 0.085 0.292
Vegetables -0.148 0.083 -0.152 0.028 -0.615 0.398 0.406
Fats & Starches 0.015 0.175 0.042 0.017 0.073 -0.571 0.248
Alcohol 0.502 0.458 0.260 0.169 0.221 0.736 -2.346
Table H.150: Compensated Elasticities - Subsamples: Scotland 2006
DairyMeat Fish
FruitVeg.
Fats &Alcohol
& Egg & Nuts Starches
Dairy & Eggs -0.780 0.275 -0.160 0.095 -0.171 -0.015 0.756
Meat 0.123 -0.707 0.020 0.042 0.065 0.207 0.251
Fish -0.351 0.097 -0.433 0.127 -0.214 0.058 0.716
Fruits & Nuts 0.124 0.122 0.076 -0.811 0.002 -0.027 0.514
Vegetables -0.250 0.212 -0.143 0.003 -0.616 0.292 0.502
Fats & Starches -0.004 0.117 0.007 -0.005 0.051 -0.349 0.184
Alcohol 0.584 0.434 0.253 0.305 0.265 0.562 -2.402
Table H.151: Compensated Elasticities - Subsamples: Scotland 2007
DairyMeat Fish
FruitVeg.
Fats &Alcohol
& Egg & Nuts Starches
Dairy & Eggs -0.640 -0.010 0.021 -0.077 -0.049 0.149 0.605
Meat -0.005 -0.533 -0.035 0.143 -0.007 0.072 0.365
Fish 0.048 -0.167 -0.527 0.073 -0.150 -0.080 0.803
Fruits & Nuts -0.099 0.391 0.042 -0.688 0.036 0.055 0.262
Vegetables -0.073 -0.024 -0.100 0.042 -0.519 0.247 0.426
Fats & Starches 0.039 0.040 -0.009 0.011 0.044 -0.480 0.355
Alcohol 0.584 0.750 0.346 0.196 0.276 1.302 -3.455
182

Table H.152: Compensated Elasticities - Subsamples: Scotland 2008
DairyMeat Fish
FruitVeg.
Fats &Alcohol
& Egg & Nuts Starches
Dairy & Eggs -0.635 -0.208 -0.043 -0.047 -0.016 0.280 0.669
Meat -0.107 -0.561 0.007 0.071 -0.020 0.178 0.431
Fish -0.106 0.036 -0.607 0.183 -0.119 -0.188 0.801
Fruits & Nuts -0.065 0.191 0.101 -0.971 0.103 0.171 0.469
Vegetables -0.025 -0.061 -0.075 0.116 -0.726 0.358 0.412
Fats & Starches 0.078 0.097 -0.021 0.035 0.064 -0.456 0.202
Alcohol 0.674 0.847 0.324 0.342 0.265 0.729 -3.181
Table H.153: Compensated Elasticities - Subsamples: Scotland 2009
DairyMeat Fish
FruitVeg.
Fats &Alcohol
& Egg & Nuts Starches
Dairy & Eggs -0.442 -0.051 -0.009 -0.018 -0.052 0.063 0.509
Meat -0.026 -0.457 0.046 0.136 0.051 0.138 0.113
Fish -0.024 0.238 -0.733 0.032 -0.077 -0.254 0.819
Fruits & Nuts -0.027 0.400 0.018 -1.035 -0.172 0.107 0.708
Vegetables -0.080 0.155 -0.046 -0.178 -0.678 0.213 0.613
Fats & Starches 0.018 0.076 -0.027 0.020 0.039 -0.423 0.297
Alcohol 0.492 0.216 0.302 0.460 0.384 1.029 -2.883
Table H.154: Compensated Elasticities - Subsamples: Northern Ireland 2001/02
DairyMeat Fish
FruitVeg.
Fats &Alcohol
& Egg & Nuts Starches
Dairy & Eggs -0.512 0.070 -0.117 -0.265 -0.107 0.314 0.617
Meat 0.028 -0.735 -0.015 0.128 0.083 0.227 0.283
Fish -0.341 -0.105 -0.580 -0.325 -0.050 0.113 1.288
Fruits & Nuts -0.488 0.579 -0.204 -1.028 -0.167 0.255 1.053
Vegetables -0.178 0.339 -0.029 -0.151 -0.738 0.172 0.585
Fats & Starches 0.073 0.130 0.009 0.032 0.024 -0.517 0.249
Alcohol 0.719 0.810 0.513 0.666 0.409 1.248 -4.365
183

Table H.155: Compensated Elasticities - Subsamples: Northern Ireland 2002/03
DairyMeat Fish
FruitVeg.
Fats &Alcohol
& Egg & Nuts Starches
Dairy & Eggs -0.406 0.185 -0.040 -0.153 -0.047 0.107 0.354
Meat 0.073 -0.790 0.022 0.111 0.048 0.253 0.282
Fish -0.131 0.182 -0.711 -0.205 -0.005 -0.374 1.244
Fruits & Nuts -0.269 0.494 -0.111 -1.049 0.019 0.034 0.882
Vegetables -0.079 0.207 -0.003 0.019 -0.766 0.054 0.569
Fats & Starches 0.026 0.158 -0.029 0.005 0.008 -0.486 0.318
Alcohol 0.366 0.737 0.397 0.518 0.346 1.327 -3.691
Table H.156: Compensated Elasticities - Subsamples: Northern Ireland 2003/04
DairyMeat Fish
FruitVeg.
Fats &Alcohol
& Egg & Nuts Starches
Dairy & Eggs -0.632 0.197 -0.006 -0.084 -0.112 -0.014 0.651
Meat 0.081 -0.674 -0.019 0.039 0.106 0.187 0.281
Fish -0.018 -0.146 -0.425 -0.074 -0.102 0.241 0.524
Fruits & Nuts -0.137 0.154 -0.040 -1.007 -0.229 0.565 0.694
Vegetables -0.172 0.397 -0.051 -0.216 -0.675 0.349 0.367
Fats & Starches -0.003 0.110 0.019 0.083 0.055 -0.546 0.282
Alcohol 0.725 0.765 0.190 0.473 0.266 1.307 -3.727
Table H.157: Compensated Elasticities - Subsamples: Northern Ireland 2004/05
DairyMeat Fish
FruitVeg.
Fats &Alcohol
& Egg & Nuts Starches
Dairy & Eggs -0.443 0.169 -0.042 -0.146 0.066 0.013 0.385
Meat 0.064 -0.538 -0.007 0.046 -0.032 0.171 0.295
Fish -0.120 -0.054 -0.658 -0.071 -0.218 -0.163 1.284
Fruits & Nuts -0.241 0.198 -0.041 -1.030 -0.162 0.248 1.029
Vegetables 0.101 -0.128 -0.118 -0.152 -0.902 0.297 0.901
Fats & Starches 0.003 0.107 -0.014 0.036 0.046 -0.556 0.378
Alcohol 0.449 0.903 0.526 0.727 0.681 1.847 -5.133
184

Table H.158: Compensated Elasticities - Subsamples: Northern Ireland 2005/06
DairyMeat Fish
FruitVeg.
Fats &Alcohol
& Egg & Nuts Starches
Dairy & Eggs -0.761 0.262 -0.029 -0.012 0.010 -0.074 0.604
Meat 0.105 -0.572 -0.036 -0.007 0.054 0.269 0.187
Fish -0.084 -0.263 -0.573 -0.053 -0.075 0.161 0.888
Fruits & Nuts -0.017 -0.023 -0.026 -0.637 -0.074 0.521 0.256
Vegetables 0.015 0.204 -0.039 -0.078 -0.670 0.146 0.423
Fats & Starches -0.018 0.162 0.013 0.089 0.023 -0.532 0.262
Alcohol 0.666 0.514 0.335 0.199 0.310 1.194 -3.217
Table H.159: Compensated Elasticities - Subsamples: Northern Ireland 2006
DairyMeat Fish
FruitVeg.
Fats &Alcohol
& Egg & Nuts Starches
Dairy & Eggs -0.549 0.111 -0.151 -0.015 -0.124 0.113 0.616
Meat 0.043 -0.434 0.021 0.051 0.016 0.230 0.072
Fish -0.431 0.155 -0.768 0.019 -0.041 0.107 0.959
Fruits & Nuts -0.021 0.187 0.009 -0.752 -0.050 0.096 0.531
Vegetables -0.188 0.060 -0.021 -0.054 -0.821 0.242 0.781
Fats & Starches 0.027 0.142 0.009 0.016 0.039 -0.504 0.271
Alcohol 0.692 0.209 0.378 0.420 0.581 1.267 -3.547
Table H.160: Compensated Elasticities - Subsamples: Northern Ireland 2007
DairyMeat Fish
FruitVeg.
Fats &Alcohol
& Egg & Nuts Starches
Dairy & Eggs -0.496 0.259 -0.079 -0.120 -0.179 0.288 0.328
Meat 0.092 -0.554 -0.021 0.061 0.037 0.173 0.212
Fish -0.217 -0.161 -0.652 -0.054 -0.111 -0.021 1.216
Fruits & Nuts -0.149 0.215 -0.025 -0.797 -0.108 0.392 0.472
Vegetables -0.257 0.149 -0.058 -0.124 -0.777 0.408 0.659
Fats & Starches 0.064 0.110 -0.002 0.071 0.064 -0.539 0.233
Alcohol 0.335 0.612 0.454 0.388 0.470 1.063 -3.323
185

Table H.161: Compensated Elasticities - Subsamples: Northern Ireland 2008
DairyMeat Fish
FruitVeg.
Fats &Alcohol
& Egg & Nuts Starches
Dairy & Eggs -0.537 0.154 -0.094 -0.139 -0.026 0.222 0.420
Meat 0.066 -0.468 0.011 0.154 0.055 0.016 0.165
Fish -0.264 0.075 -0.588 0.067 -0.207 0.369 0.549
Fruits & Nuts -0.211 0.543 0.036 -0.895 -0.119 0.430 0.216
Vegetables -0.042 0.205 -0.117 -0.125 -0.749 0.342 0.485
Fats & Starches 0.059 0.010 0.035 0.076 0.057 -0.469 0.232
Alcohol 0.501 0.457 0.231 0.170 0.363 1.033 -2.754
Table H.162: Compensated Elasticities - Subsamples: Northern Ireland 2009
DairyMeat Fish
FruitVeg.
Fats &Alcohol
& Egg & Nuts Starches
Dairy & Eggs -0.736 0.170 -0.093 -0.099 -0.171 0.170 0.759
Meat 0.069 -0.699 -0.027 0.114 0.079 0.101 0.363
Fish -0.281 -0.201 -0.563 -0.069 0.047 0.210 0.858
Fruits & Nuts -0.156 0.443 -0.036 -0.976 -0.045 0.192 0.577
Vegetables -0.261 0.296 0.024 -0.043 -0.885 0.279 0.591
Fats & Starches 0.041 0.061 0.017 0.030 0.045 -0.417 0.224
Alcohol 0.816 0.965 0.304 0.395 0.417 0.987 -3.884
Table H.163: Compensated Elasticities - Subsamples: Households in lowest income quin-tile 2001/02
DairyMeat Fish
FruitVeg.
Fats &Alcohol
& Egg & Nuts Starches
Dairy & Eggs -0.406 0.253 0.045 -0.061 -0.086 -0.092 0.347
Meat 0.114 -0.604 -0.023 0.098 0.041 0.226 0.148
Fish 0.108 -0.120 -0.391 0.071 -0.009 0.327 0.013
Fruits & Nuts -0.099 0.354 0.048 -0.732 0.014 0.264 0.151
Vegetables -0.121 0.126 -0.005 0.012 -0.522 0.211 0.299
Fats & Starches -0.024 0.128 0.035 0.041 0.039 -0.429 0.209
Alcohol 0.284 0.267 0.004 0.075 0.174 0.666 -1.470
186
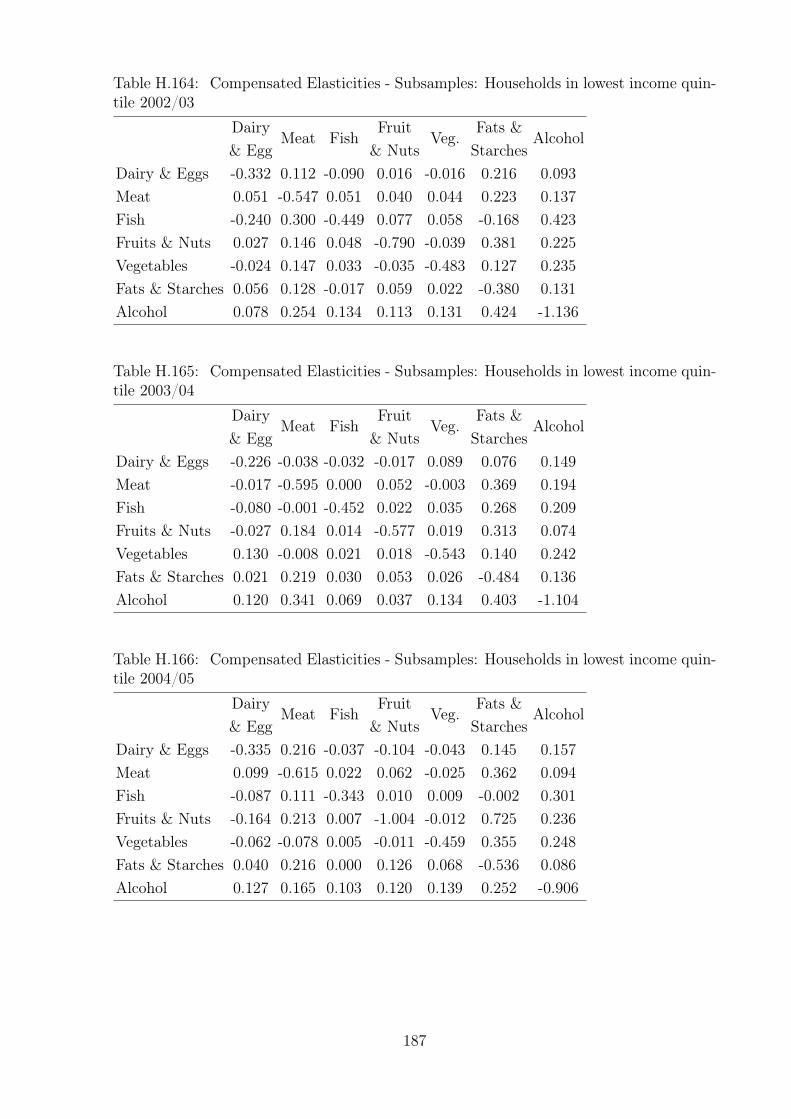
Table H.164: Compensated Elasticities - Subsamples: Households in lowest income quin-tile 2002/03
DairyMeat Fish
FruitVeg.
Fats &Alcohol
& Egg & Nuts Starches
Dairy & Eggs -0.332 0.112 -0.090 0.016 -0.016 0.216 0.093
Meat 0.051 -0.547 0.051 0.040 0.044 0.223 0.137
Fish -0.240 0.300 -0.449 0.077 0.058 -0.168 0.423
Fruits & Nuts 0.027 0.146 0.048 -0.790 -0.039 0.381 0.225
Vegetables -0.024 0.147 0.033 -0.035 -0.483 0.127 0.235
Fats & Starches 0.056 0.128 -0.017 0.059 0.022 -0.380 0.131
Alcohol 0.078 0.254 0.134 0.113 0.131 0.424 -1.136
Table H.165: Compensated Elasticities - Subsamples: Households in lowest income quin-tile 2003/04
DairyMeat Fish
FruitVeg.
Fats &Alcohol
& Egg & Nuts Starches
Dairy & Eggs -0.226 -0.038 -0.032 -0.017 0.089 0.076 0.149
Meat -0.017 -0.595 0.000 0.052 -0.003 0.369 0.194
Fish -0.080 -0.001 -0.452 0.022 0.035 0.268 0.209
Fruits & Nuts -0.027 0.184 0.014 -0.577 0.019 0.313 0.074
Vegetables 0.130 -0.008 0.021 0.018 -0.543 0.140 0.242
Fats & Starches 0.021 0.219 0.030 0.053 0.026 -0.484 0.136
Alcohol 0.120 0.341 0.069 0.037 0.134 0.403 -1.104
Table H.166: Compensated Elasticities - Subsamples: Households in lowest income quin-tile 2004/05
DairyMeat Fish
FruitVeg.
Fats &Alcohol
& Egg & Nuts Starches
Dairy & Eggs -0.335 0.216 -0.037 -0.104 -0.043 0.145 0.157
Meat 0.099 -0.615 0.022 0.062 -0.025 0.362 0.094
Fish -0.087 0.111 -0.343 0.010 0.009 -0.002 0.301
Fruits & Nuts -0.164 0.213 0.007 -1.004 -0.012 0.725 0.236
Vegetables -0.062 -0.078 0.005 -0.011 -0.459 0.355 0.248
Fats & Starches 0.040 0.216 0.000 0.126 0.068 -0.536 0.086
Alcohol 0.127 0.165 0.103 0.120 0.139 0.252 -0.906
187

Table H.167: Compensated Elasticities - Subsamples: Households in lowest income quin-tile 2005/06
DairyMeat Fish
FruitVeg.
Fats &Alcohol
& Egg & Nuts Starches
Dairy & Eggs -0.287 0.064 0.004 -0.021 0.072 -0.063 0.231
Meat 0.032 -0.708 -0.011 0.102 0.034 0.359 0.194
Fish 0.011 -0.059 -0.409 0.125 -0.041 0.190 0.182
Fruits & Nuts -0.033 0.319 0.076 -0.698 0.074 0.186 0.075
Vegetables 0.105 0.101 -0.023 0.069 -0.536 0.185 0.099
Fats & Starches -0.019 0.215 0.022 0.035 0.037 -0.505 0.214
Alcohol 0.224 0.383 0.069 0.047 0.066 0.708 -1.498
Table H.168: Compensated Elasticities - Subsamples: Households in lowest income quin-tile 2006
DairyMeat Fish
FruitVeg.
Fats &Alcohol
& Egg & Nuts Starches
Dairy & Eggs -0.254 0.115 -0.032 0.032 0.023 -0.073 0.189
Meat 0.054 -0.618 0.013 0.068 0.036 0.162 0.286
Fish -0.068 0.056 -0.359 0.047 -0.018 0.136 0.206
Fruits & Nuts 0.044 0.198 0.031 -0.775 0.147 0.350 0.006
Vegetables 0.031 0.103 -0.012 0.144 -0.571 0.194 0.110
Fats & Starches -0.020 0.096 0.018 0.071 0.040 -0.402 0.197
Alcohol 0.159 0.516 0.083 0.004 0.069 0.598 -1.428
Table H.169: Compensated Elasticities - Subsamples: Households in lowest income quin-tile 2007
DairyMeat Fish
FruitVeg.
Fats &Alcohol
& Egg & Nuts Starches
Dairy & Eggs -0.356 0.046 0.066 0.006 -0.061 0.084 0.214
Meat 0.022 -0.460 0.036 0.104 0.029 0.190 0.079
Fish 0.149 0.172 -0.547 -0.058 -0.108 0.174 0.217
Fruits & Nuts 0.009 0.326 -0.038 -0.604 -0.131 0.233 0.205
Vegetables -0.081 0.081 -0.063 -0.116 -0.479 0.272 0.386
Fats & Starches 0.024 0.113 0.022 0.044 0.058 -0.484 0.223
Alcohol 0.174 0.135 0.078 0.112 0.237 0.638 -1.374
188

Table H.170: Compensated Elasticities - Subsamples: Households in lowest income quin-tile 2008
DairyMeat Fish
FruitVeg.
Fats &Alcohol
& Egg & Nuts Starches
Dairy & Eggs -0.608 0.310 -0.085 -0.033 -0.053 0.187 0.282
Meat 0.173 -0.540 -0.014 -0.023 0.019 0.358 0.026
Fish -0.267 -0.077 -0.516 0.060 -0.098 0.330 0.569
Fruits & Nuts -0.060 -0.074 0.034 -0.627 0.044 0.258 0.424
Vegetables -0.092 0.058 -0.054 0.043 -0.540 0.204 0.381
Fats & Starches 0.056 0.191 0.031 0.043 0.035 -0.526 0.170
Alcohol 0.469 0.077 0.301 0.394 0.368 0.946 -2.555
Table H.171: Compensated Elasticities - Subsamples: Households in lowest income quin-tile 2009
DairyMeat Fish
FruitVeg.
Fats &Alcohol
& Egg & Nuts Starches
Dairy & Eggs -0.459 0.067 -0.084 0.012 0.059 0.057 0.349
Meat 0.038 -0.606 0.002 0.043 -0.011 0.296 0.238
Fish -0.258 0.009 -0.455 -0.051 0.096 0.335 0.325
Fruits & Nuts 0.023 0.141 -0.031 -0.527 -0.070 0.347 0.117
Vegetables 0.099 -0.032 0.053 -0.062 -0.578 0.331 0.190
Fats & Starches 0.017 0.156 0.033 0.055 0.059 -0.507 0.187
Alcohol 0.564 0.673 0.172 0.100 0.181 1.003 -2.692
Table H.172: Compensated Elasticities - Subsamples: Households w/ children 2001/02
DairyMeat Fish
FruitVeg.
Fats &Alcohol
& Egg & Nuts Starches
Dairy & Eggs -0.459 0.138 0.000 -0.004 -0.002 0.208 0.119
Meat 0.068 -0.640 0.026 0.104 0.047 0.344 0.052
Fish -0.001 0.188 -0.450 0.069 -0.028 0.116 0.105
Fruits & Nuts -0.007 0.352 0.032 -0.847 -0.010 0.428 0.051
Vegetables -0.004 0.171 -0.014 -0.011 -0.763 0.417 0.204
Fats & Starches 0.053 0.177 0.008 0.065 0.059 -0.458 0.096
Alcohol 0.128 0.114 0.031 0.033 0.124 0.407 -0.837
189

Table H.173: Compensated Elasticities - Subsamples: Households w/ children 2002/03
DairyMeat Fish
FruitVeg.
Fats &Alcohol
& Egg & Nuts Starches
Dairy & Eggs -0.444 0.196 -0.014 -0.058 -0.055 0.236 0.139
Meat 0.097 -0.532 -0.004 0.105 0.090 0.234 0.010
Fish -0.050 -0.026 -0.553 0.251 -0.119 0.357 0.140
Fruits & Nuts -0.097 0.357 0.118 -0.902 -0.033 0.508 0.048
Vegetables -0.099 0.333 -0.061 -0.036 -0.680 0.459 0.083
Fats & Starches 0.060 0.121 0.026 0.077 0.065 -0.489 0.140
Alcohol 0.147 0.021 0.042 0.031 0.049 0.583 -0.872
Table H.174: Compensated Elasticities - Subsamples: Households w/ children 2003/04
DairyMeat Fish
FruitVeg.
Fats &Alcohol
& Egg & Nuts Starches
Dairy & Eggs -0.381 0.245 0.022 -0.040 -0.040 0.069 0.125
Meat 0.114 -0.589 0.002 0.131 0.055 0.257 0.029
Fish 0.082 0.019 -0.547 0.036 0.115 0.255 0.040
Fruits & Nuts -0.065 0.457 0.016 -0.832 -0.073 0.369 0.128
Vegetables -0.071 0.209 0.056 -0.079 -0.659 0.497 0.047
Fats & Starches 0.017 0.140 0.018 0.058 0.072 -0.473 0.168
Alcohol 0.133 0.066 0.012 0.083 0.028 0.702 -1.024
Table H.175: Compensated Elasticities - Subsamples: Households w/ children 2004/05
DairyMeat Fish
FruitVeg.
Fats &Alcohol
& Egg & Nuts Starches
Dairy & Eggs -0.371 0.179 0.023 -0.023 -0.080 0.157 0.115
Meat 0.085 -0.620 -0.017 0.067 0.054 0.345 0.086
Fish 0.084 -0.133 -0.549 0.084 0.002 0.367 0.144
Fruits & Nuts -0.037 0.226 0.037 -0.882 0.048 0.475 0.133
Vegetables -0.142 0.203 0.001 0.053 -0.689 0.373 0.202
Fats & Starches 0.040 0.186 0.026 0.076 0.054 -0.470 0.088
Alcohol 0.117 0.184 0.040 0.084 0.115 0.346 -0.887
190

Table H.176: Compensated Elasticities - Subsamples: Households w/ children 2005/06
DairyMeat Fish
FruitVeg.
Fats &Alcohol
& Egg & Nuts Starches
Dairy & Eggs -0.399 0.139 -0.022 -0.056 0.016 0.113 0.209
Meat 0.071 -0.715 0.010 0.112 0.055 0.394 0.072
Fish -0.074 0.065 -0.530 0.076 -0.028 0.426 0.065
Fruits & Nuts -0.079 0.316 0.033 -0.785 0.023 0.518 -0.025
Vegetables 0.026 0.180 -0.014 0.027 -0.748 0.512 0.018
Fats & Starches 0.031 0.211 0.035 0.099 0.084 -0.633 0.173
Alcohol 0.221 0.151 0.021 -0.019 0.011 0.671 -1.057
Table H.177: Compensated Elasticities - Subsamples: Households w/ children 2006
DairyMeat Fish
FruitVeg.
Fats &Alcohol
& Egg & Nuts Starches
Dairy & Eggs -0.603 0.164 -0.040 0.025 0.014 0.260 0.180
Meat 0.081 -0.688 0.006 0.137 0.045 0.312 0.108
Fish -0.135 0.038 -0.581 0.156 -0.046 0.434 0.135
Fruits & Nuts 0.034 0.374 0.063 -0.718 0.082 0.200 -0.035
Vegetables 0.020 0.130 -0.020 0.086 -0.620 0.321 0.083
Fats & Starches 0.072 0.176 0.036 0.041 0.063 -0.522 0.133
Alcohol 0.194 0.235 0.043 -0.028 0.063 0.514 -1.022
Table H.178: Compensated Elasticities - Subsamples: Households w/ children 2007
DairyMeat Fish
FruitVeg.
Fats &Alcohol
& Egg & Nuts Starches
Dairy & Eggs -0.362 0.204 -0.019 0.010 -0.062 0.076 0.153
Meat 0.105 -0.538 -0.013 0.100 0.056 0.203 0.088
Fish -0.059 -0.078 -0.323 -0.047 0.114 0.315 0.078
Fruits & Nuts 0.014 0.276 -0.021 -0.788 -0.035 0.340 0.214
Vegetables -0.091 0.159 0.053 -0.036 -0.563 0.393 0.086
Fats & Starches 0.021 0.111 0.028 0.067 0.075 -0.450 0.147
Alcohol 0.177 0.198 0.028 0.174 0.068 0.601 -1.246
191
Table H.179: Compensated Elasticities - Subsamples: Households w/ children 2008
DairyMeat Fish
FruitVeg.
Fats &Alcohol
& Egg & Nuts Starches
Dairy & Eggs -0.428 0.274 0.032 -0.072 -0.102 0.121 0.175
Meat 0.150 -0.545 0.001 0.102 0.054 0.132 0.107
Fish 0.103 0.007 -0.486 -0.076 -0.016 0.283 0.186
Fruits & Nuts -0.112 0.290 -0.037 -0.757 -0.016 0.386 0.246
Vegetables -0.155 0.149 -0.008 -0.015 -0.586 0.520 0.095
Fats & Starches 0.035 0.070 0.026 0.072 0.100 -0.395 0.092
Alcohol 0.222 0.248 0.074 0.200 0.080 0.403 -1.228
Table H.180: Compensated Elasticities - Subsamples: Households w/ children 2009
DairyMeat Fish
FruitVeg.
Fats &Alcohol
& Egg & Nuts Starches
Dairy & Eggs -0.590 0.258 -0.055 -0.027 -0.023 0.157 0.279
Meat 0.150 -0.630 0.018 0.153 0.070 0.215 0.024
Fish -0.183 0.105 -0.585 0.009 0.055 0.357 0.243
Fruits & Nuts -0.045 0.436 0.004 -0.823 -0.032 0.438 0.022
Vegetables -0.036 0.192 0.026 -0.030 -0.526 0.416 -0.042
Fats & Starches 0.047 0.111 0.032 0.080 0.079 -0.525 0.176
Alcohol 0.379 0.056 0.098 0.018 -0.036 0.798 -1.313
192
IN
utrie
nt
Ela
sticityEstim
ate
s
Table I.1: Nutrient elasticities - 2001/02
Nutrient Unit Dairy & Eggs Meat Fish Fruits & Nuts Vegetables Fats & Starches Alcohol Expenditure
Vegetable Protein g -0.097 -0.101 -0.032 -0.056 -0.067 -0.666 -0.040 1.059
Animal Protein g -0.364 -0.133 -0.021 -0.057 -0.073 -0.297 0.031 0.914
Fat g -0.283 -0.107 -0.023 -0.053 -0.064 -0.447 0.011 0.966
Saturates g -0.273 -0.110 -0.024 -0.044 -0.060 -0.474 0.011 0.975
Mono-unsaturates g -0.282 -0.114 -0.023 -0.056 -0.062 -0.439 0.011 0.965
Poly-unsaturates g -0.260 -0.097 -0.025 -0.063 -0.070 -0.458 0.002 0.971
Carbohydrate g -0.113 -0.084 -0.033 -0.040 -0.044 -0.715 -0.033 1.062
Energy - Kcal kcal -0.239 -0.102 -0.026 -0.051 -0.060 -0.494 -0.012 0.985
Energy - MJ MJ -0.239 -0.102 -0.026 -0.051 -0.060 -0.495 -0.012 0.985
Calcium mg -0.318 -0.065 -0.022 -0.057 -0.074 -0.424 0.015 0.945
Iron mg -0.285 -0.086 -0.023 -0.053 -0.072 -0.447 0.005 0.961
Retinol ug -0.376 -0.082 -0.017 -0.060 -0.075 -0.339 0.033 0.916
Carotene ug -0.135 -0.086 -0.026 -0.053 -0.336 -0.296 -0.046 0.979
Retinol equivalent ug -0.355 -0.082 -0.018 -0.060 -0.098 -0.336 0.026 0.922
Thiamin mg -0.204 -0.132 -0.027 -0.042 -0.067 -0.529 -0.006 1.008
Riboflavin mg -0.351 -0.075 -0.019 -0.060 -0.074 -0.373 0.025 0.928
Niacin Equivalent mg -0.275 -0.151 -0.025 -0.053 -0.068 -0.400 0.009 0.962
Vitamin C mg -0.117 -0.020 0.004 -0.402 -0.164 -0.132 -0.093 0.925
Vitamin D ug -0.383 -0.069 -0.022 -0.061 -0.076 -0.325 0.032 0.904
Folate ug -0.315 -0.064 -0.021 -0.064 -0.089 -0.403 0.013 0.942
Sodium mg -0.214 -0.151 -0.030 -0.026 -0.062 -0.519 -0.001 1.004
Starch g -0.098 -0.103 -0.038 0.003 -0.041 -0.780 -0.027 1.083
Glucose g -0.110 -0.044 -0.017 -0.206 -0.065 -0.496 -0.069 1.008
193

Table I.2: Nutrient elasticities - 2001/02 (cont.)
Nutrient Unit Dairy & Eggs Meat Fish Fruits & Nuts Vegetables Fats & Starches Alcohol Expenditure
Fructose g -0.112 -0.022 -0.010 -0.289 -0.073 -0.392 -0.083 0.980
Sucrose g -0.112 -0.073 -0.033 -0.038 -0.038 -0.741 -0.033 1.067
Maltose g -0.098 -0.092 -0.037 -0.009 -0.029 -0.770 -0.045 1.079
Lactose g -0.301 -0.062 -0.023 -0.042 -0.064 -0.486 0.016 0.963
Other sugars g -0.125 -0.079 -0.035 -0.007 -0.067 -0.719 -0.028 1.061
Total sugars g -0.129 -0.064 -0.027 -0.087 -0.048 -0.646 -0.039 1.040
Non-milk extr sugars g -0.111 -0.073 -0.034 -0.032 -0.033 -0.751 -0.036 1.069
Alcohol g 0.038 0.046 -0.073 -0.098 -0.041 -0.010 -0.751 0.889
Fibre:Southgate g -0.104 -0.072 -0.027 -0.097 -0.096 -0.599 -0.045 1.039
Fibre:Englyst g -0.104 -0.075 -0.027 -0.095 -0.102 -0.590 -0.045 1.038
Potassium mg -0.204 -0.107 -0.027 -0.070 -0.076 -0.492 -0.018 0.994
Magnesium mg -0.206 -0.095 -0.027 -0.070 -0.063 -0.514 -0.020 0.995
Copper mg -0.228 -0.094 -0.025 -0.069 -0.073 -0.487 -0.010 0.985
Zinc mg -0.318 -0.126 -0.020 -0.059 -0.073 -0.365 0.019 0.943
Vitamin B6 mg -0.222 -0.149 -0.026 -0.061 -0.072 -0.448 -0.009 0.987
Vitamin B12 ug -0.394 -0.079 -0.021 -0.064 -0.077 -0.296 0.034 0.896
Phosphorus mg -0.328 -0.096 -0.021 -0.061 -0.075 -0.372 0.018 0.935
Manganese mg -0.100 -0.081 -0.033 -0.048 -0.052 -0.709 -0.041 1.064
Biotin ug -0.371 -0.054 -0.016 -0.082 -0.077 -0.334 0.024 0.911
Pantothenic acid mg -0.345 -0.082 -0.019 -0.067 -0.079 -0.336 0.006 0.922
Vitamin E mg -0.248 -0.069 -0.026 -0.055 -0.075 -0.506 -0.001 0.980
Cholesterol mg -0.414 -0.060 -0.015 -0.069 -0.080 -0.295 0.039 0.893
194
Table I.3: Nutrient elasticities - 2002/03
Nutrient Unit Dairy & Eggs Meat Fish Fruits & Nuts Vegetables Fats & Starches Alcohol Expenditure
Vegetable Protein g -0.102 -0.125 -0.034 -0.060 -0.055 -0.672 -0.008 1.057
Animal Protein g -0.297 -0.125 -0.021 -0.024 -0.094 -0.323 -0.027 0.911
Fat g -0.237 -0.114 -0.024 -0.032 -0.073 -0.468 -0.014 0.962
Saturates g -0.231 -0.120 -0.024 -0.024 -0.068 -0.494 -0.010 0.972
Mono-unsaturates g -0.236 -0.120 -0.024 -0.035 -0.071 -0.462 -0.016 0.962
Poly-unsaturates g -0.220 -0.104 -0.026 -0.046 -0.077 -0.477 -0.018 0.968
Carbohydrate g -0.114 -0.115 -0.034 -0.044 -0.032 -0.724 0.004 1.059
Energy - Kcal kcal -0.206 -0.115 -0.027 -0.037 -0.065 -0.509 -0.023 0.982
Energy - MJ MJ -0.205 -0.115 -0.027 -0.037 -0.065 -0.510 -0.023 0.982
Calcium mg -0.265 -0.072 -0.024 -0.033 -0.088 -0.441 -0.018 0.940
Iron mg -0.240 -0.095 -0.024 -0.032 -0.083 -0.464 -0.020 0.958
Retinol ug -0.306 -0.085 -0.017 -0.026 -0.096 -0.361 -0.022 0.913
Carotene ug -0.151 -0.067 -0.025 -0.041 -0.346 -0.266 -0.087 0.984
Retinol equivalent ug -0.292 -0.083 -0.018 -0.028 -0.117 -0.354 -0.027 0.919
Thiamin mg -0.180 -0.144 -0.028 -0.030 -0.067 -0.547 -0.010 1.006
Riboflavin mg -0.288 -0.078 -0.020 -0.030 -0.092 -0.395 -0.020 0.924
Niacin Equivalent mg -0.230 -0.151 -0.026 -0.031 -0.077 -0.423 -0.023 0.960
Vitamin C mg -0.094 0.023 -0.009 -0.430 -0.152 -0.122 -0.139 0.924
Vitamin D ug -0.311 -0.067 -0.024 -0.027 -0.098 -0.348 -0.024 0.900
Folate ug -0.262 -0.068 -0.022 -0.039 -0.103 -0.420 -0.023 0.939
Sodium mg -0.187 -0.162 -0.030 -0.011 -0.064 -0.542 -0.008 1.003
Starch g -0.106 -0.140 -0.038 0.001 -0.027 -0.790 0.021 1.081
Glucose g -0.101 -0.049 -0.024 -0.221 -0.053 -0.497 -0.059 1.004
195

Table I.4: Nutrient elasticities - 2002/03 (cont.)
Nutrient Unit Dairy & Eggs Meat Fish Fruits & Nuts Vegetables Fats & Starches Alcohol Expenditure
Fructose g -0.096 -0.015 -0.020 -0.306 -0.060 -0.396 -0.085 0.978
Sucrose g -0.114 -0.107 -0.034 -0.042 -0.025 -0.750 0.009 1.063
Maltose g -0.105 -0.132 -0.037 -0.014 -0.016 -0.776 0.004 1.075
Lactose g -0.255 -0.075 -0.024 -0.019 -0.076 -0.500 -0.007 0.957
Other sugars g -0.129 -0.112 -0.035 -0.007 -0.059 -0.724 0.007 1.058
Total sugars g -0.123 -0.087 -0.030 -0.092 -0.038 -0.652 -0.013 1.036
Non-milk extr sugars g -0.113 -0.108 -0.035 -0.037 -0.020 -0.757 0.007 1.064
Alcohol g -0.024 -0.044 -0.049 -0.140 -0.095 0.178 -0.703 0.877
Fibre:Southgate g -0.106 -0.086 -0.030 -0.105 -0.086 -0.598 -0.025 1.037
Fibre:Englyst g -0.107 -0.088 -0.030 -0.103 -0.092 -0.588 -0.027 1.035
Potassium mg -0.180 -0.115 -0.028 -0.062 -0.078 -0.501 -0.027 0.990
Magnesium mg -0.180 -0.107 -0.029 -0.062 -0.065 -0.525 -0.024 0.992
Copper mg -0.197 -0.104 -0.026 -0.057 -0.077 -0.499 -0.022 0.982
Zinc mg -0.263 -0.125 -0.020 -0.032 -0.088 -0.388 -0.024 0.940
Vitamin B6 mg -0.192 -0.152 -0.026 -0.047 -0.076 -0.466 -0.026 0.985
Vitamin B12 ug -0.319 -0.074 -0.023 -0.028 -0.101 -0.319 -0.027 0.892
Phosphorus mg -0.271 -0.097 -0.023 -0.034 -0.091 -0.392 -0.024 0.931
Manganese mg -0.105 -0.111 -0.035 -0.053 -0.040 -0.715 -0.003 1.061
Biotin ug -0.303 -0.054 -0.018 -0.052 -0.098 -0.353 -0.029 0.906
Pantothenic acid mg -0.284 -0.084 -0.019 -0.038 -0.099 -0.351 -0.042 0.918
Vitamin E mg -0.214 -0.081 -0.028 -0.041 -0.082 -0.517 -0.014 0.976
Cholesterol mg -0.335 -0.056 -0.016 -0.031 -0.106 -0.317 -0.026 0.888
196

Table I.5: Nutrient elasticities - 2003/04
Nutrient Unit Dairy & Eggs Meat Fish Fruits & Nuts Vegetables Fats & Starches Alcohol Expenditure
Vegetable Protein g -0.113 -0.107 -0.025 -0.074 -0.051 -0.674 -0.012 1.055
Animal Protein g -0.272 -0.106 -0.041 -0.056 -0.094 -0.350 -0.007 0.926
Fat g -0.224 -0.091 -0.034 -0.060 -0.072 -0.487 -0.003 0.972
Saturates g -0.219 -0.097 -0.033 -0.053 -0.067 -0.510 -0.001 0.980
Mono-unsaturates g -0.223 -0.098 -0.034 -0.063 -0.070 -0.480 -0.004 0.972
Poly-unsaturates g -0.211 -0.083 -0.034 -0.071 -0.076 -0.496 -0.007 0.976
Carbohydrate g -0.124 -0.092 -0.025 -0.062 -0.029 -0.727 -0.002 1.060
Energy - Kcal kcal -0.197 -0.094 -0.033 -0.060 -0.063 -0.525 -0.016 0.989
Energy - MJ MJ -0.197 -0.094 -0.033 -0.060 -0.063 -0.526 -0.016 0.989
Calcium mg -0.248 -0.048 -0.036 -0.062 -0.087 -0.468 -0.004 0.952
Iron mg -0.227 -0.072 -0.034 -0.060 -0.081 -0.485 -0.009 0.968
Retinol ug -0.282 -0.058 -0.037 -0.060 -0.096 -0.392 -0.001 0.927
Carotene ug -0.148 -0.072 -0.027 -0.037 -0.361 -0.258 -0.071 0.975
Retinol equivalent ug -0.271 -0.059 -0.037 -0.058 -0.118 -0.382 -0.007 0.931
Thiamin mg -0.175 -0.124 -0.030 -0.053 -0.066 -0.556 -0.006 1.011
Riboflavin mg -0.268 -0.054 -0.037 -0.062 -0.091 -0.423 -0.002 0.937
Niacin Equivalent mg -0.216 -0.134 -0.036 -0.057 -0.077 -0.438 -0.011 0.970
Vitamin C mg -0.118 0.010 -0.013 -0.378 -0.145 -0.198 -0.081 0.923
Vitamin D ug -0.288 -0.044 -0.043 -0.061 -0.098 -0.380 -0.003 0.916
Folate ug -0.248 -0.046 -0.035 -0.067 -0.103 -0.444 -0.007 0.949
Sodium mg -0.181 -0.143 -0.034 -0.038 -0.063 -0.544 -0.006 1.008
Starch g -0.115 -0.115 -0.026 -0.025 -0.024 -0.781 0.007 1.080
Glucose g -0.118 -0.042 -0.020 -0.203 -0.046 -0.540 -0.038 1.007
197
Table I.6: Nutrient elasticities - 2003/04 (cont.)
Nutrient Unit Dairy & Eggs Meat Fish Fruits & Nuts Vegetables Fats & Starches Alcohol Expenditure
Fructose g -0.117 -0.014 -0.017 -0.274 -0.051 -0.456 -0.051 0.981
Sucrose g -0.124 -0.082 -0.024 -0.061 -0.021 -0.752 0.001 1.064
Maltose g -0.114 -0.107 -0.026 -0.036 -0.013 -0.771 -0.010 1.075
Lactose g -0.241 -0.048 -0.035 -0.051 -0.074 -0.522 0.004 0.968
Other sugars g -0.135 -0.087 -0.027 -0.031 -0.058 -0.716 -0.003 1.057
Total sugars g -0.133 -0.068 -0.024 -0.102 -0.034 -0.667 -0.010 1.038
Non-milk extr sugars g -0.123 -0.084 -0.025 -0.056 -0.017 -0.760 -0.001 1.065
Alcohol g 0.003 -0.053 -0.061 -0.070 -0.079 0.122 -0.737 0.874
Fibre:Southgate g -0.118 -0.072 -0.023 -0.110 -0.081 -0.611 -0.020 1.035
Fibre:Englyst g -0.119 -0.074 -0.023 -0.108 -0.087 -0.600 -0.021 1.034
Potassium mg -0.177 -0.099 -0.031 -0.078 -0.077 -0.514 -0.019 0.995
Magnesium mg -0.178 -0.088 -0.031 -0.081 -0.062 -0.539 -0.017 0.997
Copper mg -0.192 -0.085 -0.031 -0.078 -0.073 -0.516 -0.012 0.988
Zinc mg -0.244 -0.105 -0.036 -0.060 -0.087 -0.411 -0.007 0.951
Vitamin B6 mg -0.184 -0.137 -0.032 -0.066 -0.075 -0.480 -0.017 0.991
Vitamin B12 ug -0.293 -0.053 -0.044 -0.062 -0.101 -0.351 -0.005 0.908
Phosphorus mg -0.252 -0.075 -0.038 -0.063 -0.090 -0.418 -0.007 0.944
Manganese mg -0.116 -0.089 -0.025 -0.071 -0.037 -0.711 -0.010 1.059
Biotin ug -0.281 -0.029 -0.037 -0.082 -0.097 -0.388 -0.006 0.920
Pantothenic acid mg -0.263 -0.062 -0.038 -0.066 -0.098 -0.382 -0.023 0.931
Vitamin E mg -0.206 -0.059 -0.033 -0.065 -0.079 -0.537 -0.005 0.984
Cholesterol mg -0.307 -0.031 -0.040 -0.066 -0.105 -0.355 -0.001 0.905
198

Table I.7: Nutrient elasticities - 2004/05
Nutrient Unit Dairy & Eggs Meat Fish Fruits & Nuts Vegetables Fats & Starches Alcohol Expenditure
Vegetable Protein g -0.096 -0.113 -0.032 -0.072 -0.063 -0.652 -0.020 1.049
Animal Protein g -0.366 -0.102 -0.034 -0.051 -0.073 -0.307 0.006 0.926
Fat g -0.284 -0.090 -0.032 -0.055 -0.062 -0.448 0.002 0.970
Saturates g -0.276 -0.097 -0.033 -0.045 -0.058 -0.475 0.005 0.979
Mono-unsaturates g -0.283 -0.096 -0.032 -0.059 -0.060 -0.440 0.001 0.969
Poly-unsaturates g -0.261 -0.082 -0.032 -0.070 -0.067 -0.455 -0.004 0.972
Carbohydrate g -0.115 -0.100 -0.034 -0.048 -0.040 -0.712 -0.008 1.056
Energy - Kcal kcal -0.242 -0.094 -0.033 -0.054 -0.057 -0.491 -0.014 0.986
Energy - MJ MJ -0.241 -0.094 -0.033 -0.054 -0.057 -0.493 -0.013 0.987
Calcium mg -0.319 -0.048 -0.033 -0.055 -0.071 -0.427 0.004 0.950
Iron mg -0.287 -0.073 -0.033 -0.053 -0.070 -0.446 -0.003 0.965
Retinol ug -0.380 -0.053 -0.031 -0.055 -0.073 -0.343 0.011 0.925
Carotene ug -0.130 -0.110 -0.027 -0.032 -0.349 -0.281 -0.040 0.969
Retinol equivalent ug -0.358 -0.058 -0.031 -0.053 -0.097 -0.339 0.006 0.930
Thiamin mg -0.206 -0.127 -0.033 -0.043 -0.065 -0.530 -0.003 1.008
Riboflavin mg -0.355 -0.052 -0.032 -0.057 -0.072 -0.376 0.008 0.935
Niacin Equivalent mg -0.276 -0.132 -0.034 -0.052 -0.067 -0.402 -0.004 0.968
Vitamin C mg -0.107 0.008 -0.001 -0.423 -0.144 -0.128 -0.118 0.914
Vitamin D ug -0.386 -0.041 -0.035 -0.056 -0.074 -0.331 0.009 0.914
Folate ug -0.320 -0.047 -0.031 -0.062 -0.087 -0.400 0.002 0.945
Sodium mg -0.216 -0.145 -0.036 -0.026 -0.062 -0.522 0.000 1.006
Starch g -0.100 -0.125 -0.038 -0.004 -0.039 -0.774 0.004 1.076
Glucose g -0.109 -0.044 -0.020 -0.212 -0.052 -0.506 -0.060 1.003
199
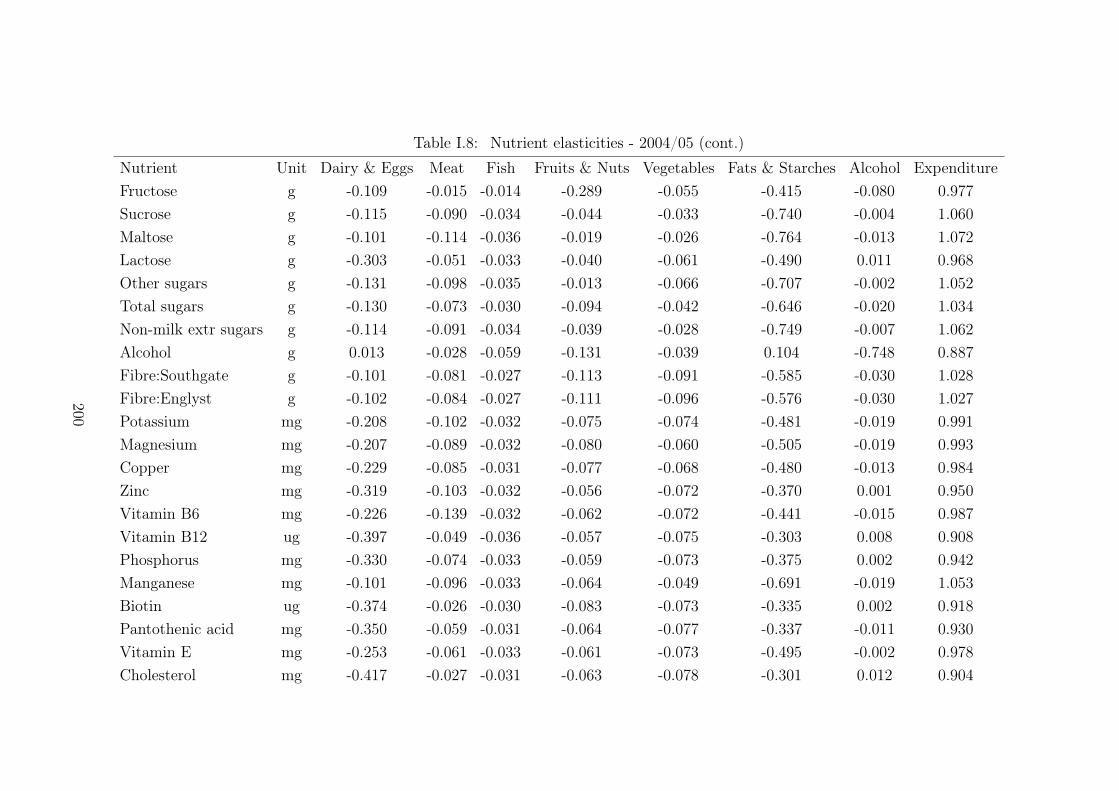
Table I.8: Nutrient elasticities - 2004/05 (cont.)
Nutrient Unit Dairy & Eggs Meat Fish Fruits & Nuts Vegetables Fats & Starches Alcohol Expenditure
Fructose g -0.109 -0.015 -0.014 -0.289 -0.055 -0.415 -0.080 0.977
Sucrose g -0.115 -0.090 -0.034 -0.044 -0.033 -0.740 -0.004 1.060
Maltose g -0.101 -0.114 -0.036 -0.019 -0.026 -0.764 -0.013 1.072
Lactose g -0.303 -0.051 -0.033 -0.040 -0.061 -0.490 0.011 0.968
Other sugars g -0.131 -0.098 -0.035 -0.013 -0.066 -0.707 -0.002 1.052
Total sugars g -0.130 -0.073 -0.030 -0.094 -0.042 -0.646 -0.020 1.034
Non-milk extr sugars g -0.114 -0.091 -0.034 -0.039 -0.028 -0.749 -0.007 1.062
Alcohol g 0.013 -0.028 -0.059 -0.131 -0.039 0.104 -0.748 0.887
Fibre:Southgate g -0.101 -0.081 -0.027 -0.113 -0.091 -0.585 -0.030 1.028
Fibre:Englyst g -0.102 -0.084 -0.027 -0.111 -0.096 -0.576 -0.030 1.027
Potassium mg -0.208 -0.102 -0.032 -0.075 -0.074 -0.481 -0.019 0.991
Magnesium mg -0.207 -0.089 -0.032 -0.080 -0.060 -0.505 -0.019 0.993
Copper mg -0.229 -0.085 -0.031 -0.077 -0.068 -0.480 -0.013 0.984
Zinc mg -0.319 -0.103 -0.032 -0.056 -0.072 -0.370 0.001 0.950
Vitamin B6 mg -0.226 -0.139 -0.032 -0.062 -0.072 -0.441 -0.015 0.987
Vitamin B12 ug -0.397 -0.049 -0.036 -0.057 -0.075 -0.303 0.008 0.908
Phosphorus mg -0.330 -0.074 -0.033 -0.059 -0.073 -0.375 0.002 0.942
Manganese mg -0.101 -0.096 -0.033 -0.064 -0.049 -0.691 -0.019 1.053
Biotin ug -0.374 -0.026 -0.030 -0.083 -0.073 -0.335 0.002 0.918
Pantothenic acid mg -0.350 -0.059 -0.031 -0.064 -0.077 -0.337 -0.011 0.930
Vitamin E mg -0.253 -0.061 -0.033 -0.061 -0.073 -0.495 -0.002 0.978
Cholesterol mg -0.417 -0.027 -0.031 -0.063 -0.078 -0.301 0.012 0.904
200
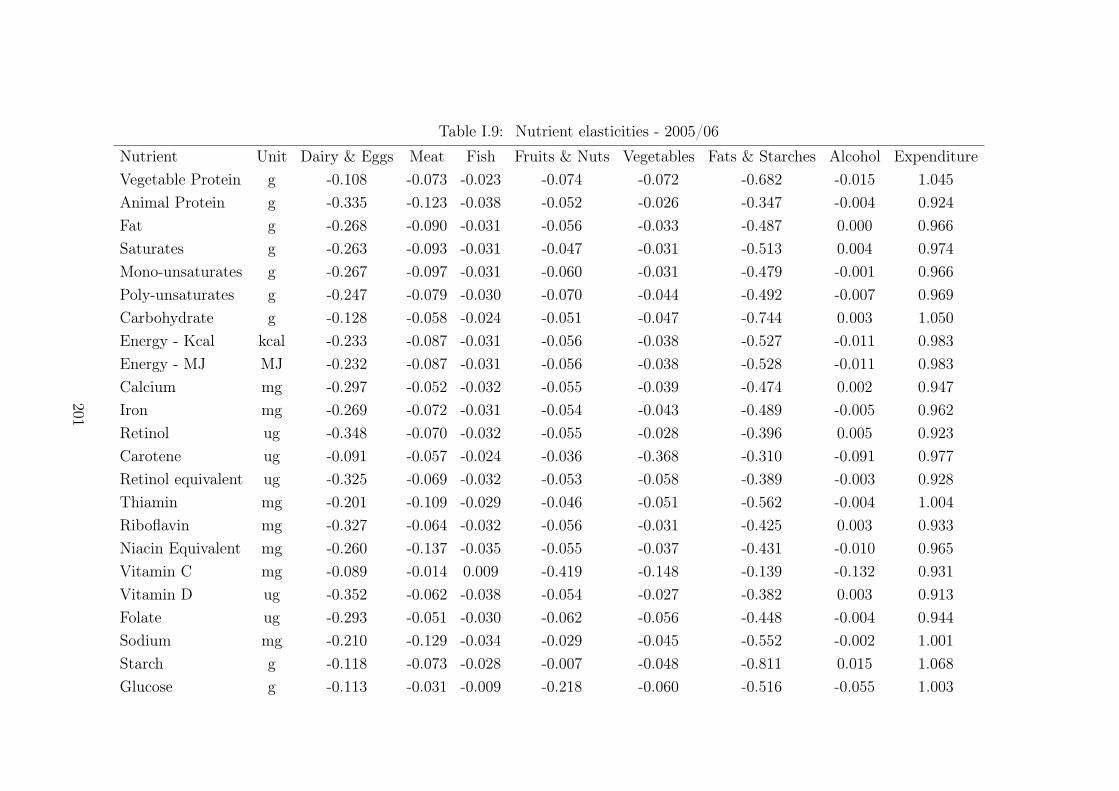
Table I.9: Nutrient elasticities - 2005/06
Nutrient Unit Dairy & Eggs Meat Fish Fruits & Nuts Vegetables Fats & Starches Alcohol Expenditure
Vegetable Protein g -0.108 -0.073 -0.023 -0.074 -0.072 -0.682 -0.015 1.045
Animal Protein g -0.335 -0.123 -0.038 -0.052 -0.026 -0.347 -0.004 0.924
Fat g -0.268 -0.090 -0.031 -0.056 -0.033 -0.487 0.000 0.966
Saturates g -0.263 -0.093 -0.031 -0.047 -0.031 -0.513 0.004 0.974
Mono-unsaturates g -0.267 -0.097 -0.031 -0.060 -0.031 -0.479 -0.001 0.966
Poly-unsaturates g -0.247 -0.079 -0.030 -0.070 -0.044 -0.492 -0.007 0.969
Carbohydrate g -0.128 -0.058 -0.024 -0.051 -0.047 -0.744 0.003 1.050
Energy - Kcal kcal -0.233 -0.087 -0.031 -0.056 -0.038 -0.527 -0.011 0.983
Energy - MJ MJ -0.232 -0.087 -0.031 -0.056 -0.038 -0.528 -0.011 0.983
Calcium mg -0.297 -0.052 -0.032 -0.055 -0.039 -0.474 0.002 0.947
Iron mg -0.269 -0.072 -0.031 -0.054 -0.043 -0.489 -0.005 0.962
Retinol ug -0.348 -0.070 -0.032 -0.055 -0.028 -0.396 0.005 0.923
Carotene ug -0.091 -0.057 -0.024 -0.036 -0.368 -0.310 -0.091 0.977
Retinol equivalent ug -0.325 -0.069 -0.032 -0.053 -0.058 -0.389 -0.003 0.928
Thiamin mg -0.201 -0.109 -0.029 -0.046 -0.051 -0.562 -0.004 1.004
Riboflavin mg -0.327 -0.064 -0.032 -0.056 -0.031 -0.425 0.003 0.933
Niacin Equivalent mg -0.260 -0.137 -0.035 -0.055 -0.037 -0.431 -0.010 0.965
Vitamin C mg -0.089 -0.014 0.009 -0.419 -0.148 -0.139 -0.132 0.931
Vitamin D ug -0.352 -0.062 -0.038 -0.054 -0.027 -0.382 0.003 0.913
Folate ug -0.293 -0.051 -0.030 -0.062 -0.056 -0.448 -0.004 0.944
Sodium mg -0.210 -0.129 -0.034 -0.029 -0.045 -0.552 -0.002 1.001
Starch g -0.118 -0.073 -0.028 -0.007 -0.048 -0.811 0.015 1.068
Glucose g -0.113 -0.031 -0.009 -0.218 -0.060 -0.516 -0.055 1.003
201

Table I.10: Nutrient elasticities - 2005/06 (cont.)
Nutrient Unit Dairy & Eggs Meat Fish Fruits & Nuts Vegetables Fats & Starches Alcohol Expenditure
Fructose g -0.110 -0.017 -0.003 -0.287 -0.062 -0.430 -0.074 0.983
Sucrose g -0.130 -0.047 -0.023 -0.048 -0.040 -0.772 0.007 1.053
Maltose g -0.120 -0.068 -0.027 -0.022 -0.034 -0.798 0.004 1.065
Lactose g -0.289 -0.047 -0.031 -0.041 -0.032 -0.534 0.012 0.961
Other sugars g -0.142 -0.052 -0.027 -0.016 -0.074 -0.736 0.003 1.044
Total sugars g -0.139 -0.042 -0.020 -0.099 -0.046 -0.672 -0.011 1.029
Non-milk extr sugars g -0.130 -0.047 -0.024 -0.045 -0.035 -0.780 0.006 1.054
Alcohol g 0.006 -0.103 -0.071 -0.130 -0.104 0.146 -0.644 0.899
Fibre:Southgate g -0.106 -0.047 -0.018 -0.113 -0.101 -0.616 -0.029 1.029
Fibre:Englyst g -0.106 -0.049 -0.018 -0.109 -0.106 -0.608 -0.030 1.027
Potassium mg -0.200 -0.090 -0.028 -0.078 -0.062 -0.508 -0.021 0.988
Magnesium mg -0.202 -0.078 -0.028 -0.082 -0.047 -0.536 -0.018 0.990
Copper mg -0.220 -0.076 -0.028 -0.079 -0.050 -0.516 -0.013 0.982
Zinc mg -0.294 -0.113 -0.033 -0.058 -0.035 -0.410 -0.005 0.948
Vitamin B6 mg -0.215 -0.133 -0.031 -0.066 -0.053 -0.467 -0.019 0.984
Vitamin B12 ug -0.360 -0.073 -0.040 -0.056 -0.026 -0.352 0.001 0.906
Phosphorus mg -0.304 -0.084 -0.034 -0.059 -0.036 -0.419 -0.003 0.940
Manganese mg -0.115 -0.055 -0.023 -0.066 -0.058 -0.723 -0.009 1.048
Biotin ug -0.341 -0.046 -0.030 -0.081 -0.030 -0.386 -0.002 0.917
Pantothenic acid mg -0.321 -0.075 -0.033 -0.063 -0.038 -0.385 -0.014 0.928
Vitamin E mg -0.240 -0.052 -0.030 -0.061 -0.054 -0.535 -0.003 0.974
Cholesterol mg -0.378 -0.053 -0.033 -0.061 -0.026 -0.358 0.005 0.903
202

Table I.11: Nutrient elasticities - 2006
Nutrient Unit Dairy & Eggs Meat Fish Fruits & Nuts Vegetables Fats & Starches Alcohol Expenditure
Vegetable Protein g -0.108 -0.104 -0.024 -0.084 -0.066 -0.641 -0.018 1.045
Animal Protein g -0.303 -0.121 -0.046 -0.076 -0.066 -0.331 0.009 0.934
Fat g -0.243 -0.102 -0.037 -0.078 -0.058 -0.461 0.006 0.973
Saturates g -0.238 -0.108 -0.037 -0.068 -0.055 -0.484 0.008 0.981
Mono-unsaturates g -0.242 -0.108 -0.037 -0.081 -0.056 -0.455 0.005 0.974
Poly-unsaturates g -0.227 -0.090 -0.036 -0.090 -0.066 -0.466 -0.001 0.976
Carbohydrate g -0.121 -0.096 -0.027 -0.066 -0.042 -0.690 -0.005 1.049
Energy - Kcal kcal -0.212 -0.102 -0.037 -0.075 -0.056 -0.497 -0.010 0.988
Energy - MJ MJ -0.211 -0.102 -0.036 -0.075 -0.056 -0.498 -0.010 0.988
Calcium mg -0.270 -0.059 -0.040 -0.082 -0.070 -0.441 0.007 0.955
Iron mg -0.244 -0.083 -0.038 -0.077 -0.068 -0.460 0.000 0.970
Retinol ug -0.315 -0.067 -0.042 -0.084 -0.069 -0.372 0.015 0.933
Carotene ug -0.125 -0.062 -0.021 -0.053 -0.376 -0.277 -0.069 0.982
Retinol equivalent ug -0.298 -0.066 -0.040 -0.081 -0.096 -0.364 0.008 0.937
Thiamin mg -0.185 -0.131 -0.033 -0.063 -0.064 -0.532 -0.001 1.009
Riboflavin mg -0.296 -0.066 -0.041 -0.084 -0.068 -0.398 0.012 0.942
Niacin Equivalent mg -0.236 -0.145 -0.040 -0.074 -0.062 -0.415 -0.001 0.972
Vitamin C mg -0.121 0.037 0.016 -0.441 -0.154 -0.154 -0.105 0.922
Vitamin D ug -0.319 -0.058 -0.049 -0.084 -0.069 -0.356 0.013 0.923
Folate ug -0.269 -0.056 -0.038 -0.089 -0.087 -0.418 0.004 0.952
Sodium mg -0.192 -0.151 -0.039 -0.045 -0.058 -0.523 0.001 1.007
Starch g -0.109 -0.122 -0.031 -0.021 -0.039 -0.750 0.004 1.068
Glucose g -0.120 -0.033 -0.009 -0.235 -0.060 -0.490 -0.051 0.998
203
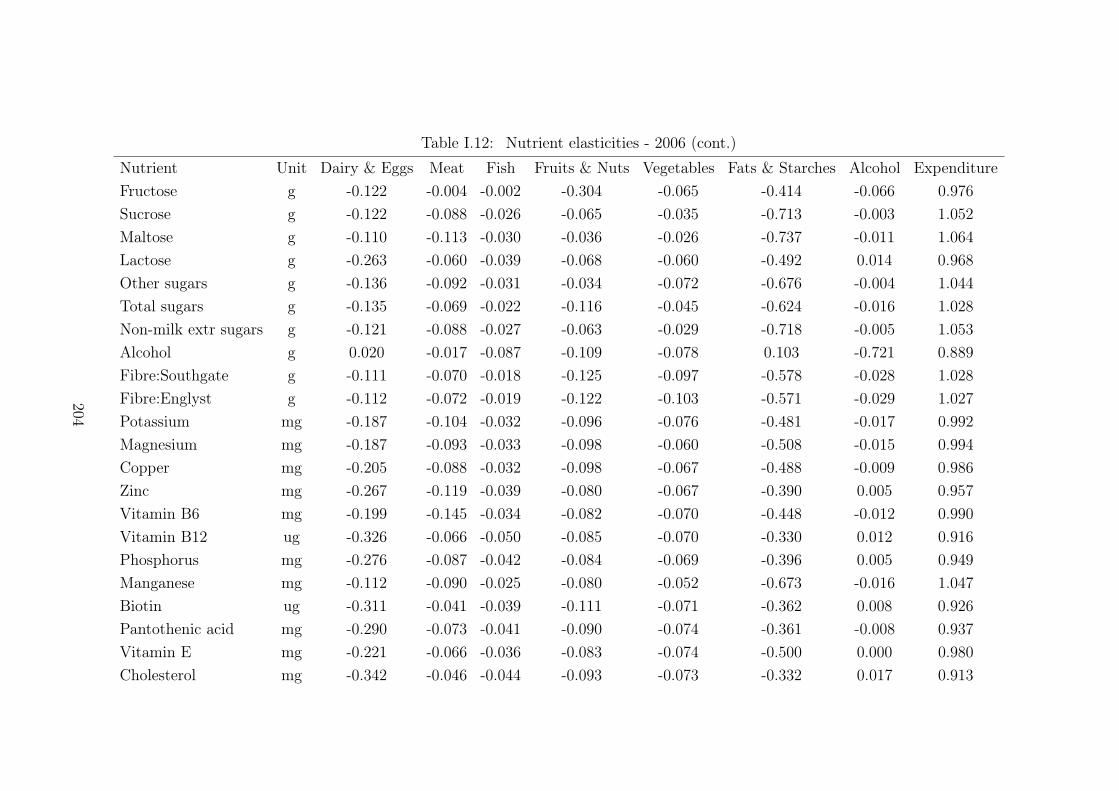
Table I.12: Nutrient elasticities - 2006 (cont.)
Nutrient Unit Dairy & Eggs Meat Fish Fruits & Nuts Vegetables Fats & Starches Alcohol Expenditure
Fructose g -0.122 -0.004 -0.002 -0.304 -0.065 -0.414 -0.066 0.976
Sucrose g -0.122 -0.088 -0.026 -0.065 -0.035 -0.713 -0.003 1.052
Maltose g -0.110 -0.113 -0.030 -0.036 -0.026 -0.737 -0.011 1.064
Lactose g -0.263 -0.060 -0.039 -0.068 -0.060 -0.492 0.014 0.968
Other sugars g -0.136 -0.092 -0.031 -0.034 -0.072 -0.676 -0.004 1.044
Total sugars g -0.135 -0.069 -0.022 -0.116 -0.045 -0.624 -0.016 1.028
Non-milk extr sugars g -0.121 -0.088 -0.027 -0.063 -0.029 -0.718 -0.005 1.053
Alcohol g 0.020 -0.017 -0.087 -0.109 -0.078 0.103 -0.721 0.889
Fibre:Southgate g -0.111 -0.070 -0.018 -0.125 -0.097 -0.578 -0.028 1.028
Fibre:Englyst g -0.112 -0.072 -0.019 -0.122 -0.103 -0.571 -0.029 1.027
Potassium mg -0.187 -0.104 -0.032 -0.096 -0.076 -0.481 -0.017 0.992
Magnesium mg -0.187 -0.093 -0.033 -0.098 -0.060 -0.508 -0.015 0.994
Copper mg -0.205 -0.088 -0.032 -0.098 -0.067 -0.488 -0.009 0.986
Zinc mg -0.267 -0.119 -0.039 -0.080 -0.067 -0.390 0.005 0.957
Vitamin B6 mg -0.199 -0.145 -0.034 -0.082 -0.070 -0.448 -0.012 0.990
Vitamin B12 ug -0.326 -0.066 -0.050 -0.085 -0.070 -0.330 0.012 0.916
Phosphorus mg -0.276 -0.087 -0.042 -0.084 -0.069 -0.396 0.005 0.949
Manganese mg -0.112 -0.090 -0.025 -0.080 -0.052 -0.673 -0.016 1.047
Biotin ug -0.311 -0.041 -0.039 -0.111 -0.071 -0.362 0.008 0.926
Pantothenic acid mg -0.290 -0.073 -0.041 -0.090 -0.074 -0.361 -0.008 0.937
Vitamin E mg -0.221 -0.066 -0.036 -0.083 -0.074 -0.500 0.000 0.980
Cholesterol mg -0.342 -0.046 -0.044 -0.093 -0.073 -0.332 0.017 0.913
204

Table I.13: Nutrient elasticities - 2007
Nutrient Unit Dairy & Eggs Meat Fish Fruits & Nuts Vegetables Fats & Starches Alcohol Expenditure
Vegetable Protein g -0.105 -0.117 -0.031 -0.084 -0.064 -0.669 0.021 1.049
Animal Protein g -0.342 -0.081 -0.008 -0.056 -0.099 -0.324 -0.026 0.936
Fat g -0.275 -0.080 -0.013 -0.062 -0.081 -0.457 -0.005 0.973
Saturates g -0.267 -0.088 -0.013 -0.053 -0.077 -0.482 0.000 0.982
Mono-unsaturates g -0.273 -0.085 -0.014 -0.065 -0.080 -0.451 -0.006 0.973
Poly-unsaturates g -0.256 -0.074 -0.016 -0.076 -0.085 -0.464 -0.005 0.975
Carbohydrate g -0.120 -0.109 -0.029 -0.065 -0.043 -0.720 0.032 1.053
Energy - Kcal kcal -0.238 -0.089 -0.018 -0.063 -0.074 -0.494 -0.012 0.988
Energy - MJ MJ -0.237 -0.089 -0.018 -0.063 -0.074 -0.496 -0.012 0.988
Calcium mg -0.304 -0.042 -0.010 -0.064 -0.094 -0.436 -0.007 0.956
Iron mg -0.279 -0.064 -0.012 -0.062 -0.090 -0.450 -0.011 0.968
Retinol ug -0.358 -0.036 -0.002 -0.061 -0.102 -0.360 -0.016 0.934
Carotene ug -0.152 -0.083 -0.012 -0.063 -0.342 -0.276 -0.050 0.977
Retinol equivalent ug -0.341 -0.040 -0.003 -0.061 -0.121 -0.354 -0.018 0.938
Thiamin mg -0.205 -0.119 -0.020 -0.055 -0.076 -0.536 0.004 1.008
Riboflavin mg -0.337 -0.040 -0.005 -0.063 -0.098 -0.385 -0.013 0.942
Niacin Equivalent mg -0.267 -0.116 -0.016 -0.060 -0.085 -0.411 -0.017 0.972
Vitamin C mg -0.112 0.037 -0.027 -0.441 -0.154 -0.151 -0.075 0.921
Vitamin D ug -0.362 -0.029 -0.006 -0.063 -0.102 -0.344 -0.019 0.924
Folate ug -0.308 -0.037 -0.008 -0.071 -0.110 -0.406 -0.011 0.951
Sodium mg -0.212 -0.136 -0.022 -0.038 -0.072 -0.528 0.002 1.006
Starch g -0.107 -0.136 -0.031 -0.022 -0.037 -0.785 0.045 1.073
Glucose g -0.113 -0.043 -0.030 -0.228 -0.065 -0.509 -0.014 1.002
205

Table I.14: Nutrient elasticities - 2007 (cont.)
Nutrient Unit Dairy & Eggs Meat Fish Fruits & Nuts Vegetables Fats & Starches Alcohol Expenditure
Fructose g -0.112 -0.012 -0.030 -0.297 -0.072 -0.428 -0.029 0.980
Sucrose g -0.121 -0.101 -0.029 -0.062 -0.036 -0.745 0.038 1.057
Maltose g -0.108 -0.129 -0.031 -0.034 -0.026 -0.767 0.026 1.068
Lactose g -0.291 -0.047 -0.010 -0.051 -0.082 -0.497 0.006 0.972
Other sugars g -0.141 -0.105 -0.025 -0.032 -0.071 -0.702 0.028 1.048
Total sugars g -0.134 -0.079 -0.027 -0.112 -0.050 -0.649 0.018 1.032
Non-milk extr sugars g -0.120 -0.102 -0.029 -0.060 -0.031 -0.750 0.034 1.058
Alcohol g -0.016 -0.122 -0.073 -0.075 -0.064 0.256 -0.783 0.876
Fibre:Southgate g -0.110 -0.084 -0.028 -0.126 -0.094 -0.598 0.010 1.030
Fibre:Englyst g -0.111 -0.086 -0.028 -0.123 -0.099 -0.592 0.009 1.029
Potassium mg -0.207 -0.095 -0.021 -0.086 -0.088 -0.484 -0.011 0.992
Magnesium mg -0.206 -0.086 -0.022 -0.088 -0.074 -0.512 -0.007 0.995
Copper mg -0.229 -0.077 -0.018 -0.085 -0.083 -0.488 -0.006 0.986
Zinc mg -0.303 -0.087 -0.010 -0.062 -0.094 -0.384 -0.017 0.957
Vitamin B6 mg -0.223 -0.125 -0.020 -0.071 -0.087 -0.446 -0.017 0.989
Vitamin B12 ug -0.368 -0.034 -0.006 -0.063 -0.104 -0.319 -0.024 0.919
Phosphorus mg -0.313 -0.061 -0.010 -0.066 -0.096 -0.388 -0.016 0.949
Manganese mg -0.109 -0.104 -0.030 -0.080 -0.051 -0.699 0.023 1.050
Biotin ug -0.352 -0.016 -0.003 -0.084 -0.103 -0.351 -0.019 0.928
Pantothenic acid mg -0.332 -0.046 -0.006 -0.068 -0.103 -0.348 -0.034 0.938
Vitamin E mg -0.250 -0.057 -0.016 -0.071 -0.090 -0.498 0.002 0.980
Cholesterol mg -0.387 -0.014 0.001 -0.067 -0.109 -0.320 -0.021 0.917
206
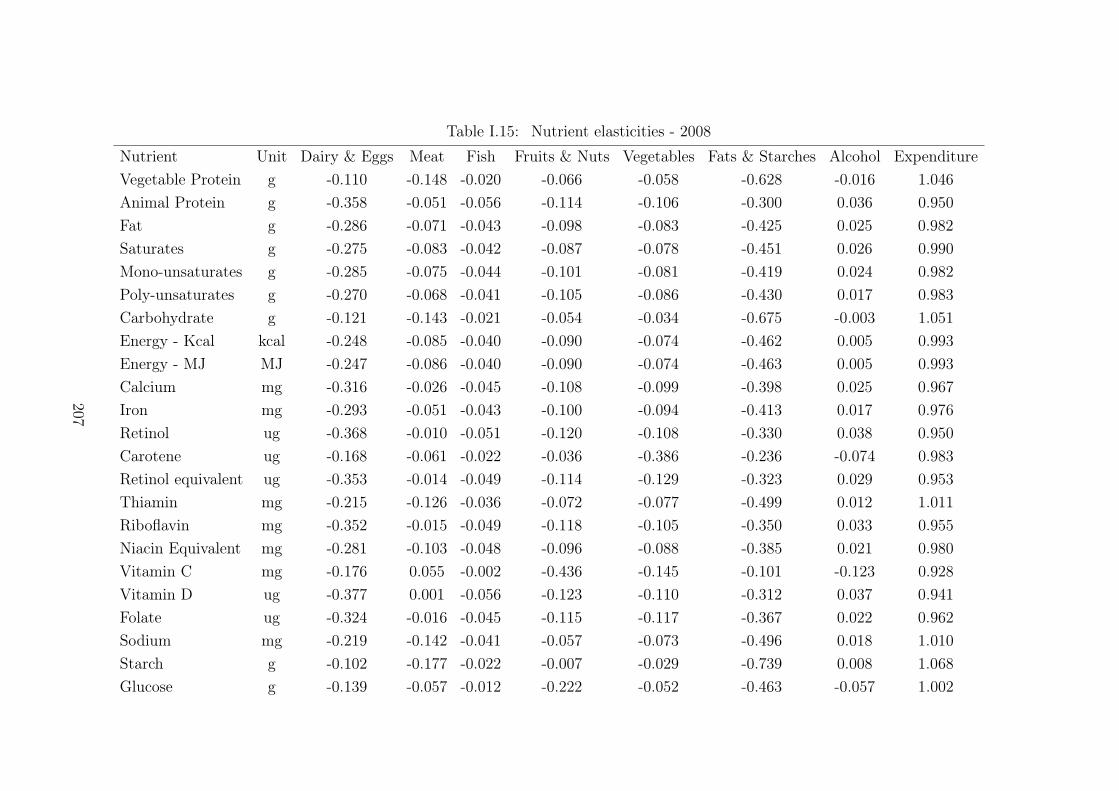
Table I.15: Nutrient elasticities - 2008
Nutrient Unit Dairy & Eggs Meat Fish Fruits & Nuts Vegetables Fats & Starches Alcohol Expenditure
Vegetable Protein g -0.110 -0.148 -0.020 -0.066 -0.058 -0.628 -0.016 1.046
Animal Protein g -0.358 -0.051 -0.056 -0.114 -0.106 -0.300 0.036 0.950
Fat g -0.286 -0.071 -0.043 -0.098 -0.083 -0.425 0.025 0.982
Saturates g -0.275 -0.083 -0.042 -0.087 -0.078 -0.451 0.026 0.990
Mono-unsaturates g -0.285 -0.075 -0.044 -0.101 -0.081 -0.419 0.024 0.982
Poly-unsaturates g -0.270 -0.068 -0.041 -0.105 -0.086 -0.430 0.017 0.983
Carbohydrate g -0.121 -0.143 -0.021 -0.054 -0.034 -0.675 -0.003 1.051
Energy - Kcal kcal -0.248 -0.085 -0.040 -0.090 -0.074 -0.462 0.005 0.993
Energy - MJ MJ -0.247 -0.086 -0.040 -0.090 -0.074 -0.463 0.005 0.993
Calcium mg -0.316 -0.026 -0.045 -0.108 -0.099 -0.398 0.025 0.967
Iron mg -0.293 -0.051 -0.043 -0.100 -0.094 -0.413 0.017 0.976
Retinol ug -0.368 -0.010 -0.051 -0.120 -0.108 -0.330 0.038 0.950
Carotene ug -0.168 -0.061 -0.022 -0.036 -0.386 -0.236 -0.074 0.983
Retinol equivalent ug -0.353 -0.014 -0.049 -0.114 -0.129 -0.323 0.029 0.953
Thiamin mg -0.215 -0.126 -0.036 -0.072 -0.077 -0.499 0.012 1.011
Riboflavin mg -0.352 -0.015 -0.049 -0.118 -0.105 -0.350 0.033 0.955
Niacin Equivalent mg -0.281 -0.103 -0.048 -0.096 -0.088 -0.385 0.021 0.980
Vitamin C mg -0.176 0.055 -0.002 -0.436 -0.145 -0.101 -0.123 0.928
Vitamin D ug -0.377 0.001 -0.056 -0.123 -0.110 -0.312 0.037 0.941
Folate ug -0.324 -0.016 -0.045 -0.115 -0.117 -0.367 0.022 0.962
Sodium mg -0.219 -0.142 -0.041 -0.057 -0.073 -0.496 0.018 1.010
Starch g -0.102 -0.177 -0.022 -0.007 -0.029 -0.739 0.008 1.068
Glucose g -0.139 -0.057 -0.012 -0.222 -0.052 -0.463 -0.057 1.002
207
Table I.16: Nutrient elasticities - 2008 (cont.)
Nutrient Unit Dairy & Eggs Meat Fish Fruits & Nuts Vegetables Fats & Starches Alcohol Expenditure
Fructose g -0.150 -0.018 -0.009 -0.293 -0.056 -0.381 -0.075 0.982
Sucrose g -0.121 -0.137 -0.020 -0.051 -0.028 -0.697 0.000 1.054
Maltose g -0.102 -0.166 -0.021 -0.023 -0.016 -0.727 -0.008 1.064
Lactose g -0.297 -0.041 -0.042 -0.089 -0.084 -0.460 0.030 0.982
Other sugars g -0.139 -0.131 -0.024 -0.024 -0.074 -0.652 -0.002 1.046
Total sugars g -0.143 -0.104 -0.020 -0.106 -0.040 -0.604 -0.015 1.031
Non-milk extr sugars g -0.119 -0.138 -0.020 -0.050 -0.021 -0.704 -0.003 1.054
Alcohol g 0.055 0.067 -0.054 -0.133 -0.091 0.134 -0.826 0.847
Fibre:Southgate g -0.123 -0.107 -0.016 -0.109 -0.092 -0.551 -0.031 1.029
Fibre:Englyst g -0.124 -0.108 -0.017 -0.105 -0.099 -0.544 -0.031 1.028
Potassium mg -0.222 -0.094 -0.036 -0.102 -0.089 -0.447 -0.005 0.996
Magnesium mg -0.220 -0.089 -0.035 -0.104 -0.073 -0.474 -0.004 0.998
Copper mg -0.243 -0.075 -0.037 -0.108 -0.084 -0.449 0.004 0.991
Zinc mg -0.317 -0.067 -0.048 -0.108 -0.099 -0.356 0.027 0.968
Vitamin B6 mg -0.238 -0.120 -0.041 -0.095 -0.088 -0.417 0.005 0.994
Vitamin B12 ug -0.385 -0.001 -0.058 -0.127 -0.113 -0.289 0.037 0.936
Phosphorus mg -0.328 -0.040 -0.049 -0.113 -0.102 -0.355 0.027 0.961
Manganese mg -0.113 -0.137 -0.019 -0.066 -0.043 -0.654 -0.016 1.047
Biotin ug -0.370 0.014 -0.049 -0.142 -0.109 -0.315 0.029 0.943
Pantothenic acid mg -0.348 -0.016 -0.050 -0.123 -0.111 -0.320 0.017 0.950
Vitamin E mg -0.263 -0.054 -0.039 -0.097 -0.092 -0.457 0.015 0.987
Cholesterol mg -0.401 0.021 -0.054 -0.135 -0.118 -0.289 0.041 0.934
208
Table I.17: Nutrient elasticities - 2009
Nutrient Unit Dairy & Eggs Meat Fish Fruits & Nuts Vegetables Fats & Starches Alcohol Expenditure
Vegetable Protein g -0.109 -0.107 -0.021 -0.091 -0.055 -0.686 0.021 1.048
Animal Protein g -0.437 -0.088 -0.049 -0.034 -0.063 -0.331 0.080 0.922
Fat g -0.345 -0.084 -0.039 -0.051 -0.052 -0.466 0.073 0.963
Saturates g -0.334 -0.093 -0.037 -0.045 -0.047 -0.491 0.075 0.971
Mono-unsaturates g -0.344 -0.088 -0.038 -0.053 -0.050 -0.460 0.071 0.962
Poly-unsaturates g -0.318 -0.074 -0.038 -0.065 -0.058 -0.474 0.061 0.966
Carbohydrate g -0.133 -0.105 -0.022 -0.074 -0.028 -0.738 0.047 1.052
Energy - Kcal kcal -0.294 -0.091 -0.036 -0.056 -0.049 -0.502 0.051 0.979
Energy - MJ MJ -0.293 -0.091 -0.036 -0.056 -0.049 -0.504 0.051 0.979
Calcium mg -0.380 -0.045 -0.042 -0.051 -0.064 -0.443 0.079 0.945
Iron mg -0.348 -0.067 -0.039 -0.051 -0.062 -0.457 0.067 0.958
Retinol ug -0.450 -0.045 -0.045 -0.041 -0.065 -0.367 0.093 0.921
Carotene ug -0.140 -0.047 -0.031 -0.044 -0.387 -0.239 -0.083 0.972
Retinol equivalent ug -0.426 -0.046 -0.044 -0.041 -0.090 -0.358 0.079 0.925
Thiamin mg -0.251 -0.121 -0.032 -0.050 -0.055 -0.547 0.054 1.002
Riboflavin mg -0.424 -0.046 -0.044 -0.046 -0.064 -0.394 0.087 0.930
Niacin Equivalent mg -0.336 -0.119 -0.041 -0.045 -0.057 -0.422 0.058 0.962
Vitamin C mg -0.101 0.077 -0.004 -0.391 -0.159 -0.207 -0.142 0.926
Vitamin D ug -0.459 -0.035 -0.051 -0.041 -0.066 -0.351 0.092 0.911
Folate ug -0.384 -0.039 -0.041 -0.055 -0.080 -0.415 0.074 0.940
Sodium mg -0.262 -0.140 -0.037 -0.034 -0.050 -0.535 0.057 1.000
Starch g -0.118 -0.134 -0.024 -0.039 -0.023 -0.795 0.061 1.071
Glucose g -0.115 -0.026 -0.013 -0.214 -0.052 -0.553 -0.031 1.004
209

Table I.18: Nutrient elasticities - 2009 (cont.)
Nutrient Unit Dairy & Eggs Meat Fish Fruits & Nuts Vegetables Fats & Starches Alcohol Expenditure
Fructose g -0.112 0.010 -0.010 -0.273 -0.059 -0.483 -0.057 0.984
Sucrose g -0.134 -0.099 -0.021 -0.072 -0.020 -0.764 0.054 1.056
Maltose g -0.116 -0.128 -0.022 -0.053 -0.010 -0.778 0.041 1.066
Lactose g -0.361 -0.052 -0.039 -0.042 -0.051 -0.505 0.090 0.962
Other sugars g -0.158 -0.101 -0.026 -0.043 -0.062 -0.703 0.049 1.044
Total sugars g -0.149 -0.073 -0.020 -0.112 -0.033 -0.676 0.031 1.032
Non-milk extr sugars g -0.132 -0.100 -0.021 -0.071 -0.014 -0.769 0.052 1.057
Alcohol g 0.110 -0.123 -0.065 -0.147 -0.124 0.332 -0.856 0.873
Fibre:Southgate g -0.111 -0.069 -0.019 -0.125 -0.090 -0.616 0.000 1.029
Fibre:Englyst g -0.113 -0.070 -0.019 -0.121 -0.097 -0.607 -0.001 1.028
Potassium mg -0.251 -0.092 -0.034 -0.076 -0.069 -0.497 0.033 0.986
Magnesium mg -0.250 -0.084 -0.033 -0.080 -0.053 -0.527 0.038 0.989
Copper mg -0.281 -0.075 -0.034 -0.076 -0.061 -0.498 0.047 0.978
Zinc mg -0.383 -0.092 -0.041 -0.045 -0.063 -0.391 0.071 0.945
Vitamin B6 mg -0.277 -0.126 -0.035 -0.059 -0.064 -0.457 0.038 0.981
Vitamin B12 ug -0.469 -0.039 -0.053 -0.040 -0.068 -0.326 0.091 0.905
Phosphorus mg -0.395 -0.065 -0.044 -0.048 -0.065 -0.395 0.075 0.937
Manganese mg -0.116 -0.098 -0.021 -0.089 -0.038 -0.718 0.029 1.050
Biotin ug -0.443 -0.021 -0.044 -0.063 -0.067 -0.362 0.084 0.915
Pantothenic acid mg -0.417 -0.052 -0.044 -0.050 -0.071 -0.353 0.063 0.924
Vitamin E mg -0.310 -0.055 -0.038 -0.062 -0.066 -0.504 0.065 0.970
Cholesterol mg -0.489 -0.022 -0.048 -0.043 -0.070 -0.329 0.099 0.902
210

References
J.H. Albert and S. Chib. Bayesian analysis of binary and polychotomous response data.Journal of the American Statistical Association, 88:669–679, 1993.
J M Alston and J A Chalfant. The silence of the lambdas: A test of the almost ideal androtterdam models. American Journal of Agricultural Economics, 75:304–313, 1993.
T Amemiya. Advanced Econometrics. Harvard University Press, Cambridge, 1985.
G Anderson and R Blundell. Testing restrictions in a flexible dynamic system: An appli-cation to consumers’ expenditure in canada. Review of Economic Studies, 40:397–410,1984.
D Aristei and L Pieroni. A double-hurdle approach to modelling tobacco consumption initaly. Applied Economics, 40:2463–2476, 2008.
M.H. Arnoult and R. Tiffin. Econometric models of nutrient demand. Project DocumentNo. 07, Workpackage No. 1, Report No. 02, University of Reading, 2008.
J Banks, R Blundell, and A Lewbel. Quadratic engel curves and consumer demand. The
Review of Economics and Statistics, 79:527–539, 1997.
W A Barnett and O Seck. Rotterdam model versus almost ideal demand system: willthe best specification please stand up? Journal of Applied Econometrics, 23:795–824,2008.
A P Barten. Consumer demand functions under conditions of almost additive preferences.Econometrica, 32:1–38, 1964.
L. Blanciforti and R. Green. An almost ideal demand system incorporating habits: Ananalysis of expenditure on food and aggregate commodity groups. Review of Economics
and Statistics, 65:511–515, 1983.
R Blundell and C Meghir. Bivariate alternatives to the tobit-model. Journal of Econo-
metrics, 34(1-2):179 – 200, 1987.
A Brown and A Deaton. Surveys in applied economics: Models of consumer behaviour.The Economic Journal, 82(328):1145–1236, 1972.
M. Burton, R. Dorsett, and T. Young. Changing preferences for meat: Evidence fromuk household data, 1973-93. European Review of Agricultural Economics, 23:357–370,1996.
M. Burton, R. Dorsett, and T. Young. An investigation of the increasing prevalence ofnonpurchase of meat by british households. Applied Economics, 32:1985–1991, 2000.
T Burton, M Young. The structure of changing tastes for meat and fish in great britain.European Review of Agricultural Economics, 19:165–180, 1992.
G. Casella and E. I. George. Explaining the gibbs sampler. The American Statistician,46(3):167–174, 1992.
211
JG Cragg. Some statistical models for limited dependent variables with applicationtodemand for durable goods. Econometrica, 39(5):829 – 844, 1971. ISSN 0012-9682.
A. Deaton and J. Muellbauer. An almost ideal demand system. American Economic
Review, 70:312–336, 1980.
J S Eales and L J Unnevehr. The inverse almost ideal demand system. European Economic
Review, 38:101–115, 1994.
D.L. Edgerton. Weak seperability and the estimation of elasticities in multistage de-mandsystems. American Journal of Agricultural Economics, 79:62–79, 1997.
E Erkan. Demand systems for agricultural products in oecd countries. Applied Economics
Letters, 13:163–169, 2006.
P Fousekis and B J Revell. Retail fish demand in great britain and its fisheries managementimplications. Marine Resource Economics, 19:495–510, 2004.
L Fulponi. The almost ideal demand system: An application to food and meat groups forfrance. Journal of Agricultural Economics, 40:82–92, 1989.
A.R. Gallant and E.H. Golub. Imposing curvature restrictions on flexible functional forms.Journal of Econometrics, 26:295–321, 1984.
J Garcia and J M Labeaga. Alternative approaches to modelling zero expenditure: anapplication to Spanish demand for tobacco. Oxford Bulletin of Economics and Statistics,58(3):489–506, 1996.
J. Geweke. Contemporary Bayesian Econometrics and Statistics. Wiley, Hoboken, NewJersey, 2005.
HMSO. National food survey 2000. archive.defra.gov.uk/evidence/statistics/foodfarm/food/familyfoo2004.
H S Houthakker and D T Lester. Consumer Demand in the United States. HarvardUniversity Press, Cambridge, 1966.
H Howe, R A Pollak, and T J Wales. Theory and time series estimation of the quadraticexpenditure system. Econometrica, 47:1231–1248, 1979.
K S Huang. Nutrient demand elasticities in a complete food demand system. American
Journal of Agricultural Economics, 78:21–29, 1996.
K S Huang. Effects of food prices and consumer income on nutrient availability. Applied
Economics, 31:367–380, 1999.
S Jaffry and J Brown. A demand analysis of the uk canned tuna market. Marine Resource
Economics, 23:215–227, 2008.
A I Katchova and W S Chern. Comparison of quadratic expenditure system and al-most ideal demand system based on emprical data. International Journal of Applied
Economics, 1(1):55–64, 2004.
212
S Klonaris. Structural change in greek meat demand. Agricultural Economics Review, 2:31–41, 2001.
J T Lafrance. The silence bleating of the lambdas: comment. American Journal of
Agricultural Economics, 80:221–230N:, 1998.
J Q Lee, M G Brown, and J L Seale. Model choice in consumer analysis - Taiwan 1970-89.American Journal of Agricultural Economics, 76(3):504–512, 1994.
M Mazzocchi, D D Monache, and A E Lobb. A structural time series approach to mod-elling multiple and resurgent meat scares in italy. Applied Economics, 38(14):1677–1688,2006.
G J Mergos and G S Donatos. Demand for food in greece: An almost ideal demandsystem analysis. Journal of Agricultural Economics, 40:178–184, 1989.
J A Molina. Food demand in spain: An application of the almost ideal system. Journal
of Agricultural Economics, 45:252–258, 1994.
D Moro and P Sckokai. Heterogeneous preferences in household food consumption initaly. European Review of Agricultural Economics, 27:302–323, 2000.
M H Pesaran and Y Shin. An autoregressive distributed lag modelling approach to cointe-gration analysis. Cambridge Working Papers in Economics 9514, Faculty of Economics,University of Cambridge, 1995.
L Phlips. Applied Consumption analysis. North Holland, 1983.
R A Pollak and T J Wales. Demand System Specification & Estimation. Oxford UniversityPress, New York, 1994.
K Rickertsen, J A Chalfant, and S Marie. The effects of advertising on the demand forvegetables. European Review of Agricultural Economics, 22:481–494, 1995.
R N Stone. Linear expenditure systems and demand analysis: An application to thepattern of british demand. Economic Journal, 64:511–527, 1954.
M.A. Tanner and W.H. Wong. The calculation of the posterior distribution by dataaugmentation (withdiscussion). Journal of the American Statistical Association, 82:528–550, 1987.
D. Terrell. Incorporating montononicity and concavity conditions in flexible functional-forms. Journal of Applied Econometrics, 11:179–194, 1996.
H Theil. The information approach to demand analysis. Principles of Econometrics, 33:67–87, 1965.
A. Tiffin and R. Tiffin. Estimates of food demand elasticities for great britain 1972-1994.Journal of Agricultural Economics, 50(1):140–147, 1999.
R. Tiffin and M. Aguiar. Bayesian estimation of an almost ideal demand system for freshfruit in Portugal. European Review of Agricultural Economics, 22(4):469–480, 1995.
213
R. Tiffin and M. Arnoult. The demand for a healthy diet: Estimating the almost idealdemand system with infrequency of purchase. European Review of Agricultural Eco-
nomics, 37(4):501–521, 2010.
R Tiffin, K Balcombe, and I McFarlane. An efficient algorithm for imposing inequalityrestrictions. Working Paper, Department of Food Economics and Marketing, Universityof Reading, 2010.
J Tobin. Estimation of relationships for limited dependent variables. Econometrica, 26:24–36, 1958.
ST Yen. Working wives and food away from home: the box cox double hurdle model.American Journal Of Agricultural Economics, 75:884–895, 1993.
A Zellner. An Introduction to Bayesian Analysis in Econometrics. John Wiley (reprinted1996 as "Wiley Classics" edition), New York, 1971.
214