Embed Size (px)
Citation preview

Estimating Economic Impacts of
Border Wait Timesin the
San Diego-Baja California Region
February 24, 2006
2
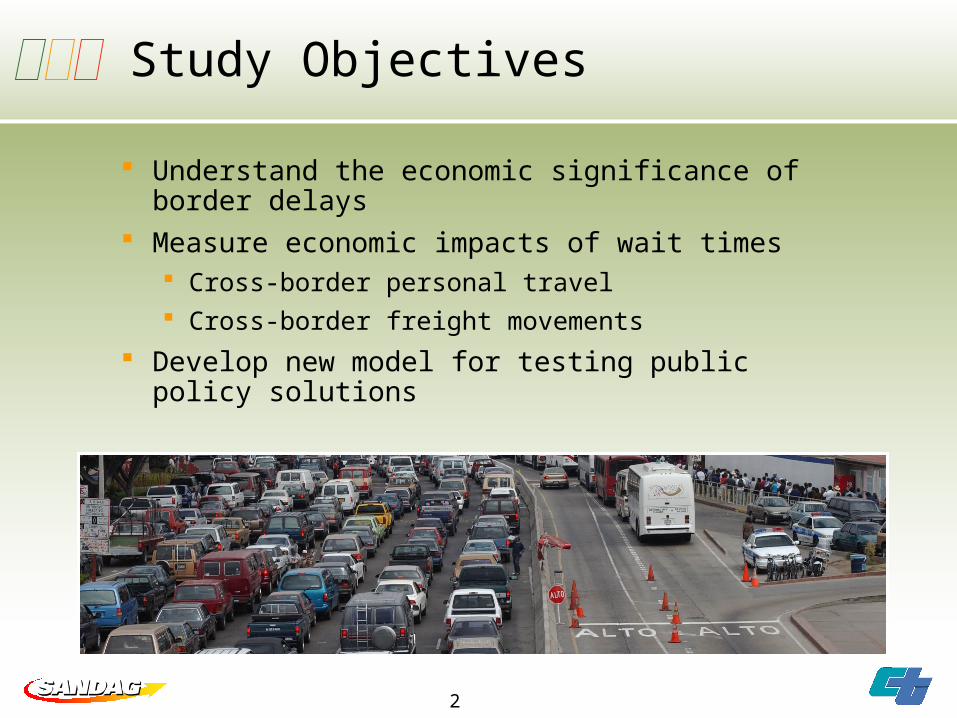
Study Objectives
Understand the economic significance of border delays
Measure economic impacts of wait times Cross-border personal travel Cross-border freight movements
Develop new model for testing public policy solutions
3
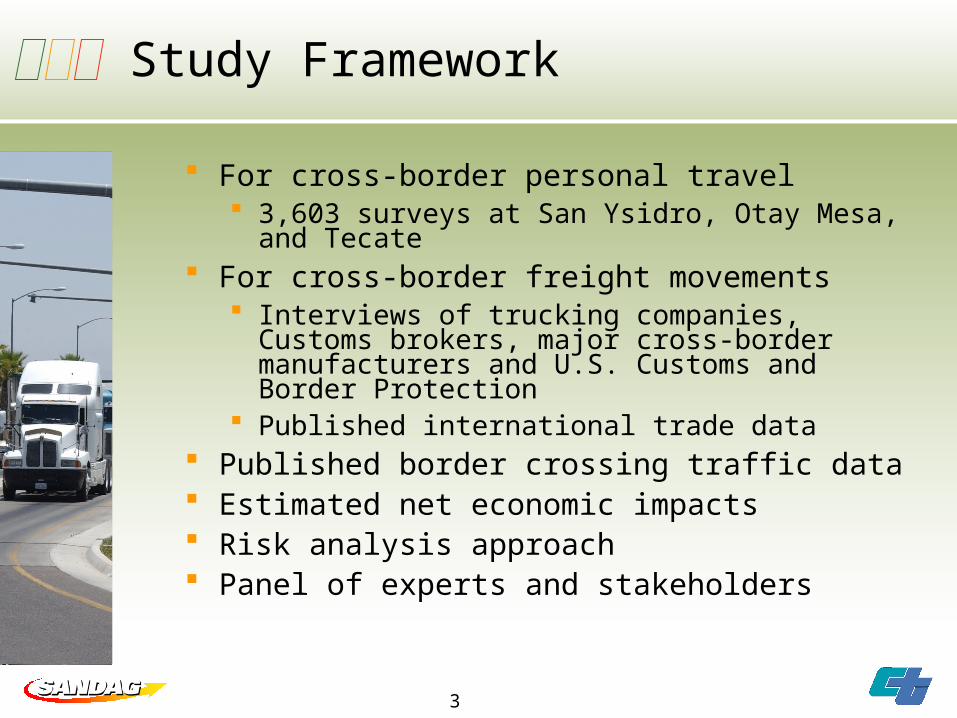
Study Framework
For cross-border personal travel 3,603 surveys at San Ysidro, Otay Mesa,
and Tecate For cross-border freight movements
Interviews of trucking companies, Customs brokers, major cross-border manufacturers and U.S. Customs and Border Protection
Published international trade data Published border crossing traffic data Estimated net economic impacts Risk analysis approach Panel of experts and stakeholders
4
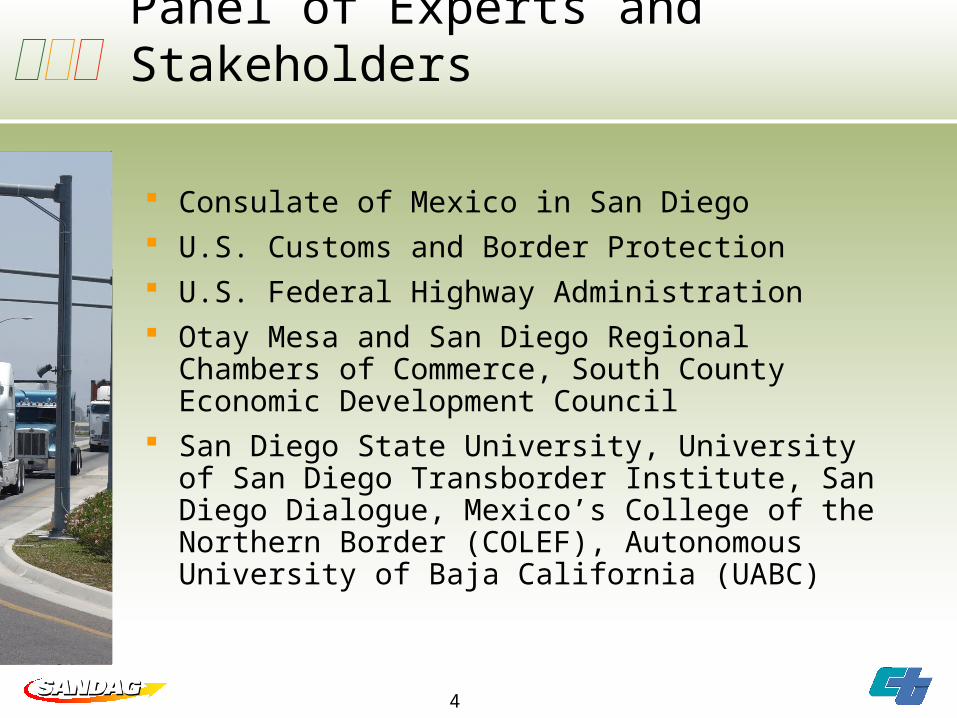
Panel of Experts and Stakeholders
Consulate of Mexico in San Diego U.S. Customs and Border Protection U.S. Federal Highway Administration Otay Mesa and San Diego Regional
Chambers of Commerce, South County Economic Development Council
San Diego State University, University of San Diego Transborder Institute, San Diego Dialogue, Mexico’s College of the Northern Border (COLEF), Autonomous University of Baja California (UABC)
5
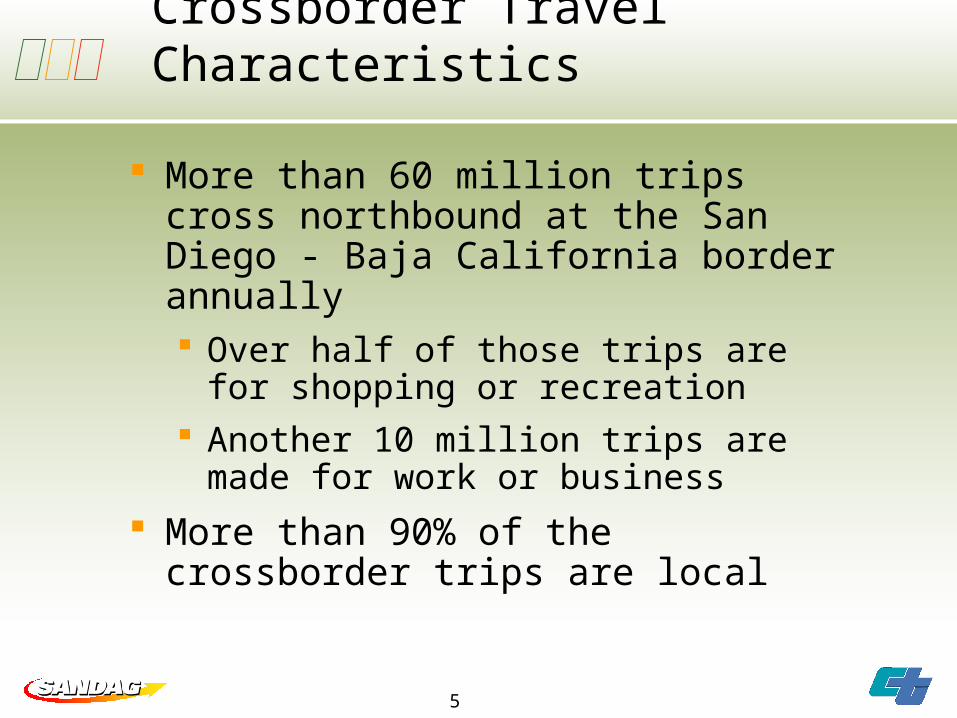
Crossborder Travel Characteristics
More than 60 million trips cross northbound at the San Diego - Baja California border annually Over half of those trips are for
shopping or recreation Another 10 million trips are made for
work or business
More than 90% of the crossborder trips are local
6
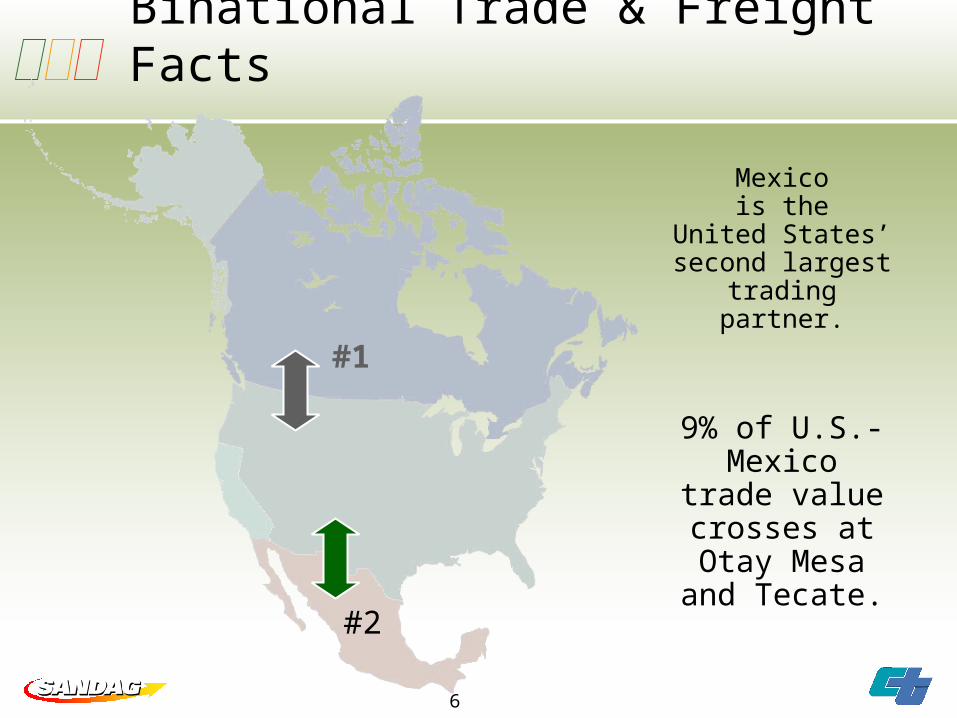
Binational Trade & Freight Facts
9% of U.S.-Mexico
trade value crosses at Otay Mesa and Tecate.
#1
Mexicois the
United States’ second largest
trading partner.
#2
7
Binational Trade & Freight Facts
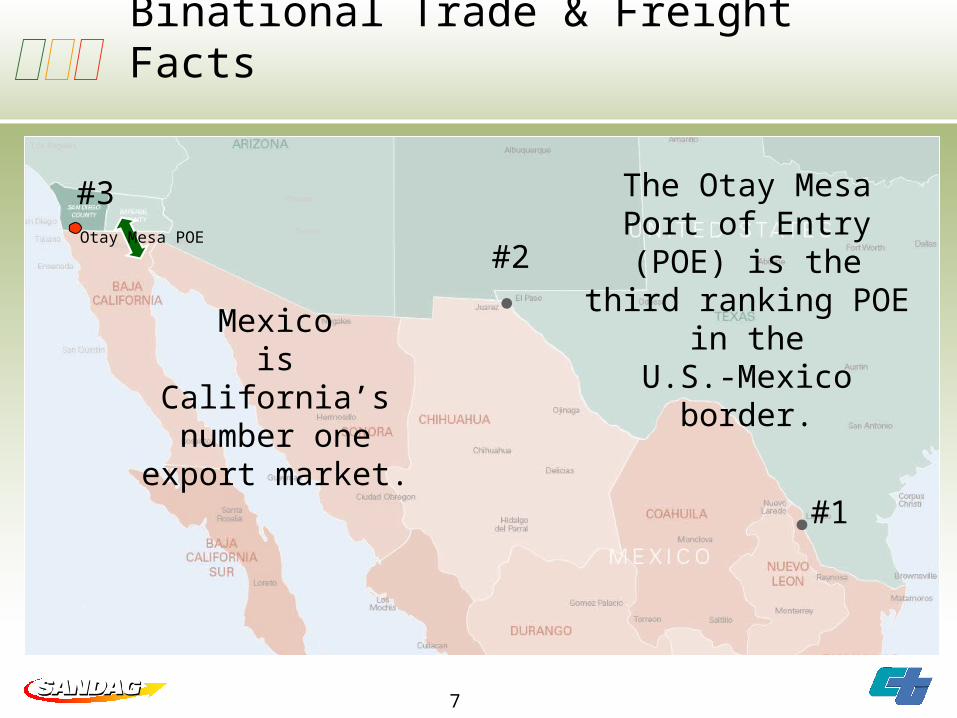
Mexicois
California’s number one
export market.
#2
#1
#3 The Otay MesaPort of Entry (POE) is the third ranking
POE in theU.S.-Mexico border.
Otay Mesa POE
8
Binational Trade & Freight Facts
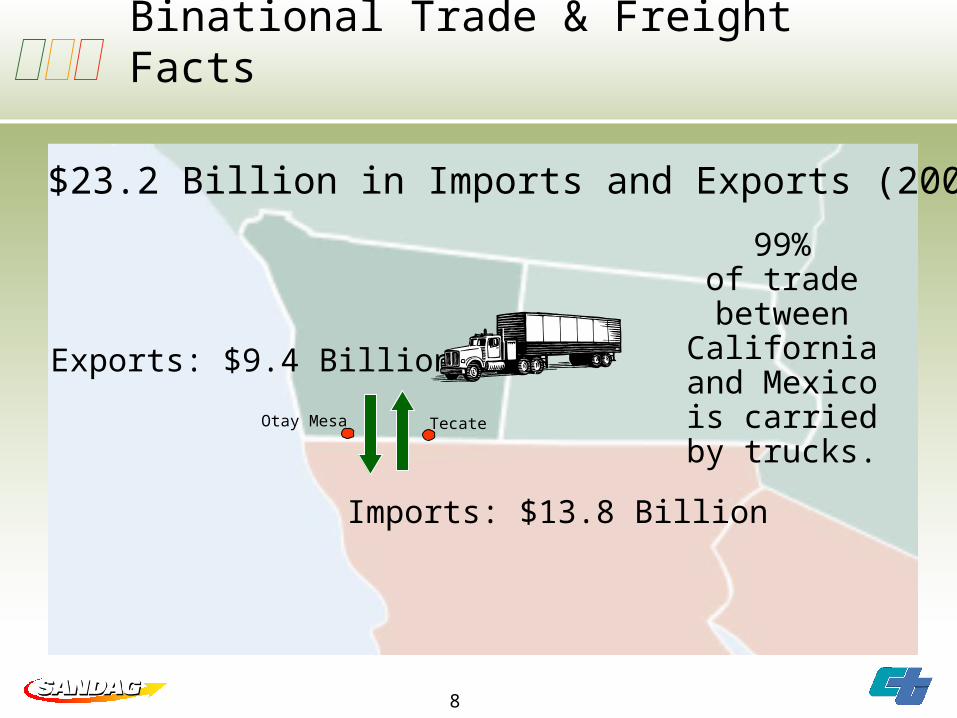
$23.2 Billion in Imports and Exports (2004)
Otay Mesa Tecate
Exports: $9.4 Billion
Imports: $13.8 Billion
99%of trade between California
and Mexico is carried by
trucks.

9
Otay Mesa & Tecate POEs
Northbound Truck Crossings
Num
ber
of
Tru
cks
(thousa
nds)
0
200
400
600
800
1995
2001
2002
2003
2004
1996
1998
1999
2000
1997
Otay Mesa
Tecate
0
$ 5,000
$10,000
$15,000
$20,000
$25,000
Two-Way Trade
Tw
o-W
ay T
rade (in
$m
illions)
10
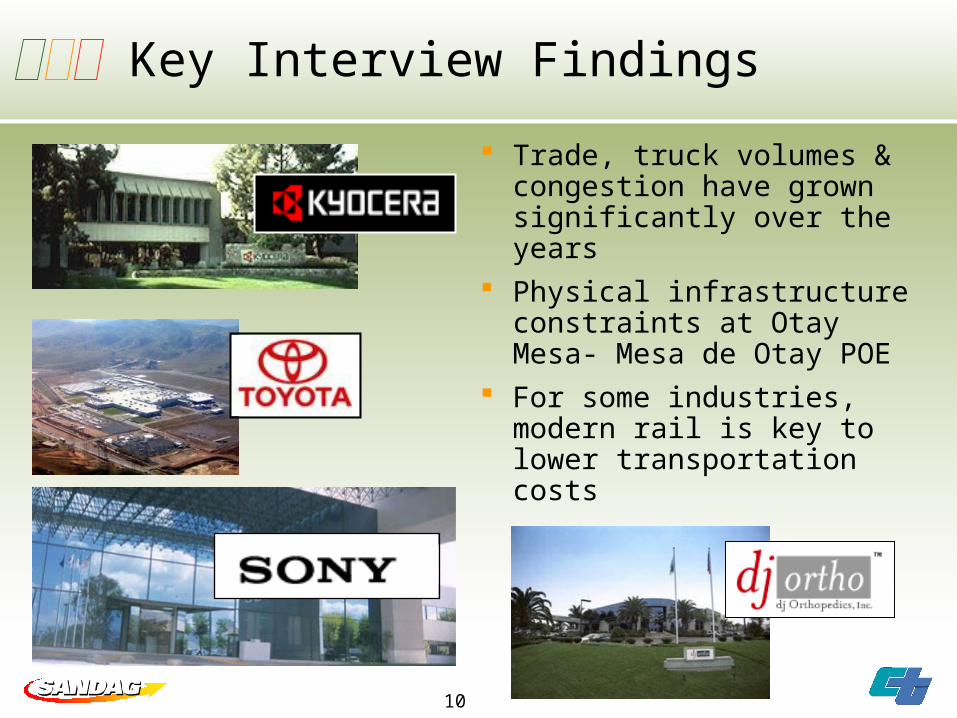
Key Interview Findings
Trade, truck volumes & congestion have grown significantly over the years
Physical infrastructure constraints at Otay Mesa- Mesa de Otay POE
For some industries, modern rail is key to lower transportation costs

11
Key Interview Findings
Extremely sensitive supply chain No inventories: Just In Time Parts go back and forth across
the border several times Delays at Otay Mesa POE are
as important as delays at Port of LA/Long Beach
Delays mean higher logistics costs and lost economic opportunities
Time is money F.A.S.T./ Empresa Certificada Tijuana-Tecate Toll Road
12
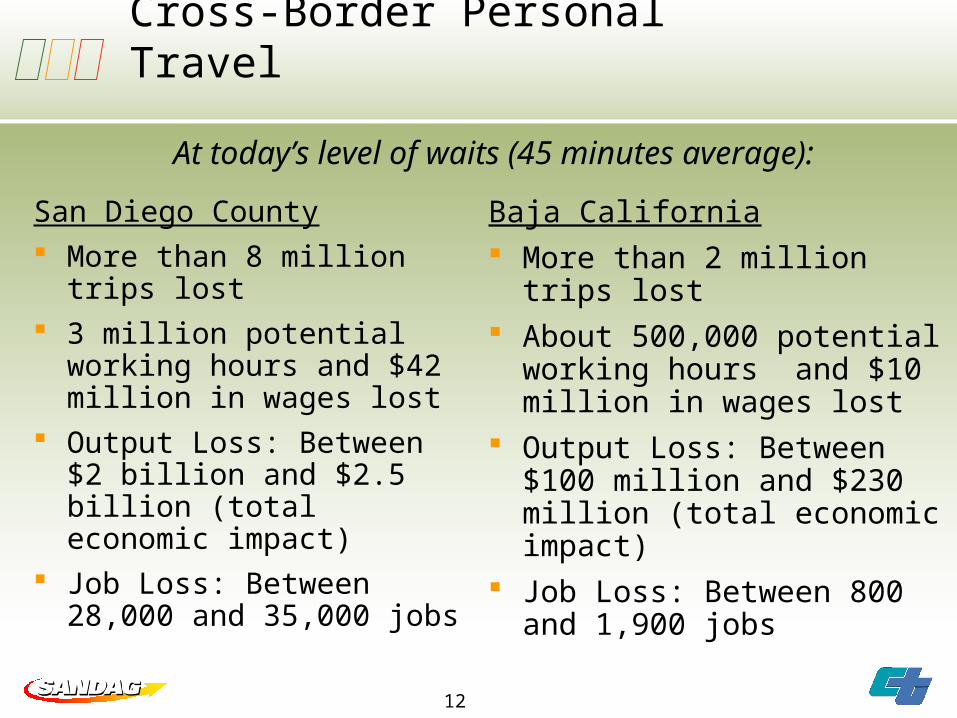
Cross-Border Personal Travel
San Diego County More than 8 million trips
lost 3 million potential
working hours and $42 million in wages lost
Output Loss: Between $2 billion and $2.5 billion (total economic impact)
Job Loss: Between 28,000 and 35,000 jobs
Baja California More than 2 million trips
lost About 500,000 potential
working hours and $10 million in wages lost
Output Loss: Between $100 million and $230 million (total economic impact)
Job Loss: Between 800 and 1,900 jobs
At today’s level of waits (45 minutes average):
13
Cross-Border Personal Travel
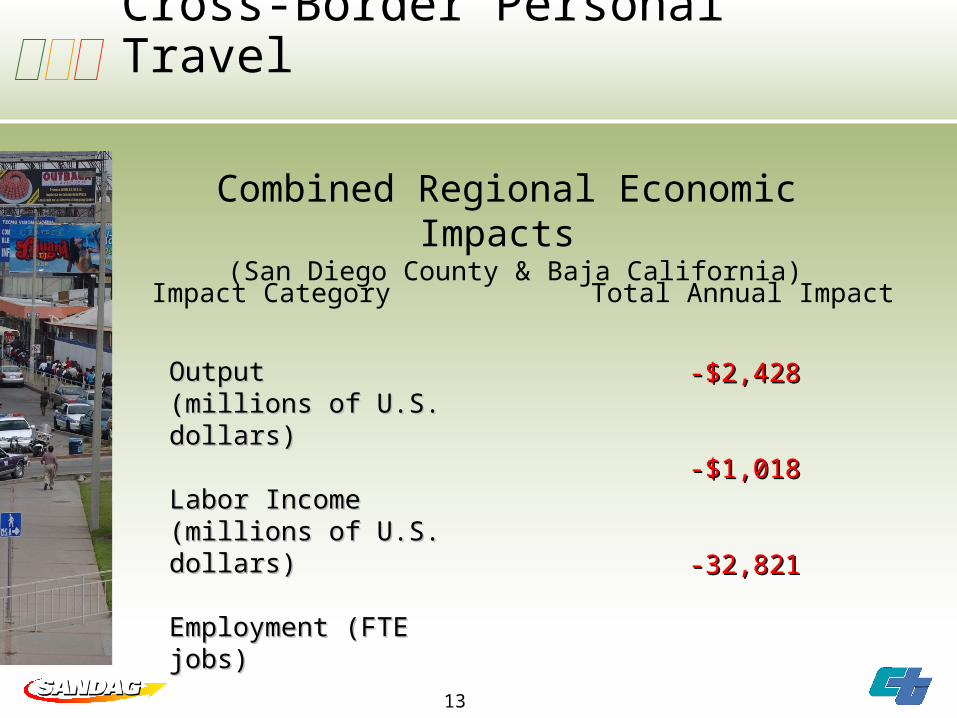
Impact Category Total Annual Impact
Output Output (millions of U.S. (millions of U.S. dollars)dollars)
Labor IncomeLabor Income(millions of U.S. (millions of U.S. dollars)dollars)
Employment (FTE Employment (FTE jobs)jobs)
-$2,428-$2,428
-$1,018-$1,018
-32,821-32,821
Combined Regional Economic Impacts
(San Diego County & Baja California)
14
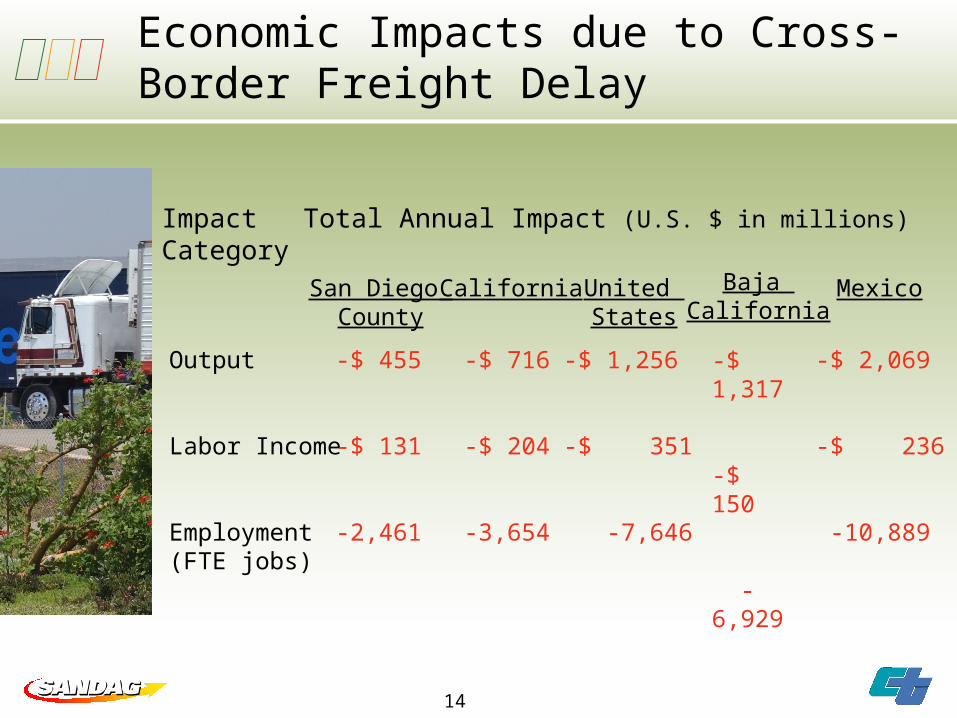
Economic Impacts due to Cross-Border Freight Delay
Impact Category
Total Annual Impact (U.S. $ in millions)
California United States
San Diego County
Output
Labor Income
Employment(FTE jobs)
-$ 455
-$ 131
-2,461
-$ 716
-$ 204
-3,654
-$ 1,256
-$ 351
-7,646
MexicoBaja California
-$ 1,317
-$ 150
-6,929
-$ 2,069
-$ 236
-10,889
15
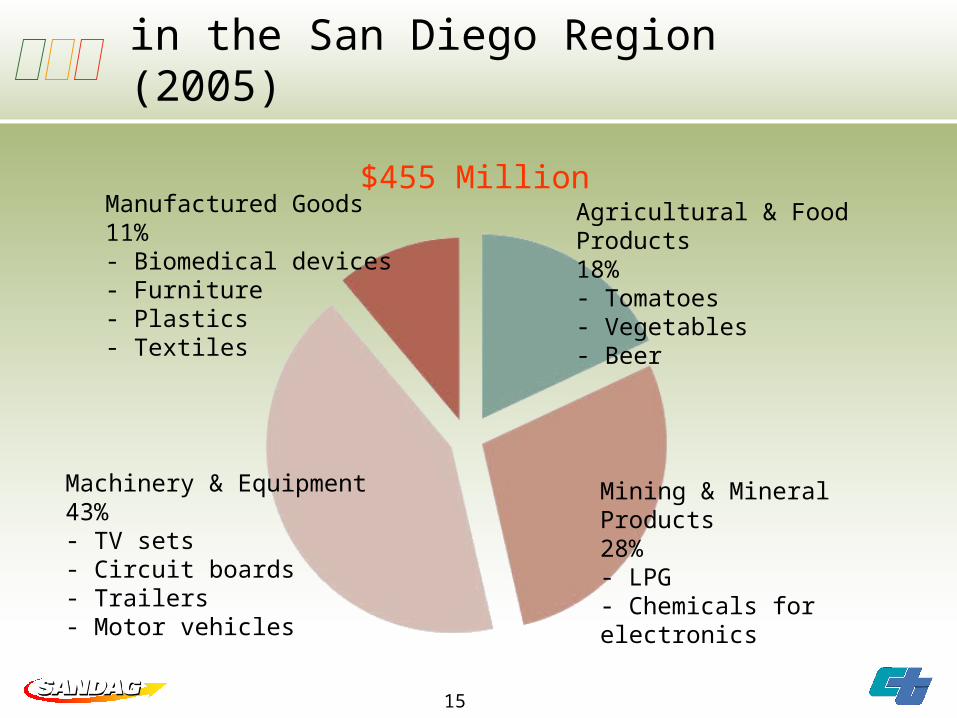
Total Output Impacts by Sector in the San Diego Region (2005)
$455 Million
Machinery & Equipment43%- TV sets- Circuit boards- Trailers- Motor vehicles
Manufactured Goods11%- Biomedical devices- Furniture- Plastics- Textiles
Agricultural & Food Products18%- Tomatoes- Vegetables- Beer
Mining & Mineral Products28%- LPG- Chemicals for electronics
16
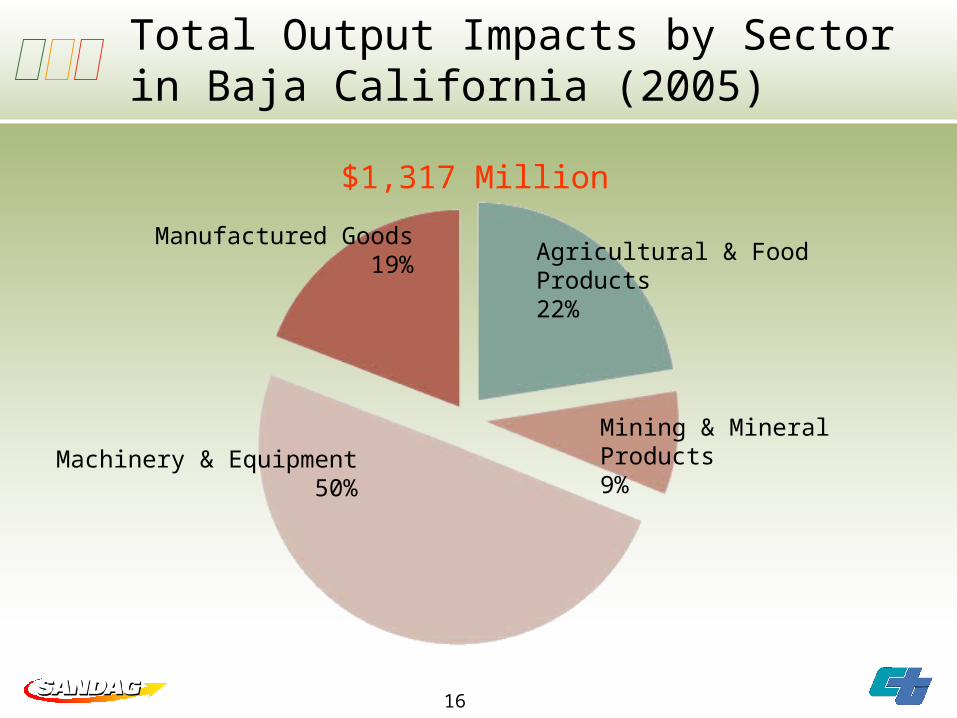
Total Output Impacts by Sectorin Baja California (2005)
$1,317 Million
Machinery & Equipment50%
Manufactured Goods19% Agricultural & Food Products
22%
Mining & Mineral Products9%
17
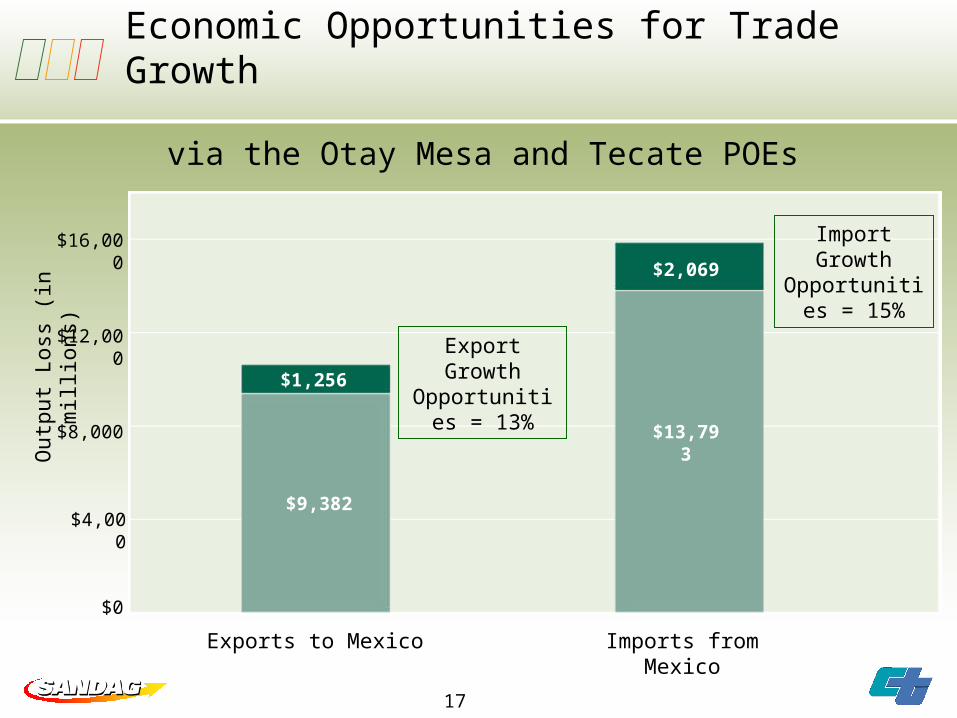
$1,256
$2,069
Economic Opportunities for Trade Growth
via the Otay Mesa and Tecate POEs
$0
$4,000
$8,000
$12,000
$16,000
Exports to Mexico Imports from Mexico
$9,382
$13,793
Outp
ut
Loss
(in
m
illio
ns) Export
Growth Opportunities
= 13%
Import Growth
Opportunities = 15%
18
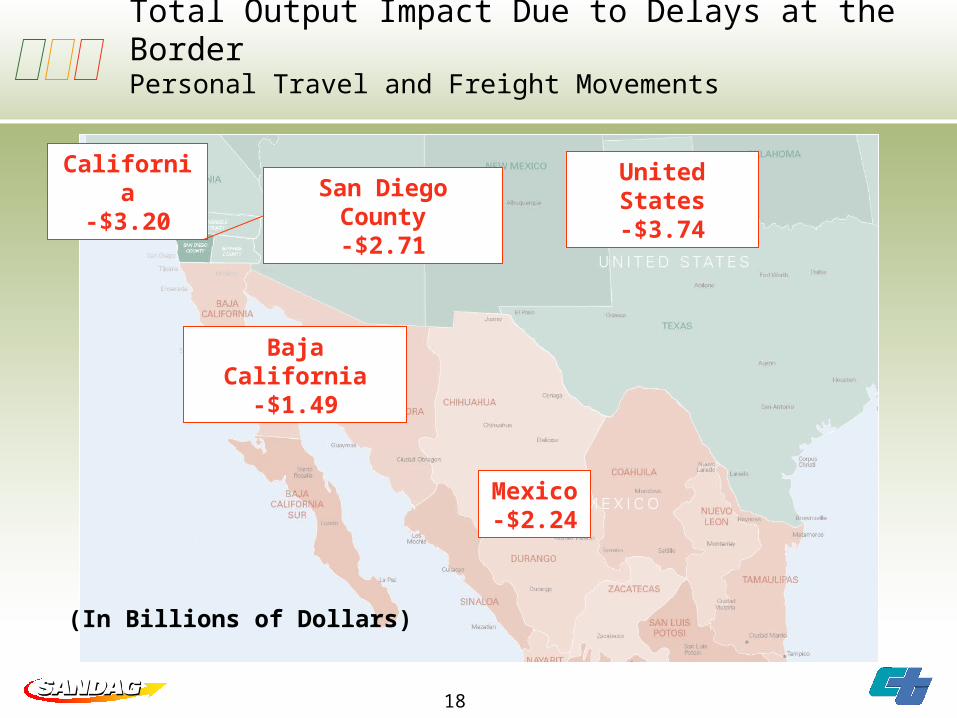
Total Output Impact Due to Delays at the BorderPersonal Travel and Freight Movements
California-$3.20
(In Billions of Dollars)
San Diego County-$2.71
Baja California-$1.49
Mexico
-$2.24
United States-$3.74
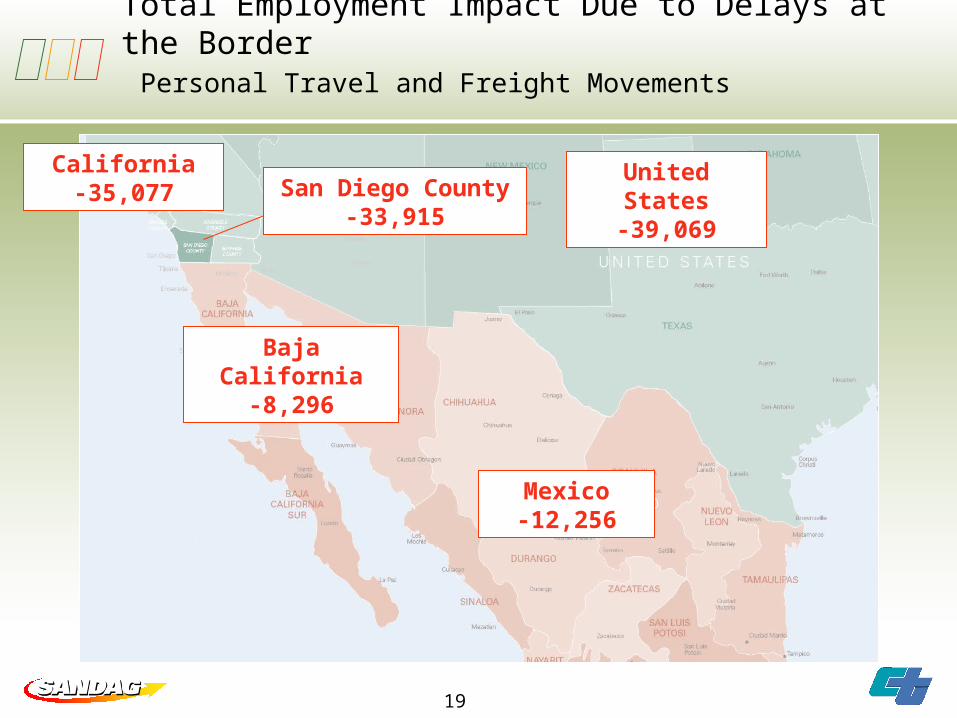
19
California-35,077 San Diego County
-33,915
Baja California
-8,296
Mexico-12,256
United States-39,069
Total Employment Impact Due to Delays at the Border Personal Travel and Freight Movements
20
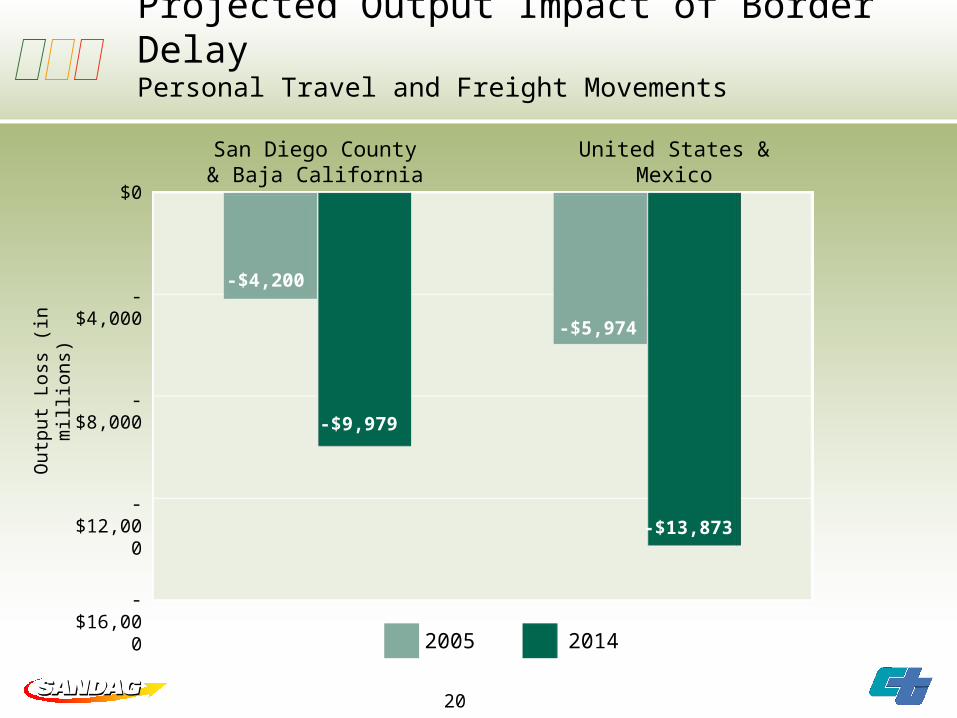
Projected Output Impact of Border DelayPersonal Travel and Freight Movements
San Diego County & Baja California
United States & Mexico
2005
2014
$0
-$4,000
-$8,000
-$12,00
0
-$16,00
0
Ou
tput
Loss
(in
mill
ions) -$4,200
-$5,974
-$9,979
-$13,873
21
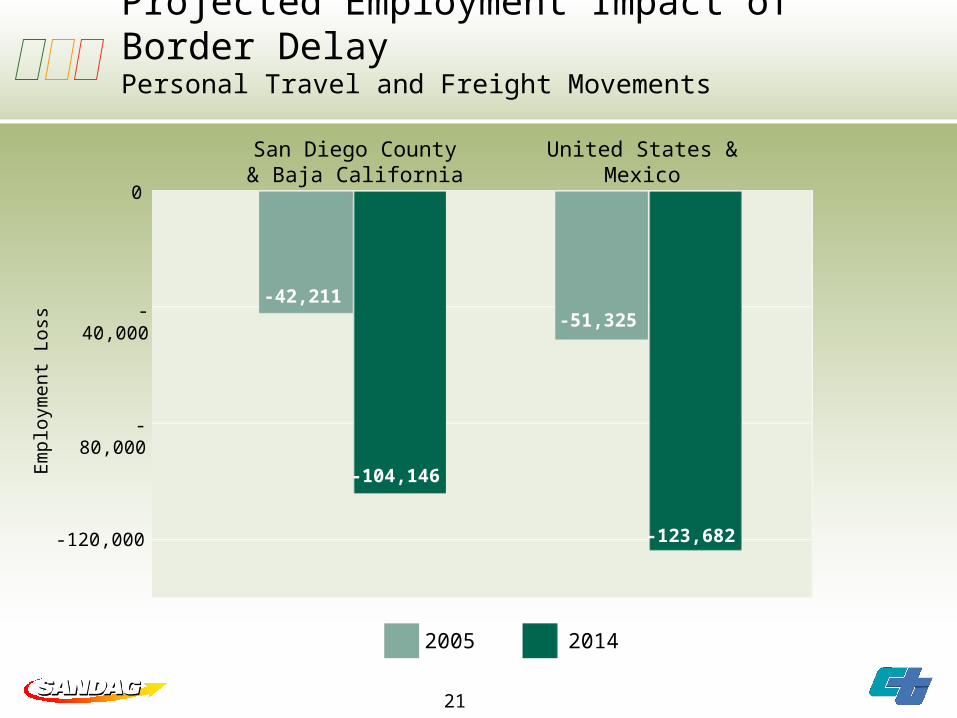
Projected Employment Impact of Border DelayPersonal Travel and Freight Movements
San Diego County & Baja California
United States & Mexico
2005
2014
0
-40,000
-80,000
-120,000
Em
plo
ym
ent
Loss
-42,211-51,325
-104,146
-123,682
22
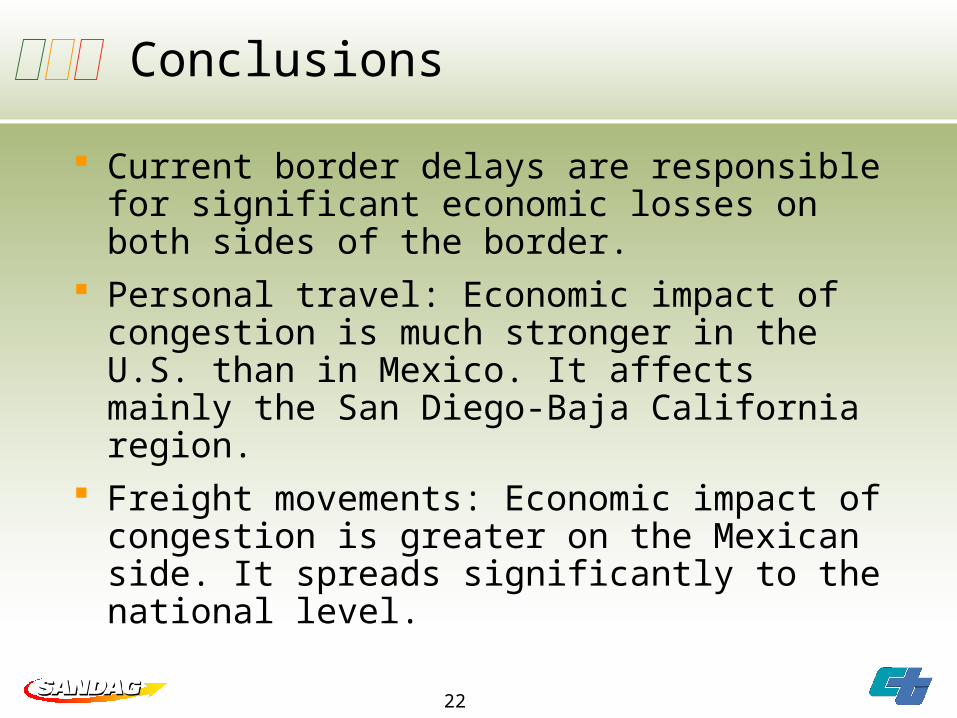
Conclusions
Current border delays are responsible for significant economic losses on both sides of the border.
Personal travel: Economic impact of congestion is much stronger in the U.S. than in Mexico. It affects mainly the San Diego-Baja California region.
Freight movements: Economic impact of congestion is greater on the Mexican side. It spreads significantly to the national level.
23
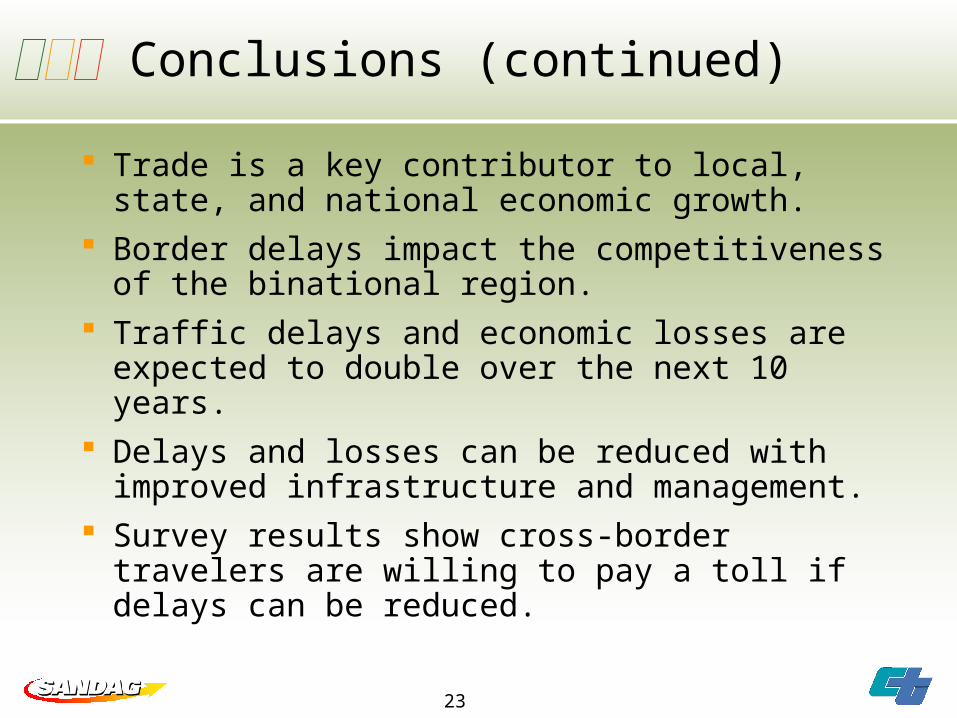
Conclusions (continued)
Trade is a key contributor to local, state, and national economic growth.
Border delays impact the competitiveness of the binational region.
Traffic delays and economic losses are expected to double over the next 10 years.
Delays and losses can be reduced with improved infrastructure and management.
Survey results show cross-border travelers are willing to pay a toll if delays can be reduced.
24
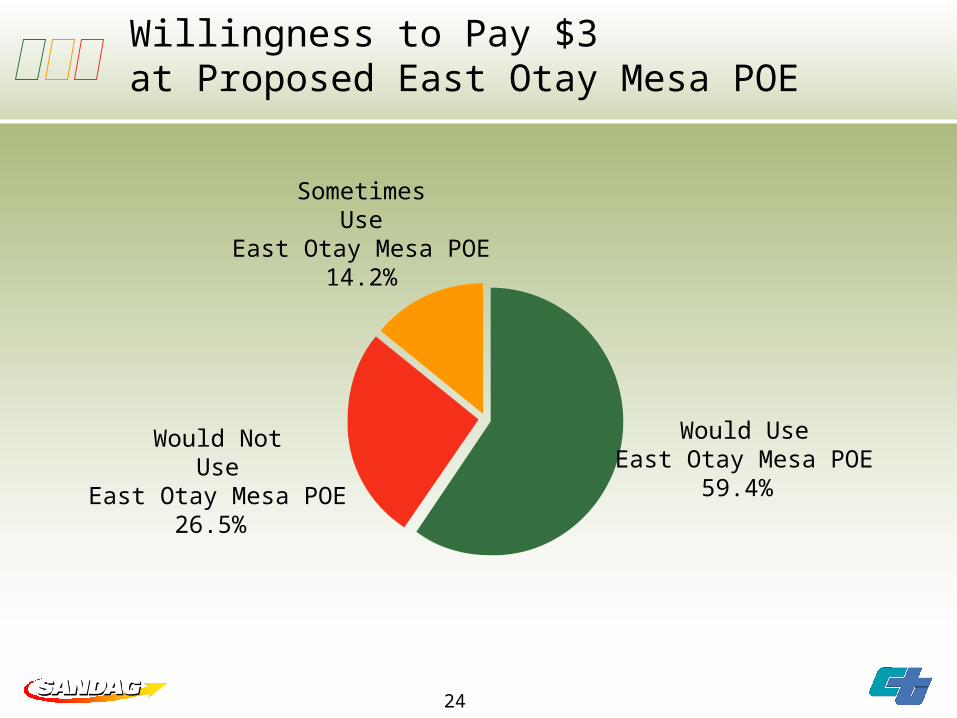
Willingness to Pay $3 at Proposed East Otay Mesa POE
Would NotUse
East Otay Mesa POE26.5%
Would UseEast Otay Mesa POE
59.4%
SometimesUse
East Otay Mesa POE14.2%
Estimating Economic Impacts of
Border Wait Timesin the
San Diego-Baja California Region
February 24, 2006