Embed Size (px)
Citation preview
Hydrol. Earth Syst. Sci., 20, 2779–2800, 2016www.hydrol-earth-syst-sci.net/20/2779/2016/doi:10.5194/hess-20-2779-2016© Author(s) 2016. CC Attribution 3.0 License.
Estimating drought risk across Europe from reported droughtimpacts, drought indices, and vulnerability factorsVeit Blauhut1, Kerstin Stahl1, James Howard Stagge2, Lena M. Tallaksen2, Lucia De Stefano3, and Jürgen Vogt4
1Hydrology, Faculty of Environment and Natural Resources, University of Freiburg, Freiburg, Germany2Department of Geosciences, University of Oslo, Oslo, Norway3Department of Geodynamics, Complutense University of Madrid, Madrid, Spain4Joint Research Centre of the European Commission, JRC, Ispra, Italy
Correspondence to: Veit Blauhut ([email protected])
Received: 31 October 2015 – Published in Hydrol. Earth Syst. Sci. Discuss.: 3 December 2015Revised: 25 May 2016 – Accepted: 10 June 2016 – Published: 12 July 2016
Abstract. Drought is one of the most costly natural hazardsin Europe. Due to its complexity, drought risk, meant as thecombination of the natural hazard and societal vulnerabil-ity, is difficult to define and challenging to detect and pre-dict, as the impacts of drought are very diverse, coveringthe breadth of socioeconomic and environmental systems.Pan-European maps of drought risk could inform the elab-oration of guidelines and policies to address its documentedseverity and impact across borders. This work tests the ca-pability of commonly applied drought indices and vulner-ability factors to predict annual drought impact occurrencefor different sectors and macro regions in Europe and com-bines information on past drought impacts, drought indices,and vulnerability factors into estimates of drought risk at thepan-European scale. This hybrid approach bridges the gapbetween traditional vulnerability assessment and probabilis-tic impact prediction in a statistical modelling framework.Multivariable logistic regression was applied to predict thelikelihood of impact occurrence on an annual basis for par-ticular impact categories and European macro regions. Theresults indicate sector- and macro-region-specific sensitivi-ties of drought indices, with the Standardized PrecipitationEvapotranspiration Index (SPEI) for a 12-month accumula-tion period as the overall best hazard predictor. Vulnerabilityfactors have only limited ability to predict drought impacts assingle predictors, with information about land use and waterresources being the best vulnerability-based predictors. Theapplication of the hybrid approach revealed strong regionaland sector-specific differences in drought risk across Europe.
The majority of the best predictor combinations rely on acombination of SPEI for shorter and longer accumulationperiods, and a combination of information on land use andwater resources. The added value of integrating regional vul-nerability information with drought risk prediction could beproven. Thus, the study contributes to the overall understand-ing of drivers of drought impacts, appropriateness of droughtindices selection for specific applications, and drought riskassessment.
1 Introduction
Drought is a natural phenomenon that can become a natu-ral disaster if not adequately managed (Wilhite, 2000). Un-like other natural hazards, it has a creeping onset and doesnot have a unique definition (Lloyd-Hughes, 2014), whichmakes defining the beginning or end of a drought event diffi-cult (Hayes et al., 2004; Wilhite et al., 2007). Drought is ei-ther defined by its physical characteristics, e.g. meteorolog-ical drought, soil moisture drought or hydrological drought(e.g. Wilhite and Glantz, 1985), or by its consequences on so-cioeconomic and environmental systems, i.e. its negative im-pacts (Blauhut et al., 2015a). These impacts can either be di-rect (e.g. reduced crop yields) or indirect (e.g. increased costsfor food due to reduced crop yields) and can occur across awide range of temporal and spatial scales. In the EuropeanUnion (EU), more than 4800 unique drought impact entrieshave been identified in the European Drought Impact Re-
Published by Copernicus Publications on behalf of the European Geosciences Union.
2780 V. Blauhut et al.: Estimating drought risk across Europe from reported drought impacts
port Inventory (EDII) across 15 different impact categoriesfrom agriculture to water quality (Stahl et al., 2016) and fi-nancial losses over the last 3 decades were estimated to overEUR 100 billion (EC, 2007).
To mitigate these impacts, until recently drought riskmanagement at the pan-European scale has predominantlyfocused on coping with financial losses, mainly throughcalamity funds, mutual funds, and insurances (Diaz-Canejaet al., 2009). Nevertheless, today’s scientific consensuspoints to the need to move from a reactive to a proactive riskmanagement strategy (Wilhite et al., 2007). Rossi and Can-celliere (2012) stated that an advanced assessment of droughtmust include firstly, an investigation of socioeconomic andenvironmental impacts, secondly, multicriteria tools to miti-gate these, and thirdly, a set of easily understood models andtechniques for application by stakeholders and decision mak-ers responsible for drought preparedness planning.
The risk of natural disasters in a very general sense is acombined function of hazard and vulnerability (Birkmann etal., 2013). For drought risk analysis, risk may be estimatedthrough a combination of hazard measures and estimates ofvulnerability or proxies of it. Cardona et al. (2012) observedthat “vulnerability and risk assessment deal with the iden-tification of different facets and factors of vulnerability andrisk, by means of gathering and systematising data and in-formation, in order to be able to identify and evaluate dif-ferent levels of vulnerability and risk of societies – socialgroups and infrastructures – or coupled socioecological sys-tems”. Hence, the assessment of the vulnerability componentof drought risk is based either on vulnerability factors or onpast drought impacts, as these are considered to be symptomsof vulnerability (Knutson et al., 1998).
According to Knutson et al. (1998), vulnerability assess-ments provide a framework for identifying the root causes ofdrought impacts at social, economic, and environmental lev-els and measure a potential state, which will generate impactsif a given level of hazard occurs. Vulnerability to drought, asthe predisposition to be adversely affected by a given haz-ard (IPCC, 2012), therefore is often assessed by the factorapproach, in which a set of vulnerability factors (e.g. Swainand Swain, 2011; Jordaan, 2012; Naumann et al., 2014; Kar-avitis et al., 2014) contribute to an overall classification ofvulnerability (e.g. information on water resources, societyor technical infrastructure; González-Tánago et al., 2015).Based on their review of 46 drought-factor-based vulnera-bility assessments, González-Tánago et al. (2015) observedthat only 57 % of the studies actually describe the processfollowed to select vulnerability factors. Among those, thecriteria used include the consultation of previous studies andspecialised literature, data availability, and expert knowledge(González-Tánago et al., 2015). The selection of vulnerabil-ity factors is guided by the focus of the study, the definitionof drought applied, the study location, and data availability.Vulnerability factors are often combined and weighted by ex-pert knowledge and stakeholder interaction to a single, over-
all vulnerability index (Wilhelmi and Wilhite, 1997; Adepetuand Berthe, 2007; Deems and Bruggeman, 2010). The ma-jority of studies provide limited or no information on proce-dures applied to verify the derived index (González-Tánagoet al., 2015). Only few studies validate their results, amongthem Aggett (2013), Naumann et al. (2014), and Karavitis etal. (2014).
Impact approaches to vulnerability and risk assessment,on the other hand, use information on past drought impactsas a proxy for vulnerability, assuming that a system has beenvulnerable if it has been impacted. Drought risk is then con-sidered the risk for a particular type of impact. Typically, theimpact of drought is then characterised based on data of ei-ther financial or quantitative losses of agricultural production(Hlavinka et al., 2009; Rossi and Niemeyer, 2010; Tsakiriset al., 2010; Gil et al., 2011; Jayanthi et al., 2014; Quijanoet al., 2014), human mortality (Dilley et al., 2005), or im-pacts on forestry (Vicente-Serrano et al., 2012; Muukkonenet al., 2015). Blauhut et al. (2015a) applied annual impact oc-currence based on reported information in the EDII to char-acterise sector-specific vulnerability. Drought risk was thenestimated as the probability of impact occurrence as a func-tion of the Standardized Precipitation Evapotranspiration In-dex (SPEI). The function used was a fitted logistic regressionmodel. The estimated parameters could subsequently be usedto generate a first set of pan-European drought risk maps.The displayed likelihood of impact occurrence on the mapscan be considered impact-category-specific drought risk forselected hazard intensities. Stagge et al. (2015b) consideredvariations of the logistic regression and expanded the ap-proach to include multiple hazard predictors. Bachmair etal. (2015) applied regression tree and correlation approachesto link impact number and occurrence with a range of in-dices. Both studies relied on a rather high temporal resolutionof reported impact occurrence, and hence considered only afew regions with particularly good data coverage.
The hazard component of drought risk is commonly de-rived from a statistical analysis of a single drought indi-cator, a single or set of drought indices, or a combineddrought index (Hayes, 1998; Zargar et al., 2011). Droughtindices are well researched and have been applied to char-acterise drought patterns across Europe in several stud-ies (Lloyd-Hughes and Saunders, 2002; Parry et al., 2012;Stagge et al., 2013; Tallaksen and Stahl, 2014; Spinoni etal., 2015). The actual monitoring of drought in Europe isconducted at different scales: national (e.g. German DroughtMonitor), transnational (e.g. Drought Management Centrefor Southeastern Europe (DMCSEE), continental (e.g. Eu-ropean Drought Observatory, EDO), and global (e.g. SPEIGlobal Drought Monitor). But what is the basis for theirselection as drought predictors? Bachmair et al. (2016) re-viewed pertinent literature and surveyed existing monitor-ing systems and found that tradition as well as data avail-ability are commonly the criteria to select the most ap-propriate drought index. Drought severity or warning lev-
Hydrol. Earth Syst. Sci., 20, 2779–2800, 2016 www.hydrol-earth-syst-sci.net/20/2779/2016/
V. Blauhut et al.: Estimating drought risk across Europe from reported drought impacts 2781
els are commonly categorised into arbitrarily chosen haz-ard index thresholds, such as those selected for the Stan-dardized Precipitation Index (SPI) (−1.5<SPI<−1: mod-erate drought, −2<SPI<−1.5: severe drought, SPI<−2:extreme drought, where negative values represents less thanmedian precipitation) (McKee et al., 1993). Defining haz-ard severity thresholds that relate to potential impacts onsocioeconomic and natural systems, and thus the droughtrisk, is often left to expert judgement. However, an indepen-dent validation of the relevance of the various drought in-dicators for management purposes is of crucial importance(Pedro-Monzonís et al., 2015). Bachmair et al. (2016) foundthat although drought monitoring and early warning systemproviders often collect impact information, these are rarelyused systematically to validate the usefulness of particularhazard indices. Such usefulness has been tested mostly inlocal or regional case studies based on empirical links be-tween quantified losses such as financial or yield losses andclimatic or resource (water availability) conditions (Jayan-thi et al., 2014; Stone and Potgieter, 2008; Schindler et al.,2007). Stagge et al. (2015b). Bachmair et al. (2015) have as-sessed the link between impacts and different drought indicesin selected European countries and found that the best indicesvary with location and sector.
In this study, we expand the method of Blauhut etal. (2015a) into a hybrid approach, which implies the consid-eration of vulnerability factors into the probabilistic impactprediction. The approach builds on earlier work developedfor the agricultural sector (Zhang et al., 2011; Ahmed andElagib, 2014; Han et al., 2015; Yin et al., 2014) and a Euro-pean assessment by De Stefano et al. (2015), who consideredseveral physical and socioeconomic factors to calculate sen-sitivity and adaptive capacity, and used impact informationcollected in the EDII to estimate exposure. More specifically,the hybrid approach aims to
1. investigate the ability of commonly used drought in-dices and vulnerability factors to predict annual droughtimpact occurrence for various sectors;
2. identify the best-performing combinations of predictorsto model drought risk for different sectors; and
3. map sector-specific drought risk for selected hazardseverity levels across Europe.
This study addresses these aims through statistical modelling(logistic regression) of the combined effect of drought haz-ard, defined by drought indices, and drought vulnerability,defined by vulnerability factors, on the occurrence of histor-ical drought impacts as extracted from the EDII. In a firststep, potentially relevant drought indices and vulnerabilityfactors were tested for their suitability as impact predictorsin binary logistic models. Then, impact category and region-specific multivariable logistic models were built in a hybridapproach, combining the most relevant drought indices and
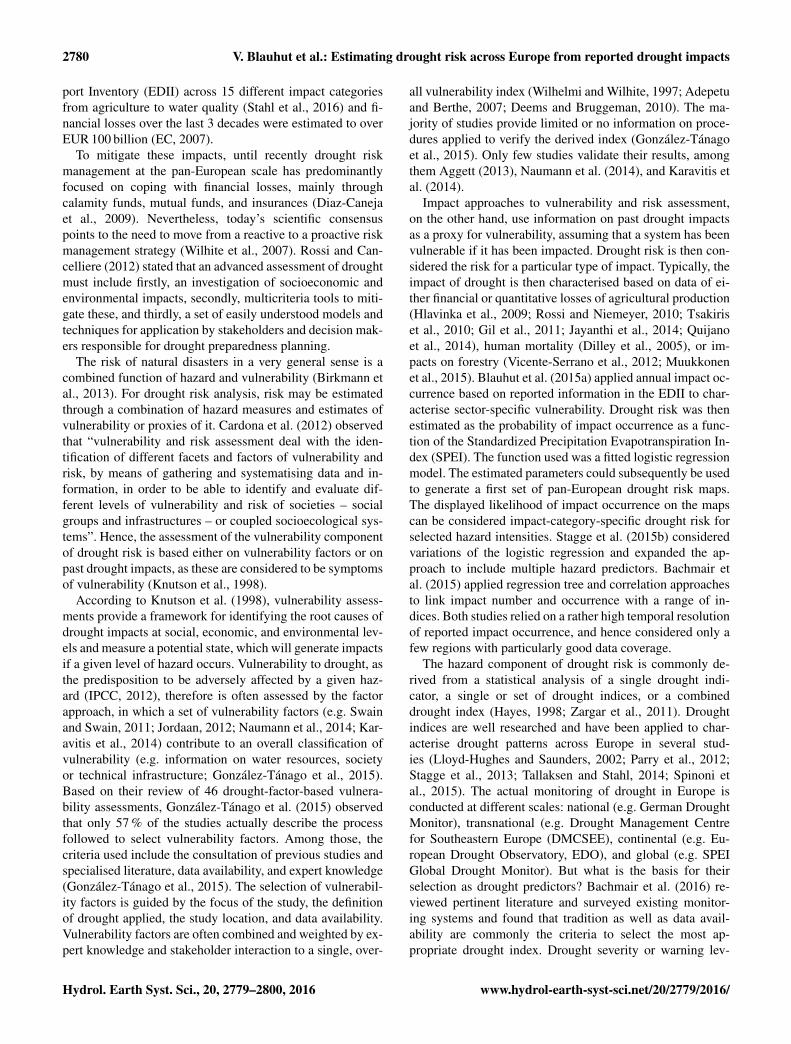
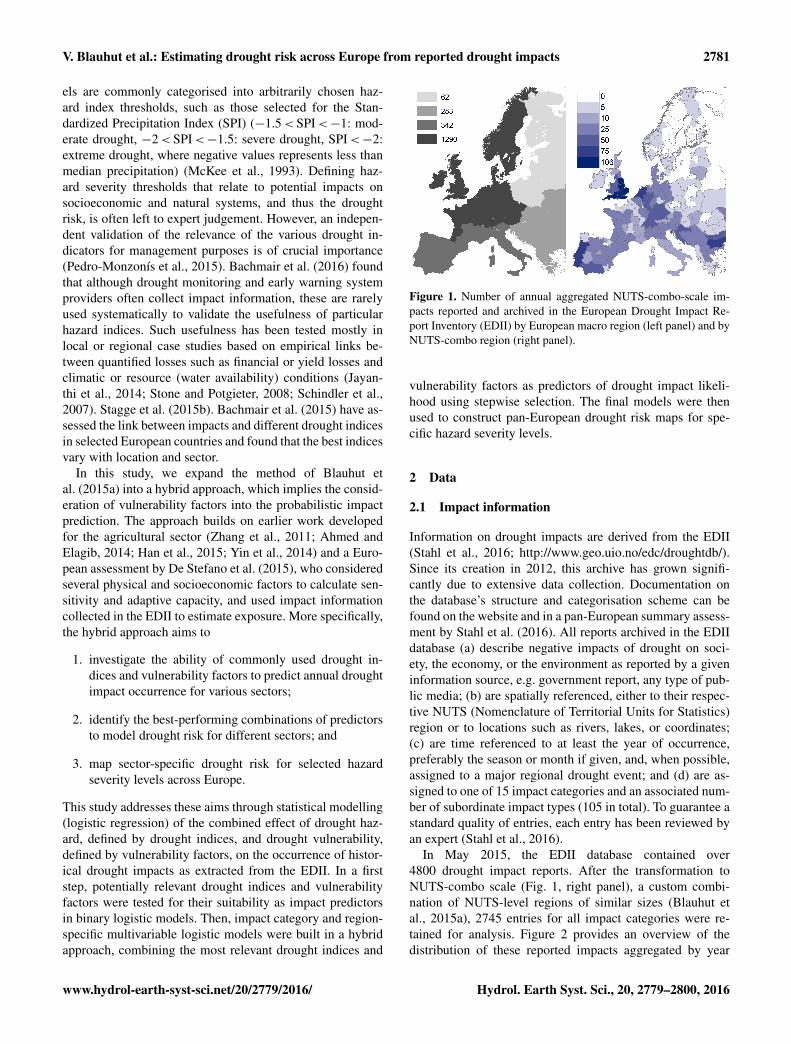
Figure 1. Number of annual aggregated NUTS-combo-scale im-pacts reported and archived in the European Drought Impact Re-port Inventory (EDII) by European macro region (left panel) and byNUTS-combo region (right panel).
vulnerability factors as predictors of drought impact likeli-hood using stepwise selection. The final models were thenused to construct pan-European drought risk maps for spe-cific hazard severity levels.
2 Data
2.1 Impact information
Information on drought impacts are derived from the EDII(Stahl et al., 2016; http://www.geo.uio.no/edc/droughtdb/).Since its creation in 2012, this archive has grown signifi-cantly due to extensive data collection. Documentation onthe database’s structure and categorisation scheme can befound on the website and in a pan-European summary assess-ment by Stahl et al. (2016). All reports archived in the EDIIdatabase (a) describe negative impacts of drought on soci-ety, the economy, or the environment as reported by a giveninformation source, e.g. government report, any type of pub-lic media; (b) are spatially referenced, either to their respec-tive NUTS (Nomenclature of Territorial Units for Statistics)region or to locations such as rivers, lakes, or coordinates;(c) are time referenced to at least the year of occurrence,preferably the season or month if given, and, when possible,assigned to a major regional drought event; and (d) are as-signed to one of 15 impact categories and an associated num-ber of subordinate impact types (105 in total). To guarantee astandard quality of entries, each entry has been reviewed byan expert (Stahl et al., 2016).
In May 2015, the EDII database contained over4800 drought impact reports. After the transformation toNUTS-combo scale (Fig. 1, right panel), a custom combi-nation of NUTS-level regions of similar sizes (Blauhut etal., 2015a), 2745 entries for all impact categories were re-tained for analysis. Figure 2 provides an overview of thedistribution of these reported impacts aggregated by year
www.hydrol-earth-syst-sci.net/20/2779/2016/ Hydrol. Earth Syst. Sci., 20, 2779–2800, 2016
2782 V. Blauhut et al.: Estimating drought risk across Europe from reported drought impacts
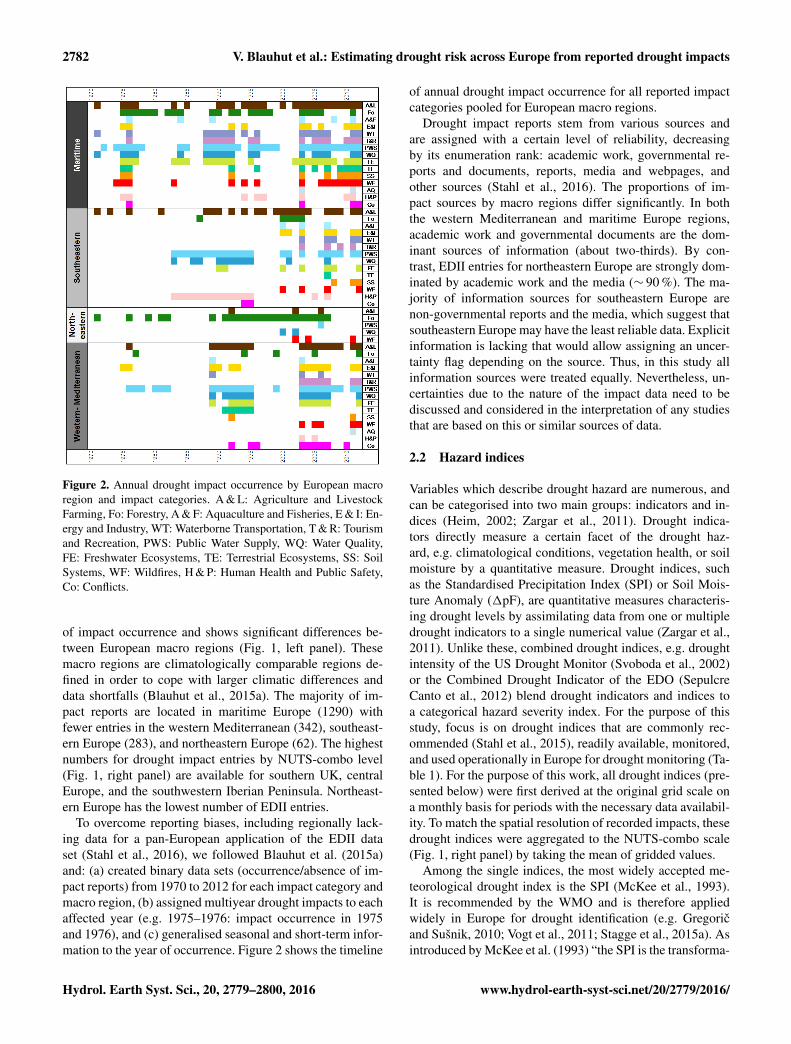
Figure 2. Annual drought impact occurrence by European macroregion and impact categories. A & L: Agriculture and LivestockFarming, Fo: Forestry, A & F: Aquaculture and Fisheries, E & I: En-ergy and Industry, WT: Waterborne Transportation, T & R: Tourismand Recreation, PWS: Public Water Supply, WQ: Water Quality,FE: Freshwater Ecosystems, TE: Terrestrial Ecosystems, SS: SoilSystems, WF: Wildfires, H & P: Human Health and Public Safety,Co: Conflicts.
of impact occurrence and shows significant differences be-tween European macro regions (Fig. 1, left panel). Thesemacro regions are climatologically comparable regions de-fined in order to cope with larger climatic differences anddata shortfalls (Blauhut et al., 2015a). The majority of im-pact reports are located in maritime Europe (1290) withfewer entries in the western Mediterranean (342), southeast-ern Europe (283), and northeastern Europe (62). The highestnumbers for drought impact entries by NUTS-combo level(Fig. 1, right panel) are available for southern UK, centralEurope, and the southwestern Iberian Peninsula. Northeast-ern Europe has the lowest number of EDII entries.
To overcome reporting biases, including regionally lack-ing data for a pan-European application of the EDII dataset (Stahl et al., 2016), we followed Blauhut et al. (2015a)and: (a) created binary data sets (occurrence/absence of im-pact reports) from 1970 to 2012 for each impact category andmacro region, (b) assigned multiyear drought impacts to eachaffected year (e.g. 1975–1976: impact occurrence in 1975and 1976), and (c) generalised seasonal and short-term infor-mation to the year of occurrence. Figure 2 shows the timeline
of annual drought impact occurrence for all reported impactcategories pooled for European macro regions.
Drought impact reports stem from various sources andare assigned with a certain level of reliability, decreasingby its enumeration rank: academic work, governmental re-ports and documents, reports, media and webpages, andother sources (Stahl et al., 2016). The proportions of im-pact sources by macro regions differ significantly. In boththe western Mediterranean and maritime Europe regions,academic work and governmental documents are the dom-inant sources of information (about two-thirds). By con-trast, EDII entries for northeastern Europe are strongly dom-inated by academic work and the media (∼ 90 %). The ma-jority of information sources for southeastern Europe arenon-governmental reports and the media, which suggest thatsoutheastern Europe may have the least reliable data. Explicitinformation is lacking that would allow assigning an uncer-tainty flag depending on the source. Thus, in this study allinformation sources were treated equally. Nevertheless, un-certainties due to the nature of the impact data need to bediscussed and considered in the interpretation of any studiesthat are based on this or similar sources of data.
2.2 Hazard indices
Variables which describe drought hazard are numerous, andcan be categorised into two main groups: indicators and in-dices (Heim, 2002; Zargar et al., 2011). Drought indica-tors directly measure a certain facet of the drought haz-ard, e.g. climatological conditions, vegetation health, or soilmoisture by a quantitative measure. Drought indices, suchas the Standardised Precipitation Index (SPI) or Soil Mois-ture Anomaly (1pF), are quantitative measures characteris-ing drought levels by assimilating data from one or multipledrought indicators to a single numerical value (Zargar et al.,2011). Unlike these, combined drought indices, e.g. droughtintensity of the US Drought Monitor (Svoboda et al., 2002)or the Combined Drought Indicator of the EDO (SepulcreCanto et al., 2012) blend drought indicators and indices toa categorical hazard severity index. For the purpose of thisstudy, focus is on drought indices that are commonly rec-ommended (Stahl et al., 2015), readily available, monitored,and used operationally in Europe for drought monitoring (Ta-ble 1). For the purpose of this work, all drought indices (pre-sented below) were first derived at the original grid scale ona monthly basis for periods with the necessary data availabil-ity. To match the spatial resolution of recorded impacts, thesedrought indices were aggregated to the NUTS-combo scale(Fig. 1, right panel) by taking the mean of gridded values.
Among the single indices, the most widely accepted me-teorological drought index is the SPI (McKee et al., 1993).It is recommended by the WMO and is therefore appliedwidely in Europe for drought identification (e.g. Gregoricand Sušnik, 2010; Vogt et al., 2011; Stagge et al., 2015a). Asintroduced by McKee et al. (1993) “the SPI is the transforma-
Hydrol. Earth Syst. Sci., 20, 2779–2800, 2016 www.hydrol-earth-syst-sci.net/20/2779/2016/
V. Blauhut et al.: Estimating drought risk across Europe from reported drought impacts 2783
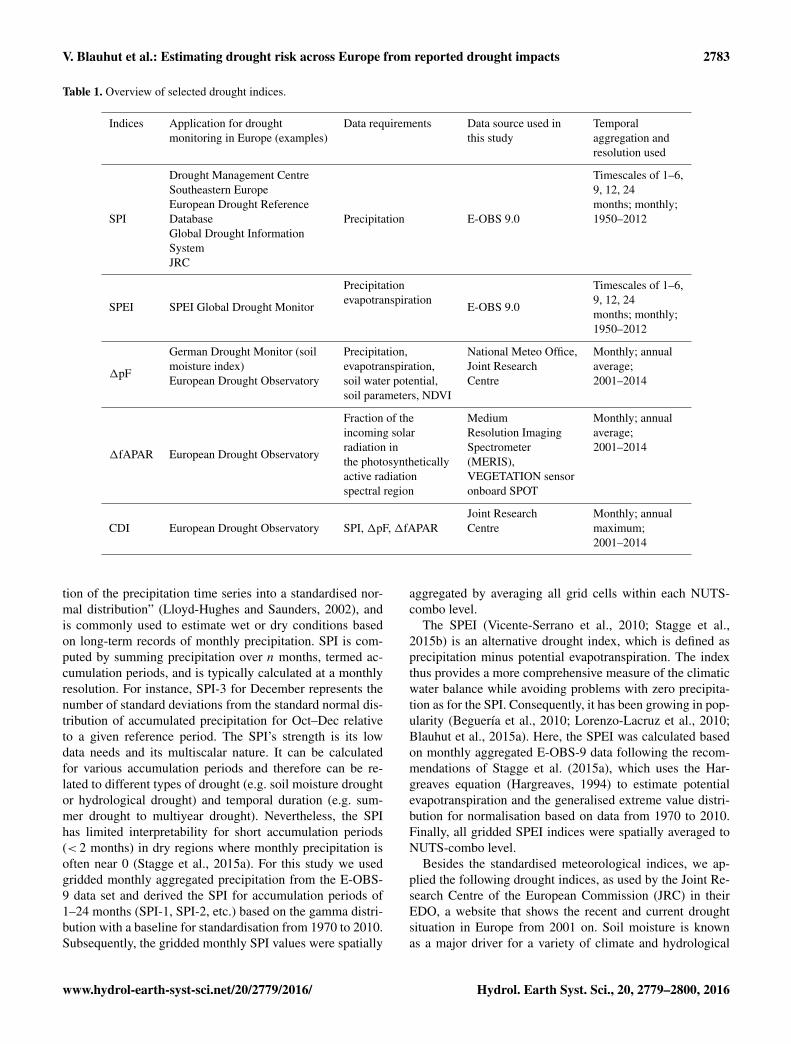
Table 1. Overview of selected drought indices.
Indices Application for drought Data requirements Data source used in Temporalmonitoring in Europe (examples) this study aggregation and
resolution used
SPI
Drought Management Centre
Precipitation E-OBS 9.0
Timescales of 1–6,Southeastern Europe 9, 12, 24European Drought Reference months; monthly;Database 1950–2012Global Drought InformationSystemJRC
SPEI SPEI Global Drought Monitor
Precipitation
E-OBS 9.0
Timescales of 1–6,evapotranspiration 9, 12, 24
months; monthly;1950–2012
1pF
German Drought Monitor (soil Precipitation, National Meteo Office, Monthly; annualmoisture index) evapotranspiration, Joint Research average;European Drought Observatory soil water potential, Centre 2001–2014
soil parameters, NDVI
1fAPAR European Drought Observatory
Fraction of the Medium Monthly; annualincoming solar Resolution Imaging average;radiation in Spectrometer 2001–2014the photosynthetically (MERIS),active radiation VEGETATION sensorspectral region onboard SPOT
CDI European Drought Observatory SPI, 1pF, 1fAPARJoint Research Monthly; annualCentre maximum;
2001–2014
tion of the precipitation time series into a standardised nor-mal distribution” (Lloyd-Hughes and Saunders, 2002), andis commonly used to estimate wet or dry conditions basedon long-term records of monthly precipitation. SPI is com-puted by summing precipitation over n months, termed ac-cumulation periods, and is typically calculated at a monthlyresolution. For instance, SPI-3 for December represents thenumber of standard deviations from the standard normal dis-tribution of accumulated precipitation for Oct–Dec relativeto a given reference period. The SPI’s strength is its lowdata needs and its multiscalar nature. It can be calculatedfor various accumulation periods and therefore can be re-lated to different types of drought (e.g. soil moisture droughtor hydrological drought) and temporal duration (e.g. sum-mer drought to multiyear drought). Nevertheless, the SPIhas limited interpretability for short accumulation periods(< 2 months) in dry regions where monthly precipitation isoften near 0 (Stagge et al., 2015a). For this study we usedgridded monthly aggregated precipitation from the E-OBS-9 data set and derived the SPI for accumulation periods of1–24 months (SPI-1, SPI-2, etc.) based on the gamma distri-bution with a baseline for standardisation from 1970 to 2010.Subsequently, the gridded monthly SPI values were spatially
aggregated by averaging all grid cells within each NUTS-combo level.
The SPEI (Vicente-Serrano et al., 2010; Stagge et al.,2015b) is an alternative drought index, which is defined asprecipitation minus potential evapotranspiration. The indexthus provides a more comprehensive measure of the climaticwater balance while avoiding problems with zero precipita-tion as for the SPI. Consequently, it has been growing in pop-ularity (Beguería et al., 2010; Lorenzo-Lacruz et al., 2010;Blauhut et al., 2015a). Here, the SPEI was calculated basedon monthly aggregated E-OBS-9 data following the recom-mendations of Stagge et al. (2015a), which uses the Har-greaves equation (Hargreaves, 1994) to estimate potentialevapotranspiration and the generalised extreme value distri-bution for normalisation based on data from 1970 to 2010.Finally, all gridded SPEI indices were spatially averaged toNUTS-combo level.
Besides the standardised meteorological indices, we ap-plied the following drought indices, as used by the Joint Re-search Centre of the European Commission (JRC) in theirEDO, a website that shows the recent and current droughtsituation in Europe from 2001 on. Soil moisture is knownas a major driver for a variety of climate and hydrological
www.hydrol-earth-syst-sci.net/20/2779/2016/ Hydrol. Earth Syst. Sci., 20, 2779–2800, 2016
2784 V. Blauhut et al.: Estimating drought risk across Europe from reported drought impacts
processes and is the key indicator of agricultural drought(Kulaglic et al., 2013; Hlavinka et al., 2009; Potop, 2011).The JRC’s EDO provides daily and 10-day assessments ofthe moisture content of the top soil layer (upper 30 cm).Soil moisture is obtained from the LISFLOOD distributedrainfall–runoff model with a grid-cell resolution of 5 kmacross Europe, using daily meteorological input from theJRC MARS meteorological database. Soil moisture is ex-pressed as soil suction (pF), providing a quantitative mea-sure of the force needed to extract water from the soil ma-trix. Soil moisture anomalies (1pF) are then calculated asthe standardised deviation from the long-term average for theperiod 1996–2014, and are used as input for the CDI. Thisstandardisation results in a quantification of the soil moisturedeficit which is normally distributed and thus comparable tothe SPI and other similar indices. For this study, the indexwas aggregated temporally to monthly values, and spatiallyto NUTS-combo level by averaging.
Direct measurement of stomatal activity (or photosyn-thetic activity, e.g. NDVI, VCI) (Chopra, 2006; Amoako etal., 2012) has been applied in many drought hazard analy-ses and has directly been used as a proxy for drought im-pacts (Skakun et al., 2014). The JRC derives the fraction ofabsorbed photosynthetically active radiation (fAPAR) fromsatellite measurements at approximately 1 km spatial reso-lution and for 10-day periods. The fAPAR is a quantitativemeasure of the fraction of solar energy that is absorbed byvegetation and a proxy for the status of the vegetation cover.Analogous to the SPI and soil moisture, fAPAR anomalies(1fAPAR) are calculated as the standardised deviation fromthe long-term mean (1975–2010). For this study, the indexwas averaged to monthly values and the NUTS-combo level.The fAPAR anomaly can be associated with plant productiv-ity and has therefore been recommended as an agriculturaldrought index by the UN Global Climate Observing Sys-tem (GCOS) and the FAO Global Terrestrial Observing Sys-tem (GTOS). However, fAPAR measures the photosyntheticactivity of the vegetation cover only, which can be due todrought but also related to factors such as pests and diseases.It is therefore important to analyse the index in conjunctionwith other indices in order to ensure the link to a droughtsituation.
The Combined Drought Indicator (CDI) (Sepulcre-Cantoet al., 2012) generated by the JRC represents a logical com-bination of several drought indices to detect the severity ofagricultural/ecosystem drought with a time step of 10 days.The method is a classification scheme that corresponds to dif-ferent stages of drought propagation from the initial precipi-tation deficit, over a soil moisture deficit, to a water stress forthe vegetation canopy. It is a logical combination of the SPIfor 1- and 3-month accumulation periods,1pF, and1fAPARwith adjusted time lags. It results in four increasingly severedrought states: Watch, Warning, Alert, and Alert2, as well astwo recovery states: Partial recovery and Full recovery. Forthe purpose of our analysis the levels of recovery were ne-
glected. For this study, monthly and annual maxima withineach NUTS-combo region were selected as further hazardindices available for the modelling.
2.3 Vulnerability factors
The most commonly used method to assess vulnerability todrought or other natural hazards is to employ a set of proxyfactors or composites of them. These factors aim at capturingdifferent issues that influence the level of vulnerability of asystem to a given hazard, herein referred to as vulnerabilityfactors. Vulnerability is often assessed through the combina-tion of factors in the following components of vulnerability:
– Exposure is the extent to which a unit of assessmentfalls within the geographical range of a hazard event(Birkmann et al., 2013).
– Sensitivity is the occupance and livelihood characteris-tics of the system (Smit and Wandel, 2006).
– Adaptive capacity is the particular asset bundles forrisk reduction (Pelling and Uitto, 2001; Gosling et al.,2009).
In Europe, the assessment of vulnerability to drought hasbeen undertaken mostly at national or local scales. With theexception of comprehensive efforts to characterise causes,components, and factors of drought vulnerability (Flörke etal., 2011; Lung et al., 2011), De Stefano et al. (2015) was thefirst to map a vulnerability index at a pan-European scale.This study builds on the experience gained in that effort,which was complemented by some additional data, as ex-plained below.
De Stefano et al. (2015) defined 16 vulnerability factorsgrouped into three thematic components: exposure (1), sen-sitivity (5), and adaptive capacity (10). The latter further sub-divided into four classes. The factors were assessed througha large set of parameters produced at the NUTS-2 resolu-tion for the 28 member states of the European Union plusNorway and Switzerland. To build the data set, De Stefanoet al. (2015) extracted data from international databases, in-cluding Aquastat, the Eurobarometer, European Commis-sion, the European Environment Agency, Eurostat, the WorldBank, FAO, as well as from the literature. In order to be ableto compare and combine data describing different factors,De Stefano et al. (2015) normalised the data from 0 to 1.Combined vulnerability factors and the vulnerability indexitself were generated on the basis of equal weights (more de-tails on the processes can be found in their report). For thisanalysis, we obtained the raw data as initially collected, theirnormalised values, as well as combined versions of vulnera-bility factors (Table 2).
For some vulnerability factors, this study completed theoriginal data set with data available for multiple time steps.Thus, the CORINE landcover data sets for 1990, 2000,and 2006 were added to the data set. These data stem
Hydrol. Earth Syst. Sci., 20, 2779–2800, 2016 www.hydrol-earth-syst-sci.net/20/2779/2016/
V. Blauhut et al.: Estimating drought risk across Europe from reported drought impacts 2785
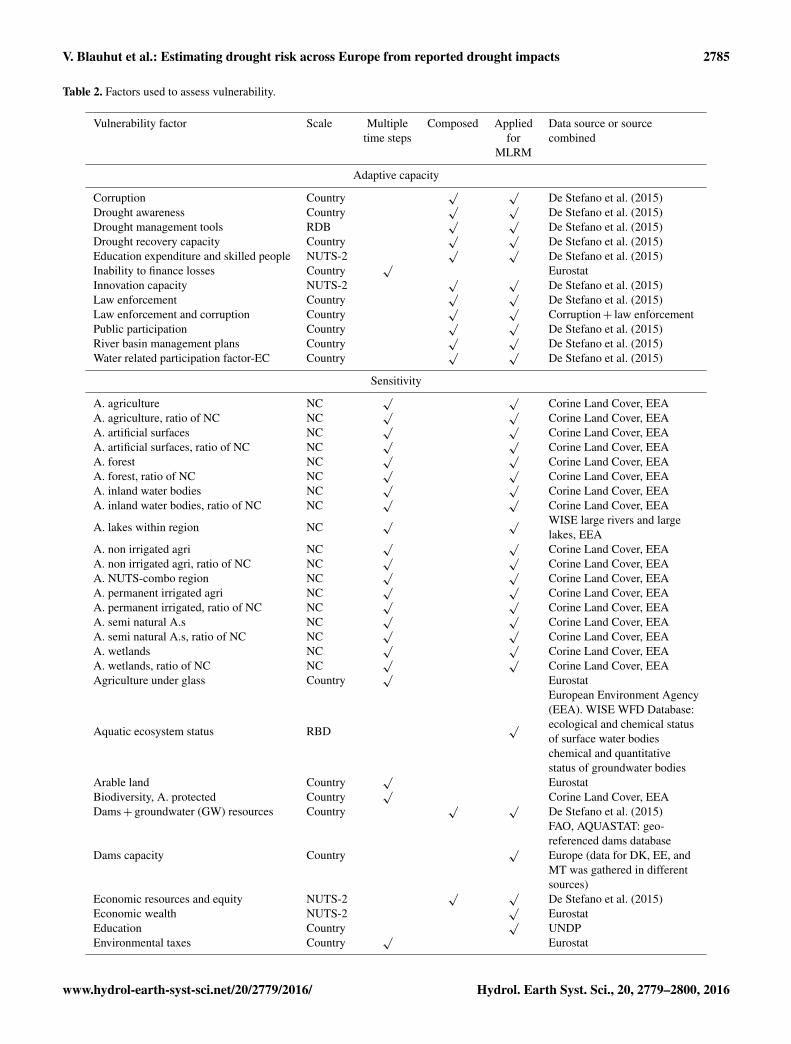
Table 2. Factors used to assess vulnerability.
Vulnerability factor Scale Multiple Composed Applied Data source or sourcetime steps for combined
MLRM
Adaptive capacity
Corruption Country√ √
De Stefano et al. (2015)Drought awareness Country
√ √De Stefano et al. (2015)
Drought management tools RDB√ √
De Stefano et al. (2015)Drought recovery capacity Country
√ √De Stefano et al. (2015)
Education expenditure and skilled people NUTS-2√ √
De Stefano et al. (2015)Inability to finance losses Country
√Eurostat
Innovation capacity NUTS-2√ √
De Stefano et al. (2015)Law enforcement Country
√ √De Stefano et al. (2015)
Law enforcement and corruption Country√ √
Corruption+ law enforcementPublic participation Country
√ √De Stefano et al. (2015)
River basin management plans Country√ √
De Stefano et al. (2015)Water related participation factor-EC Country
√ √De Stefano et al. (2015)
Sensitivity
A. agriculture NC√ √
Corine Land Cover, EEAA. agriculture, ratio of NC NC
√ √Corine Land Cover, EEA
A. artificial surfaces NC√ √
Corine Land Cover, EEAA. artificial surfaces, ratio of NC NC
√ √Corine Land Cover, EEA
A. forest NC√ √
Corine Land Cover, EEAA. forest, ratio of NC NC
√ √Corine Land Cover, EEA
A. inland water bodies NC√ √
Corine Land Cover, EEAA. inland water bodies, ratio of NC NC
√ √Corine Land Cover, EEA
A. lakes within region NC√ √ WISE large rivers and large
lakes, EEAA. non irrigated agri NC
√ √Corine Land Cover, EEA
A. non irrigated agri, ratio of NC NC√ √
Corine Land Cover, EEAA. NUTS-combo region NC
√ √Corine Land Cover, EEA
A. permanent irrigated agri NC√ √
Corine Land Cover, EEAA. permanent irrigated, ratio of NC NC
√ √Corine Land Cover, EEA
A. semi natural A.s NC√ √
Corine Land Cover, EEAA. semi natural A.s, ratio of NC NC
√ √Corine Land Cover, EEA
A. wetlands NC√ √
Corine Land Cover, EEAA. wetlands, ratio of NC NC
√ √Corine Land Cover, EEA
Agriculture under glass Country√
Eurostat
Aquatic ecosystem status RBD√
European Environment Agency(EEA). WISE WFD Database:ecological and chemical statusof surface water bodieschemical and quantitativestatus of groundwater bodies
Arable land Country√
EurostatBiodiversity, A. protected Country
√Corine Land Cover, EEA
Dams+ groundwater (GW) resources Country√ √
De Stefano et al. (2015)
Dams capacity Country√
FAO, AQUASTAT: geo-referenced dams databaseEurope (data for DK, EE, andMT was gathered in differentsources)
Economic resources and equity NUTS-2√ √
De Stefano et al. (2015)Economic wealth NUTS-2
√Eurostat
Education Country√
UNDPEnvironmental taxes Country
√Eurostat
www.hydrol-earth-syst-sci.net/20/2779/2016/ Hydrol. Earth Syst. Sci., 20, 2779–2800, 2016
2786 V. Blauhut et al.: Estimating drought risk across Europe from reported drought impacts
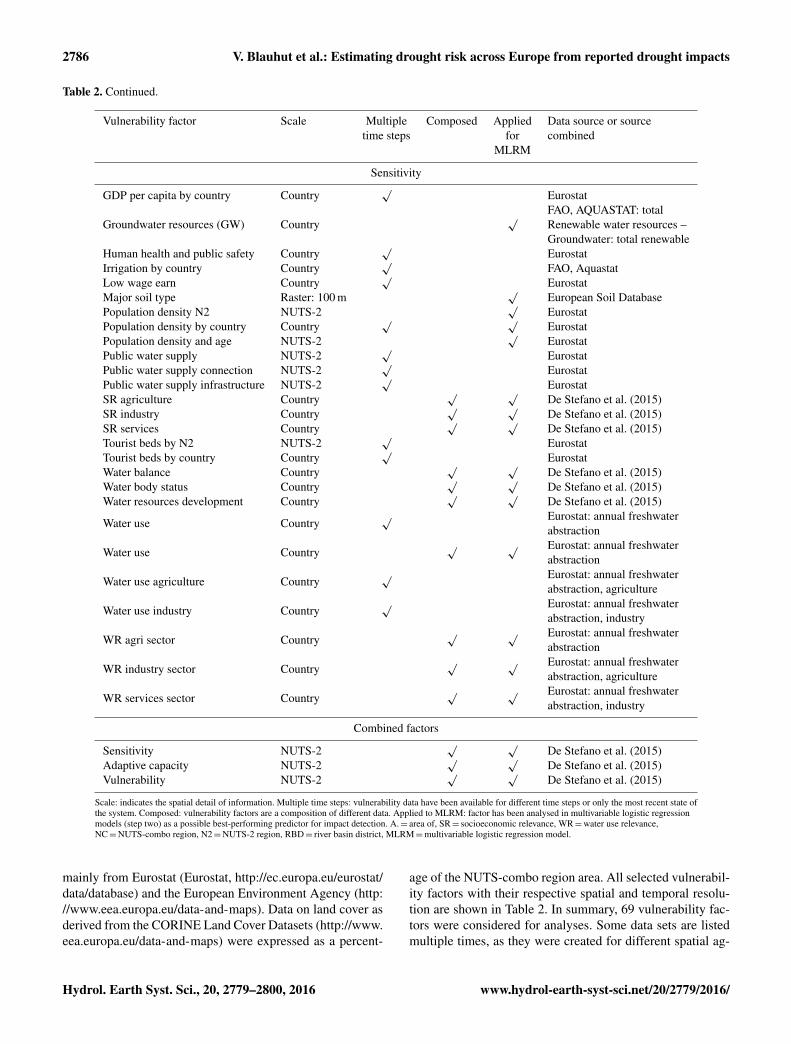
Table 2. Continued.
Vulnerability factor Scale Multiple Composed Applied Data source or sourcetime steps for combined
MLRM
Sensitivity
GDP per capita by country Country√
Eurostat
Groundwater resources (GW) Country√
FAO, AQUASTAT: totalRenewable water resources –Groundwater: total renewable
Human health and public safety Country√
EurostatIrrigation by country Country
√FAO, Aquastat
Low wage earn Country√
EurostatMajor soil type Raster: 100 m
√European Soil Database
Population density N2 NUTS-2√
EurostatPopulation density by country Country
√ √Eurostat
Population density and age NUTS-2√
EurostatPublic water supply NUTS-2
√Eurostat
Public water supply connection NUTS-2√
EurostatPublic water supply infrastructure NUTS-2
√Eurostat
SR agriculture Country√ √
De Stefano et al. (2015)SR industry Country
√ √De Stefano et al. (2015)
SR services Country√ √
De Stefano et al. (2015)Tourist beds by N2 NUTS-2
√Eurostat
Tourist beds by country Country√
EurostatWater balance Country
√ √De Stefano et al. (2015)
Water body status Country√ √
De Stefano et al. (2015)Water resources development Country
√ √De Stefano et al. (2015)
Water use Country√ Eurostat: annual freshwater
abstraction
Water use Country√ √ Eurostat: annual freshwater
abstraction
Water use agriculture Country√ Eurostat: annual freshwater
abstraction, agriculture
Water use industry Country√ Eurostat: annual freshwater
abstraction, industry
WR agri sector Country√ √ Eurostat: annual freshwater
abstraction
WR industry sector Country√ √ Eurostat: annual freshwater
abstraction, agriculture
WR services sector Country√ √ Eurostat: annual freshwater
abstraction, industry
Combined factors
Sensitivity NUTS-2√ √
De Stefano et al. (2015)Adaptive capacity NUTS-2
√ √De Stefano et al. (2015)
Vulnerability NUTS-2√ √
De Stefano et al. (2015)
Scale: indicates the spatial detail of information. Multiple time steps: vulnerability data have been available for different time steps or only the most recent state ofthe system. Composed: vulnerability factors are a composition of different data. Applied to MLRM: factor has been analysed in multivariable logistic regressionmodels (step two) as a possible best-performing predictor for impact detection. A.= area of, SR= socioeconomic relevance, WR=water use relevance,NC=NUTS-combo region, N2=NUTS-2 region, RBD= river basin district, MLRM=multivariable logistic regression model.
mainly from Eurostat (Eurostat, http://ec.europa.eu/eurostat/data/database) and the European Environment Agency (http://www.eea.europa.eu/data-and-maps). Data on land cover asderived from the CORINE Land Cover Datasets (http://www.eea.europa.eu/data-and-maps) were expressed as a percent-
age of the NUTS-combo region area. All selected vulnerabil-ity factors with their respective spatial and temporal resolu-tion are shown in Table 2. In summary, 69 vulnerability fac-tors were considered for analyses. Some data sets are listedmultiple times, as they were created for different spatial ag-
Hydrol. Earth Syst. Sci., 20, 2779–2800, 2016 www.hydrol-earth-syst-sci.net/20/2779/2016/
V. Blauhut et al.: Estimating drought risk across Europe from reported drought impacts 2787
gregations (e.g. “Population density” for NUTS-2 or countrylevel), for different time steps (e.g. “Water use” for singleor multiple time steps), or related to different spatial scales(e.g. “Area of agriculture” to “Area of agriculture” by NUTS-combo level). Furthermore, individual components of com-bined vulnerability factors are analysed (e.g. “Dams capac-ity” and “Groundwater resources” for “Dams+ groundwaterresources”).
For vulnerability data which did not have multiple timesteps available, the most recent information for the en-tire period of investigation was applied. Vulnerability datawith multiple time steps were assigned to the correspondingyear, and preceding years up to the next time step available(e.g. available time steps were 1976, 1990 and 2003; data for1970–1976, 1977–1990, and 1991–2012 were applied).
3 Methods
The overall approach followed a series of steps to find thebest logistic regression models. Hereby one model is deter-mined for each European macro region and impact category,using annual impact occurrence as a target variable and cor-responding hazard and vulnerability observations as predic-tors. This is achieved by employing a regionally pooled set oftarget and predictor variables that includes all NUTS-comboregions that lie within the macro region. NUTS regions thatdid not have any reported impact or information on a givenvulnerability factor were disregarded. Step 1 tested the pre-dictors SPEI and SPI for the temporal aggregations of 1, 2,3, 4, 5, 6, 9, 12, and 24 months and 69 vulnerability fac-tors as individual predictors in a univariate binary logisticregression. Step 2 employed a stepwise selection process toevaluate the best-performing combination of five possiblepredictors in a multivariable logistic regression model. Fi-nally, Step 3 applied the best multivariate models for selectedhazard-level scenarios to create pan-European drought riskmaps.
In Step 1, the ability of each single predictor (drought in-dices and vulnerability factors) to predict the occurrence ofdrought impacts on an annual basis was tested separately.Following Blauhut et al. (2015a), the likelihood of droughtimpact occurrence LIO is assessed using binary logistic re-gression models (BLMs) (Eq. 1).
log(
LIONUTS
1−LIONUTS
)= αMacro+βMacro ·PNUTS (1)
The logit transformation of LIO equals the sum of the modelparameter α and the product of the model parameter βMacrowith the selected predictor PNUTS of the NUTS-combo re-gion. All model parameters were estimated using standardregression techniques within the framework of generalisedlinear models (GLMs) (Harrel Jr., 2001; Venables and Rip-ley, 2002; Zuur et al., 2009). Hence, the LIO is a mea-sure of the probability of drought impact occurrence from 0
to 1, depending on the selected predictor. The predictivepower of each selected predictor was quantified by predictor-significance (p value for the parameter β) to estimate LIOand by the overall model performance. The latter is mea-sured using the area under the ROC (receiver operating char-acteristics) curve, AROC, which quantifies the skill of proba-bilistic models (Mason and Graham, 2002; Wilks, 2011) in arange from 0 to 1. Significant predictors (p values< 0.05)with AROC> 0.5 indicate that the resulting model will besuperior to random guessing, but are still considered poormodel performance (marked by a single star ∗). Significantpredictors with AROC> 0.7 are considered good model per-formance (∗∗), while significant predictors with AROC> 0.9are considered excellent model performance (∗∗∗).
In Step 2, the approach was expanded by stepwise modelbuilding to include multiple hazard indices and vulnerabilitypredictors (hybrid approach) into one statistical model. Thisanalysis follows Stagge et al. (2015b) and Blauhut and Stahlet al. (2015) and applies multivariable logistic regression toassess the LIO (Eq. 2).
log(
LIONUTS
1−LIONUTS
)= αMacro+
∑i
(βi,Macro ·HNUTS
)+
∑j
(βj,Macro ·VNUTS
)(2)
Again, the left-hand side is the logit transformation of LIO,while α and β are estimated using standard regression tech-niques within the framework of GLMs (Harrel Jr., 2001; Ven-ables and Ripley, 2002; Zuur et al., 2009). Multivariable lo-gistic regression models (MLRMs) are fitted for each impactcategory and macro region. For each macro region and im-pact category, the aim was to find the best combination ofone or two hazard indices (H ) and up to three vulnerabilityfactors (V ). Due to the short period of available data (2001–2014) of 1fAPAR, 1pF, and CDI, only SPEI data of differ-ent aggregation periods were used as hazard indices for thispart of analyses. The combined vulnerability factors “Sensi-tivity and adaptive capacity” were also neglected as they arepredetermined combinations of individual factors that mightalso enter the model as predictors, resulting in multicollinear-ity.
Emphasising the effect of climatic hazard indices ondrought impacts, the stepwise multivariate logistic regres-sion began with the detection of the best single hazard in-dex (from the univariate logistic regression model in Step 1).The best-performing hazard index was selected by predic-tor significance, measured by p values, and model perfor-mance measured by AROC. Then, a second hazard index wasselected following two criteria: it is not correlated (r2< 0.5)with the best-performing hazard index and it significantly im-proves the model. Again, the best-performing predictor wasassessed by predictor significance and overall model per-formance. Furthermore, overfitting by additional variableswas penalised by the Bayesian information criterion (BIC),
www.hydrol-earth-syst-sci.net/20/2779/2016/ Hydrol. Earth Syst. Sci., 20, 2779–2800, 2016
2788 V. Blauhut et al.: Estimating drought risk across Europe from reported drought impacts
with smaller numbers indicating better models. Accordingly,a second hazard index is only chosen for the final MLRMif AROC increases or remains constant and BIC decreases.A maximum of two hazard indices are allowed in the finalMLRM.
Furthermore then, up to three vulnerability factors are in-cluded into the model in a stepwise fashion based on thesame criteria. Proceeding as in the previous step, the best-performing vulnerability factors are only considered for thefinal MLRM if they improve the overall model, either in-creasing AROC or producing equal AROC, but a lower BIC.If AROC decreases or remains constant with a poor BIC, thefactor was not added to the final MLRM and further vulner-ability factors were not analysed. A maximum of three vul-nerability factors were included into the resultant MLRM.
In Step 3 of the study, the resultant MLRMs were appliedto construct drought risk maps that show the likelihood ofimpact occurrence for three selected hazard levels, based onthe standard deviation from normal −0.5, −1.5, and −2.5.The hazard predictors were all standardised indices repre-senting a certain hazard severity and likely frequency of oc-currence. The definition of drought severity for SPI, SPEI,1pF, and 1fAPAR is inspired by the definition of McKee etal. (1993) who assigned standard deviations from normal tohazard severity levels for SPI, with a threshold of 1 corre-sponding to a return period of 6.3 years, classified as mod-erate drought, and −2 as extreme drought conditions. Thefinal pan-European drought risk map presents the LIO by thebest-performing combination of predictors for 15 impact cat-egories and for 3 hazard levels. For countries with a lack ofsufficient vulnerability data (Table S1 in the Supplement),LIO was estimated using the best hazard-only model.
4 Results
4.1 Distribution of drought impacts and impactcharacteristics
As shown in Fig. 2, the majority of the reported droughtimpacts occurred during well-known major drought events:1975–1976 in central Europe, 1991–1995 in the Mediter-ranean, 2003 all over Europe (except the Mediterranean),and 2004–2007 in the western Mediterranean (Stagge etal., 2013; Stahl et al., 2016), as well as in more recentevents, e.g. the drought of 2010–2012 in the United King-dom (Kendon et al., 2013; Parry et al., 2013), the Eu-ropean drought of 2011 (DWD, 2011), and the 2011–2012 drought in southeastern Europe (Spinoni et al., 2015).The highest number of reports is represented by the droughtevents of “1975–1976 Europe”, “2003 Europe”, and “2010–2012 UK”.
Except for northeastern Europe, almost all impact cate-gories (except “Air Quality”) have at least one annual im-pact recorded per macro region (Blauhut et al., 2015a). An
increasing trend of impact reports with time is observed forall macro regions. Overall, maritime Europe has the high-est number of impacted years in total, which is consistentwith this region’s higher number of overall impact reports.Generally, the number of reported impacts cluster with well-known drought events, although impacts on “Forestry” showa delay and longer duration compared to the meteorologicalhazard. “Waterborne Transportation”, “Tourism and Recre-ation”, “Public Water Supply”, “Water Quality”, and “Fresh-water Ecosystems” show a similar temporal pattern of impactoccurrence. Impacts on “Agriculture and Livestock Farm-ing”, Public Water Supply, and Freshwater Ecosystems arereported for almost every year. For southeastern Europe,Agriculture and Livestock Farming has the most frequent im-pacts. Furthermore, Public Water Supply and “Human Healthand Public Safety” have a continuous presence of impactsfrom 1983 to 1996. From 2000 on, all impact categories havereported impacts. Northeastern Europe has only a few impactcategories with drought-impacted years, but Forestry shows along continuous time with impacts, from 1991 on. The west-ern Mediterranean region shows a less scattered pattern. Be-sides a low number of impacts from the middle of the 1970suntil the beginning of the 1980s for Agriculture and Live-stock Farming, Forestry, “Energy and Industry”, and PublicWater Supply impacts occurred during the two major long-term drought events of 1989–1995 and 2003–2008.
The observed increase in the occurrence of reported im-pacts from 2000 onwards may have several reasons; one ofthe most important being an increased reporting behaviour(governmental and news) due to an increased awareness ofnatural hazard impacts and the possibility of easy and fastcommunicated information (internet). Nevertheless, we can-not exclude the fact that Europe is warming and that thiswarming may lead to an increase in reported drought im-pacts.
4.2 Suitable predictor variables for hazard andvulnerability
First, the individual predictors in binary logistic regres-sion models, BLMs, were evaluated by impact category andmacro region. Data availability allowed the identification ofrobust BLMs for all impact categories only for the mar-itime Europe region. For southeastern Europe, the impactcategory “Terrestrial Ecosystems”, for northeastern EuropeWater Quality, and for the western Mediterranean Terres-trial Ecosystems, Air Quality, and Human Health and PublicSafety could not be modelled. All hazard indices performeddifferently across regions and impact categories. Tables S2to S4 show the model performance for the individual hazardindices and the vulnerability factors. These detailed resultsare only briefly summarised here as they only represent apreliminary screening step in the model-building process.
Among the indices used within the EDO, the index1fAPAR generally results in robust models during the grow-
Hydrol. Earth Syst. Sci., 20, 2779–2800, 2016 www.hydrol-earth-syst-sci.net/20/2779/2016/
V. Blauhut et al.: Estimating drought risk across Europe from reported drought impacts 2789
ing season, but the annual average 1fAPAR appears not tobe a suitable predictor. The 1pF performs as the overallbest predictor with mostly good models between March andNovember and the best overall performance of the annualaverage of 1pF. The CDI resulted in only few poor to goodmodels.
For the indices of SPEI, a longer period of hazard data wasavailable (1970–2012) than for the EDO indices and henceoverall better model fits were achieved. The best-performingindices (in terms of aggregation times) are more specific tothe impact category than to the macro region and tend to spanfrom 6- to 12-month aggregation times. SPEI-12 performswith good to excellent models for the majority of impactcategories and macro regions from August to September. Incomparison to the other impact categories, few robust modelswere identified for Forestry and Public Water Supply. In gen-eral, SPI follows the similar performance pattern as SPEI, butwith consistently lower model performance and is thereforenot shown in the tables. To estimate the influence of longertime series for model input, Table S5 shows model perfor-mance for SPEI applied for the shorter time period 2001–2012. Resultant model performance follows a similar but lessstrong performance pattern as the longer time series.
To identify patterns in the many vulnerability factor vari-ables tested, Table S4 groups the individual vulnerability fac-tors by the vulnerability components of adaptive capacityand sensitivity. In general, none of these obtained an excel-lent model performance. Factors related to “Sensitivity” thatcharacterise land use and are based on multiple time steps,such as “Area of Agriculture”, “Area of Forest”, “Area ofSemi-natural Areas”, and “Percentage of Area of Agricul-ture” proved to be significant in many cases. In addition, ro-bust model predictors for all macro regions include “Damsand Groundwater Resources” and “Water related Participa-tion EC” for Agriculture and Livestock Farming or “Socialrelevance for services sector” for Energy and Industry. Forthe remaining vulnerability factors, no clear patterns weredetectable. Only few robust models could be identified. Pre-dictive skill for vulnerability factors such as “GDP by coun-try”, “Public Water Supply connection by NUTS-2” or “Bio-diversity, Areas protected” was not found. The combined vul-nerability factors resulted in few macro region and impactcategory robust models. Impact occurrence for the categories“Aquacultures and Fisheries”, “Soil Systems”, “Wildfires”and Air Quality were generally difficult to model by vulner-ability factors.
In summary, the drought hazard indices SPEI and SPIalone were better suited than the rather static vulnerabilityfactors alone to estimate the likelihood of annual droughtimpact occurrence, and will therefore be treated as more im-portant for the identification of the best-performing MLRMs(Step 2, ref. Sect. 3).
4.3 Estimating the best-performing combinations ofhazard indices and vulnerability factors to assessthe likelihood of impact occurrence
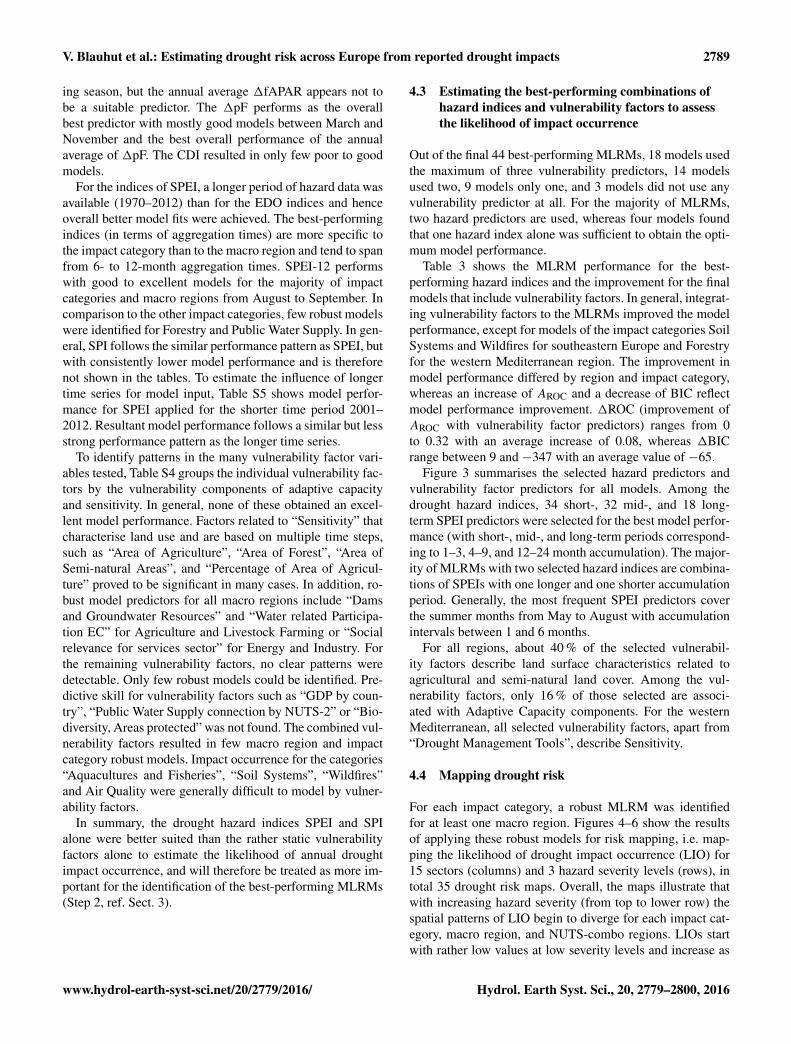
Out of the final 44 best-performing MLRMs, 18 models usedthe maximum of three vulnerability predictors, 14 modelsused two, 9 models only one, and 3 models did not use anyvulnerability predictor at all. For the majority of MLRMs,two hazard predictors are used, whereas four models foundthat one hazard index alone was sufficient to obtain the opti-mum model performance.
Table 3 shows the MLRM performance for the best-performing hazard indices and the improvement for the finalmodels that include vulnerability factors. In general, integrat-ing vulnerability factors to the MLRMs improved the modelperformance, except for models of the impact categories SoilSystems and Wildfires for southeastern Europe and Forestryfor the western Mediterranean region. The improvement inmodel performance differed by region and impact category,whereas an increase of AROC and a decrease of BIC reflectmodel performance improvement. 1ROC (improvement ofAROC with vulnerability factor predictors) ranges from 0to 0.32 with an average increase of 0.08, whereas 1BICrange between 9 and −347 with an average value of −65.
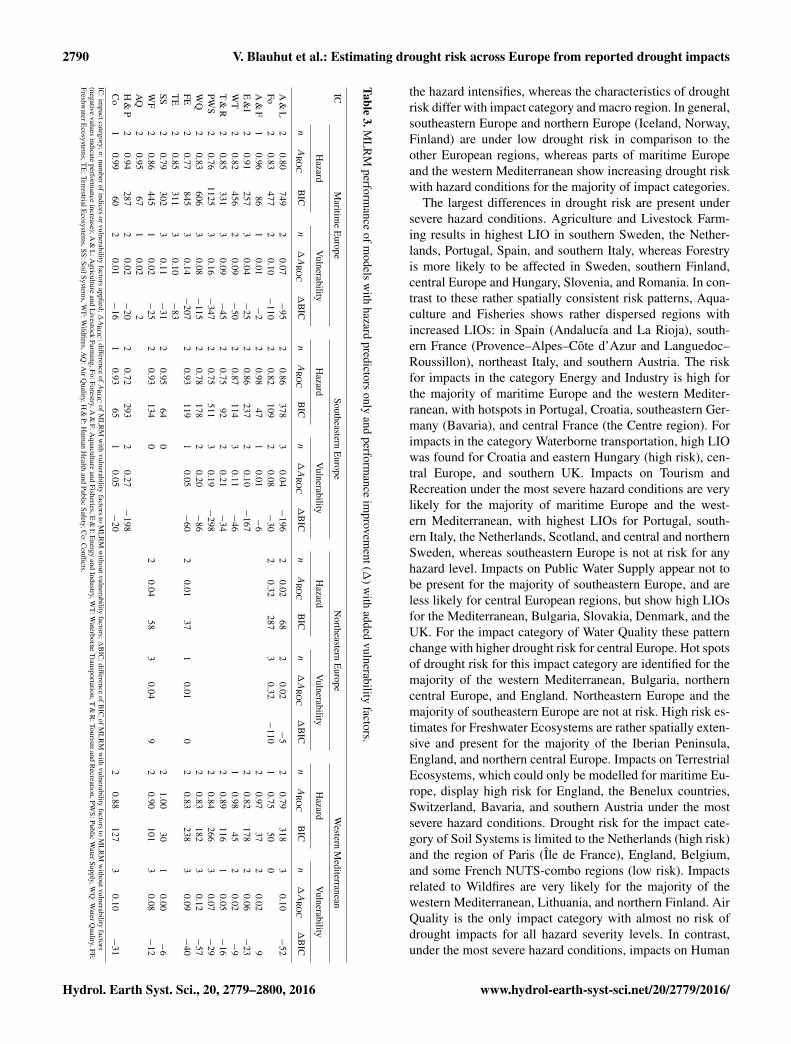
Figure 3 summarises the selected hazard predictors andvulnerability factor predictors for all models. Among thedrought hazard indices, 34 short-, 32 mid-, and 18 long-term SPEI predictors were selected for the best model perfor-mance (with short-, mid-, and long-term periods correspond-ing to 1–3, 4–9, and 12–24 month accumulation). The major-ity of MLRMs with two selected hazard indices are combina-tions of SPEIs with one longer and one shorter accumulationperiod. Generally, the most frequent SPEI predictors coverthe summer months from May to August with accumulationintervals between 1 and 6 months.
For all regions, about 40 % of the selected vulnerabil-ity factors describe land surface characteristics related toagricultural and semi-natural land cover. Among the vul-nerability factors, only 16 % of those selected are associ-ated with Adaptive Capacity components. For the westernMediterranean, all selected vulnerability factors, apart from“Drought Management Tools”, describe Sensitivity.
4.4 Mapping drought risk
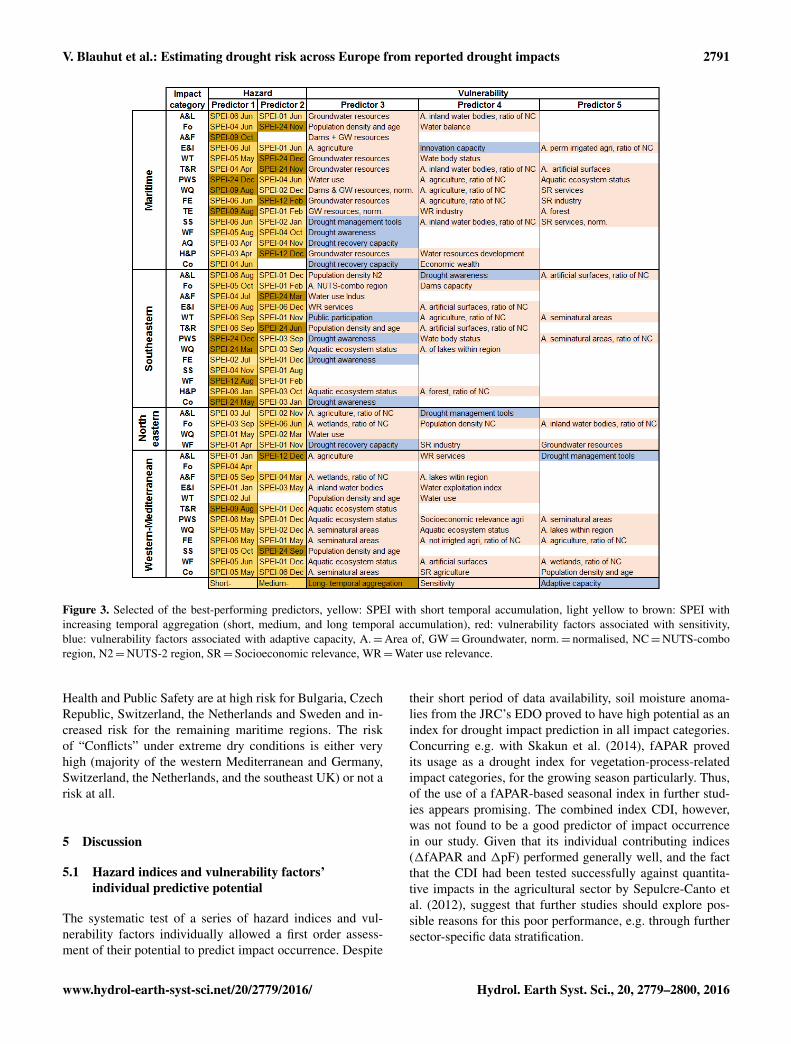
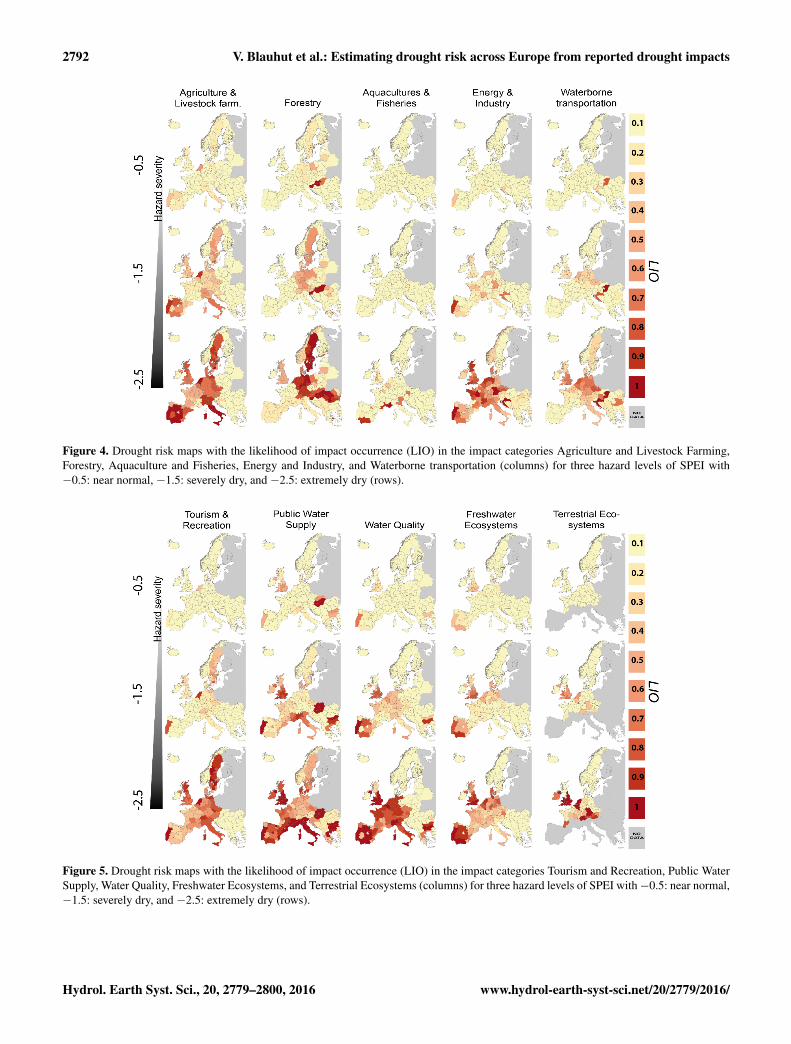
For each impact category, a robust MLRM was identifiedfor at least one macro region. Figures 4–6 show the resultsof applying these robust models for risk mapping, i.e. map-ping the likelihood of drought impact occurrence (LIO) for15 sectors (columns) and 3 hazard severity levels (rows), intotal 35 drought risk maps. Overall, the maps illustrate thatwith increasing hazard severity (from top to lower row) thespatial patterns of LIO begin to diverge for each impact cat-egory, macro region, and NUTS-combo regions. LIOs startwith rather low values at low severity levels and increase as
www.hydrol-earth-syst-sci.net/20/2779/2016/ Hydrol. Earth Syst. Sci., 20, 2779–2800, 2016
2790 V. Blauhut et al.: Estimating drought risk across Europe from reported drought impacts
Table3.M
LR
Mperform
anceofm
odelsw
ithhazard
predictorsonly
andperform
anceim
provement(1
)with
addedvulnerability
factors.
ICM
aritime
Europe
SoutheasternE
uropeN
ortheasternE
uropeW
esternM
editerranean
Hazard
Vulnerability
Hazard
Vulnerability
Hazard
Vulnerability
Hazard
Vulnerability
nA
RO
CB
ICn
1A
RO
C1
BIC
nA
RO
CB
ICn
1A
RO
C1
BIC
nA
RO
CB
ICn
1A
RO
C1
BIC
nA
RO
CB
ICn
1A
RO
C1
BIC
A&
L2
0.80749
20.07
−95
20.86
3783
0.04−
1962
0.0268
20.02
−5
20.79
3183
0.10−
52Fo
20.83
4772
0.10−
1102
0.82109
20.08
−30
20.32
2873
0.32−
1101
0.7550
0A
&F
10.96
861
0.01−
22
0.9847
10.01
−6
20.97
372
0.029
E&
I2
0.91257
30.04
−25
20.86
2372
0.10−
1672
0.82178
20.06
−23
WT
20.82
4562
0.09−
502
0.87114
30.11
−46
10.98
452
0.02−
9T
&R
20.85
3313
0.09−
452
0.7592
20.21
−34
20.89
1161
0.05−
16PW
S2
0.761125
30.16
−347
20.75
5113
0.19−
2982
0.84266
30.07
−29
WQ
20.83
6063
0.08−
1152
0.78178
20.20
−86
20.83
1823
0.12−
57FE
20.77
8453
0.14−
2072
0.93119
10.05
−60
20.01
371
0.010
20.83
2383
0.09−
40T
E2
0.85311
30.10
−83
SS2
0.79302
30.11
−31
20.95
640
21.00
301
0.00−
6W
F2
0.86445
10.02
−25
20.93
1340
20.04
583
0.049
20.90
1013
0.08−
12A
Q2
0.9567
10.02
2H
&P
20.94
2872
0.02−
202
0.72293
20.27
−198
Co
10.99
602
0.01−
161
0.9365
10.05
−20
20.88
1273
0.10−
31IC
:impactcategory;
n:numberofindices
orvulnerabilityfactors
applied;1A
RO
C:difference
ofA
RO
CofM
LR
Mw
ithvulnerability
factorsto
ML
RM
withoutvulnerability
factors;1
BIC
:differenceofB
ICofM
LR
Mw
ithvulnerability
factorsto
ML
RM
withoutvulnerability
factors(negative
valuesindicate
performance
increase);A&
L:A
gricultureand
Livestock
Farming,Fo:Forestry,A
&F:A
quacultureand
Fisheries,E&
I:Energy
andIndustry,W
T:Waterborne
Transportation,T&
R:Tourism
andR
ecreation,PWS:Public
WaterSupply,W
Q:W
aterQuality,FE
:Freshw
aterEcosystem
s,TE
:TerrestrialEcosystem
s,SS:SoilSystems,W
F:Wildfires,A
Q:A
irQuality,H
&P:H
uman
Health
andPublic
Safety,Co:C
onflicts.
the hazard intensifies, whereas the characteristics of droughtrisk differ with impact category and macro region. In general,southeastern Europe and northern Europe (Iceland, Norway,Finland) are under low drought risk in comparison to theother European regions, whereas parts of maritime Europeand the western Mediterranean show increasing drought riskwith hazard conditions for the majority of impact categories.
The largest differences in drought risk are present undersevere hazard conditions. Agriculture and Livestock Farm-ing results in highest LIO in southern Sweden, the Nether-lands, Portugal, Spain, and southern Italy, whereas Forestryis more likely to be affected in Sweden, southern Finland,central Europe and Hungary, Slovenia, and Romania. In con-trast to these rather spatially consistent risk patterns, Aqua-culture and Fisheries shows rather dispersed regions withincreased LIOs: in Spain (Andalucía and La Rioja), south-ern France (Provence–Alpes–Côte d’Azur and Languedoc–Roussillon), northeast Italy, and southern Austria. The riskfor impacts in the category Energy and Industry is high forthe majority of maritime Europe and the western Mediter-ranean, with hotspots in Portugal, Croatia, southeastern Ger-many (Bavaria), and central France (the Centre region). Forimpacts in the category Waterborne transportation, high LIOwas found for Croatia and eastern Hungary (high risk), cen-tral Europe, and southern UK. Impacts on Tourism andRecreation under the most severe hazard conditions are verylikely for the majority of maritime Europe and the west-ern Mediterranean, with highest LIOs for Portugal, south-ern Italy, the Netherlands, Scotland, and central and northernSweden, whereas southeastern Europe is not at risk for anyhazard level. Impacts on Public Water Supply appear not tobe present for the majority of southeastern Europe, and areless likely for central European regions, but show high LIOsfor the Mediterranean, Bulgaria, Slovakia, Denmark, and theUK. For the impact category of Water Quality these patternchange with higher drought risk for central Europe. Hot spotsof drought risk for this impact category are identified for themajority of the western Mediterranean, Bulgaria, northerncentral Europe, and England. Northeastern Europe and themajority of southeastern Europe are not at risk. High risk es-timates for Freshwater Ecosystems are rather spatially exten-sive and present for the majority of the Iberian Peninsula,England, and northern central Europe. Impacts on TerrestrialEcosystems, which could only be modelled for maritime Eu-rope, display high risk for England, the Benelux countries,Switzerland, Bavaria, and southern Austria under the mostsevere hazard conditions. Drought risk for the impact cate-gory of Soil Systems is limited to the Netherlands (high risk)and the region of Paris (Île de France), England, Belgium,and some French NUTS-combo regions (low risk). Impactsrelated to Wildfires are very likely for the majority of thewestern Mediterranean, Lithuania, and northern Finland. AirQuality is the only impact category with almost no risk ofdrought impacts for all hazard severity levels. In contrast,under the most severe hazard conditions, impacts on Human
Hydrol. Earth Syst. Sci., 20, 2779–2800, 2016 www.hydrol-earth-syst-sci.net/20/2779/2016/
V. Blauhut et al.: Estimating drought risk across Europe from reported drought impacts 2791
Figure 3. Selected of the best-performing predictors, yellow: SPEI with short temporal accumulation, light yellow to brown: SPEI withincreasing temporal aggregation (short, medium, and long temporal accumulation), red: vulnerability factors associated with sensitivity,blue: vulnerability factors associated with adaptive capacity, A.=Area of, GW=Groundwater, norm.= normalised, NC=NUTS-comboregion, N2=NUTS-2 region, SR=Socioeconomic relevance, WR=Water use relevance.
Health and Public Safety are at high risk for Bulgaria, CzechRepublic, Switzerland, the Netherlands and Sweden and in-creased risk for the remaining maritime regions. The riskof “Conflicts” under extreme dry conditions is either veryhigh (majority of the western Mediterranean and Germany,Switzerland, the Netherlands, and the southeast UK) or not arisk at all.
5 Discussion
5.1 Hazard indices and vulnerability factors’individual predictive potential
The systematic test of a series of hazard indices and vul-nerability factors individually allowed a first order assess-ment of their potential to predict impact occurrence. Despite
their short period of data availability, soil moisture anoma-lies from the JRC’s EDO proved to have high potential as anindex for drought impact prediction in all impact categories.Concurring e.g. with Skakun et al. (2014), fAPAR provedits usage as a drought index for vegetation-process-relatedimpact categories, for the growing season particularly. Thus,of the use of a fAPAR-based seasonal index in further stud-ies appears promising. The combined index CDI, however,was not found to be a good predictor of impact occurrencein our study. Given that its individual contributing indices(1fAPAR and 1pF) performed generally well, and the factthat the CDI had been tested successfully against quantita-tive impacts in the agricultural sector by Sepulcre-Canto etal. (2012), suggest that further studies should explore pos-sible reasons for this poor performance, e.g. through furthersector-specific data stratification.
www.hydrol-earth-syst-sci.net/20/2779/2016/ Hydrol. Earth Syst. Sci., 20, 2779–2800, 2016
2792 V. Blauhut et al.: Estimating drought risk across Europe from reported drought impacts
Figure 4. Drought risk maps with the likelihood of impact occurrence (LIO) in the impact categories Agriculture and Livestock Farming,Forestry, Aquaculture and Fisheries, Energy and Industry, and Waterborne transportation (columns) for three hazard levels of SPEI with−0.5: near normal, −1.5: severely dry, and −2.5: extremely dry (rows).
Figure 5. Drought risk maps with the likelihood of impact occurrence (LIO) in the impact categories Tourism and Recreation, Public WaterSupply, Water Quality, Freshwater Ecosystems, and Terrestrial Ecosystems (columns) for three hazard levels of SPEI with−0.5: near normal,−1.5: severely dry, and −2.5: extremely dry (rows).
Hydrol. Earth Syst. Sci., 20, 2779–2800, 2016 www.hydrol-earth-syst-sci.net/20/2779/2016/
V. Blauhut et al.: Estimating drought risk across Europe from reported drought impacts 2793
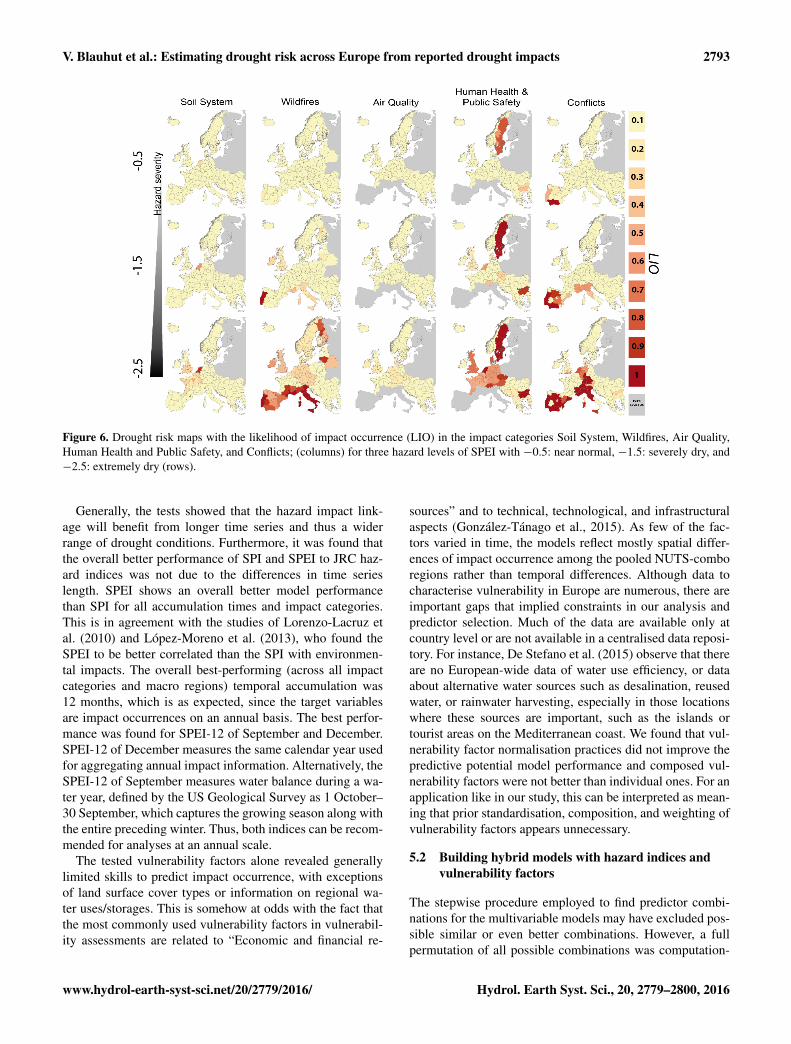
Figure 6. Drought risk maps with the likelihood of impact occurrence (LIO) in the impact categories Soil System, Wildfires, Air Quality,Human Health and Public Safety, and Conflicts; (columns) for three hazard levels of SPEI with −0.5: near normal, −1.5: severely dry, and−2.5: extremely dry (rows).
Generally, the tests showed that the hazard impact link-age will benefit from longer time series and thus a widerrange of drought conditions. Furthermore, it was found thatthe overall better performance of SPI and SPEI to JRC haz-ard indices was not due to the differences in time serieslength. SPEI shows an overall better model performancethan SPI for all accumulation times and impact categories.This is in agreement with the studies of Lorenzo-Lacruz etal. (2010) and López-Moreno et al. (2013), who found theSPEI to be better correlated than the SPI with environmen-tal impacts. The overall best-performing (across all impactcategories and macro regions) temporal accumulation was12 months, which is as expected, since the target variablesare impact occurrences on an annual basis. The best perfor-mance was found for SPEI-12 of September and December.SPEI-12 of December measures the same calendar year usedfor aggregating annual impact information. Alternatively, theSPEI-12 of September measures water balance during a wa-ter year, defined by the US Geological Survey as 1 October–30 September, which captures the growing season along withthe entire preceding winter. Thus, both indices can be recom-mended for analyses at an annual scale.
The tested vulnerability factors alone revealed generallylimited skills to predict impact occurrence, with exceptionsof land surface cover types or information on regional wa-ter uses/storages. This is somehow at odds with the fact thatthe most commonly used vulnerability factors in vulnerabil-ity assessments are related to “Economic and financial re-
sources” and to technical, technological, and infrastructuralaspects (González-Tánago et al., 2015). As few of the fac-tors varied in time, the models reflect mostly spatial differ-ences of impact occurrence among the pooled NUTS-comboregions rather than temporal differences. Although data tocharacterise vulnerability in Europe are numerous, there areimportant gaps that implied constraints in our analysis andpredictor selection. Much of the data are available only atcountry level or are not available in a centralised data reposi-tory. For instance, De Stefano et al. (2015) observe that thereare no European-wide data of water use efficiency, or dataabout alternative water sources such as desalination, reusedwater, or rainwater harvesting, especially in those locationswhere these sources are important, such as the islands ortourist areas on the Mediterranean coast. We found that vul-nerability factor normalisation practices did not improve thepredictive potential model performance and composed vul-nerability factors were not better than individual ones. For anapplication like in our study, this can be interpreted as mean-ing that prior standardisation, composition, and weighting ofvulnerability factors appears unnecessary.
5.2 Building hybrid models with hazard indices andvulnerability factors
The stepwise procedure employed to find predictor combi-nations for the multivariable models may have excluded pos-sible similar or even better combinations. However, a fullpermutation of all possible combinations was computation-
www.hydrol-earth-syst-sci.net/20/2779/2016/ Hydrol. Earth Syst. Sci., 20, 2779–2800, 2016
2794 V. Blauhut et al.: Estimating drought risk across Europe from reported drought impacts
ally too expensive for this study. Nevertheless, it was possi-ble to identify suitable models for most cases and the multi-variable selection process further elucidated joint importantcontrols on drought risk. The majority of SPEIs selected forfinal model application were combinations of SPEI with dif-ferent accumulation times, often short and long periods. Thestepwise procedure showed that hazard indices with tempo-ral accumulations from 3 to 12 months generally performedbest, depending on the region and impact. These results con-firmed previous case studies on the best combinations, e.g. byStagge et al. (2015b), and common practice using combineddrought monitoring indices, such as the US Drought Mon-itor (Svoboda et al., 2002). The majority of MLRMs alsoperformed better by adding at least one vulnerability fac-tor, suggesting that these can improve the predictability ofannual drought impact occurrence. The vulnerability factorsselected are dominated by factors associated with the vulner-ability component of Sensitivity. This could be explained bythe fact that adaptive capacity evolves much faster than sen-sitivity and the values of “Adaptive Capacity” factors usedin the models refer to present conditions while impacts spanover a 50-year time period. Thus, the poor performance ofAdaptive Capacity indicators as predictors of impact couldbe due to the mismatch between the adaptive capacity thatexisted when impact occurred in the past and the one usedin our models rather than their lack of relevance in absoluteterms.
The predictor selection was likely influenced by some ofthe particular biases and characteristics of the underlyingdatabases. The EDII’s impact categories broadly pool im-pact types of similar topics. Reported impact types withina category can be very different and reported impact typescan differ between countries (Stahl et al., 2015). Using Agri-culture and Livestock Farming impacts as an example, thelarge range of SPEIs selected for the final models (with re-gard to temporal accumulation and month) can be due to sev-eral reasons. These may include differences in impacts inirrigated vs. rain-fed agriculture. Whereas impacts on rain-fed agriculture are often described best by meteorologicaldrought (short accumulation periods), irrigated agriculturestrongly depends on lagged hydrological drought (Pedro-Monzonís et al., 2015). Characteristics of location and cul-tivation may also play a role. Depending on the climaticand orographic conditions of a NUTS-combo region, impact-category-specific characteristics differ (e.g. growing season,dormancy, development). Hence, the most relevant SPEI foreach region may differ in accumulation time and month se-lected. This corresponds e.g. to Lei et al. (2011) and Po-topová et al. (2015) who detected different optimal accu-mulation times of SPEI for maize productivity for north-ern China and Czech Republic. A reason for the selectionof more unexpected combination of SPEI (e.g. SPEI-6 ofAugust was selected together with SPEI-1 in December forAgriculture and Livestock Farming in southeastern Europe)
might be due to the criterion of variable independence em-ployed.
For wildfires, Gudmundsson et al. (2014) suggested SPIwith lead times not longer than 2 months to indicate ma-jor effects of wildfires in southern Europe, contradicting thelonger accumulation times selected in this study. However,Gudmundsson et al. (2014) used the comprehensive Euro-pean Fire Database, whereas the EDII only contains wildfirereports that were directly attributed to drought. On the otherhand, our variable selections match the results of Catry etal. (2010) who estimated that the majority (51 %) of all wild-fires occur during the summer months.
Hydrological drought takes the longest time to respondto drought conditions. Accordingly, impact categories forwhich surface and groundwater availability is important andoften linked to water quality (e.g. higher water temperaturesdue to low flow) (Aquaculture and Freshwater Fisheries, En-ergy and Industry, Waterborne Transportation, Water Quality,Freshwater Ecosystems), are best predicted by longer accu-mulation times (≥SPEI-9). Impacts on Public Water Sup-ply are generally poorly predicted by SPEI. The best perfor-mances are obtained for long accumulation times (SPEI-24)indicating that impacts on water resources rely on the stor-age characteristics (natural or artificial) and thus depend on avariety of conditions that cannot be characterised by SPEI onthe larger scale. Other impact categories show weaker pat-terns, but in general show better results for predictions insummer.
This seasonal focus points to a related data challenge. Thetemporal resolution of reported impacts, which often only re-fer to an entire season, year, or multiyear drought, does notallow an identification of the onset, duration, and ending of agiven drought impact. The annual timescale employed here isa compromise between a sufficient high number of reportedimpacts and spatial coverage. Stagge et al. (2015b) showedthat seasonal models can be constrained better, but sufficientseasonal information on impacts was not available for all re-gions or countries across Europe. Furthermore, in order toovercome data availability issues, Europe was divided intofour European macro regions to pool impact information,some of which may not reflect regions with similar droughtimpacts and as such influence the model performance ob-tained (Blauhut et al., 2015a).
The selection of vulnerability factors for the final MLRMsin this study is also driven by the model fits and thus basedon empirical relation rather than on commonly applied epis-temic selection procedures (Gonzáles Tánago et al., 2015). Inseveral cases, MLRM performance differed only marginallybetween different factors included in the models. Due to thelimitation of only selecting the best-performing and model-performance-increasing vulnerability factors, further impor-tant factors that might have an influence on regional vulnera-bility may thus not have been included. Whereas there is con-siderable variability in the impact-category-specific or macroregional factors selected, some general trends can be noted.
Hydrol. Earth Syst. Sci., 20, 2779–2800, 2016 www.hydrol-earth-syst-sci.net/20/2779/2016/
V. Blauhut et al.: Estimating drought risk across Europe from reported drought impacts 2795
More than one-third of applied factors quantitatively charac-terise regional land use, and almost half of the selected fac-tors characterise the water resources. This is in accordancewith Gonzáles Tánago et al. (2015) who summarised thatdrought vulnerability analyses have often applied informa-tion on water resources and land use information. Neverthe-less, according to Gonzáles Tánago et al. (2015), the mostcommonly applied information in drought vulnerability as-sessment is related to economic and financial resources andtechnical infrastructure, but these priorities are not reflectedin our findings where e.g. “Economic Wealth”, “Public WaterSupply Connection” or “Drought Recovery Capacity” wereof minor importance or not selected at all in the model build-ing process. Nevertheless, the results call for a review of therelevance of vulnerability factors in wider ranges of droughtcases and for progress with regard to thematic content, datageneration, and transformation from qualitative to quantita-tive data and their rationalisation.
5.3 Regional patterns of modelled sectorial droughtrisk across Europe
Statistical models to predict drought impact occurrence re-main a relatively new approach that has proved successfulwithin targeted country-scale studies (e.g. Bachmair et al.,2015; Stagge et al., 2015b). As with any data-driven ap-proach, the presented risk modelling relies on the quality andavailability of its underlying data. Since its establishment,the EDII database has been constantly growing and now con-tains data across Europe, covering the majority of major pastdrought events (Stagge et al., 2013). The database used herewas also considerably larger than that used in the previouspan-European risk modelling study by Blauhut et al. (2015a).This increased database, as well as addition of vulnerabilityfactors, led to some differences in the resulting risk maps.Nevertheless, the updated EDII database still has certain bi-ases and characteristics (Stahl et al., 2016) that may affectthe results of the risk models and maps this study presents.One bias in the impact data is a decreasing data availabil-ity from west to east and poor data availability in northernEurope. Additionally, using binary information of annual im-pact occurrence is less sensitive to these reporting biases thane.g. the number of reports or impacts as discussed by Bach-mair et al. (2015). Overall, uncertainties of the risk modelsare likely higher in regions with lower report availability aswell as with lower availability of vulnerability data as in thisstudy for the macro region of southeastern Europe.
Agriculture and Livestock Farming is the best-covered im-pact report data category across Europe and thus an issueat pan-European scale (Kossida et al., 2012; Stahl et al.,2016). In accordance with reports of the European Commis-sion (EC, 2007, 2008), the derived risk maps for Agricultureand Livestock Farming show high drought risk for most ofthe western Mediterranean regions, covering water scarce re-gions as detected by Strosser et al. (2012). Moderate to high
drought risk for maritime Europe confirms pattern previouslyidentified by Blauhut et al. (2015a) based on hazard predic-tors only. A relatively low risk such as for most of France,may reflect the added vulnerability predictor, particular agri-cultural land use as well as drought management (e.g. com-pensation) tools. The relatively high risk for Sweden in theNordic countries may reflect that agriculture is a much largersector in Sweden than in the neighbouring countries (Eu-rostat database: “Agricultural production”, 2015). The rela-tively low drought risk for Agriculture and Livestock Farm-ing in southeastern Europe may result from the aforemen-tioned lack of data. Stahl et al. (2015) actually found the im-pact category in the region to be relatively important amongall impact categories. Regional pooling for this study mayalso have affected these results and should be further testedin future studies.
The pattern of drought risk for Energy and Industry iden-tified by Blauhut et al. (2015a) were confirmed by this study.Regions with a high dependency on water resources for en-ergy production, such as Slovenia or Bavaria, are at higherrisk of impacts in this category. As an example, Slove-nia’s total energy production is based on∼ 55 % hydropowersources and ∼ 45 % by thermal power plants (HEP, 2009)and Bavaria (and also France) has several nuclear power-plants. Quite contrarily, Norway is at low risk for severehazard conditions even though about 98 % of its energy pro-duction is by hydropower (Christensen et al., 2013). A rela-tive index should be able to pick up deviations from normalinducing impacts on hydropower production. Rather theremust be some other reasons (e.g. regional averaging of theindices, pooling of impact information to macro regions).Future work will require higher temporally and spatially re-solved impact information such as daily power productionto solve this issue. Nevertheless, drought indices quantifyingthe absolute state of water reservoirs or sources could im-prove predictions for this impact category.
The pattern of risk of impacts on Public Water Supplydiffers somewhat from the results of Blauhut et al. (2015a)who presented medium risk for extreme conditions (SPEI-12=−3) all over Europe. For regions with high water stress(Mediterranean) (EEA, 2009), impacts on Public Water Sup-ply are more likely, as well as in regions where water storagecapacity is limited (UK). Estimates for southeastern Europeare likely to be impaired due to data availability and regionalpooling.
Water Quality aggregates very different impact causeswithin one impact category, ranging from water quality dete-rioration (e.g. algal bloom) to salt water intrusion, bathingwater quality, and economic losses. Risk patterns showhigh LIOs for the majority of the maritime region (exclud-ing Scandinavia), the western Mediterranean, Bulgaria, andnorthern Greece. This is in accordance with drought risk asestimated by Blauhut et al. (2015a). In maritime Europe, rel-atively high risk areas reflect areas with poor ecological sta-tus of European waters and lakes for maritime Europe (EEA,
www.hydrol-earth-syst-sci.net/20/2779/2016/ Hydrol. Earth Syst. Sci., 20, 2779–2800, 2016
2796 V. Blauhut et al.: Estimating drought risk across Europe from reported drought impacts
2012), even though this was not a selected predictor in themodels (as for the other regions). In their study on driversof vulnerability, Blauhut et al. (2015b) raised an additionalpoint of uncertainty to consider for this category: an increaseof reported impacts due to an increased ecological monitor-ing and increased public and scientific recognition. The UKhas the densest surface water monitoring network in Europeand the longest history of ecological status care (Royal Geo-graphical Society (with IBG), 2012). Hence, a higher numberof reported impacts even under less severe drought is likely.A high risk for southern England, northern central Europe,and the Iberian Peninsula is also detected for the impact cat-egory of Freshwater Ecosystems. For maritime Europe, theregional pattern also resembles that of diffuse agriculturalemissions of nitrogen to freshwater (EEA, 2010), and for theMediterranean it resembles that of highly irrigated regions(EEA, 2014). These relations indicate a strong influence ofagriculture on Freshwater Ecosystems, which could be takeninto account in future impact-data-based risk assessments.
Analysing the risk of Wildfires at the pan-European scalehas particular challenges. According to the European For-est Fire Information System, over 95 % of forest fires arehuman-induced (San-Miguel and Camia, 2009; Ganteaumeet al., 2013). The EDII data only contain reports that have at-tributed fires to drought (Stahl et al., 2015). Hence, patternsof high risk as derived for the Mediterranean, the Baltics,and Finland do not fully agree e.g. with the findings of Gud-mundsson et al. (2014). However, a comparison to the forestfire hazard map by the ESPON, which is based on a com-bination of numbers of observed fires and biogeographic re-gions (EEA, 2012), and to the fire density map by Catry etal. (2010), shows high similarities for the western Mediter-ranean, maritime, and northeastern Europe with only a fewnational exceptions. For southeastern Europe, a high num-ber of fires has been reported, but this is not reflected in thedrought risk maps.
For the impact category of Waterborne Transportationa specifically high drought risk was modelled mainly forNUTS regions with rivers of high international importancefor transportation, such as the large rivers draining into theNorth and Baltic seas and the Danube (Eurostat, 2015).
Impacts on Tourism and Recreation can occur all over Eu-rope and throughout the year, whereas drought risk maps in-dicate comparably low risk for Spain, France, and southeast-ern Europe. However, this category incorporates a very widerange of impacts and for more informative characteristics, amore detailed analyses of impact types or subjects, e.g. lightoutdoor activities, freshwater, tourism, and winter sports asused by Amelung and Moreno (2009) may be required.
Conflicts caused by drought are reported over all of Europeand affect a wide range of interest groups such as farmers,fishers, golfers, or citizens. However, the risk for these re-source conflicts is elevated in southern Europe’s water scarceregions, regions with high proportion of irrigation in agricul-
ture, and regions with a high water exploitation index (EEA,2016).
The presented hazard severity levels are based on an ar-bitrary choice inspired by McKee et al. (1993) and cannotbe used as fixed threshold. In accordance with Blauhut etal. (2015a) and Stagge et al. (2015b), it should be highlightedthat drought risk is sensitive to impact category and location,and develops very differently with increasing hazard sever-ity (deviation from normal). Thus, common overall severitythresholds are not recommendable.
6 Conclusion
This study tested commonly used drought hazard indices andvulnerability factors for the empirical modelling of droughtrisk in terms of likelihood of impact occurrence and appliedthese models to map sector-specific drought risk across Eu-rope. Building on prior applications of the statistical mod-elling of drought impact occurrence (Blauhut et al., 2015a;Stagge et al., 2015b; Bachmair et al., 2015), an importantexpansion of this study was the inclusion of vulnerabilityfactors as predictors into the models in addition to onlythe hazard indices previously used. Furthermore, the use ofthe updated EDII database allowed a pan-European applica-tion to the risk modelling and assessment of a wider rangeof drought impact categories than previously possible. Aswith all empirical modelling, the application demonstratedthe benefits of the availability of high-quality data. Repre-sentative records on past drought impacts as well as a goodcoverage of vulnerability factors are crucial to obtain mean-ingful models. In regions where data are scarce, modellingmay be biased due to the limited information available. Haz-ard indices were confirmed to be impact-sector-sensitive andshould thus be selected carefully to enable the characterisa-tion of different drought causing impacts. Here the distinc-tion was mainly made through using different accumulationtimes of SPEI. However, hydrological drought indices basedon streamflow, groundwater, reservoir levels, etc. may alsoimprove the drought impact models.
Generally, the addition of vulnerability factors improvedthe performance of the empirical drought risk models andfor many impact categories, it added plausible spatial detailsto the drought risk. Since only vulnerability, and not hazard,can be reduced through active measures, a modelling exer-cise as presented here can shed light into possible opportu-nities for risk reduction. The collection of relevant data ata high resolution and at regular interval is key to advancethe refinement of the assessment and the use of such mapsfor drought management. Present impact categories pool awide range of impact types and further studies may want toevaluate the use of more specific impact types. Further, toovercome impact data scarcity, pooling of regions into largermacro regions based on an existing classification was neces-sary. A more specific classification could improve future ap-
Hydrol. Earth Syst. Sci., 20, 2779–2800, 2016 www.hydrol-earth-syst-sci.net/20/2779/2016/
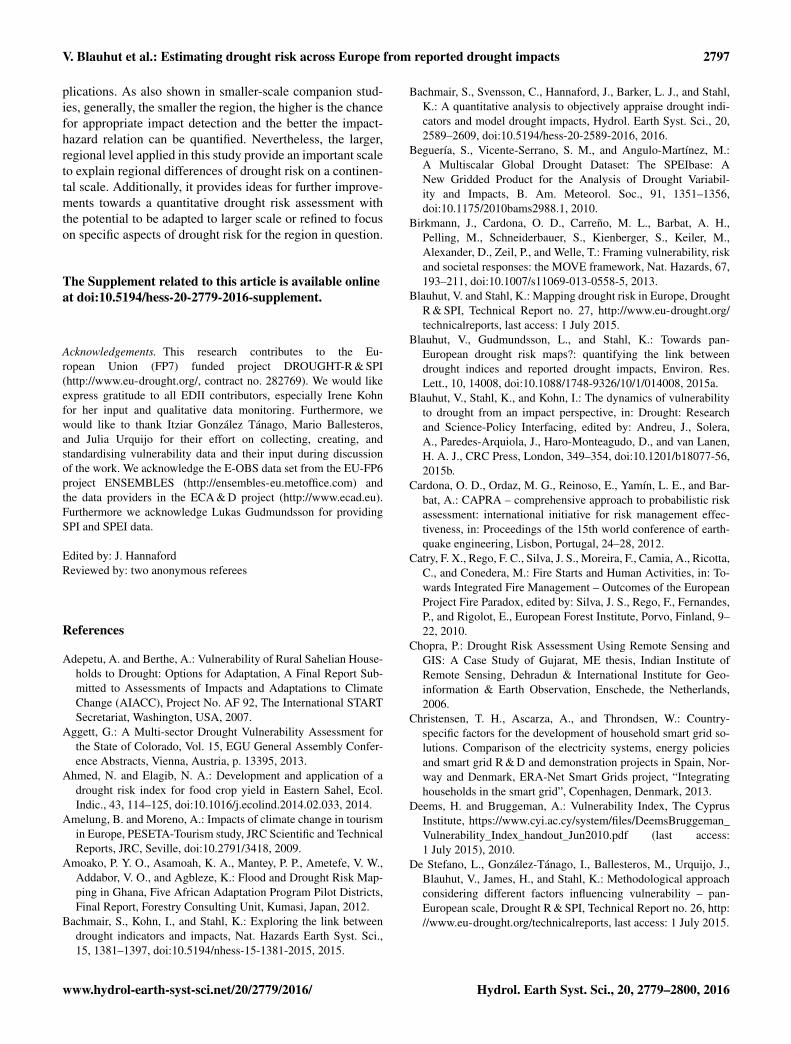
V. Blauhut et al.: Estimating drought risk across Europe from reported drought impacts 2797
plications. As also shown in smaller-scale companion stud-ies, generally, the smaller the region, the higher is the chancefor appropriate impact detection and the better the impact-hazard relation can be quantified. Nevertheless, the larger,regional level applied in this study provide an important scaleto explain regional differences of drought risk on a continen-tal scale. Additionally, it provides ideas for further improve-ments towards a quantitative drought risk assessment withthe potential to be adapted to larger scale or refined to focuson specific aspects of drought risk for the region in question.
The Supplement related to this article is available onlineat doi:10.5194/hess-20-2779-2016-supplement.
Acknowledgements. This research contributes to the Eu-ropean Union (FP7) funded project DROUGHT-R & SPI(http://www.eu-drought.org/, contract no. 282769). We would likeexpress gratitude to all EDII contributors, especially Irene Kohnfor her input and qualitative data monitoring. Furthermore, wewould like to thank Itziar González Tánago, Mario Ballesteros,and Julia Urquijo for their effort on collecting, creating, andstandardising vulnerability data and their input during discussionof the work. We acknowledge the E-OBS data set from the EU-FP6project ENSEMBLES (http://ensembles-eu.metoffice.com) andthe data providers in the ECA & D project (http://www.ecad.eu).Furthermore we acknowledge Lukas Gudmundsson for providingSPI and SPEI data.
Edited by: J. HannafordReviewed by: two anonymous referees
References
Adepetu, A. and Berthe, A.: Vulnerability of Rural Sahelian House-holds to Drought: Options for Adaptation, A Final Report Sub-mitted to Assessments of Impacts and Adaptations to ClimateChange (AIACC), Project No. AF 92, The International STARTSecretariat, Washington, USA, 2007.
Aggett, G.: A Multi-sector Drought Vulnerability Assessment forthe State of Colorado, Vol. 15, EGU General Assembly Confer-ence Abstracts, Vienna, Austria, p. 13395, 2013.
Ahmed, N. and Elagib, N. A.: Development and application of adrought risk index for food crop yield in Eastern Sahel, Ecol.Indic., 43, 114–125, doi:10.1016/j.ecolind.2014.02.033, 2014.
Amelung, B. and Moreno, A.: Impacts of climate change in tourismin Europe, PESETA-Tourism study, JRC Scientific and TechnicalReports, JRC, Seville, doi:10.2791/3418, 2009.
Amoako, P. Y. O., Asamoah, K. A., Mantey, P. P., Ametefe, V. W.,Addabor, V. O., and Agbleze, K.: Flood and Drought Risk Map-ping in Ghana, Five African Adaptation Program Pilot Districts,Final Report, Forestry Consulting Unit, Kumasi, Japan, 2012.
Bachmair, S., Kohn, I., and Stahl, K.: Exploring the link betweendrought indicators and impacts, Nat. Hazards Earth Syst. Sci.,15, 1381–1397, doi:10.5194/nhess-15-1381-2015, 2015.
Bachmair, S., Svensson, C., Hannaford, J., Barker, L. J., and Stahl,K.: A quantitative analysis to objectively appraise drought indi-cators and model drought impacts, Hydrol. Earth Syst. Sci., 20,2589–2609, doi:10.5194/hess-20-2589-2016, 2016.
Beguería, S., Vicente-Serrano, S. M., and Angulo-Martínez, M.:A Multiscalar Global Drought Dataset: The SPEIbase: ANew Gridded Product for the Analysis of Drought Variabil-ity and Impacts, B. Am. Meteorol. Soc., 91, 1351–1356,doi:10.1175/2010bams2988.1, 2010.
Birkmann, J., Cardona, O. D., Carreño, M. L., Barbat, A. H.,Pelling, M., Schneiderbauer, S., Kienberger, S., Keiler, M.,Alexander, D., Zeil, P., and Welle, T.: Framing vulnerability, riskand societal responses: the MOVE framework, Nat. Hazards, 67,193–211, doi:10.1007/s11069-013-0558-5, 2013.
Blauhut, V. and Stahl, K.: Mapping drought risk in Europe, DroughtR & SPI, Technical Report no. 27, http://www.eu-drought.org/technicalreports, last access: 1 July 2015.
Blauhut, V., Gudmundsson, L., and Stahl, K.: Towards pan-European drought risk maps?: quantifying the link betweendrought indices and reported drought impacts, Environ. Res.Lett., 10, 14008, doi:10.1088/1748-9326/10/1/014008, 2015a.
Blauhut, V., Stahl, K., and Kohn, I.: The dynamics of vulnerabilityto drought from an impact perspective, in: Drought: Researchand Science-Policy Interfacing, edited by: Andreu, J., Solera,A., Paredes-Arquiola, J., Haro-Monteagudo, D., and van Lanen,H. A. J., CRC Press, London, 349–354, doi:10.1201/b18077-56,2015b.
Cardona, O. D., Ordaz, M. G., Reinoso, E., Yamín, L. E., and Bar-bat, A.: CAPRA – comprehensive approach to probabilistic riskassessment: international initiative for risk management effec-tiveness, in: Proceedings of the 15th world conference of earth-quake engineering, Lisbon, Portugal, 24–28, 2012.
Catry, F. X., Rego, F. C., Silva, J. S., Moreira, F., Camia, A., Ricotta,C., and Conedera, M.: Fire Starts and Human Activities, in: To-wards Integrated Fire Management – Outcomes of the EuropeanProject Fire Paradox, edited by: Silva, J. S., Rego, F., Fernandes,P., and Rigolot, E., European Forest Institute, Porvo, Finland, 9–22, 2010.
Chopra, P.: Drought Risk Assessment Using Remote Sensing andGIS: A Case Study of Gujarat, ME thesis, Indian Institute ofRemote Sensing, Dehradun & International Institute for Geo-information & Earth Observation, Enschede, the Netherlands,2006.
Christensen, T. H., Ascarza, A., and Throndsen, W.: Country-specific factors for the development of household smart grid so-lutions. Comparison of the electricity systems, energy policiesand smart grid R & D and demonstration projects in Spain, Nor-way and Denmark, ERA-Net Smart Grids project, “Integratinghouseholds in the smart grid”, Copenhagen, Denmark, 2013.
Deems, H. and Bruggeman, A.: Vulnerability Index, The CyprusInstitute, https://www.cyi.ac.cy/system/files/DeemsBruggeman_Vulnerability_Index_handout_Jun2010.pdf (last access:1 July 2015), 2010.
De Stefano, L., González-Tánago, I., Ballesteros, M., Urquijo, J.,Blauhut, V., James, H., and Stahl, K.: Methodological approachconsidering different factors influencing vulnerability – pan-European scale, Drought R & SPI, Technical Report no. 26, http://www.eu-drought.org/technicalreports, last access: 1 July 2015.
www.hydrol-earth-syst-sci.net/20/2779/2016/ Hydrol. Earth Syst. Sci., 20, 2779–2800, 2016
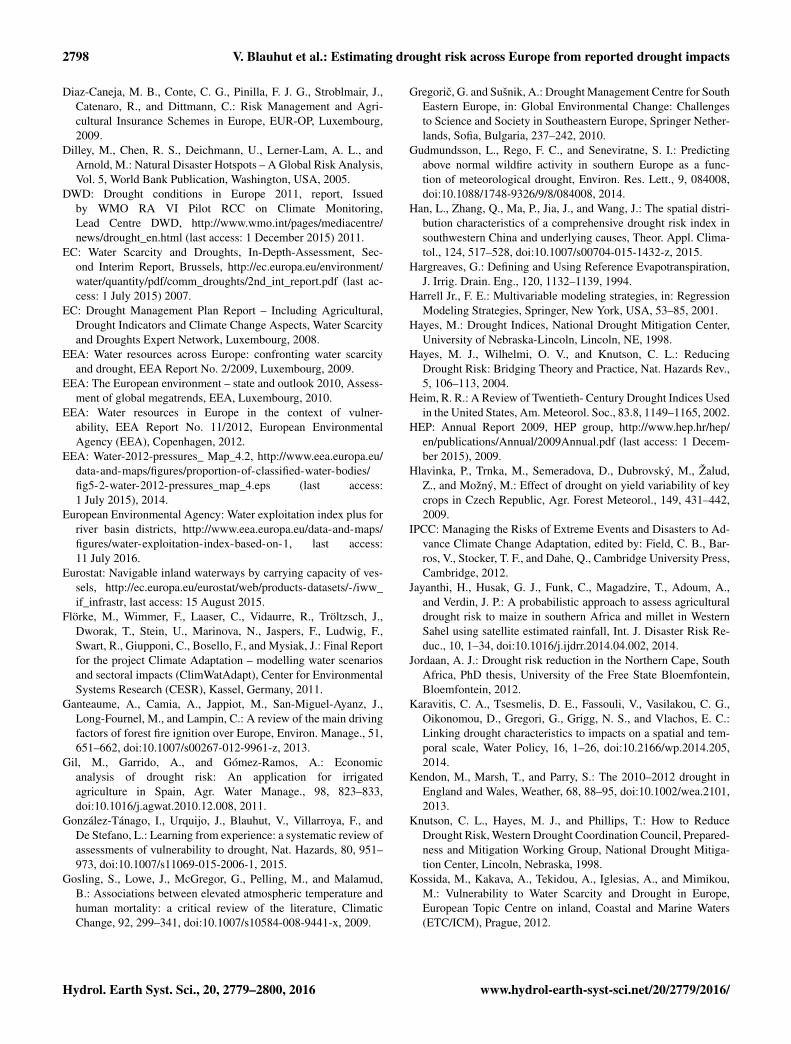
2798 V. Blauhut et al.: Estimating drought risk across Europe from reported drought impacts
Diaz-Caneja, M. B., Conte, C. G., Pinilla, F. J. G., Stroblmair, J.,Catenaro, R., and Dittmann, C.: Risk Management and Agri-cultural Insurance Schemes in Europe, EUR-OP, Luxembourg,2009.
Dilley, M., Chen, R. S., Deichmann, U., Lerner-Lam, A. L., andArnold, M.: Natural Disaster Hotspots – A Global Risk Analysis,Vol. 5, World Bank Publication, Washington, USA, 2005.
DWD: Drought conditions in Europe 2011, report, Issuedby WMO RA VI Pilot RCC on Climate Monitoring,Lead Centre DWD, http://www.wmo.int/pages/mediacentre/news/drought_en.html (last access: 1 December 2015) 2011.
EC: Water Scarcity and Droughts, In-Depth-Assessment, Sec-ond Interim Report, Brussels, http://ec.europa.eu/environment/water/quantity/pdf/comm_droughts/2nd_int_report.pdf (last ac-cess: 1 July 2015) 2007.
EC: Drought Management Plan Report – Including Agricultural,Drought Indicators and Climate Change Aspects, Water Scarcityand Droughts Expert Network, Luxembourg, 2008.
EEA: Water resources across Europe: confronting water scarcityand drought, EEA Report No. 2/2009, Luxembourg, 2009.
EEA: The European environment – state and outlook 2010, Assess-ment of global megatrends, EEA, Luxembourg, 2010.
EEA: Water resources in Europe in the context of vulner-ability, EEA Report No. 11/2012, European EnvironmentalAgency (EEA), Copenhagen, 2012.
EEA: Water-2012-pressures_ Map_4.2, http://www.eea.europa.eu/data-and-maps/figures/proportion-of-classified-water-bodies/fig5-2-water-2012-pressures_map_4.eps (last access:1 July 2015), 2014.
European Environmental Agency: Water exploitation index plus forriver basin districts, http://www.eea.europa.eu/data-and-maps/figures/water-exploitation-index-based-on-1, last access:11 July 2016.
Eurostat: Navigable inland waterways by carrying capacity of ves-sels, http://ec.europa.eu/eurostat/web/products-datasets/-/iww_if_infrastr, last access: 15 August 2015.
Flörke, M., Wimmer, F., Laaser, C., Vidaurre, R., Tröltzsch, J.,Dworak, T., Stein, U., Marinova, N., Jaspers, F., Ludwig, F.,Swart, R., Giupponi, C., Bosello, F., and Mysiak, J.: Final Reportfor the project Climate Adaptation – modelling water scenariosand sectoral impacts (ClimWatAdapt), Center for EnvironmentalSystems Research (CESR), Kassel, Germany, 2011.
Ganteaume, A., Camia, A., Jappiot, M., San-Miguel-Ayanz, J.,Long-Fournel, M., and Lampin, C.: A review of the main drivingfactors of forest fire ignition over Europe, Environ. Manage., 51,651–662, doi:10.1007/s00267-012-9961-z, 2013.
Gil, M., Garrido, A., and Gómez-Ramos, A.: Economicanalysis of drought risk: An application for irrigatedagriculture in Spain, Agr. Water Manage., 98, 823–833,doi:10.1016/j.agwat.2010.12.008, 2011.
González-Tánago, I., Urquijo, J., Blauhut, V., Villarroya, F., andDe Stefano, L.: Learning from experience: a systematic review ofassessments of vulnerability to drought, Nat. Hazards, 80, 951–973, doi:10.1007/s11069-015-2006-1, 2015.
Gosling, S., Lowe, J., McGregor, G., Pelling, M., and Malamud,B.: Associations between elevated atmospheric temperature andhuman mortality: a critical review of the literature, ClimaticChange, 92, 299–341, doi:10.1007/s10584-008-9441-x, 2009.
Gregoric, G. and Sušnik, A.: Drought Management Centre for SouthEastern Europe, in: Global Environmental Change: Challengesto Science and Society in Southeastern Europe, Springer Nether-lands, Sofia, Bulgaria, 237–242, 2010.
Gudmundsson, L., Rego, F. C., and Seneviratne, S. I.: Predictingabove normal wildfire activity in southern Europe as a func-tion of meteorological drought, Environ. Res. Lett., 9, 084008,doi:10.1088/1748-9326/9/8/084008, 2014.
Han, L., Zhang, Q., Ma, P., Jia, J., and Wang, J.: The spatial distri-bution characteristics of a comprehensive drought risk index insouthwestern China and underlying causes, Theor. Appl. Clima-tol., 124, 517–528, doi:10.1007/s00704-015-1432-z, 2015.
Hargreaves, G.: Defining and Using Reference Evapotranspiration,J. Irrig. Drain. Eng., 120, 1132–1139, 1994.
Harrell Jr., F. E.: Multivariable modeling strategies, in: RegressionModeling Strategies, Springer, New York, USA, 53–85, 2001.
Hayes, M.: Drought Indices, National Drought Mitigation Center,University of Nebraska-Lincoln, Lincoln, NE, 1998.
Hayes, M. J., Wilhelmi, O. V., and Knutson, C. L.: ReducingDrought Risk: Bridging Theory and Practice, Nat. Hazards Rev.,5, 106–113, 2004.
Heim, R. R.: A Review of Twentieth- Century Drought Indices Usedin the United States, Am. Meteorol. Soc., 83.8, 1149–1165, 2002.
HEP: Annual Report 2009, HEP group, http://www.hep.hr/hep/en/publications/Annual/2009Annual.pdf (last access: 1 Decem-ber 2015), 2009.
Hlavinka, P., Trnka, M., Semeradova, D., Dubrovský, M., Žalud,Z., and Možný, M.: Effect of drought on yield variability of keycrops in Czech Republic, Agr. Forest Meteorol., 149, 431–442,2009.
IPCC: Managing the Risks of Extreme Events and Disasters to Ad-vance Climate Change Adaptation, edited by: Field, C. B., Bar-ros, V., Stocker, T. F., and Dahe, Q., Cambridge University Press,Cambridge, 2012.
Jayanthi, H., Husak, G. J., Funk, C., Magadzire, T., Adoum, A.,and Verdin, J. P.: A probabilistic approach to assess agriculturaldrought risk to maize in southern Africa and millet in WesternSahel using satellite estimated rainfall, Int. J. Disaster Risk Re-duc., 10, 1–34, doi:10.1016/j.ijdrr.2014.04.002, 2014.
Jordaan, A. J.: Drought risk reduction in the Northern Cape, SouthAfrica, PhD thesis, University of the Free State Bloemfontein,Bloemfontein, 2012.
Karavitis, C. A., Tsesmelis, D. E., Fassouli, V., Vasilakou, C. G.,Oikonomou, D., Gregori, G., Grigg, N. S., and Vlachos, E. C.:Linking drought characteristics to impacts on a spatial and tem-poral scale, Water Policy, 16, 1–26, doi:10.2166/wp.2014.205,2014.
Kendon, M., Marsh, T., and Parry, S.: The 2010–2012 drought inEngland and Wales, Weather, 68, 88–95, doi:10.1002/wea.2101,2013.
Knutson, C. L., Hayes, M. J., and Phillips, T.: How to ReduceDrought Risk, Western Drought Coordination Council, Prepared-ness and Mitigation Working Group, National Drought Mitiga-tion Center, Lincoln, Nebraska, 1998.
Kossida, M., Kakava, A., Tekidou, A., Iglesias, A., and Mimikou,M.: Vulnerability to Water Scarcity and Drought in Europe,European Topic Centre on inland, Coastal and Marine Waters(ETC/ICM), Prague, 2012.
Hydrol. Earth Syst. Sci., 20, 2779–2800, 2016 www.hydrol-earth-syst-sci.net/20/2779/2016/
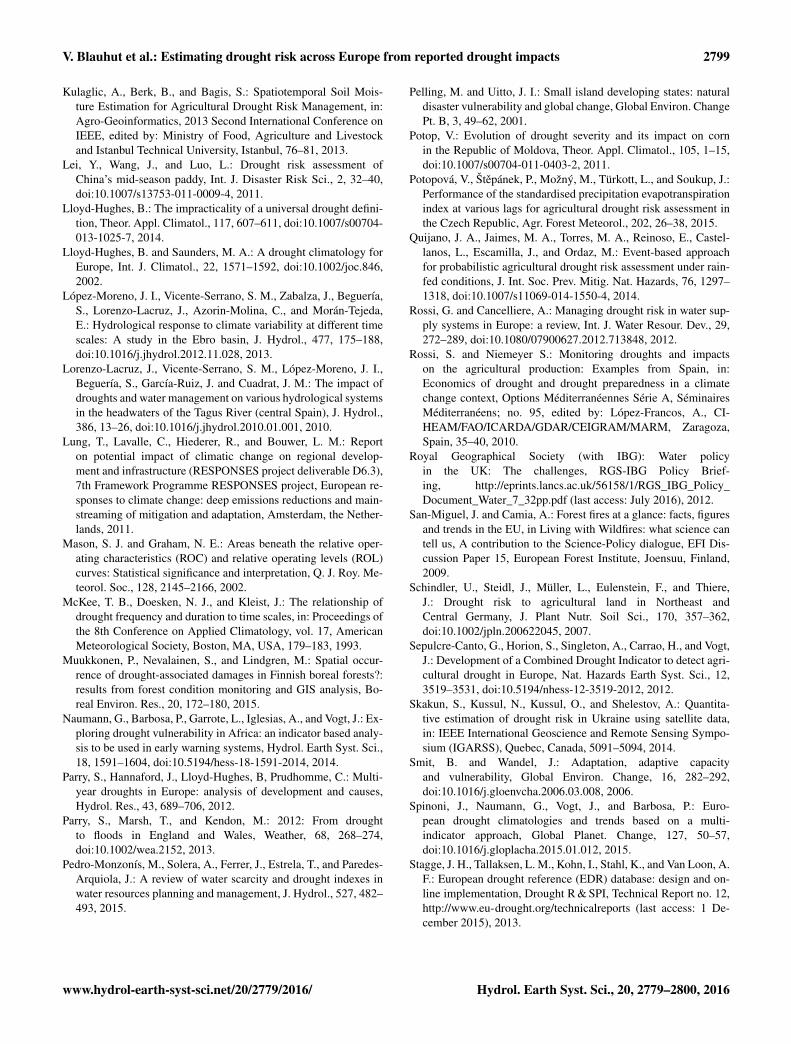
V. Blauhut et al.: Estimating drought risk across Europe from reported drought impacts 2799
Kulaglic, A., Berk, B., and Bagis, S.: Spatiotemporal Soil Mois-ture Estimation for Agricultural Drought Risk Management, in:Agro-Geoinformatics, 2013 Second International Conference onIEEE, edited by: Ministry of Food, Agriculture and Livestockand Istanbul Technical University, Istanbul, 76–81, 2013.
Lei, Y., Wang, J., and Luo, L.: Drought risk assessment ofChina’s mid-season paddy, Int. J. Disaster Risk Sci., 2, 32–40,doi:10.1007/s13753-011-0009-4, 2011.
Lloyd-Hughes, B.: The impracticality of a universal drought defini-tion, Theor. Appl. Climatol., 117, 607–611, doi:10.1007/s00704-013-1025-7, 2014.
Lloyd-Hughes, B. and Saunders, M. A.: A drought climatology forEurope, Int. J. Climatol., 22, 1571–1592, doi:10.1002/joc.846,2002.
López-Moreno, J. I., Vicente-Serrano, S. M., Zabalza, J., Beguería,S., Lorenzo-Lacruz, J., Azorin-Molina, C., and Morán-Tejeda,E.: Hydrological response to climate variability at different timescales: A study in the Ebro basin, J. Hydrol., 477, 175–188,doi:10.1016/j.jhydrol.2012.11.028, 2013.
Lorenzo-Lacruz, J., Vicente-Serrano, S. M., López-Moreno, J. I.,Beguería, S., García-Ruiz, J. and Cuadrat, J. M.: The impact ofdroughts and water management on various hydrological systemsin the headwaters of the Tagus River (central Spain), J. Hydrol.,386, 13–26, doi:10.1016/j.jhydrol.2010.01.001, 2010.
Lung, T., Lavalle, C., Hiederer, R., and Bouwer, L. M.: Reporton potential impact of climatic change on regional develop-ment and infrastructure (RESPONSES project deliverable D6.3),7th Framework Programme RESPONSES project, European re-sponses to climate change: deep emissions reductions and main-streaming of mitigation and adaptation, Amsterdam, the Nether-lands, 2011.
Mason, S. J. and Graham, N. E.: Areas beneath the relative oper-ating characteristics (ROC) and relative operating levels (ROL)curves: Statistical significance and interpretation, Q. J. Roy. Me-teorol. Soc., 128, 2145–2166, 2002.
McKee, T. B., Doesken, N. J., and Kleist, J.: The relationship ofdrought frequency and duration to time scales, in: Proceedings ofthe 8th Conference on Applied Climatology, vol. 17, AmericanMeteorological Society, Boston, MA, USA, 179–183, 1993.
Muukkonen, P., Nevalainen, S., and Lindgren, M.: Spatial occur-rence of drought-associated damages in Finnish boreal forests?:results from forest condition monitoring and GIS analysis, Bo-real Environ. Res., 20, 172–180, 2015.
Naumann, G., Barbosa, P., Garrote, L., Iglesias, A., and Vogt, J.: Ex-ploring drought vulnerability in Africa: an indicator based analy-sis to be used in early warning systems, Hydrol. Earth Syst. Sci.,18, 1591–1604, doi:10.5194/hess-18-1591-2014, 2014.
Parry, S., Hannaford, J., Lloyd-Hughes, B, Prudhomme, C.: Multi-year droughts in Europe: analysis of development and causes,Hydrol. Res., 43, 689–706, 2012.
Parry, S., Marsh, T., and Kendon, M.: 2012: From droughtto floods in England and Wales, Weather, 68, 268–274,doi:10.1002/wea.2152, 2013.
Pedro-Monzonís, M., Solera, A., Ferrer, J., Estrela, T., and Paredes-Arquiola, J.: A review of water scarcity and drought indexes inwater resources planning and management, J. Hydrol., 527, 482–493, 2015.
Pelling, M. and Uitto, J. I.: Small island developing states: naturaldisaster vulnerability and global change, Global Environ. ChangePt. B, 3, 49–62, 2001.
Potop, V.: Evolution of drought severity and its impact on cornin the Republic of Moldova, Theor. Appl. Climatol., 105, 1–15,doi:10.1007/s00704-011-0403-2, 2011.
Potopová, V., Štepánek, P., Možný, M., Türkott, L., and Soukup, J.:Performance of the standardised precipitation evapotranspirationindex at various lags for agricultural drought risk assessment inthe Czech Republic, Agr. Forest Meteorol., 202, 26–38, 2015.
Quijano, J. A., Jaimes, M. A., Torres, M. A., Reinoso, E., Castel-lanos, L., Escamilla, J., and Ordaz, M.: Event-based approachfor probabilistic agricultural drought risk assessment under rain-fed conditions, J. Int. Soc. Prev. Mitig. Nat. Hazards, 76, 1297–1318, doi:10.1007/s11069-014-1550-4, 2014.
Rossi, G. and Cancelliere, A.: Managing drought risk in water sup-ply systems in Europe: a review, Int. J. Water Resour. Dev., 29,272–289, doi:10.1080/07900627.2012.713848, 2012.
Rossi, S. and Niemeyer S.: Monitoring droughts and impactson the agricultural production: Examples from Spain, in:Economics of drought and drought preparedness in a climatechange context, Options Méditerranéennes Série A, SéminairesMéditerranéens; no. 95, edited by: López-Francos, A., CI-HEAM/FAO/ICARDA/GDAR/CEIGRAM/MARM, Zaragoza,Spain, 35–40, 2010.
Royal Geographical Society (with IBG): Water policyin the UK: The challenges, RGS-IBG Policy Brief-ing, http://eprints.lancs.ac.uk/56158/1/RGS_IBG_Policy_Document_Water_7_32pp.pdf (last access: July 2016), 2012.
San-Miguel, J. and Camia, A.: Forest fires at a glance: facts, figuresand trends in the EU, in Living with Wildfires: what science cantell us, A contribution to the Science-Policy dialogue, EFI Dis-cussion Paper 15, European Forest Institute, Joensuu, Finland,2009.
Schindler, U., Steidl, J., Müller, L., Eulenstein, F., and Thiere,J.: Drought risk to agricultural land in Northeast andCentral Germany, J. Plant Nutr. Soil Sci., 170, 357–362,doi:10.1002/jpln.200622045, 2007.
Sepulcre-Canto, G., Horion, S., Singleton, A., Carrao, H., and Vogt,J.: Development of a Combined Drought Indicator to detect agri-cultural drought in Europe, Nat. Hazards Earth Syst. Sci., 12,3519–3531, doi:10.5194/nhess-12-3519-2012, 2012.
Skakun, S., Kussul, N., Kussul, O., and Shelestov, A.: Quantita-tive estimation of drought risk in Ukraine using satellite data,in: IEEE International Geoscience and Remote Sensing Sympo-sium (IGARSS), Quebec, Canada, 5091–5094, 2014.
Smit, B. and Wandel, J.: Adaptation, adaptive capacityand vulnerability, Global Environ. Change, 16, 282–292,doi:10.1016/j.gloenvcha.2006.03.008, 2006.
Spinoni, J., Naumann, G., Vogt, J., and Barbosa, P.: Euro-pean drought climatologies and trends based on a multi-indicator approach, Global Planet. Change, 127, 50–57,doi:10.1016/j.gloplacha.2015.01.012, 2015.
Stagge, J. H., Tallaksen, L. M., Kohn, I., Stahl, K., and Van Loon, A.F.: European drought reference (EDR) database: design and on-line implementation, Drought R & SPI, Technical Report no. 12,http://www.eu-drought.org/technicalreports (last access: 1 De-cember 2015), 2013.
www.hydrol-earth-syst-sci.net/20/2779/2016/ Hydrol. Earth Syst. Sci., 20, 2779–2800, 2016
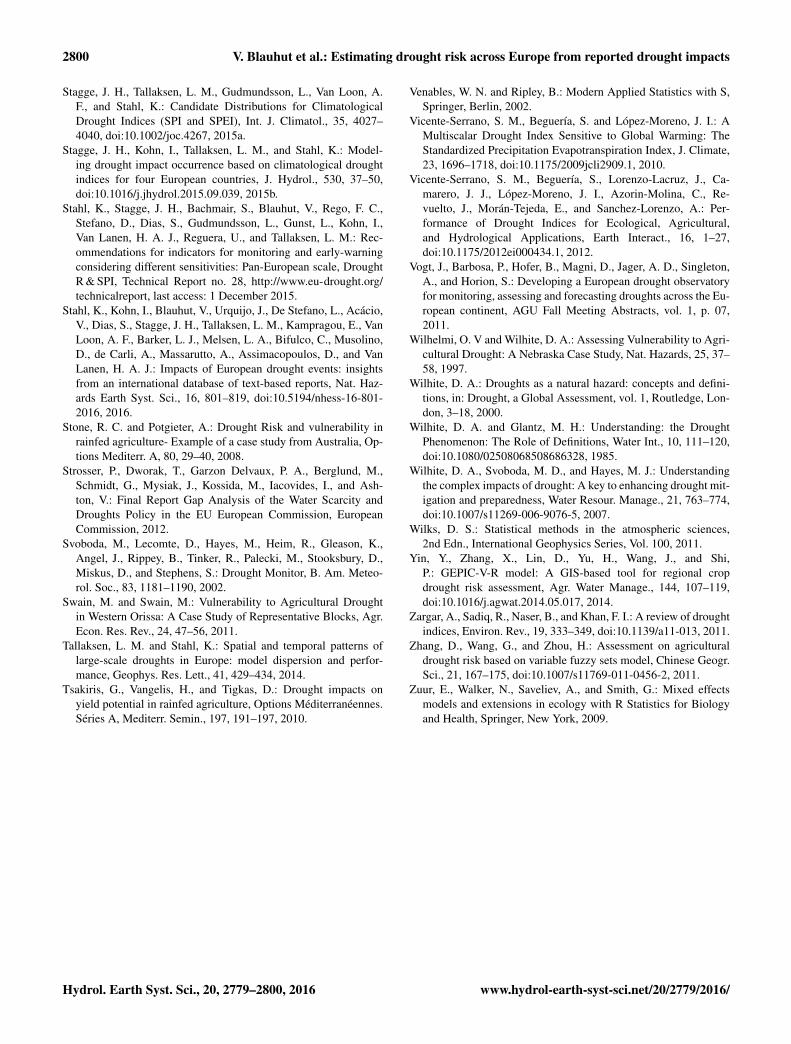
2800 V. Blauhut et al.: Estimating drought risk across Europe from reported drought impacts
Stagge, J. H., Tallaksen, L. M., Gudmundsson, L., Van Loon, A.F., and Stahl, K.: Candidate Distributions for ClimatologicalDrought Indices (SPI and SPEI), Int. J. Climatol., 35, 4027–4040, doi:10.1002/joc.4267, 2015a.
Stagge, J. H., Kohn, I., Tallaksen, L. M., and Stahl, K.: Model-ing drought impact occurrence based on climatological droughtindices for four European countries, J. Hydrol., 530, 37–50,doi:10.1016/j.jhydrol.2015.09.039, 2015b.
Stahl, K., Stagge, J. H., Bachmair, S., Blauhut, V., Rego, F. C.,Stefano, D., Dias, S., Gudmundsson, L., Gunst, L., Kohn, I.,Van Lanen, H. A. J., Reguera, U., and Tallaksen, L. M.: Rec-ommendations for indicators for monitoring and early-warningconsidering different sensitivities: Pan-European scale, DroughtR & SPI, Technical Report no. 28, http://www.eu-drought.org/technicalreport, last access: 1 December 2015.
Stahl, K., Kohn, I., Blauhut, V., Urquijo, J., De Stefano, L., Acácio,V., Dias, S., Stagge, J. H., Tallaksen, L. M., Kampragou, E., VanLoon, A. F., Barker, L. J., Melsen, L. A., Bifulco, C., Musolino,D., de Carli, A., Massarutto, A., Assimacopoulos, D., and VanLanen, H. A. J.: Impacts of European drought events: insightsfrom an international database of text-based reports, Nat. Haz-ards Earth Syst. Sci., 16, 801–819, doi:10.5194/nhess-16-801-2016, 2016.
Stone, R. C. and Potgieter, A.: Drought Risk and vulnerability inrainfed agriculture- Example of a case study from Australia, Op-tions Mediterr. A, 80, 29–40, 2008.
Strosser, P., Dworak, T., Garzon Delvaux, P. A., Berglund, M.,Schmidt, G., Mysiak, J., Kossida, M., Iacovides, I., and Ash-ton, V.: Final Report Gap Analysis of the Water Scarcity andDroughts Policy in the EU European Commission, EuropeanCommission, 2012.
Svoboda, M., Lecomte, D., Hayes, M., Heim, R., Gleason, K.,Angel, J., Rippey, B., Tinker, R., Palecki, M., Stooksbury, D.,Miskus, D., and Stephens, S.: Drought Monitor, B. Am. Meteo-rol. Soc., 83, 1181–1190, 2002.
Swain, M. and Swain, M.: Vulnerability to Agricultural Droughtin Western Orissa: A Case Study of Representative Blocks, Agr.Econ. Res. Rev., 24, 47–56, 2011.
Tallaksen, L. M. and Stahl, K.: Spatial and temporal patterns oflarge-scale droughts in Europe: model dispersion and perfor-mance, Geophys. Res. Lett., 41, 429–434, 2014.
Tsakiris, G., Vangelis, H., and Tigkas, D.: Drought impacts onyield potential in rainfed agriculture, Options Méditerranéennes.Séries A, Mediterr. Semin., 197, 191–197, 2010.
Venables, W. N. and Ripley, B.: Modern Applied Statistics with S,Springer, Berlin, 2002.
Vicente-Serrano, S. M., Beguería, S. and López-Moreno, J. I.: AMultiscalar Drought Index Sensitive to Global Warming: TheStandardized Precipitation Evapotranspiration Index, J. Climate,23, 1696–1718, doi:10.1175/2009jcli2909.1, 2010.
Vicente-Serrano, S. M., Beguería, S., Lorenzo-Lacruz, J., Ca-marero, J. J., López-Moreno, J. I., Azorin-Molina, C., Re-vuelto, J., Morán-Tejeda, E., and Sanchez-Lorenzo, A.: Per-formance of Drought Indices for Ecological, Agricultural,and Hydrological Applications, Earth Interact., 16, 1–27,doi:10.1175/2012ei000434.1, 2012.
Vogt, J., Barbosa, P., Hofer, B., Magni, D., Jager, A. D., Singleton,A., and Horion, S.: Developing a European drought observatoryfor monitoring, assessing and forecasting droughts across the Eu-ropean continent, AGU Fall Meeting Abstracts, vol. 1, p. 07,2011.
Wilhelmi, O. V and Wilhite, D. A.: Assessing Vulnerability to Agri-cultural Drought: A Nebraska Case Study, Nat. Hazards, 25, 37–58, 1997.
Wilhite, D. A.: Droughts as a natural hazard: concepts and defini-tions, in: Drought, a Global Assessment, vol. 1, Routledge, Lon-don, 3–18, 2000.
Wilhite, D. A. and Glantz, M. H.: Understanding: the DroughtPhenomenon: The Role of Definitions, Water Int., 10, 111–120,doi:10.1080/02508068508686328, 1985.
Wilhite, D. A., Svoboda, M. D., and Hayes, M. J.: Understandingthe complex impacts of drought: A key to enhancing drought mit-igation and preparedness, Water Resour. Manage., 21, 763–774,doi:10.1007/s11269-006-9076-5, 2007.
Wilks, D. S.: Statistical methods in the atmospheric sciences,2nd Edn., International Geophysics Series, Vol. 100, 2011.
Yin, Y., Zhang, X., Lin, D., Yu, H., Wang, J., and Shi,P.: GEPIC-V-R model: A GIS-based tool for regional cropdrought risk assessment, Agr. Water Manage., 144, 107–119,doi:10.1016/j.agwat.2014.05.017, 2014.
Zargar, A., Sadiq, R., Naser, B., and Khan, F. I.: A review of droughtindices, Environ. Rev., 19, 333–349, doi:10.1139/a11-013, 2011.
Zhang, D., Wang, G., and Zhou, H.: Assessment on agriculturaldrought risk based on variable fuzzy sets model, Chinese Geogr.Sci., 21, 167–175, doi:10.1007/s11769-011-0456-2, 2011.
Zuur, E., Walker, N., Saveliev, A., and Smith, G.: Mixed effectsmodels and extensions in ecology with R Statistics for Biologyand Health, Springer, New York, 2009.
Hydrol. Earth Syst. Sci., 20, 2779–2800, 2016 www.hydrol-earth-syst-sci.net/20/2779/2016/