Embed Size (px)
Citation preview
371
Estimating Item Characteristic CurvesMalcolm James ReeAir Force Human Resources Laboratory
A simulation study of the effectiveness of fouritem characteristic curve estimation programs wasconducted. Using the three-parameter logisticmodel, three groups of 2,000 simulated subjectswere administered 80-item tests. These simulatedtest responses were then calibrated using the fourprograms. The estimated item parameters were
compared to the known item parameters in fouranalyses for each program in all three data sets. Itwas concluded that the selection of an item calibra-tion procedure should be dependent on the distri-bution of ability in the calibration sample, the lateruses of the item parameters, and the computer re-sources available.
Increased interest in computer-driven adaptive testing, automated item banking, and automatedtest construction has made the estimation of the item characteristic curve (ICC) important. This curvedescribes the relationship between the ability of individuals and the probability of their answering atest question correctly. It is useful in estimating test scores, equating the scores of various tests, andscoring responses during adaptive testing. There are several methods for estimating ICCs withinavailable computer programs. Selection and implementation of the appropriate program becomes atask for the practitioner. The objective of this study is to compare the merits of four available pro-grams.
The Research Problem
In order to estimate an ICC, a conceptual model must be defined and item parameters must beestimated. The three-parameter logistic model of Birnbaum (Lord & Novick, 1968) is the most fre-quently used for relating item responses to persons’ ability. The three parameters-a, b, and c-areitem discrimination, item difficulty (or location), and probability of chance success (or lower asymp-tote), respectively.
The curve described by these parameters takes the shape of an (cumulative frequency) ogive oran &dquo;s&dquo; with the upper asymptote approaching a probability of 1.0 and, usually, the lower asymptotea probability greater than 0.0. The ogive describes the probability of obtaining a correct answer toan item as a monotonic increasing function of ability.
APPLIED PSYCHOLOGICAL MEASUREMENTVol. 3. No.3 Summer 1979 pp. 371-385@ Copyright 1979 West Publishing Co.
Downloaded from the Digital Conservancy at the University of Minnesota, http://purl.umn.edu/93227. May be reproduced with no cost by students and faculty for academic use. Non-academic reproduction
requires payment of royalties through the Copyright Clearance Center, http://www.copyright.com/
372
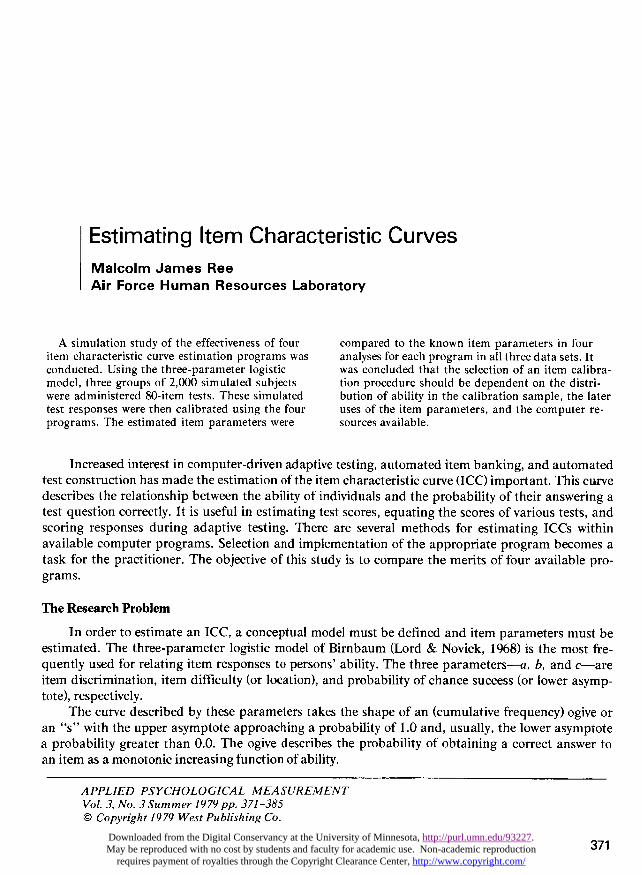
The item discrimination parameter (a) is a function of the slope of the ICC and generally rangesfrom .5 to about 2.5. A value of a equal to about 1.0 is typical of many test items, while a values below.5 are insufficiently discriminating for most testing purposes, and a values above 2.0 are infrequentlyfound. The item difficulty parameter (b) describes the point of inflection of the ICC and is usuallyscaled between -3.0 and +3.0, although the metric is arbitrary. The item guessing parameter (c) is thelower asymptote of the ICC and is generally interpreted as the probability of selecting the correctitem-option by chance alone. Most test items have c parameters greater than 0.0 and less than orequal to .30.
Figure 1 shows three ICCs. The horizontal axis is scaled in units of ability (0) and the verticalaxis is the probability of answering the item correctly. The solid curved line shows an ICC for an item
Figure 1
Downloaded from the Digital Conservancy at the University of Minnesota, http://purl.umn.edu/93227. May be reproduced with no cost by students and faculty for academic use. Non-academic reproduction
requires payment of royalties through the Copyright Clearance Center, http://www.copyright.com/
373
of average difficulty with acceptable discrimination and the lower asymptote appropriate for a five-option multiple-choice item. The dashed line shows an item of identical difficulty, c value of .28, butwith a lower a value. Note how the slope of the curve is less steep. The third curve, dot-dash line,shows an item with a c value of .30, an a parameter of 1.0, and a b parameter equal to 1.0. As the bparameter changes, the location of the inflection point of the curve is displaced along the horizontalaxis.
In most cases the test constructor is faced with the task of estimating three parameters for the nitems and one ability parameter (0) for every examinee (11~ so that N + 3n parameters must be esti-mated for each group of test items. For a group of 2,000 examinees taking 80 items 2,240 [2,000 + (3 x80)] parameters must be estimated simultaneously. In an iterative procedure this estimation must berepeated several times, which leads to long computer runs with more precise estimates. Three of thefour ICC estimation procedures evaluated in this study are iterative. The fourth is a monotonic in-creasing function of the biserial correlation between the item and the raw score.
Method
A simulation was run in order to have known values for the ability level (0) and for the itemparameters. Three distributions of ability (0) with differing shapes were generated on which to testthe procedures for ICC parameter estimation. Each 0 is equivalent to a &dquo;subject.&dquo; The generateditem parameters (a, b, and c) remained constant across the three distributions of ability (0).
Four methods of assessing the adequacy of the ICC estimation procedures were used. First, theestimated item parameters (a, b, and c) were correlated with the known item parameters; second, the0 estimated by using a, b, and c from each estimation procedure was correlated with the known 0.Third, true scores and estimated true scores from the ~, 6, and c were compared (Lord, 1975). Finally,the test information curve was compared with estimates of the test information curve using the itemparameters estimated in the three data sets.
Data Sets
Data set 7 (DSI). The distribution of 0’s for DS1 was generated by dividing the interval be-tween -2.5 and +2.5 into 2,000 equal intervals and assigning each resultant number to a value of 0.This data set is similar to those sometimes produced for item analytic studies for tests such as theArmed Services Vocational Aptitude Battery (Jensen, Massey, & Valentine, 1976).
Data set 2 (DS2). The distribution of 0’s for DS2 was generated by obtaining 3,000 cases froma unit normal random number generator. Two thousand 0’s were selected by administering a &dquo;test&dquo;and generating a sum of the number-correct score for the 3,000 based on ICC parameters of a 30-itemsubtest used in military selection and classification. A cutting score was set which would yield theupper two-thirds of the population. This method, rather than just cutting at a 33.3 percentile equiva-lent on the 0 distribution, was used to emulate actual selection practices which involve errors ofmeasurement. The resultant distribution does not have a sharp truncation of 0’s but is asymmetric,with few scores below a specified level. DS2 is similar to samples frequently available to organizationswhich must work with samples selected for inclusion in training or education.
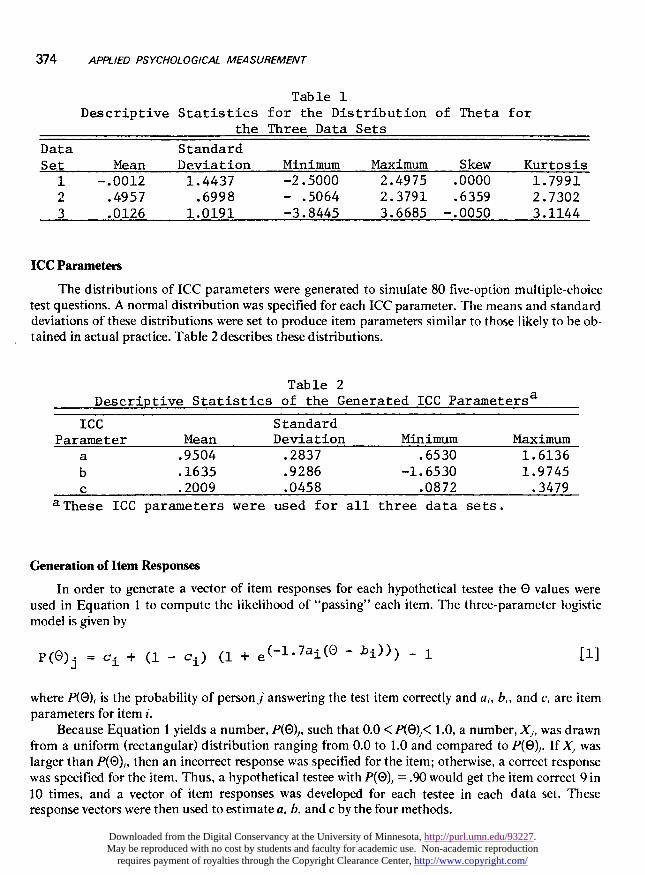
Data set 3 (DS3). The distribution of 0’s for DS3 was generated by accessing the unit normalrandom number generator for 2,000 numbers. Table 1 shows the means, standard deviations, andminimum and maximum 0’s for the three data sets.
Downloaded from the Digital Conservancy at the University of Minnesota, http://purl.umn.edu/93227. May be reproduced with no cost by students and faculty for academic use. Non-academic reproduction
requires payment of royalties through the Copyright Clearance Center, http://www.copyright.com/
374
Table 1
Descriptive Statistics for the Distribution of Theta forthe Three Data Sets
ICC Parameters
The distributions of ICC parameters were generated to simulate 80 five-option multiple-choicetest questions. A normal distribution was specified for each ICC parameter. The means and standarddeviations of these distributions were set to produce item parameters similar to those likely to be ob-tained in actual practice. Table 2 describes these distributions.
Tab le 2
- Descriptive Statistics of the Generated ICC Parametersa
-
--~-- z
a These ICC parameters were used for all three data sets.
Generation of Item Responses
In order to generate a vector of item responses for each hypothetical testee the 0 values wereused in Equation 1 to compute the likelihood of &dquo;passing&dquo; each item. The three-parameter logisticmodel is given by
where P(8), is the probability of person’; answering the test item correctly and a&dquo; b&dquo; and c, are item
parameters for item i.Because Equation 1 yields a number, P(0),, such that 0.0 < P(8)j< 1.0, a number, X,, was drawn
from a uniform (rectangular) distribution ranging from 0.0 to 1.0 and compared to P(0),. If X, waslarger than P(0),, then an incorrect response was specified for the item; otherwise, a correct responsewas specified for the item. Thus, a hypothetical testee with P(O), =.90 would get the item correct 9 in10 times, and a vector of item responses was developed for each testee in each data set. Theseresponse vectors were then used to estimate a, b, and c by the four methods.
Downloaded from the Digital Conservancy at the University of Minnesota, http://purl.umn.edu/93227. May be reproduced with no cost by students and faculty for academic use. Non-academic reproduction
requires payment of royalties through the Copyright Clearance Center, http://www.copyright.com/
375
Estimation of ICC Parameters
The following four methods of ICC estimation were selected because of their wide availability topractitioners: ANCILLES, LOGIST, OGIVIA, and transformations to the item-test biserial correla-tion. All are three-parameter models.
ANCILLES and OGIVIA are described by Urry (1977, 1978); and LOGIST, by Wood, Winger-sky, and Lord (1976). Transformations may be found in Lord and Novick (1968). These procedureswere implemented on a UNIVAC 1108 and thoroughly checked out by processing the sample data setsupplied by each of the authors of the programs. Default options for the programs were specifiedwhere possible and the logistic model was used throughout.
Analysis
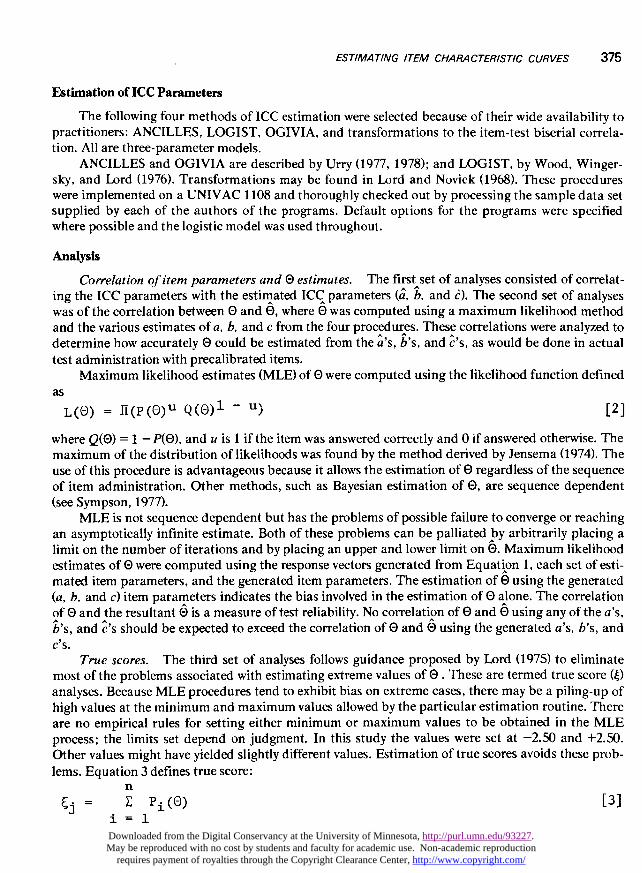
Correlation of item parameters and e estimates. The first set of analyses consisted of correlat-ing the ICC parameters with the estimated ICC parameters (a, b, and c). The second set of analyseswas of the correlation between 0 and O, where e was computed using a maximum likelihood methodand the various estimates of a, b, and c from the four procedures. These correlations were analyzed todetermine how accurately 0 could be estimated from the ~’s, b’s, and c’s, as would be done in actualtest administration with precalibrated items.
Maximum likelihood estimates (MLE) of 0 were computed using the likelihood function definedas
where Q(0) =1 - P(O), and u is 1 if the item was answered correctly and 0 if answered otherwise. Themaximum of the distribution of likelihoods was found by the method derived by Jensema (1974). Theuse of this procedure is advantageous because it allows the estimation of 0 regardless of the sequenceof item administration. Other methods, such as Bayesian estimation of 0, are sequence dependent(see Sympson, 1977).
MLE is not sequence dependent but has the problems of possible failure to converge or reachingan asymptotically infinite estimate. Both of these problems can be palliated by arbitrarily placing alimit on the number of iterations and by placing an upper and lower limit on 6. Maximum likelihoodestimates of 0 were computed using the response vectors generated from Equation 1, each set of esti-mated item parameters, and the generated item parameters. The estimation of 0 using the generated(a, b, and c) item parameters indicates the bias involved in the estimation of 0 alone. The correlationof 0 and the resultant 6 is a measure of test reliability. No correlation of 0 and O using any of the a’s,b’s, and c A should be expected to exceed the correlation of 0 and O using the generated a’s, b’s, andc’s.
True scores. The third set of analyses follows guidance proposed by Lord (1975) to eliminatemost of the problems associated with estimating extreme values of O . These are termed true score (~)analyses. Because MLE procedures tend to exhibit bias on extreme cases, there may be a piling-up ofhigh values at the minimum and maximum values allowed by the particular estimation routine. Thereare no empirical rules for setting either minimum or maximum values to be obtained in the MLEprocess; the limits set depend on judgment. In this study the values were set at -2.50 and +2.50.Other values might have yielded slightly different values. Estimation of true scores avoids these prob-lems. Equation 3 defines true score:
Downloaded from the Digital Conservancy at the University of Minnesota, http://purl.umn.edu/93227. May be reproduced with no cost by students and faculty for academic use. Non-academic reproduction
requires payment of royalties through the Copyright Clearance Center, http://www.copyright.com/
376
where 4, is the true score,n is the number of items, andP,(0) is the probability of a correct response for the item as in Equation 1. Similarly, the
estimated true score is given by
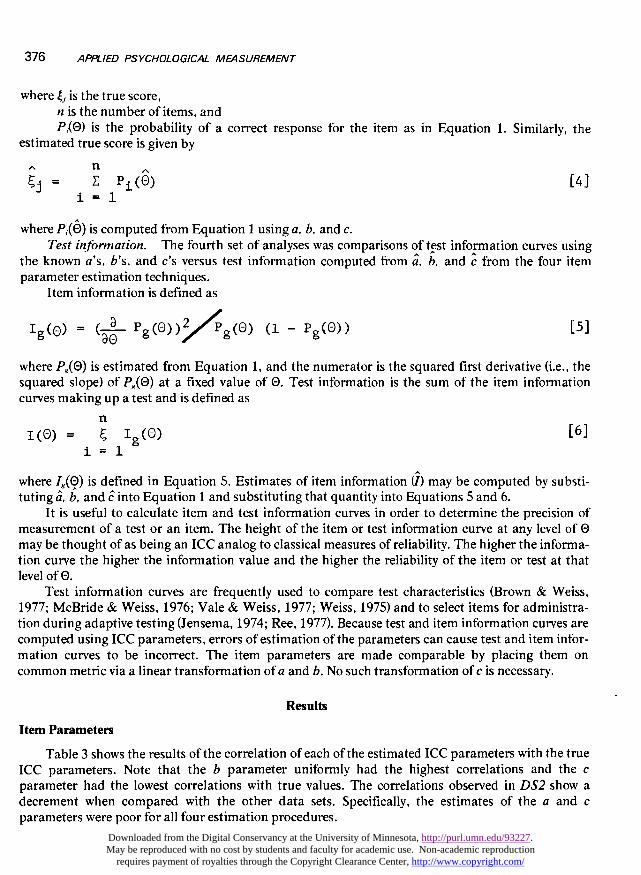
where P,(6) is computed from Equation 1 using a, b, and c.Test information. The fourth set of analyses was comparisons of test information curves using
the known a’s, b’s, and c’s versus test information computed from a, b, and c from the four itemparameter estimation techniques.
Item information is defined as
where Pg(O) is estimated from Equation 1, and the numerator is the squared first derivative (i.e., thesquared slope) of PB(0) at a fixed value of 0. Test information is the sum of the item informationcurves making up a test and is defined as
where IB(0) is defined in Equation 5. Estimates of item information (I) may be computed by substi-tuting a, b, and i into Equation 1 and substituting that quantity into Equations 5 and 6.
It is useful to calculate item and test information curves in order to determine the precision ofmeasurement of a test or an item. The height of the item or test information curve at any level of 0may be thought of as being an ICC analog to classical measures of reliability. The higher the informa-tion curve the higher the information value and the higher the reliability of the item or test at thatlevel of O.
Test information curves are frequently used to compare test characteristics (Brown & Weiss,1977; McBride & Weiss, 1976; Vale & Weiss, 1977; Weiss, 1975) and to select items for administra-tion during adaptive testing (Jensema, 1974; Ree, 1977). Because test and item information curves arecomputed using ICC parameters, errors of estimation of the parameters can cause test and item infor-mation curves to be incorrect. The item parameters are made comparable by placing them oncommon metric via a linear transformation of a and b. No such transformation of c is necessary.
Results
Item Parameters
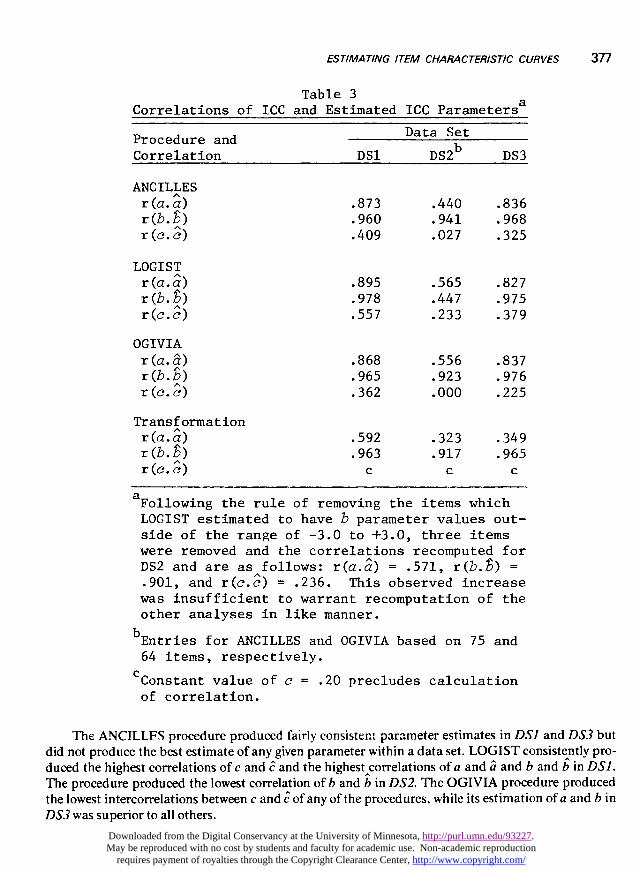
Table 3 shows the results of the correlation of each of the estimated ICC parameters with the trueICC parameters. Note that the b parameter uniformly had the highest correlations and the cparameter had the lowest correlations with true values. The correlations observed in DS2 show adecrement when compared with the other data sets. Specifically, the estimates of the a and cparameters were poor for all four estimation procedures.
Downloaded from the Digital Conservancy at the University of Minnesota, http://purl.umn.edu/93227. May be reproduced with no cost by students and faculty for academic use. Non-academic reproduction
requires payment of royalties through the Copyright Clearance Center, http://www.copyright.com/
377
Table 3Correlations of ICC and Estimated ICC Parametersa
aFollowing the rule of removing the items whichLOGIST estimated to have b parameter values out-side of the range of -3.0 to +3.0, three itemswere removed and the correlations recomputed forDS2 and are as follows: r(a.a^) = .571, r (b. ~) -.901, and r(c.c) = .236. This observed increasewas insufficient to warrant recomputation of theother analyses in like manner.
bEntries for ANCILLES and OGIVIA based on 75 and64 items, respectively.
cConstant value of c = .20 precludes calculationof correlation.
The ANCILLFS procedure produced fairly consistent parameter estimates in DSI and DS3 butdid not produce the best estimate of any given parameter within a data set. LOGIST consistently pro-duced the highest correlations of c and c and the highest correlations of a and a and band b in DS].The procedure produced the lowest correlation of b and b in DS2. The OGIVIA procedure producedthe lowest intercorrelations between c and i of any of the procedures, while its estimation of a and b inDS3 was superior to all others.
Downloaded from the Digital Conservancy at the University of Minnesota, http://purl.umn.edu/93227. May be reproduced with no cost by students and faculty for academic use. Non-academic reproduction
requires payment of royalties through the Copyright Clearance Center, http://www.copyright.com/
378
Ability Estimates
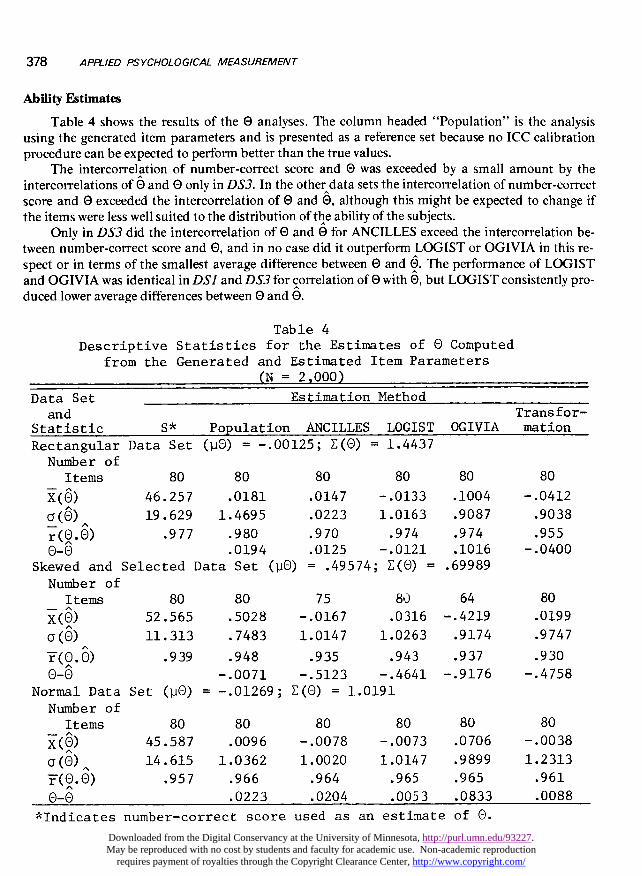
Table 4 shows the results of the O analyses. The column headed &dquo;Population&dquo; is the analysisusing the generated item parameters and is presented as a reference set because no ICC calibrationprocedure can be expected to perform better than the true values.
The intercorrelation of number-correct score and 0 was exceeded by a small amount by theintercorrelations of 6 and O only in DS3. In the other data sets the intercorrelation of number-correctscore and 0 exceeded the intercorrelation of 0 and 6, although this might be expected to change ifthe items were less well suited to the distribution of the ability of the subjects.
Only in DS3 did the intercorrelation of 0 and 6 for ANCILLES exceed the intercorrelation be-tween number-correct score and 0, and in no case did it outperform LOGIST or OGIVIA in this re-spect or in terms of the smallest average difference between 0 and U. The performance of LOGISTand OGIVIA was identical in DSI and DS3 for correlation of 0 with 6, but LOGIST consistently pro-duced lower average differences between 0 and 6.
Table 4
Descriptive Statistics for the Estimates of 0 Computedfrom the Generated and Estimated Item Parameters
(N = 2,000)
indicates number-correct score used as an estimate of 0.
Downloaded from the Digital Conservancy at the University of Minnesota, http://purl.umn.edu/93227. May be reproduced with no cost by students and faculty for academic use. Non-academic reproduction
requires payment of royalties through the Copyright Clearance Center, http://www.copyright.com/
379
The transformations procedures worked best in DS3, producing a correlation of 0 with 0 higherthan the correlation between number-correct score and 0. In all other cases the correlation of e and0 for transtormations was exceeded by the correlation ot 0 and number-correct scores. Transforma-tions did produce the smallest average difference between 0 and / for DS3, but other proceduresproved superior in DSI and DS2.
True Scores
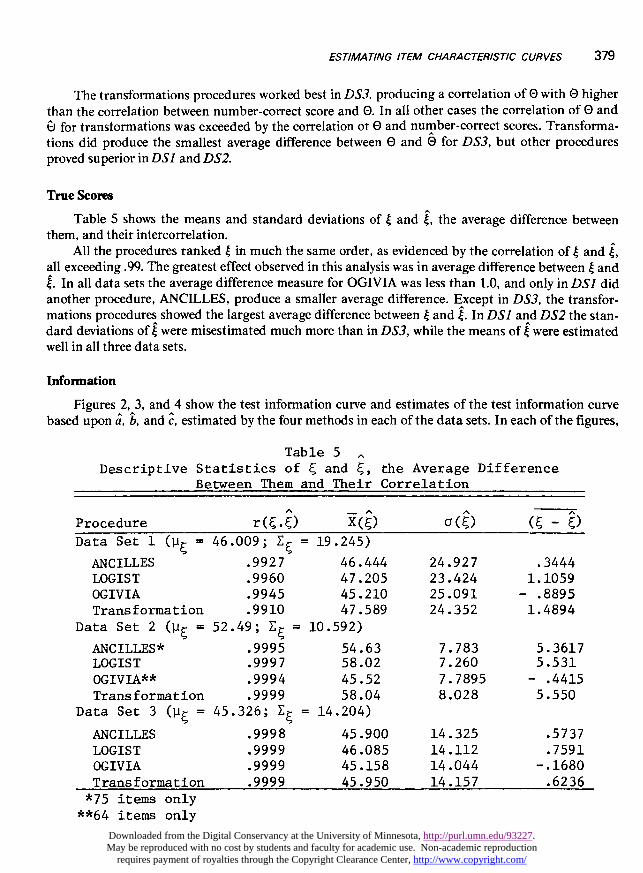
Table 5 shows the means and standard deviations of I and ~, the average difference betweenthem, and their intercorrelation.
All the procedures ranked I in much the same order, as evidenced by the correlation of 4 and I,all exceeding .99. The greatest effect observed in this analysis was in average difference between I andi. In all data sets the average difference measure for OGIVIA was less than 1.0, and only in D~7 didanother procedure, ANCILLES, produce a smaller average difference. Except in DS3, the transfor-mations procedures showed the largest average difference between I and ~. In DSI and DS2 the stan-dard deviations of i were misestimated much more than in DS3, while the means of i were estimatedwell in all three data sets.
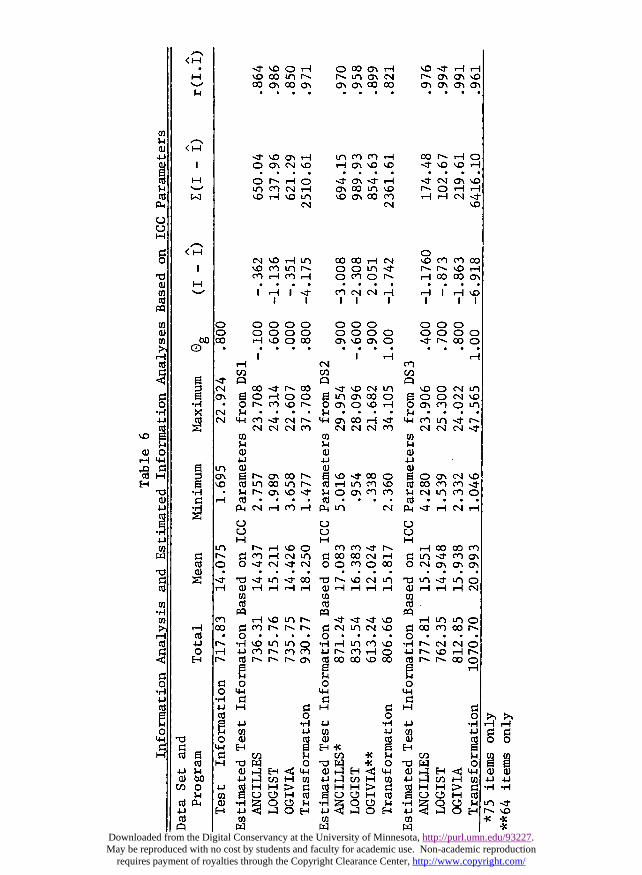
Information
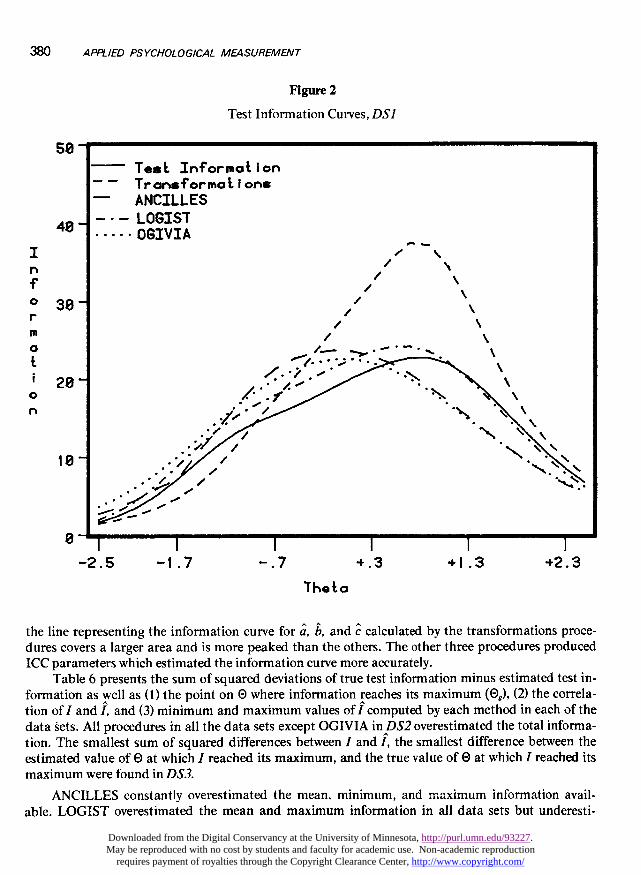
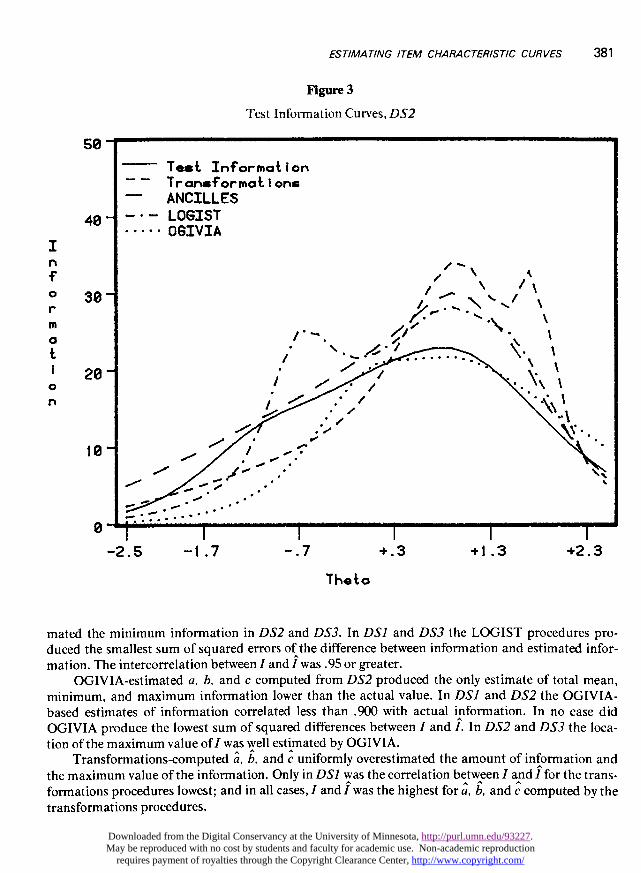
Figures 2, 3, and 4 show the test information curve and estimates of the test information curvebased upon â, b, and c, estimated by the four methods in each of the data sets. In each of the figures,
Table 5 -Descriptive Statistics of E and ~, the Average Difference
Between Them and Their Correlation
*75 items only**64 items only
Downloaded from the Digital Conservancy at the University of Minnesota, http://purl.umn.edu/93227. May be reproduced with no cost by students and faculty for academic use. Non-academic reproduction
requires payment of royalties through the Copyright Clearance Center, http://www.copyright.com/
380
Figure 2
Test Information Curves, D~7
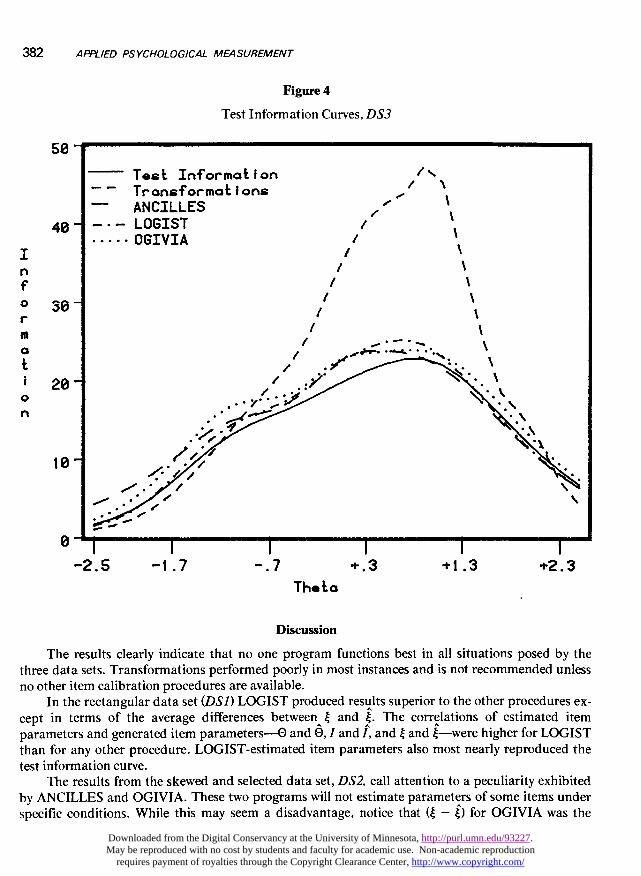
the line representing the information curve for a, b, and c calculated by the transformations proce-dures covers a larger area and is more peaked than the others. The other three procedures producedICC parameters which estimated the information curve more accurately.
Table 6 presents the sum of squared deviations of true test information minus estimated test in-formation as well as (1) the point on 0 where information reaches its maximum (0,), (2) the correla-tion of I and i, and (3) minimum and maximum values of f computed by each method in each of thedata sets. All procedures in all the data sets except OGIVIA in DS2 overestimated the total informa-tion. The smallest sum of squared differences between I and I, the smallest difference between theestimated value of 8 at which I reached its maximum, and the true value of 0 at which I reached itsmaximum were found in DS3.
ANCILLES constantly overestimated the mean, minimum, and maximum information avail-able. LOGIST overestimated the mean and maximum information in all data sets but underesti-
Downloaded from the Digital Conservancy at the University of Minnesota, http://purl.umn.edu/93227. May be reproduced with no cost by students and faculty for academic use. Non-academic reproduction
requires payment of royalties through the Copyright Clearance Center, http://www.copyright.com/
381
Figure 3
Test Information Curves, DS2
mated the minimum information in DS2 and DS3. In DSI and DS3 the LOGIST procedures pro-duced the smallest sum of squared errors of the difference between information and estimated infor-mation. The intercorrelation between I and I was .95 or greater.
OGIVIA-estimated a, b, and c computed from DS2 produced the only estimate of total mean,minimum, and maximum information lower than the actual value. In DSI and DS2 the OGIVIA-based estimates of information correlated less than .900 with actual information. In no case did
OGIVIA produce the lowest sum of squared differences between I and I. In DS2 and DS3 the loca-tion of the maximum value of I was well estimated by OGIVIA.
Transformations-computed a, b, and c uniformly overestimated the amount of information andthe maximum value of the information. Only in DSl was the correlation between I and 7 for the trans-formations procedures lowest; and in all cases, I and 1 was the highest for a, b, and c computed by thetransformations procedures.
Downloaded from the Digital Conservancy at the University of Minnesota, http://purl.umn.edu/93227. May be reproduced with no cost by students and faculty for academic use. Non-academic reproduction
requires payment of royalties through the Copyright Clearance Center, http://www.copyright.com/
382
Figure 4
Test Information Curves, DS3
Discussion
The results clearly indicate that no one program functions best in all situations posed by thethree data sets. Transformations performed poorly in most instances and is not recommended unlessno other item calibration procedures are available.
In the rectangular data set (DSI) LOGIST produced results superior to the other procedures ex-cept in terms of the average differences between I and ~. The correlations of estimated itemparameters and generated item parameters-Ð and 6, I and I, and I and i-were higher for LOGISTthan for any other procedure. LOGIST-estimated item parameters also most nearly reproduced thetest information curve.
The results from the skewed and selected data set, DS2, call attention to a peculiarity exhibitedby ANCILLES and OGIVIA. These two programs will not estimate parameters of some items underspecific conditions. While this may seem a disadvantage, notice that (~ - j) for OGIVIA was the
Downloaded from the Digital Conservancy at the University of Minnesota, http://purl.umn.edu/93227. May be reproduced with no cost by students and faculty for academic use. Non-academic reproduction
requires payment of royalties through the Copyright Clearance Center, http://www.copyright.com/
mnv
4JmH
Il1-1t0
r;:l.¡
UUH
Go’0Nmcuts
PQ
mN
mi§<oon
wuw S
m t(U 0~4-I
x <E-’
’dN
#!4Jmm
o<
cutsm·rlm
r~cuts
G<oonwcuts
S1-1o4-1GH
ON ~>1r-ir-i
?to 0
p Aai (U4J 4.J.r-i ’H
m<¡-... B0* -x
«Downloaded from the Digital Conservancy at the University of Minnesota, http://purl.umn.edu/93227. May be reproduced with no cost by students and faculty for academic use. Non-academic reproduction
requires payment of royalties through the Copyright Clearance Center, http://www.copyright.com/
384
smallest in DS2. Note also that OGIVIA showed (see Table 4) a correlation of 0 with 6 of .937 for 64items compared to .943 for 80 items using LOGIST. This increase of .006 is very small for the addi-tion of 16 items. LOGIST estimated item parameters for all the items, but inspection of the scatter-plot of b versus b indicates several outliers which have the effect of substantially reducing the value ofthe correlation of b with b. All the estimated test information curves computed from DS2 estimates ofthe item parameters resembled the true test information curve very poorly.
The OGIVIA procedure was the most preferable for use in the normally distributed data set,DS3. The correlations of OGIVIA-estimated a and b with a and b were higher than for the other pro-cedures ; however, its correlation of c and c was less than either ANCILLES or LOGIST. The correla-tion of 0 with 6 using OGIVIA was as high as LOGIST and higher than all others. The correlation ofwith for OGIVIA was the highest and simultaneously had the smallest average difference between~ and ~. OGIVIA is built around assumptions of the normality of the distribution of 0 and performedvery well when these conditions held true, as in DS3, or approximately held true, as in DS2. LOGISTestimates of the item parameters produced the highest correlation between I and.i and the lowest sumof squared deviations ofI minus l, and thus the best estimated test information.
The decision as to which procedure to use must be based on a series of criteria. If all the itemsmust be calibrated, then OGIVIA and ANCILLES may present problems in a situation similar tothat represented by DS2. If wide-range samples like DSl and DS3 are available or can be made avail-able on the basis of ability measured on some other test, and the estimation of 0 is the goal, then cali-bration with LOGIST or OGIVIA is recommended. Clearly, if the examinees are available, a normaldistribution of 0 leads to the best estimations of a, b, c, t 0, and I and is desirable. These data shouldthen be calibrated using OGIVIA.
Cost is a final factor which should be considered. The transformations procedure was the quick-est because, unlike the others, it is not iterative and its work can be accomplished in about 10 Fortranstatements. The LOGIST procedure took the longest on the computer. It ran eight times longer thaneither ANCILLES or OGIVIA. Central Processor Unit (CPU) times on a UNIVAC 1108 with 262Kwords of memory for DS3 were ANCILLES, 296 seconds; LOGIST, 2,061 seconds; OGIVIA, 180seconds; and transformations, 38 seconds.
The data from this study, therefore, suggest that the choice of ICC parameter estimation tech-niques should be consistent with the later use of the estimates, the characteristics of the distributionof ability in the groups available for item administration, the necessity to calibrate all items, and thecomputer resources available.
References
Brown, J. M., & Weiss, D. An adaptive testingstrategy for achievement test batteries (ResearchReport 77-6). Minneapolis: University of Minne-sota, Department of Psychology, PsychometricMethods Program, October 1977. (NTIS No.AD A046062).
Jensema, C. An application of latent-trait mental testtheory. British Journal of Mathematical and Sta-tistical Psychology, 1974, 27, 29-48.
Jensen, H., Massey, I., & Valentine, L. Armed Serv-ices Vocational Aptitude Battery Development:ASVAB Forms 5, 6, and 7 (AFHRL-TR-76-87).Lackland Air Force Base, TX: Air Force HumanResources Laboratory, Personnel Research Divi-sion, December 1976.
Lord, F. Evaluation with artificial data of a proce-dure for estimating ability and item characteristiccurve parameters (Research Memorandum 75-33).Princeton, NJ: Educational Testing Service, 1975.
Lord, F., & Novick, M. Statistical theories of mentaltest scores. Reading MA: Addison-Wesley, 1968.
McBride, J., & Weiss, D. Some properties of aBayesian adaptive ability testing strategy (Re-search Report 76-1). Minneapolis: University ofMinnesota, Department of Psychology, Psycho-metric Methods Program, March 1976. (NTIS No.AD A022964)
Ree, M. Implementation of a model adaptive testingsystem at an Armed Forces Entrance and Ex-amination Station. In D. J. Weiss (Ed.), Proceed-
Downloaded from the Digital Conservancy at the University of Minnesota, http://purl.umn.edu/93227. May be reproduced with no cost by students and faculty for academic use. Non-academic reproduction
requires payment of royalties through the Copyright Clearance Center, http://www.copyright.com/
385
ings of the 1977 Computerized Adaptive TestingConference. Minneapolis: University of Min-nesota, Department of Psychology, PsychometricMethods Program, July 1977.
Sympson, J. Estimation of latent trait status in adap-tive testing procedures. In D. J. Weiss (Ed.), Ap-plications of computerized adaptive testing (Re-search Report 77-1). Minneapolis: University ofMinnesota, Department of Psychology, Psycho-metric Methods Program, March 1977. (NTIS No.AD A038114)
Urry, V. OGIVIA: Item parameter estimation pro-gram with normal ogive and logistic three-
parameter model options. Washington, DC: U.S.Civil Service Commission, Personnel Researchand Development Center, 1977.
Urry, V. ANCILLES: Item parameter estimation pro-gram with normal ogive and logistic three-
parameter model options. Washington, DC: U.S.Civil Service Commission, Personnel Research
and Development Center, 1978.Vale, C., & Weiss, D. A comparison of information
functions of multiple-choice and free-responsevocabulary items (Research Report 77-2). Minnea-polis : University of Minnesota, Department ofPsychology, Psychometric Methods Program,April 1977.
Weiss, D. Adaptive testing research at Min-
nesota—overview, recent results, and future direc-tions. In C. L. Clark (Ed.), Proceedings of the,fcrstconference on computerized adaptive testing (U.S.Civil Service Commission, Personnel Research ,and Development Center, PS-75-6). Washington,DC: U.S. Government Printing Office, 1976.
(Superintendent of Documents Stock No. 006-
00940-9)
Wood, R., Wingersky, M., & Lord, F. LOGIST: Acomputer program for estimating examinee abilityand item characteristic curve parameters (Re-search Memorandum 76-6). Princeton, NJ: Edu-cational Testing Service, June 1976.
Acknowledgments
This reseach was conducted under Project 7719,Air Force Development of Selection, Assignment,Performance Evaluation, Retention, and UtilizationDevices; Task 771915. Perceptual and Computer-Managed Measurement.
The author extends his appreciation to Vern Urry.United States Civil Service Commission, and to
Frederick M. Lord, Educational Testing Service, formaking their computer programs available and fortheir suggestions concerning the simulation and anal-yses. James R. McBride, Naval Personnel Researchand Development Center; James B. Sympson, Univer-sity of Minnesota; and Vincent Maurelli, Army Re-search Institute, provided much-appreciated as-
sistance in the conduct of this study.The views expressed herein are those of the author
and do not necessarily reflect the views of the UnitedStates Air Force or the Department of Defense.
Author’s Address
Send requests for reprints or further information toMalcolm J. Ree, Personnel Research Division, AirForce Human Resources Laboratory, Brooks AFB,TX 78235.
Downloaded from the Digital Conservancy at the University of Minnesota, http://purl.umn.edu/93227. May be reproduced with no cost by students and faculty for academic use. Non-academic reproduction
requires payment of royalties through the Copyright Clearance Center, http://www.copyright.com/
553
Error Corrections
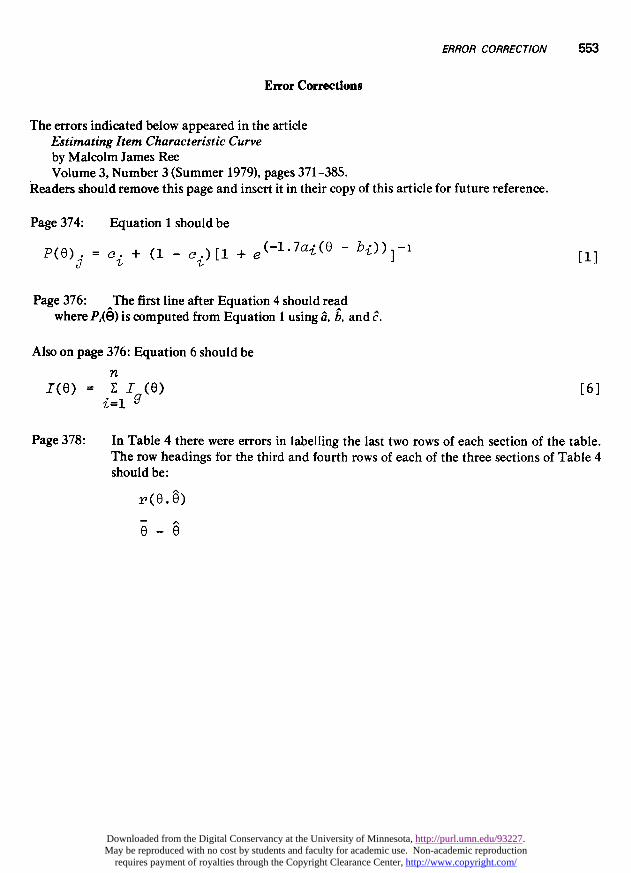
The errors indicated below appeared in the articleEstimating Item Characteristic Curveby Malcolm James ReeVolume 3, Number 3 (Summer 1979), pages 371-385.
Readers should remove this page and insert it in their copy of this article for future reference.
Page 374: Equation 1 should be
Page 376: The first line after Equation 4 should readwhere Pi(6) is computed from Equation 1 using a, L, and c.
Also on page 376: Equation 6 should be
Page 378: In Table 4 there were errors in labelling the last two rows of each section of the table.The row headings for the third and fourth rows of each of the three sections of Table 4should be:
Downloaded from the Digital Conservancy at the University of Minnesota, http://purl.umn.edu/93227. May be reproduced with no cost by students and faculty for academic use. Non-academic reproduction
requires payment of royalties through the Copyright Clearance Center, http://www.copyright.com/


![Estimating Predictive Rate–Distortion Curves via Neural ...socsci.uci.edu/~rfutrell/papers/hahn2019estimating.pdffaces a series of challenges [2]. One is the curse of dimensionality:](https://img.pdfslide.us/doc/110x75/601a2bb054d3a2185635a422/estimating-predictive-rateadistortion-curves-via-neural-rfutrellpapershahn2019estimatingpdf.jpg)