Embed Size (px)
Citation preview

October 2015
1
ESTIMATING BILATERAL TRADE IN SERVICES BY INDUSTRY – THE EBTSI DATA SET
1. Francesca Spinelli and Sébastien Miroudot, OECD
Introduction
2. This note describes the construction of the Estimated Bilateral Trade in Services by Industry
(EBTSI) dataset, a principle building block of the OECD Inter-Country Input-Output (ICIO) model.
3. The starting point of the EBTSI dataset is the OECD-WTO Trade in Services (TiS) database which
collects Balance of Payments (BoP) international services trade statistics within the framework of the
Manual on Statistics and International Trade in Services (MSITS 2002). The primary sources of the
BoP statistics are national statistical offices and the data are subsequently harmonised at the level of
international organisations.
4. The coverage of trade in services data, and in particular of bilateral trade flows, is still very
limited and often unbalanced, for reasons that could be partially attributed to the many challenges
encountered while measuring trade in services transactions. Services, in contrast to goods, are
characterised by a number of features, such as intangibility and non-storability, which complicate the
collection of accurate international trade in services statistics.
5. In order to capture these particular aspects of trade in services, the WTO has outlined, in its
General Agreement on Trade in Services (GATS), four modes of supply for the provision of
international services: Mode 1 cross-border trade; Mode 2 consumption abroad; Mode 3 commercial
presence; and Mode 4 movement of natural persons. BoP statistics, however, do not match precisely
the modes of supply defined in the GATS as services are often not provided according to one single
mode of supply but rather delivered through several modes at the same time and, as it is often the
case, these modes are interconnected.1 The intermodal supply of international services is only one of
many characteristics that make the compilation and recording of international services transactions
1. Services sectors such as accredited professions as Legal, Accounting, Engineering and other Professional services, can
be supplied through a combination of modes: i) the professional service provider moving temporarily to the host country to
deliver their services; ii) opening a firm in the host country; iii) cross-border supply e.g. sending documents electronically; or
iv) offering services to a non-resident travelling in the home country of the provider. Intermodal supply is characteristic of
some other sectors, such as Construction services. In that case, there are additional conceptual complications in the
recording of such transactions within the BoP statistics or Foreign Affiliates Trade in Services (FATS) data. In some sectors,
such as Financial services, the supply through a specific mode – commercial presence in this case - is compulsory in some
countries. For Construction services further complications arise from the fact that the BoP definition includes goods and is
limited to construction projects completed within the year. In fact, BoP accounts record both the goods (in terms of
construction material) and services provided by an unincorporated site office carrying out a construction project of duration
of up to one year. However, large-scale construction projects often require several years to complete; in that case, the
works performed by foreign subsidiaries or branches of what the BoP considers resident enterprises, but de facto are non-
resident enterprises and site offices, are excluded from BoP data but will be found in FATS statistics.

October 2015
2
under BoP particularly difficult. Additional challenges in the collection of international trade in
services data are situations where firms differentiate their products by adding services, resulting in a
bundle of services and goods sold in a single package. This phenomenon, known as the servicification
of manufacturing2, reflects the increasing amount of service content – whether sourced in-house or
externally – that manufacturing firms are incorporating in their production cycle to respond to the
increasing competitive pressures from local or foreign providers.
6. The limited data availability and some internal inconsistencies of trade in services data call for
the need of supplementary techniques, such as gravity estimations and optimisation procedures, to
achieve a comprehensive and consistent matrix of bilateral services trade flows by industry.
1. Data source and country, sector and time coverage
7. The construction of the EBTSI begins with the OECD-WTO TiS Database, which compiles total
trade in services and bilateral trade in services data from the OECD Trade in Services by Partner
Country (TISP) dataset and the WTO Trade in Services dataset.
8. The data originate from primary sources, such as national statistical offices, or secondary
compilers, such as EUROSTAT, IMF and UN as well as Regional Banks and Commissions (ASEAN,
ECLAC, BCEAO, ECCB). In addition to the data directly provided by these institutions, the OECD-WTO
TiS database includes also some initial estimates for missing trade flows as detailed in Box 1.
Box 1. Estimates in the OECD-WTO Trade in Services dataset
The OECD-WTO joint dataset on international trade in services (July 2014 version) contains about 30,000
estimated or adjusted data points. About 18,000 of these relate to the conversion of EBOPS 2010 data to EBOPS
2002 – either carried out directly or based on the shares of bilateral partners. However, for about 400 data points
the conversion was approximate, for example when negative values were present, or if a break in series occurred
(e.g. when countries have used the change to BPM6 to implement other methodological changes such as
increased coverage).
The remaining estimates and adjustments include 3,250 corrections to Eurostat data. This type of estimate occurs
when items can be derived from existing Eurostat data by a simple subtraction. An additional 1,500 estimates
were derived from Eurostat data using simple calculations, such aggregation of items to obtain commercial
services figures and, for more recent years, annualised quarterly data from Eurostat. Similar types of simple
calculations (aggregation of items, or the derivation by subtraction) were also carried out on UNSD data, creating
about 5,500 estimates. Finally, a further 1,800 estimates were derived by adjusting national data when e.g.
bilateral breakdowns were not entirely consistent with world totals or when breaks in series were present.
For additional information on the OECD-WTO TiS dataset, see OECD (2015).
2. See National Board of Trade (2010) and, National Board of Trade (2012).

October 2015
3
9. Overall, the OECD-WTO TiS Database contains trade in services data from 1995 to most recent
years, for 240 reporting economies (52 of which report bilateral trade flows) classified according to
the Extended Balance of Payments Services (EBOPS) 2002 classification – a disaggregated version of
the fifth edition of the IMF Balance of Payment Manual (BPM5) classification.3
10. The database reports trade flows in USD millions and covers both total bilateral trade in services
(EBOPS 2002, code 200) and trade in services according to the following EBOPS 2002 service
categories4: Transportation services (EBOPS 2002, code 205), Travel services (EBOPS 2002, code 236),
Communications services (EBOPS 2002, code 245), Construction services (EBOPS 2002, code 249),
Insurance services (EBOPS 2002, code 253), Financial services (EBOPS 2002, code 260), Computer and
information services (EBOPS 2002, code 262), Royalties and license fees (EBOPS 2002, code 266),
Other business services (EBOPS 2002, code 268), Personal, cultural and recreational services (EBOPS
2002, code 287), and Government services not included elsewhere, n.i.e. (EBOPS 2002, code 291).
While bilateral trade data are only provided for the 11 services components, total trade in services
flows are available on a more detailed breakdown in a number of areas.
11. The availability of trade in services statistics has improved over recent years, for both the sectoral
and partner dimensions. However, most bilateral trade in services flows remain unreported. Table 1
summarises the availability of bilateral services export in ICIO target economies with respect to all
ICIO partners except Rest of the world. For each reporting country, the percentages indicate the
average number of available bilateral export flows out of all possible bilateral trade combinations
over the ICIO sample period 1995, 2000, 2005 and 2008 to 2011.
3. A first version of the EBOPS classification (EBOPS 2002), as proposed by the Interagency Task Force of Statistics of
International Trade in Services (EU, IMF, OECD, UN, UNCTAD and WTO), is described in details in the Manual on Statistics of
International Trade in Services (MSITS 2002). The EBOPS 2002 classification distinguishes 11 main services categories,
corresponding to the 11 major services components of the BPM5, and more disaggregated components under these 11
categories. A detailed presentation of the EBOPS 2002 classification is found in Annex II of the MSITS 2002, available at the
following address: http://unstats.un.org/unsd/tradekb/Attachment358.aspx.
4. Some countries, such as Australia, Canada, Chile and Russia, have started to collect and report international trade in
services data according to the more recent edition of the EBOPS classification, namely EBOPS 2010. However, to ensure
cross-country comparability and increase country coverage, trade flows provided in EBOPS 2010 have been converted to
EBOPS 2002. The conversion is also necessary as the EBOPS 2002 classification is more closely aligned with ISIC Rev. 3.1, the
industry classification used by the OECD ICIO model.

October 2015
4
Table 1. Availability of bilateral trade in services for ICIO target economies – average over selected years
Source : OECD-WTO TiS dataset, 2014.
Note : The allocation of countries is based on the data availability of all bilateral export flows, that is both bilateral total services (EBOPS 200) and bilateral sectoral data, over the ICIO sample period: 1995, 2000, 2005, and from 2008 to 2011. Percentages in parentheses provide additional information on the data availability of bilateral export flows at the sectorial level.
12. Table 1 reveals that coverage of bilateral trade in services is very limited, with the best coverage
concentrated in European countries. Relatively high coverage ratios (above 75%) are apparent in only
one sixth of the countries considered. At the other end of the spectrum, there are ICIO economies
where bilateral trade in services data are absent and where estimates need to be made in EBTSI.
2. Unallocated trade in services data
13. As discussed above, data availability at the bilateral level is sparse or virtually non-existent for
some ICIO economies, representing a large geographical share of unallocated trade. Figure 1
illustrates how the percentage of geographically unallocated bilateral export flows for total services
has evolved over time and in most cases has decreased. Many countries have filled gaps by allocating
their services export (or import) flows to their major trading partners, reflecting continuous efforts in
collecting better bilateral trade statistics. For instance, many of the eastern European countries that
joined the European Union in the last decade moved from very large shares of unallocated trade in
the mid-nineties to increasingly better coverage ratios in recent years. Nevertheless, there are still
many economies for which the allocation of trade flows across any of their trading partners is still
lacking.
Above 75% Betw een 50% and 75% Betw een 25% and 50% Betw een 0% and 25% No bilateral f low s
FIN (74%) HRV (59%) KOR (28%) MEX (0.3%) ARG (0%)
LUX (75%) LTU (60%) USA (28%) CHN (1%) BRN (0%)
DNK (75%) BGR (60%) ISR (30%) CHL (4%) CHE (0%)
FRA (76%) ROU (61%) HKG (32%) SGP (7%) COL (0%)
ITA (76%) POL (63%) MLT (32%) TUR (10%) CRI (0%)
NLD (77%) EST (64%) AUS (40%) TUN (12%) IDN (0%)
DEU (79%) IRL (64%) NOR (42%) BRA (14%) IND (0%)
SVN (82%) SVK (64%) JPN (43%) NZL (16%) KHM (0%)
AUT (83%) GBR (66%) CYP (47%) CAN (16%) MYS (0%)
BEL (90%) LVA (66%) ISL (19%) PHL (0%)
RUS (69%) PRT (21%) SAU (0%)
GRC (71%) THA (0%)
ESP (71%) TWN (0%)
HUN (72%) VNM (0%)
CZE (72%) ZAF (0%)
SWE (72%)

October 2015
5
Figure 1. Geographically unallocated trade at the aggregate total service level (EBOPS 200)
Percentage of unallocated bilateral export flows in selected years
Source : OECD/WTO TiS dataset, 2014.
14. The availability of bilateral trade by type of service has also improved over time. Figure 2 shows
how the average (across all reporting economies) of geographically unallocated bilateral export
flows, by services category, has changed from 1995 to 2011. While all sectors have reduced the
percentage of unallocated trade to some extent over the last fifteen years, the Transportation and
Travel services categories stand out as the two main categories that have seen wider geographical
coverage.
0%
10%
20%
30%
40%
50%
60%
70%
80%
90%
100%
AR
GA
US
AU
TB
ELB
GR
BR
AB
RN
CA
NC
HE
CH
LC
HN
CO
LC
RI
CYP CZE
DEU
DN
KES
PES
TFI
NFR
AG
BR
GR
CH
KG
HR
VH
UN
IDN
IND
IRL
ISL
ISR
ITA
JPN
KH
MK
OR
LTU
LUX
LVA
MEX
MLT
MYS
NLD
NO
RN
ZLP
HL
PO
LP
RT
RO
UR
US
SAU
SGP
SVK
SVN
SWE
THA
TUN
TUR
TWN
USA
VN
MZA
F
1995 2005 2011

October 2015
6
Figure 2. Geographically unallocated trade by main EBOPS 2002 services category
Average percentage of unallocated bilateral export flows by service sector
Source : OECD/WTO TiS dataset, 2014.
15. Nevertheless, despite increases in coverage, reported bilateral trade in services data are still
prone to a range of inconsistencies. For example, for a given bilateral flow, either country may not
report trade flows across all services sectors because of confidentiality or because such information
is simply not available – resulting in unallocated trade at the sectoral level. Also, the sum of reported
trade flows across all eleven services categories may not match reported total trade. This type of
inconsistency can be attributed to confidentiality issues at the sectoral level or, in some cases, to
possible mis-measurement. In few exceptional cases, the sum of the sectoral flows may also exceed
the reported total trade.5
5. One possible explanation for this type of inconsistency is related to the presence of negative trade flows at the sectoral
level – this can occur for insurance and other business services - as explained in more detail in part 3.
0% 20% 40% 60% 80% 100%
Travel
Transport
Computer and Information
Other business services
Royalties and licence fees
Finance
Insurance
Personal, cultural & recreational services
Communication
Construction
Gov.t services n.i.e.
1995 2011

October 2015
7
3. Data adjustments
3.1 Additional data
16. To increase coverage, the OECD-WTO TiS database is complemented with additional data from
the UN Trade in services database. Moreover, in cases where total bilateral trade flows are not
available, but more than half the sectoral trade flows are reported, the sum of sectoral flows is used
as a proxy for the total bilateral trade flow.
3.2 Negative trade flows
17. Negative flows of services trade are sometimes reported; this happens mostly, but not
exclusively, for specific services components such as Insurance services (EBOPS 2002, code 253)6 and
Other business services (EBOPS 2002, code 268)7. Although few country-pairs report negative trade
flows (both at the bilateral and at the total trade level), the cumulative impact of these negative
flows might not be negligible, in some cases accounting for up to 10% of a reporting country’s total
trade in services.8 These negative trade flows are initially set to missing and subsequently replaced by
either mirror flows or estimates.
3.3 Zero trade flows
18. Many trade in services flows are reported as zero9. Naturally, not all countries trade in all types of
services with all countries. However, the presence of zero trade flows might also be explained by
data reporting thresholds, which vary considerably from country to country; different approaches to
estimating or compiling trade in services data – including the rounding of small trade flows; and the
difficulties in measuring and allocating international services transactions, resulting in potential mis-
classification and erroneous imputation of zero trade flows when the flow is actually just missing.
Zero trade flows, as negative flows, are temporarily set to missing and replaced by mirror statistics or
6. International trade flows of Insurance services are valued, according to MSITIS 2002 principles, as the services charges
included in total premiums earned rather than by the total value of the premiums themselves, and thus negative flows can
occur when the claims are far larger than the premiums received. For instance, a resident firm specialised in providing
international freight insurance services may record a negative export flow if it provides insurance services to non-residents
for which it earns less premiums than the claims payable on the goods lost or destroyed in transit.
7. Negative trade flows are also very frequent in Other business services and mainly related to Merchanting services (EBOPS
2002, codes 268 and 270, respectively). Merchanting transactions arise when a good is purchased by a resident of the
compiling economy from a non-resident and subsequently sold to another non-resident. If the goods are re-sold for less
than the original cost of purchase – that is, the merchant makes a loss on the sale – then a negative export of merchanting
services would be recorded under MSTIS 2002.
8. For example, in Japan the sum of all negative bilateral export flows in total exports of services was about 10% in 2008;
similar high shares are also apparent in France and the Czech Republic.
9. The presence of zero trade flows is a widely known problem in the trade empirical literature and failing to account for
their presence can have severe consequences for the interpretation of trade model estimates.

October 2015
8
data estimates in the subsequent steps of the process, unless the corresponding “gravity estimates”
suggests that these zeros are plausible from an economic point of view.
3.4 Merchanting
19. Merchanting services arise when a resident of a compiling economy purchases a good from a
non-resident and subsequently sells it to another non-resident with the good never entering or
leaving the compiling economy. In BPM5, the difference between the value of the good when
purchased and the value when sold is recorded as the value of Merchanting services (EBOPS 2002,
code 270).
20. The recording of merchanting services might result in structural asymmetries as merchanting
services are recorded as export flows only in the economy where the merchant is resident - hence
there are no matching import flows. Moreover, speculative gains or losses realised from transactions
in commodity arbitrage are also recorded under merchanting services; however, since these are
valuation changes of the merchant’s assets (inventories), they should not be included in the services
statistics.
21. For these and other reasons10, Merchanting services transactions have been removed from its
parent category Other business services (EBOPS 2002, code 268) and the total bilateral services
exports (EBOPS 2002, code 200). The revised treatment of merchanting in the 2008 SNA and BPM6
(corresponding to EBOPS 2010 classification) will solve some of the inconsistencies in BMP5
recording of merchanting transactions as merchanting of goods is reclassified from services to goods.
While we can correct for merchanting transactions when countries provide data for merchanting
services, there are countries for which such data are not available. In such cases, only the
optimisation and reconciliation of exports and imports provide a fix.
3.5 Removing goods from trade in services data
22. For practical measurement reasons, international trade in services between residents and non-
residents also includes some trade in goods. For instance, the Travel services category in the BoP
accounts covers both the goods and services acquired for personal use by non-resident travellers
during visits of less than one year in host countries.11 For some countries, the non-resident
expenditures on goods and services can be retrieved from the national accounts and, in such cases,
the share of expenditures on goods is used to adjust the BoP data. When this information is not
10. In addition to the recording of merchanting transactions being asymmetrical and inconsistent with inventories data and
balance sheets for both the merchant and the supplier, the valuation principle used does not align with those used in the
compilation of the supply and use tables (UNECE, 2011).
11. Besides Travel services, other sectors, such as Construction services and Government services n.i.e., also include a wide
range of goods that may be traded or consumed by non-residents; the separation between goods and services in these
sectors is, however, complicated by the lack of supplementary data that could be exploited to disentangle transactions on
goods from those on services.
October 2015
9
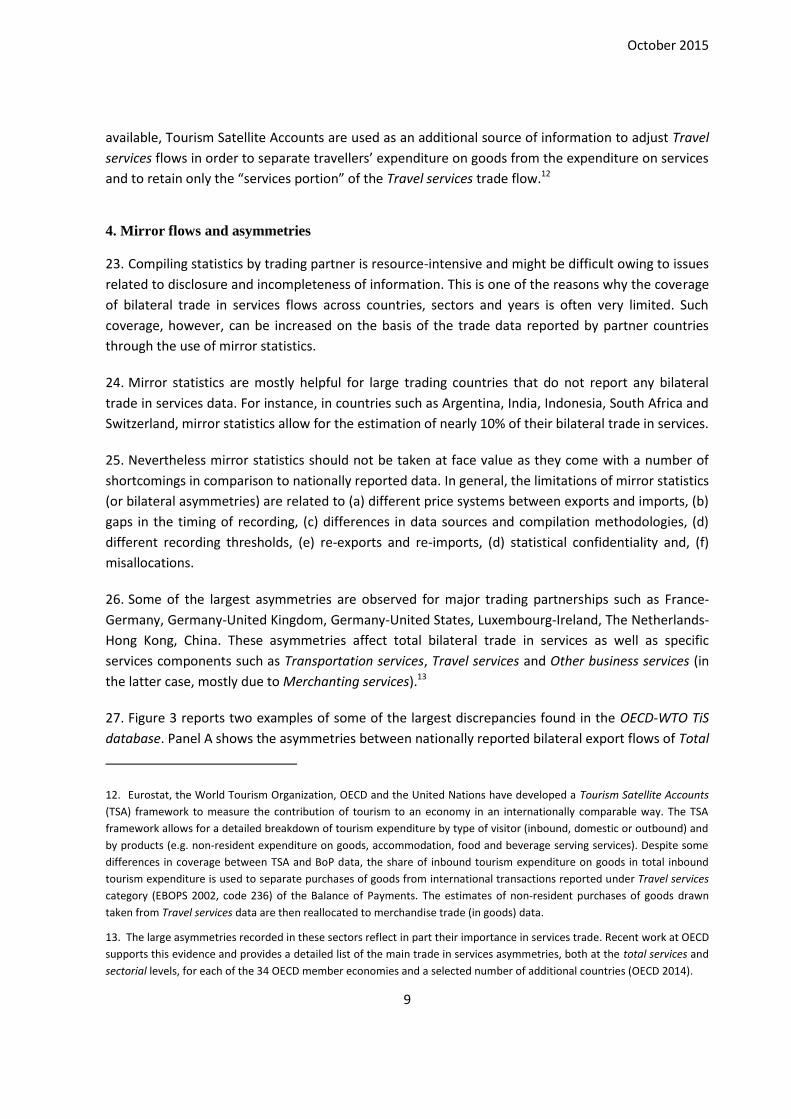
available, Tourism Satellite Accounts are used as an additional source of information to adjust Travel
services flows in order to separate travellers’ expenditure on goods from the expenditure on services
and to retain only the “services portion” of the Travel services trade flow.12
4. Mirror flows and asymmetries
23. Compiling statistics by trading partner is resource-intensive and might be difficult owing to issues
related to disclosure and incompleteness of information. This is one of the reasons why the coverage
of bilateral trade in services flows across countries, sectors and years is often very limited. Such
coverage, however, can be increased on the basis of the trade data reported by partner countries
through the use of mirror statistics.
24. Mirror statistics are mostly helpful for large trading countries that do not report any bilateral
trade in services data. For instance, in countries such as Argentina, India, Indonesia, South Africa and
Switzerland, mirror statistics allow for the estimation of nearly 10% of their bilateral trade in services.
25. Nevertheless mirror statistics should not be taken at face value as they come with a number of
shortcomings in comparison to nationally reported data. In general, the limitations of mirror statistics
(or bilateral asymmetries) are related to (a) different price systems between exports and imports, (b)
gaps in the timing of recording, (c) differences in data sources and compilation methodologies, (d)
different recording thresholds, (e) re-exports and re-imports, (d) statistical confidentiality and, (f)
misallocations.
26. Some of the largest asymmetries are observed for major trading partnerships such as France-
Germany, Germany-United Kingdom, Germany-United States, Luxembourg-Ireland, The Netherlands-
Hong Kong, China. These asymmetries affect total bilateral trade in services as well as specific
services components such as Transportation services, Travel services and Other business services (in
the latter case, mostly due to Merchanting services).13
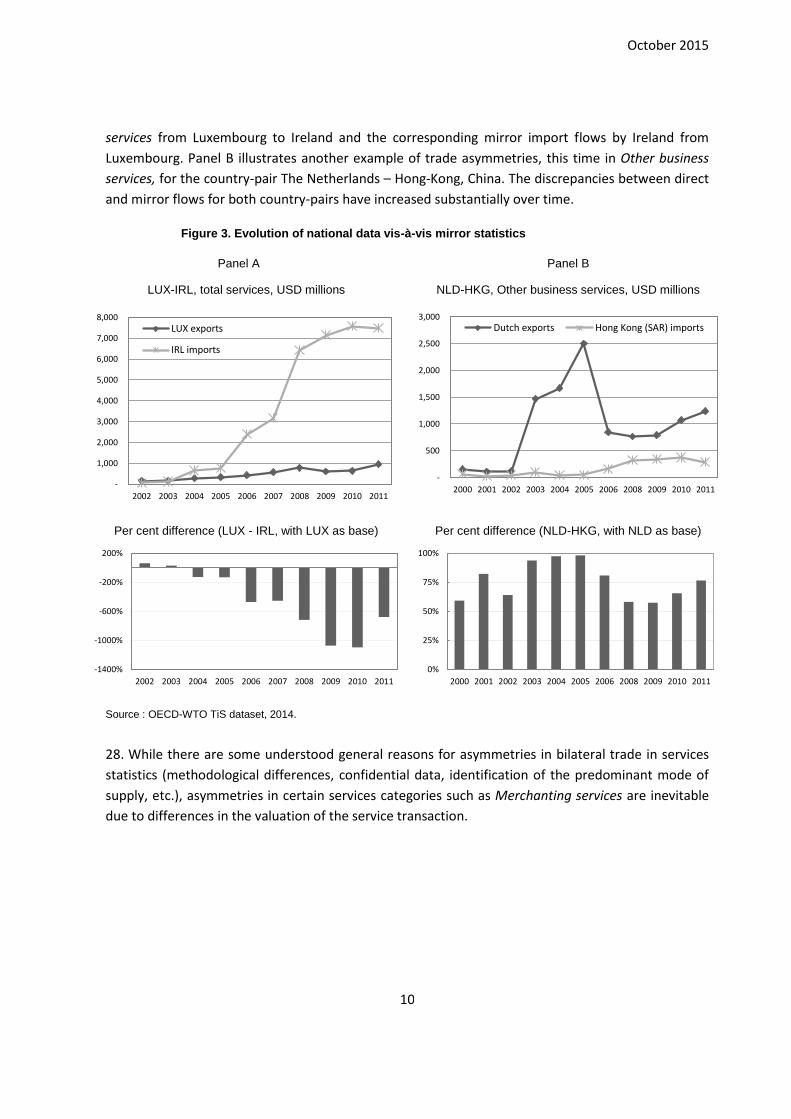
27. Figure 3 reports two examples of some of the largest discrepancies found in the OECD-WTO TiS
database. Panel A shows the asymmetries between nationally reported bilateral export flows of Total
12. Eurostat, the World Tourism Organization, OECD and the United Nations have developed a Tourism Satellite Accounts
(TSA) framework to measure the contribution of tourism to an economy in an internationally comparable way. The TSA
framework allows for a detailed breakdown of tourism expenditure by type of visitor (inbound, domestic or outbound) and
by products (e.g. non-resident expenditure on goods, accommodation, food and beverage serving services). Despite some
differences in coverage between TSA and BoP data, the share of inbound tourism expenditure on goods in total inbound
tourism expenditure is used to separate purchases of goods from international transactions reported under Travel services
category (EBOPS 2002, code 236) of the Balance of Payments. The estimates of non-resident purchases of goods drawn
taken from Travel services data are then reallocated to merchandise trade (in goods) data.
13. The large asymmetries recorded in these sectors reflect in part their importance in services trade. Recent work at OECD
supports this evidence and provides a detailed list of the main trade in services asymmetries, both at the total services and
sectorial levels, for each of the 34 OECD member economies and a selected number of additional countries (OECD 2014).
October 2015
10
services from Luxembourg to Ireland and the corresponding mirror import flows by Ireland from
Luxembourg. Panel B illustrates another example of trade asymmetries, this time in Other business
services, for the country-pair The Netherlands – Hong-Kong, China. The discrepancies between direct
and mirror flows for both country-pairs have increased substantially over time.
Figure 3. Evolution of national data vis-à-vis mirror statistics
Panel A Panel B
LUX-IRL, total services, USD millions NLD-HKG, Other business services, USD millions
Per cent difference (LUX - IRL, with LUX as base) Per cent difference (NLD-HKG, with NLD as base)
Source : OECD-WTO TiS dataset, 2014.
28. While there are some understood general reasons for asymmetries in bilateral trade in services
statistics (methodological differences, confidential data, identification of the predominant mode of
supply, etc.), asymmetries in certain services categories such as Merchanting services are inevitable
due to differences in the valuation of the service transaction.
-
1,000
2,000
3,000
4,000
5,000
6,000
7,000
8,000
2002 2003 2004 2005 2006 2007 2008 2009 2010 2011
LUX exports
IRL imports
-
500
1,000
1,500
2,000
2,500
3,000
2000 2001 2002 2003 2004 2005 2006 2008 2009 2010 2011
Dutch exports Hong Kong (SAR) imports
-1400%
-1000%
-600%
-200%
200%
2002 2003 2004 2005 2006 2007 2008 2009 2010 2011
0%
25%
50%
75%
100%
2000 2001 2002 2003 2004 2005 2006 2008 2009 2010 2011
October 2015
11
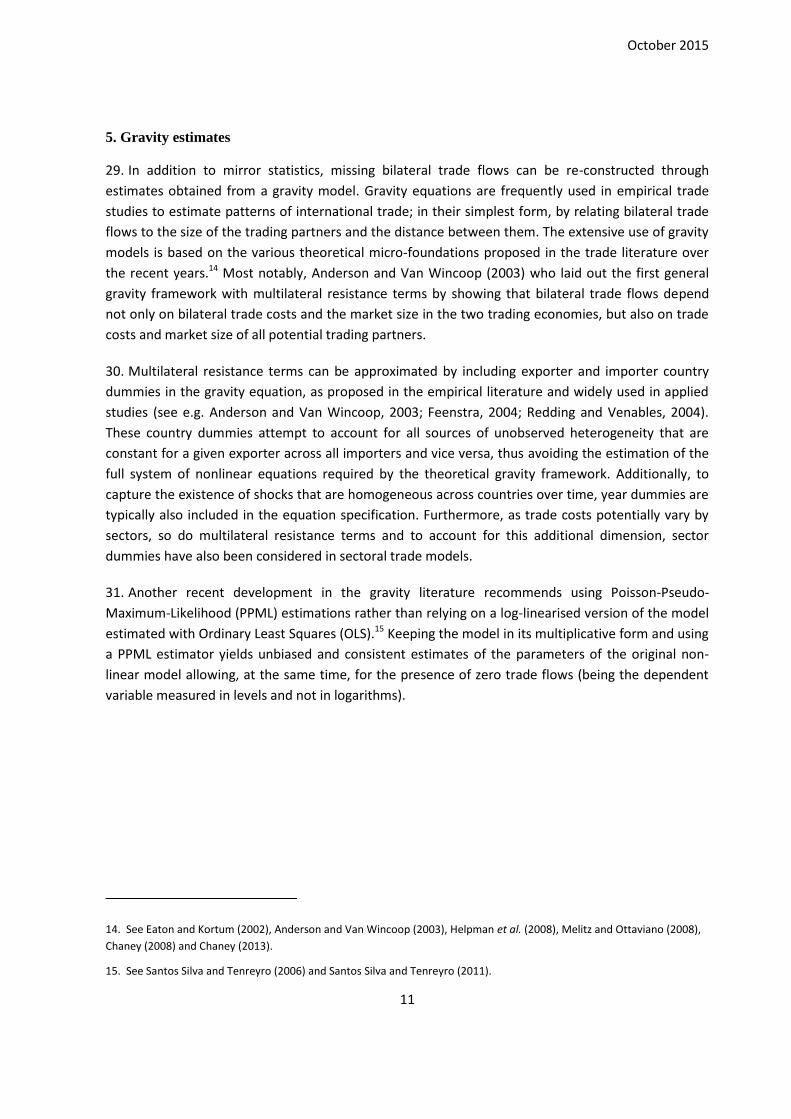
5. Gravity estimates
29. In addition to mirror statistics, missing bilateral trade flows can be re-constructed through
estimates obtained from a gravity model. Gravity equations are frequently used in empirical trade
studies to estimate patterns of international trade; in their simplest form, by relating bilateral trade
flows to the size of the trading partners and the distance between them. The extensive use of gravity
models is based on the various theoretical micro-foundations proposed in the trade literature over
the recent years.14 Most notably, Anderson and Van Wincoop (2003) who laid out the first general
gravity framework with multilateral resistance terms by showing that bilateral trade flows depend
not only on bilateral trade costs and the market size in the two trading economies, but also on trade
costs and market size of all potential trading partners.
30. Multilateral resistance terms can be approximated by including exporter and importer country
dummies in the gravity equation, as proposed in the empirical literature and widely used in applied
studies (see e.g. Anderson and Van Wincoop, 2003; Feenstra, 2004; Redding and Venables, 2004).
These country dummies attempt to account for all sources of unobserved heterogeneity that are
constant for a given exporter across all importers and vice versa, thus avoiding the estimation of the
full system of nonlinear equations required by the theoretical gravity framework. Additionally, to
capture the existence of shocks that are homogeneous across countries over time, year dummies are
typically also included in the equation specification. Furthermore, as trade costs potentially vary by
sectors, so do multilateral resistance terms and to account for this additional dimension, sector
dummies have also been considered in sectoral trade models.
31. Another recent development in the gravity literature recommends using Poisson-Pseudo-
Maximum-Likelihood (PPML) estimations rather than relying on a log-linearised version of the model
estimated with Ordinary Least Squares (OLS).15 Keeping the model in its multiplicative form and using
a PPML estimator yields unbiased and consistent estimates of the parameters of the original non-
linear model allowing, at the same time, for the presence of zero trade flows (being the dependent
variable measured in levels and not in logarithms).
14. See Eaton and Kortum (2002), Anderson and Van Wincoop (2003), Helpman et al. (2008), Melitz and Ottaviano (2008),
Chaney (2008) and Chaney (2013).
15. See Santos Silva and Tenreyro (2006) and Santos Silva and Tenreyro (2011).

October 2015
12
The equation specification of the gravity model using available data is the following:
𝑋𝑖𝑗𝑘𝑡 = exp(𝛽0 +𝛽1log(𝐺𝐷𝑃𝑖𝑡) +𝛽2log(𝐺𝐷𝑃𝑗𝑡) +𝛽3log(𝐷𝐼𝑆𝑇𝑖𝑗) + 𝛽4𝐶𝑂𝑁𝑇𝐼𝐺𝑖𝑗 +𝛽5𝐶𝑂𝑀𝐿𝐴𝑁𝐺𝑖𝑗 +
𝛽6𝐶𝑂𝐿45𝑖𝑗 +𝛽7𝐷𝑖 +𝛽8𝐷𝑗 +𝛽9𝐷𝑡 +𝛽10𝐷𝑘 + 𝜀𝑖𝑗𝑘𝑡)
32. The dependent variable is bilateral trade flows (either exports or imports) measured in gross
terms. Subscripts i, j, k and t indicate the source, destination, sector and year respectively. Among
the explanatory variables, the second and third terms represent the logarithm of the Gross Domestic
Product (GDP) of the exporter and importer country respectively if the dependent variable is bilateral
exports (and vice versa if the dependent is bilateral imports). These two variables should be a proxy
of the market size of the trading partners. The fourth term is the logarithm of the bilateral distance
(DIST) between the trading partners while CONTIG is a dummy equal to one if there is a shared
common border and zero otherwise. COMLANG is a dummy equal to one if two trading partners
share a common official language and COL45 a dummy which is equal to one if they have been in a
colonial relationship after 1945. D is an exhaustive set of dummies in the indicated dimension.
33. The gravity analysis is carried out on an unbalanced panel of 74 reporting economies with
bilateral trade services flows, both at the sectoral level and at the total services level, spanning the
period 1995 to 2011. Among the explanatory variables, GDP figures (in USD millions, current prices)
are taken from the World Bank’s World Development Indicators (WDI), while the set of control
variables reflecting geographical and cultural differences, such as bilateral distance, contiguity,
common language and colonial ties, are sourced from the CEPII gravity dataset. The equation
specification above is estimated with a Poisson pseudo-maximum likelihood estimator using a robust
covariance matrix for both trade flows (exports and imports, separately) on a pooled sample of 11
EBOPS 2002 sectorial services trade flows as well as on the total services flows.16 The results are
presented in Table 2 with the first two columns reporting the estimates of the regressions run on the
pooled sample, and the last two referring to the results of the regressions run on the bilateral total
services trade flows.
16. Robustness checks addressing recent concerns emerging in the gravity literature on the convergence problems of the
STATA Poisson command are taken into account by using alternative algorithms such as the PPML estimation algorithm and
the Guimaraes and Portugal (2010) iterative algorithm for high dimensional fixed effects (Poi2HDFE). Such estimators are
used to estimate bilateral total services trade, producing almost identical results (correlation indices between the
Poisson/Ppml and the Poi2HDFE are around 0.8). Nevertheless, the gravity estimates obtained at this stage are subject to a
series of additional transformations in the various subsequent stages, involving their rescaling to SNA total trade,
subsequently optimised to match given industry targets.
October 2015
13
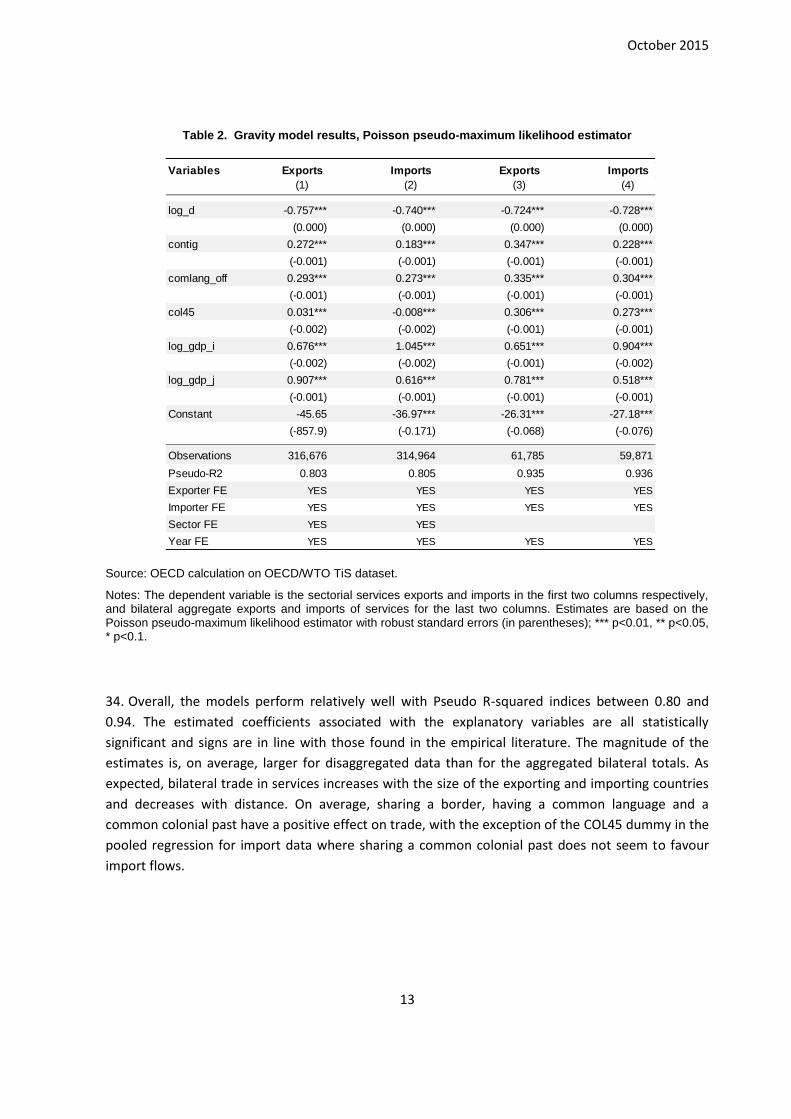
Table 2. Gravity model results, Poisson pseudo-maximum likelihood estimator
Source: OECD calculation on OECD/WTO TiS dataset.
Notes: The dependent variable is the sectorial services exports and imports in the first two columns respectively, and bilateral aggregate exports and imports of services for the last two columns. Estimates are based on the Poisson pseudo-maximum likelihood estimator with robust standard errors (in parentheses); *** p<0.01, ** p<0.05, * p<0.1.
34. Overall, the models perform relatively well with Pseudo R-squared indices between 0.80 and
0.94. The estimated coefficients associated with the explanatory variables are all statistically
significant and signs are in line with those found in the empirical literature. The magnitude of the
estimates is, on average, larger for disaggregated data than for the aggregated bilateral totals. As
expected, bilateral trade in services increases with the size of the exporting and importing countries
and decreases with distance. On average, sharing a border, having a common language and a
common colonial past have a positive effect on trade, with the exception of the COL45 dummy in the
pooled regression for import data where sharing a common colonial past does not seem to favour
import flows.
Variables Exports Imports Exports Imports
(1) (2) (3) (4)
log_d -0.757*** -0.740*** -0.724*** -0.728***
(0.000) (0.000) (0.000) (0.000)
contig 0.272*** 0.183*** 0.347*** 0.228***
(-0.001) (-0.001) (-0.001) (-0.001)
comlang_off 0.293*** 0.273*** 0.335*** 0.304***
(-0.001) (-0.001) (-0.001) (-0.001)
col45 0.031*** -0.008*** 0.306*** 0.273***
(-0.002) (-0.002) (-0.001) (-0.001)
log_gdp_i 0.676*** 1.045*** 0.651*** 0.904***
(-0.002) (-0.002) (-0.001) (-0.002)
log_gdp_j 0.907*** 0.616*** 0.781*** 0.518***
(-0.001) (-0.001) (-0.001) (-0.001)
Constant -45.65 -36.97*** -26.31*** -27.18***
(-857.9) (-0.171) (-0.068) (-0.076)
Observations 316,676 314,964 61,785 59,871
Pseudo-R2 0.803 0.805 0.935 0.936
Exporter FE YES YES YES YES
Importer FE YES YES YES YES
Sector FE YES YES
Year FE YES YES YES YES

October 2015
14
6. Filling the gaps in the data and first stage of the optimisation (EBOPS 2002, code 200)
35. In order to create a full and consistent dataset of bilateral trade in services by industry, we start
with the OECD-WTO TiS dataset for total bilateral trade (EBOPS 2002, code 200 – EBOPS 200
hereafter) and fill the gaps for both exports and imports with three different methodologies:
1. Simple interpolation based on the partner share when the data are missing for selected years. In some cases, the data are extrapolated (for the period before or after) but not for more than two years and controlling that there is a reasonable slope.
2. Mirror flows. However, we never mix the mirror flows with existing data from the reporter as there are important asymmetries between reporters and partners. We keep a consistent source for each pair of countries over years.
3. Gravity estimates (for all the remaining gaps). The gravity estimates are not directly introduced as values in the matrix. They are applied as shares to a residual unallocated trade. For example, let assume that country A’s total services exports are 10 billion USD and that 7 billion are allocated to partners. The remaining 3 billion are allocated according to shares derived from the gravity estimates. If there is no residual to be allocated, an extra 10% trade is added to cover the missing partners.
36. The resulting matrix has no missing data but is inconsistent across countries. We use an
optimisation to created balanced trade flows where services exports from one country are equal to
services imports from another. We minimize the square of the difference between the starting
matrix and the new balanced matrix under the constraint of total trade in services being equal for
each country to the SNA total which is used in the ICIO. There is no solution for this optimisation
where the objective is minimised to zero. We always have a discrepancy between the targeted totals
and the resulting totals for EBOPS 200.
37. Once we have this balanced trade matrix for EBOPS 200, we fix the bilateral totals and fill a
second starting matrix this time by EBOPS category. We use the OECD-WTO TiS data rescaled to the
bilateral totals obtained in the first stage of the optimisation. We fill the gaps with the same
methodologies applied to total trade: (1) interpolation/extrapolation of partners’ shares across years,
(2) mirror flows, (3) gravity estimates for the remaining unallocated trade. This matrix by EBOPS
category is then converted to ISIC to obtain trade flows by industry.
7. Conversion from EBOPS 2002 to ISIC Rev. 3.1
38. The conversion from EBOPS 2002 to ISIC Rev. 3.1 is carried out by applying a series of conversion
shares built from the most disaggregated services trade flows available at the sub-category level that
are as close as possible to the corresponding service industry in the ISIC classification. Table 3 below
shows an approximate correspondence table between EBOPS 2002 eleven main services categories
and the corresponding ISIC Rev. 3.1 services industries. The first column details the EBOPS 2002 sub-
category used to construct the conversion shares.

October 2015
15
Table 3. Approximate conversion key between EBOPS 2002 and ISIC Rev. 3.1
Source : OECD estimates.
Notes : The calculation of the shares relies on the most disaggregated bilateral trade flows sourced from OECD-TISP, UN, EUROSTAT and WTO. When possible, missing trade flows at the parent category level are reconstructed from flows at the sub-category level. The conversion shares are then derived as the ratio of the sub-category to its parent category, as described in the first column of Table 3.
39. This approach allows redistributing EBOPS trade flows to the industries of interest, particularly
for those services categories where there is no evident one-to-one correspondence between the two
classifications. This is for instance the case for a generic category such as Other business services
(EBOPS 2002, code 268) that is allocated to several ISIC Rev 3.1 services industries.17 The shares are
calculated at the bilateral level over the entire period considered (with missing years being
interpolated), and subsequently averaged out across all available partners in order to have an
aggregate share by country, industry and year. These shares are then applied to the estimated
bilateral trade flows to convert them into services industries.
17. In the case of Other business services, shares are complemented with information available from supply and use tables.
Share calculation EBOPS 2002 main services categories ISIC Rev. 3.1 services industries at the 2-digit level
1 249 Construction services 45 Construction
269/268 268 Other business services 50t52 Wholesale and retail trade; repairs
1 236 Travel services 55 Hotels and restaurants
1 205 Transportation services 60t63 Transport and storage
1 245 Communication services 64 Post and telecommunications
1 + 1/6*(266) 253+260Financial and Insurance services + Royalties and License
fees65t67 Finance and insurance
284/268 268 Other business services 70 Real estate activities
272/268 268 Other business services 71 Renting of machinery and equipment
263/262 + 1/3*(266) 262 & 266Computer and Information services + Royalties and License
fees72 Computer and related activities
279/268 + 1/3*(266) 268 & 266 Other business services + Royalties and License fees 73 Research and development
(280+281+285)/268
[or (268 - (269+272+274+278+279+284))/268 ]268 Other business services 74 Other Business Activities
1 291 Government services, n. i. e. 75Public admin. and defence; compulsory social
security
895/287 [or 0.75*(287-288)] 287 Personal, cultural and recreational services 80 Education
896/287 [or 0.05*(287-288)] 287 Personal, cultural and recreational services 85 Health and social work
897/287
[or 0.2*(287-288)] + 1/6*(266)287
Personal, cultural and recreational services + Royalties and
License fees90t93 Other community, social and personal services

October 2015
16
40. Most of Travel services (EBOPS 2002, code 236) and part of Personal, cultural and recreational
services (EBOPS 2002, code 287), mainly Education and Health services (EBOPS 2002, codes 985 and
986, respectively), are largely provided through GATS Mode 2 of supply, i.e. consumption abroad.
These services correspond to non-residents expenditure in the domestic economy when associated
with exports flows, and resident expenditure abroad in the case of imports flows18. Such services
flows are removed from total trade in services data and re-allocated to the corresponding categories
of the National accounts definition of households’ final consumption expenditure – whether in the
domestic territory by non-residents or abroad by residents.
8. Final optimisation
41. Once we have a full matrix of bilateral trade in services by industry, we run a final optimisation to
balance the data across countries and industries. The methodology is the same as for total trade in
services, a minimisation of the square of differences. Since exports and imports are already balanced
in the first stage optimisation, we use only exports and express them as shares of world total exports
of services. The constraints in the optimisation are: (1) total world trade in services equal to 1, (2) the
sum of all exports to all partners equal to the share of the country in world exports, (3) the sum of
exports to all partners for one industry is equal to total exports by this industry. The industry targets
come from the ICIO as well as total trade in services for each country (SNA figures).
42. As this was the case with the first stage optimisation, there is an optimal solution to this
optimisation but the minimum for the objective function cannot be zero. The final EBTSI matrix
cannot fully match the industry and country totals of the ICIO and there is a small discrepancy. But
EBTSI is a fully balanced matrix of bilateral services flows at the industry level.
18. This is an approximation as these services can be provided through other modes – e.g. Educational services for instance,
can be provided as Mode 1, in the case of correspondence courses disseminated through the internet, but also as Mode 4,
when a professor decides to teach a module in a foreign university or goes abroad for a workshop/seminar/short-term
training, etc.. The same applies to doctors, nurses, para-medicals and similar personnel providing health services abroad.

October 2015
17
REFERENCES
Anderson, J.E., Van Wincoop, E., (2003). Gravity with gravitas: A solution to the border puzzle.
American Economic Review, 93, 170–192.
Chaney, T. (2008). Distorted gravity: the intensive and extensive margins of international
trade. American Economic Review, 98(4), 1707-1721.
Chaney, T. (2013). The gravity equation in international trade: An explanation. National Bureau of
Economic Research, No. w19285.
Eaton, J., & Kortum, S. (2002). Technology, geography, and trade. Econometrica, 70(5), 1741-1779.
Guimaraes, P., & Portugal, P. (2010). A simple feasible procedure to fit models with high-dimensional
fixed effects. Stata Journal, 10(4), 628.
Helpman, E., Melitz, M. and Rubinstein, Y. (2008). Estimating trade flows: trading with partners and
trading volumes. Quarterly Journal of Economics, 123, 441-487.
Manual on Statistics of International Trade in Services (2002), released by the European Commission,
IMF, OECD, UNCTAD and WTO: www.oecd.org/std/its/2404428.pdf.
Melitz, M. J., & Ottaviano, G. I. (2008). Market size, trade, and productivity. The review of economic
studies, 75(1), 295-316.
National Board of Trade (2010). Servicification of Swedish manufacturing. Kommerskollegium,
Stockholm.
National Board of Trade (2012). Everybody is in Services – The Impact of Servicification in
Manufacturing on Trade and Trade Policy. Kommerskollegium, Stockholm.
OECD (2014), Improving input data into TiVA : an analysis of trade asymmetries, internal document
presented at the Working Party on International Trade in Goods and Services Statistics, OECD, Paris,
March 2014.
OECD (2015), Towards a global matrix of trade in services for TiVA : Progress report, internal
document presented at the Working Party on International Trade in Goods and Services Statistics,
OECD, Paris, March 2015.
Silva, J. S., & Tenreyro, S. (2006). The log of gravity. The Review of Economics and statistics, 88(4),
641-658.
Silva, J. S., & Tenreyro, S. (2011). Further simulation evidence on the performance of the Poisson
pseudo-maximum likelihood estimator. Economics Letters, 112(2), 220-222.
UNECE (2011). The Impact of Globalization on National Accounts, Chapter 6 – Merchanting,
released by the United Nations Economic Commission For Europe, United Nations, New York and
Geneva, 2011.