Embed Size (px)
Citation preview
PREPARED BY NON-US BROKER-DEALER(S): BNP PARIBAS CADIZ SECURITIES (PTY) LTD THIS MATERIAL HAS BEEN APPROVED FOR U.S DISTRIBUTION. ANALYST CERTIFICATION AND IMPORTANT DISCLOSURES CAN BE FOUND AT APPENDIX ON PAGE 50
Estimating betas for JSE-listed companies and indices
The Equity Risk Service
The Equity Risk Service is aimed at bringing up-to-date risk measures and associated statistics of the sector indices and
the stocks listed on the Johannesburg Stock Exchange (JSE).
The Equity Risk Service is based not only on the American and the United Kingdom experience but also on an ongoing
research programme at the University of Cape Town (UCT). Our estimates are based on a price series database
supplied by Johannesburg Stock Exchange Ltd.
What makes our service unique?
Our service differs from others in that we implement two important refinements in our estimation procedure which have
been shown to improve the accuracy of our risk estimates. Firstly, we implement a Bayesian adjustment which takes
account of prior information on betas. Our research has shown that this adjustment improves the predictability of betas
by some 20%. Secondly, and more importantly, we implement a thin-trading correction procedure, known as the “trade-
to-trade” procedure. Our research shows that this procedure removes all the bias in beta estimates caused by thin-
trading.
About the different market proxies
The JSE is unique in the sense that it is composed of two distinctly different types of shares: resources shares and
financial & industrial shares. Investors are often concerned with the behaviour of shares in these markets relative to an
index which characterises these markets separately, rather than relative to an overall market index. For example, many
investors prefer to measure the performance of an industrial share relative to an industrial market index and a gold share
relative to a mining index. In order to accommodate these preferences for each listed share, we have included risk
statistics relative to each share’s characteristic market index and also relative to the overall market index. Logical proxies
for these characteristic markets would be the three secondary component indices of the All Share Index (J203), namely:
§ The Financial and Industrial Index (J250),
§ The Resource Index (J258),
§ The Top-40 Index (J200).
Thus, the accompanying tables give risk statistics for all shares relative to the All Share Index, as well as relative to one
of the above-mentioned secondary indices.
14 JANUARY 2014
QUANTITATIVE RESEARCH
EQUITY RISK SERVICE – Q4 2013
Igor Rodionov [email protected]
+27 11 088 2172
Yashin Gopi [email protected]
+27 11 088 2176
Our research is available on Thomson One, Bloomberg, TheMarkets.com, Factset and on http://eqresearch.bnpparibas.com/index. Please contact your salesperson for
authorisation. Please see the important notice on the back page.

EQUITY RISK SERVICE – Q4 2013 Igor Rodionov
2 BNP PARIBAS 14 JANUARY 2014
CONTENTS The Equity Risk Service ............................................................................................................................................................................. 1
What makes our service unique? ............................................................................................................................................................ 1
About the different market proxies ........................................................................................................................................................ 1
1. Introduction ............................................................................................................................................................................................ 3
2. The basics of risk management .......................................................................................................................................................... 3
3. Use of the service .................................................................................................................................................................................. 7
4. The tables ............................................................................................................................................................................................. 10
4.1 FTSE/JSE All Share Index (J203) as market proxy ....................................................................................................................... 12
4.2 FTSE/JSE Financial & Industrial (J250) as market proxy ............................................................................................................ 22
4.3 FTSE/JSE Resource Index (J258) as market proxy ....................................................................................................................... 31
4.4 FTSE/JSE Top40 (J200) as market proxy ........................................................................................................................................ 35
5. Questions and answers ...................................................................................................................................................................... 41
6. A worked example ............................................................................................................................................................................... 43
7. Literature .............................................................................................................................................................................................. 47
8. Glossary................................................................................................................................................................................................. 48
Acknowledgements ................................................................................................................................................................................. 49

EQUITY RISK SERVICE – Q4 2013 Igor Rodionov
3 BNP PARIBAS 14 JANUARY 2014
1. Introduction
We have come a long way and have learnt a great deal about the estimation of risk
on the stock market over the last decade.
The Equity Risk Service
The Equity Risk Service is aimed at bringing up-to-date risk measures and
associated statistics of the sector indices and the stocks listed on the Johannesburg
Stock Exchange (JSE).
The Equity Risk Service is based not only on the American and the United Kingdom
experience but also on an ongoing research programme at the University of Cape
Town (UCT). Our estimates are based on a price series database supplied by
Johannesburg Stock Exchange Ltd.
What makes our service unique?
Our service differs from others in that we implement two important refinements in our
estimation procedure which have been shown to improve the accuracy of our risk
estimates. Firstly, we implement a Bayesian adjustment which takes account of prior
information on betas. Our research has shown that this adjustment improves the
predictability of betas by some 20%. Secondly, and more importantly, we implement
a thin-trading correction procedure, known as the “trade-to-trade” procedure. Our
research shows that this procedure removes all the bias in beta estimates caused by
thin-trading.
We realise that, due to the increased emphasis on professionalism, most investment
managers no longer doubt the usefulness and the scientific merit of the tools of
Modern Portfolio Theory. However, many investors have been daunted by the myths
that the level of mathematics needed is unmanageable. We thus also include some
explanatory material (in Section 2) showing that the crucial ideas are simple ones
and are free from mathematical complexity.
In Section 3 we expand on these ideas and suggest how the Equity Risk Service
may be used. In Section 4 the risk and associated statistics of listed stocks on the
JSE are tabled. In Section 5 some pertinent questions are answered, in Section 6 we
include a worked example and in Section 7 we refer to some literature on the subject
of systematic risk measurement. We include references to some of our own
publications in this area.
The Equity Risk Service is aimed at
bringing up-to-date risk measures
and associated statistics.
Our service differs from others in that
we implement two important
refinements, mainly a Bayesian
adjustment and thin-trading
correction.

EQUITY RISK SERVICE – Q4 2013 Igor Rodionov
4 BNP PARIBAS 14 JANUARY 2014
2. The basics of risk management
The major challenge facing investors has always been the maximisation of their
wealth in a world of uncertainty. In the finance world, the level of uncertainty, or risk,
of a share has become associated with the degree to which the share price “bounces
around” or fluctuates. The more variable the company’s share price, the more risky
the share.
To get a better picture of the notion of risk, consider the chart at the end of this
section (Exhibit 1) which demonstrates the variability of Gold Fields, a ‘high-risk’ gold
share, and Woolworths, a ‘low-risk’ stores share. Exhibit 1 charts their monthly prices
since 2000.
EXHIBIT 1: Prices (2000-2013)
Sources: I-Net Station; BNP Paribas Cadiz Securities
We can also attach a quantitative measure of the risk of a share by measuring its
variability. We do this by computing the standard deviation of the percentage price
changes (percentage returns). The standard deviations are a widely accepted
statistical measure of a share’s total risk. The higher the standard deviation, the
riskier the share. (These measures are found of both the Index Statistics and the
Security Statistics tables in Section 4.) We see, as expected, that Gold Fields had a
standard deviation of 38.1% over this entire period while Woolworths had a standard
deviation of only 28.8% over the same period.
It is important to note that a company’s total risk can be split into two parts, namely,
market risk and unique risk. Market/systematic risk reflects the fluctuations which are
linked to factors which affect the market as a whole (e.g. political events and interest
rate changes). Unique/non-systematic risk reflects the fluctuations which are linked
to events which are unique to the company (e.g. bad management and worker
strikes).
Market/systematic risk
All share prices are driven to some extent by market forces, some more than others.
Beta measures the sensitivity of a share price to movements of the market as a
whole.
A share with a beta of 1.5 will move, on average, 15% for each 10% move of the
market. Generally such a share would prove aggressive, performing well in bull
markets and poorly in bear markets. On the other hand, a share with a beta of 0.5
will move, on average, only 5% for every 10% move of the market. Generally, such a
share would prove to be defensive, under-performing the market index in bull
markets, but doing well, relative to other shares, in bear markets. Finally, a share
0
2000
4000
6000
8000
10000
12000
14000
16000
18000
00 01 02 03 04 05 06 07 08 09 10 11 12 13
Price (c)
Gold Fields Woolworths
The major challenge facing investors
has always been the maximisation of
their wealth in a world of uncertainty.
A company’s total risk can be split
into two parts, namely, market risk
and unique risk.
Beta measures the sensitivity of a
share price to movements of the
market as a whole.

EQUITY RISK SERVICE – Q4 2013 Igor Rodionov
5 BNP PARIBAS 14 JANUARY 2014
with a beta of 1 will, on average, move in line with the market. We can determine
what proportion of a share’s total risk is attributable to market risk by using the R2
statistic. R2 tells us the proportion of a share’s total risk which is attributable to
market movements.
Unique/unsystematic risk
Unexpected price movements (those which are not market driven) are a result of a
share’s unique risk. We can also determine the proportion of a share’s total risk
which is unique risk by using the R2 statistic. Where R
2 tells us the proportion of a
share’s total risk which is attributable to market movements, 1- R2 tells us the
proportion of a share’s total risk which is not attributable to market movements but
rather to factors which are unique to the company.
Why the distinction?
Firstly, the Capital Asset Pricing Model (CAPM) advocates that investors should not
expect to be compensated (expect more profit) for taking on unique risk, but they can
expect to receive higher returns for taking on market risk.
This makes sense as most of us are concerned with holding a portfolio of
investments rather than one individual share. The major reason for holding portfolios
is an intuitive one – we don’t want to put all our eggs in one basket. Put simply, if
portfolios are diversified, the unique risks of individual shares tend to cancel each
other out.
For example, while Gold Fields shares had periods of decline since 2000,
Woolworths shares increased in value over the same period. If we had been holding
a portfolio of both shares, the bad news of Gold Fields would largely have been
cancelled by the good news of Woolworths success and so we would have
diversified some of the unique risk of Gold Fields away.
This reduction in unique risk is precisely what diversification is all about. In fact, a
portfolio consisting of an investment divided equally between almost any 10 listed
companies will have eliminated over 80% of the unique risk of the portfolio.
And so our evidence is consistent with intuition – if we are not forced to take on
unique risk (since it can be eliminated by diversification), then why should we be
rewarded for it? However, no matter how much we diversify, we cannot eliminate
market risk. We cannot escape the economy-wide perils that affect the entire market
– each share in our portfolio will respond to the news affecting the economy as a
whole.
The market risk of your portfolio can be determined by computing the weighted
average of the betas of the component shares of your portfolio. This is precisely why
beta is such an important tool to professional investment management. Unique risk
can easily be diversified away; leaving the beta of a well-diversified portfolio to tell
you all there is to know about the portfolio’s risk.
The second reason why it is important to know the difference between market risk
and unique risk concerns the way people approach investment analysis. Some
investors are skilled at predicting which way the market will be moving, others
attempt to identify which sectors they should be in, and perhaps analyse particular
shares. Your skills in these areas are inextricably linked to the two components of
total risk and have important implications for the composition of the portfolios you
should hold. In order to capitalise on any skills you may have in forecasting the
market, you will need to be concerned about shifting the beta of your portfolio –
increasing it when you predict a market rise and vice versa. That is, you will be
altering the market risk exposure of your portfolio. On the other hand, if you are
skilled at selecting sectors and shares, or have some information that the rest of the
market does not, you may need to take on some unique risk.
Unexpected share movements, which
are not market driven are a result of
share’s unique risk.

EQUITY RISK SERVICE – Q4 2013 Igor Rodionov
6 BNP PARIBAS 14 JANUARY 2014
In summary, it is worth mentioning that, measured over long periods of time, high
beta shares have given the highest returns. However, we emphasise “over long
periods of time”: clearly, during bear markets, high beta shares are the worst
performers. While many investors may be seeking high returns from high beta
shares, there is absolutely no guarantee that they will be attained. That is why beta is
referred to as a measure of risk – high beta shares are genuinely more risky than low
beta shares.

EQUITY RISK SERVICE – Q4 2013 Igor Rodionov
7 BNP PARIBAS 14 JANUARY 2014
3. Use of the service
The ERS is not about prescribing to you what shares you should buy, its aim is to
supply back-up information to the astute investor or portfolio manager so that they
may make sound, professional investment decisions. Below we offer some ideas on
how risk measures can be used. These ideas by no means cover all the uses as
there exist a multitude of specific financial models which require these parameters.
Determining and monitoring your portfolio’s risk level
The biggest concern of investment managers is that they get caught with a so-called
balanced portfolio which “takes a dive” during a market recession, or a so-called
growth fund which returns only 10% when the market goes up 20%. Whether you are
a private investor or a professional portfolio manager, you need to know how much
risk your portfolio is exposed to and how to monitor the risk over time.
Calculating your portfolio’s risk
By now it should be clear that, for portfolios, beta is the most important component of
risk (since market risk is the dominant risk component for diversified portfolios). The
beta of a portfolio tells us how sensitive it is to market movements. Calculating a
portfolio’s beta is straight forward: simply look up the individual betas of the
constituent shares and weight each one by the proportion of your funds which is
invested in that share. The sum of these weighted values will yield your portfolio’s
beta (to calculate the actual amount of market risk your portfolio has, refer to our
worked example in Section 6).
The measurement of the unique risk of a portfolio is slightly more intricate. Naturally,
if your portfolio is the market index or something very close to it, the unique risk of
your portfolio will be virtually zero. However, if your portfolio is not diversified, you
may need some data on the recent history of your portfolio’s performance.
Alternatively, if your portfolio is reasonably diversified, we suggest instead that you
calculate your portfolio’s unique risk from the unique risk figures of the constituent
shares and you follow our worked example in Section 6. If your portfolio is fairly well
diversified, this approach gives a good estimate of its unique risk. However, if many
of the shares in your portfolio are clustered in one industry, then the true unique risk
will be slightly higher than calculated. Once you have measured the two risk
components of your portfolio, you should compare them to your target levels. If either
of the risk components are off target, the remedy is clear.
Traditionally, the approaches to portfolio management included: restricting selection
choices to an eligible list of large companies; specifying a minimum yield level;
restricting the proportion in a single share or sector; and even authorising every deal
that is made. This can impose unnecessary constraints which fail to control the risks.
The modern way to manage portfolios is to measure beta and unique risk on an on-
going basis and to track actual levels to target levels.
Measuring your portfolio’s performance
In the past, many managers have compared their funds on the basis of returns
alone. Performance figures that are unadjusted for risk tell us how much money the
portfolio has earned, but they tell us nothing about the risks that were taken on the
way. Managers may argue that it is profit that clients are concerned with and find it
difficult to convince clients that their portfolios yield lower returns than their
competitors simply because they are exposed to lower risks. But managers, who
take on unnecessarily high risk portfolios in an attempt to gain a competitive edge on
return, are foolish and will be managers no more when the market turns bearish.
Your congratulations should always go to the managers who have achieved the
highest risk-adjusted returns even if their unadjusted returns are lower.
Adjusting for risk
A lot has been written about adjusting for risk. Some measures have been designed
to compare portfolios on a one-off basis, and others have been designed to
continually monitor the risk-adjusted performance of a portfolio.
The portfolio’s beta is calculated by
looking up individual betas of the
constituent shares and weighting
each one by the proportion of your
funds which is invested in that share.
It is important to examine risk
adjusted returns when examining
portfolio’s performance.

EQUITY RISK SERVICE – Q4 2013 Igor Rodionov
8 BNP PARIBAS 14 JANUARY 2014
For example, to compare risk-adjusted performances of various portfolios at year
end, you could simply divide the annual return on each portfolio by its beta (Treynor’s
measure). Clearly, the portfolio having the largest measure would be the best risk-
adjusted performer. If however, the portfolios are not fully diversified, you should
perhaps divide by their standard deviation (i.e., total risk) instead of beta and
compare them on this basis (Sharpe’s measure).
Alternatively, you may want to monitor how well you are doing for individual
portfolios. In this case you could compute the portfolio’s abnormal return on an on
going basis. The term abnormal return embodies the idea of having returns over and
above (or below) what is expected, given the risk of a portfolio. The idea is to
compute the return for your portfolio over and above the return you would expect for
a portfolio having the same beta as yours.
For example, consider a portfolio having a beta of 1. Since this is the same beta as
that of the market index, you would expect it to do just as well as the market. What
about an investment with a beta of zero? Zero beta means zero market risk. If you
were to invest all your money in a fixed interest instrument, you would receive the
interest rate as a return but your beta would be zero. So the interest rate can be
used as a benchmark return for a portfolio with a beta equal to zero.
Now suppose your portfolio has a beta of 0.7. This can be viewed as having the
same beta as a portfolio with 70% invested in the market index and 30% invested at
a fixed interest rate. So to compare like with like, the benchmark return on your
portfolio can be computed as 0.7 multiplied by the return of the market index (over
the same period) plus 0.3 multiplied by the interest rate. Having obtained this
benchmark return, you subtract it from your portfolio’s actual return realised over the
same period. This is your portfolio’s abnormal return. If your abnormal return is
positive, you are doing well. If it is negative, you are under-performing the
benchmark.
Selection and timing
We shift our emphasis away from portfolios and consider the two issues uppermost
in any portfolio manager’s mind. Firstly, which shares to choose (selection), and
secondly when to trade (timing).
Considering selection, you should look for shares with high abnormal returns. By
contrast, shares which consistently produce negative abnormal returns are the ones
to sell. The abnormal return for a share can be calculated in the same way as that for
a portfolio described above (see also Section 6 for a worked example). Abnormal
returns can even be computed on a daily or weekly basis to closely monitor
opportunities to trade in shares.
Calculating abnormal returns of shares is well and good, but there are hundreds of
shares. Which shares should you look for? Obviously you should focus your efforts
on the sectors and shares which you know best. You may also want to focus on
sectors where you hold much less than market proportions. But the shares which are
most likely to yield significant abnormal returns are the ones having high unique risk.
If a share had no unique risk there would be no purpose in analysing its abnormal
returns as its price movements would be determined entirely by its beta.
Considering market timing, this depends very much on your ability to forecast which
way the market is moving. If you think the market is about to go up, you should move
into high beta shares. On the other hand if you think the market is about to fall, you
would do better to move into low beta shares or into liquid assets. Of the two, going
liquid is easier and may be less costly, but you may be constrained to remain
invested in liquid (e.g. time deposits). Whichever way you choose, however, you will
be best off selling the highest beta shares first.
Selection and timing are two
important issues to any portfolio
manager.

EQUITY RISK SERVICE – Q4 2013 Igor Rodionov
9 BNP PARIBAS 14 JANUARY 2014
Your confidence in your forecasts should also impact on the degree to which you
shift your portfolio. Clearly, the less confident you are about your forecasts, the more
moderate you should make the shift in the beta of your portfolio.
Your ability to make accurate forecasts and your ability to pick winners are clearly
going to influence your investment strategy. Assuming you are a fairly good analyst
and that you are right 6 times out of 10. Even with these moderate levels of
forecasting skills you can produce useful profits. You may thus want to take on a
slight amount of unique risk, although it would be wise to limit unique risk to a
maximum of about 10% of your portfolio’s total risk. If however, you do not claim to
be able to pick winners or if you have no particular forecasting prowess, you should
hold as diversified a portfolio as possible.

EQUITY RISK SERVICE – Q4 2013 Igor Rodionov
10 BNP PARIBAS 14 JANUARY 2014
4. The tables
About the different market proxies
The JSE is unique in the sense that it is composed of two distinctly different types of
shares, i.e. resources shares and financial & industrial shares. Often investors are
concerned with the behaviour of shares in these markets relative to an index which
characterises these markets separately, rather than relative to an overall market
index. For example, many investors prefer to measure the performance of an
industrial share relative to an industrial market index and a gold share relative to a
mining index. In order to accommodate these preferences for each listed share, we
have included risk statistics relative to each share’s characteristic market index and
also relative to the overall market index. Logical proxies for these characteristic
markets would be the three secondary component indices of the All Share Index
(J203), namely:
§ The Financial and Industrial Index (J250),
§ The Resource Index (J258),
§ The Top-40 Index (J200).
Thus, the accompanying tables give risk statistics for all shares relative to the All
Share Index, as well as relative to one of the above-mentioned secondary indices.
Please note that we have switched to the new Free Float FTSE/JSE Africa Index
Series.
About the index and share statistics tables
Each column of information is defined as follows:
Security: The company’s name
Code: The ticker symbol which identifies the security on the JSE
Number of months: The number of months during which the security traded.
For example, a thinly-traded security may have been listed
for 35 months but, if it hasn’t traded at all for two of those
months, only 33 traded months can be used in the
estimation process.
Annualised Alpha: The average return per annum on a share when the market
on average does not move.
Beta: This is the sensitivity of the share’s price to changes in the
market. A beta of 1 means that the share will, on average,
move in line with the market (as measured by the relevant
FTSE/JSE Index). A beta greater than 1 implies that the
share will tend to move more in percentage terms than the
market index and vice-versa.
Se(ß): The standard error of beta is a statistical measure of the
reliability of the estimate of beta. The lower this figure, the
more reliable the estimate of beta. Statisticians set up a
confidence interval for the estimate of beta by adding and
subtracting 2 x se (ß) from the beta estimate. There is a
95% chance that the true beta lies in this interval.
Ann. Total Risk: This is the standard deviation of returns which measures
the share’s total risk expressed in % per annum.
Ann. Unique Risk: (or Non-Systematic Risk) reflects the fluctuations in the
security’s returns which are linked to events which are
unique to the company (e.g. bad management, worker
strikes etc.).
The secondary component indices of
the All Share Index are used as
market proxies.

EQUITY RISK SERVICE – Q4 2013 Igor Rodionov
11 BNP PARIBAS 14 JANUARY 2014
R2: This can be interpreted as the proportion of the share’s
total risk accounted for by its market risk. Note that a high
beta will not necessarily produce a high R2. In statistical
terms, R2 is the coefficient of determination of the
regression.
% of days traded: This quantity is the percentage of the business days over
the period of analysis which the security traded. This
provides an indication of the extent to which the security is
thinly traded.

EQUITY RISK SERVICE – Q4 2013 Igor Rodionov
12 BNP PARIBAS 14 JANUARY 2014
4.1 FTSE/JSE All Share Index (J203) as market proxy
EXHIBIT 2: FTSE/JSE INDICES VS ALL SHARE INDEX
Index Code No. of Months Beta Std Error Annualised
Total risk Annualised
Unique Risk R²
(β) (%) (%) (%)
Africa Headline Indices
JSE All Share Index J203 60 1.00 0.00 15.1 0.0 100
JSE Top 40 Index J200 60 1.09 0.01 16.6 1.4 99
JSE Mid Cap Index J201 60 0.52 0.06 10 7 7.2 54
JSE Small Cap Index J202 60 0.45 0.06 9.8 7.0 49
JSE Fledgling Index J204 60 0.35 0.08 10.5 9.0 25
Tradeable Indices
JSE Resource 20 Index J210 60 1.34 0.08 22.4 9.4 82
JSE Industrial 25 Index J211 60 0.89 0.05 14.7 5.6 85
JSE Financial 15 Index J212 60 0.85 0.08 15.9 9.2 66
JSE Financial and Industrial 30 Index J213 60 0.91 0.05 14.8 5.6 86
Secondary Markets
JSE Development Capital Index J230 60 0.05 0.44 49.5 49.1 0
JSE Venture Capital Index J231 60 1.39 0.69 80.4 77.0 7
JSE ALTX Index J232 60 0.45 0.19 21.9 20.6 9
JSE ALTX 15 Index J233 60 0.40 0.24 27.7 26.8 5
Specialist Indices
JSE Socially Responsible Investment Index J100 60 1.06 0.02 16.1 1.8 99
JSE SA Financials and Industrials Index J250 60 0.81 0.05 13.4 5.3 84
JSE Preference Share Index J251 60 0.12 0.06 6.9 6.6 6
JSE SA Listed Property Index J253 60 0.11 0.11 12.5 12.3 2
JSE Capped Property Index J254 60 0.23 0.10 11.3 10.7 10
JSE Property Unit Trust Index J255 60 0.14 0.10 11.4 11.1 3
JSE Property Loan Stock Index J256 60 0.11 0.12 13.4 13.2 1
JSE SA Industrials Index J257 60 0.84 0.05 13.7 5.2 85
JSE SA Resources Index J258 60 1.33 0.08 22.3 9.4 82
JSE Dividend+ Index J259 60 0.78 0.06 13.6 6.7 75
JSE RAFI 40 Index J260 60 1.05 0.02 16.1 2.5 97
Capped Indices
JSE Capped Top 40 Index J300 60 1.06 0.01 16.0 1.2 99
JSE Capped All Share Index J303 60 0.99 0.00 14.9 0.0 100
Style Indices
JSE Value Index J330 60 0.88 0.04 14.2 4.7 89
JSE Growth Index J331 60 1.09 0.03 16.9 3.9 95
Shareholder Weighted Indices
JSE Shareholder Weighted Top 40 Index J400 60 1.00 0.02 15.3 2.6 97
JSE Shareholder Weighted All Share Index J403 60 0.89 0.02 13.7 2.7 96
Industry Indices
JSE Oil & Gas Index J500 60 1.04 0.11 20.3 12.5 61
JSE Basic Materials Index J510 60 1.35 0.09 22.7 9.6 82
JSE Industrials Index J520 60 0.67 0.09 14.1 9.6 52
JSE Consumer Goods Index J530 60 0.97 0.10 18.2 10.7 65
JSE Health Care Index J540 60 0.35 0.11 13.6 12.4 15
JSE Consumer Services Index J550 60 0.83 0.09 15.9 9.7 63
JSE Telecommunication Index J560 60 0.82 0.14 20.0 15.6 39
JSE Financials Index J580 60 0.74 0.08 14.3 8.8 62
JSE Technology Index J590 60 0.60 0.17 20.5 18.3 19
(continued on next page)

EQUITY RISK SERVICE – Q4 2013 Igor Rodionov
13 BNP PARIBAS 14 JANUARY 2014
EXHIBIT 2: FTSE/JSE INDICES VS ALL SHARE INDEX (cont’d)
Index Code No. of months Beta Std Error Annualised
Total risk Annualised
Unique Risk R²
(β) (%) (%) (%)
Sector Indices
JSE Oil & Gas Producers Index J055 60 1.04 0.11 20.3 12.5 61
JSE Chemicals Index J135 60 0.51 0.12 15.7 13.6 24
JSE Forestry & Paper Index J173 60 1.51 0.21 32.7 23.1 48
JSE Industrial Metals Index J175 60 0.77 0.17 22.1 18.6 27
JSE Mining Index J177 60 1.39 0.09 23.5 10.5 80
JSE Construction & Materials Index J235 60 0.53 0.16 20.0 18.2 16
JSE General Industrials Index J272 60 0.63 0.09 13.6 9.6 50
JSE Electronic & Electrical Equipment Index J273 60 0.54 0.15 18.5 16.5 19
JSE Industrial Engineering Index J275 60 0.69 0.18 22.4 19.7 21
JSE Industrial Transportation Index J277 60 0.98 0.13 21.0 14.7 50
JSE Support Services Index J279 60 0.76 0.12 18.0 13.6 41
JSE Automobiles & Parts Index J335 60 0.36 0.30 35.1 34.4 3
JSE Beverages Index J353 60 0.87 0.12 19.2 13.8 47
JSE Food Producers Index J357 60 0.41 0.08 11.5 9.5 30
JSE Household Goods Index J372 60 1.12 0.18 26.8 20.5 40
JSE Personal Goods Index J376 60 1.39 0.19 29.8 20.9 50
JSE Health Care Equipment & Services Index J453 60 0.26 0.11 13.5 12.8 9
JSE Pharmaceuticals & Biotechnology Index J457 60 0.41 0.16 18.5 17.3 11
JSE Food & Drug Retailers Index J533 60 0.37 0.15 17.5 16.4 10
JSE General Retailers Index J537 60 0.77 0.14 19.3 15.3 36
JSE Media Index J555 60 1.18 0.16 25.1 17.5 51
JSE Travel & Leisure Index J575 60 0.54 0.12 16.0 13.7 26
JSE Fixed Line Telecommunications Index J653 60 0.65 0.24 28.9 26.9 11
JSE Mobile Telecommunications Index J657 60 0.84 0.15 20.9 16.4 38
JSE Banks Index J835 60 0.83 0.12 18.5 13.5 46
JSE Nonlife Insurance Index J853 60 0.13 0.16 17.6 17.3 1
JSE Life Insurance Index J857 60 0.87 0.09 16.8 10.4 60
JSE General Financial Index J877 60 1.06 0.11 20.7 13.0 61
JSE Equity Investment Instruments Index J898 60 0.48 0.11 14.0 11.9 26
JSE Software & Computer Services Index J953 60 0.61 0.17 20.9 18.7 19
Sub Sector Indices
JSE Gold Mining Index J150 60 0.47 0.28 31.7 30.7 5
JSE Coal Mining Index J151 60 0.30 0.22 25.0 24.4 3
JSE Platinum Mining Index J153 60 1.42 0.17 29.1 19.5 55
JSE General Mining Index J154 60 1.62 0.10 26.9 10.9 83
Sources: JSE; BNP Paribas Cadiz Securities

EQUITY RISK SERVICE – Q4 2013 Igor Rodionov
14 BNP PARIBAS 14 JANUARY 2014
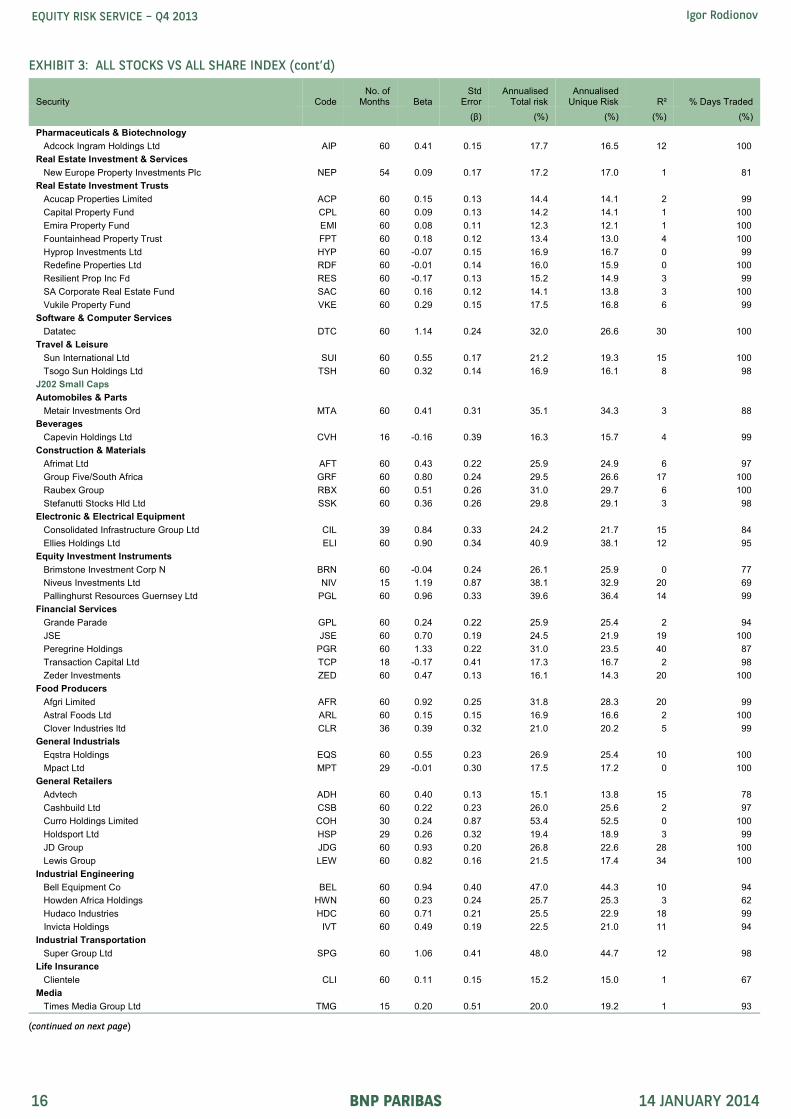
EXHIBIT 3: ALL STOCKS VS ALL SHARE INDEX
Security Code No. of
Months Beta Std
Error Annualised
Total risk Annualised
Unique Risk R² % Days Traded
(β) (%) (%) (%) (%)
J200 Large Caps
Banks
Barclays Africa Group Limited BGA 60 0.84 0.15 21.0 16.5 37 100
Firstrand Limited FSR 60 0.93 0.13 20.2 14.4 48 100
Nedbank Group. NED 60 0.77 0.15 20.8 17.1 32 100
RMB Holdings RMH 60 0.85 0.15 21.3 16.8 37 100
Standard Bank Group SBK 60 0.80 0.15 21.0 17.1 34 100
Beverages
SABMiller SAB 60 0.87 0.13 19.2 13.9 47 100
Financial Services
Investec Ltd INL 60 1.55 0.16 29.5 17.6 64 100
Investec PLC INP 60 1.56 0.16 30.3 18.6 63 100
Food & Drug Retailers
Shoprite SHP 60 0.29 0.19 21.3 20.7 4 100
Food Producers
Tiger Brands TBS 60 0.65 0.14 18.7 15.8 27 100
Forestry & Paper
Mondi Limited MND 60 1.52 0.20 32.3 22.2 52 100
Mondi Plc MNP 60 1.65 0.20 33.7 22.0 56 100
General Industrials
Bidvest Group BVT 60 0.81 0.11 17.2 11.9 50 100
Remgro REM 60 0.65 0.10 14.6 10.8 45 100
General Retailers
Truworths International TRU 60 0.79 0.20 25.5 22.3 22 100
Woolworths Holdings WHL 60 0.80 0.18 23.2 19.6 27 100
Health Care Equipment & Services
Life Healthcare Group Holdings LHC 42 -0.30 0.23 18.0 17.4 5 100
Medi-Clinicrp MDC 60 0.24 0.15 16.9 16.4 5 100
Household Goods & Home Construction
Steinhoff International Holdings SHF 60 1.11 0.18 26.7 20.4 41 100
Industrial Metals & Mining
Kumba Iron Ore KIO 60 0.93 0.22 28.1 24.1 25 100
Industrial Transportation
Imperial Holdings IPL 60 1.16 0.17 26.3 19.3 45 100
Life Insurance
Discovery Holdings DSY 60 0.50 0.13 16.3 14.3 21 100
Old Mutual Plc OML 60 1.08 0.19 26.5 20.7 38 100
Sanlam SLM 60 0.81 0.10 16.6 11.1 54 99
Media
Naspers NPN 60 1.19 0.16 25.8 18.3 50 100
Mining
African Rainbow Minerals Ltd ARI 60 1.08 0.20 28.2 22.7 34 100
Anglo American AGL 60 1.79 0.17 33.1 18.6 67 100
Anglo American Platinum AMS 60 1.16 0.22 30.9 25.1 33 100
Anglogold Ashanti Ltd ANG 60 0.66 0.31 36.4 34.6 8 100
Assore Limited ASR 60 1.59 0.21 33.2 23.1 51 96
BHP Billiton BIL 60 1.53 0.12 26.9 13.4 75 100
Exxaro Resources EXX 60 1.09 0.21 28.8 23.3 33 100
Impala Platinum Hlds IMP 60 1.47 0.22 33.7 24.8 45 100
Mobile Telecommunications
MTN Group MTN 60 0.87 0.15 22.0 17.4 37 100
VODACOM Group Ltd VOD 55 0.46 0.20 20.0 18.8 10 100
Oil & Gas Producers
Sasol SOL 60 1.04 0.11 20.2 12.5 61 100
Personal Goods
Compagnie Financiere Richemont AG CFR 60 1.38 0.19 29.8 20.9 50 100
Pharmaceuticals & Biotechnology
Aspen Pharmacare Holdings Ltd APN 60 0.44 0.20 23.6 22.4 8 100
Real Estate Investment & Services
Capital & Countries Properties CCO 43 0.27 0.24 19.2 18.6 4 100
Real Estate Investment Trusts
Growthpoint Prop Ltd GRT 60 0.23 0.15 16.8 16.3 4 100
Intu Properties Plc ITU 60 0.93 0.17 24.1 19.4 34 97
Tobacco
British American Tobacco PLC BTI 60 0.28 0.17 19.4 18.8 4 100
(continued on next page)

EQUITY RISK SERVICE – Q4 2013 Igor Rodionov
15 BNP PARIBAS 14 JANUARY 2014
EXHIBIT 3: ALL STOCKS VS ALL SHARE INDEX (cont’d)
Security Code No. of
Months Beta Std
Error Annualised
Total risk Annualised
Unique Risk R² % Days Traded
(β) (%) (%) (%) (%)
J201 Mid Caps
Banks
Capitec Bank Hldgs Ltd CPI 60 0.22 0.23 26.0 25.6 1 99
Chemicals
AECI AFE 60 0.48 0.15 18.8 17.2 15 100
African Oxygen Ltd AFX 60 0.52 0.20 23.7 22.2 11 100
Omnia Holdings Ltd OMN 60 0.55 0.15 18.8 16.7 20 99
Construction & Materials
Aveng AEG 60 0.56 0.24 27.9 26.3 9 100
Murray & Roberts MUR 60 0.61 0.26 30.7 29.0 9 98
PPC Limited PPC 60 0.35 0.18 21.5 20.7 6 100
Wilson Bayly Holmes-Ovcon WBO 60 0.68 0.19 23.6 21.1 19 100
Electronic & Electrical Equipment
Allied Electronics Corp Part Prf ATNP 60 0.66 0.14 18.9 15.8 28 100
Allied Electronics Corporation Ltd ATN 60 0.50 0.19 22.9 21.4 11 99
Reunert RLO 60 0.48 0.18 21.7 20.3 11 100
Equity Investment Instruments
Hosken Cons Invest HCI 60 0.27 0.19 21.4 20.8 3 95
Rand Merchant Insurance Holdings Ltd RMI 33 0.61 0.26 17.7 15.9 17 100
Reinet Investments SCA REI 60 0.53 0.13 16.8 14.6 22 100
Financial Services
African Bank Investments Ltd ABL 60 0.57 0.27 31.9 30.5 7 100
Brait SA BAT 60 0.16 0.23 26.1 25.8 1 99
Coronation Fund Managers CML 60 0.62 0.19 23.8 21.7 16 99
PSG Group PSG 60 0.31 0.24 27.6 27.0 3 100
Fixed Line Telecommunications
Telkom TKG 60 0.75 0.23 28.8 26.2 16 100
Food & Drug Retailers
Clicks Group Ltd CLS 60 0.63 0.18 21.9 19.6 19 98
Pick N Pay Stores PIK 60 0.49 0.16 19.4 17.8 14 100
The Spar Group SPP 60 0.37 0.14 16.8 15.7 11 100
Food Producers
AngloVaal Industries ORD AVI 60 0.42 0.16 19.1 17.9 11 100
Illovo Sugar ILV 60 0.26 0.18 20.7 20.1 4 100
Oceana Group OCE 60 0.02 0.20 23.1 22.9 0 91
Pioneer Foods Group Ltd PFG 60 0.44 0.17 20.1 18.8 11 100
RCL Foods Limited RCL 60 0.12 0.14 15.7 15.5 1 95
Tongaat Hulett TON 60 -0.24 0.18 20.6 20.1 3 100
Forestry & Paper
Sappi SAP 60 1.33 0.27 36.6 30.1 30 100
General Industrials
Barloworld BAW 60 0.93 0.23 29.6 25.8 23 100
KAP Industrial Holdings Ltd KAP 60 0.58 0.26 29.2 27.7 8 81
Nampak NPK 60 0.29 0.15 17.1 16.4 6 100
General Retailers
Massmart Holdings Ltd MSM 60 0.69 0.19 23.9 21.3 20 100
Mr Price Group MPC 60 0.49 0.20 23.4 22.0 10 100
The Foschini Group Ltd TFG 60 0.93 0.20 27.0 22.8 28 100
Health Care Equipment & Services
Netcare NTC 60 0.47 0.15 18.2 16.6 16 100
Industrial Metals & Mining
Arcelor Mittal South Africa Ltd ACL 60 0.82 0.28 34.6 32.0 13 100
Industrial Transportation
Grindrod GND 60 0.79 0.19 24.5 21.2 24 100
Trencor Ltd TRE 60 0.29 0.20 22.5 21.9 4 91
Life Insurance
Liberty Holdings Limited Ord LBH 60 0.37 0.12 14.5 13.3 14 97
MMI Holdings Ltd MMI 60 0.74 0.15 20.6 17.2 30 100
Mining
Gold Fields GFI 60 0.39 0.28 32.4 31.6 3 100
Harmony HAR 60 0.07 0.33 36.9 36.6 0 100
Lonmin PLC LON 60 1.58 0.29 41.0 32.6 36 100
Northam Platinum NHM 60 1.21 0.29 38.0 32.8 24 100
Royal Bafokeng Platinum RBP 37 0.88 0.32 23.5 20.8 20 100
Nonlife Insurance
Santam SNT 60 0.13 0.16 17.6 17.4 1 100
(continued on next page)
EQUITY RISK SERVICE – Q4 2013 Igor Rodionov
16 BNP PARIBAS 14 JANUARY 2014
EXHIBIT 3: ALL STOCKS VS ALL SHARE INDEX (cont’d)
Security Code No. of
Months Beta Std
Error Annualised
Total risk Annualised
Unique Risk R² % Days Traded
(β) (%) (%) (%) (%)
Pharmaceuticals & Biotechnology
Adcock Ingram Holdings Ltd AIP 60 0.41 0.15 17.7 16.5 12 100
Real Estate Investment & Services
New Europe Property Investments Plc NEP 54 0.09 0.17 17.2 17.0 1 81
Real Estate Investment Trusts
Acucap Properties Limited ACP 60 0.15 0.13 14.4 14.1 2 99
Capital Property Fund CPL 60 0.09 0.13 14.2 14.1 1 100
Emira Property Fund EMI 60 0.08 0.11 12.3 12.1 1 100
Fountainhead Property Trust FPT 60 0.18 0.12 13.4 13.0 4 100
Hyprop Investments Ltd HYP 60 -0.07 0.15 16.9 16.7 0 99
Redefine Properties Ltd RDF 60 -0.01 0.14 16.0 15.9 0 100
Resilient Prop Inc Fd RES 60 -0.17 0.13 15.2 14.9 3 99
SA Corporate Real Estate Fund SAC 60 0.16 0.12 14.1 13.8 3 100
Vukile Property Fund VKE 60 0.29 0.15 17.5 16.8 6 99
Software & Computer Services
Datatec DTC 60 1.14 0.24 32.0 26.6 30 100
Travel & Leisure
Sun International Ltd SUI 60 0.55 0.17 21.2 19.3 15 100
Tsogo Sun Holdings Ltd TSH 60 0.32 0.14 16.9 16.1 8 98
J202 Small Caps
Automobiles & Parts
Metair Investments Ord MTA 60 0.41 0.31 35.1 34.3 3 88
Beverages
Capevin Holdings Ltd CVH 16 -0.16 0.39 16.3 15.7 4 99
Construction & Materials
Afrimat Ltd AFT 60 0.43 0.22 25.9 24.9 6 97
Group Five/South Africa GRF 60 0.80 0.24 29.5 26.6 17 100
Raubex Group RBX 60 0.51 0.26 31.0 29.7 6 100
Stefanutti Stocks Hld Ltd SSK 60 0.36 0.26 29.8 29.1 3 98
Electronic & Electrical Equipment
Consolidated Infrastructure Group Ltd CIL 39 0.84 0.33 24.2 21.7 15 84
Ellies Holdings Ltd ELI 60 0.90 0.34 40.9 38.1 12 95
Equity Investment Instruments
Brimstone Investment Corp N BRN 60 -0.04 0.24 26.1 25.9 0 77
Niveus Investments Ltd NIV 15 1.19 0.87 38.1 32.9 20 69
Pallinghurst Resources Guernsey Ltd PGL 60 0.96 0.33 39.6 36.4 14 99
Financial Services
Grande Parade GPL 60 0.24 0.22 25.9 25.4 2 94
JSE JSE 60 0.70 0.19 24.5 21.9 19 100
Peregrine Holdings PGR 60 1.33 0.22 31.0 23.5 40 87
Transaction Capital Ltd TCP 18 -0.17 0.41 17.3 16.7 2 98
Zeder Investments ZED 60 0.47 0.13 16.1 14.3 20 100
Food Producers
Afgri Limited AFR 60 0.92 0.25 31.8 28.3 20 99
Astral Foods Ltd ARL 60 0.15 0.15 16.9 16.6 2 100
Clover Industries ltd CLR 36 0.39 0.32 21.0 20.2 5 99
General Industrials
Eqstra Holdings EQS 60 0.55 0.23 26.9 25.4 10 100
Mpact Ltd MPT 29 -0.01 0.30 17.5 17.2 0 100
General Retailers
Advtech ADH 60 0.40 0.13 15.1 13.8 15 78
Cashbuild Ltd CSB 60 0.22 0.23 26.0 25.6 2 97
Curro Holdings Limited COH 30 0.24 0.87 53.4 52.5 0 100
Holdsport Ltd HSP 29 0.26 0.32 19.4 18.9 3 99
JD Group JDG 60 0.93 0.20 26.8 22.6 28 100
Lewis Group LEW 60 0.82 0.16 21.5 17.4 34 100
Industrial Engineering
Bell Equipment Co BEL 60 0.94 0.40 47.0 44.3 10 94
Howden Africa Holdings HWN 60 0.23 0.24 25.7 25.3 3 62
Hudaco Industries HDC 60 0.71 0.21 25.5 22.9 18 99
Invicta Holdings IVT 60 0.49 0.19 22.5 21.0 11 94
Industrial Transportation
Super Group Ltd SPG 60 1.06 0.41 48.0 44.7 12 98
Life Insurance
Clientele CLI 60 0.11 0.15 15.2 15.0 1 67
Media
Times Media Group Ltd TMG 15 0.20 0.51 20.0 19.2 1 93
(continued on next page)

EQUITY RISK SERVICE – Q4 2013 Igor Rodionov
17 BNP PARIBAS 14 JANUARY 2014
EXHIBIT 3: ALL STOCKS VS ALL SHARE INDEX (cont’d)
Security Code No. of
Months Beta Std
Error Annualised
Total risk Annualised
Unique Risk R² % Days Traded
(β) (%) (%) (%) (%)
Mining
Aquarius Platinum Ltd AQP 60 1.34 0.41 50.8 45.9 17 99
Pan African Resources Plc PAN 60 0.43 0.41 47.3 46.5 2 99
Sibanye Gold Limited SGL 10 1.59 1.73 72.2 56.6 32 100
Mobile Telecommunications
Blue Label Telecoms Ltd. BLU 60 0.48 0.28 32.4 31.3 5 100
Real Estate Investment & Services
Delta Property Fund Ltd DLT 13 0.30 0.29 11.6 10.6 11 95
Premium Properties PMM 60 -0.06 0.18 20.1 19.9 0 85
Real Estate Investment Trusts
Arrowhead Properties Ltd AWA 24 0.17 0.30 14.6 14.2 2 100
Ascension Properties Ltd AIB 18 0.31 0.39 15.2 14.5 2 58
Ascension Properties Ltd-A units AIA 18 -0.19 0.27 12.2 11.6 4 65
Fortress Income Fund Ltd FFA 50 0.04 0.12 10.9 10.8 0 94
Hospitality Property A HPA 60 -0.01 0.15 16.3 16.1 1 78
Hospitality Property B HPB 60 0.58 0.34 39.2 37.9 5 88
Investec Property Fund Limited IPF 32 -0.36 0.34 22.2 21.3 4 99
Octodec Investments OCT 60 -0.27 0.20 21.7 21.2 4 88
Rebosis Property Fund Ltd REB 31 -0.20 0.23 14.8 14.3 3 92
Sycom Property Fund SYC 60 0.21 0.15 16.9 16.4 3 99
Software & Computer Services
Business Connexion Group Ltd BCX 60 0.13 0.19 20.8 20.6 1 99
EOH Holdings Ltd. EOH 60 0.29 0.23 25.9 25.4 3 95
Support Services
Adcorp Holdings Ltd ADR 60 0.20 0.21 22.6 22.3 2 98
Metrofile Holdings MFL 60 -0.04 0.20 21.7 21.5 0 94
Net 1 Ueps Technologies Inc NT1 60 0.41 0.55 55.8 55.1 1 64
Technology Hardware & Equipment
Pinnacle Technology Holdings PNC 60 0.22 0.24 27.9 27.5 1 95
Travel & Leisure
City Lodge Hotels Ltd CLH 60 0.46 0.16 18.9 17.4 14 100
Famous Brands FBR 60 0.63 0.21 25.2 23.1 14 99
Spur Corp SUR 60 0.61 0.20 23.5 21.6 14 96
J204 Fledging
Automobiles & Parts
Control Instruments Group CNL 60 0.82 0.54 52.6 51.1 5 61
Beverages
Awethu Breweries AWT 60 -0.32 0.92 101.5 100.3 1 50
Chemicals
Delta EMD Ltd DTA 60 0.19 0.35 38.4 38.0 1 67
Rolfes Technology Hldgs RLF 60 0.41 0.40 42.5 41.8 2 67
Spanjaard SPA 60 -0.02 0.24 33.4 33.1 1 16
Construction & Materials
Basil Read Holdings BSR 60 0.26 0.30 34.4 33.9 1 100
Calgro M3 Holdings CGR 60 0.19 0.60 69.8 69.2 0 60
Esorfranki Ltd ESR 60 0.83 0.35 40.9 38.5 10 99
Kaydav Group Ltd KDV 60 0.17 0.44 46.2 45.7 0 27
Masonite Africa MAS 60 0.33 0.24 38.3 37.4 3 24
Mazor Group MZR 60 1.49 0.34 41.6 34.7 27 65
Protech Khuthele Hldg Ld PKH 60 0.00 0.32 36.2 35.9 0 94
Electronic & Electrical Equipment
Amalgamated Electronics Corp AER 60 -0.11 0.34 37.7 37.4 1 66
ARB Holdings Ltd ARH 60 0.59 0.30 35.5 34.0 6 87
CAFCA Ltd CAC 23 1.30 0.87 118.8 104.0 14 3
Digicore Holdings DGC 60 0.58 0.29 34.7 33.3 7 94
Jasco Electronics Holdings JSC 60 0.23 0.40 43.0 42.5 1 91
South Ocean Holdings SOH 60 0.95 0.33 40.0 36.9 13 81
Equity Investment Instruments
Sabvest SBV 50 -0.01 0.34 41.0 40.6 0 9
Sabvest Lmt N SVN 57 -0.17 0.34 42.1 41.5 1 12
Trematon Capital Investments TMT 60 0.30 0.21 24.6 23.9 3 34
(continued on next page)

EQUITY RISK SERVICE – Q4 2013 Igor Rodionov
18 BNP PARIBAS 14 JANUARY 2014
EXHIBIT 3: ALL STOCKS VS ALL SHARE INDEX (cont’d)
Security Code No. of
Months Beta Std
Error Annualised
Total risk Annualised
Unique Risk R² % Days Traded
(β) (%) (%) (%) (%)
Financial Services
Cadiz Holdings CDZ 60 0.87 0.25 30.7 27.5 18 91
Conduit Capital CND 60 -0.50 0.42 47.1 45.9 2 63
Efficient Group Ltd EFG 27 0.09 1.80 75.4 73.9 0 15
London Finance and Investment Group LNF 60 0.00 0.30 43.0 42.6 0 10
Prescient Limited PCT 16 0.15 0.51 20.7 20.0 0 91
Purple Capital PPE 60 0.72 0.43 49.3 47.7 5 78
Sasfin Holdings SFN 60 0.39 0.22 25.4 24.5 5 88
Sekunjalo Investments SKJ 60 0.25 0.43 47.1 46.6 1 84
Trustco Group Holdings Limited TTO 58 1.66 0.65 67.7 62.4 13 78
Food Producers
Country Bird Holdings CBH 60 0.07 0.32 36.1 35.8 0 90
Crookes Brothers CKS 60 0.12 0.25 28.6 28.4 0 34
Sovereign Food Investments SOV 60 0.87 0.30 36.6 33.8 13 80
Forestry & Paper
York Timber Holdings Ltd YRK 60 -0.09 0.32 35.3 35.0 0 82
General Industrials
Argent Industrial Ltd ART 60 0.37 0.24 27.7 26.9 4 98
Astrapak Limited APK 60 0.90 0.26 32.6 29.3 18 84
Bowler Metcalf BCF 60 0.39 0.18 20.8 19.8 8 81
Transpaco TPC 60 0.56 0.21 23.5 22.1 11 54
General Retailers
Combined Motor Hldgs Ltd CMH 60 0.36 0.25 27.3 26.6 3 77
Nictus NCS 60 -0.26 0.39 47.5 46.7 1 21
REX Trueform Clothing Sco RTN 56 -0.17 0.27 38.5 37.9 0 12
Taste Holdings TAS 60 1.18 0.50 55.7 52.3 10 85
Verimark Holdings VMK 60 -0.31 0.40 45.9 45.3 2 78
Health Care Equipment & Services
Afrocentric Investment Corp Ltd ACT 60 0.19 0.35 36.6 36.2 0 82
Industrial Engineering
Austro Group Ltd ASO 60 -0.16 0.30 31.3 30.9 0 69
Master Drilling Group Ltd MDI 12 -0.11 0.54 19.4 18.4 1 81
Industrial Metals & Mining
Hulamin HLM 60 0.55 0.32 37.4 36.2 5 99
Insimbi Ref & Alloy ISB 60 1.26 0.32 38.5 33.6 23 60
Metmar MML 60 0.69 0.27 31.6 29.7 11 95
ZCI Ltd ZCI 60 -0.63 0.58 72.6 70.4 3 26
Industrial Transportation
Cargo Carriers CRG 60 0.27 0.22 25.9 25.3 2 18
OneLogix Group Ltd OLG 60 0.21 0.34 38.5 38.1 0 90
Santova Limited SNV 60 0.64 0.61 68.1 66.8 2 72
Value Group VLE 60 0.14 0.22 22.5 22.2 1 78
Leisure Goods
Nu-World Holdings NWL 60 0.35 0.30 36.0 35.3 2 56
Media
African Media Entertainment Ltd AME 60 0.25 0.14 15.3 14.7 2 27
Mining
Atlatsa Resources Corp ATL 60 1.55 0.59 73.3 67.9 13 88
Bauba Platinum Ltd BAU 42 1.19 0.78 71.8 68.9 7 37
BuildMax Limited BDM 60 0.44 0.38 43.6 42.7 2 91
Coal of Africa Ltd CZA 60 1.24 0.50 59.7 55.8 11 99
DRD Gold DRD 60 0.43 0.40 45.3 44.4 2 100
Goliath Gold Mining Limited GGM 60 -0.06 0.39 48.2 47.8 0 47
Hwange Colliery Co. Ltd. HWA 60 0.85 0.49 72.0 69.1 6 19
Infrasors Holdings IRA 60 2.04 0.53 68.2 59.0 24 72
Jubilee Platinum PLC JBL 60 0.72 0.76 85.9 84.4 2 99
Keaton Energy Holdings Ltd KEH 60 0.21 0.32 37.0 36.5 1 94
Merafe Resources MRF 60 1.37 0.31 41.2 35.0 27 100
Miranda Mineral Holdings Ltd. MMH 60 0.45 0.41 47.6 46.7 2 90
Petmin Ltd. PET 60 0.29 0.25 28.7 28.1 2 99
Randgold & Exploration Company Ltd RNG 60 1.17 0.37 44.3 40.3 16 83
Sable Platimum Ltd SLP 12 -0.92 0.56 27.9 21.9 33 63
Sentula Mining SNU 60 0.81 0.45 52.5 50.5 6 94
Sephaku Holdings Ltd SEP 52 0.33 0.58 52.7 52.0 1 59
Trans HEX Group TSX 60 0.52 0.41 47.7 46.7 3 96
Village Main Reef Ltd VIL 60 1.33 0.72 82.2 78.5 7 66
Wescoal Holdings Limited WSL 60 0.45 0.39 44.2 43.3 2 97
Wesizwe Platinum WEZ 60 0.72 0.56 63.6 62.1 3 100
Witwatersrand Cons Gold Resources WGR 60 0.59 0.57 55.0 53.9 2 61
(continued on next page)

EQUITY RISK SERVICE – Q4 2013 Igor Rodionov
19 BNP PARIBAS 14 JANUARY 2014
EXHIBIT 3: ALL STOCKS VS ALL SHARE INDEX (cont’d)
Security Code No. of
Months Beta Std
Error Annualised
Total risk Annualised
Unique Risk R² % Days Traded
(β) (%) (%) (%) (%)
Oil & Gas Producers
Sacoil Holdings Ltd SCL 56 0.56 0.87 94.8 93.5 1 80
Pharmaceuticals & Biotechnology
Litha Healthcare Group LHG 60 0.52 0.42 43.3 42.3 3 77
Real Estate Investment & Services
Adrenna Prop Group Ltd ANA 60 -0.73 0.51 65.7 63.9 4 35
Ingenuity Property Inv L ING 60 0.04 0.25 29.5 29.3 1 32
Putprop Ltd PPR 60 0.05 0.34 29.4 29.2 0 33
Real Estate Investment Trusts
Annuity Properties Ltd ANP 19 -0.03 0.36 15.3 14.9 0 88
Synergy Income Fund Ltd SGA 24 0.10 0.34 18.0 17.6 1 44
Vividend Income Fund Ltd VIF 37 0.15 0.17 12.4 12.1 2 93
Vunani Prop Inv Fund Ltd VPF 28 0.08 0.33 19.5 19.1 0 61
Software & Computer Services
Adaptit Holdings Ltd ADI 60 0.63 0.50 54.6 53.3 4 55
Compu Clearing Outs Ltd CCL 60 -0.45 0.29 38.2 37.0 4 27
Convergenet Holdings Limited CVN 60 -0.34 0.44 50.0 49.2 1 81
Datacentrix Holdings DCT 60 0.09 0.29 31.1 30.8 0 96
Gijima Group Limited GIJ 60 1.63 0.45 56.7 50.0 21 100
Securedata Holdings SDH 60 0.63 0.41 45.5 44.3 4 43
Support Services
ELB Group ELR 60 0.67 0.34 33.6 32.2 7 63
Iliad Africa ILA 60 0.92 0.36 42.9 40.2 11 96
Kelly Group KEL 60 0.11 0.26 29.9 29.6 0 76
Marshall Monteagle PLC MMP 34 -0.64 0.44 31.3 29.5 8 33
MICROmega Holdings MMG 60 0.70 0.90 100.9 99.5 2 39
MORVEST Bus Group Ltd MOR 33 -0.05 0.58 35.9 35.3 0 95
Primeserv Group PMV 60 -0.38 0.50 50.3 49.5 2 32
Winhold Limited WNH 60 0.70 0.23 26.6 24.4 14 82
Technology Hardware & Equipment
Mustek MST 60 0.10 0.47 52.1 51.7 0 91
Travel & Leisure
Comair COM 60 0.53 0.36 41.0 39.9 4 85
DON Group DON 60 0.66 0.34 36.2 34.7 7 74
Phumelela Gaming & Leisure PHM 60 0.46 0.27 30.8 29.8 5 79
Wilderness Holdings Ltd WIL 40 1.02 0.82 54.5 51.8 6 13
J232 Altx
Construction & Materials
Accentuate Limited ACE 60 0.42 0.46 53.0 52.2 1 44
B&W Instrumentation & Electrical BWI 60 0.30 0.45 49.7 49.1 1 85
Chemical Specialities CSP 60 0.02 0.66 72.3 71.7 0 92
W G Wearne WEA 60 1.43 0.95 110.9 106.7 6 83
Electricity
IPSA Group PLC IPS 60 0.95 0.79 95.1 92.9 3 53
Electronic & Electrical Equipment
Ansys ANS 60 1.62 0.72 84.1 78.8 11 86
Equity Investment Instruments
Blackstar Group SE BCK 28 1.51 1.04 66.9 60.9 13 72
Financial Services
African Dawn Capital Ltd ADW 60 0.43 0.85 95.3 94.3 0 97
Finbond Group Litd FGL 60 0.62 1.12 108.3 107.0 0 47
Global Asset Management Ltd GAM 11 -1.40 1.47 77.2 60.4 36 14
Stratcorp STA 60 0.43 0.84 111.3 110.1 1 20
Vunani Capital Holdings VUN 60 1.51 0.77 90.3 85.7 9 55
General Retailers
Alert Steel Holdings Ltd AET 60 -0.41 0.70 75.7 74.6 1 75
Household Goods & Home Construction
RBA Holdings Ltd RBA 60 0.78 0.89 89.9 88.4 2 82
Industrial Engineering
Mine Restoration Investments Ltd MRI 18 -0.42 0.79 34.7 33.0 5 64
PSV Holdings Ltd. PSV 60 0.06 0.57 62.6 62.0 0 72
Industrial Metals & Mining
BSI Steel Ltd BSS 60 -0.19 0.30 35.8 35.4 1 77
(continued on next page)

EQUITY RISK SERVICE – Q4 2013 Igor Rodionov
20 BNP PARIBAS 14 JANUARY 2014
EXHIBIT 3: ALL STOCKS VS ALL SHARE INDEX (cont’d)
Security Code No. of
Months Beta Std
Error Annualised
Total risk Annualised
Unique Risk R² % Days Traded
(β) (%) (%) (%) (%)
Media
MoneyWeb Holdings MNY 60 0.79 0.62 70.4 68.8 3 23
Mining
Chrometco CMO 60 0.14 0.83 92.7 91.9 0 76
Personal Goods
Beige Holdings BEG 60 0.82 0.44 53.2 51.1 6 89
Imbalie Beauty Limited ILE 60 -0.07 0.83 99.0 98.2 1 42
Pharmaceuticals & Biotechnology
Nutritional Holdings Limited NUT 29 1.53 2.53 164.2 153.1 10 89
Real Estate Investment & Services
Mas Real Estate Inc. MSP 44 -0.84 0.54 35.3 33.3 7 21
Rockcastle Global Real Estate Co Ltd ROC 17 0.25 0.41 16.8 16.1 2 85
Real Estate Investment Trusts
Oasis Crescent Property Fund OAS 60 -0.07 0.07 7.0 6.9 2 21
Software & Computer Services
ISA Holdings ISA 60 0.53 0.36 40.1 39.0 3 80
Silverbridge Holdings SVB 60 0.52 0.90 118.3 116.9 0 20
Total Client Services TCS 60 0.38 2.08 199.5 197.8 0 34
Support Services
Interwaste Holdings Ltd IWE 60 0.71 0.43 45.0 43.4 5 72
M&S Holdings Ltd MSA 60 0.37 0.53 53.4 52.7 1 68
Rare Holdings Ltd RAR 60 0.62 0.65 66.0 64.9 1 59
Torre Industrial Holdings Ltd TOR 13 -1.78 0.92 47.7 33.3 45 88
Workforce Limited WKF 55 -0.03 0.41 54.2 53.7 0 11
Technology Hardware & Equipment
Foneworx Holdings FWX 60 0.41 0.33 38.8 37.9 3 75
Huge Group Ltd HUG 60 -0.04 0.73 79.6 78.9 0 56
Poynting Holdings Ltd POY 60 -0.02 1.60 186.2 184.5 0 47
Travel & Leisure
Gooderson Leisure Corp GDN 60 0.01 0.32 37.5 37.2 0 38
Other
Automobiles & Parts
Dorbyl DLV 60 0.56 0.29 44.9 43.0 6 44
Beverages
Distell Group Limited DST 60 0.09 0.15 17.1 16.9 1 96
Construction & Materials
Brikor Ltd BIK 60 0.95 1.06 136.6 134.0 2 52
Ceramic Industries Limited CRM 60 0.06 0.21 27.9 27.6 0 46
Distribution and Warehousing Network DAW 60 0.12 0.30 32.1 31.8 0 93
Erbacon Investment Holdings ERB 60 0.26 0.58 68.8 68.1 1 35
Sanyati Holdings SAN 54 1.17 0.31 47.2 40.7 24 73
Sea Kay Holdings SKY 59 0.47 0.52 72.7 71.6 2 68
William Tell Holdings Ltd WTL 58 0.19 0.56 76.0 75.2 1 32
Electronic & Electrical Equipment
IDECO Group Limited IDE 52 -0.05 1.00 119.1 117.9 0 20
Equity Investment Instruments
Brimstone Investment Corporation Ld BRT 60 0.25 0.22 23.5 23.0 1 39
New Bond Capital Limited NBC 60 0.59 0.23 31.3 29.2 11 87
Financial Services
Blue Financial Services BFS 60 0.21 0.68 89.5 88.7 0 89
Fixed Line Telecommunications
Telemasters Holdings Limited TLM 60 0.43 0.58 67.4 66.5 1 40
Food & Drug Retailers
Pick N Pay Holdings Limited PWK 60 0.40 0.15 18.4 17.2 11 100
Food Producers
AH-Vest Limited AHL 59 -0.34 1.01 114.4 112.7 0 10
General Retailers
African and Overseas Enterprises Limited AOVP 25 -0.42 0.87 86.7 83.4 2 2
African and Overseas Enterprises Ltd AON 58 -0.02 0.28 53.3 52.8 0 9
Hardware Warehouse Ltd HWW 60 1.28 0.66 92.8 88.1 7 20
Italtile Ltd ITE 60 0.52 0.19 24.2 22.6 13 67
Rex Trueform Clothing Company Ltd RTO 50 -0.29 0.41 43.3 42.3 2 6
Health Care Equipment & Services
Afrocentric Investment Corp Limited ACTP 59 0.09 0.27 51.1 50.6 0 9
(continued on next page)

EQUITY RISK SERVICE – Q4 2013 Igor Rodionov
21 BNP PARIBAS 14 JANUARY 2014
EXHIBIT 3: ALL STOCKS VS ALL SHARE INDEX (cont’d)
Security Code No. of
Months Beta Std
Error Annualised
Total risk Annualised
Unique Risk R² % Days Traded
(β) (%) (%) (%) (%)
Industrial Metals & Mining
African Eagle Resources PLC AEA 60 -0.62 1.26 147.2 144.6 2 35
Evraz Highveld Steel & Vanadium EHS 60 0.27 0.38 42.3 41.7 1 89
Palabora Mining PAM 60 0.70 0.31 37.0 35.1 8 98
Leisure Goods
Amalgamated Appliance Holdings Ltd AMA 60 0.54 0.26 37.6 35.9 7 86
Media
Caxton & CTP CAT 60 0.57 0.22 26.8 25.2 10 87
Mining
Central Rand Gold Ltd CRD 60 -0.01 1.44 157.8 156.4 0 64
DiamondCorp Plc DMC 60 0.53 1.46 197.9 195.9 0 21
Eastern Platinum Limited EPS 60 1.02 0.45 52.9 50.0 9 98
Firestone Energy Ltd FSE 55 -0.51 0.84 83.2 81.8 2 62
Gold One International Ltd GDO 55 0.77 0.51 49.6 48.0 5 99
Great Basin Gold Limited GBG 58 0.42 0.49 63.8 62.8 1 73
Platfields Limited PLL 31 0.03 1.47 79.7 78.3 0 69
Rockwell Diamonds Incor RDI 60 1.02 0.86 99.9 97.4 3 33
South African Coal Mining Holdings SAH 29 0.83 2.47 116.2 113.1 2 28
Tawana Resources NL TAW 60 1.14 1.14 130.3 127.3 3 34
Nonlife Insurance
Zurich Insurance Co SA ZSA 60 -0.13 0.11 13.8 13.6 3 23
Oil & Gas Producers
Oando Plc OAO 60 0.64 0.46 48.4 47.1 4 65
Personal Goods
Seardel Investment Corp SER 60 0.63 0.48 53.8 52.5 4 43
Seardel Investment Corp N SRN 60 0.21 0.51 62.8 62.2 0 30
Real Estate Investment & Services
Orion Real Estate Ltd. ORE 60 1.10 0.70 78.2 75.4 4 25
Quantum Prop Group Ltd QPG 37 1.02 0.67 71.8 67.2 7 9
Sable Holdings Limited SBL 54 0.82 0.42 64.1 61.3 8 10
Tradehold Limited TDH 60 0.87 0.51 62.4 60.2 5 47
Real Estate Investment Trusts
Fairvest Property Hldgs FVT 60 0.11 0.24 23.4 23.2 1 33
Fortress Incume Fund ltd FFB 50 -0.17 0.26 23.1 22.8 0 68
Support Services
Excellerate Holdings Limited EXL 57 0.06 0.26 35.5 35.2 0 28
Lonrho Plc LAF 26 1.22 1.21 74.7 70.3 8 30
Mix Telematics Ltd MIX 60 0.94 0.45 53.0 50.5 8 84
RGT Smart Market Intelligence Ltd RGT 39 -0.47 1.08 85.1 83.1 1 22
Technology Hardware & Equipment
Africa Cellular Towers Ltd ATR 54 0.66 0.55 76.4 74.6 3 69
Travel & Leisure
1time Holdings Ltd 1TM 60 0.09 1.00 75.2 74.5 0 76
Cullinan Holdings CUL 60 0.18 0.53 60.4 59.8 1 34
Note: The table is sorted according to size classification and sector classification. Sources: JSE; BNP Paribas Cadiz

EQUITY RISK SERVICE – Q4 2013 Igor Rodionov
22 BNP PARIBAS 14 JANUARY 2014
4.2 FTSE/JSE Financial & Industrial (J250) as market proxy
EXHIBIT 4: FTSE/JSE INDICES VS FINANCIAL AND INDUSTRIAL INDEX
Index Code No. of
Months Beta Std Error Annualised
Total risk Annualised
Unique Risk R²
(β) (%) (%) (%)
Africa Headline Indices
JSE All Share Index J203 60 1.04 0.06 15.1 6.1 84
JSE Top 40 Index J200 60 1.11 0.08 16.6 7.5 80
JSE Mid Cap Index J201 60 0.68 0.06 10.7 5.7 72
JSE Small Cap Index J202 60 0.58 0.06 9.8 6.0 62
JSE Fledgling Index J204 60 0.46 0.09 10.5 8.5 34
Tradeable Indices
JSE Resource 20 Index J210 60 1.11 0.17 22.4 16.6 44
JSE Industrial 25 Index J211 60 1.07 0.03 14.7 3.3 95
JSE Financial 15 Index J212 60 1.09 0.06 15.9 6.4 84
JSE Financial and Industrial 30 Index J213 60 1.10 0.02 14.8 1.8 99
Secondary Markets
JSE Development Capital Index J230 60 0.33 0.49 49.5 48.9 1
JSE Venture Capital Index J231 60 1.69 0.77 80.4 76.5 8
JSE ALTX Index J232 60 0.57 0.21 21.9 20.3 12
JSE ALTX 15 Index J233 60 0.57 0.27 27.7 26.4 7
Specialist Indices
JSE Socially Responsible Investment Index J100 60 1.07 0.07 16.1 7.4 79
JSE SA Financials and Industrials Index J250 60 1.00 0.00 13.4 0.0 100
JSE Preference Share Index J251 60 0.14 0.07 6.9 6.6 7
JSE SA Listed Property Index J253 60 0.33 0.12 12.5 11.6 12
JSE Capped Property Index J254 60 0.44 0.10 11.3 9.5 28
JSE Property Unit Trust Index J255 60 0.32 0.11 11.4 10.5 14
JSE Property Loan Stock Index J256 60 0.33 0.13 13.4 12.6 11
JSE SA Industrials Index J257 60 1.01 0.03 13.7 2.5 96
JSE SA Resources Index J258 60 1.11 0.17 22.3 16.6 44
JSE Dividend+ Index J259 60 0.91 0.06 13.6 6.2 79
JSE RAFI 40 Index J260 60 1.11 0.06 16.1 6.3 84
Capped Indices
JSE Capped Top 40 Index J300 60 1.08 0.07 16.0 6.9 81
JSE Capped All Share Index J303 60 1.03 0.06 14.9 5.8 85
Style Indices
JSE Value Index J330 60 0.98 0.05 14.2 5.3 86
JSE Growth Index J331 60 1.07 0.09 16.9 9.1 71
Shareholder Weighted Indices
JSE Shareholder Weighted Top 40 Index J400 60 1.07 0.06 15.3 5.6 87
JSE Shareholder Weighted All Share Index J403 60 0.98 0.04 13.7 4.2 91
Industry Indices
JSE Oil & Gas Index J500 60 0.92 0.16 20.3 16.0 36
JSE Basic Materials Index J510 60 1.14 0.17 22.7 16.7 45
JSE Industrials Index J520 60 0.89 0.08 14.1 7.5 71
JSE Consumer Goods Index J530 60 1.09 0.11 18.2 10.8 64
JSE Health Care Index J540 60 0.44 0.12 13.6 12.2 19
JSE Consumer Services Index J550 60 1.01 0.08 15.9 8.3 72
JSE Telecommunication Index J560 60 1.06 0.14 20.0 14.1 50
JSE Financials Index J580 60 0.97 0.06 14.3 6.0 83
JSE Technology Index J590 60 0.78 0.18 20.5 17.5 25
(continued on next page)

EQUITY RISK SERVICE – Q4 2013 Igor Rodionov
23 BNP PARIBAS 14 JANUARY 2014
EXHIBIT 4: FTSE/JSE INDICES VS FINANCIAL AND INDUSTRIAL INDEX (cont’d)
Index Code No. of
Months Beta Std Error Annualised
Total risk Annualised
Unique Risk R²
(β) (%) (%) (%)
Sector Indices
JSE Oil & Gas Producers Index J055 60 0.92 0.16 20.3 16.0 36
JSE Chemicals Index J135 60 0.76 0.12 15.7 11.9 41
JSE Forestry & Paper Index J173 60 1.72 0.24 32.7 23.0 49
JSE Industrial Metals Index J175 60 0.76 0.20 22.1 19.4 21
JSE Mining Index J177 60 1.14 0.18 23.5 17.7 42
JSE Construction & Materials Index J235 60 0.75 0.17 20.0 17.1 25
JSE General Industrials Index J272 60 0.81 0.08 13.6 8.2 63
JSE Electronic & Electrical Equipment Index J273 60 0.78 0.15 18.5 15.2 32
JSE Industrial Engineering Index J275 60 0.80 0.20 22.4 19.5 23
JSE Industrial Transportation Index J277 60 1.22 0.13 21.0 13.1 60
JSE Support Services Index J279 60 0.90 0.14 18.0 13.3 44
JSE Automobiles & Parts Index J335 60 0.45 0.34 35.1 34.3 3
JSE Beverages Index J353 60 0.97 0.14 19.2 14.0 46
JSE Food Producers Index J357 60 0.54 0.09 11.5 8.9 39
JSE Household Goods Index J372 60 1.15 0.22 26.8 21.8 33
JSE Personal Goods Index J376 60 1.55 0.21 29.8 21.2 49
JSE Health Care Equipment & Services Index J453 60 0.34 0.13 13.5 12.6 12
JSE Pharmaceuticals & Biotechnology Index J457 60 0.53 0.17 18.5 17.0 15
JSE Food & Drug Retailers Index J533 60 0.51 0.16 17.5 15.9 15
JSE General Retailers Index J537 60 1.03 0.14 19.3 13.4 51
JSE Media Index J555 60 1.32 0.18 25.1 17.8 50
JSE Travel & Leisure Index J575 60 0.71 0.13 16.0 12.8 35
JSE Fixed Line Telecommunications Index J653 60 0.78 0.27 28.9 26.7 13
JSE Mobile Telecommunications Index J657 60 1.09 0.15 20.9 14.9 49
JSE Banks Index J835 60 1.10 0.11 18.5 11.3 63
JSE Nonlife Insurance Index J853 60 0.22 0.17 17.6 17.2 2
JSE Life Insurance Index J857 60 1.03 0.10 16.8 9.4 67
JSE General Financial Index J877 60 1.29 0.11 20.7 11.4 70
JSE Equity Investment Instruments Index J898 60 0.57 0.12 14.0 11.7 29
JSE Software & Computer Services Index J953 60 0.78 0.18 20.9 18.0 24
Sub Sector Indices
JSE Gold Mining Index J150 60 -0.09 0.32 31.7 31.4 0
JSE Coal Mining Index J151 60 0.14 0.25 25.0 24.7 1
JSE Platinum Mining Index J153 60 1.22 0.24 29.1 24.0 32
JSE General Mining Index J154 60 1.46 0.18 26.9 18.3 53
Sources: JSE; BNP Paribas Cadiz Securities

EQUITY RISK SERVICE – Q4 2013 Igor Rodionov
24 BNP PARIBAS 14 JANUARY 2014
EXHIBIT 5: ALL STOCKS VS FINANCIAL AND INDUSTRIAL INDEX
Security Code No. of
Months Beta Std
Error Annualised
Total risk Annualised
Unique Risk R² % Days Traded
(β) (%) (%) (%) (%)
J200 Large Caps
Banks
Barclays Africa Group Limited BGA 60 1.05 0.15 21.0 15.4 46 100
Firstrand Limited FSR 60 1.19 0.13 20.2 12.4 62 100
Nedbank Group. NED 60 1.08 0.15 20.8 14.9 49 100
RMB Holdings RMH 60 1.17 0.15 21.3 14.3 54 100
Standard Bank Group SBK 60 1.05 0.15 21.0 15.4 46 100
Beverages
SABMiller SAB 60 0.97 0.14 19.2 14.0 45 100
Financial Services
Investec Ltd INL 60 1.77 0.17 29.5 17.3 66 100
Investec PLC INP 60 1.75 0.19 30.3 18.9 62 100
Food & Drug Retailers
Shoprite SHP 60 0.46 0.21 21.3 20.3 8 100
Food Producers
Tiger Brands TBS 60 0.80 0.15 18.7 15.2 33 100
Forestry & Paper
Mondi Limited MND 60 1.62 0.24 32.3 23.6 46 100
Mondi Plc MNP 60 1.80 0.24 33.7 23.1 51 100
General Industrials
Bidvest Group BVT 60 1.02 0.11 17.2 10.4 62 100
Remgro REM 60 0.86 0.09 14.6 9.0 62 100
General Retailers
Truworths International TRU 60 1.04 0.22 25.5 21.1 30 100
Woolworths Holdings WHL 60 1.05 0.19 23.2 18.2 37 100
Health Care Equipment & Services
Life Healthcare Group Holdings LHC 42 -0.11 0.27 18.0 17.7 0 100
Medi-Clinicrp MDC 60 0.26 0.17 16.9 16.4 5 100
Household Goods & Home Construction
Steinhoff International Holdings SHF 60 1.14 0.22 26.7 21.6 33 100
Industrial Metals & Mining
Kumba Iron Ore KIO 60 0.80 0.26 28.1 25.8 15 100
Industrial Transportation
Imperial Holdings IPL 60 1.43 0.18 26.3 17.9 53 100
Life Insurance
Discovery Holdings DSY 60 0.56 0.15 16.3 14.4 20 100
Old Mutual Plc OML 60 1.33 0.20 26.5 19.4 45 100
Sanlam SLM 60 0.96 0.11 16.6 10.4 60 99
Media
Naspers NPN 60 1.33 0.19 25.8 18.5 48 100
Mobile Telecommunications
MTN Group MTN 60 1.12 0.16 22.0 15.9 48 100
VODACOM Group Ltd VOD 55 0.61 0.23 20.0 18.5 13 100
Personal Goods
Compagnie Financiere Richemont AG CFR 60 1.54 0.21 29.8 21.2 49 100
Pharmaceuticals & Biotechnology
Aspen Pharmacare Holdings Ltd APN 60 0.54 0.23 23.6 22.3 9 100
Real Estate Investment & Services
Capital & Countries Properties CCO 43 0.27 0.27 19.2 18.7 3 100
Real Estate Investment Trusts
Growthpoint Prop Ltd GRT 60 0.48 0.16 16.8 15.4 15 100
Intu Properties Plc ITU 60 1.19 0.18 24.1 18.0 43 97
Tobacco
British American Tobacco PLC BTI 60 0.37 0.19 19.4 18.6 6 100
(continued on next page)

EQUITY RISK SERVICE – Q4 2013 Igor Rodionov
25 BNP PARIBAS 14 JANUARY 2014
EXHIBIT 5: ALL STOCKS VS FINANCIAL AND INDUSTRIAL INDEX (cont’d)
Security Code No. of
Months Beta Std
Error Annualised
Total risk Annualised
Unique Risk R² % Days Traded
(β) (%) (%) (%) (%)
J201 Mid Caps
Banks
Capitec Bank Hldgs Ltd CPI 60 0.40 0.25 26.0 25.2 4 99
Chemicals
AECI AFE 60 0.72 0.16 18.8 16.0 26 100
African Oxygen Ltd AFX 60 0.78 0.22 23.7 21.1 19 100
Omnia Holdings Ltd OMN 60 0.71 0.16 18.8 16.1 26 99
Construction & Materials
Aveng AEG 60 0.80 0.26 27.9 25.5 15 100
Murray & Roberts MUR 60 0.97 0.28 30.7 27.5 18 98
PPC Limited PPC 60 0.43 0.21 21.5 20.5 7 100
Wilson Bayly Holmes-Ovcon WBO 60 1.00 0.20 23.6 19.3 32 100
Electronic & Electrical Equipment
Allied Electronics Corp Part Prf ATNP 60 0.76 0.16 18.9 15.7 29 100
Allied Electronics Corporation Ltd ATN 60 0.72 0.21 22.9 20.6 18 99
Reunert RLO 60 0.78 0.19 21.7 18.9 23 100
Equity Investment Instruments
Hosken Cons Invest HCI 60 0.30 0.21 21.4 20.8 3 95
Rand Merchant Insurance Holdings Ltd RMI 33 0.74 0.32 17.7 16.0 16 100
Reinet Investments SCA REI 60 0.64 0.15 16.8 14.3 26 100
Financial Services
African Bank Investments Ltd ABL 60 0.84 0.30 31.9 29.6 13 100
Brait SA BAT 60 0.27 0.26 26.1 25.7 2 99
Coronation Fund Managers CML 60 0.96 0.20 23.8 19.8 31 99
PSG Group PSG 60 0.51 0.27 27.6 26.5 6 100
Fixed Line Telecommunications
Telkom TKG 60 0.83 0.27 28.8 26.3 15 100
Food & Drug Retailers
Clicks Group Ltd CLS 60 0.87 0.19 21.9 18.5 28 98
Pick N Pay Stores PIK 60 0.52 0.18 19.4 18.0 13 100
The Spar Group SPP 60 0.47 0.16 16.8 15.4 14 100
Food Producers
AngloVaal Industries ORD AVI 60 0.58 0.17 19.1 17.3 17 100
Illovo Sugar ILV 60 0.24 0.20 20.7 20.3 2 100
Oceana Group OCE 60 -0.05 0.23 23.1 22.9 0 91
Pioneer Foods Group Ltd PFG 60 0.50 0.19 20.1 18.9 10 100
RCL Foods Limited RCL 60 0.14 0.16 15.7 15.5 1 95
Tongaat Hulett TON 60 -0.16 0.20 20.6 20.3 1 100
Forestry & Paper
Sappi SAP 60 1.58 0.30 36.6 29.4 34 100
General Industrials
Barloworld BAW 60 1.12 0.25 29.6 25.3 26 100
KAP Industrial Holdings Ltd KAP 60 0.73 0.29 29.2 27.4 11 81
Nampak NPK 60 0.31 0.17 17.1 16.4 6 100
General Retailers
Massmart Holdings Ltd MSM 60 0.88 0.21 23.9 20.6 25 100
Mr Price Group MPC 60 0.76 0.21 23.4 20.9 19 100
The Foschini Group Ltd TFG 60 1.28 0.21 27.0 20.6 41 100
Health Care Equipment & Services
Netcare NTC 60 0.55 0.17 18.2 16.5 17 100
Industrial Metals & Mining
Arcelor Mittal South Africa Ltd ACL 60 0.82 0.33 34.6 32.5 10 100
Industrial Transportation
Grindrod GND 60 0.95 0.21 24.5 20.7 27 100
Trencor Ltd TRE 60 0.38 0.22 22.5 21.7 5 91
Life Insurance
Liberty Holdings Limited Ord LBH 60 0.35 0.14 14.5 13.6 10 97
MMI Holdings Ltd MMI 60 0.80 0.18 20.6 17.5 27 100
Nonlife Insurance
Santam SNT 60 0.22 0.17 17.6 17.2 2 100
Pharmaceuticals & Biotechnology
Adcock Ingram Holdings Ltd AIP 60 0.52 0.16 17.7 16.2 15 100
Real Estate Investment & Services
New Europe Property Investments Plc NEP 54 0.17 0.20 17.2 16.9 2 81
(continued on next page)

EQUITY RISK SERVICE – Q4 2013 Igor Rodionov
26 BNP PARIBAS 14 JANUARY 2014
EXHIBIT 5: ALL STOCKS VS FINANCIAL AND INDUSTRIAL INDEX (cont’d)
Security Code No. of
Months Beta
Std Error
Annualised Total risk
Annualised Unique Risk R²
% Days Traded
(β) (%) (%) (%) (%)
Real Estate Investment Trusts
Acucap Properties Limited ACP 60 0.34 0.14 14.4 13.5 10 99
Capital Property Fund CPL 60 0.30 0.14 14.2 13.6 7 100
Emira Property Fund EMI 60 0.25 0.12 12.3 11.8 7 100
Fountainhead Property Trust FPT 60 0.38 0.12 13.4 12.2 15 100
Hyprop Investments Ltd HYP 60 0.20 0.17 16.9 16.5 2 99
Redefine Properties Ltd RDF 60 0.23 0.16 16.0 15.6 3 100
Resilient Prop Inc Fd RES 60 0.01 0.15 15.2 15.1 0 99
SA Corporate Real Estate Fund SAC 60 0.29 0.14 14.1 13.5 7 100
Vukile Property Fund VKE 60 0.45 0.16 17.5 16.2 12 99
Software & Computer Services
Datatec DTC 60 1.56 0.24 32.0 23.9 43 100
Travel & Leisure
Sun International Ltd SUI 60 0.76 0.19 21.2 18.4 23 100
Tsogo Sun Holdings Ltd TSH 60 0.44 0.16 16.9 15.7 12 98
J202 Small Caps
Automobiles & Parts
Metair Investments Ord MTA 60 0.50 0.35 35.1 34.2 4 88
Beverages
Capevin Holdings Ltd CVH 16 -0.04 0.52 16.3 15.8 2 99
Construction & Materials
Afrimat Ltd AFT 60 0.34 0.26 25.9 25.3 3 97
Group Five/South Africa GRF 60 1.15 0.25 29.5 24.9 28 100
Raubex Group RBX 60 0.84 0.29 31.0 28.6 13 100
Stefanutti Stocks Hld Ltd SSK 60 0.48 0.29 29.8 28.9 5 98
Electronic & Electrical Equipment
Consolidated Infrastructure Group Ltd CIL 39 1.10 0.40 24.2 21.3 18 84
Ellies Holdings Ltd ELI 60 0.98 0.39 40.9 38.3 11 95
Equity Investment Instruments
Brimstone Investment Corp N BRN 60 -0.07 0.27 26.1 25.9 0 77
Niveus Investments Ltd NIV 15 1.04 1.24 38.1 35.0 9 69
Pallinghurst Resources Guernsey Ltd PGL 60 1.35 0.36 39.6 34.8 21 99
Financial Services
Grande Parade GPL 60 0.45 0.25 25.9 24.9 5 94
JSE JSE 60 0.82 0.22 24.5 21.7 21 100
Peregrine Holdings PGR 60 1.68 0.22 31.0 21.2 51 87
Transaction Capital Ltd TCP 18 -0.09 0.53 17.3 16.8 0 98
Zeder Investments ZED 60 0.56 0.14 16.1 14.2 22 100
Food Producers
Afgri Limited AFR 60 1.18 0.28 31.8 27.3 25 99
Astral Foods Ltd ARL 60 0.23 0.17 16.9 16.5 3 100
Clover Industries ltd CLR 36 0.48 0.38 21.0 20.2 5 99
General Industrials
Eqstra Holdings EQS 60 0.75 0.25 26.9 24.8 14 100
Mpact Ltd MPT 29 0.19 0.37 17.5 17.1 0 100
General Retailers
Advtech ADH 60 0.58 0.13 15.1 12.9 25 78
Cashbuild Ltd CSB 60 0.23 0.26 26.0 25.7 1 97
Curro Holdings Limited COH 30 0.36 1.10 53.4 52.5 0 100
Holdsport Ltd HSP 29 0.51 0.39 19.4 18.5 6 99
JD Group JDG 60 1.14 0.22 26.8 21.9 32 100
Lewis Group LEW 60 1.08 0.16 21.5 15.8 46 100
Industrial Engineering
Bell Equipment Co BEL 60 1.00 0.45 47.0 44.6 9 94
Howden Africa Holdings HWN 60 0.60 0.25 25.7 24.4 10 62
Hudaco Industries HDC 60 0.83 0.23 25.5 22.8 19 99
Invicta Holdings IVT 60 0.53 0.22 22.5 21.1 10 94
Industrial Transportation
Super Group Ltd SPG 60 1.55 0.44 48.0 42.6 19 98
Life Insurance
Clientele CLI 60 0.03 0.16 15.2 15.1 1 67
Media
Times Media Group Ltd TMG 15 0.64 0.67 20.0 18.4 8 93
Mobile Telecommunications
Blue Label Telecoms Ltd. BLU 60 0.70 0.31 32.4 30.7 9 100
Real Estate Investment & Services
Delta Property Fund Ltd DLT 13 0.68 0.34 11.6 9.3 31 95
Premium Properties PMM 60 0.14 0.20 20.1 19.8 1 85
(continued on next page)

EQUITY RISK SERVICE – Q4 2013 Igor Rodionov
27 BNP PARIBAS 14 JANUARY 2014
EXHIBIT 5: ALL STOCKS VS FINANCIAL AND INDUSTRIAL INDEX (cont’d)
Security Code No. of
Months Beta
Std Error
Annualised Total risk
Annualised Unique Risk R²
% Days Traded
(β) (%) (%) (%) (%)
Real Estate Investment Trusts
Arrowhead Properties Ltd AWA 24 0.67 0.36 14.6 13.2 15 100
Ascension Properties Ltd AIB 18 0.60 0.48 15.2 13.9 9 58
Ascension Properties Ltd-A units AIA 18 -0.43 0.35 12.2 11.1 12 65
Fortress Income Fund Ltd FFA 50 0.16 0.14 10.9 10.6 3 94
Hospitality Property A HPA 60 -0.01 0.16 16.3 16.1 1 78
Hospitality Property B HPB 60 0.49 0.39 39.2 38.4 3 88
Investec Property Fund Limited IPF 32 -0.09 0.44 22.2 21.8 0 99
Octodec Investments OCT 60 -0.07 0.22 21.7 21.5 0 88
Rebosis Property Fund Ltd REB 31 -0.04 0.29 14.8 14.5 0 92
Sycom Property Fund SYC 60 0.39 0.16 16.9 15.9 10 99
Software & Computer Services
Business Connexion Group Ltd BCX 60 0.22 0.21 20.8 20.4 2 99
EOH Holdings Ltd. EOH 60 0.47 0.26 25.9 25.0 5 95
Support Services
Adcorp Holdings Ltd ADR 60 0.32 0.24 22.6 22.1 3 98
Metrofile Holdings MFL 60 0.07 0.22 21.7 21.5 0 94
Net 1 Ueps Technologies Inc NT1 60 0.46 0.61 55.8 55.1 1 64
Technology Hardware & Equipment
Pinnacle Technology Holdings PNC 60 0.30 0.27 27.9 27.4 2 95
Travel & Leisure
City Lodge Hotels Ltd CLH 60 0.60 0.17 18.9 17.0 18 100
Famous Brands FBR 60 0.88 0.23 25.2 22.1 21 99
Spur Corp SUR 60 0.55 0.24 23.5 22.3 9 96
J204 Fledging
Automobiles & Parts
Control Instruments Group CNL 60 0.95 0.58 52.6 50.9 5 61
Beverages
Awethu Breweries AWT 60 -0.46 0.98 101.5 100.1 1 50
Construction & Materials
Basil Read Holdings BSR 60 0.43 0.34 34.4 33.6 3 100
Calgro M3 Holdings CGR 60 -0.13 0.69 69.8 69.2 0 60
Esorfranki Ltd ESR 60 0.92 0.39 40.9 38.6 9 99
Kaydav Group Ltd KDV 60 0.32 0.48 46.2 45.6 0 27
Masonite Africa MAS 60 0.40 0.30 38.3 37.4 3 24
Mazor Group MZR 60 1.52 0.37 41.6 35.5 24 65
Protech Khuthele Hldg Ld PKH 60 0.31 0.35 36.2 35.7 1 94
Electronic & Electrical Equipment
Amalgamated Electronics Corp AER 60 0.02 0.37 37.7 37.4 0 66
ARB Holdings Ltd ARH 60 0.70 0.34 35.5 33.9 7 87
CAFCA Ltd CAC 23 1.72 1.38 118.8 84.3 13 3
Digicore Holdings DGC 60 0.85 0.32 34.7 32.5 11 94
Jasco Electronics Holdings JSC 60 0.50 0.43 43.0 42.1 2 91
South Ocean Holdings SOH 60 1.34 0.36 40.0 35.4 20 81
Equity Investment Instruments
Sabvest SBV 50 -0.06 0.40 41.0 40.6 0 9
Sabvest Lmt N SVN 57 -0.23 0.40 42.1 41.5 1 12
Trematon Capital Investments TMT 60 0.27 0.24 24.6 24.1 2 34
Financial Services
Cadiz Holdings CDZ 60 0.90 0.29 30.7 28.0 15 91
Conduit Capital CND 60 -0.39 0.49 47.1 46.3 1 63
Efficient Group Ltd EFG 27 0.60 2.19 75.4 73.8 0 15
London Finance and Investment Group LNF 60 0.01 0.32 43.0 42.6 0 10
Prescient Limited PCT 16 0.30 0.67 20.7 19.9 1 91
Purple Capital PPE 60 0.84 0.49 49.3 47.6 5 78
Sasfin Holdings SFN 60 0.40 0.25 25.4 24.6 4 88
Sekunjalo Investments SKJ 60 0.16 0.47 47.1 46.7 0 84
Trustco Group Holdings Limited TTO 58 1.57 0.77 67.7 64.1 9 78
Food Producers
Country Bird Holdings CBH 60 -0.03 0.36 36.1 35.8 0 90
Crookes Brothers CKS 60 0.18 0.29 28.6 28.3 0 34
Sovereign Food Investments SOV 60 0.87 0.34 36.6 34.3 11 80
General Industrials
Argent Industrial Ltd ART 60 0.33 0.28 27.7 27.1 2 98
Astrapak Limited APK 60 0.96 0.30 32.6 29.7 16 84
Bowler Metcalf BCF 60 0.28 0.20 20.8 20.3 3 81
Transpaco TPC 60 0.60 0.24 23.5 22.2 10 54
(continued on next page)

EQUITY RISK SERVICE – Q4 2013 Igor Rodionov
28 BNP PARIBAS 14 JANUARY 2014
EXHIBIT 5: ALL STOCKS VS FINANCIAL AND INDUSTRIAL INDEX (cont’d)
Security Code No. of
Months Beta
Std Error
Annualised Total risk
Annualised Unique Risk R²
% Days Traded
(β) (%) (%) (%) (%)
General Retailers
Combined Motor Hldgs Ltd CMH 60 0.34 0.27 27.3 26.7 2 77
Nictus NCS 60 -0.12 0.47 47.5 47.1 0 21
REX Trueform Clothing Sco RTN 56 0.20 0.30 38.5 37.9 0 12
Taste Holdings TAS 60 1.21 0.55 55.7 52.8 9 85
Verimark Holdings VMK 60 -0.49 0.48 45.9 45.0 3 78
Health Care Equipment & Services
Afrocentric Investment Corp Ltd ACT 60 0.43 0.39 36.6 35.9 2 82
Industrial Engineering
Austro Group Ltd ASO 60 0.10 0.34 31.3 31.0 0 69
Master Drilling Group Ltd MDI 12 -0.17 0.70 19.4 18.3 2 81
Industrial Transportation
Cargo Carriers CRG 60 0.38 0.26 25.9 25.2 3 18
OneLogix Group Ltd OLG 60 0.39 0.39 38.5 37.9 2 90
Santova Limited SNV 60 0.23 0.69 68.1 67.5 0 72
Value Group VLE 60 0.17 0.25 22.5 22.2 1 78
Leisure Goods
Nu-World Holdings NWL 60 0.27 0.34 36.0 35.5 1 56
Media
African Media Entertainment Ltd AME 60 0.31 0.16 15.3 14.7 2 27
Mining
Jubilee Platinum PLC JBL 60 0.99 0.85 85.9 84.0 3 99
Pharmaceuticals & Biotechnology
Litha Healthcare Group LHG 60 0.68 0.46 43.3 42.0 4 77
Real Estate Investment & Services
Adrenna Prop Group Ltd ANA 60 -0.82 0.62 65.7 63.8 4 35
Ingenuity Property Inv L ING 60 0.14 0.27 29.5 29.2 1 32
Putprop Ltd PPR 60 -0.19 0.38 29.4 29.0 0 33
Real Estate Investment Trusts
Annuity Properties Ltd ANP 19 0.25 0.45 15.3 14.7 2 88
Synergy Income Fund Ltd SGA 24 0.28 0.41 18.0 17.5 2 44
Vividend Income Fund Ltd VIF 37 0.24 0.21 12.4 12.0 4 93
Vunani Prop Inv Fund Ltd VPF 28 0.44 0.39 19.5 18.6 4 61
Software & Computer Services
Adaptit Holdings Ltd ADI 60 0.67 0.59 54.6 53.4 3 55
Compu Clearing Outs Ltd CCL 60 -0.23 0.35 38.2 37.7 0 27
Convergenet Holdings Limited CVN 60 -0.17 0.49 50.0 49.5 0 81
Datacentrix Holdings DCT 60 0.24 0.33 31.1 30.7 1 96
Gijima Group Limited GIJ 60 1.56 0.52 56.7 51.9 15 100
Securedata Holdings SDH 60 0.84 0.45 45.5 43.9 6 43
Support Services
ELB Group ELR 60 0.64 0.36 33.6 32.4 6 63
Iliad Africa ILA 60 1.00 0.41 42.9 40.4 10 96
Kelly Group KEL 60 0.23 0.29 29.9 29.5 1 76
Marshall Monteagle PLC MMP 34 -0.76 0.48 31.3 29.3 9 33
MICROmega Holdings MMG 60 1.39 1.04 100.9 98.2 5 39
MORVEST Bus Group Ltd MOR 33 -0.62 0.70 35.9 34.5 4 95
Primeserv Group PMV 60 -0.12 0.58 50.3 49.9 0 32
Winhold Limited WNH 60 0.68 0.26 26.6 24.9 11 82
Technology Hardware & Equipment
Mustek MST 60 0.61 0.54 52.1 51.1 2 91
Travel & Leisure
Comair COM 60 0.49 0.41 41.0 40.2 2 85
DON Group DON 60 0.69 0.37 36.2 34.8 6 74
Phumelela Gaming & Leisure PHM 60 0.26 0.31 30.8 30.4 1 79
Wilderness Holdings Ltd WIL 40 0.45 0.89 54.5 53.6 1 13
J232 Altx
Construction & Materials
Accentuate Limited ACE 60 0.49 0.54 53.0 52.2 1 44
B&W Instrumentation & Electrical BWI 60 0.48 0.50 49.7 48.9 2 85
Chemical Specialities CSP 60 0.76 0.74 72.3 70.9 2 92
W G Wearne WEA 60 1.86 1.06 110.9 105.7 8 83
Electronic & Electrical Equipment
Ansys ANS 60 1.37 0.85 84.1 81.0 6 86
Equity Investment Instruments
Blackstar Group SE BCK 28 1.45 1.28 66.9 62.6 8 72
(continued on next page)

EQUITY RISK SERVICE – Q4 2013 Igor Rodionov
29 BNP PARIBAS 14 JANUARY 2014
EXHIBIT 5: ALL STOCKS VS FINANCIAL AND INDUSTRIAL INDEX (cont’d)
Security Code No. of
Months Beta
Std Error
Annualised Total risk
Annualised Unique Risk R²
% Days Traded
(β) (%) (%) (%) (%)
Financial Services
African Dawn Capital Ltd ADW 60 1.15 0.95 95.3 92.9 3 97
Finbond Group Litd FGL 60 0.92 1.21 108.3 106.6 1 47
Global Asset Management Ltd GAM 11 -1.67 1.76 77.2 57.5 38 14
Stratcorp STA 60 0.70 1.03 111.3 109.7 1 20
Vunani Capital Holdings VUN 60 2.01 0.88 90.3 84.3 11 55
General Retailers
Alert Steel Holdings Ltd AET 60 -0.44 0.78 75.7 74.6 1 75
Household Goods & Home Construction
RBA Holdings Ltd RBA 60 0.56 1.02 89.9 89.0 1 82
Industrial Engineering
Mine Restoration Investments Ltd MRI 18 -0.33 1.00 34.7 33.3 3 64
PSV Holdings Ltd. PSV 60 -0.02 0.63 62.6 62.0 0 72
Industrial Metals & Mining
BSI Steel Ltd BSS 60 -0.12 0.35 35.8 35.4 0 77
Media
MoneyWeb Holdings MNY 60 0.62 0.66 70.4 69.2 2 23
Mining
Chrometco CMO 60 0.07 0.92 92.7 91.9 0 76
Personal Goods
Beige Holdings BEG 60 1.10 0.49 53.2 50.4 9 89
Imbalie Beauty Limited ILE 60 0.12 0.90 99.0 98.2 1 42
Pharmaceuticals & Biotechnology
Nutritional Holdings Limited NUT 29 1.14 3.28 164.2 158.8 3 89
Real Estate Investment & Services
Mas Real Estate Inc. MSP 44 -0.55 0.54 35.3 34.2 3 21
Rockcastle Global Real Estate Co Ltd ROC 17 0.46 0.52 16.8 15.8 5 85
Real Estate Investment Trusts
Oasis Crescent Property Fund OAS 60 -0.06 0.08 7.0 6.9 1 21
Software & Computer Services
ISA Holdings ISA 60 0.77 0.40 40.1 38.4 6 80
Silverbridge Holdings SVB 60 0.62 1.08 118.3 116.9 0 20
Total Client Services TCS 60 0.73 2.18 199.5 197.5 0 34
Support Services
Interwaste Holdings Ltd IWE 60 0.93 0.49 45.0 43.1 6 72
M&S Holdings Ltd MSA 60 0.35 0.60 53.4 52.8 1 68
Rare Holdings Ltd RAR 60 0.56 0.74 66.0 65.1 0 59
Torre Industrial Holdings Ltd TOR 13 -2.45 1.19 47.7 30.8 52 88
Workforce Limited WKF 55 0.01 0.50 54.2 53.7 0 11
Technology Hardware & Equipment
Foneworx Holdings FWX 60 0.41 0.35 38.8 38.0 2 75
Huge Group Ltd HUG 60 0.15 0.79 79.6 79.0 0 56
Poynting Holdings Ltd POY 60 0.06 1.77 186.2 184.5 0 47
Travel & Leisure
Gooderson Leisure Corp GDN 60 0.37 0.36 37.5 36.8 2 38
Electricity
IPSA Group PLC IPS 60 1.08 0.91 95.1 92.8 3 53
Other
Automobiles & Parts
Dorbyl DLV 60 0.93 0.33 44.9 41.6 13 44
Beverages
Distell Group Limited DST 60 0.24 0.17 17.1 16.7 4 96
Construction & Materials
Brikor Ltd BIK 60 1.39 1.35 136.6 133.2 3 52
Ceramic Industries Limited CRM 60 0.29 0.24 27.9 27.3 3 46
Distribution and Warehousing Network DAW 60 0.23 0.33 32.1 31.7 1 93
Erbacon Investment Holdings ERB 60 0.66 0.64 68.8 67.4 3 35
Sanyati Holdings SAN 54 1.55 0.32 47.2 38.3 32 73
Sea Kay Holdings SKY 59 0.67 0.58 72.7 71.2 3 68
William Tell Holdings Ltd WTL 58 0.19 0.61 76.0 75.3 1 32
Electronic & Electrical Equipment
IDECO Group Limited IDE 52 0.19 1.08 119.1 117.9 0 20
Equity Investment Instruments
Brimstone Investment Corporation Ld BRT 60 0.17 0.25 23.5 23.2 0 39
New Bond Capital Limited NBC 60 0.85 0.25 31.3 28.3 17 87
(continued on next page)

EQUITY RISK SERVICE – Q4 2013 Igor Rodionov
30 BNP PARIBAS 14 JANUARY 2014
EXHIBIT 5: ALL STOCKS VS FINANCIAL AND INDUSTRIAL INDEX (cont’d)
Security Code No. of
Months Beta
Std Error
Annualised Total risk
Annualised Unique Risk R²
% Days Traded
(β) (%) (%) (%) (%)
Financial Services
Blue Financial Services BFS 60 0.58 0.83 89.5 88.4 1 89
Fixed Line Telecommunications
Telemasters Holdings Limited TLM 60 0.35 0.65 67.4 66.7 0 40
Food & Drug Retailers
Pick N Pay Holdings Limited PWK 60 0.50 0.17 18.4 17.0 13 100
Food Producers
AH-Vest Limited AHL 59 -0.93 0.92 114.4 110.3 3 10
General Retailers
African and Overseas Enterprises Limited AOVP 25 -0.22 1.10 86.7 84.3 0 2
African and Overseas Enterprises Ltd AON 58 0.14 0.36 53.3 52.8 0 9
Hardware Warehouse Ltd HWW 60 1.39 0.80 92.8 88.8 6 20
Italtile Ltd ITE 60 0.68 0.21 24.2 22.1 16 67
Rex Trueform Clothing Company Ltd RTO 50 0.03 0.47 43.3 42.9 1 6
Health Care Equipment & Services
Afrocentric Investment Corp Limited ACTP 59 0.21 0.31 51.1 50.5 1 9
Industrial Metals & Mining
African Eagle Resources PLC AEA 60 -1.11 1.40 147.2 143.3 4 35
Leisure Goods
Amalgamated Appliance Holdings Ltd AMA 60 0.61 0.32 37.6 36.1 6 86
Media
Caxton & CTP CAT 60 0.49 0.26 26.8 25.8 6 87
Mining
DiamondCorp Plc DMC 60 0.61 1.72 197.9 195.9 0 21
Nonlife Insurance
Zurich Insurance Co SA ZSA 60 -0.08 0.14 13.8 13.7 1 23
Personal Goods
Seardel Investment Corp SER 60 0.81 0.55 53.8 52.3 5 43
Seardel Investment Corp N SRN 60 0.64 0.58 62.8 61.5 2 30
Real Estate Investment & Services
Orion Real Estate Ltd. ORE 60 1.01 0.81 78.2 76.3 2 25
Quantum Prop Group Ltd QPG 37 1.27 0.81 71.8 66.6 8 9
Sable Holdings Limited SBL 54 0.78 0.45 64.1 61.7 6 10
Tradehold Limited TDH 60 0.77 0.57 62.4 60.8 3 47
Real Estate Investment Trusts
Fairvest Property Hldgs FVT 60 0.04 0.24 23.4 23.2 1 33
Fortress Incume Fund ltd FFB 50 -0.26 0.31 23.1 22.7 0 68
Support Services
Excellerate Holdings Limited EXL 57 0.08 0.29 35.5 35.2 0 28
Lonrho Plc LAF 26 0.68 1.52 74.7 72.8 1 30
Mix Telematics Ltd MIX 60 1.24 0.50 53.0 49.7 11 84
RGT Smart Market Intelligence Ltd RGT 39 -0.09 1.23 85.1 83.9 0 22
Technology Hardware & Equipment
Africa Cellular Towers Ltd ATR 54 1.00 0.62 76.4 73.6 6 69
Travel & Leisure
1time Holdings Ltd 1TM 60 0.19 1.11 75.2 74.5 0 76
Cullinan Holdings CUL 60 0.13 0.55 60.4 59.9 1 34
Note: The table is sorted according to size classification and sector classification. Sources: JSE; BNP Paribas Cadiz Securities

EQUITY RISK SERVICE – Q4 2013 Igor Rodionov
31 BNP PARIBAS 14 JANUARY 2014
4.3 FTSE/JSE Resource Index (J258) as market proxy
EXHIBIT 6: FTSE/JSE INDICES VS RESOURCES INDEX
Index Code No. of
Months Beta Std Error Annualised
Total risk Annualised
Unique Risk R²
(β) (%) (%) (%)
Africa Headline Indices
JSE All Share Index J203 60 0.61 0.04 15.1 6.5 82
JSE Top 40 Index J200 60 0.68 0.04 16.6 6.4 85
JSE Mid Cap Index J201 60 0.23 0.06 10.7 9.3 24
JSE Small Cap Index J202 60 0.21 0.05 9.8 8.6 23
JSE Fledgling Index J204 60 0.16 0.06 10.5 9.8 12
Tradeable Indices
JSE Resource 20 Index J210 60 1.00 0.00 22.4 0.7 100
JSE Industrial 25 Index J211 60 0.46 0.06 14.7 10.4 49
JSE Financial 15 Index J212 60 0.40 0.08 15.9 13.0 32
JSE Financial and Industrial 30 Index J213 60 0.46 0.06 14.8 10.7 48
Secondary Markets
JSE Development Capital Index J230 60 -0.11 0.30 49.5 49.0 0
JSE Venture Capital Index J231 60 0.70 0.47 80.4 78.2 4
JSE ALTX Index J232 60 0.22 0.13 21.9 21.1 5
JSE ALTX 15 Index J233 60 0.16 0.17 27.7 27.2 2
Specialist Indices
JSE Socially Responsible Investment Index J100 60 0.66 0.04 16.1 6.2 85
JSE SA Financials and Industrials Index J250 60 0.40 0.06 13.4 9.9 44
JSE Preference Share Index J251 60 0.06 0.04 6.9 6.7 3
JSE SA Listed Property Index J253 60 -0.09 0.07 12.5 12.3 3
JSE Capped Property Index J254 60 -0.01 0.07 11.3 11.2 0
JSE Property Unit Trust Index J255 60 -0.05 0.07 11.4 11.3 1
JSE Property Loan Stock Index J256 60 -0.10 0.08 13.4 13.1 3
JSE SA Industrials Index J257 60 0.43 0.06 13.7 9.8 48
JSE SA Resources Index J258 60 1.00 0.00 22.3 0.0 100
JSE Dividend+ Index J259 60 0.42 0.06 13.6 9.8 47
JSE RAFI 40 Index J260 60 0.64 0.04 16.1 7.4 79
Capped Indices
JSE Capped Top 40 Index J300 60 0.66 0.04 16.0 6.5 83
JSE Capped All Share Index J303 60 0.60 0.04 14.9 6.5 81
Style Indices
JSE Value Index J330 60 0.50 0.05 14.2 8.7 61
JSE Growth Index J331 60 0.70 0.04 16.9 6.6 85
Shareholder Weighted Indices
JSE Shareholder Weighted Top 40 Index J400 60 0.59 0.05 15.3 7.8 74
JSE Shareholder Weighted All Share Index J403 60 0.51 0.05 13.7 7.6 69
Industry Indices
JSE Oil & Gas Index J500 60 0.73 0.07 20.3 11.9 64
JSE Basic Materials Index J510 60 1.01 0.01 22.7 2.0 99
JSE Industrials Index J520 60 0.31 0.07 14.1 12.2 24
JSE Consumer Goods Index J530 60 0.53 0.08 18.2 13.7 43
JSE Health Care Index J540 60 0.16 0.08 13.6 13.1 7
JSE Consumer Services Index J550 60 0.42 0.08 15.9 12.7 36
JSE Telecommunication Index J560 60 0.37 0.11 20.0 18.1 18
JSE Financials Index J580 60 0.33 0.07 14.3 12.2 27
JSE Technology Index J590 60 0.29 0.12 20.5 19.3 9
(continued on next page)

EQUITY RISK SERVICE – Q4 2013 Igor Rodionov
32 BNP PARIBAS 14 JANUARY 2014
EXHIBIT 6: FTSE/JSE INDICES VS RESOURCES INDEX (cont’d)
Index Code No. of
Months Beta Std Error Annualised
Total risk Annualised
Unique Risk R²
(β) (%) (%) (%)
Sector Indices
JSE Oil & Gas Producers Index J055 60 0.73 0.07 20.3 11.9 64
JSE Chemicals Index J135 60 0.18 0.09 15.7 15.1 7
JSE Forestry & Paper Index J173 60 0.85 0.16 32.7 26.4 33
JSE Industrial Metals Index J175 60 0.53 0.11 22.1 18.5 28
JSE Mining Index J177 60 1.05 0.01 23.5 2.0 99
JSE Construction & Materials Index J235 60 0.22 0.12 20.0 19.2 6
JSE General Industrials Index J272 60 0.30 0.07 13.6 11.8 25
JSE Electronic & Electrical Equipment Index J273 60 0.21 0.11 18.5 17.8 7
JSE Industrial Engineering Index J275 60 0.38 0.13 22.4 20.6 14
JSE Industrial Transportation Index J277 60 0.46 0.11 21.0 18.1 24
JSE Support Services Index J279 60 0.43 0.09 18.0 15.1 29
JSE Automobiles & Parts Index J335 60 0.17 0.20 35.1 34.6 2
JSE Beverages Index J353 60 0.47 0.10 19.2 15.9 30
JSE Food Producers Index J357 60 0.18 0.06 11.5 10.6 13
JSE Household Goods Index J372 60 0.70 0.13 26.8 21.5 34
JSE Personal Goods Index J376 60 0.78 0.14 29.8 24.0 35
JSE Health Care Equipment & Services Index J453 60 0.11 0.08 13.5 13.1 4
JSE Pharmaceuticals & Biotechnology Index J457 60 0.18 0.11 18.5 18.0 5
JSE Food & Drug Retailers Index J533 60 0.13 0.10 17.5 17.1 2
JSE General Retailers Index J537 60 0.33 0.11 19.3 17.7 15
JSE Media Index J555 60 0.68 0.12 25.1 19.8 38
JSE Travel & Leisure Index J575 60 0.24 0.09 16.0 14.9 11
JSE Fixed Line Telecommunications Index J653 60 0.39 0.17 28.9 27.3 9
JSE Mobile Telecommunications Index J657 60 0.39 0.11 20.9 18.8 17
JSE Banks Index J835 60 0.37 0.10 18.5 16.5 20
JSE Nonlife Insurance Index J853 60 0.03 0.11 17.6 17.4 0
JSE Life Insurance Index J857 60 0.45 0.08 16.8 13.4 35
JSE General Financial Index J877 60 0.53 0.10 20.7 16.8 34
JSE Equity Investment Instruments Index J898 60 0.26 0.08 14.0 12.6 17
JSE Software & Computer Services Index J953 60 0.30 0.12 20.9 19.7 10
Sub Sector Indices
JSE Gold Mining Index J150 60 0.65 0.17 31.7 28.0 20
JSE Coal Mining Index J151 60 0.34 0.14 25.0 23.6 10
JSE Platinum Mining Index J153 60 1.04 0.10 29.1 17.5 64
JSE General Mining Index J154 60 1.15 0.05 26.9 7.7 92
Sources: JSE; BNP Paribas Cadiz Securities

EQUITY RISK SERVICE – Q4 2013 Igor Rodionov
33 BNP PARIBAS 14 JANUARY 2014
EXHIBIT 7: RESOURCE STOCKS VS RESOURCE INDEX
Security Code No. of
Months Beta
Std Error
Annualised Total risk
Annualised Unique Risk R²
% Days Traded
(β) (%) (%) (%) (%)
J200 Large Caps
Forestry & Paper
Mondi Limited MND 60 0.90 0.15 32.3 24.8 40 100
Mondi Plc MNP 60 0.96 0.15 33.7 25.2 42 100
Industrial Metals & Mining
Kumba Iron Ore KIO 60 0.68 0.14 28.1 23.2 30 100
Mining
African Rainbow Minerals Ltd ARI 60 0.85 0.12 28.2 20.5 46 100
Anglo American AGL 60 1.25 0.11 33.1 17.0 72 100
Anglo American Platinum AMS 60 0.87 0.14 30.9 23.6 41 100
Anglogold Ashanti Ltd ANG 60 0.78 0.19 36.4 31.3 25 100
Assore Limited ASR 60 1.08 0.15 33.2 23.3 50 96
BHP Billiton BIL 60 1.08 0.07 26.9 11.4 83 100
Exxaro Resources EXX 60 0.87 0.13 28.8 20.8 47 100
Impala Platinum Hlds IMP 60 1.04 0.14 33.7 23.7 50 100
Oil & Gas Producers
Sasol SOL 60 0.72 0.07 20.2 11.9 64 100
J201 Mid Caps
Chemicals
AECI AFE 60 0.17 0.11 18.8 18.3 4 100
African Oxygen Ltd AFX 60 0.20 0.14 23.7 23.1 4 100
Omnia Holdings Ltd OMN 60 0.25 0.11 18.8 17.8 9 99
Forestry & Paper
Sappi SAP 60 0.66 0.20 36.6 33.0 17 100
Industrial Metals & Mining
Arcelor Mittal South Africa Ltd ACL 60 0.54 0.19 34.6 32.1 13 100
Mining
Gold Fields GFI 60 0.54 0.18 32.4 29.7 14 100
Harmony HAR 60 0.35 0.22 36.9 35.7 5 100
Lonmin PLC LON 60 1.24 0.17 41.0 29.1 50 100
Northam Platinum NHM 60 0.90 0.19 38.0 31.4 30 100
Royal Bafokeng Platinum RBP 37 0.60 0.17 23.5 19.7 28 100
J202 Small Caps
Mining
Aquarius Platinum Ltd AQP 60 1.04 0.27 50.8 43.8 24 99
Pan African Resources Plc PAN 60 0.48 0.27 47.3 45.6 6 99
Sibanye Gold Limited SGL 10 0.95 0.83 72.2 53.3 40 100
J204 Fledging
Chemicals
Delta EMD Ltd DTA 60 0.22 0.24 38.4 37.8 2 67
Rolfes Technology Hldgs RLF 60 0.18 0.26 42.5 42.0 1 67
Spanjaard SPA 60 -0.03 0.17 33.4 33.1 1 16
Forestry & Paper
York Timber Holdings Ltd YRK 60 -0.20 0.21 35.3 34.7 2 82
Industrial Metals & Mining
Hulamin HLM 60 0.30 0.22 37.4 36.5 3 99
Insimbi Ref & Alloy ISB 60 0.48 0.24 38.5 36.8 7 60
Metmar MML 60 0.40 0.19 31.6 30.1 8 95
ZCI Ltd ZCI 60 -0.50 0.37 72.6 69.8 5 26
(continued on next page)

EQUITY RISK SERVICE – Q4 2013 Igor Rodionov
34 BNP PARIBAS 14 JANUARY 2014
EXHIBIT 7: RESOURCE STOCKS VS RESOURCE INDEX (cont’d)
Security Code No. of
Months Beta
Std Error
Annualised Total risk
Annualised Unique Risk R²
% Days Traded
(β) (%) (%) (%) (%)
Mining
Atlatsa Resources Corp ATL 60 1.09 0.40 73.3 66.8 16 88
Bauba Platinum Ltd BAU 42 0.52 0.48 71.8 69.6 4 37
BuildMax Limited BDM 60 0.21 0.26 43.6 43.0 1 91
Coal of Africa Ltd CZA 60 0.74 0.34 59.7 56.3 10 99
DRD Gold DRD 60 0.51 0.26 45.3 43.3 7 100
Goliath Gold Mining Limited GGM 60 0.07 0.27 48.2 47.8 0 47
Hwange Colliery Co. Ltd. HWA 60 0.48 0.35 72.0 69.9 4 19
Infrasors Holdings IRA 60 1.09 0.37 68.2 61.5 17 72
Keaton Energy Holdings Ltd KEH 60 0.20 0.21 37.0 36.4 1 94
Merafe Resources MRF 60 0.65 0.23 41.2 37.9 14 100
Miranda Mineral Holdings Ltd. MMH 60 0.20 0.28 47.6 47.0 1 90
Petmin Ltd. PET 60 0.19 0.17 28.7 28.2 2 99
Randgold & Exploration Company Ltd RNG 60 0.65 0.27 44.3 41.6 10 83
Sable Platimum Ltd SLP 12 -0.45 0.32 27.9 22.8 28 63
Sentula Mining SNU 60 0.29 0.31 52.5 51.6 2 94
Sephaku Holdings Ltd SEP 52 0.09 0.37 52.7 52.2 0 59
Trans HEX Group TSX 60 0.12 0.28 47.7 47.3 0 96
Village Main Reef Ltd VIL 60 0.72 0.50 82.2 79.3 5 66
Wescoal Holdings Limited WSL 60 0.18 0.26 44.2 43.7 1 97
Wesizwe Platinum WEZ 60 0.67 0.37 63.6 60.8 7 100
Witwatersrand Cons Gold Resources WGR 60 0.37 0.37 55.0 53.9 2 61
Oil & Gas Producers
Sacoil Holdings Ltd SCL 56 0.39 0.61 94.8 93.4 1 80
Other
Industrial Metals & Mining
Evraz Highveld Steel & Vanadium EHS 60 0.25 0.26 42.3 41.5 2 89
Palabora Mining PAM 60 0.52 0.21 37.0 34.7 10 98
Mining
Central Rand Gold Ltd CRD 60 -0.18 0.96 157.8 155.8 1 64
Eastern Platinum Limited EPS 60 0.75 0.30 52.9 49.3 12 98
Firestone Energy Ltd FSE 55 -0.47 0.57 83.2 81.0 4 62
Gold One International Ltd GDO 55 0.69 0.32 49.6 46.6 10 99
Great Basin Gold Limited GBG 58 0.39 0.33 63.8 62.3 2 73
Platfields Limited PLL 31 0.26 0.93 79.7 78.2 0 69
Rockwell Diamonds Incor RDI 60 0.37 0.67 99.9 98.6 1 33
South African Coal Mining Holdings SAH 29 0.51 1.29 116.2 112.0 3 28
Tawana Resources NL TAW 60 0.78 0.77 130.3 126.3 4 34
Oil & Gas Producers
Oando Plc OAO 60 0.29 0.32 48.4 47.6 2 65
Note: The table is sorted according to size classification and sector classification. Sources: JSE; BNP Paribas Cadiz Securities

EQUITY RISK SERVICE – Q4 2013 Igor Rodionov
35 BNP PARIBAS 14 JANUARY 2014
4.4 FTSE/JSE Top40 (J200) as market proxy
EXHIBIT 8: FTSE/JSE INDICES VS TOP40
Index Code No. of
Months Beta Std Error Annualised Total risk
Annualised Unique Risk R²
(β) (%) (%) (%)
Africa Headline Indices
JSE All Share Index J203 60 0.91 0.01 15.1 1.2 99
JSE Top 40 Index J200 60 1.00 0.00 16.6 0.0 100
JSE Mid Cap Index J201 60 0.44 0.06 10.7 7.8 46
JSE Small Cap Index J202 60 0.39 0.06 9.8 7.4 42
JSE Fledgling Index J204 60 0.30 0.08 10.5 9.2 22
Tradeable Indices
JSE Resource 20 Index J210 60 1.25 0.07 22.4 8.5 85
JSE Industrial 25 Index J211 60 0.80 0.05 14.7 6.0 83
JSE Financial 15 Index J212 60 0.75 0.08 15.9 9.8 62
JSE Financial and Industrial 30 Index J213 60 0.81 0.05 14.8 6.1 83
Secondary Markets
JSE Development Capital Index J230 60 0.00 0.40 49.5 49.1 0
JSE Venture Capital Index J231 60 1.25 0.63 80.4 77.0 7
JSE ALTX Index J232 60 0.40 0.17 21.9 20.7 9
JSE ALTX 15 Index J233 60 0.34 0.22 27.7 26.9 4
Specialist Indices
JSE Socially Responsible Investment Index J100 60 0.96 0.02 16.1 2.0 98
JSE SA Financials and Industrials Index J250 60 0.72 0.05 13.4 6.0 80
JSE Preference Share Index J251 60 0.10 0.05 6.9 6.6 6
JSE SA Listed Property Index J253 60 0.06 0.10 12.5 12.4 1
JSE Capped Property Index J254 60 0.17 0.09 11.3 10.8 7
JSE Property Unit Trust Index J255 60 0.09 0.09 11.4 11.2 2
JSE Property Loan Stock Index J256 60 0.05 0.11 13.4 13.3 0
JSE SA Industrials Index J257 60 0.75 0.05 13.7 5.8 82
JSE SA Resources Index J258 60 1.24 0.07 22.3 8.5 85
JSE Dividend+ Index J259 60 0.68 0.06 13.6 7.5 69
JSE RAFI 40 Index J260 60 0.95 0.03 16.1 3.1 96
Capped Indices
JSE Capped Top 40 Index J300 60 0.96 0.01 16.0 0.6 100
JSE Capped All Share Index J303 60 0.89 0.01 14.9 1.3 99
Style Indices
JSE Value Index J330 60 0.78 0.04 14.2 5.5 85
JSE Growth Index J331 60 1.00 0.03 16.9 3.4 96
Shareholder Weighted Indices
JSE Shareholder Weighted Top 40 Index J400 60 0.90 0.02 15.3 3.0 96
JSE Shareholder Weighted All Share Index J403 60 0.80 0.03 13.7 3.5 93
Industry Indices
JSE Oil & Gas Index J500 60 0.98 0.10 20.3 12.0 64
JSE Basic Materials Index J510 60 1.26 0.07 22.7 8.7 85
JSE Industrials Index J520 60 0.58 0.08 14.1 10.2 47
JSE Consumer Goods Index J530 60 0.88 0.09 18.2 10.7 65
JSE Health Care Index J540 60 0.29 0.10 13.6 12.6 13
JSE Consumer Services Index J550 60 0.73 0.08 15.9 10.2 58
JSE Telecommunication Index J560 60 0.74 0.13 20.0 15.7 38
JSE Financials Index J580 60 0.64 0.08 14.3 9.4 56
JSE Technology Index J590 60 0.53 0.15 20.5 18.4 18
(continued on next page)

EQUITY RISK SERVICE – Q4 2013 Igor Rodionov
36 BNP PARIBAS 14 JANUARY 2014
EXHIBIT 8: FTSE/JSE INDICES VS TOP40 (cont’d)
Index Code No. of
Months Beta Std Error Annualised Total risk
Annualised Unique Risk R²
(β) (%) (%) (%)
Sector Indices
JSE Oil & Gas Producers Index J055 60 0.98 0.10 20.3 12.0 64
JSE Chemicals Index J135 60 0.44 0.11 15.7 13.9 21
JSE Forestry & Paper Index J173 60 1.36 0.20 32.7 23.5 46
JSE Industrial Metals Index J175 60 0.70 0.15 22.1 18.6 28
JSE Mining Index J177 60 1.29 0.08 23.5 9.6 83
JSE Construction & Materials Index J235 60 0.42 0.15 20.0 18.5 12
JSE General Industrials Index J272 60 0.55 0.08 13.6 10.0 45
JSE Electronic & Electrical Equipment Index J273 60 0.45 0.14 18.5 16.8 16
JSE Industrial Engineering Index J275 60 0.60 0.16 22.4 19.9 19
JSE Industrial Transportation Index J277 60 0.85 0.13 21.0 15.3 45
JSE Support Services Index J279 60 0.67 0.11 18.0 13.9 38
JSE Automobiles & Parts Index J335 60 0.29 0.27 35.1 34.5 2
JSE Beverages Index J353 60 0.78 0.11 19.2 13.9 46
JSE Food Producers Index J357 60 0.36 0.08 11.5 9.7 27
JSE Household Goods Index J372 60 1.01 0.17 26.8 20.7 39
JSE Personal Goods Index J376 60 1.28 0.17 29.8 20.6 52
JSE Health Care Equipment & Services Index J453 60 0.21 0.10 13.5 12.9 7
JSE Pharmaceuticals & Biotechnology Index J457 60 0.34 0.14 18.5 17.5 10
JSE Food & Drug Retailers Index J533 60 0.30 0.14 17.5 16.6 8
JSE General Retailers Index J537 60 0.65 0.13 19.3 15.9 31
JSE Media Index J555 60 1.07 0.14 25.1 17.6 51
JSE Travel & Leisure Index J575 60 0.46 0.11 16.0 14.0 22
JSE Fixed Line Telecommunications Index J653 60 0.58 0.22 28.9 27.0 11
JSE Mobile Telecommunications Index J657 60 0.76 0.13 20.9 16.5 37
JSE Banks Index J835 60 0.72 0.11 18.5 14.0 42
JSE Nonlife Insurance Index J853 60 0.09 0.14 17.6 17.4 0
JSE Life Insurance Index J857 60 0.77 0.09 16.8 10.8 57
JSE General Financial Index J877 60 0.93 0.11 20.7 13.7 56
JSE Equity Investment Instruments Index J898 60 0.43 0.10 14.0 12.0 25
JSE Software & Computer Services Index J953 60 0.54 0.15 20.9 18.8 18
Sub Sector Indices
JSE Gold Mining Index J150 60 0.49 0.25 31.7 30.4 6
JSE Coal Mining Index J151 60 0.30 0.20 25.0 24.3 4
JSE Platinum Mining Index J153 60 1.30 0.16 29.1 19.4 56
JSE General Mining Index J154 60 1.50 0.08 26.9 10.2 85
Sources: JSE; BNP Paribas Cadiz Securities

EQUITY RISK SERVICE – Q4 2013 Igor Rodionov
37 BNP PARIBAS 14 JANUARY 2014
EXHIBIT 9: ALL STOCKS VS TOP40
Security Code No. of
Months Beta Std
Error Annualised
Total risk Annualised
Unique Risk R² % Days Traded
(β) (%) (%) (%) (%)
J200 Large Caps
Banks
Barclays Africa Group Limited BGA 60 0.74 0.14 21.0 16.8 35 100
Firstrand Limited FSR 60 0.80 0.12 20.2 15.1 43 100
Nedbank Group. NED 60 0.66 0.14 20.8 17.6 28 100
RMB Holdings RMH 60 0.74 0.14 21.3 17.2 34 100
Standard Bank Group SBK 60 0.70 0.14 21.0 17.4 31 100
Beverages
SABMiller SAB 60 0.78 0.12 19.2 14.0 46 100
Financial Services
Investec Ltd INL 60 1.39 0.15 29.5 18.1 63 100
Investec PLC INP 60 1.41 0.15 30.3 18.9 61 100
Food & Drug Retailers
Shoprite SHP 60 0.23 0.17 21.3 20.8 3 100
Food Producers
Tiger Brands TBS 60 0.57 0.13 18.7 16.0 26 100
Forestry & Paper
Mondi Limited MND 60 1.39 0.18 32.3 22.3 51 100
Mondi Plc MNP 60 1.50 0.18 33.7 22.2 55 100
General Industrials
Bidvest Group BVT 60 0.72 0.10 17.2 12.3 47 100
Remgro REM 60 0.57 0.09 14.6 11.1 42 100
General Retailers
Truworths International TRU 60 0.66 0.19 25.5 22.8 19 100
Woolworths Holdings WHL 60 0.69 0.16 23.2 19.9 25 100
Health Care Equipment & Services
Life Healthcare Group Holdings LHC 42 -0.32 0.20 18.0 17.2 7 100
Medi-Clinicrp MDC 60 0.22 0.13 16.9 16.4 5 100
Household Goods & Home Construction
Steinhoff International Holdings SHF 60 1.00 0.17 26.7 20.6 39 100
Industrial Metals & Mining
Kumba Iron Ore KIO 60 0.86 0.20 28.1 23.9 26 100
Industrial Transportation
Imperial Holdings IPL 60 1.02 0.16 26.3 19.9 42 100
Life Insurance
Discovery Holdings DSY 60 0.43 0.12 16.3 14.5 19 100
Old Mutual Plc OML 60 0.96 0.17 26.5 20.9 36 100
Sanlam SLM 60 0.71 0.09 16.6 11.6 51 99
Media
Naspers NPN 60 1.08 0.15 25.8 18.4 49 100
Mining
African Rainbow Minerals Ltd ARI 60 1.01 0.18 28.2 22.5 36 100
Anglo American AGL 60 1.63 0.16 33.1 18.6 67 100
Anglo American Platinum AMS 60 1.07 0.20 30.9 24.9 34 100
Anglogold Ashanti Ltd ANG 60 0.67 0.28 36.4 34.3 9 100
Assore Limited ASR 60 1.48 0.19 33.2 22.7 53 96
BHP Billiton BIL 60 1.42 0.10 26.9 12.6 78 100
Exxaro Resources EXX 60 1.01 0.19 28.8 23.1 34 100
Impala Platinum Hlds IMP 60 1.33 0.20 33.7 24.9 45 100
Mobile Telecommunications
MTN Group MTN 60 0.78 0.14 22.0 17.5 36 100
VODACOM Group Ltd VOD 55 0.44 0.18 20.0 18.7 11 100
Oil & Gas Producers
Sasol SOL 60 0.97 0.10 20.2 12.0 64 100
Personal Goods
Compagnie Financiere Richemont AG CFR 60 1.28 0.17 29.8 20.6 52 100
Pharmaceuticals & Biotechnology
Aspen Pharmacare Holdings Ltd APN 60 0.37 0.18 23.6 22.6 7 100
Real Estate Investment & Services
Capital & Countries Properties CCO 43 0.27 0.21 19.2 18.6 4 100
Real Estate Investment Trusts
Growthpoint Prop Ltd GRT 60 0.16 0.13 16.8 16.5 3 100
Intu Properties Plc ITU 60 0.84 0.16 24.1 19.5 33 97
Tobacco
British American Tobacco PLC BTI 60 0.25 0.15 19.4 18.8 4 100
(continued on next page)

EQUITY RISK SERVICE – Q4 2013 Igor Rodionov
38 BNP PARIBAS 14 JANUARY 2014
EXHIBIT 9: ALL STOCKS VS TOP40 (cont’d)
Security Code No. of
Months Beta Std
Error Annualised
Total risk Annualised
Unique Risk R² % Days Traded
(β) (%) (%) (%) (%)
J201 Mid Caps
Banks
Capitec Bank Hldgs Ltd CPI 60 0.14 0.21 26.0 25.7 1 99
Chemicals
AECI AFE 60 0.40 0.14 18.8 17.4 12 100
African Oxygen Ltd AFX 60 0.44 0.18 23.7 22.4 9 100
Omnia Holdings Ltd OMN 60 0.50 0.14 18.8 16.8 19 99
Construction & Materials
Aveng AEG 60 0.44 0.22 27.9 26.7 7 100
Murray & Roberts MUR 60 0.48 0.24 30.7 29.4 7 98
PPC Limited PPC 60 0.28 0.17 21.5 20.8 5 100
Wilson Bayly Holmes-Ovcon WBO 60 0.54 0.18 23.6 21.6 15 100
Electronic & Electrical Equipment
Allied Electronics Corp Part Prf ATNP 60 0.58 0.13 18.9 16.1 26 100
Allied Electronics Corporation Ltd ATN 60 0.42 0.18 22.9 21.6 9 99
Reunert RLO 60 0.39 0.17 21.7 20.6 9 100
Equity Investment Instruments
Hosken Cons Invest HCI 60 0.22 0.17 21.4 20.9 3 95
Rand Merchant Insurance Holdings Ltd RMI 33 0.52 0.23 17.7 16.0 16 100
Reinet Investments SCA REI 60 0.48 0.12 16.8 14.7 22 100
Financial Services
African Bank Investments Ltd ABL 60 0.43 0.25 31.9 30.9 5 100
Brait SA BAT 60 0.09 0.21 26.1 25.9 0 99
Coronation Fund Managers CML 60 0.52 0.18 23.8 21.9 14 99
PSG Group PSG 60 0.25 0.22 27.6 27.1 2 100
Fixed Line Telecommunications
Telkom TKG 60 0.68 0.21 28.8 26.2 16 100
Food & Drug Retailers
Clicks Group Ltd CLS 60 0.53 0.16 21.9 19.9 16 98
Pick N Pay Stores PIK 60 0.41 0.15 19.4 18.0 12 100
The Spar Group SPP 60 0.30 0.13 16.8 15.9 9 100
Food Producers
AngloVaal Industries ORD AVI 60 0.35 0.15 19.1 18.1 9 100
Illovo Sugar ILV 60 0.24 0.16 20.7 20.1 4 100
Oceana Group OCE 60 0.02 0.19 23.1 22.9 0 91
Pioneer Foods Group Ltd PFG 60 0.39 0.16 20.1 18.9 10 100
RCL Foods Limited RCL 60 0.11 0.13 15.7 15.5 1 95
Tongaat Hulett TON 60 -0.26 0.16 20.6 20.0 4 100
Forestry & Paper
Sappi SAP 60 1.16 0.25 36.6 30.7 28 100
General Industrials
Barloworld BAW 60 0.80 0.21 29.6 26.3 20 100
KAP Industrial Holdings Ltd KAP 60 0.48 0.24 29.2 28.0 7 81
Nampak NPK 60 0.25 0.13 17.1 16.4 6 100
General Retailers
Massmart Holdings Ltd MSM 60 0.60 0.17 23.9 21.5 17 100
Mr Price Group MPC 60 0.38 0.18 23.4 22.4 7 100
The Foschini Group Ltd TFG 60 0.77 0.19 27.0 23.5 23 100
Health Care Equipment & Services
Netcare NTC 60 0.41 0.14 18.2 16.8 14 100
Industrial Metals & Mining
Arcelor Mittal South Africa Ltd ACL 60 0.74 0.26 34.6 32.0 13 100
Industrial Transportation
Grindrod GND 60 0.70 0.18 24.5 21.4 22 100
Trencor Ltd TRE 60 0.26 0.18 22.5 21.9 3 91
Life Insurance
Liberty Holdings Limited Ord LBH 60 0.33 0.11 14.5 13.3 14 97
MMI Holdings Ltd MMI 60 0.65 0.14 20.6 17.5 27 100
Mining
Gold Fields GFI 60 0.39 0.26 32.4 31.4 4 100
Harmony HAR 60 0.10 0.30 36.9 36.6 0 100
Lonmin PLC LON 60 1.50 0.26 41.0 31.9 39 100
Northam Platinum NHM 60 1.12 0.27 38.0 32.6 25 100
Royal Bafokeng Platinum RBP 37 0.77 0.28 23.5 20.8 19 100
Nonlife Insurance
Santam SNT 60 0.09 0.14 17.6 17.4 0 100
(continued on next page)

EQUITY RISK SERVICE – Q4 2013 Igor Rodionov
39 BNP PARIBAS 14 JANUARY 2014
EXHIBIT 9: ALL STOCKS VS TOP40 (cont’d)
Security Code No. of
Months Beta Std
Error Annualised
Total risk Annualised
Unique Risk R² % Days Traded
(β) (%) (%) (%) (%)
Pharmaceuticals & Biotechnology
Adcock Ingram Holdings Ltd AIP 60 0.34 0.14 17.7 16.6 10 100
Real Estate Investment & Services
New Europe Property Investments Plc NEP 54 0.07 0.16 17.2 17.0 1 81
Real Estate Investment Trusts
Acucap Properties Limited ACP 60 0.09 0.12 14.4 14.2 1 99
Capital Property Fund CPL 60 0.05 0.11 14.2 14.1 0 100
Emira Property Fund EMI 60 0.04 0.10 12.3 12.2 0 100
Fountainhead Property Trust FPT 60 0.12 0.11 13.4 13.1 2 100
Hyprop Investments Ltd HYP 60 -0.12 0.14 16.9 16.6 2 99
Redefine Properties Ltd RDF 60 -0.05 0.13 16.0 15.9 0 100
Resilient Prop Inc Fd RES 60 -0.20 0.12 15.2 14.7 5 99
SA Corporate Real Estate Fund SAC 60 0.12 0.11 14.1 13.9 2 100
Vukile Property Fund VKE 60 0.22 0.14 17.5 17.0 4 99
Software & Computer Services
Datatec DTC 60 1.00 0.22 32.0 26.9 28 100
Travel & Leisure
Sun International Ltd SUI 60 0.46 0.16 21.2 19.5 13 100
Tsogo Sun Holdings Ltd TSH 60 0.26 0.13 16.9 16.2 7 98
J202 Small Caps
Automobiles & Parts
Metair Investments Ord MTA 60 0.34 0.28 35.1 34.4 3 88
Beverages
Capevin Holdings Ltd CVH 16 -0.16 0.33 16.3 15.6 5 99
Construction & Materials
Afrimat Ltd AFT 60 0.37 0.20 25.9 25.0 6 97
Group Five/South Africa GRF 60 0.68 0.22 29.5 27.0 15 100
Raubex Group RBX 60 0.43 0.24 31.0 29.9 5 100
Stefanutti Stocks Hld Ltd SSK 60 0.29 0.24 29.8 29.2 3 98
Electronic & Electrical Equipment
Consolidated Infrastructure Group Ltd CIL 39 0.69 0.30 24.2 22.1 13 84
Ellies Holdings Ltd ELI 60 0.79 0.31 40.9 38.3 11 95
Equity Investment Instruments
Brimstone Investment Corp N BRN 60 -0.06 0.22 26.1 25.9 0 77
Niveus Investments Ltd NIV 15 1.13 0.73 38.1 32.2 23 69
Pallinghurst Resources Guernsey Ltd PGL 60 0.85 0.30 39.6 36.6 13 99
Financial Services
Grande Parade GPL 60 0.20 0.20 25.9 25.5 1 94
JSE JSE 60 0.60 0.18 24.5 22.2 17 100
Peregrine Holdings PGR 60 1.16 0.21 31.0 24.3 36 87
Transaction Capital Ltd TCP 18 -0.23 0.35 17.3 16.5 4 98
Zeder Investments ZED 60 0.42 0.12 16.1 14.4 19 100
Food Producers
Afgri Limited AFR 60 0.78 0.23 31.8 28.7 17 99
Astral Foods Ltd ARL 60 0.11 0.14 16.9 16.7 1 100
Clover Industries ltd CLR 36 0.30 0.29 21.0 20.3 3 99
General Industrials
Eqstra Holdings EQS 60 0.47 0.21 26.9 25.6 8 100
Mpact Ltd MPT 29 -0.06 0.26 17.5 17.2 0 100
General Retailers
Advtech ADH 60 0.34 0.12 15.1 14.1 12 78
Cashbuild Ltd CSB 60 0.16 0.21 26.0 25.7 1 97
Curro Holdings Limited COH 30 0.21 0.77 53.4 52.5 0 100
Holdsport Ltd HSP 29 0.19 0.28 19.4 18.9 2 99
JD Group JDG 60 0.80 0.19 26.8 23.1 24 100
Lewis Group LEW 60 0.72 0.14 21.5 17.7 31 100
Industrial Engineering
Bell Equipment Co BEL 60 0.82 0.36 47.0 44.5 9 94
Howden Africa Holdings HWN 60 0.17 0.22 25.7 25.4 3 62
Hudaco Industries HDC 60 0.62 0.19 25.5 23.1 17 99
Invicta Holdings IVT 60 0.42 0.17 22.5 21.1 10 94
Industrial Transportation
Super Group Ltd SPG 60 0.89 0.38 48.0 45.1 10 98
Life Insurance
Clientele CLI 60 0.09 0.14 15.2 15.0 1 67
Media
Times Media Group Ltd TMG 15 0.14 0.44 20.0 19.2 0 93
(continued on next page)

EQUITY RISK SERVICE – Q4 2013 Igor Rodionov
40 BNP PARIBAS 14 JANUARY 2014
EXHIBIT 9: ALL STOCKS VS TOP40 (cont’d)
Security Code No. of
Months Beta Std
Error Annualised
Total risk Annualised
Unique Risk R² % Days Traded
(β) (%) (%) (%) (%)
Mining
Aquarius Platinum Ltd AQP 60 1.25 0.37 50.8 45.6 18 99
Pan African Resources Plc PAN 60 0.43 0.38 47.3 46.4 3 99
Sibanye Gold Limited SGL 10 1.40 1.51 72.2 57.7 29 100
Mobile Telecommunications
Blue Label Telecoms Ltd. BLU 60 0.41 0.26 32.4 31.4 5 100
Real Estate Investment & Services
Delta Property Fund Ltd DLT 13 0.23 0.25 11.6 10.7 9 95
Premium Properties PMM 60 -0.10 0.17 20.1 19.8 1 85
Real Estate Investment Trusts
Arrowhead Properties Ltd AWA 24 0.09 0.26 14.6 14.3 1 100
Ascension Properties Ltd AIB 18 0.20 0.34 15.2 14.6 0 58
Ascension Properties Ltd-A units AIA 18 -0.16 0.23 12.2 11.6 4 65
Fortress Income Fund Ltd FFA 50 0.00 0.11 10.9 10.8 0 94
Hospitality Property A HPA 60 -0.02 0.14 16.3 16.1 1 78
Hospitality Property B HPB 60 0.54 0.31 39.2 37.9 5 88
Investec Property Fund Limited IPF 32 -0.39 0.30 22.2 21.1 6 99
Octodec Investments OCT 60 -0.29 0.18 21.7 21.0 5 88
Rebosis Property Fund Ltd REB 31 -0.21 0.20 14.8 14.2 4 92
Sycom Property Fund SYC 60 0.15 0.13 16.9 16.6 2 99
Software & Computer Services
Business Connexion Group Ltd BCX 60 0.09 0.17 20.8 20.6 1 99
EOH Holdings Ltd. EOH 60 0.23 0.21 25.9 25.5 2 95
Support Services
Adcorp Holdings Ltd ADR 60 0.16 0.19 22.6 22.3 1 98
Metrofile Holdings MFL 60 -0.07 0.18 21.7 21.5 0 94
Net 1 Ueps Technologies Inc NT1 60 0.38 0.51 55.8 55.1 1 64
Technology Hardware & Equipment
Pinnacle Technology Holdings PNC 60 0.17 0.22 27.9 27.5 1 95
Travel & Leisure
City Lodge Hotels Ltd CLH 60 0.39 0.14 18.9 17.6 12 100
Famous Brands FBR 60 0.52 0.19 25.2 23.4 11 99
Spur Corp SUR 60 0.55 0.19 23.5 21.6 14 96
Note: The table is sorted according to size classification and sector classification. Sources: JSE; BNP Paribas Cadiz Securities

EQUITY RISK SERVICE – Q4 2013 Igor Rodionov
41 BNP PARIBAS 14 JANUARY 2014
5. Questions and answers
How do you compute beta?
We compute monthly returns for each share and the corresponding returns on the
JSE/FTSE All Share Index. If however a share has not been traded at month end, we
go back to the last day of trade and match the index to it in our return computation. If
you were to plot these points with the index’s returns on the horizontal axis and the
share’s returns on the vertical axis (as shown below), beta would be the slope of the
line that best fits these points. We have illustrated this in Exhibit 10 using Anglo
American.
EXHIBIT 10: Anglo American beta
Sources: I-Net Bridge; BNP Paribas Cadiz Securities
Could I estimate beta on my own?
There is no reason why not. You would however need a time series of both the share
returns as well as the market index returns. Be careful though, as there are some
tricks which can make all the difference between good and bad estimates. We have
implemented techniques which will improve beta estimation, especially for thinly-
traded shares. We want you to use our service and therefore it is important to us that
you have confidence in our estimates.
What estimation periods do you use?
We use the last five years of monthly returns, which is the last 60 data points.
Research has shown that the trade-off between the desire to include more data
points and concerns about the stationarity of beta point to 5 years of data as being
most suitable. We also know that using daily or even weekly prices in order to
maximise the number of data points is futile as it introduces considerable noise
(error) which can bias our estimates.
In our sector listing you will find some of the new companies which have less than 60
data points used in the estimation procedure. We advise you to use the betas of
these companies with caution, especially if there are less than about 40 data points
indicated in the column headed ‘No. of months’. We only include betas of shares and
sectors which have been listed for at least 5 months.
Are betas stable, or do they change?
Betas do change! The major causes for the changes in a company’s beta are linked
to a shift in the debt-to-equity ratio of a company or a shift in the risk of the projects
that the company takes on.
-0.30
-0.20
-0.10
0.00
0.10
0.20
0.30
-0.15 -0.10 -0.05 0.00 0.05 0.10 0.15
Anglo American
JSE All Share Index

EQUITY RISK SERVICE – Q4 2013 Igor Rodionov
42 BNP PARIBAS 14 JANUARY 2014
Do betas differ in bull and bear markets?
It would be nice if they did, unfortunately our research suggests that they don’t.
However we would be interested to know if you find a company with a beta that
does!
I knew of a share with a high beta, but it declined while the market was rising.
We could probably find many shares that did likewise. This occurrence is simply due
to the fact that such shares have high unique risk. Consequently, these shares would
have exhibited a large negative abnormal return over the particular period. Recall
that for any single share only a part of the variability (total risk) is due to market
movements. By combining shares into portfolios their unique risks are diversified
away and it is unlikely that such declines would have been significant in the portfolio
context.
I want to purchase more shares in a particular company but how will they influence the risk of my existing portfolio?
Assuming your existing portfolio is diversified, the beta of your portfolio is the only
measure that determines the risk of your portfolio. Consequently, only the beta of the
company you are considering can influence the risk of your portfolio. You can easily
determine the effect of the additional share on your portfolio’s risk by remembering
that the beta of your portfolio is simply the weighted average of its constituent betas.
But beta only tells us part of the story on risk, so why the emphasis on beta?
Most individuals attempt to hold diversified portfolios in order to reduce unique risk.
However, they know that their shares are tied together by a web of co-movements
which determine the limit of the diversification benefits. This limit is determined by
the market risk of their portfolio, and its beta precisely determines the sensitivity of
the portfolio to market movements.
What exactly is R2, and 1 - R
2?
Technically the R2 tells us how well the “best fitting” line “fits” the data points.
Interpreting this in a more useful way, it tells us what proportion of the share’s
movement is due to market movements, i.e. the proportion of market risk relative to
total risk. Clearly then 1-R2 tells us what proportion of the share’s movement is due
to unique factors, i.e. the 1- R2 measures the proportion of unique risk relative to
total risk.
The standard deviation, of a share in the tables is 48.5% per annum. How can I calculate its variability in monthly terms?
Our standard deviations in the tables are calculated on a monthly basis, and then
annualised. Hence the standard deviation of this share is interpreted as 48.5% per
annum. To convert this to monthly terms, simply divide the published figure by the
square root of 12, i.e. 48.5% ÷ √12 = 14% per month.

EQUITY RISK SERVICE – Q4 2013 Igor Rodionov
43 BNP PARIBAS 14 JANUARY 2014
6. A worked example
In this worked example1, assume that you have a portfolio consisting of only the four
companies listed in the table below which are held in the given investment
proportions.
EXHIBIT 11: Portfolio summary
Share Sector Proportion R2 Beta
Annualised Standard Deviation
(%) (%)
ANGLO AMERICAN Mining 0.4 70.43 1.72 38.02
WOOLWORTHS HOLDINGS General Retailers 0.1 20.84 0.67 27.06
ASPEN PHARMACARE HOLDINGS Pharmaceuticals & Biotechnology 0.2 7.07 0.44 30.23
LIBERTY HOLDINGS Life Insurance 0.3 7.75 0.29 19.19
Source: BNP Paribas Cadiz Securities
In order to conduct a risk analysis on this portfolio we will want to calculate its beta,
unique risk and total risk.
Calculate your portfolio’s market risk
Recall that the beta of a portfolio is simply the weighted average of the component
betas and can be calculated as follows:
EXHIBIT 12: Portfolio Beta
Share Proportion Beta Proportion x Beta
ANGLO AMERICAN 0.4 1.72 0.690
WOOLWORTHS HOLDINGS 0.1 0.67 0.067
ASPEN PHARMACARE HOLDINGS 0.2 0.44 0.087
LIBERTY HOLDINGS 0.3 0.29 0.087
Portfolio Beta 0.931
Source: BNP Paribas Cadiz Securities
Hence we can on average expect this portfolio to move 9.31% for every 10% move
of the market index.
We can also compute the magnitude of market risk of the portfolio. In order to do this
we need the standard deviation of the market index. In the very first entry of the
Sector Statistics Table (EXHIBIT 2) we find the statistics of the JSE-Overall index.
We may find that the standard deviation (total risk) of the market index is 18.44% per
annum.
The market risk of our portfolio = beta x market risk of the index
= 0.931 x 18.44
= 17.17% per annum
Calculate your portfolio’s unique risk
Calculating the magnitude of your portfolio’s unique risk is a little trickier than
calculating the unique risk of an individual share. Let’s begin by calculating the
unique risk of the constituent shares in our portfolio.
There is a special relationship that links the different kinds of risk:
1 Note that the statistics used here are from December 2012 issue.

EQUITY RISK SERVICE – Q4 2013 Igor Rodionov
44 BNP PARIBAS 14 JANUARY 2014
(Total Risk)2 = (Market Risk)
2 + (Unique Risk)
2
It is important to realise that we can add the square of the standard deviations (i.e.
the variances) but we cannot add the standard deviations2 and still obtain a
meaningful interpretation.
Now since R2 is the proportion of market risk relative to total risk and 1-R
2 is the
proportion of unique risk relative to total risk, we can express the above relationship
as:
(Total Risk)2 = R
2 x (Total Risk)
2 +(1 - R
2) x (Total Risk)
2
It is easy to see that the components of risk can be obtained by comparison of the
above expressions:
Unique Risk2 = (1 - R
2) x (Total Risk)
2
Similarly,
Market Risk2 = R
2 x (Total Risk)
2
Note that we do not have information concerning the R2 and the total risk of the
portfolio as a whole and so we cannot directly compute these risk components for
our portfolio using the above expressions. We do however have all the necessary
information to compute these two risk components for individual shares.
Recall that the standard deviation of an individual share is the measure of total risk
for the share. We can thus calculate the magnitude of the two components of risk for
individual shares using the above expressions as follows:
EXHIBIT 13: Market risk and unique risk of individual shares
Shares Market Risk R
2
Unique Risk 1-R
2
Annualised Standard Deviation
Annualised Market Risk
Annualised Unique Risk
(%) (%) (%) (%) (%)
ANGLO AMERICAN 70.43 29.57 38.02 31.91 20.67
WOOLWORTHS HOLDINGS 20.84 79.16 27.06 12.35 24.07
ASPEN PHARMACARE HOLDINGS
7.07 92.93 30.23 8.04 29.15
LIBERTY HOLDINGS 7.75 92.25 19.19 5.34 18.43
Source: BNP Paribas Cadiz Securities
We could also have obtained the Market Risk for each share by simply multiplying
the beta values by the market risk as we did when we calculated the magnitude of
portfolio market risk.
The calculation of the unique risk of our portfolio is shown below. Here we multiply
the investment proportion by the unique risk, square and then sum across the
constituent shares. Finally we take the square root of the result to yield the portfolio’s
unique risk.
EXHIBIT 14: Portfolio’s Unique Risk
Share Proportion Annualised Unique Risk [Proportion x Ann Unique Risk] 2
(%)
ANGLO AMERICAN 0.4 20.67 68.38
WOOLWORTHS HOLDINGS 0.1 24.07 5.79
ASPEN PHARMACARE HOLDINGS 0.2 29.15 33.98
LIBERTY HOLDINGS 0.3 18.43 30.58
TOTAL 138.74
Portfolio Unique Risk = √138.74 = 11.78% per annum
Source: BNP Paribas Cadiz Securities
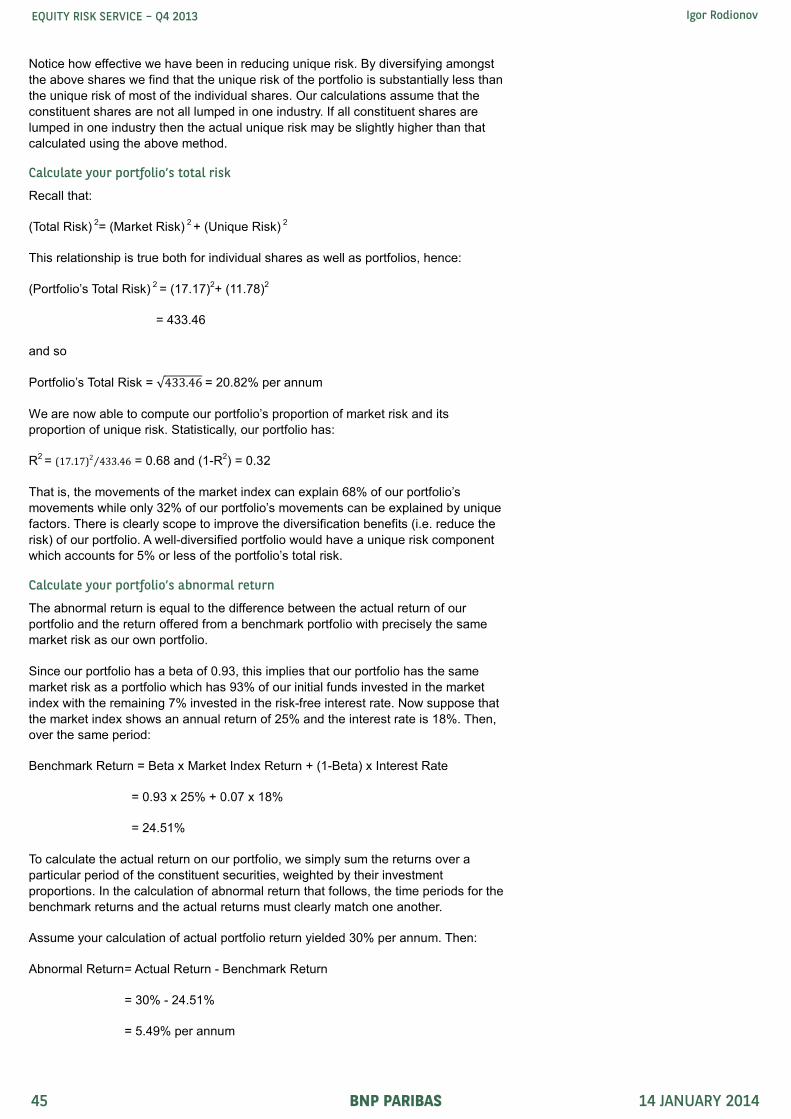
EQUITY RISK SERVICE – Q4 2013 Igor Rodionov
45 BNP PARIBAS 14 JANUARY 2014
Notice how effective we have been in reducing unique risk. By diversifying amongst
the above shares we find that the unique risk of the portfolio is substantially less than
the unique risk of most of the individual shares. Our calculations assume that the
constituent shares are not all lumped in one industry. If all constituent shares are
lumped in one industry then the actual unique risk may be slightly higher than that
calculated using the above method.
Calculate your portfolio’s total risk
Recall that:
(Total Risk) 2= (Market Risk)
2 + (Unique Risk)
2
This relationship is true both for individual shares as well as portfolios, hence:
(Portfolio’s Total Risk) 2
= (17.17)2+ (11.78)
2
= 433.46
and so
Portfolio’s Total Risk = √433.46 = 20.82% per annum
We are now able to compute our portfolio’s proportion of market risk and its
proportion of unique risk. Statistically, our portfolio has:
R2
= (17.17)2 433.46⁄ = 0.68 and (1-R2) = 0.32
That is, the movements of the market index can explain 68% of our portfolio’s
movements while only 32% of our portfolio’s movements can be explained by unique
factors. There is clearly scope to improve the diversification benefits (i.e. reduce the
risk) of our portfolio. A well-diversified portfolio would have a unique risk component
which accounts for 5% or less of the portfolio’s total risk.
Calculate your portfolio’s abnormal return
The abnormal return is equal to the difference between the actual return of our
portfolio and the return offered from a benchmark portfolio with precisely the same
market risk as our own portfolio.
Since our portfolio has a beta of 0.93, this implies that our portfolio has the same
market risk as a portfolio which has 93% of our initial funds invested in the market
index with the remaining 7% invested in the risk-free interest rate. Now suppose that
the market index shows an annual return of 25% and the interest rate is 18%. Then,
over the same period:
Benchmark Return = Beta x Market Index Return + (1-Beta) x Interest Rate
= 0.93 x 25% + 0.07 x 18%
= 24.51%
To calculate the actual return on our portfolio, we simply sum the returns over a
particular period of the constituent securities, weighted by their investment
proportions. In the calculation of abnormal return that follows, the time periods for the
benchmark returns and the actual returns must clearly match one another.
Assume your calculation of actual portfolio return yielded 30% per annum. Then:
Abnormal Return = Actual Return - Benchmark Return
= 30% - 24.51%
= 5.49% per annum

EQUITY RISK SERVICE – Q4 2013 Igor Rodionov
46 BNP PARIBAS 14 JANUARY 2014
(You can calculate the abnormal return for an individual security in precisely the
same way, again using the notion of benchmark portfolio return.)
Although the market risk of our portfolio is identical to that of the benchmark portfolio,
our portfolio has a unique risk of 11.78% per annum while the benchmark portfolio
has none. Our previous discussion reminds us that there is no automatic reward for
taking on unique risk. So unless you had special knowledge about your shares, an
abnormal return of 5.49% per annum is more likely to occur, on average, two out of
every five years. (We elaborate on the interpretation of risk in following section.)
We can also use the notion of a benchmark return to give us some idea of how our
portfolio is expected to perform in the future. For example, assume we are interested
in our portfolio’s expected performance in the forthcoming year. This of course
depends on the performance of the market to a large extent. You may have some
prediction of your own of the market’s performance. If not, you can use past
experience as a guide. Based on the last 30 years’ track record on the JSE, a return
on the market index of 9% over and above the risk-free interest rate seems a
reasonable expectation. Adding an interest rate of 8% to this figure suggests an
expected return on the market of 9% + 8% or 17% per annum. Hence the expected
return on our portfolio is:
Expected Return = Beta x Expected Market Return + (1-Beta) x Interest Rate
= 0.93 (17%) + 0.07 (8%)
= 16.37%
Interpreting the risk of your portfolio
Investors who are concerned with the notion of risk are clearly concerned about the
potential of a share’s return to drop unexpectedly. Yet the standard deviation
incorporates both downside risk and upside potential. We have already discussed
the various components of risk and have mentioned that unique risk is the
component of total risk which is not explained by market movements. Therefore,
when we computed the abnormal return it was evident that a portfolio having zero
unique risk would have an abnormal return of zero. Any non-zero abnormal returns
consequently reflect the unique risk of a portfolio.
In the context of the expected portfolio return computed above, we are concerned
about the variability of our market index forecast as well as factors unique to our
portfolio. That is, our expected return forecast should be interpreted within the
framework of the total risk of a portfolio.
There is a special relationship between the standard deviation and the number of
times we expect returns to exceed the standard deviation. For example assume your
portfolio has an expected return of 16.37% with a total risk of 5% per month. How do
we interpret this? Simply, there is approximately a one in six chance that the actual
return will be below expectation by the standard deviation. Similarly however there is
an approximately one in six chance of the actual return being above expectation by
the standard deviation. A one in six chance can also be interpreted as one year in
every six years. Furthermore, we can say that the actual portfolio return has
approximately a one in three chance of being below expectation by at least half a
standard deviation and approximately a one in forty chance of being below
expectation by more than two standard deviations.

EQUITY RISK SERVICE – Q4 2013 Igor Rodionov
47 BNP PARIBAS 14 JANUARY 2014
7. Literature
Our own papers on the subject of systematic risk estimation
A practitioner’s guide to estimating beta & the role of beta Professor Dave Bradfield QR2003/03/3
Improved Beta Estimation on the Johannesburg Stock Exchange: a simulation study D C Bowie & D J Bradfield South African Journal of Business Management 1993, June, Volume 24, Issue 4, pages 39-44
A Review of Systematic Risk Estimation on the JSE D C Bowie & D J Bradfield De Ratione 1993, Volume 7, Issue 1, pages 6-22
The Use of State-Space Models in Estimating Beta Coefficients on the JSE D C Bowie & D J Bradfield A working paper - The University of Cape Town 1993a
Robust Estimation of Beta Coefficients: Evidence from a Small Stock Market D C Bowie & D J Bradfield Journal of Business Finance and Accounting, Volume 25 Number 3&4, 1998
Recent criticisms and comebacks on the value of ß’s
Truth and Consequences in the Beta Fracas P L Bernstein The Journal of Portfolio Management Spring 1994 (page 1)
Reports of Beta’s Death Have Been Greatly Exaggerated K Grundy & B G Malkiel The Journal of Portfolio Management Spring 1996 (pages 36 - 44)
Beta and Return Fischer Black The Journal of Portfolio Management
Fall 1993 (pages 8-18)
Some Evidence on the Stability of Beta Coefficients on the JSE D C Bowie & D J Bradfield South African Journal of Accounting Research Volume 11, Number 2, 1997 Multivariate Tests of the CAPM: South African Evidence D J Bradfield & J F Affleck-Graves South African Statistical Journal, Volume 25 (pages 19 - 44), 1991 A Note on the Estimation Problems Caused by Thin Trading on the JSE D J Bradfield, De Ratione, Volume 3 (pages 22 - 25), 1990 Risk Estimation in the Thinly-Traded JSE Environment D J Bradfield & G D I Barr South African Journal of Business Management 1989 Volume 20 (pages 169 - 173) Stability Tests for Alphas and Betas over Bull and Bear Market Conditions on the JSE D J Bradfield, J F Affleck-Graves & G D I Barr Technical Report - The University of Cape Town 1982 Is Beta Dead Again? R C Grinold Financial Analysts Journal 1993 Volume 49 (pages 28 - 34) Bye-Bye to Beta (New Research Disputes the Validity of Stock Risk Analysis) David Dreman Forbes, 1993 March 30, Volume 149 page 148 If Beta is Dead, Where is the Corpse? (Fama-French Findings on Relationship between Risk and Return) Peter L Bernstein Forbes, 1992 July 20, Volume150 page 343

EQUITY RISK SERVICE – Q4 2013 Igor Rodionov
48 BNP PARIBAS 14 JANUARY 2014
8. Glossary
Abnormal Return is the return for your portfolio over and above the return you
would expect for a benchmark portfolio having the same beta as your portfolio.
Beta measures the sensitivity of a share price to movements of the market as a
whole.
The CAPM: the Capital Asset Pricing Model.
Market Risk (or Systematic Risk) reflects the fluctuations which are linked to factors
which affect the market as a whole (e.g. political events, interest rate changes etc.).
Non-Systematic Risk (or Unique Risk) reflects the fluctuations which are linked to
events which are unique to the company (e.g. bad management, worker strikes etc.).
R-squared (R2) tells us the proportion of a share’s total risk which is attributable to
market movements.
Systematic Risk (or Market Risk) reflects the fluctuations which are linked to factors
which affect the market as a whole (e.g. political events, interest rate changes etc.).
Unique Risk (or Non-Systematic Risk) reflects the fluctuations which are linked to
events which are unique to the company (e.g. bad management, worker strikes etc.).

EQUITY RISK SERVICE – Q4 2013 Igor Rodionov
49 BNP PARIBAS 14 JANUARY 2014
Acknowledgements
Since the inception of the risk service in 1989 several people have contributed
significantly to the improvement and upkeep of the service.
We would like to thank the following contributors in this regard:
§ Dr David Bowie, Ph.D. (UCT). David is now head of research of the World Markets Co., Edinburgh.
§ Prof Dave Bradfield, Ph.D. (UCT).
§ Cally Ardington, M.Sc. (UCT).
§ Warren McLeod, M.Com. (UCT). Warren is now an analyst with Old Mutual Asset Management.
§ Heidi Raubenheimer, B.Sc. (Hons) (UCT).
§ Yashin Gopi, B.Sc. (Hons) (UKZN).
§ Brian Munro, B.Sc. (Hons) (UCT).
§ Dieter Hendricks, B.Sc (Hons) (UCT).

EQUITY RISK SERVICE – Q4 2013 Igor Rodionov
50 BNP PARIBAS 14 JANUARY 2014
Disclaimers and Disclosures
APPENDIX
DISCLAIMERS AND DISCLOSURES APPLICABLE TO NON-US BROKER-DEALER(S) (BNP Paribas Cadiz Securities (Pty) Ltd)
ANALYST(S) CERTIFICATION
Igor Rodionov, BNP Paribas Cadiz Securities (Pty) Ltd, +27 11 088 2172, [email protected].
Yashin Gopi, BNP Paribas Cadiz Securities (Pty) Ltd, +27 11 088 2176, [email protected].
The analyst(s) or strategist(s) herein each referred to as analyst(s) named in this report certify(ies) that (i) all views expressed in this report accurately reflect the personal view of the analyst(s) with regard to any and all of the subject securities, companies or issuers mentioned in this report; and (ii) no part of the compensation of the analyst(s) was, is, or will be, directly or indirectly, related to the specific recommendations or views expressed by the research analyst herein. Analysts mentioned in this disclaimer are employed by a non-US affiliate of BNP Paribas Securities Corp., and are not registered/ qualified pursuant to NYSE and/or FINRA regulations.
IMPORTANT DISCLOSURES REQUIRED IN THE UNITED STATES BY FINRA RULES AND OTHER JURISDICTIONS "BNP Paribas” is the marketing name for the global banking and markets business of BNP Paribas Group. No portion of this report was prepared by BNP Paribas Securities Corp (US) personnel, and it is considered Third-Party Affiliate research under NASD Rule 2711. The following disclosures relate to relationships between companies covered in this research report and the BNP entity identified on the cover of this report, BNP Securities Corp., and other entities within the BNP Paribas Group (collectively, "BNP Paribas").
The disclosure column in the following table lists the important disclosures applicable to each company that has been rated and/or recommended in this report:
Company Ticker Disclosure (as applicable)
N/A N/A N/A
BNP Paribas represents that: 1. Within the past year, it has managed or co-managed a public offering for this company, for which it received fees. 2. It had an investment banking relationship with this company in the last 12 months. 3. It received compensation for investment banking services from this company in the last 12 months. 4. It expects to receive or intends to seek compensation for investment banking services from the subject company/ies in the next 3 months. 5. It beneficially owns 1% or more of any class of common equity securities of the subject company. 6. It makes a market in securities in respect of this company. 7. The analyst(s) or an individual who assisted in the preparation of this report (or a member of his/her household) has a financial interest position in
securities issued by this company. The financial interest is in the common stock of the subject company, unless otherwise noted. 8. The analyst (or a member of his/her household) is an officer, director, or advisory board member of this company or has received compensation from the
company.
IMPORTANT DISCLOSURES REQUIRED IN KOREA The disclosure column in the following table lists the important disclosures applicable to each Korea listed company that has been rated and/or recommended in this report:
Company Ticker Price (as of 16-Oct-2013 closing price) Interest
N/A N/A N/A N/A
1. The performance of obligations of the Company is directly or indirectly guaranteed by BNP Paribas Securities Korea Co. Ltd (“BNPPSK”) by means of payment guarantees, endorsements, and provision of collaterals and/or taking over the obligations.
2. BNPPSK owns 1/100 or more of the total outstanding shares issued by the Company. 3. The Company is an affiliate of BNPPSK as prescribed by Item 3, Article 2 of the Monopoly Regulation and Fair Trade Act. 4. BNPPSK is the financial advisory agent of the Company for the Merger and Acquisition transaction or of the Target Company whereby the size of the
transaction does not exceed 5/100 of the total asset of the Company or the total number of outstanding shares. 5. BNPPSK has taken financial advisory service regarding listing to the Company within the past 1 year. 6. With regards to the tender offer initiated by the Company based on Item 2, Article 133 of the Financial Investment Services and Capital Market Act,
BNPPSK acts in the capacity of the agent for the tender offer designated either by the Company or by the target company, provided that this provision shall apply only where tender offer has not expired.
7. the listed company which issued the stocks in question in case where 40 days has not passed since the new shares were listed from the date of entering into arrangement for public offering or underwriting-related agreement for issuance of stocks
8. The Company is recognized as having considerable interests with BNPPSK. 9. The analyst or his/her spouse owns (including delivery claims of marketable securities based on legal regulations and trading and misc. contracts) the
following securities or rights (hereinafter referred to as “Securities, etc.” in this Article) regardless of whose name is used in the trading. 1) Stocks, bond with stock certificate, and certificate of pre-emptive rights issued by the Company whose securities dealings are being solicited. 2) Stock options of the Company whose securities dealings are being solicited. 3) Individual stock future, stock option, and warrants that use the stocks specified in Item 1) as underlying.
GENERAL DISCLAIMER This report was produced by BNP Paribas Cadiz Securities (Pty) Ltd, member company(ies) of the BNP Paribas Group. This report is for the use of intended recipients only and may not be reproduced (in whole or in part) or delivered or transmitted to any other person without our prior written consent. By accepting this report, the recipient agrees to be bound by the terms and limitations set forth herein. This report does not constitute a personal recommendation or take into account the particular investment objectives, financial situations, or needs of individual clients. Customers are advised to use the information contained herein as just one of many inputs and considerations prior to engaging in any trading activity. This report does not constitute a prospectus or other offering document or an offer or solicitation to buy or sell any securities or other investments. This report is not intended to provide the sole basis of any evaluation of the subject securities and companies mentioned in this report. Information and opinions contained in this report are published for reference of the recipients and are not to be relied upon as authoritative or without the

EQUITY RISK SERVICE – Q4 2013 Igor Rodionov
51 BNP PARIBAS 14 JANUARY 2014
recipient’s own independent verification, or taken in substitution for the exercise of judgment by the recipient. Additionally, the products mentioned in this report may not be available for sale in certain jurisdictions. As an investment bank with a wide range of activities, BNP Paribas may face conflicts of interest, which are resolved under applicable legal provisions and internal guidelines. You should be aware, however, that BNP Paribas may engage in transactions in a manner inconsistent with the views expressed in this document, either for its own account or for the account of its clients.
Australia: This report is being distributed in Australia by BNP Paribas Sydney Branch, registered in Australia as ABN 23 000 000 117 at 60 Castlereagh Street Sydney NSW 2000. BNP Paribas Sydney Branch is licensed under the Banking Act 1959 and the holder of Australian Financial Services Licence no. 238043 and therefore subject to regulation by the Australian Securities & Investments Commission in relation to delivery of financial services. By accepting this document you agree to be bound by the foregoing limitations, and acknowledge that information and opinions in this document relate to financial products or financial services which are delivered solely to wholesale clients (in terms of the Corporations Act 2001, sections 761G and 761GA; Corporations Regulations 2001, division 2, reg. 7.1.18 & 7.1.19) and/or professional investors (as defined in section 9 of the Corporations Act 2001).
Canada: The information contained herein is not, and under no circumstances is to be construed as, a prospectus, an advertisement, a public offering, an offer to sell securities described herein, or solicitation of an offer to buy securities described herein, in Canada or any province or territory thereof. Any offer or sale of the securities described herein in Canada will be made only under an exemption from the requirements to file a prospectus with the relevant Canadian securities regulators and only by a dealer properly registered under applicable securities laws or, alternatively, pursuant to an exemption from the dealer registration requirement in the relevant province or territory of Canada in which such offer or sale is made. The information contained herein is under no circumstances to be construed as investment advice in any province or territory of Canada and is not tailored to the needs of the recipient. To the extent that the information contained herein references securities of an issuer incorporated, formed or created under the laws of Canada or a province or territory of Canada, any trades in such securities must be conducted through a dealer registered in Canada. No securities commission or similar regulatory authority in Canada has reviewed or in any way passed judgment upon these materials, the information contained herein or the merits of the securities described herein, and any representation to the contrary is an offence.
Hong Kong: This report is prepared for professional investors and is being distributed in Hong Kong by BNP Paribas Securities (Asia) Limited to persons whose business involves the acquisition, disposal or holding of securities, whether as principal or agent. BNP Paribas Securities (Asia) Limited, a subsidiary of BNP Paribas, is regulated by the Securities and Futures Commission for the conduct of dealing in securities, advising on securities, providing automated trading services, dealing in futures contacts and advising on corporate finance. For professional investors in Hong Kong, please contact BNP Paribas Securities (Asia) Limited for all matters and queries relating to this report.
India: In India, this document is being distributed by BNP Paribas Securities India Pvt. Ltd. ("BNPPSIPL"), having its registered office at 5th floor, BNP Paribas House, 1 North Avenue, Maker Maxity, Bandra Kurla Complex, Bandra (East), Mumbai 400 051 (Tel. no. +91 22 3370 4000 / 6196 4000). BNPPSIPL is registered with the Securities and Exchange Board of India (“SEBI”) as a stockbroker in the Equities and the Futures & Options segments of National Stock Exchange of India Ltd. and Bombay Stock Exchange Ltd. (SEBI regn. nos. INB/INF231474835, INB/INF011474831).
Indonesia: This report is being distributed by PT BNP Paribas Securities Indonesia and is delivered by licensed employee(s) to its clients. PT BNP Paribas Securities Indonesia, having its registered office at Menara BCA, 35th Floor, Grand Indonesia, Jl. M.H.Thamrin No.1, Jakarta, 10310, Indonesia, is a fully subsidiaries company of BNP Paribas SA and is licensed under Capital Market Law No. 8 of 1995 and the holder of broker-dealer and underwriter licenses issued by the Capital Market and Financial Institutions Supervisory Agency (BAPEPAM-LK). PT BNP Paribas Securities Indonesia is also a member of Indonesia Stock Exchange. Neither this research publication nor any copy hereof may be distributed in Indonesia or to any Indonesian citizens except in compliance with applicable Indonesian capital market laws and regulations. This research publication is not an offer of securities in Indonesia. Some of the securities referred to in this research publication have not been registered with the Capital Market and Financial Institutions Supervisory Agency (BAPEPAM-LK) pursuant to relevant capital market laws and regulations, and may not be offered or sold within the territory of the Republic of Indonesia or to Indonesian citizens through a public offering or in circumstance which constitute an offer within the meaning of Indonesian capital market laws and regulations.
Japan: This report is being distributed to Japanese based firms by BNP Paribas Securities (Japan) Limited or by a subsidiary or affiliate of BNP Paribas not registered as a financial instruments firm in Japan, to certain financial institutions defined by article 17-3, item 1 of the Financial Instruments and Exchange Law Enforcement Order. BNP Paribas Securities (Japan) Limited is a financial instruments firm registered according to the Financial Instruments and Exchange Law of Japan and a member of the Japan Securities Dealers Association, the Financial Futures Association of Japan and the Type II Financial Instruments Firms Association. BNP Paribas Securities (Japan) Limited accepts responsibility for the content of a report prepared by another non-Japan affiliate only when distributed to Japanese based firms by BNP Paribas Securities (Japan) Limited. Some of the foreign securities stated on this report are not disclosed according to the Financial Instruments and Exchange Law of Japan.
Malaysia: This report is issued and distributed by BNP Paribas Capital (Malaysia) Sdn Bhd. The views and opinions in this research report are our own as of the date hereof and are subject to change. BNP Paribas Capital (Malaysia) Sdn Bhd has no obligation to update its opinion or the information in this research report. This publication is strictly confidential and is for private circulation only to clients of BNP Paribas Capital (Malaysia) Sdn Bhd. This publication is being provided to you strictly on the basis that it will remain confidential. No part of this material may be (i) copied, photocopied, duplicated, stored or reproduced in any form by any means or (ii) redistributed or passed on, directly or indirectly, to any other person in whole or in part, for any purpose without the prior written consent of BNP Paribas Capital (Malaysia) Sdn Bhd.
Philippines: This report is being distributed in the Philippines by BNP Paribas Manila Branch, an Offshore Banking Unit (OBU) of BNP Paribas whose head office is in Paris, France. BNP Paribas Manila OBU is registered as an offshore banking unit under Presidential Decree No. 1034 (PD 1034), and regulated by the Bangko Sentral ng Pilipinas. This report is being distributed in the Philippines to qualified clients of OBUs as allowed under PD 1034, and is qualified in its entirety to the products and services allowed under PD 1034.
Singapore: This report is distributed in Singapore by BNP Paribas Securities (Singapore) Pte Ltd ("BNPPSSL") and may be distributed in Singapore only to an Accredited or Institutional Investor, each as defined under the Financial Advisers Regulations ("FAR") and the Securities and Futures Act (Chapter 289) of Singapore, as amended from time to time. In relation to the distribution to such categories of investors, BNPPSSL and its representatives are exempted under Regulation 35 of the FAR from the requirements in Section 36 of the Financial Advisers Act of Singapore, regarding the disclosure of certain interests in, or certain interests in the acquisition or disposal of, securities referred to in this report. For Institutional and Accredited Investors in Singapore, please contact BNP Paribas Securities (Singapore) Ptd Ltd for all matters and queries relating to this report.
South Africa: In South Africa, BNP Paribas Cadiz Securities (Pty) Ltd and BNP Paribas Cadiz Stock Broking (Pty) Ltd (hereinafter referred to as “BNPP Cadiz”) are licensed members of Johannesburg Stock Exchange and are authorised Financial Services Providers and subject to regulation by the Financial Services Board. BNPP Cadiz does not expressly or by implication represent, recommend or propose that the financial products referred to in this report are appropriate to the particular investment objectives, financial situation or particular needs of the recipient.
Switzerland: This report is intended solely for customers who are “Qualified Investors” as defined in article 10 paragraphs 3 and 4 of the Swiss Federal Act on Collective Investment Schemes of 23 June 2006 (CISA) and the relevant provisions of the Swiss Federal Ordinance on Collective Investment Schemes of 22 November 2006 (CISO). “Qualified Investors” includes, among others, regulated financial intermediaries such as banks, securities dealers, fund management companies and asset managers of collective investment schemes, regulated insurance companies as well as pension funds and companies with professional treasury operations. This document may not be suitable for customers who are not Qualified Investors and should only be used and passed on to Qualified Investors. For specification purposes, a “Swiss Corporate Customer” is a Client which is a corporate entity, incorporated and existing under the laws of Switzerland and which qualifies as “Qualified Investor” as defined above." BNP Paribas (Suisse) SA is authorised as bank and as securities dealer by the Swiss Federal Market Supervisory Authority FINMA. BNP Paribas (Suisse) SA is registered at the Geneva commercial register under No. CH-270-3000542-1. BNP Paribas (Suisse) SA is incorporated in Switzerland with limited liability. Registered Office: 2 place de Hollande, CH-1204 Geneva.
Taiwan: Information on securities that trade in Taiwan is distributed by BNP Paribas Securities (Taiwan) Co., Ltd. Such information is for your reference only. The reader should independently evaluate the investment risks and is solely responsible for their investment decision. Information on securities that do not trade in Taiwan is for informational purposes only and is not to be construed as a recommendation or a solicitation to trade in such securities. BNP Paribas Securities (Taiwan) Co., Ltd. may not execute transactions for clients in these securities. This publication may not be distributed to the public media or quoted or used by the public media without the express written consent of BNP Paribas.

EQUITY RISK SERVICE – Q4 2013 Igor Rodionov
52 BNP PARIBAS 14 JANUARY 2014
Thailand: Research relating to Thailand and Thailand based issuers is produced pursuant to an arrangement between BNP PARIBAS (“BNPP”) and Finansia Syrus Securities Public Company Limited (“FSS”). The International Investment Advisory Team at FSS prepares and distributes research under the brand name “BNP PARIBAS/FSS”. FSS is not an affiliate of BNPP. FSS also publishes a different research product under the brand name “FINANSIA SYRUS,” which is prepared by research analysts who are not part of the International Investment Advisory Team and who may cover the same securities, issuers, or industries that are the subject of this report. The ratings, recommendations, and views expressed in this report may differ from the ratings, recommendations, and views expressed by other research analysts or research teams employed by FSS. This report is being distributed outside Thailand by members of BNP Paribas.
Turkey: This report is being distributed in Turkey by TEB Investment (TEB YATIRIM MENKUL DEGERLER A.S., Teb Kampus D Blok Saray Mah. Kucuksu Cad. Sokullu Sok., No:7 34768 Umraniye, Istanbul, Turkey, Trade register number: 358354, www.tebyatirim.com.tr) and outside Turkey jointly by TEB Investment and BNP Paribas. Notice Published in accordance with “Communiqué Regarding the Principles on Investment Consultancy Activities and the Investment Consultancy Institutions” Series: V, No: 55 issued by the Capital Markets Board. The investment related information, commentary and recommendations contained herein do not constitute investment consultancy services. Investment consultancy services are provided in accordance with investment consultancy agreements executed between investors and brokerage companies or portfolio management companies or non-deposit accepting banks. The commentary and recommendations contained herein are based on the personal views of the persons who have made such commentary and recommendations. These views may not conform to your financial standing or to your risk and return preferences. Therefore, investment decisions based solely on the information provided herein may fail to produce results in accordance with your expectations.
United States: This report may be distributed in the United States only to U.S. Persons who are “major U.S. institutional investors” (as such term is defined in Rule 15a-6 under the Securities Exchange Act of 1934, as amended) and is not intended for the use of any person or entity that is not a “major U.S. institutional investor”. U.S persons who wish to effect transactions in securities discussed herein must do so through BNP Paribas Securities Corp., a US-registered broker dealer and member of FINRA, SIPC, NFA, NYSE and other principal exchanges.
Certain countries within the European Economic Area: This document may only be distributed in the United Kingdom to eligible counterparties and professional clients and is not intended for, and should not be circulated to, retail clients (as such terms are defined in the Markets in Financial Instruments Directive 2004/39/EC (“MiFID”)). This document will have been approved for publication and distribution in the United Kingdom by BNP Paribas London Branch, a branch of BNP Paribas SA whose head office is in Paris, France. BNP Paribas SA is incorporated in France with limited liability with its registered office at 16 boulevard des Italiens, 75009 Paris. BNP Paribas London Branch (registered office: 10 Harewood Avenue, London NW1 6AA; tel: [44 20] 7595 2000; fax: [44 20] 7595 2555) is authorised by the Autorité de Contrôle Prudentiel and the Prudential Regulation Authority and subject to limited regulation by the Financial Conduct Authority and Prudential Regulation Authority. Details about the extent of our authorisation and regulation by the Prudential Regulation Authority, and regulation by the Financial Conduct Authority are available from us on request.This report has been approved for publication in France by BNP Paribas, a credit institution licensed as an investment services provider by the Autorité de Contrôle Prudentiel whose head office is 16, Boulevard des Italiens 75009 Paris, France. This report is being distributed in Germany either by BNP Paribas London Branch or by BNP Paribas Niederlassung Frankfurt am Main, regulated by the Bundesanstalt für Finanzdienstleistungsaufsicht (BaFin).
Other Jurisdictions: The distribution of this report in other jurisdictions or to residents of other jurisdictions may also be restricted by law, and persons into whose possession this report comes should inform themselves about, and observe, any such restrictions. By accepting this report you agree to be bound by the foregoing instructions. This report is not directed to, or intended for distribution to or use by, any person or entity that is a citizen or resident of or located in any locality, state, country, or other jurisdiction where such distribution, publication, availability or use would be contrary to law or regulation.
All research reports are disseminated and available to all clients simultaneously through our internal client websites. For all research available on a particular stock, please contact the relevant BNP Paribas research team or the author(s) of this report.
Additional Disclosures Target price history, stock price charts, valuation and risk details, and equity rating histories applicable to each company rated in this report is available in our most recently published reports available on our website: http://eqresearch.bnpparibas.com, or you can contact the analyst named on the front of this note or your BNP Paribas representative.
All share prices are as at market close on 16 October 2013 unless otherwise stated.
RECOMMENDATION STRUCTURE
Stock Ratings Stock ratings are based on absolute upside or downside, which we define as (target price* - current price) / current price. BUY (B). The upside is 10% or more. HOLD (H). The upside or downside is less than 10%. REDUCE (R). The downside is 10% or more. Unless otherwise specified, these recommendations are set with a 12-month horizon. Thus, it is possible that future price volatility may cause a temporary mismatch between upside/downside for a stock based on market price and the formal recommendation. * In most cases, the target price will equal the analyst's assessment of the current fair value of the stock. However, if the analyst doesn't think the market will reassess the stock over the specified time horizon due to a lack of events or catalysts, then the target price may differ from fair value. In most cases, therefore, our recommendation is an assessment of the mismatch between current market price and our assessment of current fair value.
Industry Recommendations Improving (é): The analyst expects the fundamental conditions of the sector to be positive over the next 12 months. Stable (previously known as Neutral) (çè): The analyst expects the fundamental conditions of the sector to be maintained over the next 12 months. Deteriorating (ê): The analyst expects the fundamental conditions of the sector to be negative over the next 12 months. Country (Strategy) Recommendations Overweight (O). Over the next 12 months, the analyst expects the market to score positively on two or more of the criteria used to determine market recommendations: index returns relative to the regional benchmark, index sharpe ratio relative to the regional benchmark and index returns relative to the market cost of equity. Neutral (N). Over the next 12 months, the analyst expects the market to score positively on one of the criteria used to determine market recommendations: index returns relative to the regional benchmark, index sharpe ratio relative to the regional benchmark and index returns relative to the market cost of equity. Underweight (U). Over the next 12 months, the analyst does not expect the market to score positively on any of the criteria used to determine market recommendations: index returns relative to the regional benchmark, index sharpe ratio relative to the regional benchmark and index returns relative to the market cost of equity.
RATING DISTRIBUTION (as at 13 January 2014)
Total BNP Paribas coverage universe 672 Investment Banking Relationship (%)
Buy 336 Buy 5.4
Hold 212 Hold 1.9
Reduce 124 Reduce 3.2
Should you require additional information concerning this report please contact the relevant BNP Paribas research team or the author(s) of this report.
© 2014 BNP Paribas Group