Embed Size (px)
Citation preview

Estimating and Mapping the Population at Risk ofSleeping SicknessPere P. Simarro1*., Giuliano Cecchi2., Jose R. Franco1, Massimo Paone2, Abdoulaye Diarra3, Jose
Antonio Ruiz-Postigo4, Eric M. Fevre5, Raffaele C. Mattioli2, Jean G. Jannin1
1 Control of Neglected Tropical Diseases, Innovative and Intensified Disease Management, World Health Organization, Geneva, Switzerland, 2 Animal Production and
Health Division, Food and Agriculture Organization of the United Nations, Rome, Italy, 3 Regional Office for Africa, World Health Organization, Brazzaville, Congo,
4 Regional Office for the Eastern Mediterranean, World Health Organization, Cairo, Egypt, 5 Centre for Immunity, Infection and Evolution, Institute of Immunology and
Infection Research, School of Biological Sciences, Ashworth Laboratories, University of Edinburgh, Edinburgh, United Kingdom
Abstract
Background: Human African trypanosomiasis (HAT), also known as sleeping sickness, persists as a public health problem inseveral sub-Saharan countries. Evidence-based, spatially explicit estimates of population at risk are needed to informplanning and implementation of field interventions, monitor disease trends, raise awareness and support advocacy.Comprehensive, geo-referenced epidemiological records from HAT-affected countries were combined with humanpopulation layers to map five categories of risk, ranging from ‘‘very high’’ to ‘‘very low,’’ and to estimate the correspondingat-risk population.
Results: Approximately 70 million people distributed over a surface of 1.55 million km2 are estimated to be at differentlevels of risk of contracting HAT. Trypanosoma brucei gambiense accounts for 82.2% of the population at risk, the remaining17.8% being at risk of infection from T. b. rhodesiense. Twenty-one million people live in areas classified as moderate to veryhigh risk, where more than 1 HAT case per 10,000 inhabitants per annum is reported.
Discussion: Updated estimates of the population at risk of sleeping sickness were made, based on quantitative informationon the reported cases and the geographic distribution of human population. Due to substantial methodological differences,it is not possible to make direct comparisons with previous figures for at-risk population. By contrast, it will be possible toexplore trends in the future. The presented maps of different HAT risk levels will help to develop site-specific strategies forcontrol and surveillance, and to monitor progress achieved by ongoing efforts aimed at the elimination of sleeping sickness.
Citation: Simarro PP, Cecchi G, Franco JR, Paone M, Diarra A, et al. (2012) Estimating and Mapping the Population at Risk of Sleeping Sickness. PLoS Negl TropDis 6(10): e1859. doi:10.1371/journal.pntd.0001859
Editor: Joseph Mathu Ndung’u, Foundation for Innovative New Diagnostics (FIND), Switzerland
Received June 26, 2012; Accepted August 29, 2012; Published October 25, 2012
Copyright: � 2012 World Health Organization; � 2012 Food and Agriculture Organization of the United Nations; licensee Public Library of Science (PLoS). This isan Open Access article in the spirit of the Public Library of Science (PLoS) principles for Open Access http://www.plos.org/oa/, without any waiver of WHO’s orFAO’s privileges and immunities under international law, convention, or agreement. This article should not be reproduced for use in association with thepromotion of commercial products, services, or any legal entity. There should be no suggestion that WHO or FAO endorses any specific organization or products.The use of the WHO or FAO logos are not permitted. This notice should be preserved along with the article’s original URL.
Funding: The study has been done under the funds provided to WHO by the Public Private partnership with Sanofi. The work of GC was supported by the FAO‘‘Pro-poor Integrated Packages to Enhance Policy and Decision Making against the African Animal Disease Burden in sub-Saharan Africa’’ (GCP/RAF/442/IFA),funded by the International Fund for Agricultural Development (IFAD). GC was also supported by WHO. Funds for MP’s activities were provided by WHO. EMF wassupported by the Wellcome Trust (085308) and WHO. The funders had no role in study design, data collection and analysis, decision to publish, or preparation ofthe manuscript.
Competing Interests: The authors have declared that no competing interests exist.
* E-mail: [email protected]
. These authors contributed equally to this work.
Introduction
Human African trypanosomiasis (HAT), or sleeping sickness, is
a vector-borne disease caused by two sub-species of the parasitic
protozoa Trypanosoma brucei (i.e. T. b. gambiense and T. b. rhodesiense).
Trypanosomes are transmitted to humans by the infected bite of
various species of tsetse fly (genus Glossina). Transmission of the
disease only takes place in sub-Saharan Africa, in discrete areas of
endemicity, or ‘foci’, within the geographic distribution of the
tsetse fly. The Gambian form of sleeping sickness is normally
characterized by a long asymptomatic period and it is found in
western and central Africa. The Rhodesian form, which is
encountered in eastern and southern Africa, displays a much
more rapid onset of overt symptoms and a faster progression.
In the early 1960s, the reported incidence of the disease was at a
trough, with only a few thousand cases being reported annually.
However, a decline in surveillance in the post-independence period
allowed sleeping sickness to regain ground. By the end of the 20th
century, the World Health Organization (WHO) estimated that
300,000 people contracted the infection every year [1]. Since then, a
global alliance led by WHO set elimination as the goal of its strategy
against HAT [2,3]. This renewed commitment by international and
national institutions, including the private sector, succeeded in
reverting the trend. As compared to the peak in 1998, when 37,991
new cases of HAT had been reported at the continental level, 6,743
cases were reported in 2011, corresponding to a reduction of 82.3%.
Also, many countries considered as endemic have not reported any
cases in recent years [4].
PLOS Neglected Tropical Diseases | www.plosntds.org 1 October 2012 | Volume 6 | Issue 10 | e1859

The magnitude of the recent advances in HAT control and
surveillance is such that up-to-date estimates of the number and
geographic distribution of people at risk are urgently needed.
In the past, estimates of sleeping sickness risk at the continental,
regional and national levels could only be based on educated guess
and rough estimations of experts, rather than on a clearly laid out,
objective analysis of the epidemiological evidence. In 1985, a
WHO Expert Committee indicated that a population of 78.5
million was at risk of HAT in sub-Saharan Africa [5]. This figure
was based on national-level information provided by the Ministries
of Health of affected countries. In 1995, a new WHO Expert
Committee indicated that 60.8 million people were at risk of
contracting sleeping sickness [1], thus providing what was, to date,
the latest global estimate of HAT risk. To derive this latest figure, a
semi-quantitative method was used, whereby rural populations
involved in agricultural activities within known HAT transmission
areas were considered at risk. In both estimates, subjectivity
remained high and the link to the epidemiological evidence loose.
Since the latest estimations were made, HAT control and
surveillance were scaled up [6], and data collection and reporting
were substantially improved, with WHO coordinating the efforts
of the National Sleeping Sickness Control Programmes (NSSCPs),
bilateral co-operation, Non-Governmental Organizations (NGOs),
Research Institutes and the private sector [7]. Also, over the last 10
to 15 years, the increased availability and utilization of the Global
Positioning System (GPS), remote sensing data and Geographical
Information Systems (GIS) triggered the development of novel,
more objective methodologies to map the risk of many diseases
[8,9,10,11].
Till recently, geospatial analysis had never been used to estimate
HAT risk at the regional or African scale. In 2008, the Atlas of
HAT was launched, aiming at assembling, harmonizing and
mapping datasets on the geographic distribution of sleeping
sickness in sub-Saharan Africa [12]. Comprehensive and accurate
epidemiological maps were generated [4,13], which laid the
foundations for more objective, evidence-based estimations of
sleeping sickness risk. Thereafter, a GIS-based methodology for
risk estimation was developed and tested in six Central African
countries [14]. In this methodology, harmonized epidemiological
data and global human population layers were combined, thus
enabling different levels of HAT risk to be estimated and mapped.
‘Risk’ was regarded as the likelihood of infection, and the
likelihood was estimated as a function of disease intensity and
geographical proximity to HAT reported cases.
In the present study, the methodology tested in the six Central
African countries was applied at the continental level in order to
map the risk of sleeping sickness in sub-Saharan Africa and to
estimate at-risk population. In an effort to generate comparable
estimates for both T. b. gambiense and T. b. rhodesiense infections, the
same methodology was applied to all HAT-endemic countries and
to both forms of the disease.
Materials and Methods
Input dataGeoreferenced layers of sleeping sickness occurrence and
human population for the period 2000–2009 constituted the input
for the present HAT risk mapping exercise.
The number and the geographic distribution of HAT cases were
provided by the latest update of the Atlas of HAT (reference date:
31 May 2012), thus including 170,492 cases of T. b. gambiense
infection and 5,084 of T. b. rhodesiense, for a total of 175,576 HAT
reported cases. Reported cases originated from twenty countries,
namely Angola, Cameroon, Central African Republic, Chad,
Congo, Cote d’Ivoire, Democratic Republic of the Congo,
Equatorial Guinea, Gabon, Ghana, Guinea, Kenya, Malawi,
Mozambique, Nigeria, Sudan, Uganda, United Republic of
Tanzania, Zambia and Zimbabwe [4].
The Atlas provided village-level mapping for 81.0% of the cases,
corresponding to 19,828 different locations mapped. The average
spatial accuracy for reported cases mapped was estimated at
<1,000 m using methods already described [4].
For the remaining 19.0% of the cases, village-level information
was unavailable but the area of occurrence was known (e.g. focus,
parish, health zone, etc.). For the purpose of risk estimation, these
cases were apportioned among the endemic villages of their area of
occurrence by means of proportional allocation [14].
Reported cases also included those diagnosed in non-endemic
countries – most notably in travellers and migrants – which in the
Atlas of HAT are mapped in the probable place of infection and
flagged as ‘exported’ [15]. For T. b. rhodesiense exported cases, the
place of infection most frequently corresponds to a park or another
type of protected area. For the sole purpose of risk estimation, T. b.
rhodesiense exported cases were randomly distributed within the
boundaries of their respective park/protected area of origin.
The geographic distribution of human population was derived
from Landscan TM databases [16]. Landscan provides global grids
where census counts are allocated to grid nodes on the basis of
probability coefficients. The spatial resolution of Landscan is 30
arcseconds (<1 km at the equator), and the population layer is
updated on a yearly basis.
To delineate risk areas, an average of the ten Landscan
population datasets from 2000 to 2009 was used. Subsequently,
Landscan 2009 was combined with the risk map to provide
estimates of people at risk at the end of the study period [14].
Spatial smoothingBoth input layers (i.e. sleeping sickness cases and human
population) can be regarded as spatial point processes, and thus
amenable to spatial smoothing.
Spatial smoothing methods are used in epidemiology to
facilitate data analysis, and they allow to transform point layers
into continuous surfaces of intensity. In this context, the intensity
l(s) of a point process is the mean number of events per unit area
at the point s [17]. The term ‘event’ is used to distinguish the
location of an observation (si) from any other arbitrary location swithin a study region R. Spatial smoothing techniques can be
based on localized averages or more complex, three-dimensional
Author Summary
The present thrust towards the elimination of humanAfrican trypanosomiasis (HAT, or sleeping sickness) re-quires accurate information on how many people are atrisk of contracting the disease, and where they live. Thisinformation is crucial to target field interventions effec-tively and efficiently, as well as to monitor progresstowards the elimination goal. In this paper, a GeographicInformation System was used to delineate areas atdifferent levels of risk. To this end, accurate data on thespatial distribution of HAT cases (period 2000–2009) werecollated and combined with maps of human population. Atotal of 70 million people are estimated to be at risk ofcontracting sleeping sickness in Africa. This population isdistributed over a surface of one and a half million squarekilometres, an area six times that of the United Kingdom.Half of the people and of the areas at risk are found in theDemocratic Republic of the Congo.
The Risk of Sleeping Sickness
PLOS Neglected Tropical Diseases | www.plosntds.org 2 October 2012 | Volume 6 | Issue 10 | e1859
mathematical functions (e.g. kernels), but they all rely on a moving
window, whose size and shape determines how far the effect of an
event will reach [18]. For this study, intensity was estimated
through a kernel function k (?), so that the intensity estimate
llt(s)could be expressed as:
llt(s)~Xn
i~1
1
t2k
s{si
t
� �
Here, s was a location anywhere in the study region R, s1,.., sn
were the locations of the n observed events, and k(?) represented
the kernel weighting function. t.0 is normally referred to as the
bandwidth or search radius, and si were the events that lay within
the area of influence as controlled by t.
There are various shapes of kernel to choose from, all usually
represented by symmetric bivariate functions decreasing radially.
The choice of shape has relatively little effect on the resulting
intensity estimate llt(s) [19,20] and we used a quadratic kernel
[20]. A more important choice is the selection of the bandwidth t,
the rule being that the higher t, the smoother the intensity surface.
Although different techniques are available for selecting t [21,22],
no optimal value exists, and characteristics of the biological
process under study are often better suited to guide the choice, so
that the smoothed surface provide insights into the underlying data
[18].
By taking into account the epidemiological features of HAT, the
behaviour of the tsetse vector and the mobility of people in the
average rural African milieu where HAT occurs, a search radius of
30 km was chosen [14]. In particular, a few studies investigated
the daily distance covered by people living in HAT foci [23,24,25]
and revealed that this tends not to exceed 15 km. The distance of
30 km enabled to take into account, at least in part, also people’s
movements that do not occur on a daily basis.
Figure 1 provides a three-dimensional illustration of the output
of spatial smoothing. In the example, the point layer used as input
comprised one single ‘event’ (i.e. one HAT case) localized at the
centre of the grid.
Delineation of risk areasPrior to spatial smoothing, the number of HAT cases reported
in 2000–2009 was divided by ten, thus providing the average
number of cases per annum (p.a.). Similarly, Landscan human
population layers from 2000 to 2009 were averaged [14]. Both
averaged layers were subjected to spatial smoothing using the same
quadratic kernel function. Importantly, both intensity surfaces
were generated using the same 30 km bandwidth [26].
Spatial smoothing resulted in the two surfaces D_
t(s) and P_
t(s),which represent the average annual estimates of disease intensity
and population intensity respectively. The input to and output of
spatial smoothing are exemplified in Figure 2.
The ratio between the intensity of HAT cases and the
population intensity can be defined as the disease risk [18], so
that a risk function was estimated as:
R_
t(s)~D_
t(s)=P_
t(s)
Thresholds were applied to the risk function R_
t(s) in order to
distinguish and map different categories of risk, ranging from ‘very
low’ to ‘very high’ (Table 1). Outside the areas mapped as at risk of
HAT, i.e. in areas where ,1 HAT case per 106 inhabitants p.a.
was reported, the risk to contract the disease was considered
‘marginal’. These marginal areas were not taken into account
further in this study. The term ‘marginal’ was chosen because, in
such areas, risk could not be considered as non-existent, since
residents of these zones could still expose themselves to infection if
visiting transmission areas.
Estimates of people at riskThe map depicting the different categories of HAT risk was
combined with Landscan 2009 dataset to estimate the number of
people at risk at the end of the study period [14].
Results
An area of 1.55 million km2 in Africa is estimated to be at
various levels of HAT risk, ranging from ‘very high’ to ‘very low’
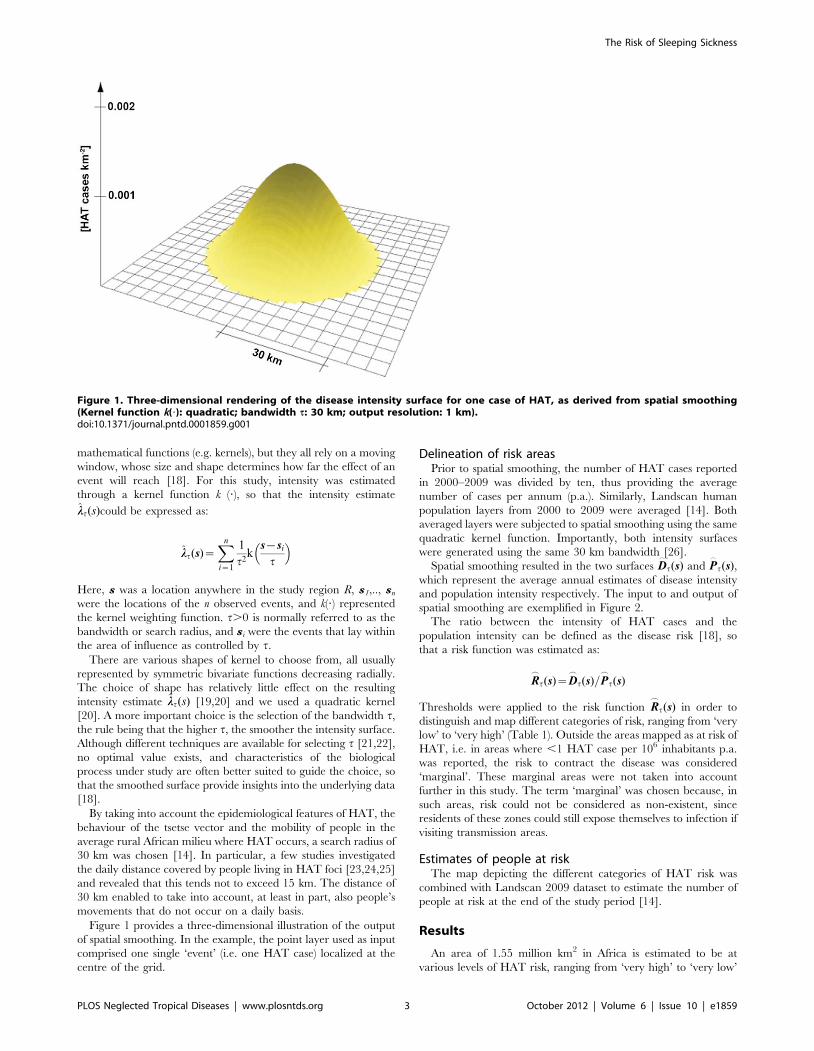
Figure 1. Three-dimensional rendering of the disease intensity surface for one case of HAT, as derived from spatial smoothing(Kernel function k(?): quadratic; bandwidth t: 30 km; output resolution: 1 km).doi:10.1371/journal.pntd.0001859.g001
The Risk of Sleeping Sickness
PLOS Neglected Tropical Diseases | www.plosntds.org 3 October 2012 | Volume 6 | Issue 10 | e1859

(Table 2 and Table 3). Areas at ‘very high’ to ‘moderate’ risk
account for 719 thousand km2 (46.3%) and areas at ‘low’ to ‘very
low’ risk account for the remaining 833 thousand km2 (53.7%).
The total population at risk of sleeping sickness is estimated at
69.3 million (Table 4 and Table 5). The categories at ‘very high’ to
‘moderate’ risk account for a third of the people at risk (21 million),
whilst the remaining two thirds (48.3 million) are at ‘low’ to ‘very
low’ risk.
The geographic distribution of risk areas in central Africa,
western Africa and eastern-southern Africa are presented in
Figure 3, Figure 4 and Figure 5 respectively. Country-level risk
maps are provided in Supporting Information (Maps S1). Focus
level risk maps will be provided at HAT/WHO website: http://
www.who.int/trypanosomiasis_african/country/en/.
Trypanosoma brucei gambienseA total of 57 million people are estimated to be at risk of
contracting Gambian sleeping sickness (Table 4). This population
is distributed over a surface of 1.38 million km2 (Table 2).
Approximately 19.6 million (34.4%) of the people at risk live in
Figure 2. The foci of Bodo-Moissala in Chad and Batangafo-Maitikoulou in Central African Republic. (a) Distribution of HAT cases; (b)Average population distribution (Landscan); (c) Annual intensity of HAT cases as derived from (a) through spatial smoothing; (d) Population intensityas derived from (b) through spatial smoothing.doi:10.1371/journal.pntd.0001859.g002
The Risk of Sleeping Sickness
PLOS Neglected Tropical Diseases | www.plosntds.org 4 October 2012 | Volume 6 | Issue 10 | e1859

areas classified at moderate risk or higher, which correspond to
areas reporting $1 HAT case per 104 inhabitants p.a. The
remaining 65.6% (<37.4 million) live in areas classified at low to
very low risk. Central Africa accounts for the vast majority of
people at risk of T. b. gambiense infection (Figure 3).
The risk patterns in Cameroon, Central African Republic,
Chad, Congo, Equatorial Guinea, and Gabon have already been
described in some detail elsewhere [14]. In essence, areas at very
high to high risk are localized in southeastern and northwestern
Central African Republic, southern Chad, along lengthy stretches
of the Congo river north of Brazzaville, and by the Atlantic coast
on both sides of the border between Gabon and Equatorial
Guinea.
The Democratic Republic of the Congo is, by far, the country
with the highest number of people at risk (<36.2 million) and the
largest at-risk area (<790 thousand km2). Areas at risk can be
found in the provinces of Bandundu, Bas Congo, Equateur,
Kasai-Occidental, Kasai-Oriental, Katanga, Kinshasa, Man-
iema, Orientale, and South Kivu. More details on the risk and
the geographic distribution of sleeping sickness in the Demo-
cratic Republic of the Congo will be provided in a separate
paper.
In South Sudan, a sizable area (<100 thousand km2) and over a
million people are estimated to be at risk of sleeping sickness,
including a number of high to very high risk areas in Central and
Western Equatoria provinces. These findings highlight the need
for continued surveillance in this country [27]. In neighbouring
Uganda, the area at risk of T. b. gambiense infection (<17 thousand
km2) is located in the North-west of the country. It mostly falls in
the category ‘moderate’, and it accounts for over two million
people at risk.
In Angola, sleeping sickness is found in the northwestern part of
the country (<180 thousand km2 – 4.8 million people at risk), and
most of the high-risk areas are located in the Provinces of Bengo,
Kwanza Norte, Uige and Zaire.
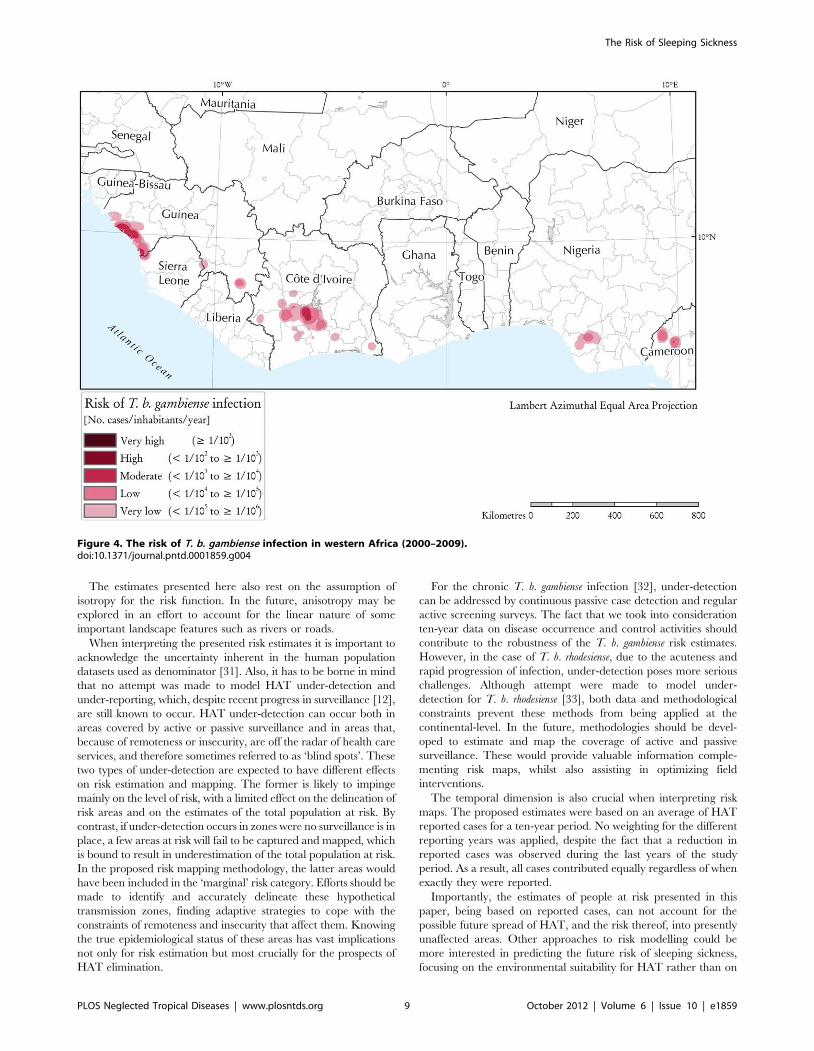
In western Africa, the most affected endemic areas are
categorized at moderate risk and they are localized in costal
Guinea and central Cote d’Ivoire (Figure 4). Areas at lower risk
fringe the main foci, but they are also found in other zones such as
southern Guinea and southern Nigeria.
Trypanosoma brucei rhodesienseRhodesian sleeping sickness is estimated to threaten a total of
12.3 million people in eastern and southern Africa (Table 5). This
population is distributed over a surface of 171 thousand km2
(Table 3 and Figure 5). Of the total population at risk of T. b.
rhodesiense, a minor proportion (<1.4 million – 11.8%) live in areas
Table 1. Thresholds for the definition of sleeping sickness riskcategories.
Category ofrisk R
_
t(s) HAT cases per annum
Very high $1022 $1 per 102 people
High 1023#R,1022 $1 per 103 people AND,1 per 102 people
Moderate 1024#R,1023 $1 per 104 people AND,1 per 103 people
Low 1025#R,1024 $1 per 105 people AND,1 per 104 people
Very low 1026#R,1025 $1 per 106 people AND,1 per 105 people
doi:10.1371/journal.pntd.0001859.t001
Table 2. Areas at risk of T. b. gambiense infection in western and central Africa (km2 6102).
CountryTotal countryarea* (km2 6102) Area at risk (km2 6102)
Very High High Moderate Low Very Low Total at risk% of totalcountry area
Angola 12,538 - 568 597 480 158 1,803 14.4
Cameroon 4,664 - - 22 79 71 173 3.7
Central African Republic 6,244 55 141 204 161 97 659 10.6
Chad 12,725 - 33 34 36 39 142 1.1
Congo 3,385 21 199 388 372 182 1,162 34.3
Cote d’Ivoire 3,214 - - 23 82 182 286 8.9
Democratic Republic ofthe Congo
23,041 27 996 2,717 2,599 1,563 7,902 34.3
Equatorial Guinea 270 - 4 37 16 8 65 24.1
Gabon 2,660 - 6 57 69 35 167 6.3
Guinea 2,461 - 1 42 53 88 184 7.5
Nigeria 9,089 - - - 16 55 70 0.8
Sierra Leone 728 - - - 7 11 18 2.5
South Sudan 6,334 21 260 379 265 76 1,001 15.8
Uganda 2,055 - 13 91 42 28 175 8.5
Other EndemicCountries**
60,316 - - - - - - -
Total 149,722 124 2,222 4,591 4,277 2,594 13,808 9.2
*Land area. The area of surface water bodies as depicted in the Shuttle Radar Topography Mission – River-Surface Water Bodies dataset [43] is not included.**Countries at marginal risk: Benin, Burkina Faso, Gambia, Ghana, Guinea-Bissau, Liberia, Mali, Niger, Senegal and Togo.doi:10.1371/journal.pntd.0001859.t002
The Risk of Sleeping Sickness
PLOS Neglected Tropical Diseases | www.plosntds.org 5 October 2012 | Volume 6 | Issue 10 | e1859

classified at moderate risk or higher, the rest (<10.9 million –
88.2%) live in areas classified at low to very low risk.
In Uganda, Rhodesian HAT threatens a population of <7.9
million, and the risk area (29 thousand km2) stretches from the
northern shores of Lake Victoria up to Lira District, north of Lake
Kyoga. The areas in Uganda where risk is relatively higher (i.e.
‘moderate’) broadly correspond to the districts of Soroti, Kaber-
amaido and northwestern Iganga.
Because of a comparatively lower human population density,
some areas in the United Republic of Tanzania are estimated to be
characterized by higher levels of risk than Uganda, despite fewer
reported cases of HAT. In particular, risk is estimated to be high in
proximity to the Ugalla River Forest Reserve (Tabora Province).
Also all of the other risk areas in the United Republic of Tanzania
are associated in one way or another to protected areas, most
notably the Moyowosi Game Reserve and the natural reservations
Table 3. Areas at risk of T. b. rhodesiense infection in eastern and southern Africa (km2 6102).
Country
Total countryarea* (km2
6102)* Area at risk (km2 6102)
Very High High Moderate Low Very Low Total at risk% of totalcountry area
Burundi 251 - - - - 2 2 0.8
Kenya 5,749 - - - 5 26 31 0.5
Malawi 948 - - 33 53 52 138 14.6
Mozambique 7,791 - - - 5 34 39 0.5
United Republic of Tanzania 8,863 - 16 125 229 286 657 7.4
Uganda 2,055 - - 45 146 97 288 14.0
Zambia 7,425 - - 33 221 224 478 6.4
Zimbabwe 3,884 - - - 9 69 78 2.0
Other Endemic Countries** 25,685 - - - - - - -
Total 62,650 - 16 236 667 792 1,711 2.7
*Land area. The area of surface water bodies as depicted in the Shuttle Radar Topography Mission – River-Surface Water Bodies dataset [43] is not included.**Countries at marginal risk: Botswana, Ethiopia, Namibia, Rwanda and Swaziland.doi:10.1371/journal.pntd.0001859.t003
Table 4. Population at risk of T. b. gambiense infection in western and central Africa (no. persons 6103).
Country
Total countrypopulation*(no. persons 6103) Population at risk (no. persons 6103)
Very High High Moderate Low Very LowTotal atrisk
% of totalcountrypopulation
Angola 12,799 - 740 749 3,049 229 4,767 37.2
Cameroon 18,879 - - 28 238 365 631 3.3
Central African Republic 4,511 28 41 130 138 99 435 9.6
Chad 10,329 - 109 114 120 123 465 4.5
Congo 4,013 4 109 451 1,825 177 2,566 63.9
Cote d’Ivoire 20,617 - - 230 722 1,720 2,672 13.0
Democratic Republic of the Congo 68,693 23 3,546 10,767 15,674 6,237 36,247 52.8
Equatorial Guinea 633 - 2 27 8 6 43 6.8
Gabon 1,515 - 2 21 19 761 803 53.0
Guinea 10,058 - - 187 488 1,932 2,606 25.9
Nigeria 149,229 - - - 368 1,814 2,183 1.5
Sierra Leone 5,132 - - 1 83 87 170 3.3
South Sudan 6,996 15 401 453 334 67 1,270 18.2
Uganda 32,370 - 142 1,275 456 251 2,124 6.6
Other Endemic Countries** 103,673 - - - - - - -
Total 449,447 70 5,092 14,431 23,521 13,869 56,983 12.7
*As per Landscan 2009.**Countries at marginal risk: Benin, Burkina Faso, Gambia, Ghana, Guinea-Bissau, Liberia, Mali, Niger, Senegal and Togo.doi:10.1371/journal.pntd.0001859.t004
The Risk of Sleeping Sickness
PLOS Neglected Tropical Diseases | www.plosntds.org 6 October 2012 | Volume 6 | Issue 10 | e1859

in the northeast of the country (i.e. Serengeti, Ngorongoro and
Tarangire). Overall, <1.8 million people (66 thousand km2) are
estimated to be at risk in this country.
In Kenya, HAT risk ranging from low to very low is localized in
the western part of the country, adjacent to risk areas in
neighbouring Uganda. Also, although no cases were reported
from the Masai Mara National Reserve during the study period,
part of its area is estimated to be at risk, as influenced by the risk
observed in the neighbouring Serengeti National Park (United
Republic of Tanzania). Interestingly, two cases have been reported
recently (2012) in travellers visiting the Masai Mara [28].
Nature reserves also shape the patterns of HAT risk at the
southernmost limit of T. b. rhodesiense distribution, most notably in
Malawi, Zambia and Zimbabwe. In this region, the highest number
of people at risk is found in Malawi (<0.9 million people), where risk
is associated to the wildlife reserves of Vwaza Marsh, Nkota-Kota,
and the Kasungu National Park. In Zambia (<0.4 million people at
risk), risk areas are scattered across the country, predominantly in
the East and most notably around the North and South Luangwa
National Parks. In Zimbabwe, an area of 7.8 thousand km2 is
estimated to be at risk (94 thousand people). This risk zone in
associated to the Mana Pools National Park and the Lake Kariba.
Discussion
Approximately 70 million people (1.55 million km2) are
estimated to be at various levels of HAT risk in Africa. This
corresponds to 10% of the total population and 7.4% of the total
area of the endemic countries. This figure is not far from estimates
made by WHO over the last thirty years, (78.54 million in 1985
[5] and 60 million in 1995 [1]). However, the meaning and
interpretation of these various figures substantially differ, and it is
unwarranted to make comparisons between the results of the
present study and previous figures, especially if the goal is to
explore trends. In the early 80 s, the only way to derive country-
and continental-level estimates of people at risk of HAT was to
collate heterogeneous information from the Ministries of Health of
the affected countries [5]. A decade later, an attempt was made to
update the estimates [1], but the degree of subjectivity in the
methodology and the reliance on expert opinion remained high.
By contrast, the present methodology is quantitative, reproduc-
ible, based on evidence and provides a categorization of risk. The
use of global human population layers [16] and the regular update
of the Atlas of HAT [4] will enable regular and comparable
updates to be made.
The presented maps of different HAT risk categories will help to
plan the most appropriate site-specific strategies for control and
surveillance, and they will contribute to ongoing efforts aimed at
the sustainable elimination of the sleeping sickness.
However, the reported incidence levels underpinning the
different risk categories differ by orders of magnitude, so that a
more accurate representation of HAT risk can be given by
focusing on the different risk categories. For example, 21 million of
people (0.7 million km2) are estimated to live at ‘moderate’ to ‘very
high’ risk of infection. These are the areas where the most
intensive control measures need to be deployed. Low to very low
risk categories account for <48 million people (0.8 million km2). In
these areas, cost-effective and adapted measures must be applied
for a sustainable control.
From the methodological standpoint, assumptions affect all
estimates of disease risk, including those presented in this paper.
One important assumption in the proposed methodology is that it
is possible to use the same approach based on human cases of
trypanosomiasis to estimate risk of both forms of sleeping sickness.
This assumption met the primary goal of generating continental
risk estimates in a consistent fashion. However, especially for T. b.
rhodesiense, different approaches could be explored, explicitly
addressing the pronounced zoonotic dimension of this form of
the disease.
Another important choice in the proposed methodology is that
of the 30 km bandwidth – the distance from affected locations
beyond which disease intensity is considered zero. Sensitivity
analysis conducted for six central African countries showed that
there is a positive linear relationship between bandwidth on the
one hand, and the extent of risk areas and the at-risk population
on the other [29,30]. However, the categories at higher risk were
shown to be the least affected by bandwidth. Therefore, as a rule,
increasing the bandwidth would inflate the low-risk categories, but
it would have a more limited effect on the delineation of areas at
higher risk.
Table 5. Population at risk of T. b. rhodesiense infection in eastern and southern Africa (no. persons 6103).
Country
Total countrypopulation* (no.persons 6103) Risk (no. persons 6103)
Very High High Moderate Low Very Low Total at risk% of total countrypopulation
Burundi 9,511 - - - 5 33 38 0.4
Kenya 39,003 - - - 254 870 1,124 2.9
Malawi 15,029 - - 194 217 499 910 6.1
Mozambique 21,669 - - - 5 53 58 0.3
United Republic of Tanzania 41,049 - 22 373 621 808 1,824 4.4
Uganda 32,370 - - 847 4,734 2,295 7,877 24.3
Zambia 11,863 - - 14 122 279 416 3.5
Zimbabwe 11,393 - - - 5 88 94 0.8
Other Endemic Countries** 101,420 - - - - - - -
Total 283,306 - 22 1,429 5,964 4,927 12,341 4.4
*As per Landscan 2009.**Countries at marginal risk: Botswana, Ethiopia, Namibia, Rwanda and Swaziland.doi:10.1371/journal.pntd.0001859.t005
The Risk of Sleeping Sickness
PLOS Neglected Tropical Diseases | www.plosntds.org 7 October 2012 | Volume 6 | Issue 10 | e1859

Figure 3. The risk of T. b. gambiense infection in central Africa (2000–2009).doi:10.1371/journal.pntd.0001859.g003
The Risk of Sleeping Sickness
PLOS Neglected Tropical Diseases | www.plosntds.org 8 October 2012 | Volume 6 | Issue 10 | e1859
The estimates presented here also rest on the assumption of
isotropy for the risk function. In the future, anisotropy may be
explored in an effort to account for the linear nature of some
important landscape features such as rivers or roads.
When interpreting the presented risk estimates it is important to
acknowledge the uncertainty inherent in the human population
datasets used as denominator [31]. Also, it has to be borne in mind
that no attempt was made to model HAT under-detection and
under-reporting, which, despite recent progress in surveillance [12],
are still known to occur. HAT under-detection can occur both in
areas covered by active or passive surveillance and in areas that,
because of remoteness or insecurity, are off the radar of health care
services, and therefore sometimes referred to as ‘blind spots’. These
two types of under-detection are expected to have different effects
on risk estimation and mapping. The former is likely to impinge
mainly on the level of risk, with a limited effect on the delineation of
risk areas and on the estimates of the total population at risk. By
contrast, if under-detection occurs in zones were no surveillance is in
place, a few areas at risk will fail to be captured and mapped, which
is bound to result in underestimation of the total population at risk.
In the proposed risk mapping methodology, the latter areas would
have been included in the ‘marginal’ risk category. Efforts should be
made to identify and accurately delineate these hypothetical
transmission zones, finding adaptive strategies to cope with the
constraints of remoteness and insecurity that affect them. Knowing
the true epidemiological status of these areas has vast implications
not only for risk estimation but most crucially for the prospects of
HAT elimination.
For the chronic T. b. gambiense infection [32], under-detection
can be addressed by continuous passive case detection and regular
active screening surveys. The fact that we took into consideration
ten-year data on disease occurrence and control activities should
contribute to the robustness of the T. b. gambiense risk estimates.
However, in the case of T. b. rhodesiense, due to the acuteness and
rapid progression of infection, under-detection poses more serious
challenges. Although attempt were made to model under-
detection for T. b. rhodesiense [33], both data and methodological
constraints prevent these methods from being applied at the
continental-level. In the future, methodologies should be devel-
oped to estimate and map the coverage of active and passive
surveillance. These would provide valuable information comple-
menting risk maps, whilst also assisting in optimizing field
interventions.
The temporal dimension is also crucial when interpreting risk
maps. The proposed estimates were based on an average of HAT
reported cases for a ten-year period. No weighting for the different
reporting years was applied, despite the fact that a reduction in
reported cases was observed during the last years of the study
period. As a result, all cases contributed equally regardless of when
exactly they were reported.
Importantly, the estimates of people at risk presented in this
paper, being based on reported cases, can not account for the
possible future spread of HAT, and the risk thereof, into presently
unaffected areas. Other approaches to risk modelling could be
more interested in predicting the future risk of sleeping sickness,
focusing on the environmental suitability for HAT rather than on
Figure 4. The risk of T. b. gambiense infection in western Africa (2000–2009).doi:10.1371/journal.pntd.0001859.g004
The Risk of Sleeping Sickness
PLOS Neglected Tropical Diseases | www.plosntds.org 9 October 2012 | Volume 6 | Issue 10 | e1859

its present occupancy. To this end, the relationships are to be
explored between HAT occurrence and a range of factors,
including human and livestock population movements [34],
environmental, climatic and socio-economic variables, as well as
disease and vector control. The potential of this type of models has
been investigated in a few local contexts, for example in
southeastern Uganda for T. b. rhodesiense [35,36,37,38], and coastal
Guinea for T. b. gambiense [25]. Recent attempts have also tried to
Figure 5. The risk of T. b. rhodesiense infection in eastern and southern Africa (2000–2009).doi:10.1371/journal.pntd.0001859.g005
The Risk of Sleeping Sickness
PLOS Neglected Tropical Diseases | www.plosntds.org 10 October 2012 | Volume 6 | Issue 10 | e1859

address risk forecasts at the regional level in relation to climate
change [39]. The potential of various modelling frameworks could
be explored for modelling the future risk of HAT [40,41]. The
growing range of spatially explicit environmental datasets [42] and
increased computational power enable these models to be applied
even across large geographical areas. Interpretation of model
outputs will probably be the most serious challenge. In fact,
incompleteness and biases in the real-world epidemiological
records often blur the line between concepts such as the theoretical
fundamental niche of a pathogen and its realized niche.
Where estimates of prevalence are available, most notably in T.
b. gambiense areas, model-based geostatistics could also be applied,
which utilize Bayesian methods of statistical inference and enable
rigorous assessment of uncertainty [11]. Their potential for, and
applicability to, a low-prevalence, focal disease such as HAT
would be interesting to explore.
Supporting Information
Map S1 Maps of distribution of population at risk of human
African trypanosomiasis in 21 disease endemic countries, where
any level of risk has been identified during the period 2000–2009.
Countries are organized on geographical order, west to east +north to south, and from T.b.gambiense to T.b.rhodesiense
endemic countries: Guinea, Sierra Leone, Cote d’Ivoire, Nigeria,
Cameroon, Chad, Central African Republic, South Sudan,
Equatorial Guinea, Gabon, Congo, The Democratic Republic of
the Congo, Angola, Uganda, Kenya, United Republic of
Tanzania, Burundi, Zambia, Malawi, Mozambique and Zim-
babwe.
(PDF)
Acknowledgments
The activities described in this paper are an initiative of the Department of
Control of Neglected Tropical Diseases - World Health Organization.
They were implemented through a technical collaboration between WHO
and FAO in the framework of the Programme against African
Trypanosomosis (PAAT).
The authors would like to acknowledge all institutions that provided the
epidemiological data used as input to this study: the National Sleeping
Sickness control Programmes and national health authorities of Angola,
Benin, Burkina Faso, Cameroon, Central African Republic, Chad, Congo,
Cote d’Ivoire, Democratic Republic of the Congo, Equatorial Guinea,
Gabon, Ghana, Guinea, Kenya, Malawi, Mali, Mozambique, Nigeria,
Rwanda, Sierra Leone, South Sudan, Togo, Uganda, United Republic of
Tanzania, Zambia and Zimbabwe; the NGOs ‘‘Medecins sans frontieres’’,
Epicentre, Malteser and Merlin; and the Research Institutions ‘‘Institut de
Recherche pour le Developpement’’, ‘‘Institut Pierre Richet’’ (Cote d’Ivoire), ‘‘Projets
de Recherches Cliniques contre la Trypanosomiase’’ (Cote d’Ivoire), ‘‘Centre
International de Recherche-Developpement sur l’Elevage en zone Sub-humide’’ (Burkina
Faso), The Centre for Infectious Disease, College of Medicine and
Veterinary Medicine, The University of Edinburgh.
The boundaries and names shown and the designations used on the
maps presented in this paper do not imply the expression of any opinion
whatsoever on the part of WHO and FAO concerning the legal status of
any country, territory, city or area or of its authorities, or concerning the
delimitation of its frontiers or boundaries.
The views expressed in this paper are those of the authors and do not
necessarily reflect the views of WHO and FAO.
Author Contributions
Conceived and designed the experiments: PPS GC. Performed the
experiments: PPS GC JRF MP. Analyzed the data: PPS GC JRF MP
AD JARP. Contributed reagents/materials/analysis tools: PPS GC JRF
MP EMF. Wrote the paper: PPS GC JRF MP AD JARP EMF RCM JGJ.
References
1. WHO (1998) Control and surveillance of African trypanosomiasis. Geneva:
World Health Organization. Available from: http://whqlibdoc.who.int/trs/
WHO_TRS_881.pdf.
2. WHO (2002) WHO programme to eliminate sleeping sickness - Building a
global alliance. Geneva: World Health Organization. Available from: http://
whqlibdoc.who.int/hq/2002/WHO_CDS_CSR_EPH_2002.13.pdf.
3. WHO (2012) Accelerating work to overcome neglected tropical diseases: a
roadmap for implementation. Geneva: World Health Organization. Available
from: http://whqlibdoc.who.int/hq/2012/WHO_HTM_NTD_2012.1_eng.pdf.
4. Simarro PP, Cecchi G, Paone M, Franco JR, Diarra A, et al. (2010) The Atlas of
human African trypanosomiasis: a contribution to global mapping of neglected
tropical diseases. Int J Health Geogr 9: 57.
5. WHO (1986) Epidemiology and control of African trypanosomiasis. Geneva:
World Health Organization. Available from: http://whqlibdoc.who.int/trs/
WHO_TRS_739.pdf.
6. Simarro PP, Jannin J, Cattand P (2008) Eliminating Human African
Trypanosomiasis: Where Do We Stand and What Comes Next. PLoS Med 5: e55.
7. Simarro PP, Diarra A, Ruiz Postigo JA, Franco JR, Jannin JG (2011) The
Human African Trypanosomiasis Control and Surveillance Programme of the
World Health Organization 2000–2009: The Way Forward. PLoS Negl Trop
Dis 5: e1007.
8. Michael E, Bundy DA, Grenfell BT (1996) Re-assessing the global prevalence
and distribution of lymphatic filariasis. Parasitology 112: 409–428.
9. Engels D, Chitsulo L, Montresor A, Savioli L (2002) The global epidemiological
situation of schistosomiasis and new approaches to control and research. Acta
Trop 82: 139–146.
10. de Silva NR, Brooker S, Hotez PJ, Montresor A, Engels D, et al. (2003) Soil-
transmitted helminth infections: updating the global picture. Trends Parasitol
19: 547–551.
11. Hay SI, Guerra CA, Gething PW, Patil AP, Tatem AJ, et al. (2009) A world
malaria map: Plasmodium falciparum endemicity in 2007. PLoS Med 6:
e1000048.
12. Cecchi G, Paone M, Franco JR, Fevre E, Diarra A, et al. (2009) Towards the
Atlas of human African trypanosomiasis. Int J Health Geogr 8: 15.
13. Cecchi G, Courtin F, Paone M, Diarra A, Franco JR, et al. (2009) Mapping
sleeping sickness in Western Africa in a context of demographic transition and
climate change. Parasite 16: 99–106.
14. Simarro PP, Cecchi G, Franco JR, Paone M, Fevre EM, et al. (2011) Risk forhuman African trypanosomiasis, Central Africa, 2000–2009. Emerg Infect Dis
17: 2322–2324.
15. Simarro PP, Franco JR, Cecchi G, Paone M, Diarra A, et al. (2012) Human
African trypanosomiasis in non-endemic countries (2000–2010). J Travel Med19: 44–53.
16. Dobson J, Bright E, Coleman P, Durfee R, Worley B (2000) LandScan: a global
population database for estimating populations at risk. Photogramm EngRemote Sensing 66: 849–857.
17. Diggle PJ (1983) Statistical analysis of spatial point patterns. London: Academic
Press.
18. Pfeiffer DU, Stevenson M, Robinson TP, Stevens KB, Rogers DJ, et al. (2008)
Spatial analysis in epidemiology. Oxford: Oxford University Press.
19. Gatrell AC, Bailey TC, Diggle PJ, Rowlingson BS (1996) Spatial point patternanalysis and its application in geographical epidemiology. Trans Inst Br Geogr
21: 256–274.
20. Silverman BW (1986) Density Estimation for Statistics and Data Analysis. NewYork: Chapman & Hall.
21. Scott DW (1992) Multivariate density estimation: theory, practice, and
visualization. New York: Wiley-Interscience.
22. Wand MP, Jones MC (1995) Kernel smoothing. London: Chapman & Hall/
CRC.
23. Solano P, Kone A, Garcia A, Sane B, Michel V, et al. (2003) [Role of patienttravel in transmission of human African trypanosomiasis in a highly endemic
area of the Ivory Coast]. Med Trop (Mars) 63: 577–582.
24. Courtin F, Jamonneau V, Oke E, Coulibaly B, Oswald Y, et al. (2005) Towardsunderstanding the presence/absence of Human African Trypanosomosis in a
focus of Cote d’Ivoire: a spatial analysis of the pathogenic system. Int J Health
Geogr 4: 27.
25. Courtin F, Jamonneau V, Camara M, Camara O, Coulibaly B, et al. (2010) Ageographical approach to identify sleeping sickness risk factors in a mangrove
ecosystem. Trop Med Int Health 15: 881–889.
26. Kelsall JE, Diggle PJ (1995) Kernel Estimation of Relative Risk. Bernoulli 1: 3–16.
27. Ruiz-Postigo JA, Franco JR, Lado M, Simarro PP (2012) Human african
trypanosomiasis in South Sudan: how can we prevent a new epidemic? PLoSNegl Trop Dis 6: e1541.
28. Gobbi F, Bisoffi Z (2012) Human African trypanosomiasis in travellers to Kenya.
Euro surveill 17: 20109.
29. Cecchi G, Paone M, Franco JR, Diarra A, Ruiz Postigo JA, et al. Up-to-date,
evidence-based estimates of sleeping sickness risk: a methodology based on
Geographic Information Systems; 2011; 31st Meeting of the InternationalScientific Council for Trypanosomiasis Research and Control (ISCTRC).
The Risk of Sleeping Sickness
PLOS Neglected Tropical Diseases | www.plosntds.org 11 October 2012 | Volume 6 | Issue 10 | e1859

Bamako, Mali. AU-IBAR (African Union - Interafrican Bureau for Animal
Resources).30. Cecchi G (2011) Biogeographical patterns of African trypanosomoses for
improved planning and implementation of field interventions. Brussels:
Universite libre de Bruxelles. 37 p. Available from: http://theses.ulb.ac.be/ETD-db/collection/available/ULBetd-01092012-153933/unrestricted/PhD_
Thesis_Cecchi_2011.pdf.31. Tatem AJ, Campiz N, Gething PW, Snow RW, Linard C (2011) The effects of
spatial population dataset choice on estimates of population at risk of disease.
Population Health Metrics 9: 4.32. Checchi F, Filipe JA, Barrett MP, Chandramohan D (2008) The natural
progression of Gambiense sleeping sickness: what is the evidence? PLoS NeglTrop Dis 2: e303.
33. Odiit M, Coleman PG, Liu WC, McDermott JJ, Fevre EM, et al. (2005)Quantifying the level of under-detection of Trypanosoma brucei rhodesiense sleeping
sickness cases. Trop Med Int Health 10: 840–849.
34. Fevre EM, Picozzi K, Fyfe J, Waiswa C, Odiit M, et al. (2005) A burgeoningepidemic of sleeping sickness in Uganda. Lancet 366: 745–747.
35. Wardrop NA, Atkinson PM, Gething PW, Fevre EM, Picozzi K, et al. (2010)Bayesian geostatistical analysis and prediction of Rhodesian human African
trypanosomiasis. PLoS Negl Trop Dis 4: e914.
36. Batchelor NA, Atkinson PM, Gething PW, Picozzi K, Fevre EM, et al. (2009)Spatial predictions of Rhodesian Human African Trypanosomiasis (sleeping
sickness) prevalence in Kaberamaido and Dokolo, two newly affected districts of
Uganda. PLoS Negl Trop Dis 3: e563.37. Zoller T, Fevre EM, Welburn SC, Odiit M, Coleman PG (2008) Analysis of risk
factors for T. brucei rhodesiense sleeping sickness within villages in south-east
Uganda. BMC Infect Dis 8: 88.38. Odiit M, Bessell PR, Fevre EM, Robinson T, Kinoti J, et al. (2006) Using remote
sensing and geographic information systems to identify villages at high risk forrhodesiense sleeping sickness in Uganda. Trans R Soc Trop Med Hyg 100: 354–362.
39. Moore S, Shrestha S, Tomlinson KW, Vuong H (2012) Predicting the effect of
climate change on African trypanosomiasis: integrating epidemiology withparasite and vector biology. J R Soc Interface 9: 817–830.
40. Hirzel A, Hausser J, Chessel D, Perrin N (2002) Ecological-niche factor analysis: howto compute habitat-suitability maps without absence data? Ecology 83: 2027–2036.
41. Phillips SJ, Anderson RP, Schapire RE (2006) Maximum entropy modeling ofspecies geographic distributions. Ecol Modell 190: 231–259.
42. Cecchi G, Mattioli RC (2009) Global geospatial datasets for African
trypanosomiasis management: a review. In: Cecchi G, Mattioli RC, editors.Geospatial datasets and analyses for an environmental approach to African
trypanosomiasis. Rome: Food and Agriculture Organization of the UnitedNations. pp. 1–39.
43. Jenness J, Dooley J, Aguilar-Manjarrez J, Riva C (2007) African water resource
database: GIS-based tools for inland aquatic resource management. Rome:Food and Agriculture Organization of the United Nations.
The Risk of Sleeping Sickness
PLOS Neglected Tropical Diseases | www.plosntds.org 12 October 2012 | Volume 6 | Issue 10 | e1859


![Improved Detection of Sleeping Sickness Cases by …Both subspecies are cyclically transmitted by infected tsetse flies of the Glossina genus [1]. The chronic form of sleeping sickness](https://img.pdfslide.us/doc/110x75/5f3ebb14546ae86eba7ad8a2/improved-detection-of-sleeping-sickness-cases-by-both-subspecies-are-cyclically.jpg)