Embed Size (px)
Citation preview
ESTIMATING ADVERSE SELECTION AND MORAL HAZARD EFFECTS WITH
HOSPITAL INVOICES DATA IN A GOVERNMENT-CONTROLLED HEALTH CARE
SYSTEM
Running head: ESTIMATING SELECTION AND MORAL HAZARD FROM HOSPITAL INVOICES Key words: Adverse and Advantageous Selection, Moral Hazard, Matching Estimators. Count: 10,753 words and 9 tables
Xiangping Liu
Center for Environmental and Resource Economics and Policy North Carolina State University, Raleigh, NC
Danijel Nestic
Institute for Economics, Zagreb, Croatia
Tomislav Vukina∗
Department of Agricultural and Resource Economics
North Carolina State University, Raleigh, NC
Corresponding author: Tomislav Vukina, Department of Agricultural and Resource Economics,
North Carolina State University, Raleigh, NC, 27695-8109. E-mail: [email protected]
Phone: 1-919-515-5864. Fax: 1-919-515-6268.
∗ The support for this project came through a grant to the University of Delaware from the State Department's Title VIII Program. No potential conflicts of interest exist. The manuscript contains original unpublished work and is not being submitted for publication elsewhere.
1
ESTIMATING ADVERSE SELECTION AND MORAL HAZARD EFFECTS WITH
HOSPITAL INVOICES DATA IN A GOVERNMENT-CONTROLLED HEALTH CARE
SYSTEM
Abstract
We use invoices for hospital services from a regional hospital in Croatia to test for adverse selection and moral hazard. There are 3 categories of patients: with no supplemental insurance, who bought it, and who are entitled to it for free. Our identification procedure relies on the premise that the difference in the observed medical care consumption between the patients who bought the insurance and those entitled to free insurance is caused by pure selection effect. Results show favorable selection for patients in 20-30 year cohort and significant moral hazard for all age cohorts. The selection effect reverses its sign in older cohorts explained by the differences in risk-aversion across cohorts caused by the timing of transition from socialism to market economy.
Key words: Adverse and Advantageous Selection, Moral Hazard, Matching Estimators.
1. Introduction
The last decade, in the U.S. and elsewhere, has been characterized by pronounced inflation in
health care costs. Commonly suggested explanations for this phenomenon are the distortion in
the health insurance market due to asymmetric information about the latent health status of
individuals that leads to adverse selection problem and run-away medical expenditures due to
moral hazard. Despite of being the textbook example of a market plagued with asymmetric
information problems, the empirical evidence on the importance of either moral hazard or
adverse selection in health insurance markets varies by country, type of health service provided,
socio-economic status of insured, etc. For example, using Australian data, Cameron et al. (1988)
found that more generous coverage leads to higher utilization of broad range of services because
of both moral hazard and adverse selection reasons. Also for Australia, Savage and Wright
(2003) found that after correcting for endogeneity the extent of moral hazard can increase the
expected length of a hospital stay by a factor of up to 3. Coulson et al. (1995) found that
supplemental insurance increases the number of prescription filled among the elderly in the U.S.
but do not find evidence of adverse selection. Vera-Hernandez (1999), for Spain, found different
evidence for heads-of-household than dependents. For heads-of-household, those who
presumably make the insurance decisions, there is evidence of adverse selection but no evidence
2
of moral hazard. In contrast, for other household members there is evidence of moral hazard.
Holly et al. (1998), using data for Switzerland, found evidence of both moral hazard and adverse
selection in hospital stays.
The main objective of this paper is to use the distinct feature of the supplemental health
insurance design in Croatia to test for the presence of adverse selection and moral hazard effects
and try to disentangle the two effects from each other. The health care system in Croatia is
dominated by a single public health insurance fund: the Croatian Institute for Health Insurance
(HZZO). The HZZO offers two types of insurance: the compulsory insurance and the
supplemental insurance. As the name suggests, the compulsory insurance’s coverage is universal
whereas the supplemental insurance can be either bought or is extended automatically free of
charge to certain categories of citizens (e.g. full time students). For the group of people who
bought the supplemental insurance, the asymmetric information problems consist of both moral
hazard and adverse selection effects. For the group who are given the insurance free of charge,
there is no selection effect and the anticipated excess in health care consumption should be
caused by the moral hazard effect alone (because it is extremely unlikely that some young people
enrolled at the university for the purpose of obtaining the supplemental health insurance). Our
identification procedure therefore hinges on the premise that the difference in the observed
medical care consumption between the two groups is due to the pure adverse selection effect.
Our unique data set consists of invoices for out-patient hospital services from one mid-size
regional hospital in the semi-agricultural northern part of Croatia. The empirical results are
obtained using matching estimators. There are two basic types of models for matching estimators.
One approach, which was utilized in the early work by labor economics and is still used in
empirical research, matches directly on conditional variables (Dehejia and Wahba, 2002).
However, matching on conditional variables becomes difficult as the dimension of the
conditional variables increases. Rosenbaum and Rubin (1982) proposed Propensity Score
Matching methods that solve the dimensionality problem by estimating the propensity scores
using conditional variables and then match on the estimated propensity scores. Since the number
of available conditional variables in our data is not very large, we match directly on our
conditional variables. The estimation approach similar to ours is Barros et al. (2008) who used a
3
matching estimator technique due to Abadie and Imbens (2006) to estimate the impact of extra
health insurance coverage in Portugal. They showed large and statistically significant moral
hazard effect among 18-30 years old when it comes to the number of blood and urine tests and
no evidence of moral hazard on the probability of visiting a dentist.
Our work is also related to Fang, Keane and Silverman (2008) who provide evidence of
favorable (advantageous) selection in the Medigap insurance in the U.S. and analyze its sources.
The Croatian public health care system as provided by the HZZO is very similar to the Medicare
system in the U.S. which provides free but limited public health insurance for the 65 years and
older citizens. The individuals covered by Medicare can choose to purchase Medigap to cover
the gaps in Medicare such as co-pays, deductibles and uncovered expenses (e.g. prescription
drugs, prolonged hospital stays, etc.). Same as Medigap, the Croatian supplemental insurance
system is ideal for studying multidimensional private information problems because of the built-
in restrictions on the insurance contracts that insurance companies can offer. Without these
restrictions, Chiappori et al. (2006) showed that a suitably modified version of the positive
correlation between the insurance coverage and ex-post realization of loss, characteristic of the
classic equilibrium insurance model (Rothschild and Stiglitz, 1976), still holds with
multidimensional private information. In Medigap the insurers can effectively price contracts
only on age, gender, smoking status and state of residence, whereas the HZZO supplemental
policy, as will be discussed in detail in the next section, is priced based on the income variable
alone.
In addition to analyzing the asymmetric information effects in the general population of hospital
patients, we also look at the behavior of farmers. Farmers are anecdotally perceived as more
likely to be self-insured and also, due to arguably worse access to health care centers relative to
urban dwellers, are more likely to be lighter users of health services. So far, the issue of farmers’
access to health insurance and health care has not been extensively studied either by agricultural
or health economists. A notable exception is Zheng and Zimmer (2008) who used the U.S.
Medical Expenditure Panel Survey 1996-2001 data and showed that farmers have problems
accessing affordable health insurance coverage which leads to overall reduction in health care
4

utilization by uninsured farmers. They also found these effects to be large and statistically
significant even after controlling for selection.
Similar to Fang, Keane and Silverman (2008), we also found the presence of favorable selection
effect but only for the youngest patients between 20 and 30 years of age. Interestingly, the
selection effect reverses its sign in the next age cohort (30-40) from favorable to adverse
selection. The result can be explained by the fact that Croatia is a transition economy where the
old socialist/communist system collapsed 20 years ago. Because the young people’s entire life
experience has been formed under the volatility and uncertainty of market economy, they are
likely to be more risk averse than their parents and hence tend to buy more insurance. The effect
wears off in older generations used to job security and free health care under the old system. We
also found the presence of positive and statistically significant moral hazard effect for all age
cohorts of patients. Finally, compared to the rest of the population, the effects of asymmetric
information problems (both adverse selection and moral hazard) seems to be less pronounced
with farmers.
2. Health Insurance in Croatia
The health care system in Croatia is still largely dominated by the institutional set-up inherited
from the socialist past-time. The central government of Croatia plays a dual role on the market
for health care. On the one hand, it acts as the purchaser and provider of health care through its
influence on the public insurance fund’s (HZZO) funding, and on the other hand, together with
the regional and municipal governments, it is the largest owner of hospitals and public health
institutions. Although the provision and funding of services are largely public, private providers
and insurers also operate on the fringes of the market and this segment of the market is steadily
growing (see Vukina and Nestic, 2008).
The Croatian health system has fared relatively well among the countries in the region. The
system has a well-trained health workforce, a well-established system of public health programs
and health delivery system, and good health outcomes in relation to countries at comparable
income levels (see Voncina et al., 2006). However, these results have been achieved at a high
cost and the HZZO has faced growing deficits in the late 1990s. Despite the fact that the
5
generous benefits and exemptions inherited from the old system have been politically difficult to
roll back, Croatia has embarked on a number of reform initiatives that resulted in a relative
decline in total spending on health, from estimated 9.2% in 1999 to 8.1% of GDP estimated for
2008 (World Bank, 2008). Nevertheless, despite the reductions, the health system is still heavily
burdened by arrears. According to the Croatian Ministry of Health, at the end of 2008, the
accumulated debt amounted to 4.65 billion HRK (1USD = 5.19 HRK as of July 20, 2009).
Solutions advocated by policy-makers in Croatia heavily revolved around increasing the inflow
of private funds into the system. Reforms have included enlarging the participation scheme (co-
payments), reducing the number of individuals exempt from participation, the introduction of
administrative fees, and some cost savings in prescription drugs expenditures. The pressure on
public resources to spend more on health will intensify in the coming years, and will have to be
met with prudent allocation of resources and continuous efforts to improve productivity
wherever possible.
The main characteristics of the system provided by HZZO, reflective of the most recent reform
launched on January 1, 2009, can be summarized as follows:
Compulsory Insurance: The compulsory health insurance, based on the principles of equality and
solidarity, is mandatory for essentially all people with permanent residence in Croatia. It is
funded by a combination of a 15% payroll tax (with an additional 0.5% for work related injury
insurance) and specific budgetary appropriations to cover the shortfalls. The system covers
primary health care, specialists’ medical care, hospital care, prescription medications, dental care,
orthopedic and prosthetic devices and the medical coverage while traveling abroad. In addition to
health care coverage, the system also includes monetary compensation for sick leaves, monetary
compensation for temporary disabilities and medical care related transportation costs. The
insured people have the right to choose their primary care physician and dentist. Women also
have the right to choose their gynecologist and parents have the right to choose the pediatrician
for their children. These choices are made for a minimum of one year period but can be easily
changed. To seek specialists’ medical care (in-patient or out-patient), the insured person needs a
referral from his or her primary care physician (family physician, dentist or gynecologist). The
service will be provided at the closest facility that has an established contractual relationship
6
with HZZO. The referral is valid for 30 days. When it comes to prescription drugs coverage, the
insured persons have access to medications from the base list and the supplemental list. The base
list contains medically and economically most appropriate (mostly generic) drugs, whereas the
supplemental list contains more expensive drugs. The compulsory insurance guarantees the
coverage of prescription drugs up to the price of the equivalent drug from the base list.
The compulsory health insurance system distinguishes two categories of medical care services:
(a) full coverage health care services and (b) co-payments based services.
(a) The full coverage services afforded by the compulsory insurance include:
• full health care for children under the age of 18
• health care of women related to pregnancy and child birth
• preventive and curative health care related to HIV and other infectious diseases
• mandatory vaccinations and immunizations
• hospital care for all chronic psychiatric patients
• complete treatment of all cancerous diseases
• dialysis
• organ transplants
• emergency room interventions
• house-calls and at-home treatment of patients
• certain categories of ambulance transportation
• prescription drugs from the HZZO basic list
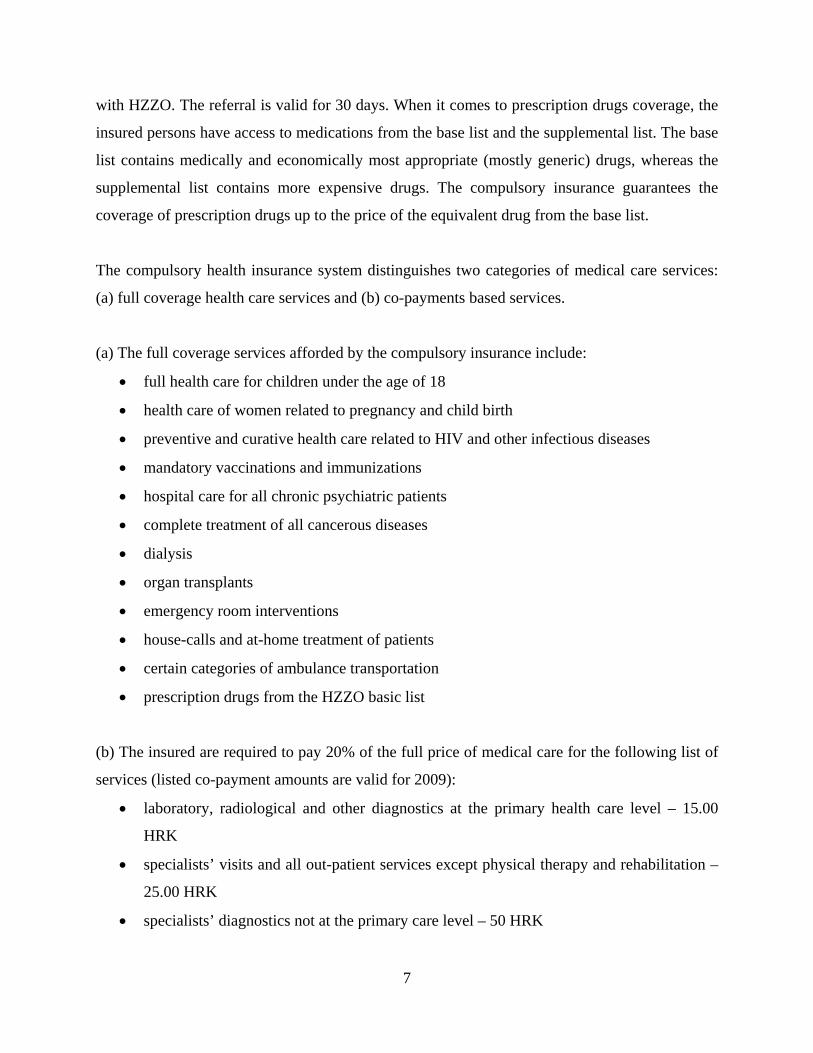
(b) The insured are required to pay 20% of the full price of medical care for the following list of
services (listed co-payment amounts are valid for 2009):
• laboratory, radiological and other diagnostics at the primary health care level – 15.00
HRK
• specialists’ visits and all out-patient services except physical therapy and rehabilitation –
25.00 HRK
• specialists’ diagnostics not at the primary care level – 50 HRK
7

• orthopedic and prosthetic devices – 50 HRK
• out-patient and at-home physical therapy and rehabilitation – 25 HRK per day
• in-patient care – 100 HRK per day
• dental care of adults 18 to 65 years of age – $1,000.00 HRK
• dental care of adults older than 65 years – or 500 HRK
• primary care (family, gynecologist, dentist) – 15 HRK
• prescription drugs – 15 HRK per subscription
The largest out-of-pocket cost-share amount that a person can pay amounts to 3,000.00 HRK per
one invoice.
Supplemental Insurance: This is a voluntary insurance that can be acquired by a person 18 years
of age or older, having compulsory insurance, by signing a contract with HZZO. Alternatively,
an employer can sign a contract with HZZO for the supplemental insurance coverage for all of its
employees where the premium can be paid either by the company or deducted from the
employees’ net salary. A person having the supplemental insurance policy is entitled to full
waiver of all medical expense co-payments listed in section (b) above.
The premiums for the supplemental insurance are determined as follows:
• 50.00 HRK per month for a retired person with pension less than 5,108.00 HRK,
• 80.00 HRK per month for a retired person with pension higher than 5,108.00 HRK,
• 80.00 HRK per month for a active person with net income less than 5,108.00 HRK,
• 130 HRK per month for an active person with net income in excess of 5,108.00 HRK,
• 80 HRK per month for all family members and dependents.
(c) The most important feature of the HZZO supplemental insurance program is the fact that
certain categories of citizens are entitled to the supplemental insurance free of charge, i.e. their
premiums are covered from the state budget. The list of people that have the right to free
supplemental insurance and hence pay no co-payments from section (b) is quite large. Here we
list only the most important ones:
• people whose per capita monthly household income does not exceed 1,516.32 HRK, and
1,939.39 HRK for single retired individuals,
8
• full time secondary school or college students,
• various categories of disabled people and war veterans and their family members,
• military service draftees,
• subsistence farmers above the age of 65,
• blood donors with 35 or more donations for men and 25 or more for women.
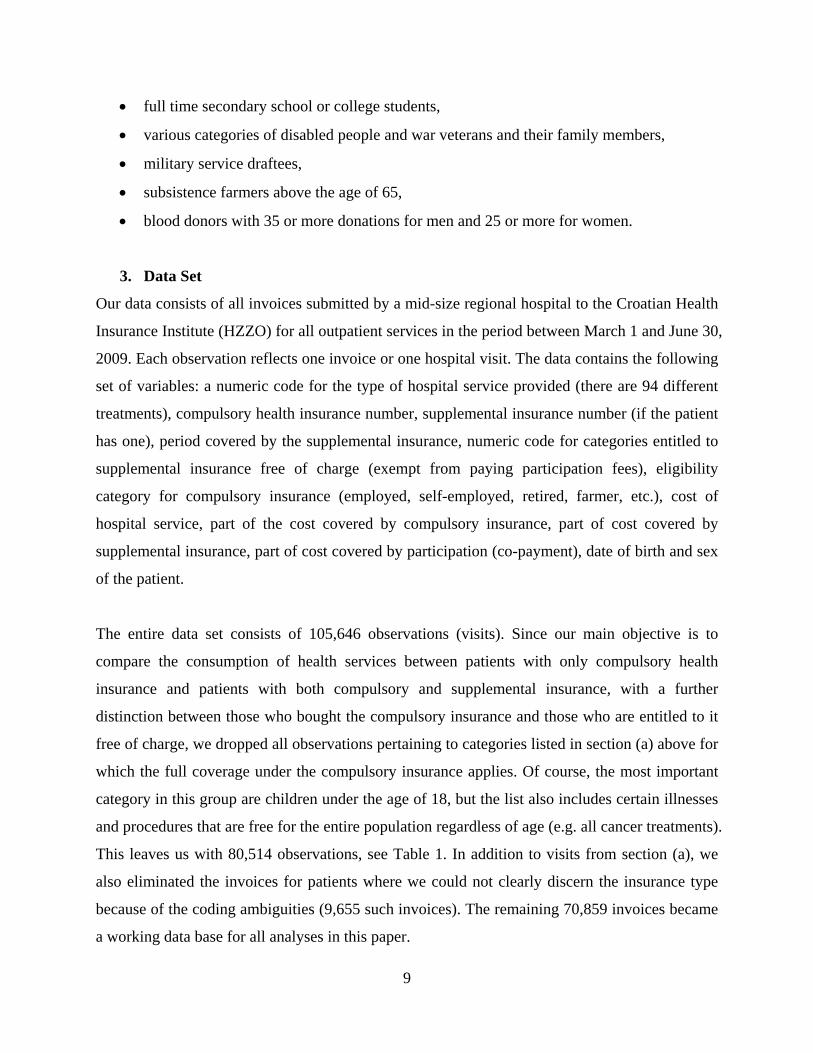
3. Data Set
Our data consists of all invoices submitted by a mid-size regional hospital to the Croatian Health
Insurance Institute (HZZO) for all outpatient services in the period between March 1 and June 30,
2009. Each observation reflects one invoice or one hospital visit. The data contains the following
set of variables: a numeric code for the type of hospital service provided (there are 94 different
treatments), compulsory health insurance number, supplemental insurance number (if the patient
has one), period covered by the supplemental insurance, numeric code for categories entitled to
supplemental insurance free of charge (exempt from paying participation fees), eligibility
category for compulsory insurance (employed, self-employed, retired, farmer, etc.), cost of
hospital service, part of the cost covered by compulsory insurance, part of cost covered by
supplemental insurance, part of cost covered by participation (co-payment), date of birth and sex
of the patient.
The entire data set consists of 105,646 observations (visits). Since our main objective is to
compare the consumption of health services between patients with only compulsory health
insurance and patients with both compulsory and supplemental insurance, with a further
distinction between those who bought the compulsory insurance and those who are entitled to it
free of charge, we dropped all observations pertaining to categories listed in section (a) above for
which the full coverage under the compulsory insurance applies. Of course, the most important
category in this group are children under the age of 18, but the list also includes certain illnesses
and procedures that are free for the entire population regardless of age (e.g. all cancer treatments).
This leaves us with 80,514 observations, see Table 1. In addition to visits from section (a), we
also eliminated the invoices for patients where we could not clearly discern the insurance type
because of the coding ambiguities (9,655 such invoices). The remaining 70,859 invoices became
a working data base for all analyses in this paper.
9

The breakdown of the data set by the type of insurance is presented in Table 2. There are 22,957
patinets in the data set, 57.4% of them are female and they are on average 52.7 years old, and
most of them are retired - 40.3%, followed by active (payroll) – 37.5% and farmers – 12.7%. The
fact that we are dealing with the older population is caused by the fact that patients under 18
years of age were dropped from the sample for reasons explained before. There are only 2,485
patients (10.8%) with no supplemental insurance, the rest have supplemental insurance either
because they qualified for free access (34.6%) or they bought the policy (54.6%). If we look at
the category of farmers (see also Table 3 for details), we can see that only 3.9% of them have no
supplemental insurance compared to the general population of 10.8%. Also, more of them are
eligible for free supplemental insurance – 61.5%, relative to the general population where only
34.6% qualify.
By simply eyeballing the data one can clearly see that the number of visits per patient is larger in
the group of patients with supplemental insurance (more than 3 visits) than in the group of
patients with no supplemental insurance (2 visits). Also, total cost per visit is higher for the
group who have the supplemental insurance but the difference is quite negligible when it comes
to comparison of people that bought the supplemental insurance and those who do not have it.
The difference is substantially larger (about 20 HRK per visit) when one compares the group
with free access to supplemental insurance and the group who does not have the supplemental
insurance at all.
Next, we look at some specific services provided by the hospital. The most frequently used
hospital services by the total number of visit are listed in Table 4. It is interesting to note that
only 8 categories of services account for well over half of the total visits during the period
covered by the data. The largest number of visits falls into the category of physical therapy
(19.2% of visits). The percentage would be even larger if combined with a similar type of service
(physical medicine and rehabilitation -3.9%). Another interesting feature of the most frequently
provided hospital services is that they all seemed to be largely non-life-threatening diagnoses
which made them desirable for the purposes of this study. Since we are interested to estimate the
impact of health insurance on the level of consumption of medical care, preferably we would like
10
to deal with illnesses and conditions where the decision regarding whether to see a doctor or not
is not a matter of life and death.
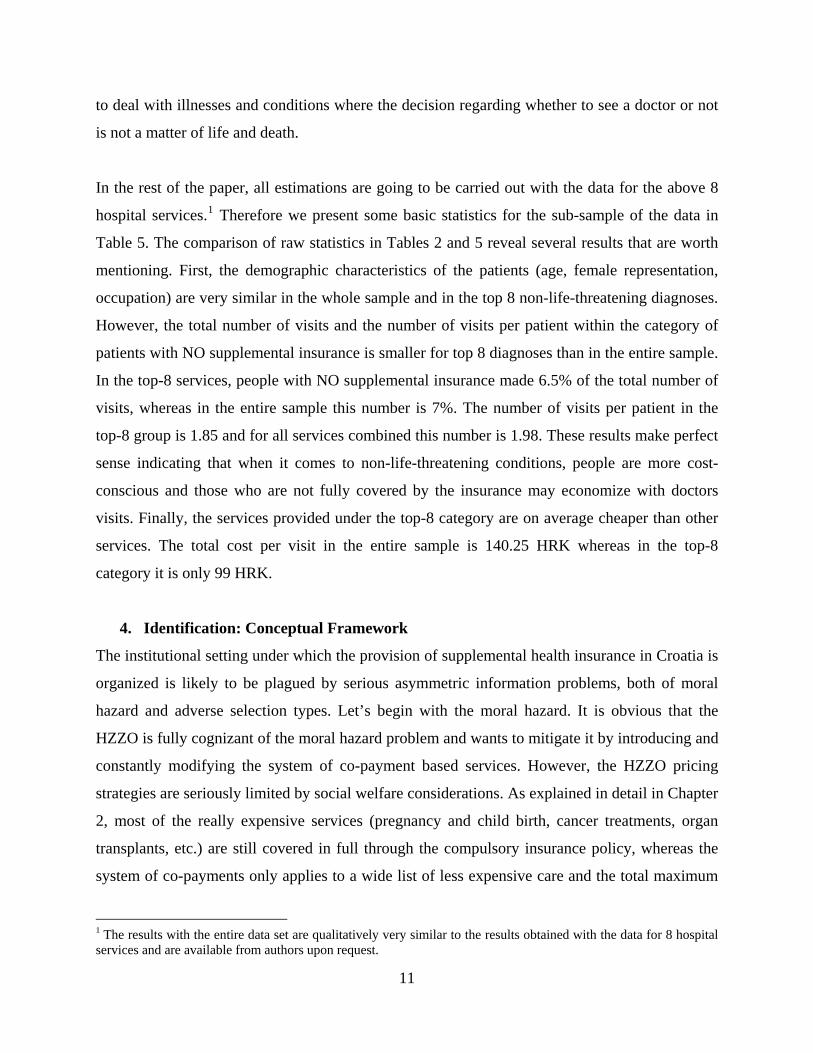
In the rest of the paper, all estimations are going to be carried out with the data for the above 8
hospital services.1 Therefore we present some basic statistics for the sub-sample of the data in
Table 5. The comparison of raw statistics in Tables 2 and 5 reveal several results that are worth
mentioning. First, the demographic characteristics of the patients (age, female representation,
occupation) are very similar in the whole sample and in the top 8 non-life-threatening diagnoses.
However, the total number of visits and the number of visits per patient within the category of
patients with NO supplemental insurance is smaller for top 8 diagnoses than in the entire sample.
In the top-8 services, people with NO supplemental insurance made 6.5% of the total number of
visits, whereas in the entire sample this number is 7%. The number of visits per patient in the
top-8 group is 1.85 and for all services combined this number is 1.98. These results make perfect
sense indicating that when it comes to non-life-threatening conditions, people are more cost-
conscious and those who are not fully covered by the insurance may economize with doctors
visits. Finally, the services provided under the top-8 category are on average cheaper than other
services. The total cost per visit in the entire sample is 140.25 HRK whereas in the top-8
category it is only 99 HRK.
4. Identification: Conceptual Framework
The institutional setting under which the provision of supplemental health insurance in Croatia is
organized is likely to be plagued by serious asymmetric information problems, both of moral
hazard and adverse selection types. Let’s begin with the moral hazard. It is obvious that the
HZZO is fully cognizant of the moral hazard problem and wants to mitigate it by introducing and
constantly modifying the system of co-payment based services. However, the HZZO pricing
strategies are seriously limited by social welfare considerations. As explained in detail in Chapter
2, most of the really expensive services (pregnancy and child birth, cancer treatments, organ
transplants, etc.) are still covered in full through the compulsory insurance policy, whereas the
system of co-payments only applies to a wide list of less expensive care and the total maximum
1 The results with the entire data set are qualitatively very similar to the results obtained with the data for 8 hospital services and are available from authors upon request.
11

out-of-pocket expense is limited. For those who are sensitive to paying these modest co-
payments, the HZZO instituted the supplemental insurance which is available to all people that
already have the compulsory insurance. A person having the supplemental insurance is entitled
to full waiver of all co-payments and, after paying the premium, can consume essentially all
medical services at zero price. Having said this, the magnitude of the moral hazard problem in
the entire system (compulsory and supplemental insurance) is likely to be severe.
What about the adverse selection problem? Of course, within the current setting, this problem is
only relevant when pricing the supplemental insurance policies because the compulsory
insurance is funded by taxes and budgetary appropriations. There are two distinct possibilities.
On the one hand, it is very likely that each individual’s health status is unknown to HZZO and
cannot be correctly ascertained at meaningfully low cost.2 The theoretically correct solution to
this problem is to offer a menu of contracts such that people would self-select themselves into
purchasing a contract that is closely reflective of their type (health status). This menu would
typically involve various combinations of benefits and premiums (prices) that people can choose
from. On the other hand, there could be no fundamentally important asymmetry of information
problem in the sense that using the readily observable individual socio-economic and other
characteristics, HZZO can correctly predict the probability of a person having a loss (in this
context going to the hospital and consuming a health service) and can sell insurance policies to
different categories of people at different prices (premiums). Since the HZZO neither offers a
menu of contracts nor meaningfully price discriminates when selling their supplemental
insurance policies, the agency’s pricing strategy per se is not revealing of the true nature and the
magnitude of the adverse selection problem. It is possible that we could observe HZZO selling
all policies at essentially the same price because the asymmetric information problems are severe
and offering a menu of contracts may be administratively too costly to apply. Alternatively, the
asymmetric information problems could be rather modest or even trivial and the reason why
HZZO does not price discriminate can be explained by equity and solidarity considerations.3
2 Of course, if cost is not an issue, then HZZO can figure out each individual's health status almost precisely by subjecting all applicants to a thorough medical exam prior to purchasing the policy. 3 As mentioned in Chapter 2, HZZO is selling supplemntal insurance policies at three different monthly premiums (50, 80 and 130 HRK which is the equivalent of 10, 16, and 26 U.S. dollars). Obviously, the HZZO pricing policy is not governed by the actuarial considerations because the supplemental insurance to retirees, who are the most likely to have a loss (to use it) is sold at a discount.
12
Despite the fact that the HZZO pricing strategies for supplemental insurance and the system of
co-payments are most likely not designed with the primary objective of solving the asymmetric
information problems but are predominantly ruled by the social welfare considerations, the
design of the supplemental insurance program itself can be used to measure the magnitude of the
asymmetric information distortions and disentangle the effect of adverse selection from the
moral hazard. Let’s explain how.
Imagine a hypothetical experiment where we can randomly divide the population into two
groups: group X and group Y such that there are no systematic differences between them. We
award the insurance to group X free of charge and offer people in group Y to purchase the
insurance if they choose to do so. Depending on their health status, longevity expectations, risk
attitudes, cognitive ability, etc., some people will buy the insurance (call it Y1) and some people
will not (call it Y2). The people with free insurance (group X) and the people who bought the
insurance (group Y1) enjoy precisely the same coverage in all respects. Obviously, people in
group X are not affected by adverse selection because they obtained this coverage automatically
and not by choice. Their behavior is only impacted by moral hazard (having the insurance
changed their behavior relative to when they were uninsured). Contrary to this, the behavior of
people in the group who actually bought the insurance (Y1) has been impacted by both adverse
selection effect (they bought the insurance because of some private information) and moral
hazard. Obviously, in this kind of experiment, we can identify the “pure” adverse selection effect
but only the “jammed” moral hazard effect. The clean adverse selection is obtained by
comparing the consumption of health care services in group Y1 (who were given the choice to
buy the insurance and took it) with their identical counterparts in group X who were assigned the
insurance for free. The jammed moral hazard effect is obtained by comparing the consumption of
health care services by group X with their observably identical counterparts in group Y2 who
chose not to buy insurance.
To illustrate, we can write a person’s medical expenditure (or consumption) Mi as a function of
his/her insurance status Ii, unobserved fixed effects (health status) hi, and some noise εi with
mean zero:
13

iiii hIM εα ++= .
An individual can obtain the insurance in which case 1=iI
)1
either because he/she is eligible to
receive it for free or because chooses to buy it ( =iB . Obviously, in this specification, α
captures the effect of moral hazard.4 Now, the average medical expenditure difference between
groups Y1 who chose to buy the insurance and Y2 who chose not to buy can be expressed as:
{ }]0[]1[]0[]1[ =−=+==−= iiiiii BhEBhEBMEBME α . (1)
The average medical expenditure difference between group (X) who is entitled to free insurance
and Y2 who chose not to buy the insurance is:
{ }]0[][]0[][ =−+==− iiii BhEhEBMEFreeME α . (2)
This is the measure of asymmetric information that we call the “jammed” moral hazard because
it is equal to pure moral hazard α plus the difference between the mean fixed effects for the free
insurance group and the group who choose not to purchase the insurance. Finally, the mean
medical expenditure difference between group Y1 and group X is:
][]1[][]1[ iiii hEBhEFreeMEBME −==−= (3)
which represents the pure adverse selection effect.
Notice that even in this true natural experiment we cannot precisely disentangle the moral hazard
effect from the adverse selection effect. This is due to the fact that we essentially observe three
means:
]1[]1[ =+== iii BhEBME α
]0[]0[ === iii BhEBME
][][ ihEFreeME += α
but on the right hand side of these equations we have four unknowns and there is no way to
recover the four unknowns from the three observed variables on the left hand side. Given the fact
that in the randomly assigned groups, ]0[][ =≥ iii BhEhE , the jammed moral hazard measure
should systematically overestimate the pure moral hazard. It is also straightforward to see that
4 In this simple model we ignore observable health components as they would only increase notational clutter. In models that allow for multidimensional private information, in addition to health status, hi can also include things like risk aversion, cognitive ability, longevity expectations, etc.
14
the sum of expressions (2) and (3) yields (1), which means that the difference in average medical
expenditure between group that bought the insurance (Y1) and refuse to buy it (Y2) is the sum of
jammed moral hazard and pure adverse selection effects. Consequently, since
]0[]1[ =≥= iiii BhEBhE , in randomly selected groups, expression (1) would systematically
overestimate the combined effect of pure moral hazard and adverse selection.
The institutional design of the health insurance in Croatia mimics the above-mentioned
experimental setting, but with an important difference. The patients who are entitled to
supplemental insurance for free correspond to group X in the above hypothetical experiment and
the remainder of the population who had to choose between buying and not buying the
supplemental insurance corresponds to group Y. However, the composition of our group X has
been decided based on some pre-determined set of criteria and therefore it is not random and
hence the left-over segment Y is nonrandom as well. The nonrandom group assignments
complicate the estimation of both moral hazard and adverse selection effects.
The analytical bias introduced by the term ]0[][ =− iii BhEhE into the measurement of the
true moral hazard effect in (2) depends on the difference between the average fixed effect (health
status) of the general patient population and the patients who opted not to buy the insurance. In
our concrete situation the first group is not the general patient population but the patients with
preferential insurance status, i.e. those who were entitled to receive the supplemental insurance
free of charge (FREE) and the left-over group (1-FREE) are patients who decided not to buy the
supplemental insurance (NO). If our FREE group consists of patients with better than average
health relative to the general population and more similar to the patients in the other group who
chose not to buy the insurance (NO), it is actually possible that our non-random assignment
design could eliminate the positive analytical moral hazard bias (jam) or perhaps even change it
from positive to negative (an underestimated effect). Of course, if the opposite is true, the
problem of overestimation of the moral hazard is exacerbated.
The non-random assignment of groups complicates the estimation of the adverse selection effect
as well, even if the estimation of the adverse selection effect, as defined in (3), is not plagued by
15
any analytical bias. The problem is caused by the fact that is not representative of the
entire patient population but of the FREE group and the
][ ihE
]1[ =ii BhE represents the average
health status of the (1-FREE) group who decided to purchase the supplemental insurance
(BOUGHT). If our FREE group consists of people with better than average health relative to the
general population, then the residual (1-FREE) group will necessarily have worse average health
than the random group and, among them, people who decided to buy the insurance will have
worse health then people who would decide to buy the insurance in a randomly selected group.
In such a case, our data would overestimate the actual adverse selection effect. If the opposite is
true, then our data would underestimate the actual adverse selection effect.
In summary, as supplemental insurance is buying the relief from paying co-payments for various
medical services thereby effectively reducing their price, we hypothesize that under the current
system of health insurance in Croatia we should see both the increased number of visits to the
hospital and the higher total cost of provided services for patients with supplemental insurance
relative to people with compulsory insurance only. Because, on average, the composition of the
group who received the supplemental insurance for free is unlikely to be seriously slanted
towards patients with really bad health, for those who actually bought the supplemental
insurance it is reasonable to expect that they would consume even more health care services
relative to the free group because, in addition to moral hazard, their increased health care
consumption is likely to have been impacted by self-selection consideration.5
5. Estimation Approach
The estimation of moral hazard and adverse selection effects identified in equations (1)-(3) is
carried out using matching estimators. While for each patient, given his/her insurance type, we
observe the number of visits to the hospital and the corresponding cost of providing the service,
we do not observe the counterfactuals. In this context the counterfactual reflects how much
medical services would be consumed by a patient with supplemental insurance had that person
have only compulsory insurance. Thus, the problem in estimating equations (1)-(3) is to 5 Notice that if everybody in the FREE group has really bad health, then the adverse selection effect would be heavily underestimated and patients in the BOUGHT group would consume less health services than patients in the FREE group.
16
construct the unobservable counterfactuals for the patients who have supplemental insurance,
either purchased or given for free, using the patients who choose not to buy the supplemental
insurance.
The matching method matches a patient who has supplemental insurances with their
observationally equivalent patients who have compulsory insurance only. The average
consumption levels of the matched patients who only have compulsory insurance are the
constructed counterfactual for the patients with supplemental insurance. Therefore, the mean
difference in consumption level of the patients with supplemental insurance and the constructed
counterfactuals is the Average Treatment Effect on the Treated (ATT). In our context, the ATTs
are the impacts of supplemental insurance and unobserved health status on the medical service
consumption for the patients who have supplemental insurance. Specifically, the estimated mean
difference between the patients with FREE supplemental insurance and their observationally
equivalent patients with NO supplemental insurance captures the effect of jammed moral hazard
(equation (2)), whereas the difference between the patients who BOUGHT the supplemental
insurance and their observationally equivalent patients with NO supplemental insurance captures
the combined effect of adverse selection and jammed moral hazard (equation (1)). Finally, we
can match FREE patients with the BOUGHT patients to estimate the effect of adverse selection
directly (equation (3)) as the average difference in health consumption for BOUGHT patients
and the constructed counterfactuals from FREE patients.
The Conditional Independence Assumption (CIA) is the basic assumption for matching method
which aims to estimate the pure ATT of a treatment. This assumption implies that whether
patients have certain types of insurance or not is random conditional on a set of observable
factors. The CIA requires that our conditioning variables include all key factors that affect both
the consumption of health services and the decision to buy the supplemental insurance.
Heckman et al. (1998) relaxed the strong CIA condition by proposing a Conditional Mean
Independence (CMI) assumption. This assumption implies that the mean consumption levels of
medical services of the patients with supplemental insurance had the insurance not existed are
the same as that of their matched patients with compulsory insurance given the set of
17

conditioning variables. CMI holds as long as unobservable factors, if there are any, have the
same impact on the consumption levels of the patients with or without supplemental insurance.
Based on the CIA condition, if we are interested in estimating the impact of supplemental
insurance, i.e., the moral hazard effect, we have to control for all factors that affect the
consumption of medical services including the patients’ unobserved health status. With its
weaker version (CMI), we only have to argue that the unobserved health status have the same
impact on the medical services consumption for the patients with and without the supplemental
insurance. The violation of the CIA or CMI indicates that the estimated ATT is no longer an
unbiased estimate of the pure impact of supplemental insurance and that it includes the impact of
uncontrolled factors. In our context where the health status is the most important unobserved
factor, the violation of CIA or CMI conditions indicates that we estimate a combination of
multiple causal effects which include the impact of having supplemental insurance (moral
hazard) and the impact of uncontrolled difference in health status (adverse selection). This is
what we estimate in equations (1) and (2). The presence of the third group who are entitled to
supplemental insurance for FREE rather than self-selecting themselves into group BOUGHT or
NO provides an instrument which allows us to estimate the impact of unobserved heath status in
equation (3), i.e. the pure adverse selection effect.
We match the observationally equivalent patients among different groups using a set of
conditioning variables. We implement matching method directly on patients’ observed
demographics. Specifically, we match all patients with compulsory insurance only (NO) with
patients with supplemental insurance (BOUGHT and FREE) if they have the same age, sex, and
the eligibility category for compulsory insurance (payroll, unemployed, self-employed, retired,
farmer, welfare recipient). In the matching process, we allow two-year age difference between
matched patients because patients born at the end of a year are not much older than the ones born
early the following year. We then calculate the estimated values for equation (1) and (2) by
taking the differences in the number of visits and total medical cost between the matched patients
with and without supplemental insurance. Similarly, we match the patients who choose to buy
the supplemental insurance (BOUGHT) with the ones who are entitled to supplemental insurance
(FREE) to estimate the pure effect of adverse selection (equation (3)).
18

As we mentioned before, the differences between the hypothetical experimental design described
before and the actual institutional design of the health insurance in Croatia that generated our
data cause some problems that could potentially jeopardize our estimation strategy. As a result of
non-random group composition, the distribution of patients’ latent health status could be
systematically different between the groups. In an unlikely extreme case, the latent health status
might not overlap at all such that one cannot find any patients from the FREE group who has the
same health status in the BOUGHT or NO groups. In more likely cases we could possibly
encounter biases (over-estimation or under-estimation) of asymmetric information effects
discussed in the previous section.
Although we are not able to observe the latent health status directly, the problem can be
practically solved by finding variables that are good proxies for it. Among many different
genetic, socio-economic and environmental determinants of health, age is probably the most
important and also the most predictable one in the sense that younger people are on average
healthier than older people. Another quite important and predictable determinant of health is
probably wealth or income. Wealthier people are likely to lead healthier lifestyles and have
better access to medical care. These effects can accumulate and have more pronounced positive
effects on the health status of elderly people than on young people. The same can be probably
argued about the positive health effect of education.
Because our invoices data does not contain patients’ income (wealth) and education variables,
we are unable to explicitly match patients on these variables. This problem can be potentially
mitigated by the fact that we have matched patients on the eligibility category for compulsory
insurance (employment and occupation) which are under Croatian circumstances fairly good
proxies for both. After controlling for these factors, to the extent that there could be some left-
over uncontrolled unobservables influencing the patients’ latent health status, we argue that their
impact should be heterogeneous across different age groups.6 In particular, young patients in the
6 Recall from Chapter 2, section (c), that the three most important categories comprising the FREE group are (i) poor people, (ii) secondary school and college students and military draftees, and (iii) various categories of disabled people, war veterans and their families. When it comes to age distribution, the poor people are most likely predominantly older, whereas the second two groups are largely comprised of younger people, most of them ages
19

20-40 year cohort are generally quite healthy and any potential differentiated impacts of wealth
or education on their individual health status did not yet have a chance to materialize. Hence
young adults who are entitled to supplemental insurance for free (e.g. because of their full time
student status) should be equally healthy regardless of whether they attend college or not and as
such similar to their counterparts in (1-FREE) group. Obviously the same cannot be argued for
older cohorts. For them, any potential differentiated impacts of wealth or education on their
individual health status could have materialized and because the FREE group automatically
includes poor people it is reasonable to anticipate that in older age cohorts the unobserved
average heath status in the FREE group is likely to be worse than in the (1-FREE) group.
In order to identify the differential age effect on adverse selection and moral hazard, we examine
differences in the number of visits and the total cost for 20-30, 30-40, 40-50, 50-60, and over 60
age groups. When it comes to estimating the effect of moral hazard, the potential estimation bias
has two sources: the analytical bias (jam) which exists even in randomly selected groups and the
component due to the non-random assignment of groups. As it turns out, the moral hazard effect
is going to be slightly over-estimated for younger cohorts because the analytical bias
{ ]0[][ =− iii BhEhE }
will still be positive, but not as much as for the older cohorts where the
bias should be considerably larger (more positive). The estimation of adverse selection effect is
considerably cleaner because there is no analytical bias, only the effect coming from the
nonrandom assignment of groups. Since the unobserved health status in younger cohorts is
comparable between FREE and (1-FREE) groups, the adverse selection effect should be
estimated precisely. In older cohorts, however, the FREE group is likely to consist of people with
worse than average health and the residual (1-FREE) group will necessarily have better than
average health and, among them, people who decided to buy the insurance will have better health
then people who would decide to buy the insurance in a random group. As a result, our data
would underestimate the actual adverse selection effect in older cohorts.
18-40. The war veterans are the participants of the Croatian Independence war of 1990-1995 and hence still relatively young. Some of them are amputees (or with some other physical imparment) but most of them suffer from various forms and degrees of post-traumatic stress disorders, but are otherwise probably of similar health as the rest of the population in the same age group.
20

6. Results
The estimation results are presented in Table 6 for all eligibility categories and separately for
farmers in Table 7. We show one set of results for all age groups combined and also
disaggregated results for 5 different age groups. There are two variables of interest: the number
of visits and the total cost per patient which is expressed in the local currency – Croatian Kuna
(HRK). Each table has 3 panels of results, labeled as A, B and C, corresponding to the
comparisons of observed and counterfactual variables outlined in the estimation section. In each
of the 3 panels, the first column of numbers always represents the observed values (BOUGHT,
FREE, BOUGHT) and the second column presents the counterfactual values (NO, NO, FREE).
The third column represents the difference between the two (ATT). The remaining two columns
are the t-stats and the number of patients in BOUGHT, FREE, and BOUGHT for whom matches
are found from NO, NO, and FREE groups respectively. As mentioned before, matching is done
directly on age, sex and the eligibility category.
The results for all age cohorts combined show that the patients with supplemental insurance,
purchased or given for free, have more hospital visits and higher total cost than the ones with
compulsory insurance only. For example, during the period under consideration (4 months),
patients with BOUGHT insurance have on average 1.36 hospital visits more (45%) than patients
with NO insurance and patients with FREE insurance have on average 1.23 hospital visits more
than patients with NO insurance. There is also the difference in costs. Patients with BOUGHT
insurance spent 126 HRK more (42%) than patients with NO insurance and patients with FREE
insurance spent 114 HRK more than patients with NO insurance. The differences are statistically
significant at 1% level.
In addition to the estimated positive and significant moral hazard effect, the obtained results are
also consistent with the adverse selection story in the sense that the ATTs in panel A are larger
than the ATTs in panel B. For example, the difference in the average number of visits between
BOUGHT and NO is by 0.13 visits larger than the difference between FREE and NO. Given the
fact that the difference between FREE and NO should measure the effect of moral hazard, this
positive difference indicate the presence of adverse selection as a part of the difference between
BOUGHT and NO. The same effect is found when comparing estimated ATT in total cost. The
21

magnitude of the estimated adverse selection effect amounts to 12 HRK or about 10% of the total
estimated ATT between BOUGHT ad NO.
Next, let’s look at the results in panel C that gives us the ATT between BOUGHT and FREE
which measures the magnitude of adverse selection effect directly. For the total number of visits
the ATT is 0.24 which is somewhat larger than the indirectly measured adverse selection effect
of 0.13. For the total cost per patient the ATT amounts to 22 HRK, also somewhat larger than the
indirectly measured adverse selection effect of 12 HRK per patient.
Finally, the results for different age groups are especially interesting. When it comes to
estimating the effect of moral hazard (panel B) the results indicate the presence of positive and
statistically significant moral hazard effect. Same as on the aggregate data level, this is true for
all age cohorts. In accordance with what have been said before, we believe that these effects have
been somewhat over-estimated, less so for the younger cohorts and more for the older cohorts.
For the youngest cohort of 20-30 years of age, the pure moral hazard effect amounts to 49%
increase in the number of visits per patient and 44% increase in total cost. When it comes to
estimating the effect of adverse selection, the results obtained on the aggregate data level do not
hold for all age groups. Based on the indirect measurements (comparing panels A and B), for the
age groups 20-30 and 50-60, the adverse selection effect is negative, i.e. we detect the presence
of the so called favorable selection Based on the direct measurement of adverse selection (panel
C) we found the presence of favorable selection effect for the group of patients in the 20-30 age
cohort, but not in the 50-60 age cohort. In line with our earlier discussion, we believe that the
adverse selection effect in younger cohorts has been measured precisely whereas in older cohorts
it could have been underestimated. Consequently, the detected favorable selection effect in 50-60
age cohort is likely to be a erroneous.
The statistically significant favorable selection effect for the youngest age cohort of patients (20-
30 years) is robust to the estimation approach and the variables by which the effect is measured.
The comparison of the results in panels A and B shows that the estimated ATT in the case of
FREE vs. NO (panel B) is smaller than the estimated ATT in the case of BOUGHT vs. NO
(panel A) for both the number of visits and the total cost per patient. These results are also
22
confirmed in the direct estimation of adverse (favorable) selection effect in panel C where the
estimated ATTs for both the number of visits and the cost per patient are negative. Patients who
bought the supplemental insurance are visiting the hospital less frequently and spend less money
than patients who obtained the supplemental insurance free of charge. Although somewhat
unexpected, the results are not that unusual and can be easily rationalized.7 The 20-30 year old
cohort who bought the insurance is dominated by people who completed education entirely after
the collapse of socialism and are likely to be more employable than older cohorts. At the same
time, these young people are used to the lack of job security and the uncertainties of free
enterprise markets and are likely to be more risk averse than their parents and hence more likely
to purchase the insurance. 8 The reversal of the selection result from favorable selection to
adverse selection in the older cohorts is interesting yet quite plausible as well. An individual that
is currently 40 years old was 20 when socialist Yugoslavia collapsed. These and especially older
people were used to socialized medicine where health care access was completely free for all,
and therefore they are very sensitive to out-of-pocket payments for access to health care.
Consequently, those with somewhat or significantly impaired health will typically choose to buy
the supplemental insurance.
Finally, in Table 7 we present the measurements of the moral hazard and adverse selection
effects for farmers. The procedure for controlling potentially confounding influences of wealth
and education on the unobserved health status of farmers by looking at matching results for
different age cohorts did not produce satisfactory results mainly because of the small sample size.
First of all, the fact that there are almost no young generation farmers in Croatia, the results for
20-30 age cohort are not presented because of the insufficient number of matches found between
various insurance categories (there are only 3 patients in this group). The situation is only
marginally better for the 30-40 cohort with only about 20+ matches found. For the older cohorts,
with sufficient number of matches found, the results are qualitatively similar to the results for the
7 See also Finkelstein and McGarry (2006), Fang, Keane and Silverman (2008), and also Zheng and Zimmer (2008) in case of U.S. farmers. 8 Note that heterogeneity in risk preferences is not neccessary to obtain the advantageous selection result. In fact, as shown by Fang, Keane and Silverman (2008) who were able to analyze various sources of advantageous selection in the Medigap insurance market, risk preferences do not appear to be its main source. Instead, they suggest that cognitive ability plays a prominent role. Our data does not allow us to empirically investigate the importance of various sources of favorable selection, but our story could have been equally convincingly told by resorting to superior cognitive ability of the younger generation rather than their higher risk aversion.
23
rest of the population. However, the fact that farmers are generally more homogeneous when it
comes to income and education than the rest of the population renders this approach less
important for identification. In other words, the measured effects at the aggregate level for the
population of farmers should be more reliable than the corresponding set of results for the entire
population. Hence, we are fairly comfortable using the aggregate results.
So what do the aggregate results show? Compared to the rest of the population, the effects of
asymmetric information problems (both adverse selection and moral hazard) seem to be less
pronounced with farmers. However, the results still indicate positive and significant moral
hazard and adverse selection effects and the adverse selection story is confirmed by both
measurement approaches. As a matter of fact the sum of the ATTs in panel B and C almost
perfectly matches the ATT in panel A for both the number of visits and the total cost per patient.
If we want to decompose the total increase in health care consumption due to having
supplemental insurance relative to having only the compulsory insurance expressed in the
number of hospital visits per patient (35%), the pure adverse selection effect amounts to only 3%
where the rest of 32% is attributable to pure moral hazard effect. If we want to decompose the
total asymmetric information effect expressed in the total cost per patient (38%), the pure
adverse selection effect accounts for 4% and the remaining 34% is the pure moral hazard effect.
7. Robustness Checks
As explained in our identification section, the main difference between an ideal experimental
setting and the actual institution we need to model is the fact that our FREE group is assembled
based on some pre-determined set of criteria. Regarding the composition of the FREE group, our
central concern is that our identification strategy would fail if the patients whose characteristics
that significantly impact their unobserved health status or consumption of health services are
very different from their matched patients in the other two groups.
Going back to the list of people that have the right to free supplemental insurance in section 2 (c),
an obvious such category are the handicapped people. Because the BOUGHT and NO groups of
patients do not contain severely disabled people, the disabled patients in the FREE group could
not be properly matched. This is the rationale for excluding them from the comparison with other
24
two groups. The disabled people entitled to free supplemental insurance are either war veterans
or civilians. As mentioned briefly before, virtually all Croatian war veterans are the participants
of the Croatian Independence war of 1990-1995 and hence still relatively young. Due to the fact
that some of them acquired the status of invalids (disabled) based on the various forms and
degrees of post-traumatic stress disorders, but are otherwise probably of similar health as the rest
of the population in the same age group, one can argue that they should not be excluded from the
analysis. Since we don’t have the information on the nature and the gravity of the disablements,
we decided to exclude all disabled people (but not their family members) regardless of whether
their handicap is war related or not and regardless of the degree of disablement. Among 4,626
patients in our data set for top eight hospital services (see Table 5) that are entitled to FREE
supplemental insurance, these exclusions eliminate 674 patients.
The results are presented in Table 8a. Same as before, we present the results for all ages groups
combined and for 5 age cohorts separately. Several results stand out and are worth discussing.
First, the presence of statistically significant favorable selection effect for the youngest age
cohort of patients (20-30 years) was confirmed for both the number of visits and the total cost
per patient. Second, the net effect of moral hazard, as measured by the difference between FREE
and NO is somewhat smaller with the truncated FREE group than with the entire FREE group for
all ages combined and, separately, for the two oldest cohorts. This result is expected because of
the elimination of the some of the supposedly heavy users from the FREE group. However, the
difference is surprisingly small. For all age cohorts combined it amounts to only 0.04 visits or 3
HRK per patient (3% reduction). Finally, the effect of decreased moral hazard has been offset by
the increase in the adverse selection as measured by the difference between BOUGHT and FREE
groups. However, the increase in adverse selection is substantially larger than the decrease in
moral hazard, such that the difference between directly measured (the sum of panel B and C
ATTs) and indirectly measured (the ATTs in panel A) total asymmetric information effect (sum
of moral hazard and adverse selection) increases relative to the estimation with non-truncated
FREE group. All these results are in line with our conjectures about the possible biases
introduced by the non-random assignment of groups.
25

The second problem associated with the design of the FREE group is the income census criterion
for obtaining the free supplemental insurance. There are two categories of people eligible for free
supplemental insurance under this criterion: (i) people whose per capita household monthly
income is below 1516.32 HRK and (ii) single retired individuals with income below 1939.39
HRK. By the nature of the program design these poor people cannot be found in any of the other
two groups (BOUGHT or NO) so it would have been impossible to find their matches based on
income if we had the income variable in our dataset. So, to the extent that income matters, either
for the unobserved health status or for the actual consumption of the health services, it is
reasonable to exclude these people from the analysis. However, the problem is that these
established eligibility thresholds do not represents some meaningful breaks in the income
distribution. Based on the fact that for 80% of the population in Croatia the per capita income
falls within 1 standard deviation around the mean, it is very likely that there are a lot of people in
BOUGHT and NO groups whose income is only going to be negligibly higher than in the FREE
group, yet still not sufficiently low for them to qualify for the free supplemental insurance.9 For
all practical purposes the purchasing powers, consumption patterns, lifestyles, etc. for the people
on either side of this income threshold are likely to be indistinguishable.
To somehow address this problem we kept all single retired people and all multi-person
household members in the FREE group except for self-employed individuals. This approach is
predicated on a conjecture that if there are any meaningful differences between poor people and
the rest of the population they have to be captured in the category of self-employed individuals
where the new class of private entrepreneurs and successful businessmen should be found. Hence,
this particular truncation of the FREE group includes all disabled patients as in Table 8a plus all
self-employed individuals whose per capita household monthly income is below 1516.32 HRK.
The matching estimators for all patients with such truncated FREE group are presented in Table
8b. What we see is that the results are very similar to the results presented in Table 8a. The
favorable selection effect for the youngest cohort is still there, the directly measured adverse
selection effect (panel C) is somewhat smaller and the directly measured moral hazard effect 9 Our estimates based on the 2008 Croatian Household Budget Survey point to a relatively tight income distribution. The ratio of top 10 to bottom 10 percentiles of total income per capita distribution for the entire population is 3.9. The top 10 percentile is about two times higher than the median and the bottom 10 percentile is about a half of the median income. Similar findings for income distribution in 2002 and 2004 are presented in World Bank (2006).
26
(panel B) is somewhat larger than in Table 8a. Overall, the result based on income census and
handicap truncation (Table 8b) are actually closer to the results without any truncation of the
FREE group (Table 6) than the results based on handicap truncation alone (Table 8a).
8. Conclusions
Using a unique data set of hospital invoices from a regional hospital in Croatia and relying on the
methodology of matching estimators we were able to separately estimate the effect of adverse
selection and moral hazard in the consumption of medical services related to non-life-threatening
diagnoses. Our estimates show that, on average for the population of patients above the age of 18,
the total distortion due to asymmetric information problems amounts to an increase in total
number of visits per patient during a four-month period by about 45%. There is also a
statistically significant increase in the total cost per patient by about 42%. The procedure for
estimating the moral hazard and the adverse selection effects separately and then summing them
up indicates somewhat larger total distortions. The directly measured net effect of adverse
selection amounts to 8% more visits per patient and about 7.5% higher total cost. The directly
measured moral hazard effect amounts to 45% increase in hospital visits and about 42% increase
in total cost per patient.
Due to the potential confounding effect of income and education that we cannot directly account
for, we also estimated the set of models for different age cohorts and argued that our results are
highly reliable for young cohorts (20-40 years of age) and potentially less so for older cohorts.
The rationale for adopting this approach comes from the fact that young people are generally
considered quite healthy and any potential differentiated impacts of wealth or education on their
individual health status did not yet have a chance to materialize. Using this approach, we found
the presence of positive and statistically significant moral hazard effect. For the youngest cohort
of 20-30 years of age, the pure moral hazard effect amounts to 49% increase in the number of
visits per patient and 44% increase in total cost. Second, for the youngest age cohort of patients
(20-30 years) we found the presence of statistically significant favorable selection effect. Patients
who bought the supplemental insurance are visiting the hospital less frequently and spend less
money than patients who obtained the supplemental insurance free of charge. Interestingly
enough, the selection effect reverses its sign in the next age cohort (30-40) from favorable to
27
adverse selection. Although somewhat unusual, the results make perfect sense in light of the fact
that Croatia is a transition economy where the old socialist/communist system collapsed 20 years
ago. The youngest adult cohort of its population with its entire life experience shaped under the
volatilities and uncertainties of market driven economic system is likely to be more risk averse
than their parents and hence would tend to buy health insurance even when their health status is
perceived to be rather good. Because old habits die hard, older generations used to job security
and free health care under the old system tend to be sensitive to paying anything for access to
health care and therefore would tend to buy the supplemental insurance only if they anticipate to
use it extensively.
To further neutralize the problems associated with non-random composition of various insurance
groups and to establish more credence for the aggregate and older cohorts results, we performed
a couple of robustness checks. In particular we purged the FREE group from disabled patients
and self-employed patients with income below the poverty line. Our previously obtained results
generally survived. Minor differences relative to the main results seem to be indicating that the
moral hazard effect is in fact somewhat smaller and the adverse selection effect larger then
previously estimated. These effects are especially important for two oldest cohorts.
In addition to the general population we also looked at the behavior of farmers. The fact that
farmers are generally more homogeneous when it comes to income and education than the rest of
the population makes the measured effects at the aggregate level more reliable than the
corresponding set of results for the entire population. Compared to the rest of the population, the
effects of asymmetric information problems (both adverse selection and moral hazard) seem to
be somewhat less pronounced in this segment of the population. The decomposition of the 35%
total increase in hospital visits per patient farmer caused by the supplemental insurance can be
decomposed into the pure adverse selection effect of 3% and pure moral hazard effect of 32%.
Based on the obtained results, it is very likely that the effect of moral hazard dominates the
adverse selection effect in the Croatian state-administered supplemental health insurance plan,
which has certain important policy consequences and lead to some obvious recommendations.
Given that adverse selection appears to be generally small, the improvements in the health care
28
system should focus on curbing the moral hazard side of the problem by introducing a universal
system of co-payments. This proposal has two prongs: (a) the current system of wide exceptions
from paying co-payments needs to be abolished or significantly trimmed, and (b) the co-payment
rates have to be widely applied to the majority of health services and need to be increased to the
point where they begin to effectively “bite”. Estimating the elasticity of demand for various
health services with respect to co-payments could be a topic of an interesting future research.
29
References
Abadie, A., Imbens, G.(2006). “Large Sample Properties of Matching Estimators for Average
Treatment Effects.” Econometrica 74 (1), 235–267.
Barros P.P., M. Machado, and A. Sanz-de-Galdeano (2008). “Moral Hazard and the Demand for
Health Services: A Matching Estimator Approach.” Journal of Health Economics, 27 (4):1006-
1025.
Cameron, A.C., P.K. Trivedi, F. Milne and J. Piggott (1998). “A Microeconometric Model of the
Demand for Health Care and Health Insurance in Australia.” Revue of Economic Studies 1: 85-
106.
Chiappori, P.-A., B. Jullien, B. Salanie, and F. Salanie (2006). “Asymmetric Information in
Insurance: General Testable Implications.” Rand Journal of Economics 37 (Winter): 783-798.
Coulson, N.E., J.V. Terza, C.A. Neslusan and S. Bruce (1995). “Estimating the Moral-Hazard
Effect of Supplemental Medical Insurance in the Demand for prescription Drugs by the Elderly.”
American Economic Review 85 (2), Papers and Proceedings, 122-126.
Dehejia, R., and S. Wahba (2002). “Propensity Score-Matching Methods for Non-experimental
Causal Studies”. The Review of Economics and Statistics 84(1): 151–161.
Fang, H., M.P. Keane, and D. Silverman (2008). “Sources of Advantageous Selection: Evidence
from the Medigap Insurance Market.” Journal of Political Economy 116(2): 303-350.
Finkelstein, A., and K. McGarry (2006). “Multiple Dimensions of Private Information: Evidence
from the Long-Term Care Insurance Market.” American Economic Review 96:938–58.
Heckman, J., H. Ichimura, and P. Todd (1998). “Matching as an Econometric Evaluation
Estimator.” Review of Economic Studies 65(2): 261-294.
30
Holly, A., G. Lucien, D. Gianfranco and B. Brigitte (1998). “An Econometric Model of Health
Care Utilization and Health Insurance in Switzerland.” European Economic Review 42: 513-522.
Rosenbaum, P., and D. Rubin (1983). “The Central Role of the Propensity Score in
Observational Studies for Causal Effects.” Biometrika 70: 41-55.
Rothschild, M. and J. Stiglitz (1976). “Equilibrium in Competitive Insurance Markets: An essay
on the Economics of Imperfect Information.” Quarterly Journal of Economics 90 (November):
629-649.
Savage, E. and D.J. Wright (2003). “Moral Hazard and Adverse Selection in Australian Private
Hospitals: 1989-1990.” Journal of Health Economics 22: 331-359.
Vera-Hernandez, A.M. (1999). “Duplicate Coverage and Demand for Health Care. The Case of
Catalonia.” Health Economics 8: 579-598.
Voncina L., N. Jemiai, S. Merkur, C. Golna, A. Maeda, S. Chao, A. Dzakula (2008). “Croatia: Health System Review.” Health Systems in Transition 8(7): 1–108.
Vukina, T. and D. Nestic. (2008). “Asymmetric Information in Health Insurance: Some
Preliminary Evidence from the Croatian State-Administered Supplemental Plan.” Privredna
kretanja i ekonomska politika 115: 25-47.
World Bank (2006). “Croatia Living Standard Assessment: Promoting Social Inclusion and Regional Equity”, Report No. 37992. Washington D.C.: The World Bank.
World Bank (2008). “Croatia: Restructuring Public Finance to Sustain Growth and Improve Public Services”, Report No. 37321-HR. Washington D.C.: The World Bank.
Zheng, X. and Zimmer (2008). “Farmers’ Health Insurance and Access to Health Care.”
American Journal of Agricultural Economics 90(1): 267-279.
31
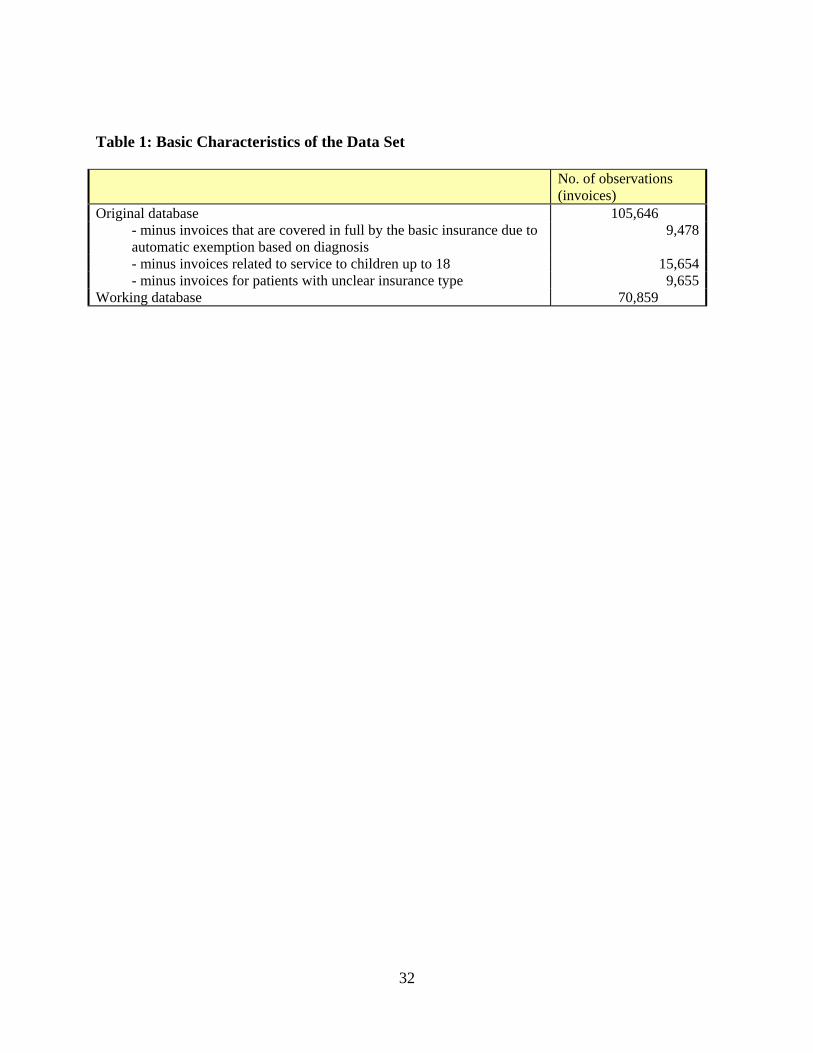
Table 1: Basic Characteristics of the Data Set No. of observations
(invoices) Original database 105,646
- minus invoices that are covered in full by the basic insurance due to automatic exemption based on diagnosis
9,478
- minus invoices related to service to children up to 18 15,654- minus invoices for patients with unclear insurance type 9,655
Working database 70,859
32
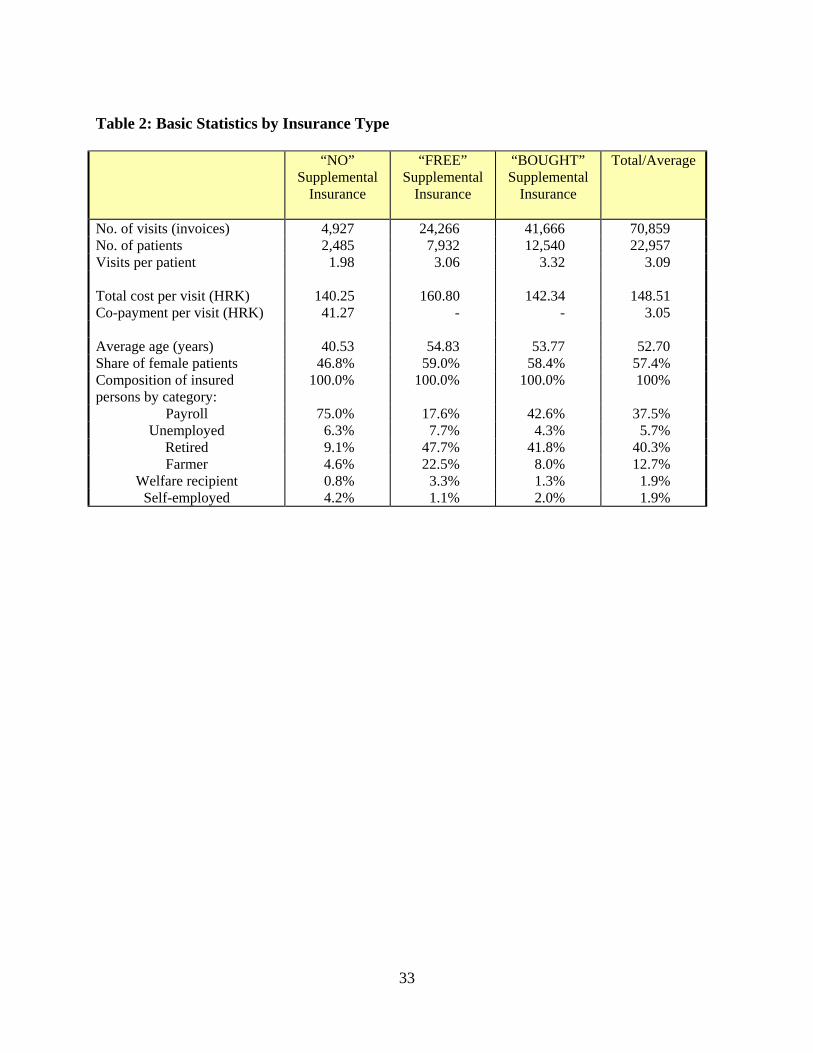
Table 2: Basic Statistics by Insurance Type
“NO” Supplemental
Insurance
“FREE” Supplemental
Insurance
“BOUGHT” Supplemental
Insurance
Total/Average
No. of visits (invoices) 4,927 24,266 41,666 70,859 No. of patients 2,485 7,932 12,540 22,957 Visits per patient 1.98 3.06 3.32 3.09 Total cost per visit (HRK) 140.25 160.80 142.34 148.51 Co-payment per visit (HRK) 41.27 - - 3.05 Average age (years) 40.53 54.83 53.77 52.70 Share of female patients 46.8% 59.0% 58.4% 57.4% Composition of insured persons by category:
100.0% 100.0% 100.0% 100%
Payroll 75.0% 17.6% 42.6% 37.5% Unemployed 6.3% 7.7% 4.3% 5.7%
Retired 9.1% 47.7% 41.8% 40.3% Farmer 4.6% 22.5% 8.0% 12.7%
Welfare recipient 0.8% 3.3% 1.3% 1.9% Self-employed 4.2% 1.1% 2.0% 1.9%
33
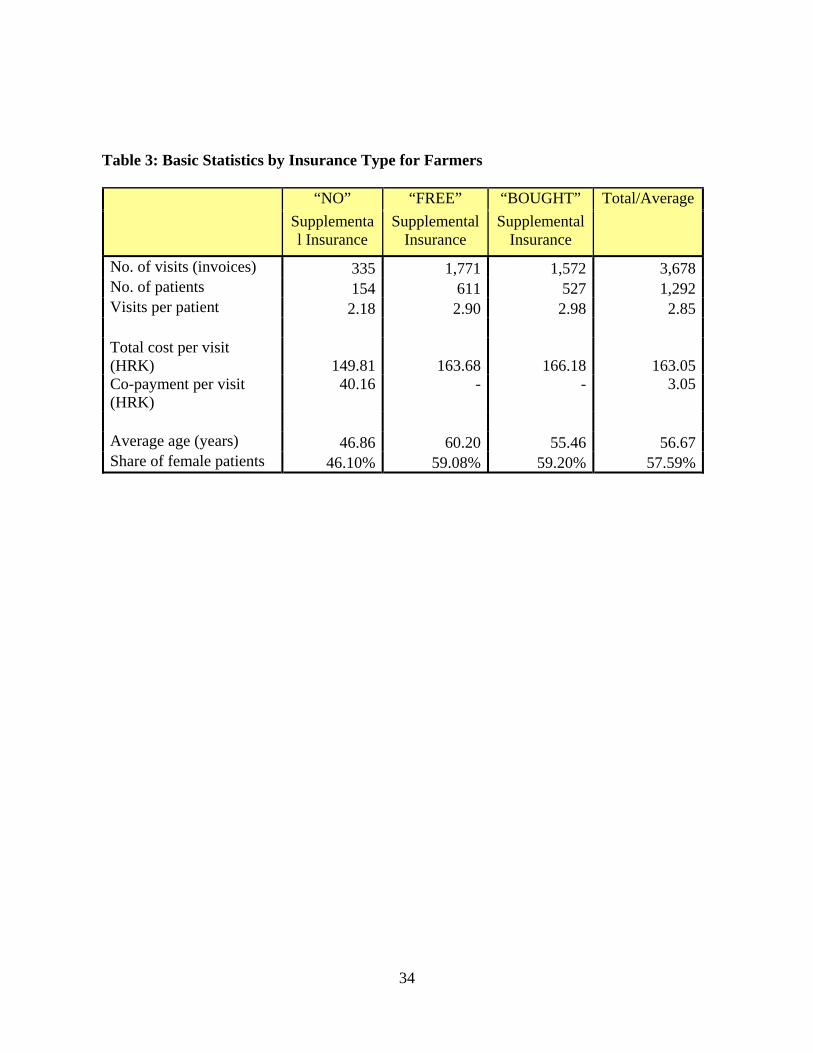
Table 3: Basic Statistics by Insurance Type for Farmers
“NO” “FREE” “BOUGHT” Total/Average Supplemental Insurance
Supplemental Insurance
Supplemental Insurance
No. of visits (invoices) 335 1,771 1,572 3,678No. of patients 154 611 527 1,292Visits per patient 2.18 2.90 2.98 2.85 Total cost per visit (HRK) 149.81 163.68 166.18 163.05Co-payment per visit (HRK)
40.16 - - 3.05
Average age (years) 46.86 60.20 55.46 56.67Share of female patients 46.10% 59.08% 59.20% 57.59%
34
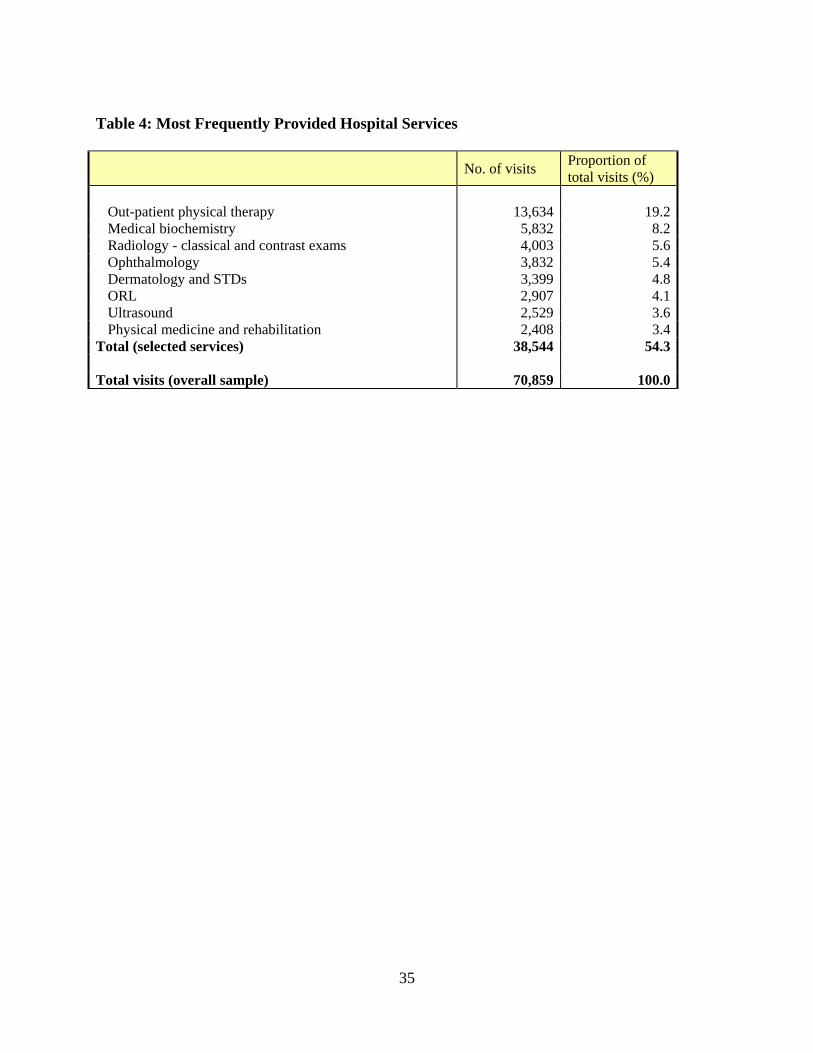
Table 4: Most Frequently Provided Hospital Services
No. of visits Proportion of total visits (%)
Out-patient physical therapy 13,634 19.2Medical biochemistry 5,832 8.2Radiology - classical and contrast exams 4,003 5.6Ophthalmology 3,832 5.4Dermatology and STDs 3,399 4.8ORL 2,907 4.1Ultrasound 2,529 3.6Physical medicine and rehabilitation 2,408 3.4
Total (selected services) 38,544 54.3 Total visits (overall sample) 70,859 100.0
35
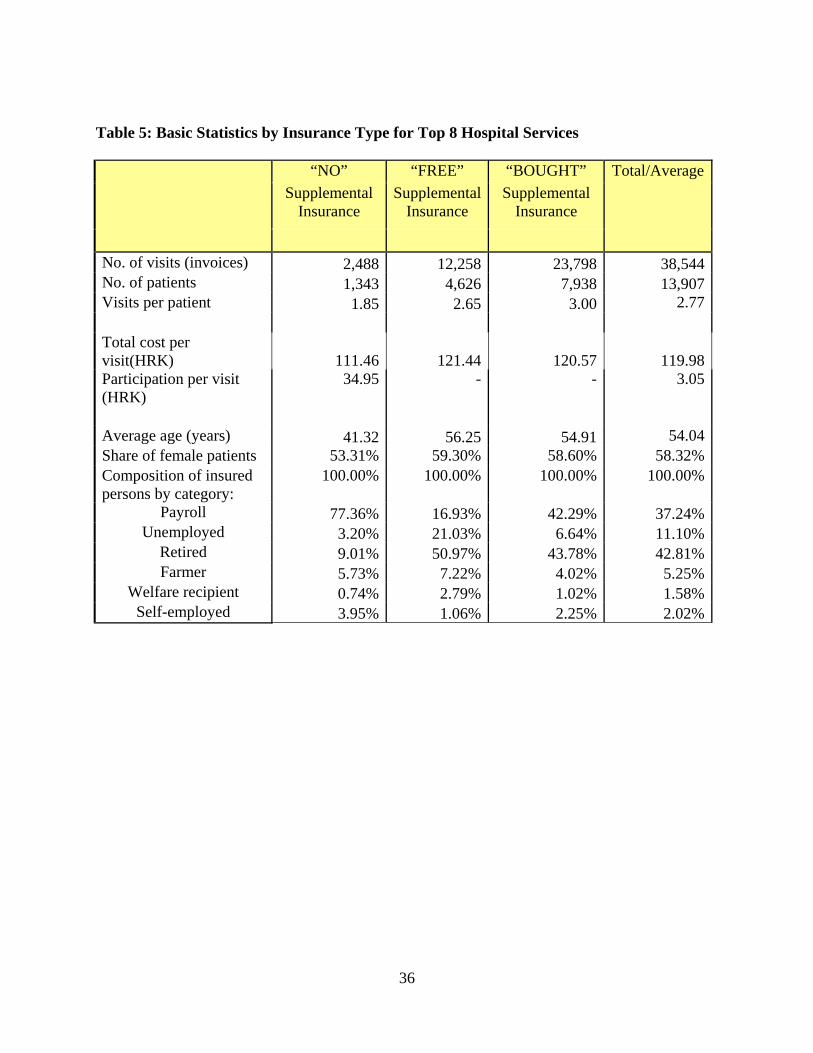
36
Table 5: Basic Statistics by Insurance Type for Top 8 Hospital Services
“NO” “FREE” “BOUGHT” Total/Average Supplemental
Insurance Supplemental
Insurance Supplemental
Insurance
No. of visits (invoices) 2,488 12,258 23,798 38,544No. of patients 1,343 4,626 7,938 13,907Visits per patient 1.85 2.65 3.00 2.77 Total cost per visit(HRK) 111.46 121.44 120.57 119.98Participation per visit (HRK)
34.95 - - 3.05
Average age (years) 41.32 56.25 54.91 54.04Share of female patients 53.31% 59.30% 58.60% 58.32%Composition of insured persons by category:
100.00% 100.00% 100.00% 100.00%
Payroll 77.36% 16.93% 42.29% 37.24%Unemployed 3.20% 21.03% 6.64% 11.10%
Retired 9.01% 50.97% 43.78% 42.81%Farmer 5.73% 7.22% 4.02% 5.25%
Welfare recipient 0.74% 2.79% 1.02% 1.58%Self-employed 3.95% 1.06% 2.25% 2.02%
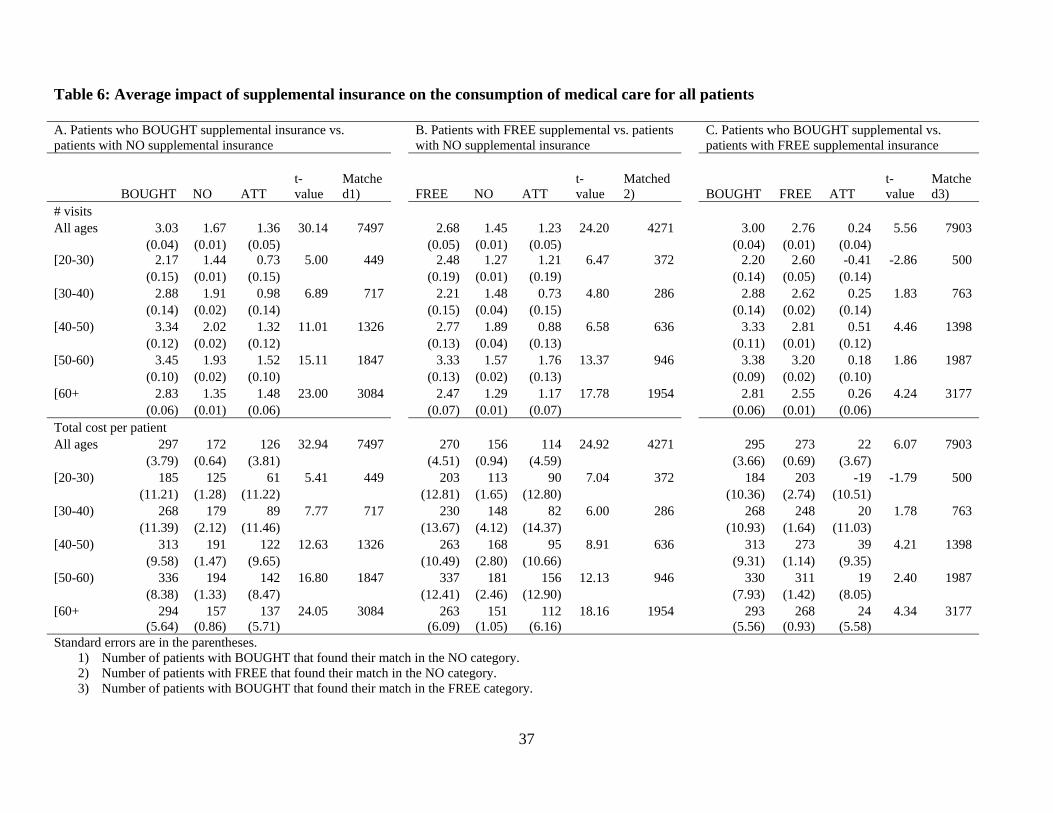
37
Table 6: Average impact of supplemental insurance on the consumption of medical care for all patients A. Patients who BOUGHT supplemental insurance vs. patients with NO supplemental insurance
B. Patients with FREE supplemental vs. patients with NO supplemental insurance
C. Patients who BOUGHT supplemental vs. patients with FREE supplemental insurance
BOUGHT NO ATT t-value
Matched1) FREE NO ATT
t-value
Matched2) BOUGHT FREE ATT
t-value
Matched3)
# visits All ages 3.03 1.67 1.36 30.14 7497 2.68 1.45 1.23 24.20 4271 3.00 2.76 0.24 5.56 7903 (0.04) (0.01) (0.05) (0.05) (0.01) (0.05) (0.04) (0.01) (0.04) [20-30) 2.17 1.44 0.73 5.00 449 2.48 1.27 1.21 6.47 372 2.20 2.60 -0.41 -2.86 500 (0.15) (0.01) (0.15) (0.19) (0.01) (0.19) (0.14) (0.05) (0.14) [30-40) 2.88 1.91 0.98 6.89 717 2.21 1.48 0.73 4.80 286 2.88 2.62 0.25 1.83 763 (0.14) (0.02) (0.14) (0.15) (0.04) (0.15) (0.14) (0.02) (0.14) [40-50) 3.34 2.02 1.32 11.01 1326 2.77 1.89 0.88 6.58 636 3.33 2.81 0.51 4.46 1398 (0.12) (0.02) (0.12) (0.13) (0.04) (0.13) (0.11) (0.01) (0.12) [50-60) 3.45 1.93 1.52 15.11 1847 3.33 1.57 1.76 13.37 946 3.38 3.20 0.18 1.86 1987 (0.10) (0.02) (0.10) (0.13) (0.02) (0.13) (0.09) (0.02) (0.10) [60+ 2.83 1.35 1.48 23.00 3084 2.47 1.29 1.17 17.78 1954 2.81 2.55 0.26 4.24 3177 (0.06) (0.01) (0.06) (0.07) (0.01) (0.07) (0.06) (0.01) (0.06) Total cost per patient All ages 297 172 126 32.94 7497 270 156 114 24.92 4271 295 273 22 6.07 7903 (3.79) (0.64) (3.81) (4.51) (0.94) (4.59) (3.66) (0.69) (3.67) [20-30) 185 125 61 5.41 449 203 113 90 7.04 372 184 203 -19 -1.79 500 (11.21) (1.28) (11.22) (12.81) (1.65) (12.80) (10.36) (2.74) (10.51) [30-40) 268 179 89 7.77 717 230 148 82 6.00 286 268 248 20 1.78 763 (11.39) (2.12) (11.46) (13.67) (4.12) (14.37) (10.93) (1.64) (11.03) [40-50) 313 191 122 12.63 1326 263 168 95 8.91 636 313 273 39 4.21 1398 (9.58) (1.47) (9.65) (10.49) (2.80) (10.66) (9.31) (1.14) (9.35) [50-60) 336 194 142 16.80 1847 337 181 156 12.13 946 330 311 19 2.40 1987 (8.38) (1.33) (8.47) (12.41) (2.46) (12.90) (7.93) (1.42) (8.05) [60+ 294 157 137 24.05 3084 263 151 112 18.16 1954 293 268 24 4.34 3177 (5.64) (0.86) (5.71) (6.09) (1.05) (6.16) (5.56) (0.93) (5.58) Standard errors are in the parentheses.
1) Number of patients with BOUGHT that found their match in the NO category. 2) Number of patients with FREE that found their match in the NO category. 3) Number of patients with BOUGHT that found their match in the FREE category.

38
Table 7: Average impact of supplemental insurance on the consumption of medical care for farmers A. Patients who BOUGHT supplemental insurance vs. patients with NO supplemental insurance
B. Patients with FREE supplemental vs. patients with NO supplemental insurance
C. Patients who BOUGHT supplemental vs. patients with FREE supplemental insurance
BOUGHT NO ATT t-value
Matched 1) FREE NO ATT
t-value
Matched 2) BOUGHT FREE ATT
t-value
Matched3)
# visits All ages 2.80 1.82 0.98 4.17 279 2.66 1.81 0.84 4.72 258 2.68 2.60 0.08 0.39 315 (0.23) (0.06) (0.24) (0.17) (0.06) (0.18) (0.20) (0.05) (0.21) [20-30) 2.00 1.17 0.83 5.00 3 1.00 1.00 0.00 . 1 2.00 1.00 1.00 . 2 (0.00) (0.17) (0.17) . . . (0.00) (0.00) (0.00) [30-40) 2.23 2.51 -0.28 -0.54 26 1.61 1.65 -0.04 -0.16 23 1.96 1.58 0.38 1.25 25 (0.39) (0.35) (0.52) (0.17) (0.18) (0.28) (0.30) (0.08) (0.31) [40-50) 2.90 1.97 0.93 1.30 63 2.79 2.16 0.63 1.67 58 2.90 2.78 0.12 0.18 63 (0.69) (0.14) (0.71) (0.38) (0.15) (0.38) (0.69) (0.09) (0.69) [50-60) 2.87 1.56 1.31 4.20 120 3.07 1.65 1.42 4.73 118 2.87 3.21 -0.34 -1.09 120 (0.31) (0.06) (0.31) (0.29) (0.07) (0.30) (0.31) (0.05) (0.31) [60+ 2.88 1.91 0.96 2.38 66 2.16 1.90 0.26 0.85 56 2.54 2.09 0.45 1.58 104 (0.42) (0.12) (0.41) (0.27) (0.13) (0.30) (0.28) (0.07) (0.29) Total cost per patient All ages 295 182 113 5.32 279 274 180 94 5.60 258 280 268 12 0.64 315 (20.9) (3.59) (21.23) (16.67) (3.38) (16.76) (18.78) (4.41) (18.96) [20-30) 164 71 93 1.28 3 20 59 -39 . 1 83 72 11 0.30 2 (81.76) (9.32) (72.94) (19.92) (17.32) (37.24) [30-40) 238 195 43 1.03 26 215 164 50 1.12 23 217 199 18 0.53 25 (38.5) (18.6) (41.6) (39.4) (13.1) (44.95) (33.54) (13.23) (33.71) [40-50) 284 185 99 1.52 63 246 188 58 1.93 58 284 251 32 0.50 63 (63.9) (6.46) (64.8) (31.3) (6.80) (30.26) (63.92) (6.91) (64.47) [50-60) 306 185 122 4.45 120 318 188 130 5.00 118 306 330 -24 -0.85 120 (27.44) (2.74) (27.4) (25.7) (2.88) (26.03) (27.44) (4.58) (27.75) [60+ 317 177 140 3.59 66 245 167 78 1.95 56 267 227 40 1.53 104 (37.5) (10.2) (39.0) (39.2) (10.6) (39.89) (25.93) (6.50) (26.24) Standard errors are in the parentheses. No results are presented for the age group of 20-30 due to its small sample size.
1) Number of patients with BOUGHT that found their match in the NO category. 2) Number of patients with FREE that found their match in the NO category.
3) Number of patients with BOUGHT that found their match in the FREE category.

39
Table 8a: Average impact of supplemental insurance on the consumption of medical care for all patients with truncated FREE group (disabled) A. Patients who BOUGHT Supplemental insurance B. Patients with FREE supplemental vs. patients C. Patients who BOUGHT supplemental vs. Vs. patients with NO insurance with NO supplemental insurance patients with FREE supplemental insurance
BOUGHT NO ATT t-value Matched-1) FREE NO ATT
t-value
Matched 2)
BOUGHT FREE ATT t-value
Matched 3)
# visits All ages 3.03 1.67 1.36 30.14 7,496 2.61 1.42 1.19 22.44 3,660 3.00 2.65 0.35 8.03 7,889 (0.04) (0.01) (0.05) (0.05) (0.01) (0.05) (0.04) (0.01) (0.04) [20-30) 2.17 1.44 0.73 5.00 449 2.46 1.27 1.19 6.37 356 2.20 2.51 -0.31 -2.20 499 (0.15) (0.01) (0.15) (0.19) (0.01) (0.19) (0.14) (0.04) (0.14) [30-40) 2.88 1.90 0.98 6.90 717 2.23 1.49 0.74 4.68 270 2.89 2.66 0.23 1.63 759 (0.14) (0.02) (0.14) (0.16) (0.04) (0.16) (0.14) (0.03) (0.14) [40-50) 3.34 2.02 1.32 11.01 1,326 2.77 1.76 1.00 6.75 525 3.33 2.82 0.50 4.38 1,398 (0.12) (0.02) (0.12) (0.15) (0.04) (0.15) (0.11) (0.02) (0.12) [50-60) 3.45 1.93 1.52 15.10 1,847 3.28 1.55 1.72 12.30 786 3.38 2.93 0.45 4.66 1,987 (0.10) (0.02) (0.10) (0.14) (0.03) (0.14) (0.09) (0.02) (0.10) [60+ 2.83 1.35 1.48 22.99 3,083 2.37 1.28 1.09 15.93 1,646 2.80 2.44 0.36 5.78 3,168 (0.06) (0.01) (0.06) (0.07) (0.01) (0.07) (0.06) (0.01) (0.06) Total cost per patient All ages 297 172 126 32.93 7496 264 154 111 22.75 3,660 295 263 32 8.63 7,889 (3.79) (0.64) (3.81) (4.77) (1.01) (4.87) (3.67) (0.68) (3.69) [20-30) 185 125 61 5.41 449 203 113 90 6.86 356 184 203 -19 -1.82 499 (11.21) (1.28) (11.22) (13.19) (1.71) (13.17) (10.38) (2.67) (10.54) [30-40) 268 178 89 7.78 717 230 149 81 5.60 270 268 243 25 2.22 759 (11.39) (2.12) (11.45) (13.77) (4.11) (14.53) (10.98) (1.59) (11.06) [40-50) 313 191 122 12.63 1326 265 163 101 8.59 525 313 273 40 4.26 1398 (9.58) (1.47) (9.65) (11.59 (3.03) (11.80) (9.31) (1.22) (9.36) [50-60) 336 194 142 16.79 1847 334 179 155 10.92 786 330 293 37 4.57 1987 (8.38) (1.32) (8.47) (13.55) (2.77) (14.18) (7.93) (1.65) (8.13) [60+ 294 157 137 24.03 3083 254 150 104 16.17 1,646 292 257 36 6.35 3,168 (5.64) (0.86) (5.71) (6.37) (1.12) (6.45) (5.56) (0.83) (5.59) Standard errors are in parentheses. 1) Number of patients with BOUGHT that found their match in the NO category. 2) Number of patients with FREE that found their match in the NO category. 3) Number of patients with BOUGHT that found their match in the FREE category.
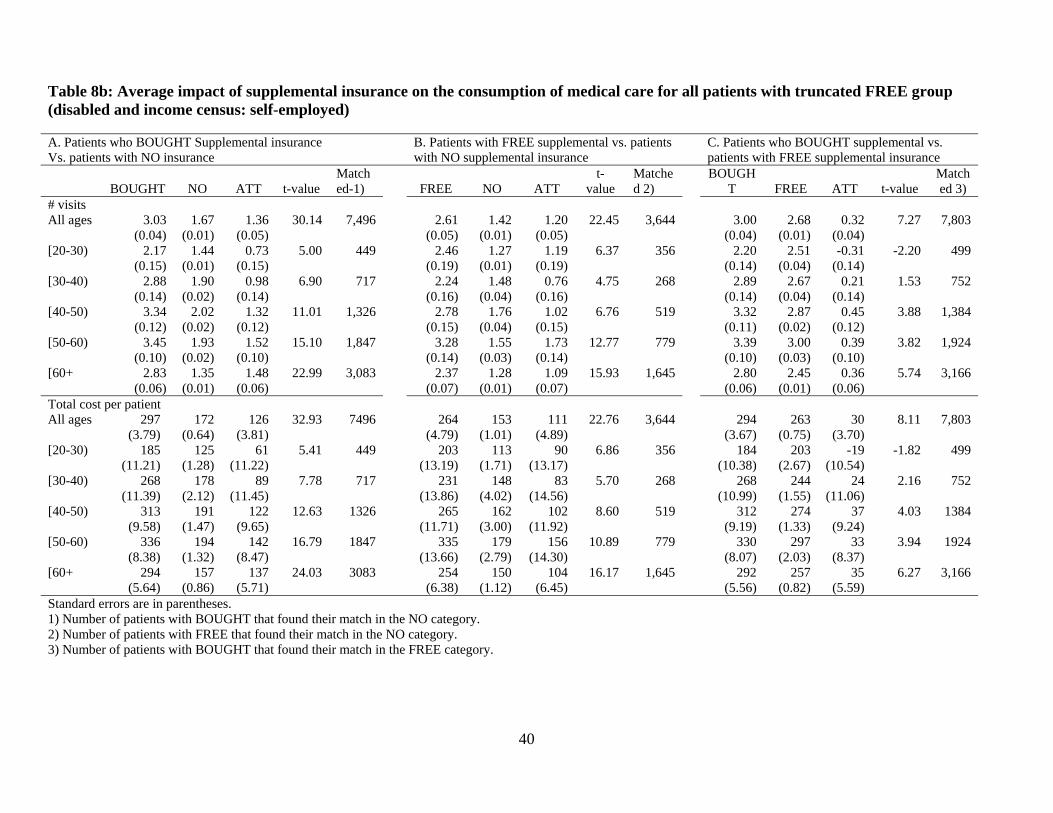
40
Table 8b: Average impact of supplemental insurance on the consumption of medical care for all patients with truncated FREE group (disabled and income census: self-employed) A. Patients who BOUGHT Supplemental insurance B. Patients with FREE supplemental vs. patients C. Patients who BOUGHT supplemental vs. Vs. patients with NO insurance with NO supplemental insurance patients with FREE supplemental insurance
BOUGHT NO ATT t-value Matched-1) FREE NO ATT
t-value
Matched 2)
BOUGHT FREE ATT t-value
Matched 3)
# visits All ages 3.03 1.67 1.36 30.14 7,496 2.61 1.42 1.20 22.45 3,644 3.00 2.68 0.32 7.27 7,803 (0.04) (0.01) (0.05) (0.05) (0.01) (0.05) (0.04) (0.01) (0.04) [20-30) 2.17 1.44 0.73 5.00 449 2.46 1.27 1.19 6.37 356 2.20 2.51 -0.31 -2.20 499 (0.15) (0.01) (0.15) (0.19) (0.01) (0.19) (0.14) (0.04) (0.14) [30-40) 2.88 1.90 0.98 6.90 717 2.24 1.48 0.76 4.75 268 2.89 2.67 0.21 1.53 752 (0.14) (0.02) (0.14) (0.16) (0.04) (0.16) (0.14) (0.04) (0.14) [40-50) 3.34 2.02 1.32 11.01 1,326 2.78 1.76 1.02 6.76 519 3.32 2.87 0.45 3.88 1,384 (0.12) (0.02) (0.12) (0.15) (0.04) (0.15) (0.11) (0.02) (0.12) [50-60) 3.45 1.93 1.52 15.10 1,847 3.28 1.55 1.73 12.77 779 3.39 3.00 0.39 3.82 1,924 (0.10) (0.02) (0.10) (0.14) (0.03) (0.14) (0.10) (0.03) (0.10) [60+ 2.83 1.35 1.48 22.99 3,083 2.37 1.28 1.09 15.93 1,645 2.80 2.45 0.36 5.74 3,166 (0.06) (0.01) (0.06) (0.07) (0.01) (0.07) (0.06) (0.01) (0.06) Total cost per patient All ages 297 172 126 32.93 7496 264 153 111 22.76 3,644 294 263 30 8.11 7,803 (3.79) (0.64) (3.81) (4.79) (1.01) (4.89) (3.67) (0.75) (3.70) [20-30) 185 125 61 5.41 449 203 113 90 6.86 356 184 203 -19 -1.82 499 (11.21) (1.28) (11.22) (13.19) (1.71) (13.17) (10.38) (2.67) (10.54) [30-40) 268 178 89 7.78 717 231 148 83 5.70 268 268 244 24 2.16 752 (11.39) (2.12) (11.45) (13.86) (4.02) (14.56) (10.99) (1.55) (11.06) [40-50) 313 191 122 12.63 1326 265 162 102 8.60 519 312 274 37 4.03 1384 (9.58) (1.47) (9.65) (11.71) (3.00) (11.92) (9.19) (1.33) (9.24) [50-60) 336 194 142 16.79 1847 335 179 156 10.89 779 330 297 33 3.94 1924 (8.38) (1.32) (8.47) (13.66) (2.79) (14.30) (8.07) (2.03) (8.37) [60+ 294 157 137 24.03 3083 254 150 104 16.17 1,645 292 257 35 6.27 3,166 (5.64) (0.86) (5.71) (6.38) (1.12) (6.45) (5.56) (0.82) (5.59) Standard errors are in parentheses. 1) Number of patients with BOUGHT that found their match in the NO category. 2) Number of patients with FREE that found their match in the NO category. 3) Number of patients with BOUGHT that found their match in the FREE category.


![Joseçh Stiglitz &rew Weiss · this problem were by Stiglitz (19751 Riley [1977,1979), Rothschild and Stiglits (1976] and Wilson (l977j. In the Stiglite and Riley papers uninformed](https://img.pdfslide.us/doc/110x75/5ed00288fbcce83357125ef2/joseh-stiglitz-rew-weiss-this-problem-were-by-stiglitz-19751-riley-19771979.jpg)