Embed Size (px)
Citation preview
1
Estimates of the Enclosed Mass and its Distribution
for several Spiral Galaxies
Geoffrey M. Williams
email: [email protected]
Abstract
Recently, high quality rotation curves for several spiral galaxies have become
available from THINGS: The HI Nearby Galaxy Survey (Reference 1). This paper
analyzes 15 of those galaxy rotation curves using the Newtonian Disk Model
(Reference 2). The Model assumes that virtually all the mass of stars, gas, dust
and dark-matter is contained as a “flattened” mass within the galactic disk, which
extends out to the edge of the observable rotation. Estimates of the enclosed
mass and its radial distribution are provided.
Introduction
The high quality HI rotation curves from THINGS (Reference 1) span a wide range
of spiral galaxy type, mass, and basic characteristics. These galaxies have been
extensively analyzed in Reference 1, using the traditional separate mass
components of stellar disk, stellar nuclear bulge, HI gas disk and an assumed
spheroidal dark-matter halo. These component velocities are added in
quadrature to match the rotation curve velocities.
In contrast to the traditional approach, this paper utilizes the Newtonian disk
model described in Reference 2. This model assumes that virtually all the galaxy
mass is contained within a flattened disk; that includes the stellar disk, stellar
2
nuclear bulge, gas disk and dark-matter components. There is no spheroidal dark-
matter halo in this model. By adjusting the 12 ring masses, the model is able to
produce a rotation curve that matches the individual rotation curve from the
THINGS galaxy data. It is then possible to calculate the enclosed galaxy mass,
display its radial distribution, and calculate the surface mass density and disk
radius of gyration.
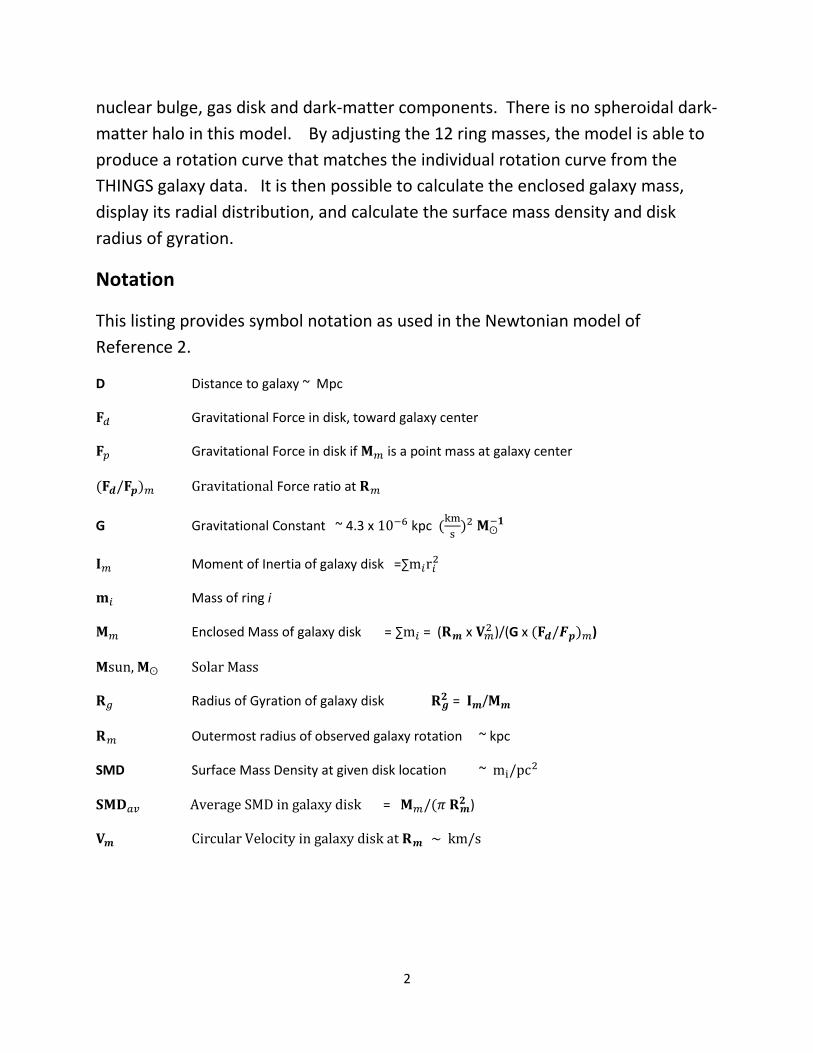
Notation
This listing provides symbol notation as used in the Newtonian model of
Reference 2.
D Distance to galaxy ~ Mpc
Gravitational Force in disk, toward galaxy center
Gravitational Force in disk if is a point mass at galaxy center
Gravitational Force ratio at
G Gravitational Constant ~ 4.3 x kpc
Moment of Inertia of galaxy disk =∑
Mass of ring i
Enclosed Mass of galaxy disk = ∑ = ( x )/(G x )
Msun, Solar Mass
Radius of Gyration of galaxy disk = /
Outermost radius of observed galaxy rotation ~ kpc
SMD Surface Mass Density at given disk location ~
Average SMD in galaxy disk = )
Circular Velocity in galaxy disk at ~ km/s
3
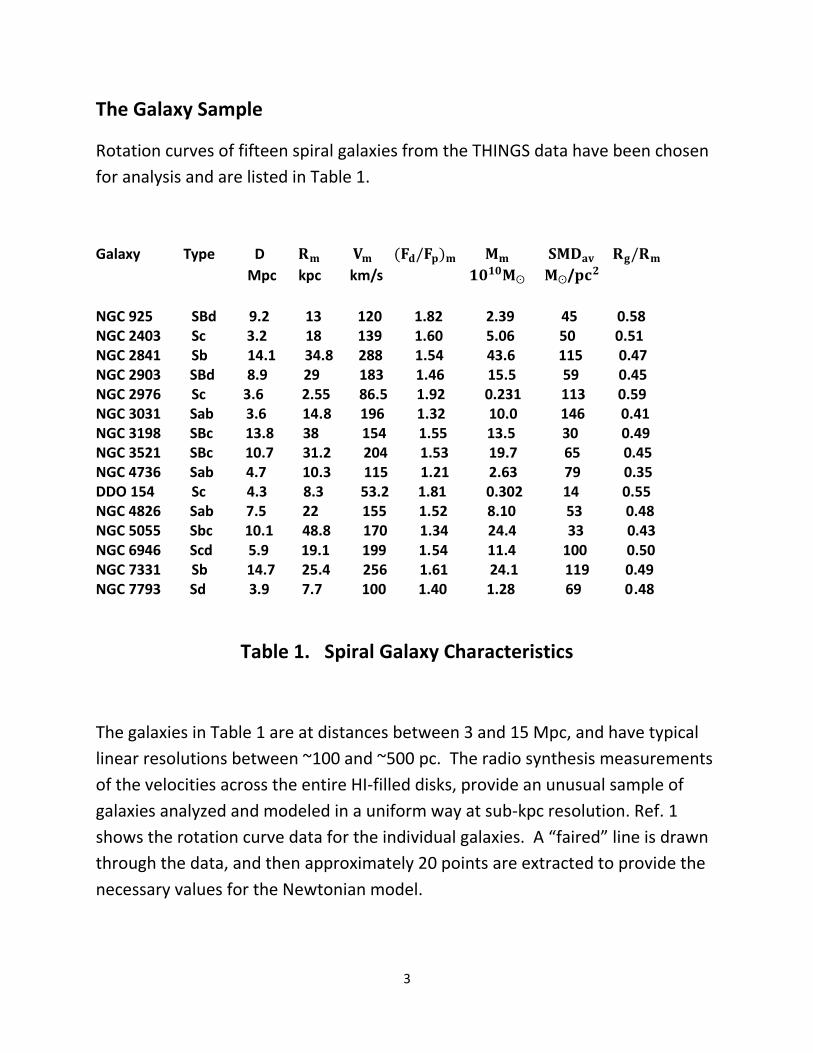
The Galaxy Sample
Rotation curves of fifteen spiral galaxies from the THINGS data have been chosen
for analysis and are listed in Table 1.
Galaxy Type D 𝐝 𝐩 𝐚𝐯 𝐠
Mpc kpc km/s 𝟎 𝟎 /𝐩𝐜
NGC 925 SBd 9.2 13 120 1.82 2.39 45 0.58 NGC 2403 Sc 3.2 18 139 1.60 5.06 50 0.51 NGC 2841 Sb 14.1 34.8 288 1.54 43.6 115 0.47 NGC 2903 SBd 8.9 29 183 1.46 15.5 59 0.45 NGC 2976 Sc 3.6 2.55 86.5 1.92 0.231 113 0.59 NGC 3031 Sab 3.6 14.8 196 1.32 10.0 146 0.41 NGC 3198 SBc 13.8 38 154 1.55 13.5 30 0.49 NGC 3521 SBc 10.7 31.2 204 1.53 19.7 65 0.45 NGC 4736 Sab 4.7 10.3 115 1.21 2.63 79 0.35 DDO 154 Sc 4.3 8.3 53.2 1.81 0.302 14 0.55 NGC 4826 Sab 7.5 22 155 1.52 8.10 53 0.48 NGC 5055 Sbc 10.1 48.8 170 1.34 24.4 33 0.43 NGC 6946 Scd 5.9 19.1 199 1.54 11.4 100 0.50 NGC 7331 Sb 14.7 25.4 256 1.61 24.1 119 0.49 NGC 7793 Sd 3.9 7.7 100 1.40 1.28 69 0.48
Table 1. Spiral Galaxy Characteristics
The galaxies in Table 1 are at distances between 3 and 15 Mpc, and have typical
linear resolutions between ~100 and ~500 pc. The radio synthesis measurements
of the velocities across the entire HI-filled disks, provide an unusual sample of
galaxies analyzed and modeled in a uniform way at sub-kpc resolution. Ref. 1
shows the rotation curve data for the individual galaxies. A “faired” line is drawn
through the data, and then approximately 20 points are extracted to provide the
necessary values for the Newtonian model.
4
The individual masses of the fifteen spiral galaxies cover a wide range from 2.3 to
440 billion solar masses. The maximum circular velocity is about 320 km/s (for
NGC 2841) , while the average circular velocity (Vm) at the disk rim (Rm) is 160
km/s for these fifteen galaxies.
The average Surface Mass Density (SMDav) for this set of galaxies spans a wide
range from 14 to 146 / (In the solar neighborhood of the Galaxy, the SMD
is estimated at 75
The gyration ratio (Rg/Rm) of this set of galaxies spans a limited range between
0.35 and 0.59, with most values clustered around the mean of 0.48
For each of the galaxies in Table 1, Figures 1 through 15 shows the estimated
galaxy mass and its radial distribution. These Figures have been grouped
together to provide easy cross-reference and comparison. The upper chart for
each galaxy shows the rotation curve extracted from THINGS data (Reference 1)
as a solid-black curve. The dashed-red curve shows how well the Newtonian
model matches the galaxy data. This upper chart also notes the estimated galaxy
mass, and the distance D associated with the galaxy disk radial dimensions. The
galaxy mass varies directly with the disk size, Rm, and therefore varies directly
with the assumed distance D. When comparing results of this paper with other
studies, it is necessary to adjust values based on the assumed distance in those
studies.
The lower chart for each galaxy model shows the radial distribution of the Ring
Masses that produce the model rotation curve. Also included in the lower chart
is the Rg/Rm gyration ratio of the mass distribution.
Discussion
Reviewing Figures 1 through 15, it can be seen that the model achieves a
reasonable match with the galaxy rotation curves. With only 12 ring masses, the
current model does not match all the minor undulations in some of the observed
rotation curves. Given the approximations involved in defining the observed
5
rotation curves, the current model is considered to provide satisfactory rotation
curve matching.
The ring mass distribution for the individual galaxies and the Rg/Rm ratios show
that the galaxy mass is well dispersed radially in the galaxy disk. (This dispersion is
in marked contrast with the solar system, where over 99% of the system mass is
contained within the sun, and the system gyration radius lies deep below the
surface of the sun.)
Most of these galaxies have relatively straightforward rotation curves and many
have been the subject of earlier analyses, as noted in Reference 1. However,
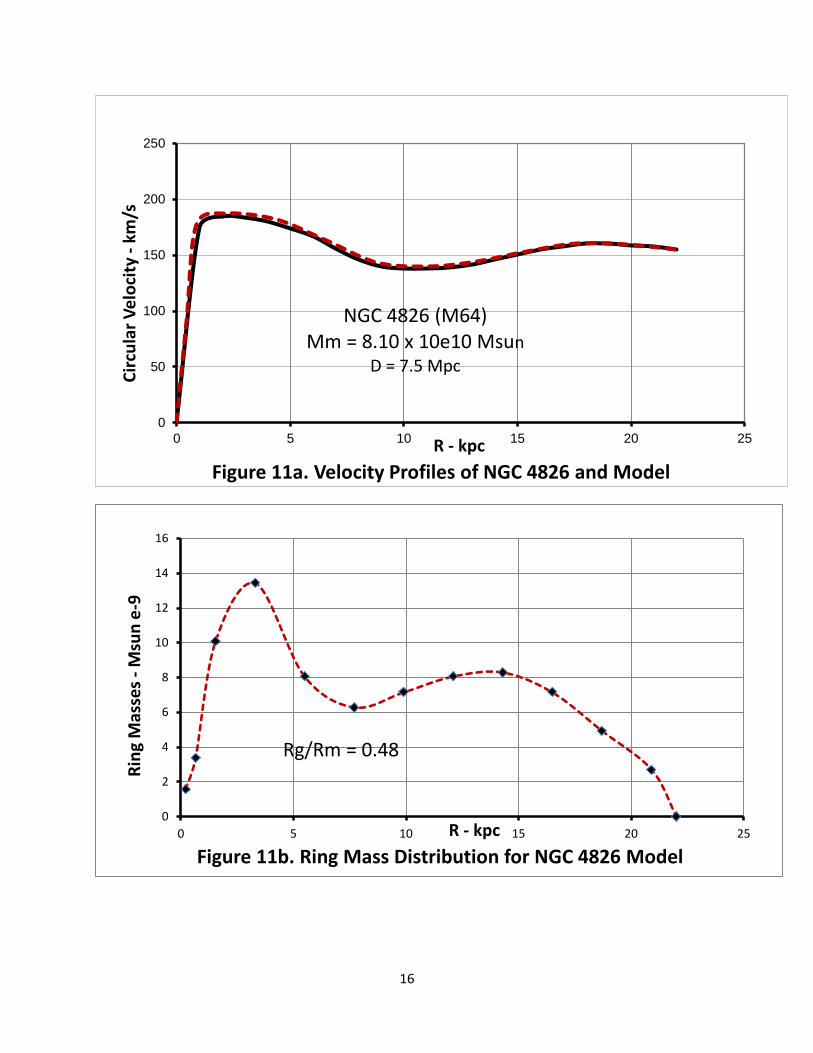
NGC 4826 has the unusual feature that HI gas in the outer disk rotates in the
opposite direction to the HI gas in the inner disk. This feature is considered
evidence of a collision and merging of two galaxies millions of years ago. There is
a transition phase (4 kpc<R<12 kpc) in the rotation curve between the inner and
outer disks, which shows some confused and non-circular motions. It is difficult
to define the rotation curve in this transition phase, so the model estimates of
galaxy mass for NGC 4826 should be regarded as tentative only.
6
0
20
40
60
80
100
120
140
0 2 4 6 8 10 12 14
Cir
cula
r V
elo
city
- k
m/s
R - kpc
Figure 1a. Velocity Profiles for NGC 925 and Model
NGC 925 Mm = 2.39 x 10e10 Msun
D = 9.2 Mpc
0
0.5
1
1.5
2
2.5
3
3.5
0 2 4 6 8 10 12 14
Rin
g M
asse
s -
Msu
n e
-9
R - kpc
Figure 1b. Ring Mass Distribution for NGC 925 Model
Rg/Rm = 0.58
7
0
20
40
60
80
100
120
140
160
0 2 4 6 8 10 12 14 16 18 20
Cir
cula
r V
elo
city
- k
m/s
R - kpc
Figure 2a. Velocity Profiles of NGC 2403 and Model
NGC 2403 Mm = 5.06 x 10e10 Msun
D = 3.2 Mpc
0
1
2
3
4
5
6
7
8
0 2 4 6 8 10 12 14 16 18 20
Rin
g M
asse
s -
Msu
n e
-9
R - kpc Figure 2b. Ring Mass Distribution for NGC 2403 Model
Rg/Rm = 0.51
8
0
50
100
150
200
250
300
350
0 5 10 15 20 25 30 35 40
Cir
cula
r V
elo
city
- k
m/s
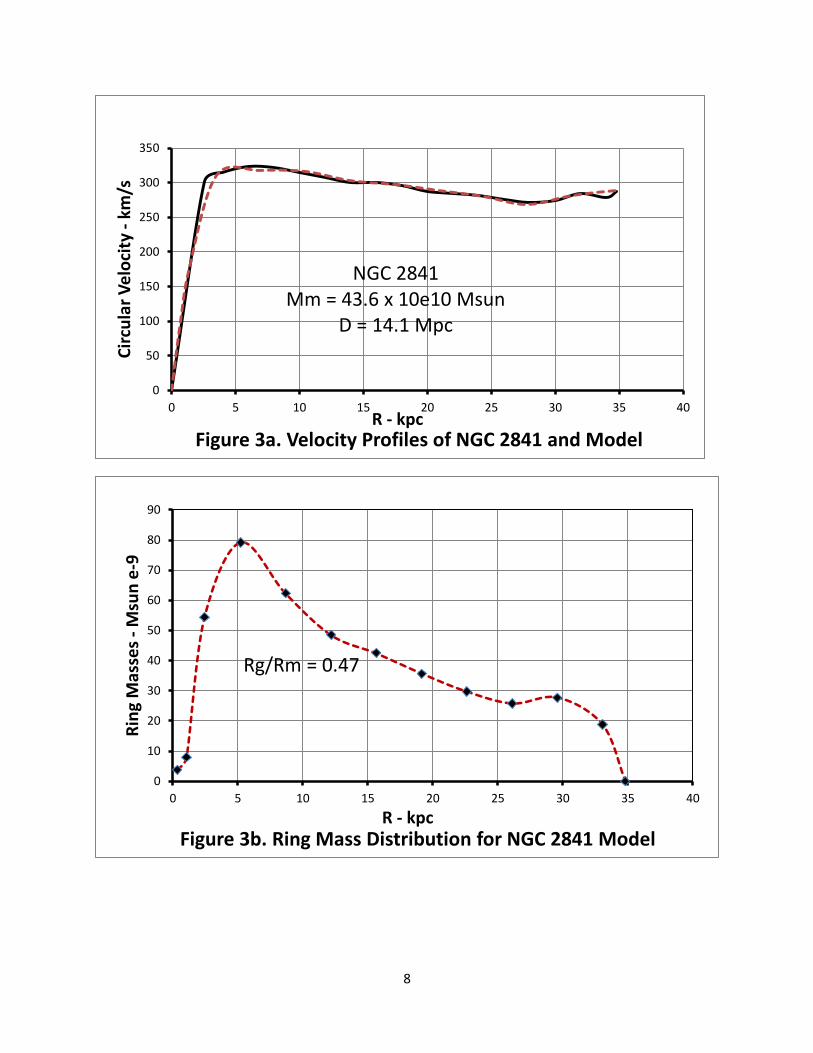
R - kpc Figure 3a. Velocity Profiles of NGC 2841 and Model
NGC 2841 Mm = 43.6 x 10e10 Msun
D = 14.1 Mpc
0
10
20
30
40
50
60
70
80
90
0 5 10 15 20 25 30 35 40
Rin
g M
asse
s -
Msu
n e
-9
R - kpc Figure 3b. Ring Mass Distribution for NGC 2841 Model
Rg/Rm = 0.47
9
0
50
100
150
200
250
0 5 10 15 20 25 30 35
Cir
cula
r V
elo
city
- k
m/s
R - kpc
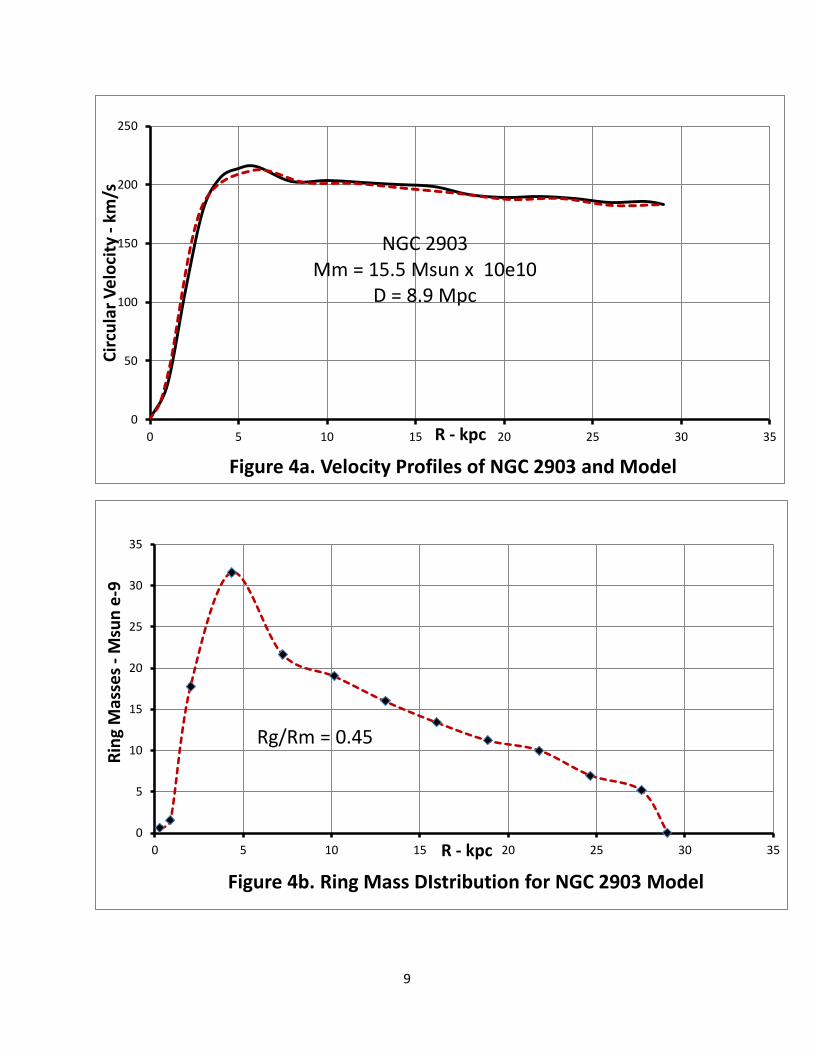
Figure 4a. Velocity Profiles of NGC 2903 and Model
NGC 2903 Mm = 15.5 Msun x 10e10
D = 8.9 Mpc
0
5
10
15
20
25
30
35
0 5 10 15 20 25 30 35
Rin
g M
asse
s -
Msu
n e
-9
R - kpc
Figure 4b. Ring Mass DIstribution for NGC 2903 Model
Rg/Rm = 0.45
10
0
10
20
30
40
50
60
70
80
90
100
0 0.5 1 1.5 2 2.5 3
Cir
cula
r V
elo
city
- k
m/s
R - kpc
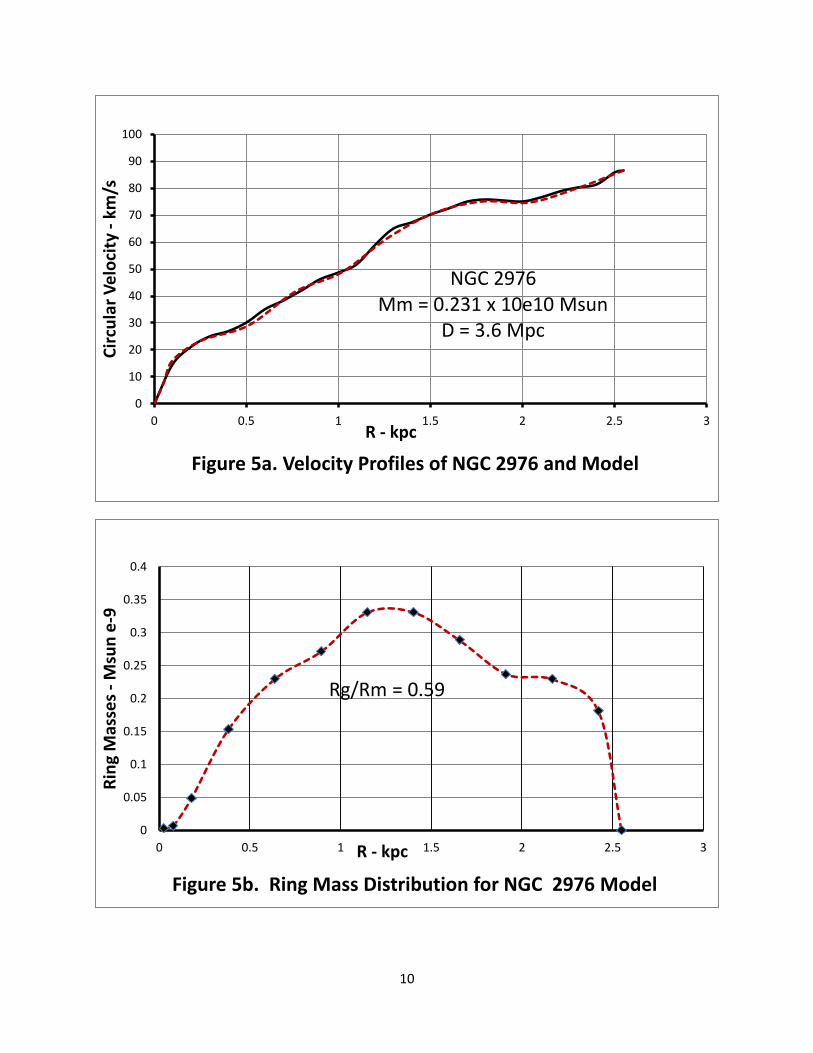
Figure 5a. Velocity Profiles of NGC 2976 and Model
NGC 2976 Mm = 0.231 x 10e10 Msun
D = 3.6 Mpc
0
0.05
0.1
0.15
0.2
0.25
0.3
0.35
0.4
0 0.5 1 1.5 2 2.5 3
Rin
g M
asse
s -
Msu
n e
-9
R - kpc
Figure 5b. Ring Mass Distribution for NGC 2976 Model
Rg/Rm = 0.59
11
0
50
100
150
200
250
300
0 2 4 6 8 10 12 14 16
Cir
cula
r V
elo
city
- k
m/s
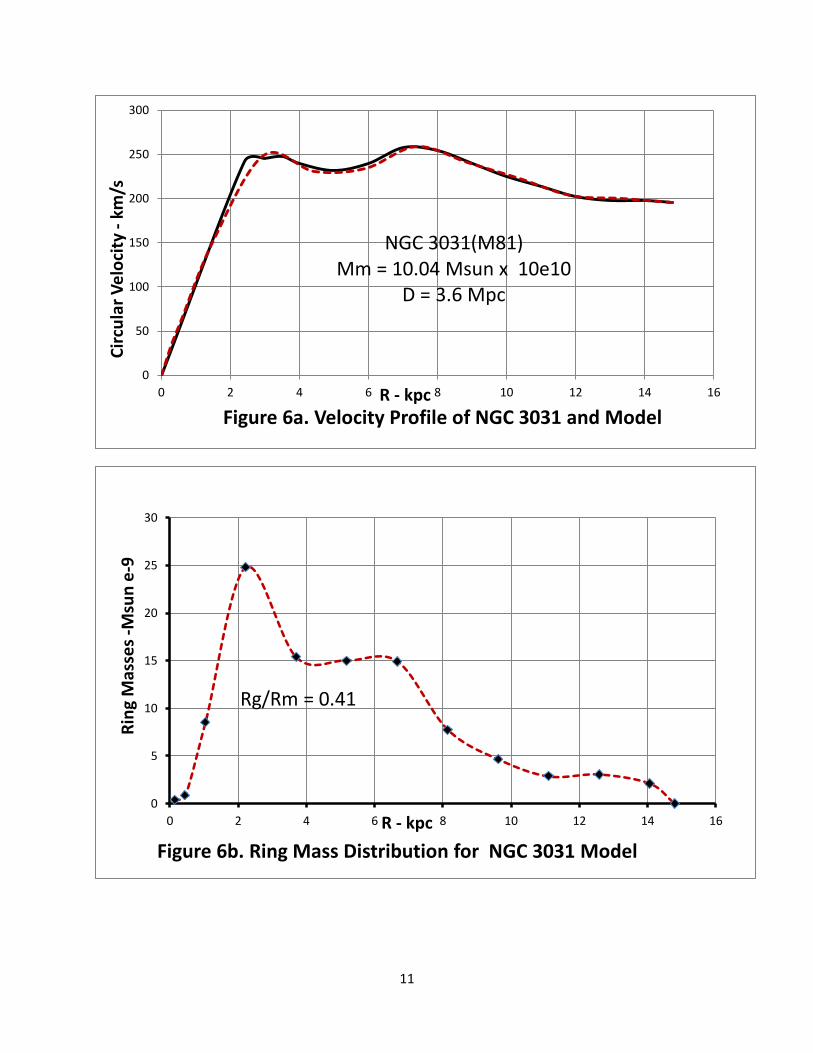
R - kpc Figure 6a. Velocity Profile of NGC 3031 and Model
NGC 3031(M81) Mm = 10.04 Msun x 10e10
D = 3.6 Mpc
0
5
10
15
20
25
30
0 2 4 6 8 10 12 14 16
Rin
g M
asse
s -M
sun
e-9
R - kpc
Figure 6b. Ring Mass Distribution for NGC 3031 Model
Rg/Rm = 0.41
12
0
20
40
60
80
100
120
140
160
180
0 5 10 15 20 25 30 35 40
Cir
cula
r V
elo
city
- k
m/s
R - kpc
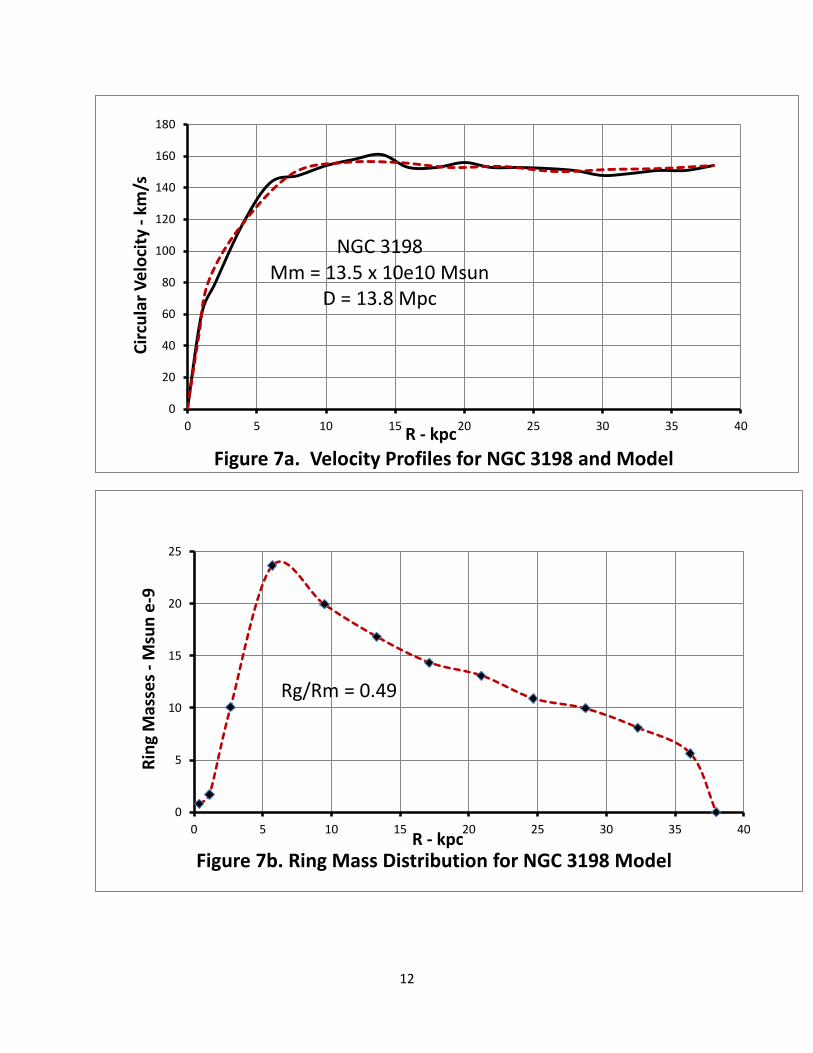
Figure 7a. Velocity Profiles for NGC 3198 and Model
NGC 3198 Mm = 13.5 x 10e10 Msun
D = 13.8 Mpc
0
5
10
15
20
25
0 5 10 15 20 25 30 35 40
Rin
g M
asse
s -
Msu
n e
-9
R - kpc Figure 7b. Ring Mass Distribution for NGC 3198 Model
Rg/Rm = 0.49
13
0
50
100
150
200
250
0 5 10 15 20 25 30 35
Cir
cula
r V
elo
city
- k
m/s
R - kpc
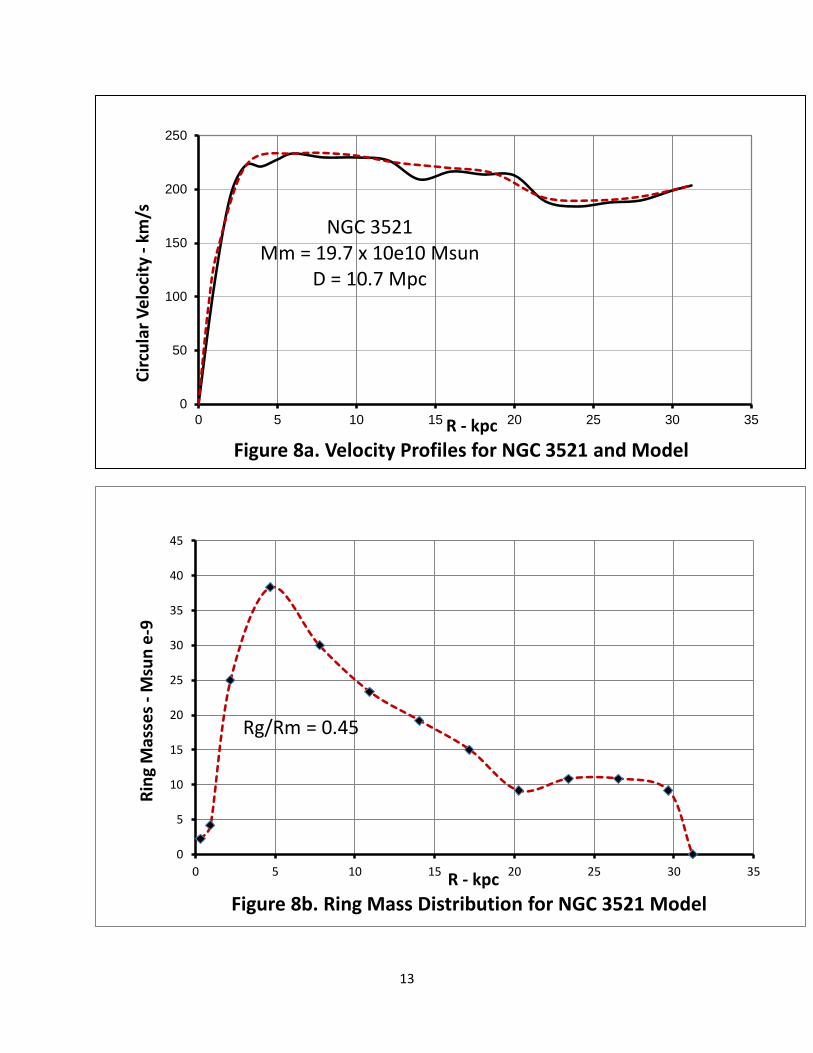
Figure 8a. Velocity Profiles for NGC 3521 and Model
NGC 3521 Mm = 19.7 x 10e10 Msun
D = 10.7 Mpc
0
5
10
15
20
25
30
35
40
45
0 5 10 15 20 25 30 35
Rin
g M
asse
s -
Msu
n e
-9
R - kpc
Figure 8b. Ring Mass Distribution for NGC 3521 Model
Rg/Rm = 0.45
14
0
50
100
150
200
250
0 2 4 6 8 10 12
Cir
cula
r V
elo
city
- k
m/s
R - kpc
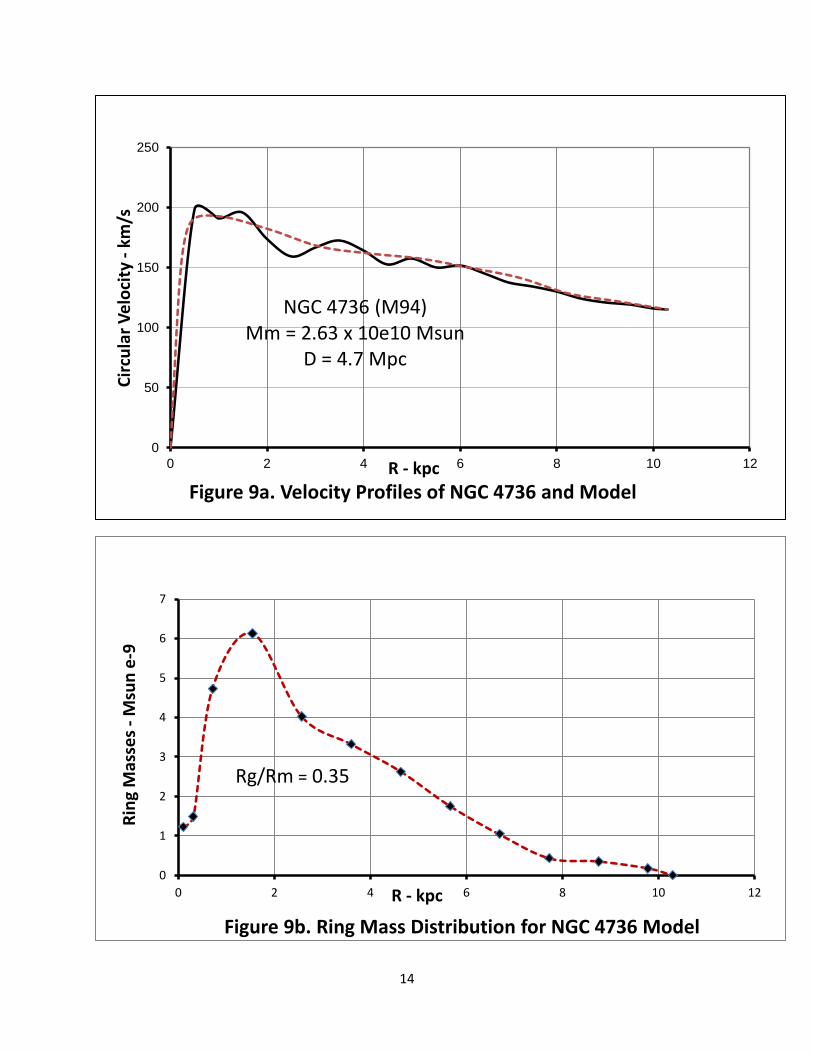
Figure 9a. Velocity Profiles of NGC 4736 and Model
NGC 4736 (M94) Mm = 2.63 x 10e10 Msun
D = 4.7 Mpc
0
1
2
3
4
5
6
7
0 2 4 6 8 10 12
Rin
g M
asse
s -
Msu
n e
-9
R - kpc
Figure 9b. Ring Mass Distribution for NGC 4736 Model
Rg/Rm = 0.35
15
0
10
20
30
40
50
60
0 1 2 3 4 5 6 7 8 9
Cir
cula
r V
elo
city
- k
m/s
R - kpc
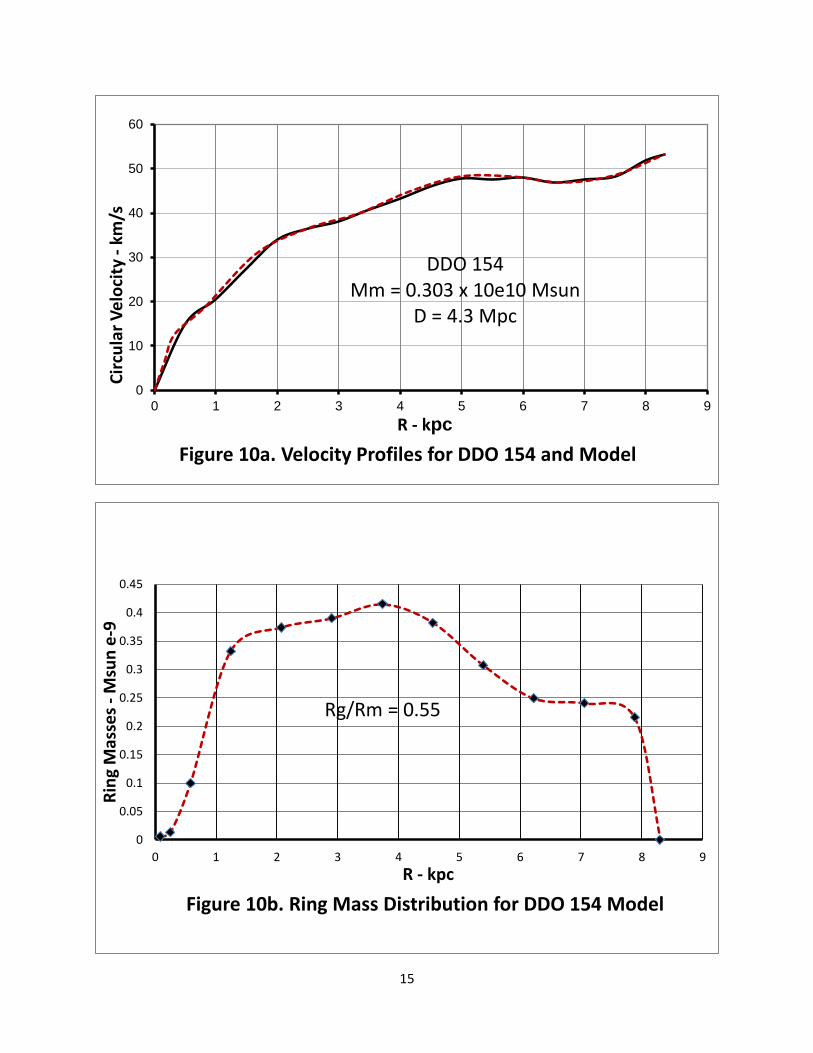
Figure 10a. Velocity Profiles for DDO 154 and Model
DDO 154 Mm = 0.303 x 10e10 Msun
D = 4.3 Mpc
0
0.05
0.1
0.15
0.2
0.25
0.3
0.35
0.4
0.45
0 1 2 3 4 5 6 7 8 9
Rin
g M
asse
s -
Msu
n e
-9
R - kpc
Figure 10b. Ring Mass Distribution for DDO 154 Model
Rg/Rm = 0.55
16
0
50
100
150
200
250
0 5 10 15 20 25
Cir
cula
r V
elo
city
- k
m/s
R - kpc
Figure 11a. Velocity Profiles of NGC 4826 and Model
NGC 4826 (M64) Mm = 8.10 x 10e10 Msun
D = 7.5 Mpc
0
2
4
6
8
10
12
14
16
0 5 10 15 20 25
Rin
g M
asse
s -
Msu
n e
-9
R - kpc
Figure 11b. Ring Mass Distribution for NGC 4826 Model
Rg/Rm = 0.48
17
0
50
100
150
200
250
0 10 20 30 40 50 60
Cir
cula
r V
elo
city
- k
m/s
R - kpc
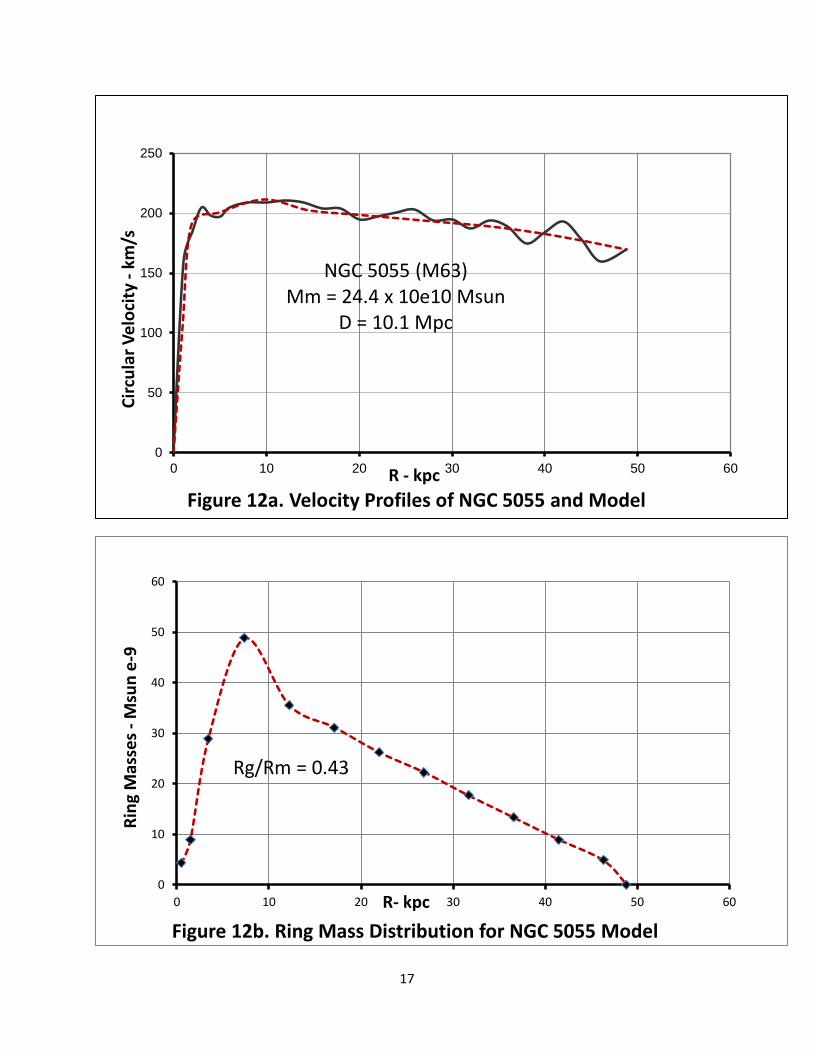
Figure 12a. Velocity Profiles of NGC 5055 and Model
NGC 5055 (M63) Mm = 24.4 x 10e10 Msun
D = 10.1 Mpc
0
10
20
30
40
50
60
0 10 20 30 40 50 60
Rin
g M
asse
s -
Msu
n e
-9
R- kpc
Figure 12b. Ring Mass Distribution for NGC 5055 Model
Rg/Rm = 0.43
18
0
50
100
150
200
250
0 5 10 15 20 25
Cir
cula
r V
elo
city
- k
m/s
R - kpc
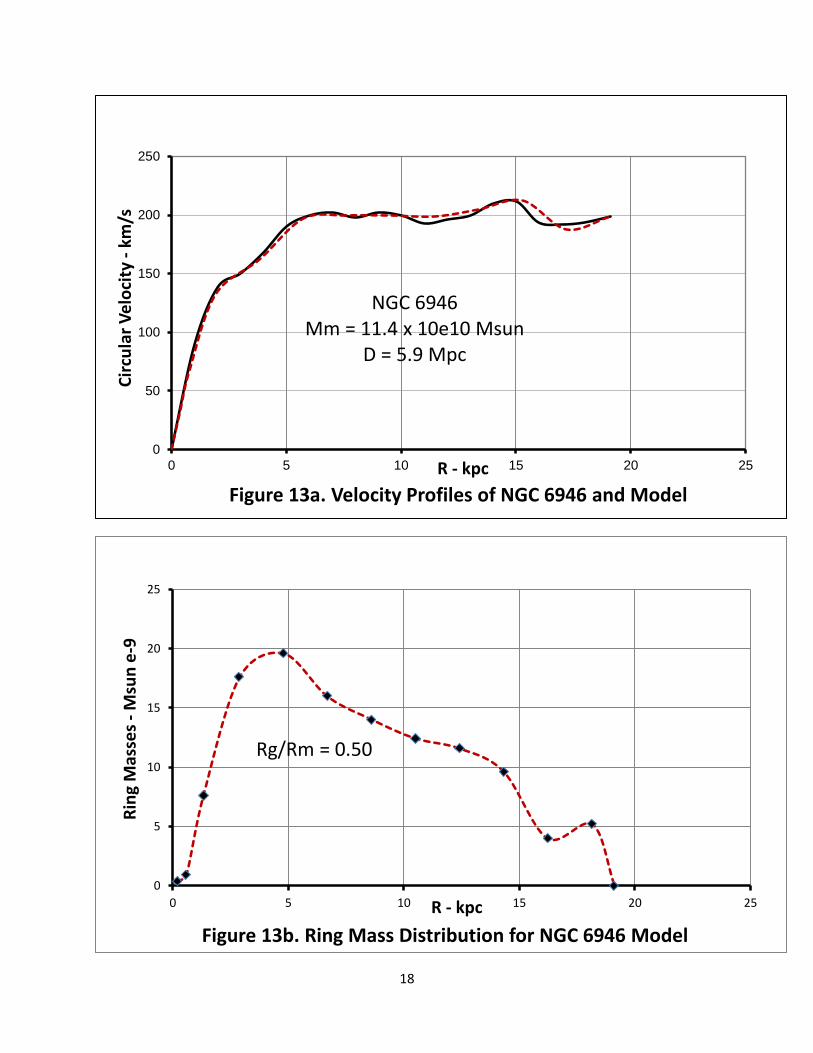
Figure 13a. Velocity Profiles of NGC 6946 and Model
NGC 6946 Mm = 11.4 x 10e10 Msun
D = 5.9 Mpc
0
5
10
15
20
25
0 5 10 15 20 25
Rin
g M
asse
s -
Msu
n e
-9
R - kpc
Figure 13b. Ring Mass Distribution for NGC 6946 Model
Rg/Rm = 0.50
19
0
50
100
150
200
250
300
0 5 10 15 20 25 30
Cir
cula
r V
elo
city
- k
m/s
R - kpc
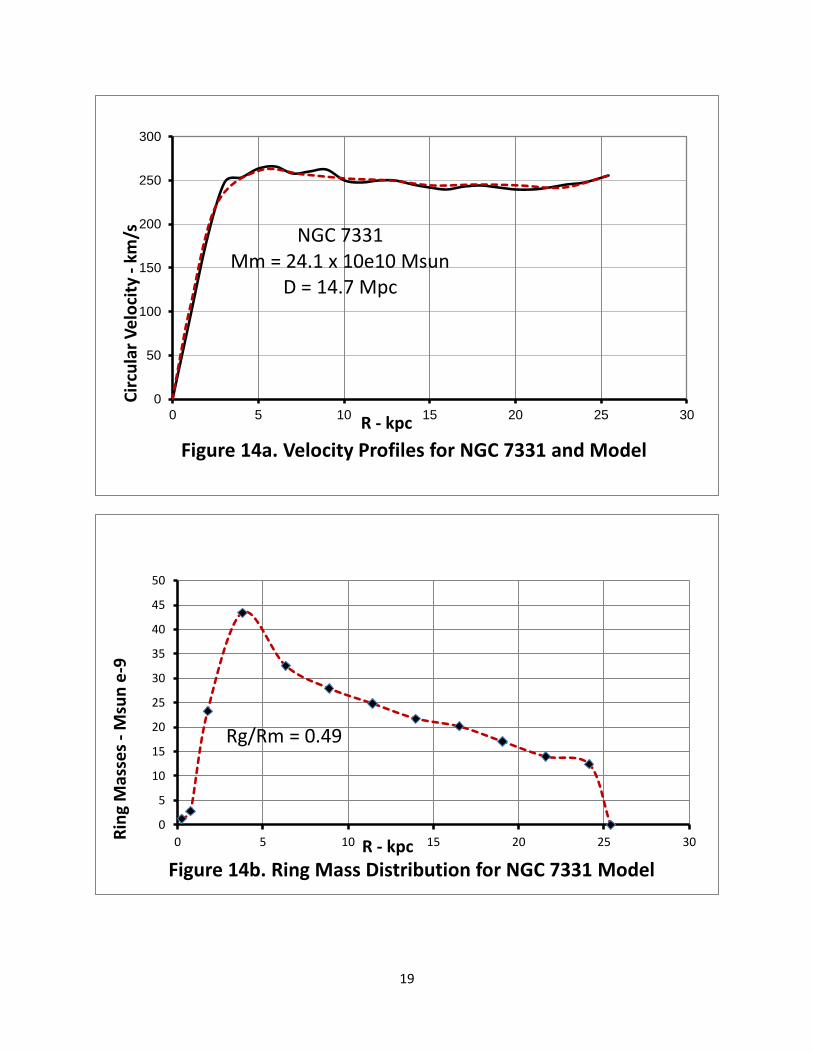
Figure 14a. Velocity Profiles for NGC 7331 and Model
NGC 7331 Mm = 24.1 x 10e10 Msun
D = 14.7 Mpc
0
5
10
15
20
25
30
35
40
45
50
0 5 10 15 20 25 30Rin
g M
asse
s -
Msu
n e
-9
R - kpc
Figure 14b. Ring Mass Distribution for NGC 7331 Model
Rg/Rm = 0.49
20
0
20
40
60
80
100
120
140
0 1 2 3 4 5 6 7 8 9
Cir
cula
r V
elo
city
- k
m/s
R - kpc
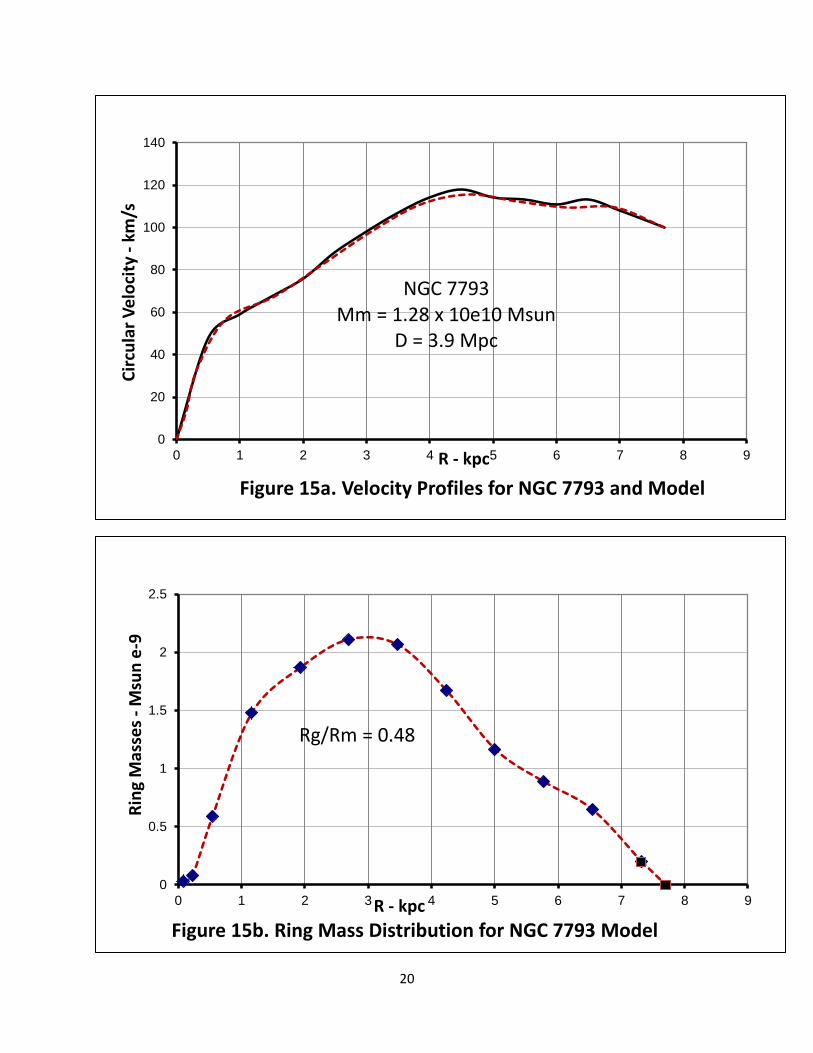
Figure 15a. Velocity Profiles for NGC 7793 and Model
NGC 7793 Mm = 1.28 x 10e10 Msun
D = 3.9 Mpc
0
0.5
1
1.5
2
2.5
0 1 2 3 4 5 6 7 8 9
Rin
g M
asse
s -
Msu
n e
-9
R - kpc
Figure 15b. Ring Mass Distribution for NGC 7793 Model
Rg/Rm = 0.48
21
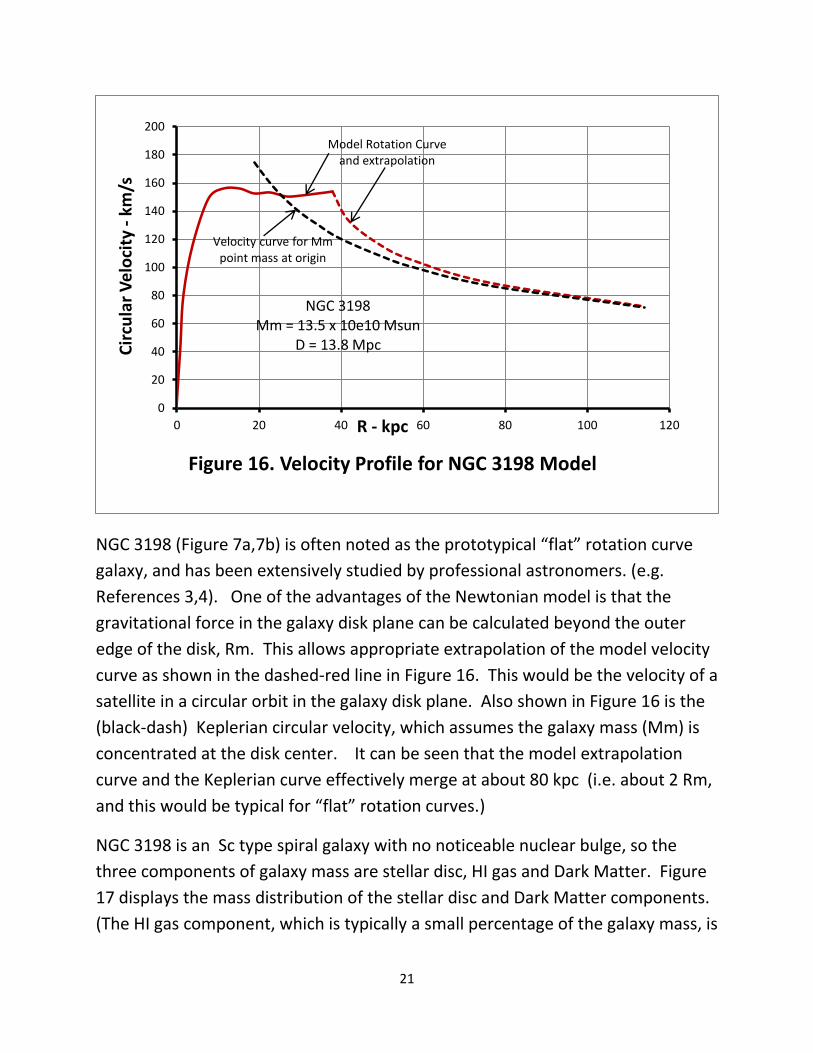
NGC 3198 (Figure 7a,7b) is often noted as the prototypical “flat” rotation curve
galaxy, and has been extensively studied by professional astronomers. (e.g.
References 3,4). One of the advantages of the Newtonian model is that the
gravitational force in the galaxy disk plane can be calculated beyond the outer
edge of the disk, Rm. This allows appropriate extrapolation of the model velocity
curve as shown in the dashed-red line in Figure 16. This would be the velocity of a
satellite in a circular orbit in the galaxy disk plane. Also shown in Figure 16 is the
(black-dash) Keplerian circular velocity, which assumes the galaxy mass (Mm) is
concentrated at the disk center. It can be seen that the model extrapolation
curve and the Keplerian curve effectively merge at about 80 kpc (i.e. about 2 Rm,
and this would be typical for “flat” rotation curves.)
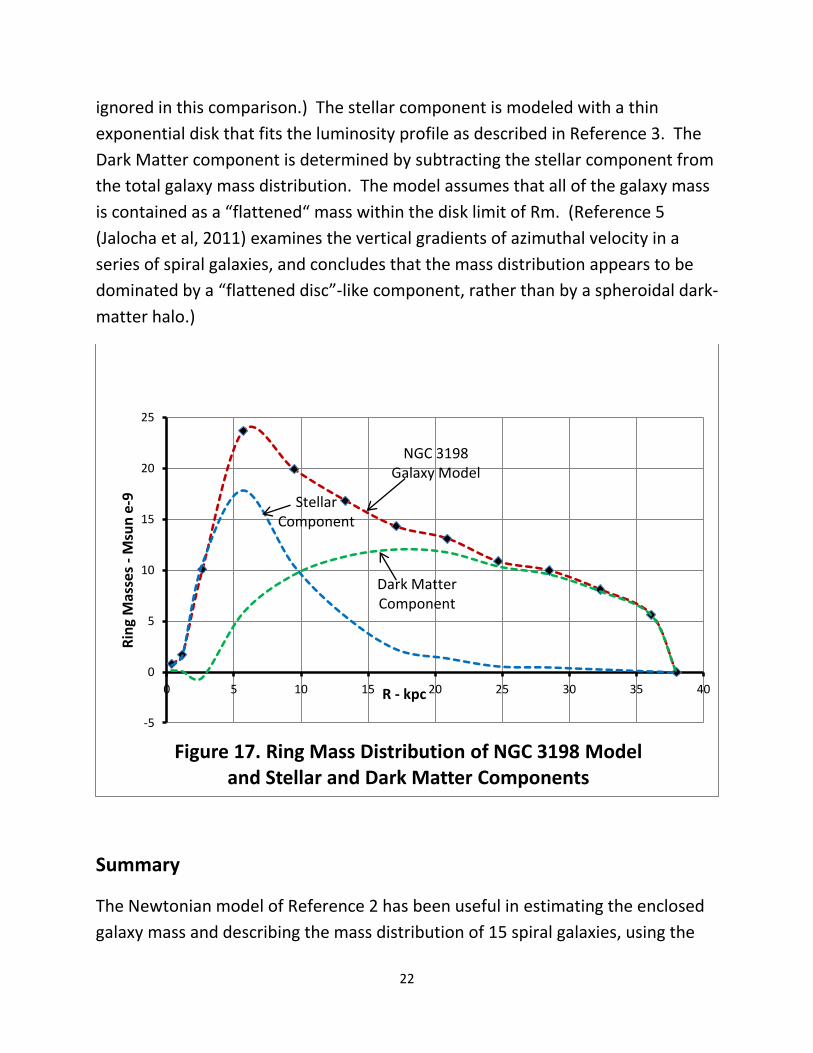
NGC 3198 is an Sc type spiral galaxy with no noticeable nuclear bulge, so the
three components of galaxy mass are stellar disc, HI gas and Dark Matter. Figure
17 displays the mass distribution of the stellar disc and Dark Matter components.
(The HI gas component, which is typically a small percentage of the galaxy mass, is
0
20
40
60
80
100
120
140
160
180
200
0 20 40 60 80 100 120
Cir
cula
r V
elo
city
- k
m/s
R - kpc
Figure 16. Velocity Profile for NGC 3198 Model
NGC 3198 Mm = 13.5 x 10e10 Msun
D = 13.8 Mpc
Model Rotation Curve and extrapolation
Velocity curve for Mm point mass at origin
22
ignored in this comparison.) The stellar component is modeled with a thin
exponential disk that fits the luminosity profile as described in Reference 3. The
Dark Matter component is determined by subtracting the stellar component from
the total galaxy mass distribution. The model assumes that all of the galaxy mass
is contained as a “flattened“ mass within the disk limit of Rm. (Reference 5
(Jalocha et al, 2011) examines the vertical gradients of azimuthal velocity in a
series of spiral galaxies, and concludes that the mass distribution appears to be
dominated by a “flattened disc”-like component, rather than by a spheroidal dark-
matter halo.)
Summary
The Newtonian model of Reference 2 has been useful in estimating the enclosed
galaxy mass and describing the mass distribution of 15 spiral galaxies, using the
-5
0
5
10
15
20
25
0 5 10 15 20 25 30 35 40
Rin
g M
asse
s -
Msu
n e
-9
R - kpc
Figure 17. Ring Mass Distribution of NGC 3198 Model and Stellar and Dark Matter Components
NGC 3198 Galaxy Model
Dark Matter Component
Stellar Component

23
rotation curves from THINGS (Reference 1.) The NGC 3198 model also
demonstrated the extrapolation of the rotation curve beyond Rm, and indicated
the mass distribution of the stellar and dark-matter components.
References
1. High-Resolution Rotation Curves and Galaxy Mass Models from THINGS.
W.J.G. de Blok et al, October 2008 arXiv:0810.2100v2
2. A Newtonian Model for Spiral Galaxy Rotation Curves.
Geoffrey M. Williams, April 2011 www.vixra.org/pdf/1104.0003v2.pdf
3. Distribution of Dark matter in the Spiral Galaxy NGC 3198.
T.S. van Albada et al, February 1985 Astrophysical Journal, 295, 305-313
4. On the Apparent Coupling of Neutral Hydrogen and Dark Matter in Spiral
Galaxies. H. Hoekstra, T.S. van Albada and R. Sancisi
Mon. Not. R. Astron. Sci. 323, 453-459 (2001)
5. Vertical Gradients of Azimuthal Velocity in a Global Thin Disk Model of
Spiral Galaxies NGC 2403, NGC 4559, NGC 4302 and NGC 5775.
Joanna Jalocha, Lukasz Bratek, Marek Kutschera, Piotr Skindzier
arXiv:1006.2060v2 (astro-ph) April 2011
6. Galactic Dynamics Binney, J and Tremain, S. 1987
Princeton University Press

24