Embed Size (px)
Citation preview

Estimates of
Maternal & Child Mortality in
India
Office of Registrar General, India 29th August 2011

Sources
• Sample Registration System(SRS)
- National and State level estimates
• Annual Health Survey(AHS)
- State and District level estimates in 8 EAG States and Assam
• National Family Health Survey(NFHS)
- National and State level estimates on child mortality only

• Sample Registration System (SRS) is designed for reliableestimates of fertility and mortality indicators at State andNational level separately for rural and urban areas
• Only source for fertility and mortality data since 1969-70
• One of the largest demographic surveys in the country coveringabout 1.4 million households and 7.01 million population in7597 sample units across 35 States/UTs
• Since 2004, a system of collection of Causes of Death datathrough Verbal Autopsy has also been included under thedomain of SRS
• This system allows for tracking Millennium Development Goals(MDG) on Child Mortality & Maternal Health on a regular basis
Sample Registration System (SRS) – An Introduction
Millennium Development Goals (MDG)
• MDGs are a set of numerical & time-bound targets to measure achievements in human and social development laid down by the UN.
• Of the 8 MDGs, IMR, U5MR and MMR are generated by SRS.
Goal No.
Goals IndicatorsTargets by 2015
4
Reduce infant mortality Infant Mortality Rate (IMR) 28
Reduce child mortality Under 5 Mortality Rate (U5MR) 42
5 Improve maternal health Maternal Mortality Ratio (MMR) 109

INFANT MORTALITY RATE (IMR)

IMR estimates 2009: Highlights
• IMR measures number of infant( < 1 year) deaths per 1000 live births.
• Every 6th death in the country pertains to an infant
• IMR in India has registered a 3 points decline to 50 in 2009 from 53 in 2008
• Maximum IMR in Madhya Pradesh (67) and minimum IMR in Kerala (12)
• Kerala (12) & Tamil Nadu (28) have achieved the MDG target (28 by 2015)
• Delhi (33), Maharashtra (31) and West Bengal (33) are in closer proximity

Infant Mortality Rate (IMR) by residence, 1990–2009
8074
68
5850
8680
74
6455
50 4844
403430
40
50
60
70
80
90
1990 1995 2000 2005 2009
Total Rural Urban
• IMR for the country declined by 30 points (rural IMR by 31 pointsvis-à-vis urban IMR 16 points) in the last 20 years at an annualaverage decline of 1.5 points
• Gap between the rural and urban IMR has declined over the years
• Still, 1 in every 20 infants - National level, 1 in every 18 infants -rural area, and 1 in every 29 infants - urban area die within one year of birth (against 1 in 37 under MDG)

Infant Mortality Rate (IMR) by sex, 1990–2009
80
74
68
58
50
78
73
67
56
49
81
76
69
61
52
45
50
55
60
65
70
75
80
85
1990 1995 2000 2005 2009
Total Male Female
• Female infants continue to experience a higher mortality than male infants

NEO-NATAL MORTALITY RATE (NNMR)

Neo-Natal Mortality Rate (NNMR) by residence, 1990–2009
• Neo-Natal Mortality Rate (<29 days) and Post Neo-Natal Mortality Rate (1 months to 11 months) has declined by 1 point and 2 points respectively during 2009 over 2008.
• NNMR for the country declined by 19 points (rural NNMR by 19 points vis-à-vis urban NNMR 10 points) in the last 20 years at an annual average decline of about 1 point
• Rural-Urban Gap in NNMR is declining.
53 48
44
37 34
57
52 49
41 38
31 29 27 23
21
10
20
30
40
50
60
1990 1995 2000 2005 2009
Total Rural Urban

IMR Vs NNMR Vs PNNMR, 1990–2009
80
74
68
58
50 53 48
44
37 34
27 26 23 22
16
10
20
30
40
50
60
70
80
90
1990 1995 2000 2005 2009
IMR NNMR PNNMR

0
10
20
30
40
50
60
70
1971-75 1976-80 1981-85 1986-90 1991-95 1996-00 2001-05 2006-09
% Share of NNMR & PNNMR in IMR
Neo-natal mortality rate Post-natal mortality rate
• Share of NNMR in the overall IMR is increasing over the years ( 54% in early 70s to 67% now)
• Interventions are required to effectively curb NNMR

UNDER 5 MORTALITY RATE (U5MR)

U5MR estimates 2009: Highlights
• U5MR denotes number of children (0-4 years) who died before reaching their fifth birthday per 1000 live births
• U5MR for the country has declined by 5 points over 2008 (64 in 2009 against 69 in 2008)
• A uniform decline of about 5 points is seen in male and female U5MRs.
• Maximum in Madhya Pradesh (89) and minimum in Kerala (14)
• Kerala (14), Tamil Nadu (33), Maharashtra (36), Delhi (37) & West Bengal (40) have already achieved the MDG target (42 by 2015)

Under 5 Mortality Rate (U5MR) by residence, 1990–2009
118
9785
77
64
128
111
98
85
7171 6755
4941
20
40
60
80
100
120
140
1990 1995 2000 2005 2009
Total Rural Urban
• U5MR for the country declined by 54 points (rural IMR by 57 points vis-à-vis urban IMR 30 points) in the last 20 years at an annual average decline of 2.7 points
• Urban U5MR has already achieved the MDG target (42 by 2015)
• Rural U5MR is still 71

Under 5 Mortality Rate (U5MR) by sex, 1990–2009
118
97
85
77
64
110
96
84
72
60
126
110
95
82
69
50
60
70
80
90
100
110
120
130
1990 1995 2000 2005 2009
Total Male Female
• Male-female mortality differential has narrowed down over the years, yet the gap remains significant
“ Child deaths are falling, but not quickly enough to reach the MDG target”

MATERNAL MORTALITY RATIO (MMR)

MMR estimates 2007-09: Highlights
• MMR measures number of women aged 15-49 years dying due to maternal causes per 1,00,000 live births.
• Decline in MMR estimates in 2007-09 over 2004-06:– For India: 212 from 254 (a fall of about 17%)
– In Empowered Action Group (EAG) states & Assam: 308 from 375 (18%)
– Among Southern States: 127 from 149 (15%)
– In Other States: 149 from 174 (14%)
• States realizing MDG target of 109 have gone up to 3 with Tamil Nadu & Maharashtra (new entrants) joining Kerala
• Andhra Pradesh, West Bengal, Gujarat and Haryana are in closer proximity to achieving the MDG target.

Maternal Mortality Ratio (MMR); India, EAG & Assam, Southern States and
Other States, 2004-06 and 2007-09
India & Major StatesMMR
2004-06
MMR
2007-09
INDIA TOTAL 254 212
Assam 480 390
Bihar/Jharkhand 312 261
Madhya Pradesh/Chhattisgarh 335 269
Orissa 303 258
Rajasthan 388 318
Uttar Pradesh/Uttarakhand 440 359
EAG AND ASSAM SUBTOTAL 375 308
Andhra Pradesh 154 134
Karnataka 213 178
Kerala 95 81
Tamil Nadu 111 97
SOUTH SUBTOTAL 149 127
Gujarat 160 148
Haryana 186 153
Maharashtra 130 104
Punjab 192 172
West Bengal 141 145
Other 206 160
OTHER SUBTOTAL 174 149

Trends in Maternal Mortality Ratio - India
(2004-06)
2009
2007-09 SRS
212
58 000
(2007-09)

Levels of MMR by Regions, 2007-09
Region MMR Life time risk
% share of female Popln.
% to total maternal
deaths
EAG states
308 1.1% 48.0 61.6
Southern states
127 0.3% 21.0 11.4
Other states
149 0.4% 31.0 27.0
India 212 0.6% 100 100

Levels of MMR by Regions, 1999-2009
35%
38%
33%327
301
254
212
461438
375
308
206
173
149127
229
199
174
149
100
150
200
250
300
350
400
450
500
1999-2001 2001-03 2004-06 2007-09
India EAG & Assam States Southern States Other States
35%
Decline over last 10 years


ANNUAL HEALTH SURVEY (AHS)

Objective of AHS
“ To yield benchmarks of core vital andhealth indicators at the district level andto map changes therein on an annualbasis”
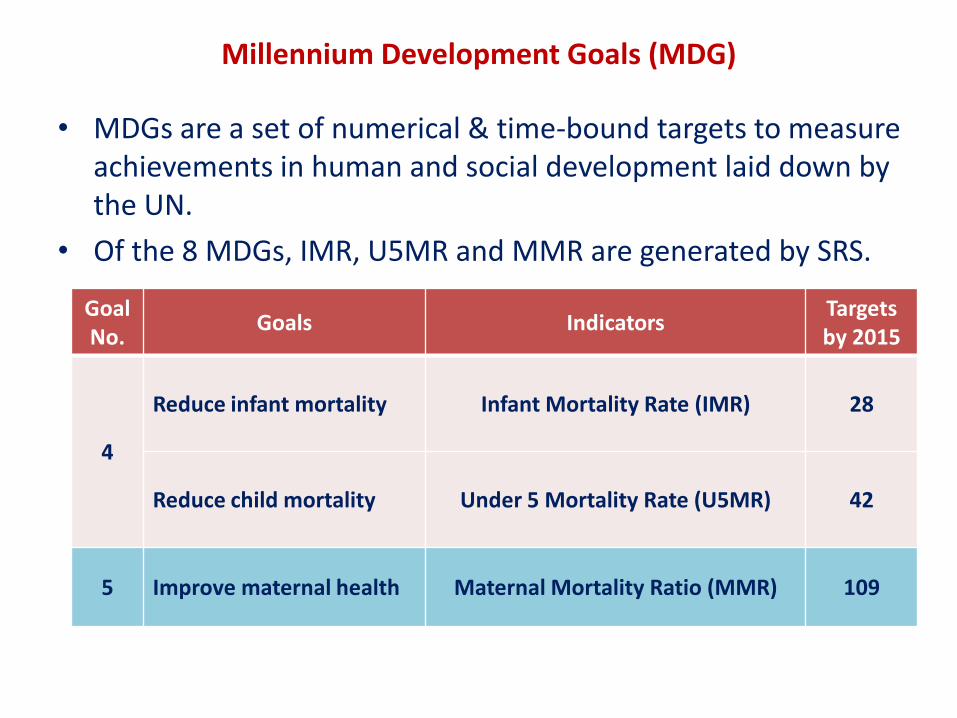
Background
• Conceived at the behest of NationalCommission on Population , PMO andPlanning Commission
• Entrusted to ORGI in view of its expertise inimplementing Sample RegistrationSystem(SRS)
• Scheme is sponsored by Ministry of Health &Family Welfare(MOHFW)

NEED FOR AHS 9 AHS States namely, Rajasthan, Uttar Pradesh,
Uttarakhand, Bihar, Jharkhand, Orissa, Madhya Pradesh, Chhattisgarh and Assam constitute:
• 48 percent of country’s Population
• 59 percent of Births
• 70 percent of Infant Deaths
• 75 percent of Under 5 Deaths
• 62 percent of Maternal Deaths
There is large inter-district variations in these States.
In the absence of District level vital data, State level estimates from Sample Registration System (SRS) are used for formulating district level plans.

Annual Health SurveySelected States
Orissa
Chhattisgarh
JharkhandMadhya Pradesh
Bihar
ASSAM
Rajasthan
Uttar Pradesh
Uttarakhand

Key Features
• Coverage- All the 284 districts of 8 EAG States and Assam
• Sample Units- 20,694 statistically selected sample units (Census
Enumeration Blocks in urban areas and Villages in rural areas)
• Sample Population- About 18.2 million
• Sample Households- 3.6 million households
• Average Sample households per district- About 13 thousand
Largest Sample Survey in the World

Key Features
• Sample Size- District level sample size is based on Infant Mortality
Rate
• Conduct of Field Work- Hybrid approach wherein fieldwork has
been outsourced and supervision done by the ORGI
• Third Party Audit- Third Party Audit was implemented under AHS
to verify the correctness of data through an independent
arrangement. This was over and above the regular supervision by
ORGI

StateNo. of
District
Sample
Population
per district
Total Sample
Population
No. of Sample
Units
No. of
Households*
Uttarakhand 13 141,898 1,844,670 2,501 368,934
Rajasthan 32 50,678 1,621,710 1,841 324,342
Uttar Pradesh 70 49,564 3,469,464 3,927 693,893
Bihar 37 59,361 2,196,340 2,356 439,268
Assam 23 71,216 1,637,967 1,784 327,593
Jharkhand 18 104,862 1,887,520 2,109 377,504
Madhya Pradesh 45 48,937 2,202,161 2,557 440,432
Chhattisgarh 16 70,371 1,125,940 1,255 225,188
Orissa 30 71,377 2,141,319 2,364 428,264
Total 284 18,127,089 20,694 3,625,418
* No. of households estimated using 5.0 as average household size
Allocation of Sample

INFANT MORTALITY RATE (IMR)
0
10
20
30
40
50
60
70
80
IMR - AHS States
Jharkhand and Uttarakhandare at the bottom of the list whereas, MP and UP tops
IMR in rural area is significantly higher than that of urban area across AHS States. In UP, rural IMR is 74 compared to 54 in urban
More female infants die as compared to males. In UP, female IMR is 72 compared to 69 for males

INFANT MORTALITY RATE (IMR)
State
Total no.
of
districts
Districts with
minimum IMR
Districts with
maximum IMRRange
UTTARAKHAND 13 Rudraprayag (19) Haridwar (72) 53
RAJASTHAN 32 Kota (36) Jalor (79) 43
UTTAR PRADESH 70 Kanpur Nagar (36) Shrawasti (103) 67
BIHAR 37 Patna (39) Madhepura (71) 32
ASSAM 23 Dhemaji (44) Kokrajhar (76) 32
JHARKHAND 18 Purbi Singhbum (26) Godda (64) 38
ORISSA 30 Baleshwar (49) Balangir (100) 51
CHHATTISGARH 16 Durg (43) Raigarh (65) 22
MADHYA PRADESH 45 Indore (40) Panna (93) 53

IMR across 284 districts ranges between 19 (Rudraprayag; Uttarakhand) & 103 (Shrawasti, UP) – a variability of 5 times!
6 districts viz. Purbi Singhbhum & Dhanbad (Jharkhand); Chamoli, Rudraprayag, Pithoragarh & Almora (Uttarakhand) have already achieved MDG-4 National target of 28 by 2015
Another 4 districts i.e. Bokaro & Ranchi(Jharkhand) and Bageshwar & Nainital(Uttarakhand) are in closer vicinity
Female infants experience higher mortality than males
IMR in rural areas is significantly higher than that in urbanareas
INFANT MORTALITY RATE (IMR)

INFANT MORTALITY RATE (IMR)
StateFrequency Range
15 - 29 30 - 44 45 - 59 60 - 74 75 - 89 90 - 104
UTTARAKHAND 4 7 2
RAJASTHAN 1 15 15 1
UTTAR PRADESH 2 18 22 23 5
BIHAR 1 27 9
ASSAM 1 13 8 1
JHARKHAND 3 6 8 1
ORISSA 17 8 4 1
CHHATTISGARH 1 10 5
MADHYA PRADESH 1 9 28 5 2
Total 7 20 117 98 34 8
76 % of districts fall in range 45-59 and 60-74 of IMR

Infant Mortality Rate
Top Five Districts in AHS States
Uttarakhand
Uttar Pradesh
Rajasthan
Assam
Bihar
Madhya Pradesh
Jharkhand
Chhattisgarh
Orissa

NEO-NATAL MORTALITY RATE (NNMR)
0
10
20
30
40
50
60
NNMR - AHS States
Jharkhand & Uttarakhandrecords NNMR under 30 whereas for MP & UP, it is 44 & 50 respectively
NNMR is more acute in rural areas than urban areas across all 9 AHS States. In UP, rural NNMR is 53 compared to 36 in urban

NNMR across 284 districts ranges between 11 (Rudraprayag; Uttarakhand) & 75 (Balangir, Orissa) – a variability of 7 times!
Out of every 10 infant deaths, 6-7 pertains to neonates
NNMR in rural areas of districts is significantly higher than that in urban areas
NEO-NATAL MORTALITY RATE (NNMR)
State
Total
no. of
districts
Districts with
minimum NNMR
Districts with
maximum NNMRRange
UTTARAKHAND 13 Rudraprayag (11) Haridwar (50) 39
RAJASTHAN 32 Kota (25) Jalor (58) 33
UTTAR PRADESH 70 Kanpur Nagar (24) Shrawasti (73) 49
BIHAR 37 Patna (22) Madhepura (49) 27
ASSAM 23 Dhemaji (27) Dhubri (50) 23
JHARKHAND 18 Purbi Singhbum (17) Lohardaga (41) 24
ORISSA 30 Anugul (31) Balangir (75) 44
CHHATTISGARH 16 Durg (29) Raigarh (45) 16
MADHYA PRADESH 45 Indore (25) Panna (66) 41

NEO-NATAL MORTALITY RATE (NNMR)
StateFrequency Range
10 - 19 20 - 29 30 - 39 40 - 49 50 - 59 60 - 69 70 - 79
UTTARAKHAND 5 6 1 1
RAJASTHAN 1 15 14 2
UTTAR PRADESH 4 15 17 19 12 3
BIHAR 7 20 10
ASSAM 1 12 9 1
JHARKHAND 2 8 7 1
ORISSA 17 10 2 1
CHHATTISGARH 3 5 8
MADHYA PRADESH 3 9 22 8 3
Total 7 33 100 92 33 15 4
68% of districts fall in range 30-39 & 40-49 of NNMR

Uttarakhand
Uttar Pradesh
Rajasthan Assam
Bihar
Madhya Pradesh
Jharkhand
Chhattisgarh
Orissa
Neo-Natal Mortality Rate
Top Five Districts in AHS States

UNDER FIVE MORTALITY RATE (U5MR)
0
10
20
30
40
50
60
70
80
90
100
U5MR - AHS States U5MR for Uttarakhand is in the 50s while for UP, it is in the 90s
Across all 9 AHS states, U5MR in rural areas is significantly higher than that of urban areas. In UP, rural U5MR is 101 compared to 68 in urban
Gap between male-female mortality differential is significant. In UP, male-female gap is 9

UNDER FIVE MORTALITY RATE (U5MR)
State
Total no.
of
districts
Districts with
minimum U5MR
Districts with
maximum U5MRRange
UTTARAKHAND 13 Pithoragarh (24) Haridwar (94) 70
RAJASTHAN 32 Kota (45)Jalor (99)
Banswara (99)54
UTTAR PRADESH 70 Kanpur Nagar (52) Shrawasti (142) 90
BIHAR 37 Patna (53) Sitamarhi (106) 53
ASSAM 23 Dhemaji (52) Kokrajhar (103) 51
JHARKHAND 18 Purbi Singhbum (36) Godda (93) 57
ORISSA 30Balasore (58)
Jharsuguda (58)Kandhamal (145) 87
CHHATTISGARH 16 Durg (52) Surguja (103) 51
MADHYA PRADESH 45 Indore (51) Panna (140) 89

U5MR ranges between 24 (Pithoragarh, Uttarakhand) & 145 (Kandhamal, Orissa) - a variability of 7 times!
7 districts viz. Pithoragarh, Almora, Rudraprayag, Chamoli, Nainital & Bagheswar (Uttarakhand) and Purbhi Singhbum (Jharkhand) have already achieved MDG National level target of 42
Another 10 districts viz. Dhanbad, Bokaro, Kodarma, Hazaribagh & Giridih (Jharkhand) and Kota (Rajasthan) and Champawat, Udham Singh Nagar, Dehradun & Uttarakashi are in closer vicinity
More no. of females die before reaching age 5 years than males
U5MR in rural areas is significantly higher than that in urban areas
UNDER FIVE MORTALITY RATE (U5MR)

UNDER FIVE MORTALITY RATE (U5MR)
StateFrequency Range
21 - 40 41 - 60 61 - 80 81 - 100 101 - 120 121 - 140 141 - 160
UTTARAKHAND 6 5 1 1
RAJASTHAN 1 18 13
UTTAR PRADESH 2 13 30 19 5 1
BIHAR 1 23 9 4
ASSAM 2 12 8 1
JHARKHAND 1 9 4 4
ORISSA 3 13 9 4 1
CHHATTISGARH 2 12 1 1
MADHYA PRADESH 2 13 19 9 2
Total 8 44 104 81 38 7 2
66 % of districts fall in range 61-80 and 81-100 of U5MR

Under Five Mortality Rate
Top Five Districts in AHS States
Uttarakhand
Uttar Pradesh
Rajasthan
Assam
Bihar
Madhya Pradesh
Jharkhand
Chhattisgarh
Orissa

MATERNAL MORTALITY RATIO (MMR)
Uttarakhand has the lowest MMR whereas, Assam has the highest
Maternal Deaths under AHS are based on response of relatives of the deceased
There is a move to introduce tools of Verbal Autopsy under AHS
0
50
100
150
200
250
300
350
400
MMR - AHS States

MMR has been published for 62 administrative divisions (Commissionraits) in 9 AHS States
It ranges between 183 (Kumaon HQ, Uttarakhand) & 451(Faizabad Mandal, UP)
MMR for Uttarakhand along with its two divisions is lower than the National Average (212)
MATERNAL MORTALITY RATIO (MMR)
State
Total no.
of
Admin.
Division
Admin. Division
with minimum MMR
Admin. Division with
maximum MMRRange
UTTARAKHAND 2 Kumaon HQ (183) Garhwal HQ (190) 7
RAJASTHAN 7 Bharatpur (292) Udaipur (364) 72
UTTAR PRADESH 18 Jhansi Mandal (241)Faizabad Mandal
(451)210
BIHAR 9 Patna (258) Purnia (377) 119
ASSAM 4Hills & Barak Valley
(342)Upper Assam (430) 88
JHARKHAND 5Uttari Chota Nagpur
(208)Santal Paragana (325) 117
ORISSA 3 Northern (253) Southern (311) 58
CHHATTISGARH 4 Raipur (243) Bastar (312) 69
MADHYA PRADESH 10 Gwalior (262) Shahdol (435) 173

Maternal Mortality Ratio
By Administrative Divisions in
AHS States
Uttarakhand
Uttar Pradesh
Rajasthan
Assam
Bihar
Madhya Pradesh
Jharkhand
Chhattisgarh
Orissa
MMR
250 and below
251 - 350
351 - 400
401 and above
Administrative Divisions

CONCLUSION
Top 100 districts in order of IMR constitute about 50 percent of total Infant Deaths across 9 States
Top 25 Administrative Divisions (comprising 104 districts) in order of MMR constitute 41 percent of the total Maternal Deaths
Top 100 districts in order of U5MR account for 63 percent of total child deaths.
57 districts are in common – Hot Spots

Orissa
Chhattisgarh
Jharkhand
Madhya Pradesh
Bihar
AssamRajasthan
Uttar Pradesh
Uttarakhand
Infant Mortality Rate
Top 100 Districts in AHS States

Orissa
Chhattisgarh
Jharkhand
Madhya Pradesh
Bihar
Assam
Rajasthan
Uttar Pradesh
Uttarakhand
Maternal Mortality Ratio
Top 25 Administrative Divisions in
AHS States
MMR
Top 25
Administrative Divisions

Rajasthan- 5
Assam- 7
MP- 11
UP- 34

THANK YOU