Embed Size (px)
Citation preview

FHWA Report
Mark R. Kehrli, Director, FHWA Office of Transportation Operations
SCOTE Meeting – June 26, 2017

MUTCD Initiatives
Traffic Incident Management Progress
Road Weather Management Goals
Work Zone Management
Operations Program Priorities
Office of Transportation Operations Programs
Performance Management Rulemaking
Connected Automated Vehicles (covered during afternoon session)
Freight – FAST Act and Other Activities
Other Office of Operations Programs

Office of Transportation Operations
MUTCD
Kevin Sylvester
Work Zones &
Road Weather
Paul Pisano
Traffic Incident &
Emergency Management
Kim Vasconez
Program Team Leaders
Office Structure

Next Edition of the MUTCD
Current Status
Pavement Marking Retro Rulemaking
Supplemental NPA docket closed May 4
Docket comments being analyzed (around 40 comments)
MUTCD
New Administration is identifying priorities
Still pursuing new Interim Approvals
4
Traffic Control Devices – MUTCD

Interim Approvals & Other Activities
FHWA continues to pursue new IAs that have
potential to address demonstrated needs
Bicycle Boxes (IA-18)
Alt. Signal Warrant 7—Crash Experience (IA-19)
2-Stage Bicycle Turn Box (IA-20 – NEW)
Policy Statements and Interpretations can also
address needs on an interim basis
Permanent Signing for Traffic Incidents (Official
Interp.)
CMS Policy Update (in progress)
5
Traffic Control Devices – MUTCD

Interim Approvals
RRFB (IA-11)
Numerous patent claims
Complex legal issues
Expect resolution very soon
Clearview (IA-5, Terminated)
Analyzing 24 submissions to Dec. 2016 RFI:
9 State DOTs 3 Organizations
2 Local agencies 8 Citizens
2 Toll agencies
3 new research reports being analyzed
SIGN Act6
Traffic Control Devices – MUTCD

National TIM Responder Training
Program Implementation Progress -
National TIM Responder Training
Program Implementation ProgressAs of June 12, 2017
Traffic Incident Management (TIM)
Train-the-Trainer Sessions• 313 sessions with 9,660 participants
• 23% of participants have provided training
In-Person Responder Training• 10,213 sessions with 234,814 participants
Web-Based Training (WBT) • 22,595 total | 17,408 NHI | 1,610 Other
• 3,577 ERSI Responder Safety Learning Network
Total Trained: 267,069

TIM Training Program Implementation Progress
Train-the-Trainer (TtT) SessionsAs of June 12, 2017
Traffic Incident Management (TIM)
313 TtT Sessions Conducted
WA
OR
CA
NV
ID
UT
NMAZ
ND
MN
IANE
MT
WY
COKS
OK
TX
WIMI
IL
AR
MSAL
SC
NY
MO
LA
IN
OH
FL
GA
TN
KY
MEVT
NH
MA
RICT
NJ2
DE
MDWVVA
DC
2
PA
2
3
2
2
SD
3
211
9
3
2
3
2
2
2
FHWA Sponsored
TtT Session Conducted
State/Local Led/Funded
TtT Session Conducted
TtT Session Planned
2
AK
HIPR
2
2
2
2
FHWA and State/Local
Co-Sponsored
TtT Session Conducted
3
2
2
2
2
NC
2
2
5
22
2
3

TIM Training Program Implementation Progress
Total Trained- As of May 31, 2015
TIM Training Program Implementation Progress
Total Trainers TrainedAs of June 12, 2017
Traffic Incident Management (TIM)
9,660 Trainers Trained
MA: 149
186
RI: 43
CT: 70
NJ: 247
DE: 32MD:
225
DC: 81
67
162
258
73
142
165
223117197
424
231
75
246
141
162171
532
334
61
68
140
59
460
81
122
184
304
41
203
269
188154
509
176
263
73
214357
VT: 43
NH: 53
56
39164
Canada:
8

TIM Training Program Implementation Progress
Total Trained- As of May 31, 2015
TIM Training Program Implementation Progress
Responder Training: In-Person and Web-BasedAs of June 12, 2017
Traffic Incident Management (TIM)
MA: 2,853[76]
1,351[1,085]
RI: 1,427[13]
CT: 772[227]
NJ: 8,286[136]
MD: 4,647[211]
DC: 1,992[35]
3,067[17]
1,006[213]
3,688[166]
1,134[24]
434[62]
7,314[418]11,717
[1,845]4,888[78]10,720
[267]
5,244[356]
4,619 [387]
227[30]
2,369[46]
7,313[19]
5,119[98]
8,079[62]
13,997[8,293]
8,198[342]
2,606[37]
2,603[31]
1,923[10]
1,071[7]
14,143[4,162]
357[93]
4,149[74]
3,494[115]
4,649[104]
1,399[30]
3,001[619]
10,608 [138]
5,463[90]3,158
[47]
2,978[74]
4,387[250]
875[29]
18,086[418]
VT: 1,265[30]
NH: 1,770[18]
352[63]
Mexico: 537
Number of Responders Trained: In-Person - 234,814 Web-Based - [22,595]
227[395] 3,421
[9]
DE: 319[58]
5,971[550]
Canada:
343 [47]
TIM Training Program Implementation Progress
Total Trained- As of May 31, 2015
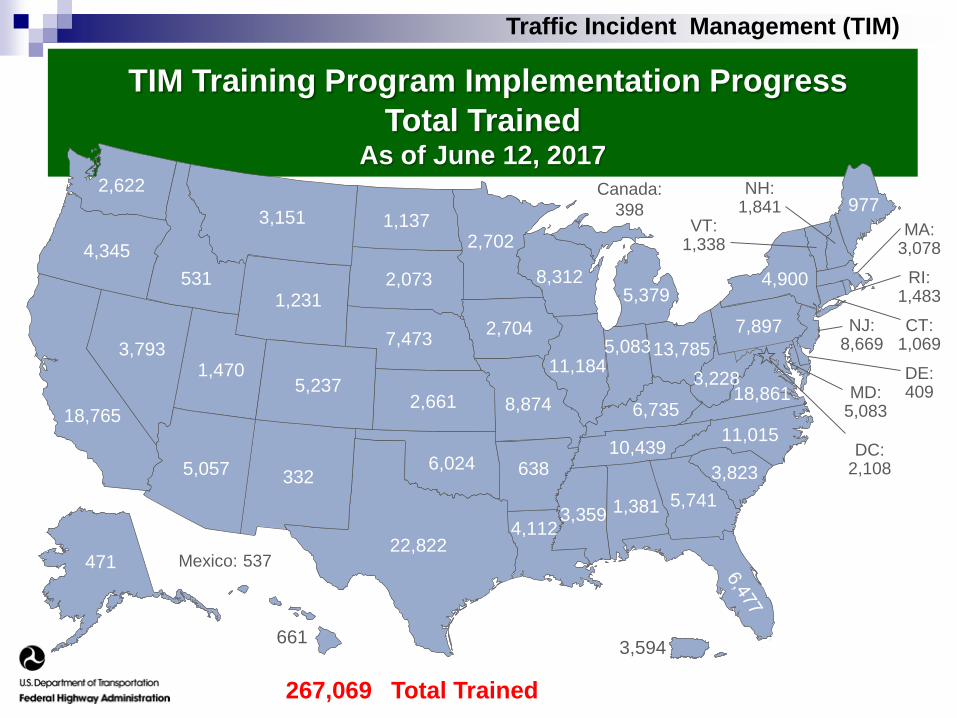
TIM Training Program Implementation Progress
Total TrainedAs of June 12, 2017
Traffic Incident Management (TIM)
3,594
MA: 3,078
2,622
RI: 1,483
CT: 1,069
NJ: 8,669
MD: 5,083
DC: 2,108
3,151
1,381
4,112
1,231
638
7,897
13,7855,08311,184
6,024
5,237
332
2,661
7,473
5,3798,312
22,822
8,874
2,704
2,702
2,073
1,137
18,765
531
4,345
3,793
5,057
1,470
3,823
11,015
5,7413,359
10,439
3,228
4,900
977
6,73518,861
471 Mexico: 537
DE: 409
267,069 Total Trained
661
VT: 1,338
NH: 1,841
Canada:
398

TIM Training Program Implementation Progress
Total Responders to Be Trained- As of May 31, 2015
Total Percent TrainedSIP17 Goal: 20% as of June 12, 2017
Traffic Incident Management (TIM)
22.7% Percent Trained
(1,178,022) Total Responders To Be Trained
MA: 25.5%(12,079)
12.6%(20,777)
RI: 36.3%(4,080)
CT: 34.3%(3,120)
NJ: 29.1%(29,798)
MD: 21.9% (23,218)
DC: 32.3%(6,534)
30.0%(10,502)
36.1%
(11,394)
32.7%(3,770)
6.0%(10,627)
14.5%(54,500)37.1%
(37,126)16.6%(30,546)
20.4%(54,699)
45.5%(13,245)
26.3%(19,894)
3.3%(9,932)
43.7%(17,100)
16.5%(32,555)
30.7%(27,081)
29.1%(78,309)
28.6%(31,000)
42.0%(4,930)
28.5%(3,993)
26.3%(71,223)
4.5%(11,781)
16.5%(26,350)
42.1%(9,019)
22.5%(22,500)
18.8%(7,831)
26.7%(14,331)
19.8%(55,670)
20.1%(28,532)
38.7%(8,683)
31.7%
9.0%(54,443)
13.0%(7,510)
37.1%(18,177)
VT: 47.9%(2,796)
NH: 25.7%(7,175)
9.8%(4,797)
20.2%(3,270) 60.7%
(5,924)
10 - 19.9% Trained
5 - 9.9% Trained
0.1 - 4.9% Trained
32.1%(8,300)
(32,948)
3.1%(45,209)
9.0%(30,208)
12.5%(21,542)
DE: 8.7%(4,715)
20 - 29.9% Trained
30 - 39.9% Trained
40+% Trained

TIM Training Program Implementation Progress
Total To Be Trained By Discipline - As of May 31, 2015
Traffic Incident Management (TIM)
* NHI Web-Based Training totals are included in “Other Disciplines”
TIM Training Program Implementation Progress
Total To Be Trained By DisciplineAs of June 12, 2017
27,224 (61.0%)
22,000 (28.9%)
29,031 (34.3%)
12,654 (5.8%)
99,333 (26.5%)
76,827 (20.2%)
44,597
76,041
84,686
217,115
374,527
381,056
0 50,000 100,000 150,000 200,000 250,000 300,000 350,000 400,000 450,000
Other Disciplines
Towing and Recovery
Transportation/Public Works
EMS
Fire/Rescue
Law Enforcement
Total Trained Total To Be Trained

• Pathfinder
• Strengthen the working relationships across
State DOTs and the Weather Enterprise for the
dissemination of road weather information to
travelers that is clear, concise, impact-based,
and consistent
• Integrating Mobile Observations (IMO)
• Deploy advanced, vehicle-based technologies to
collect, transmit, and use weather, road
condition, and related vehicle data for improved
transportation system management
14
EDC-4: Weather-Savvy Roads
Road Weather

• Monday, August 21, 2017
• Approximately 200 million people live within a day’s
drive of the path of this total eclipse
• Some actions that State DOTs are taking:
• Suspending road work that day
• Coordinating traveler information messages with law
enforcement and others
• Monitoring related events (http://nationaleclipse.com)
• AASHTO task force
15
2017 Solar Eclipse
Source: FHWA
Road Weather

EDC-3: Smarter Work Zones
Successfully promoted the deployment of two
innovative strategies designed to optimize work
zone safety and mobility
Project Coordination 34 States implemented strategies to better coordinate
projects that minimize disruptions to safety and
mobility
Technology Application 41 States implemented a variety of ITS technology
solutions keep traffic moving safely through work
zones
Work Zones

EDC-3: Smarter Work Zones
Promoting the deployment of two innovative
strategies designed to optimize work zone
safety and mobility
Project CoordinationStrategies:
WISE tool:
Technology Application1a: Planning:
1b: Demonstrating:
Work Zones
Target: 25 (by 12/31/2016) Number of States Implementing: 34 Goal Met? Exceeded by 9
Target: 35
(by 12/31/2016)
Number of States Implementing 1a: 9
Number of States Implementing 1b: 32
Goal Met? Exceeded by 6
Target: 5 (by 12/31/2016) Number of States Implementing: 4 Goal Met? No

EDC-3: Smarter Work Zones
SWZ Interactive
ToolkitResources:• 13 Webinars
• 3 Fact Sheets
• 6 Case Studies
• 14 Marketing Products
• Specifications and other
project related info
• Peer Exchanges and
Workshops
• Training
• Demonstration Site Visits
• Other references
Work Zones
https://www.workzonesafety.org/swz/

Advanced Transportation and Congestion
Management Technologies Deployment (ATCMTD)
FAST Act Competitive grants for development of model deployment
sites for large-scale installation and operation
ATCMTD program
61 applications in response to NOFO
Requesting $354M of Federal funding for over $1B of total
project costs
Technical Review Teams currently reviewing
applications
ATCMTD

Transportation Performance Management
FHWA TPM Rulemaking: Status
TPM Related Rules Final Rule Published Rule Effective Date
Safety Performance Measures March 15, 2016 April 14, 2016
Highway Safety Improvement
ProgramMarch 15, 2016 April 14, 2016
Statewide and Non-Metropolitan
Planning; Metropolitan PlanningMay 27, 2016 June 27, 2016
Highway Asset Management Plans
for NHSOctober 24, 2016 October 2, 2017
Pavement and Bridge Condition
MeasuresJanuary 18, 2017 May 20, 2017
Performance of the NHS, Freight,
and CMAQ MeasuresJanuary 18, 2017 May 20, 2017*
* Except for portions of the rule related to the percent change in CO2 emissions from 2017
(GHG measure). Those portions are delayed and FHWA will be publishing an NPRM in the
Federal Register pertaining to this measure.

Transportation Performance Management
GHG Measure Delayed
While the rule took effect on May 20, 2017, certain
portions of the rule pertaining to the GHG measure (the
percent change in CO2 emissions from 2017, generated
by on-road mobile sources on the NHS) have been
delayed indefinitely.
FHWA will be publishing a NPRM in the Federal Register
pertaining to the GHG measure.

Transportation Performance Management
Final Measures: System Performance and Freight
Note: These measures contribute to assessing the National Highway Performance Program
(NHPP) and National Highway Freight Program (NHFP)
Measure Area Performance Measures
Performance of the National Highway System(Subpart E)
• Interstate Travel Time Reliability Measure: Percent of person-miles traveled on the Interstate that are reliable
• Non-Interstate Travel Time Reliability Measure: Percent of person-miles traveled on the non-Interstate NHS that are reliable
Freight Movement on the Interstate System (Subpart F)
• Freight Reliability Measure: Truck Travel Time Reliability (TTTR) Index

Transportation Performance Management
Measure Area Performance Measures
Measures to Assess the CMAQ Program – Traffic Congestion(Subpart G)
• Peak Hour Excessive Delay(PHED) Measure: Annual
Hours of Peak Hour Excessive Delay (PHED) Per
Capita
• Non-Single Occupancy Vehicle Travel (SOV)
Measure: Percent of Non-Single Occupancy
Vehicle (SOV) Travel
Measure to Assess the CMAQ Program – On-Road Mobile Source Emissions (Subpart H)
• Emissions Measure: Total Emissions Reduction
Final Measures: CMAQ Program

FAST Act Implementation Nationally Significant Freight and Highway program provides financial
assistance—competitive grants or credit assistance—to nationally and
regionally significant freight and highway projects that align with the
program goals
The program is funded at $4.5 billion in total over 5 years
FY16 awards for 18 grants totaling nearly $770 million, will be combined
with other funding from federal, state, local, and private sources to
support $3.6 billion in infrastructure investment in 15 states and the
District of Columbia
National Highway Freight Program provides funding for freight projects on
the National Highway Freight Network.
The program provides $6.3 billion in formula funds over five years for
States
Program funding – guidance issued
Freight

FAST Act Implementation Changes to Truck Size and Weight provisions - guidance issued
Critical Urban and Rural Freight Corridor designation process –
guidance issued.
State Freight Plans and State Freight Advisory Committees –
guidance issued November 2016; reviewing Plans for compliance
US DOT working on designation of the National Multimodal
Freight Network
National Strategic Freight Plan –US DOT is working on
completing a final Plan this year
Emergency Route Working Group to determine best practices for
expeditious State approval of special permits for vehicles involved in
emergency response and recovery
Freight

FAST Act Implementation The Fixing America's Surface Transportation Act (FAST Act)
directed the FHWA Administrator to establish a National Highway
Freight Network (NHFN) to strategically direct Federal resources
and policies toward improved performance of highway portions of
the U.S. freight transportation system. The NHFN includes the
following subsystems of roadways:
Primary Highway Freight System (PHFS)
Other Interstate portions not on the PHFS
Critical Rural Freight Corridors (CRFCs)
Critical Urban Freight Corridors (CUFCs)
FHWA working with States and Metropolitan Planning Organizations
on the certification of Critical Urban/Critical Rural Freight
Corridors.
Freight

Other Activities/Assistance Develop and maintain Freight Analysis Framework
Oversee truck size and weight regulatory requirements and
manage truck size and weight research activities
Lead National Truck Parking Coalition and Jason’s Law Survey
Provide freight professional development capacity building
Peer to Peer Program
Talking Freight
Training and Best Practices
Other Research
Freight Fluidity
FRATIS
Border Initiatives
U.S./European Union Urban Goods Movement Twinning Initiative
Freight

Thank You!