Embed Size (px)
Citation preview

ESTIMATED IMPACTS OF THE 2010 CENSUS ON THE TEXAS TRANSIT FUNDING FORMULA: SUMMARY REPORT ON FINDINGS
by
Linda Cherrington Research Scientist
Texas Transportation Institute
and
Suzie Edrington Research Specialist
Texas Transportation Institute
Product 0-6199-P1 Project 0-6199
Project Title: Estimated Impact of the 2010 Census on the Texas Transit Funding Formula
Performed in cooperation with the Texas Department of Transportation
Federal Transit Administration and the
Federal Highway Administration
March 2010 Published: August 2010
TEXAS TRANSPORTATION INSTITUTE
The Texas A&M University System College Station, Texas 77843-3135


iii
DISCLAIMER
This research was performed in cooperation with the Texas Department of Transportation (TxDOT), the Federal Transit Administration (FTA), and the Federal Highway Administration (FHWA). The contents of this report reflect the views of the authors, who are responsible for the facts and the accuracy of the data presented herein. The contents do not necessarily reflect the official view or policies of the FTA, FHWA, or TxDOT. This report does not constitute a standard, specification, or regulation.

iv
ACKNOWLEDGMENTS
This project was conducted in cooperation with TxDOT, FTA, and FHWA.
The authors would like to acknowledge the support and guidance of the TxDOT project director, Karen Dunlap, TxDOT Public Transportation Division (PTN); Eric Gleason, Director, TxDOT-PTN; and members of the Project Monitoring Committee: Kelly Kirkland, Linda Gonzalez, and Maureen McCoy of the Capital Area Metropolitan Planning Organization (CAMPO). The authors appreciate the assistance of TxDOT Research and Technology Implementation (RTI) representatives Duncan Stewart and Sylvia Medina.
The authors would also like to thank Karl Eschbach, Director, and Michael Cline, Research Associate, Institute for Demographic and Socioeconomic Research (IDSER), University of Texas at San Antonio (UTSA) for the population projections by county in Texas, research information, and participation in research discussions.

v
TABLE OF CONTENTS
Page List of Acronyms ........................................................................................................................... ix Chapter 1: Introduction ...................................................................................................................1
Report Purpose ............................................................................................................................ 1 Research Approach ..................................................................................................................... 1 Report Organization .................................................................................................................... 2 Use of Terms ............................................................................................................................... 2
Chapter 2: Change in Population and Land Area by Transit District .............................................3 Projected 2010 Population and Land Area by Transit District ................................................... 3 Population for Limited Eligibility Transit Providers .................................................................. 9 New Urbanized Area Effect on Current Transit Districts ......................................................... 11 Scenarios To Reflect the Impacts of New Urbanized Areas .................................................... 13 Summary ................................................................................................................................... 22
Chapter 3: Impact of Changes in 2010 Population on Funding Formula .....................................23 Texas Transit Funding Formula ................................................................................................ 23 Results for Scenario A: New Small Urbanized Areas .............................................................. 27 Results for Scenario B: Mergers to Large Urbanized Areas ..................................................... 35 Results for Scenario C: Most Likely ......................................................................................... 39 Summary of Funding Analysis by Scenario ............................................................................. 43
Chapter 4: Findings and Key Policy Implications ........................................................................47 Research Findings ..................................................................................................................... 47 Policy Implications for Funding ............................................................................................... 48
References ......................................................................................................................................55 Appendix A: Population and Land Area for Each County ...........................................................59 Appendix B: Population for Each Urbanized Area .......................................................................67 Appendix C: Needs Funding Methodology and Assumptions .....................................................69 Appendix D: Performance Funding Methodology and Assumptions ...........................................71 Appendix E: Scenario A Funding Results ....................................................................................77 Appendix F: Scenario B Funding Results .....................................................................................89 Appendix G: Scenario C Funding Results ....................................................................................99

vi
LIST OF FIGURES
Page Figure 1. 2010 Percent Population Change by Rural Transit District. .......................................... 5 Figure 2. 2010 Absolute Population Change by Rural Transit District. ........................................ 6 Figure 3. Texas Urban Transit Districts. ........................................................................................ 8 Figure 4. Texas Transit Funding Formula. .................................................................................. 24 Figure 5. Scenario A: Urban Transit District State Funding Impact if No New Funds. .............. 30 Figure 6. Scenario A: Rural Transit District State Funding Impact if No New Funds. ............... 34 Figure 7. Scenario A: Rural Transit District Federal Funding Impact if No New Funds. ........... 34 Figure 8. Scenario B: Urban Transit District State Funding Impact if No New Funds. .............. 38 Figure 9. Scenario C: Urban Transit District State Funding Impact if No New Funds. .............. 42

vii
LIST OF TABLES
Page Table 1. Example for Allocation of County Population to Transit Providers. .............................. 3 Table 2. Population and Land Area 2000 and 2010 for Existing Rural Transit Districts. ............. 4 Table 3. Population 2000 and 2010 for Existing Urban Transit Districts. .................................... 7 Table 4. Rural Transit Districts Near Metropolitan Areas with Population Growth. .................... 9 Table 5. Limited Eligibility Population as a Percent of Total Population. .................................. 10 Table 6. Projected 2010 Eligible Population for Limited Eligibility Providers. ......................... 11 Table 7. Scenario A: Population 2000 and 2010 for State Funded Urban Transit Districts. ....... 15 Table 8. Scenario A: Population 2000 and 2010 for Rural Transit Districts. .............................. 16 Table 9. Scenario A: Land Area 2000 and 2010 for Rural Transit Districts (Sq Miles). ............ 17 Table 10. Scenario B: Population 2000 and 2010 for State Funded Urban Transit Districts. ..... 19 Table 11. Scenario C: Population 2000 and 2010 for State Funded Urban Transit Districts. ..... 21 Table 12. Summary of Three Scenarios. ...................................................................................... 22 Table 13. Projected 2010 Limited Eligibility Provider Set-Aside Percent. ................................. 26 Table 14. Scenario A. Urban Transit State Funding Summary of Results. ................................ 28 Table 15. Rural Transit State Funding Summary of Results. ...................................................... 31 Table 16. Rural Transit Federal Funding Summary of Results. .................................................. 32 Table 17. Scenario B. Urban Transit State Funding Summary of Results. ................................ 36 Table 18. Scenario C. Urban Transit State Funding Summary of Results. ................................ 40 Table 19. Urban Transit State Funding Differences from Current Funding. ............................... 44 Table 20. Rural Transit State and Federal Funding Differences from Current Funding. ............ 45 Table 21. Population Increase 2000 to 2010 for Baseline and Each Scenario. ........................... 47 Table 22. Transit Funds per Capita for Baseline and Each Scenario. .......................................... 49 Table 23. Required Funding for New Urbanized Areas. ............................................................. 49 Table 24. Additional Funding to Maintain Baseline per Capita. ................................................. 50 Table 25. Total Funds Required Based on Projected 2010 Population. ...................................... 50 Table 26. Funds Needed to Avoid Negative Impacts after All Reallocation. .............................. 51 Table 27. Percent Urban/Rural Population for State-Funded Transit Districts. .......................... 51


ix
LIST OF ACRONYMS
AACOG Alamo Area Council of Governments ABI Abilene AMA Am arillo ARKT Ark-Tex Council of Governments ASBDC Aspermont Small Business Development Center BCAA Bee Community Action Agency BMT Beaum ont BRWN Brownsville BTD Brazos Transit District CACST Community Act. Council of South Texas CARTS Capital Area Rural Transportation System CCST Community Council of Southwest Texas CCSWT Community Council of Southwest Texas CLEB Cleburne City of CLEBURB Cleburne Urbanized Area COLCO Collin County Committee on Aging CONROE Conroe CONVA Concho Valley Council of Governments CS Community Services, Inc. CS-BRY College Station-Bryan CTRTD Central Texas Rural Transit District CVT Colorado Valley Transit DART Dallas Area Rapid Transit DCTA Denton County Transportation Authority DR Del Rio, City of EPC El Paso, County of ETCOG East Texas Council of Governments FBC Fort Bend County GALV Galveston GCC Gulf Coast Center GCRPC Golden Crescent Regional Planning Commission GEORGE Georgetown HCTD Hill Country Transit District HRL Harlingen HTCG Heart of Texas Council of Governments KART Kaufman Area Rural Transportation KCHS Kleberg County Human Services KIL Killeen LAR Laredo LEP Limited Eligibility Provider LJ-ANG Lake Jackson-Angleton LNG Longview LRGVDC Lower Rio Grande Valley Development Council LUB Lubbock

x
MCA McAllen MCKIN McKinney METRO Metropolitan Transit Authority of Harris County (Houston) MID-ODS Midland-Odessa MTED Mesquite Transportation for the Elderly and Disabled NB New Braunfels NETS Northeast Transportation Services PA Port Arthur PCS Panhandle Community Services PTN TxDOT Public Transportation Division PTS Public Transit Services REAL Rural Economic Assist. League RPMC Rolling Plains Management Corp. SANG San Angelo SCRPT Senior Center Resources and Public Transit Inc. SETRPC South East Texas RPC SHR Sherm an SM San Marcos SPAN Services Program for Aging Needs SPCAA South Plains Comm. Action Assoc. SPI South Padre Island, Town of TAPS Texoma Area Paratransit System The T Fort Worth Transportation Authority TMP Tem ple TTI Texas Transportation Institute TTS The Transit System, Inc. TWOO The Woodlands TXA Texarkana TXC Texas City TxDOT Texas Department of Transportation TYL Tyler VIA San Antonio Via Metropolitan Transit VIC Victoria WACO Waco WEBB Webb Co. Community Action Agency WF W ichita Falls WTO West Texas Opportunities
1
CHAPTER 1: INTRODUCTION
The purpose of the research for Project 0-6199, Estimated Impact of the 2010 Census on the Texas Transit Funding Formula, is to project population growth for the 2010 Census in urbanized and non-urbanized areas in Texas and to identify the impacts on funding allocations using the Texas Transit Funding Formula. This research is a collaborative effort between the Institute for Demographic and Socioeconomic Research (IDSER) at the University of Texas at San Antonio and Texas Transportation Institute (TTI), part of The Texas A&M University System. Researchers completed four major tasks prior to this report. The findings of the previous research are documented in technical memoranda that serve as the background and source of data for this report. Technical Memorandum #1, Assessment of Policies Impacting Public Transportation Funding, reviews legislative and administrative policies and practices for funding public transportation in Texas and discusses the policies that may be affected by the results of the decennial census in 2010. Technical Memorandum #2, Impact of Census 2010 on Population Factors Affecting Apportionment of FTA Funds and on the Designation and Population of Urbanized Areas in Texas, provides a summary of the projected changes in the number of urbanized areas for Texas as well as the projected population for each county and urbanized area for the 2010 Census. Technical Memorandum #3, Assessment of the Impact of Demographic Trends on Public Transportation in Texas, discusses changes in the populations for elderly and persons with disabilities by transit districts in Texas. Technical Memorandum #4: Review of Impacts of Changes in Census Data Reporting provides an overview of the American Community Survey and its relevance to transit funding.
REPORT PURPOSE
The purpose of this report, Estimated Impact of the 2010 Census on the Texas Transit Funding Formula: Summary Report on Findings, is to document the impact of the projections for the 2010 Census on federal and state funding for rural transit districts and the impact on state funding for eligible urban transit districts. Appendices A and B document the IDSER projections of 2010 population and land area for each county and urbanized area (from Technical Memorandum #2).
RESEARCH APPROACH
The research approach for this task relies on the population and land area projections by county and urbanized area by IDSER (see Technical Memorandum #2). Researchers identified the changes in population and land area by transit district for existing rural and urban transit districts. Based upon the allocation of population and land area by transit district, researchers identified how new urbanized areas will affect current transit districts. Researchers developed three population growth scenarios to reflect the possible impacts of new urbanized areas. Researchers applied each of the population growth scenarios to the current Texas transit funding formula to identify the impacts on funding by transit provider. Based up on the outcomes of the funding analysis, researchers documented findings and key policy implications for application of the Texas transit funding formula based on projected changes in population and land area.

2
REPORT ORGANIZATION
This report consists of four chapters. This introduction is the first chapter. Chapter 2 documents the change in population and land area by transit district for existing rural and urban transit districts; identifies how new urbanized areas will affect current rural transit districts; and identifies the development of three population scenarios to reflect the possible impacts of new urbanized areas. Chapter 3 applies each of the population scenarios to the current Texas transit funding formula to identify the impacts on funding by transit provider. Chapter 4 provides discussion of the findings and key policy implications based on the information provided in the previous chapters. The Appendices to this report include information to support the research methodology.
USE OF TERMS
Public transportation is specifically defined in Texas statute to mean “mass transportation of passengers and their hand-carried packages or baggage on a regular and continuing basis by means of surface, fixed guideway, or underground transportation or transit, other than aircraft, taxicab, ambulance, or emergency vehicle” (1). The terms “public transportation” and “transit” are used interchangeably throughout this report. This report specifically focuses on rural and urban transit districts, as defined below.
The term transit district refers to the urban and rural transit providers that are funded by the state. Rural transit districts are defined in Texas statute to mean “a political subdivision of this state that provides and coordinates rural public transportation in its territory.” Rural public transportation serves non-urbanized areas that provide public transportation to communities with populations of less than 50,000. An urban transit district means a local governmental body or political subdivision of this state that operates a public transportation system in an urbanized area with a population of more than 50,000 but less than 200,000. The term also applies to any urban transportation provider that received public transportation money through TxDOT as of September 1, 1994 (prior to the 2000 Census) (1).

3
CHAPTER 2: CHANGE IN POPULATION AND LAND AREA BY TRANSIT DISTRICT
The purpose of this chapter is to document the projected 2010 change in population and land area by transit district for rural transit districts and urban transit districts that are eligible for state funding. The chapter also identifies how new urbanized areas in 2010 will affect current transit districts and develops three scenarios to reflect the possible impacts of new urbanized areas on the allocation of transit funding.
PROJECTED 2010 POPULATION AND LAND AREA BY TRANSIT DISTRICT
As documented in Technical Memorandum #2, IDSER projected 2010 population for each county in Texas. Researchers summarized the Census 2000 and 2010 projections by county as Appendix A and by urbanized area as Appendix B. Researchers used county and urbanized area data from the 2000 Census and the 2010 projections by IDSER to assign county population and land area to each Texas transit district. Table 1 provides an example of the assignment process for Wichita County for the 2010 Census projection. Wichita County is projected to have a population of 127,695 in 2010. Researchers assigned the Wichita Falls urbanized area 2010 population (as provided by IDSER) to the Wichita Falls Transit System (state funded urban transit district) and the remaining non-urbanized area population to Rolling Plains Management Corporation (rural transit district). Researchers used this same process to assign land area projections for each county.
Table 1. Example for Allocation of County Population to Transit Providers.
County Tra nsit Provider
Projected
2010 County Population
Urbanized Non-
Urbanized
Large Urbanized
Area
State Funded Urban Transit District
State Funded Limited
Eligibility Population
State Funded Rural
Transit District
Wichita
Wichita Falls Transit System (Urban)
127,695
96,194
Rolling Plains
Management Corporation - Sharp Lines (Rural)
31,501
Researchers conducted the county by county assignment of population until a picture of the impact of population changes on existing transit districts was complete. Table 2 provides the results of the population and land area change by existing rural transit district. Figure 1 illustrates the projected percent change in population by existing rural transit district, and Figure 2 illustrates the projected absolute change in population by existing rural transit district. Table 2 shows that many rural transit districts have a loss in land area. Urbanized areas are projected to expand in geographic size and therefore reduce the surrounding rural area. For example, the El Paso County rural transit district is expected to decrease in land area by 28 square miles as a result of the growth in the El Paso urbanized area. Despite the loss of the urbanized land area, the majority of rural areas continue to experience net population growth.

4
Table 2. Population and Land Area 2000 and 2010 for Existing Rural Transit Districts. Sorted by Percent Population Change
Rural Transit Districts Population Land Area (Sq. Miles)
2000 2010 Change Percent 2000 2010 Change Percent
Rural Totals 5,762,803 6,766,971 1,004,168 17% 251,954
251,583 (371) 0. 1% El Paso, County of 31,157 59,174 28,017 90% 809 781 (28) -3.5% Collin County COA 56,516 100,216 43,700 77% 689 650 (39) -5.7% Webb Co. CAA 17,531 30,388 12,857 73% 3,314 3,313 (2) -0.1% Kaufman Area RT 82,737 132,068 49,331 60% 896 886 (10) -1.1% SPAN 62,453 99,474 37,021 59% 748 711 (37) -5.0% CARTS 427,869 633,043 205,174 48% 7,192 7,137 (55) -0.8% Fort Bend County 37,891 50,701 12,810 34% 747 705 (43) -5.7% Transit System Inc., The 47,909 63,252 15,343 32% 609 609 - 0.0% Alamo Area COG 392,995 501,680 108,685 28% 10,130 10,121 (9) -0.1% Cleburne City of 103,238 130,161 26,923 26% 710 707 (3) -0.4% Community Services, Inc. 135,414 170,698 35,284 26% 1,924 1,921 (3) -0.2% Public Transit Services 117,544 141,657 24,113 21% 2,765 2,763 (2) -0.1% Community Act. CST 84,180 100,195 16,015 19% 5,149 5,149 - 0.0% LRGV DC 122,660 144,271 21,611 18% 2,641 2,614 (27) -1.0% Snr Ctr Res. & Public Tr. 76,596 89,977 13,381 17% 841 841 - 0.0% Brazos Transit District 798,164 928,675 130,511 16% 16,910 16,865 (45) -0.3% Colorado Valley Transit 117,124 135,438 18,314 16% 3,220 3,220 (0) 0.0% Hill Country Transit Dist. 155,387 179,046 23,659 15% 8,321 8,313 (7) -0.1% Texoma Area Para. Syst. 200,664 226,167 25,503 13% 5,601 5,599 (2) 0.0% Del Rio, City of 44,856 50,067 5,211 12% 3,170 3,170 - 0.0% Gulf Coast Center 102,725 114,403 11,678 11% 1,570 1,545 (25) -1.6% CC of Southwest Texas 109,525 120,725 11,200 10% 11,138 11,138 - 0.0% East Texas COG 565,616 624,278 58,662 10% 9,613 9,607 (6) -0.1% Bee Community AA 75,844 82,047 6,203 8% 4,051 4,051 - 0.0% South Padre Island 2,422 2,627 205 8% 2 2 - 0.0% Heart of Texas COG 168,338 180,734 12,396 7% 5,478 5,473 (5) -0.1% Golden Crescent RPC 160,333 169,456 9,123 6% 7,088 7,087 (1) 0.0% Central Texas Rural TD 184,925 195,080 10,155 5% 10,693 10,690 (3) 0.0% Panhandle Comm. Serv. 223,550 235,286 11,736 5% 25,749 25,744 (4) 0.0% REAL 96,923 102,017 5,094 5% 2,491 2,491 (0) 0.0% Ark-Tex COG 221,701 230,739 9,038 4% 5,761 5,761 (1) 0.0% Concho Valley COG 56,505 58,541 2,036 4% 15,309 15,309 (1) 0.0% Kleberg County HS 31,963 32,460 497 2% 2,328 2,328 - 0.0% South Plains CAA 201,705 206,432 4,727 2% 15,342 15,337 (5) 0.0% West Texas Opportunities 190,752 195,180 4,428 2% 44,056 44,053 (3) 0.0% Rolling Plains MC. 86,084 85,719 (365) 0% 6,553 6,553 (0) 0.0% Aspermont SBDC 39,877 39,478 (399) 0% 6,317 6,317 - 0.0% South East Texas RPC 131,130 125,421 (5,709) -4% 2,027 2,023 (3) -0.2%

5
Figure 1. 2010 Percent Population Change by Rural Transit District.

6
Figure 2. 2010 Absolute Population Change by Rural Transit District.

7
Table 3 provides the change in population and land area for each existing urban transit district that is eligible to receive state funding. The transit districts with a population over 200,000 are identified by a note because of the significance for funding allocation (see discussion in Chapter 3). The population projections are not precise. A population change of ±2.5 percent for any urbanized area is assumed to reflect no change in population (0%). Figure 3 is a map of metropolitan transit authorities and state funded urban transit districts in Texas.
Table 3. Population 2000 and 2010 for Existing Urban Transit Districts.
Population by State Funded Urban Transit District Sorted by Percent Population Change
2000 Projected
2010 Change Percent Notes Urban Totals 3, 356,007 4, 094,827 73 8,820 22% McKinney 54,525 145,824 91,299 167% The Woodlands 89,445 180,880 91,435 102% McAllen 523,144 739,217 216,073 41% >200,000 Brownsville 165,776 214,428 48,652 29% >200,000 Laredo 175,586 227,202 51,616 29% >200,000 Tyler 101,494 125,471 23,977 24% Temple 71,937 86,175 14,238 20% Harlingen 110,770 132,033 21,263 19% Killeen 167,976 200,475 32,499 19% >200,000 College Station-Bryan 132,500 151,722 19,222 15% Texas City 96,417 110,875 14,458 15% Amarillo 179,312 201,289 21,977 12% >200,000 Midland – Odessa 210,616 235,546 24,930 12% >200,000 Lubbock 202,225 223,853 21,628 11% >200,000 Sherman 56,168 62,140 5,972 11% Texarkana 48,767 53,987 5,220 11% Waco 153,198 170,155 16,957 11% Lake Jackson-Angleton 73,416 78,789 5,373 7% Longview 78,070 83,225 5,155 7% Victoria 61,529 65,378 3,849 6% Abilene 107,041 112,253 5,212 5% Beaumont 139,304 140,223 919 0% Port Arthur 114,656 114,274 (382) 0% San Angelo 87,969 87,710 (259) 0% Galveston (a) 54,770 54,240 (530) 0% Wichita Falls 99,396 97,463 (1,933) 0%
(a) Estimate based on trends before Hurricane Ike

8
Figure 3. Texas Urban Transit Districts.

9
The data show significant population growth in the rural transit districts surrounding major metropolitan areas and along the Texas border with Mexico. Rural areas surrounding many of the metropolitan areas are growing at a rate faster than the metropolitan area. Table 4 shows the rural transit districts that are growing faster than the immediate surrounding metropolitan area.
Table 4. Rural Transit Districts Near Metropolitan Areas with Population Growth. Urbanized Area (UZA) and Rural Transit District
Census 2000
Projected 2010 Change Percent
Dallas - Ft Worth – Arlington UZA 4,145,659 5,115,000 969,341 23 %
Collin County Committee on Aging 56,516 100,216 43,700 77% Kaufman Area Rural Transit 82,737 132,068 49,331 60% Cleburne, City of 103,238 130,161 26,923 26% Community Services Incorporated 135,414 170,698 35,284 26%
Laredo UZA 175,586 227,000 51,414 29 % Webb Community Action Assoc. 17,531 30,388 12,857 73%
El Paso UZA 648,465 714,000
65,535 10 % El Paso County 31,157 59,174 28,017 90%
Houston UZA 3,822,509 4,831,000 1,008,491 26 % Fort Bend County 37,891 50,701 12,810 34%
Austin UZA 901,920 1,183,000
281,080 31 % Capital Area Rural Transp. Sys. 427,869 633,043 205,174 48%
San Antonio UZA 1,327,554 1,567,000
239,446 18 % Alamo Area COG 392,995 501,680 108,685 28%
POPULATION FOR LIMITED ELIGIBILITY TRANSIT PROVIDERS
There are four transit providers in Texas located in the Dallas-Fort Worth-Arlington urbanized area that are designated as “limited eligibility providers”—Arlington, Northeast Transportation Services (NETS), Grand Prairie, and Mesquite. These transit providers restrict transit eligibility to seniors and persons with disabilities. Limited eligibility providers are grandfathered to be funded by the state in Texas Transportation Code, Chapter 456 under § 456.006 (b) entitled “Limitations Use of Funds.” This statute calls out limits and conditions on “designated recipients not included in a transit authority but located in an urbanized area that includes one or more transit authorities and that received state transit funding during the biennium ending August 31, 1997” [Arlington, NETS, Grand Prairie, Mesquite]. The Texas transit funding formula allocates urban transit funds to limited eligibility transit providers by setting aside a portion of urban funds. The set aside amount is based on the populations of seniors and persons with disabilities in these four service areas, as compared to

10
the total urban population in the urban areas eligible for state funds for transit. Population of seniors is defined as population age 65 and older as reported by the U.S. Census. A person with a disability is an individual ages 5 to 64 with a U.S. Census defined disability (2). TxDOT currently sets aside 6.58 percent of urban funds for limited eligibility providers based on the Census 2000 eligible population calculation. There are two issues that suggest this percent estimate is not correct. Researchers discovered that when the Texas transit funding formula was first applied for limited eligibility providers (in 2006) the eligible population for persons with disabilities was based on a Census 2000 report that tallies disabilities rather than persons with disabilities. This creates an inflated number to represent the eligible population served by limited eligibility providers. Another issue is the U.S. Census has determined that disabilities were likely over-reported in Census 2000 due to possible misinterpretation of written instructions in the mail survey. As a result, the Census changed the order in which questions about disabilities were asked and added additional instructions. The American Community Survey (ACS) for 2006–2008 now captures this change for larger populations (65,000 and over). The ACS made additional changes in the data collection instrument to document persons with disabilities in 2008. Preliminary indications are that the number of persons with disabilities as of ACS 2010 data may be a lower than Census 2000. Chapter 4 discusses the impact of this possibility. ACS data for age is not yet reported at a level of detail to make it possible to estimate 2010 percent of persons age 65 or older for each of the cities served by NETS. These data will be available with ACS 5-year data for 2005–2010 when published. For purposes of this report, researchers revised the source of the data to estimate the eligible population for limited eligibility providers. This research assumes the ACS 2006 through 2008 populations for persons with disabilities ages 5 to 64, and Census 2000 data for persons age 65 and older. For projected 2010 population scenarios developed in this report, researchers used the revised source data to first calculate the percent of eligible population to total population for each of the limited eligibility providers (see Table 5).
Table 5. Limited Eligibility Population as a Percent of Total Population.
Provider Original
Calculation
Revised Calculation
Persons Age 65 and older
(Census 2000)
Persons with Disabilities Age 5-64
(ACS 2006-2008) Revised Eligible
Population
Arlington 25.9% 7.17% 12 .09% 19.3% Grand Prairie 29.8% 7.11% 14 .09% 21.2% Mesquite 27.5% 7.95% 12 .13% 20.1% NETS 24.8% 9.66% 10 .28% 19.9%

11
Using IDSER projected 2010 populations for the cities served by the four limited eligibility transit providers, researchers applied the revised eligible population percent to project the 2010 eligible population as shown in Table 6.
Table 6. Projected 2010 Eligible Population for Limited Eligibility Providers.
Limited Eligibility Providers
2000 Total Population
2000
Eligible Population
Projected 2010 Total Population
Projected Percent Eligible
Population
Projected 2010
Eligible Population
Arlington 3 35,164 86,396 387,086 19.3 74,561 Grand Prairie 126,889 37,995 154,157 21.2 32,673 Mesquite 1 23,800 34,209 136,565 20.1 27,424 NETS 3 13,030 77,713 341,014 19.9 68,002 Total Limited Eligibility Providers 898,883 236,313 1,018,822 19.9 202,660
NEW URBANIZED AREA EFFECT ON CURRENT TRANSIT DISTRICTS
After the initial assignment of population and land area to existing transit districts, researchers reviewed the implications of changes in population in high growth areas for transit providers. Researchers conducted an initial screening for areas near urbanized thresholds of 50,000 (small urbanized areas), 200,000 (large urbanized areas), and 1 million (very large urbanized areas). New urbanized areas may have a significant impact on the application of the state transit funding formula. The impacts are different depending on if areas of high population growth become new small urbanized areas or if the areas become part of the existing metropolitan areas:
• new small urbanized areas over 50,000 in population: • more eligible state funded urban transit districts, • decreased population for the rural transit districts;
• rapidly urbanizing rural areas merge into large urbanized areas: • eligible state funded urban transit districts merge into a large urbanized areas that
are not eligible for state funding, and • decreased population and land area for the rural transit districts.
IDSER identified areas that are most likely to reach the 50,000 population threshold and become a new urbanized area or merge into a nearby large urbanized area. These areas include:
• Cleburne, • Conroe, • Georgetown, • New Braunfels, and • San Marcos-Kyle.

12
IDSER also identified three existing small urbanized areas that may merge in total or in part into a nearby large urbanized area. These areas include:
• McKinney, • The Woodlands, and • Texas City-La Marque.
Cleburne
The Cleburne area is expected to grow from Census 2000 population of 36,863 to 52,000 in 2010. IDSER projects the Cleburne population will exceed the 50,000 threshold and become a new small urbanized area. There is a possibility that all or parts of the Cleburne urban area could merge with Dallas-Fort Worth-Arlington (DFWA) via a jump connection to Burleson.
Conroe
The Conroe area is expected to grow from Census 2000 population of 41,402 to 58,000 in 2010. IDSER projects most likely Conroe will become a new small urbanized area. Concentrations of population outside of the main Conroe area close to The Woodlands were considered part of the Conroe Urban Cluster in 2000 via a jump connection along Interstate Highway 45 (I-45). These areas are separated by a flood plain that restricts the connections between the areas by a jump or hop connection. If the current hop or jump connection criteria continue, then Conroe and The Woodlands areas will remain separate with Conroe meeting the 50,000 population threshold.
Georgetown
The Georgetown area is expected to grow from Census 2000 population of 32,763 to 59,000 in 2010. The distance between Georgetown and Austin is over 2.5 miles and the gap is projected to remain assuming the urban area criteria remain the same as 2000. IDSER projects that most likely these two areas will remain separate and Georgetown will become a new small urbanized area.
New Braunfels
The New Braunfels area population is expected to grow from Census 2000 population of 39,709 to 62,000 in 2010. The potential for merger with San Antonio is unlikely due to the distance between the two urban areas. IDSER projects that most likely New Braunfels will remain separate from San Antonio and become a new small urbanized area.
San Marcos
The San Marcos-Kyle population is expected to grow from Census 2000 of 47,333 to 79,000 in 2010. The distance between the Census 2000 designated urban areas of San Marcos-Kyle and Austin is over five miles. The possibility of San Marcos-Kyle being connected to Austin could only occur through a series of contiguous blocks of 500 or more persons per square miles. IDSER projects that most likely San Marcos-Kyle will remain separate from Austin and become a new small urbanized area.

13
McKinney
The McKinney area population is expected to grow from the Census 2000 population of 54,525 to 147,000 in 2010. McKinney could link to DFWA if the development to the west and south of McKinney consists of more than a hop, jump, or point-to-point connection. Otherwise if the two areas connect as a result of a hop, jump, or point-to-point connection, then these areas would remain separate. IDSER makes the projection that McKinney will most likely merge with DFWA.
The Woodlands
The Woodlands area population is expected to grow from Census 2000 population of 89,445 to 183,000 in 2010. In Census 2000, The Woodlands and Houston were considered two urbanized areas because the urbanized areas were separated by the flood plain along Spring Creek and the only connection between the two was through a point-to-point connection. In 2010, The U.S. Census Bureau may use ancillary information including employment and land use data to connect these two areas rather than limiting the separation by the flood plain between the two areas. If these data are used, then The Woodlands and Houston could merge. IDSER projects that most likely The Woodlands will not merge with Houston in 2010.
Texas City
The Texas City-La Marque area population is expected to grow from Census 2000 population of 96,417 to 111,000 in 2010. In Census 2000 Texas City-La Marque was split from Houston by a point-to-point connection and consisted of two population cores (cities of Dickinson and Santa Fe) connected via a point-to-point connection within the Texas City-La Marque urbanized area. Residential development between the area of Houston and Texas City-La Marque has occurred since 2000. IDSER projects that most likely the Dickinson portion of Texas City-La Marque will merge with Houston.
SCENARIOS TO REFLECT THE IMPACTS OF NEW URBANIZED AREAS
Based on documentation provided by IDSER, researchers identified two scenarios that are significant to transit funding:
• Scenario A. New Small Urbanized Areas and • Scenario B. Mergers to Large Urbanized Areas.
Both of the scenarios are defined to reflect a distinction in the probable impact on the Texas transit funding formula. Scenario A assumes the rapidly urbanizing rural areas become small urbanized areas, eligible for state urban funds. Scenario B assumes the rapidly urbanizing rural areas will become part of large urbanized areas, no longer eligible for state transit funding. In the case of scenarios, population and land area that were rural after Census 2000 will be urbanized in 2010. The impact on rural population and land area is the same for both scenarios.

14
Scenario A
For Scenario A, researchers estimated the maximum number of possible state funded urban transit districts based on projected new urbanized areas in 2010 as provided by IDSER. Scenario A includes the following possible new urban transit districts:
• Cleburne (affects Cleburne Rural Transit District), • Conroe (affects Brazos Rural Transit District), • Georgetown (affects Capital Area Rural Transportation System), • New Braunfels (affects Alamo Area Council of Governments), and • San Marcos-Kyle (affects Capital Area Rural Transportation System).
Table 7 documents 2000 and 2010 population for urbanized transit districts, including five new small urbanized areas. The population projections are not precise. A population change of ±2.5 percent for any urbanized transit district is assumed to reflect no change in population (0 percent). Table 8 documents 2000 and 2010 population for rural transit districts after the new urbanized areas are recognized. Table 9 provides the same information as Table 8 but for the land area (rather than population) for rural transit districts. Many rural transit districts have a decrease in land area as portions of the rural areas become urbanized. However, most rural transit districts that have a decrease in land area in Table 9 still show an increase in population in Table 8. This is because the population increase in the remaining rural area is greater than the population in the areas that are reclassified as urbanized in Scenario A. There is a net increase in population in the (smaller) rural area.

15
Table 7. Scenario A: Population 2000 and 2010 for State Funded Urban Transit Districts.
State Funded Urban System 2000 Projected
2010 Change Percent Notes
Current Urban Transit Districts: Abilene 10 7,041 112,253 5,212 5 Amarillo 1 79,312 201,289 21,977 12 >200,000 Beaumont 1 39,304 140,223 919 0 Brownsville 1 65,776 214,428 48,652 29 >200,000 College Station-Bryan 132,500 151,722 19,222 15 Galveston (a) 5 4,770 54,240 (530) 0 Harlingen 1 10,770 132,033 21,263 19 Killeen 1 67,976 200,475 32,499 19 >200,000 Laredo 1 75,586 227,202 51,616 29 >200,000 Lake Jackson-Angleton 73,416 78,789 5,373 7 Longview 7 8,070 83,225 5,155 7 Lubbock 2 02,225 223,853 21,628 11 >200,000 McAllen 5 23,144 739,217 216,073 41 >200,000 McKinney 5 4,525 145,824 91,299 167 Midland-Odessa 2 10,616 235,546 24,930 12 >200,000 Port Arthur 114,656 114,274 (382) 0 San Angelo 87,969 87,710 (259) 0 Sherman 5 6,168 62,140 5,972 11 Temple 7 1,937 86,175 14,238 20 The Woodlands 89,445 180,880 91,435 102 Texarkana 4 8,767 53,987 5,220 11 Texas City 96,417 110,875 14,458 15 Tyler 1 01,494 125,471 23,977 24 Victoria 6 1,529 65,378 3,849 6 Waco 1 53,198 170,155 16,957 11 Wichita Falls 99,396 97,463 (1,933) 0 State Funded Urban Totals 3,356,007 4,094,827 738,820 22 Possible New Urban Transit Districts: Cleburne - 51,866 51,866 100 Conroe - 58,417 58,417 100 Georgetown - 58,851 58,851 100 New Braunfels - 62,419 62,419 100 San Marcos-Kyle - 79,748 79,748 100
Revised State Funded Urban Totals 3,356,007 4, 406,128 1,050,121 31
Limited Eligibility Providers Arlington 8 6,396 74,561 Grand Prairie 37,995 32,673 Mesquite 3 4,209 27,424 NETS 7 7,713 68,002 Total Limited Eligibility 236,313 202,660 (33,653) (14) >200,000
Total Urban and Limited Eligibility 3,592,320 4,608,788 1,016,468 28 (a) Estimate based on trends before Hurricane Ike

16
Table 8. Scenario A: Population 2000 and 2010 for Rural Transit Districts. Current Rural Transit District 2000
Projected 2010 Change Percent
Impacted by New UZA
Alamo Area COG 392,995 439,261 46,266 12% New Braunfels Ark-Tex COG 221,701 230,739 9,038 4% Aspermont Small Bus. Dvlpmt Ctr. 39,877 39,478 (399) 0% Bee Community Action Agency 75,844 82,047 6,203 8% Brazos Transit District 798,164 870,258 72,094 9% Conroe
Capital Area Rural Transportation System 427,869 494,444 66,575 16% San Marcos-Kyle and Georgetown
Central Texas Rural Transit District 184,925 195,080 10,155 5% Cleburne City of 103,238 78,295 (24,943) -24% City of Cleburne Collin County Committee on Aging 56,516 100,216 43,700 77% Colorado Valley Transit 117,124 135,438 18,314 16% Community Act. Council of South Texas 84,180 100,195 16,015 19% Community Council of Southwest Texas 109,525 120,725 11,200 10% Community Services, Inc. 135,414 170,698 35,284 26% Concho Valley COG 56,505 58,541 2,036 4% Del Rio, City of 44,856 50,067 5,211 12% East Texas COG 565,616 624,278 58,662 10% El Paso, County of 31,157 59,174 28,017 90% Fort Bend County 37,891 50,701 12,810 34% Golden Crescent RPC 160,333 169,456 9,123 6% Gulf Coast Center 102,725 114,403 11,678 11% Heart of Texas COG 168,338 180,734 12,396 7% Hill Country Transit District 155,387 179,046 23,659 15% Kaufman Area Rural Transportation 82,737 132,068 49,331 60% Kleberg County Human Services 31,963 32,460 497 2% Lower Rio Grande Valley Dev. Council 122,660 144,271 21,611 18% Panhandle Community Services 223,550 235,286 11,736 5% Public Transit Services 117,544 141,657 24,113 21% Rolling Plains Management Corp. 86,084 85,719 (365) 0% Rural Economic Assist. League 96,923 102,017 5,094 5% Services Program for Aging Needs 62,453 99,474 37,021 59% Snr. Center Res. & Public Transit Inc. 76,596 89,977 13,381 17% South East Texas RPC 131,130 125,421 (5,709) -4% South Padre Island, Town of 2,422 2,627 205 8% South Plains Comm. Action Assoc. 201,705 206,432 4,727 2% Texoma Area Paratransit System 200,664 226,167 25,503 13% Transit System Inc., The 47,909 63,252 15,343 32% Webb Co. Community Action Agency 17,531 30,388 12,857 73% West Texas Opportunities, Inc. 190,752 195,180 4,428 2% Rural Totals 5,762,803 6,455,670 692,867 12%

17
Table 9. Scenario A: Land Area 2000 and 2010 for Rural Transit Districts (Sq Miles).
Current Rural Transit District 2000
Projected 2010 Change Percent
Impacted by New/Merged or Expanded UZA
Alamo Area COG 10,130 10,090 (40) -0.4% SA, New Braunfels Ark-Tex COG 5,761 5,761 (1) 0.0% Texarkana Aspermont Small Bus. Dvlpmt Ctr. 6,317 6,317 - 0.0% Bee Community Action Agency 4,051 4,051 - 0.0% Brazos Transit District 16,910 16,835 (75) -0.4% CS-B, TWO, Conroe Capital Area Rural Transportation System 7,192 7,082 (110) -1.5%
Austin, Georgetown San Marcos-Kyle
Central Texas Rural Transit District 10,693 10,690 (3) 0.0% Abilene Cleburne City of 710 677 (33) -4.6% Cleburne Collin County Committee on Aging 689 650 (39) -5.7% McKinney Colorado Valley Transit 3,220 3,220 (0) 0.0% Community Act. Council of South Texas 5,149 5,149 - 0.0% Community Council of Southwest Texas 11,138 11,138 - 0.0% Community Services, Inc. 1,924 1,921 (3) -0.2% DFWA Concho Valley COG 15,309 15,309 (1) 0.0% San Angelo Del Rio, City of 3,170 3,170 - 0.0% East Texas COG 9,613 9,607 (6) -0.1% Tyler, Longview El Paso, County of 809 781 (28) -3.5% El Paso Fort Bend County 747 705 (43) -5.7% Houston Golden Crescent RPC 7,088 7,087 (1) 0.0% Victoria Gulf Coast Center 1,570 1,545 (25) -1.6% Texas City, LJ-A Heart of Texas COG 5,478 5,473 (5) -0.1% Waco Hill Country Transit District 8,321 8,313 (7) -0.1% Killeen, Temple Kaufman Area Rural Transportation 896 886 (10) -1.1% DFWA Kleberg County Human Services 2,328 2,328 - 0.0%
Lower Rio Grande Valley Dev. Council 2,641 2,614 (27) -1.0% McAllen, Hgn Brownsville
Panhandle Community Services 25,749 25,744 (4) 0.0% Amarillo Public Transit Services 2,765 2,763 (2) -0.1% DFWA Rolling Plains Management Corp. 6,553 6,553 (0) 0.0% Rural Economic Assist. League 2,491 2,491 (0) 0.0% Services Program for Aging Needs 748 711 (37) -5.0% Denton-Lewisville Snr Center Res. & Public Transit Inc. 841 841 - 0.0% South East Texas RPC 2,027 2,023 (3) -0.2% Beaumont South Padre Island, Town of 2 2 - 0.0% South Plains Comm. Action Assoc. 15,342 15,337 (5) 0.0% Lubbock Texoma Area Paratransit System 5,601 5,599 (2) 0.0% Sherman-Denison Transit System Inc., The 609 609 - 0.0% Webb Co. Community Action Agency 3,314 3,313 (2) -0.1% Laredo West Texas Opportunities, Inc. 44,056 44,053 (3) 0.0% Midland-Odessa
Rural Totals 251,954 251,437 (516) -0.2%

18
With the addition of five new urban transit districts in Scenario A, the total number of state funded urban transit districts increases from 30 current to 35. Four additional state funded urban transit districts are estimated to increase in population to more than 200,000, increasing the number of large urban areas eligible for state funding, as shown in Table 7. In Scenario A, the number of rural transit districts remains at 38. The addition of the five new state funded urban transit districts in Scenario A does not affect the total number of rural transit districts but does reduce the population in the rural transit districts affected. As shown in Table 8, three of four rural transit districts that lose some population due to the new small urbanized areas (Alamo Area Council of Governments, Capital Area Rural Transportation System, and Brazos Transit District) are projected to experience population growth despite the loss of an urbanized area. A portion of Cleburne County will remain as a rural area even after the creation of a new Cleburne urbanized area; the overall population and land area for rural Cleburne County is significantly smaller due to the new urban transit district. Table 9 documents land area loss for several rural transit districts (in addition to the four rural transit districts affected by the new urbanized areas). This loss of land area is due to the fact that IDSER projects that urbanized areas will grow (land area and population) into the rural transit district boundaries. For example, the urbanized area for the City of El Paso is expected to increase by 28 square miles into the El Paso County rural transit district.
Scenario B
For Scenario B, researchers assumed the maximum number of possible mergers of transit districts into large urbanized areas based on the information provided by IDSER. Scenario B includes the following potential mergers that impact state funded urban and rural transit districts:
• Merged areas that are currently state funded urban transit districts: • The Woodlands with Houston, • McKinney with DFWA, • Partial Texas City (Dickinson) with Houston;
• Merged areas that are currently a part of rural transit districts:
• Cleburne with DFWA, • Conroe with The Woodlands and Houston, • Georgetown with Austin, • New Braunfels with San Antonio, and • San Marcos with Austin.
Table 10 provides the outcome of Scenario B projected population for state funded urban transit districts. The change in rural transit districts is the same across all scenarios (see Table 8 and Table 9 for rural transit districts).

19
Table 10. Scenario B: Population 2000 and 2010 for State Funded Urban Transit Districts.
State Funded Urban System 2000 Projected
2010 Change Percent Impacted by Merger
to Large UZA Abilene 10 7,041 112,253 5,212 5 Amarillo 1 79,312 201,289 21,977 12 Beaumont 1 39,304 140,223 919 1 Brownsville 1 65,776 214,428 48,652 29 College Station-Bryan 132,500 151,722 19,222 15 Galveston (a) 54,770 5 4,240 (530) -1 Harlingen 1 10,770 132,033 21,263 19 Killeen 1 67,976 200,475 32,499 19 Laredo 1 75,586 227,202 51,616 29 Lake Jackson-Angleton 73,416 78,789 5,373 7 Longview 7 8,070 83,225 5,155 7 Lubbock 2 02,225 223,853 21,628 11 McAllen 5 23,144 739,217 216,073 41 McKinney 5 4,525 - (54,525) -100 DFWA Midland - Odessa 210,616 235,546 24,930 12 Port Arthur 114,656 114,274 (382) 0 San Angelo 87,969 87,710 (259) 0 Sherman 5 6,168 62,140 5,972 11 Temple 7 1,937 86,175 14,238 20 The Woodlands 89,445 - (89,445) -100 Houston Texarkana 4 8,767 53,987 5,220 11 Texas City 96,417 79,122 (17,295) -18 Dickinson to Houston Tyler 1 01,494 125,471 23,977 24 Victoria 6 1,529 65,378 3,849 6 Waco 1 53,198 170,155 16,957 11 Wichita Falls 99,396 97,463 (1,933) -2
State Funded Urban Totals 3,356,007 3,736,370 380,363 11 New Urbanized Areas: Cleburne n/a 0 DFWA Conroe n/ a 0 Houston Georgetown n/ a 0 Austin New Braunfels n/ a 0 San Antonio San Marcos-Kyle n/a 0 Austin Limited Eligibility Providers Arlington 8 6,396 74,561 Grand Prairie 37,995 32,673 Mesquite 3 4,209 27,424 NETS 7 7,713 68,002 Total Limited Eligibility 236,313 202,660 (33,653) (14) Total Urban and Limited Eligibility 3 ,592,320 3,939,030 346,710 10
(a) Estimate based on trends before Hurricane Ike

20
In Scenario B, researchers analyze the impact of the merger of areas located in current small urbanized areas into large urbanized areas as a result of Census 2010. Three current state funded urban transit districts are assumed to merge into large urbanized areas (McKinney, The Woodlands, and part of Texas City). These mergers have the impact of reducing the total number of state urban transit districts from the existing 30 to 28 (only a portion of Texas City is merged). For the five newly urbanized areas that are currently a part of rural transit districts, these mergers have the impact of decreasing population and land area for existing rural transit districts, with no change in the number of rural transit districts. The same changes occur for rural transit districts in Scenarios A and B. The same population and land area move to state funded urban transit districts in Scenario A or move to large urbanized areas in Scenario B.
Scenario C
Actual population changes may include both new small urbanized areas and mergers into larger urbanized areas. IDSER projected the most likely changes in urbanized areas for 2010, including the most likely new urbanized areas and most likely mergers to large urbanized areas. Scenario C represents the most likely change in population and land area for state funded transit districts as follows:
• Most likely new state funded urban transit districts: • Cleburne, • Conroe, • Georgetown, • New Braunfels, • San Marcos-Kyle;
• Most likely mergers with large urbanized areas: • McKinney with DFWA and • Partial Texas City (Dickinson) with Houston.
The impacts on rural population and land area are the same for Scenario C as Scenarios A and B. Table 11 provides the outcome of Scenario C projected population for state funded urban transit districts. Rural transit district change is the same across all scenarios (see Table 8 and Table 9 for Rural Transit Districts).

21
Table 11. Scenario C: Population 2000 and 2010 for State Funded Urban Transit Districts.
(a) Estimate based on trends before Hurricane Ike
State Funded Urban System 2000 Projected
2010 Change Percent Merged to Large UZA Current Urban Transit Districts: Abilene 10 7,041 112,253 5,212 5 Amarillo 1 79,312 201,289 21,977 12 Beaumont 1 39,304 140,223 919 1 Brownsville 1 65,776 214,428 48,652 29 College Station-Bryan 132,500 151,722 19,222 15 Galveston (a) 5 4,770 54,240 (530) -1 Harlingen 1 10,770 132,033 21,263 19 Killeen 1 67,976 200,475 32,499 19 Laredo 1 75,586 227,202 51,616 29 Lake Jackson-Angleton 73,416 78,789 5,373 7 Longview 7 8,070 83,225 5,155 7 Lubbock 2 02,225 223,853 21,628 11 McAllen 5 23,144 739,217 216,073 41 McKinney 5 4,525 (54,525) -100 Merge to DFWA Midland-Odessa 2 10,616 235,546 24,930 12 Port Arthur 114,656 114,274 (382) 0 San Angelo 87,969 87,710 (259) 0 Sherman 5 6,168 62,140 5,972 11 Temple 7 1,937 86,175 14,238 20 The Woodlands 89,445 180,880 91,435 102 Texarkana 4 8,767 53,987 5,220 11 Texas City 96,417 79,122 (17,295) -18 Dickinson to Houston Tyler 1 01,494 125,471 23,977 24 Victoria 6 1,529 65,378 3,849 6 Waco 1 53,198 170,155 16,957 11 Wichita Falls 99,396 97,463 (1,933) -2 State Funded Urban Totals 3,356,007 3,917,250 561,243 17 Possible New Urban Transit Districts: Cleburne - 51,866 51,866 100 Conroe - 58,417 58,417 100 Georgetown - 58,851 58,851 100 New Braunfels - 62,419 62,419 100 San Marcos-Kyle - 79,748 79,748 100 Revised State Funded Urban Totals 3, 356,007 4,228,551 872,544 26 Limited Eligibility Providers Arlington 8 6,396 74,561 Grand Prairie 37,995 32,673 Mesquite 3 4,209 27,424 NETS 7 7,713 68,002 Total Limited Eligibility 236,313 202,660 (33,653) (14) Total Urban and Limited Eligibility 3 ,592,320 4,431,211 838,891 23

22
The addition of these five new urban transit districts and the merger of McKinney to DFWA and partial Texas City to Houston change the total number of state funded urban transit districts from 30 to 34. The merger of the two small urbanized areas to large urbanized areas does not affect the number of rural transit districts or the rural population and land area. The rural transit district changes in Scenario C are the same as Scenarios A and B.
SUMMARY
Table 12 provides a summary of the population and land area allocations to rural transit districts and state funded urban transit districts for each of three scenarios:
• Scenario A. New Small Urbanized Areas, • Scenario B. Mergers to Large Urbanized Areas, and • Scenario C. Most Likely.
Scenario A and Scenario B are developed to reflect a distinction in the probable impact of new small urbanized areas and mergers of areas into large urbanized areas. Scenario A provides the impact of rural areas becoming small urbanized and therefore eligible for state urban funds. Scenario B provides the impact of existing rural or urban transit districts becoming part of large urbanized areas and no longer supported by state funding for transit. Scenario C provides a most likely scenario as defined by IDSER and includes both new small urbanized areas and mergers into larger urbanized areas. In all three scenarios, the impact on rural transit districts is the same with rural transit districts remaining at a total of 38 and a population increase of 12 percent. For state funded urban transit districts, Scenario A has the greatest number of urban transit districts and the greatest increase in population, 31 percent. Scenario B results in the least number of urban transit districts and the least increase in population, 11 percent. Although limited eligibility provider total area population grows by 13 percent, eligible population decreases 14 percent due to the revised eligible population calculation for persons with disabilities.
Table 12. Summary of Three Scenarios.
State Funded
No. of Transit
Providers 2000
Population
Projected 2010
Population Change Percent Urban Transit Districts Scenario A 31 3,356,007 4,406,128 1,050,121 31% Scenario B 24 3,356,007 3,736,370 380,363 11% Scenario C 30 3,356,007 4,228,551 872,544 26% Limited Eligibility Providers All Scenarios Total Population 4 898,883 1,018,822 119,939 13% Eligible Population Only 2 36,313 202,660 (33,653) (14%) Rural Transit Districts All Scenarios 38 5,762,803 6,455,670 692,867 12% Rural Land Area in Square Miles 251,954 251,437 (516) -0.2%

23
CHAPTER 3: IMPACT OF CHANGES IN 2010 POPULATION ON FUNDING FORMULA
The purpose of this chapter is to apply each of the three population scenarios using the current Texas transit funding formula to identify the impacts on funding by transit provider:
• Scenario A. New Small Urbanized Areas, • Scenario B. Mergers to Large Urbanized Areas, and • Scenario C. Most Likely.
Researchers projected funding for each state funded urban and rural transit district. For each scenario, researchers determined the transit district needs funding factors and the performance funding factors in order to allocate funds. Appendices C and D provide the methodology for determining the funding allocation for needs and performance for each transit district and the calculations.
TEXAS TRANSIT FUNDING FORMULA
The Texas transit funding formula is applied as currently described in Texas Administrative Code (3). This chapter discusses the formula in more detail. The Texas transit funding formula allocates funds to each transit district according to needs and performance. Figure 4 illustrates the Texas transit funding formula. State funding for public transportation is split 35 percent to urban transit and 65 percent to rural transit. Federal 5311 (rural) funds are distributed to rural areas using the same formula as state rural funds.

24
Figure 4. Texas Transit Funding Formula. The urban transit funds are allocated 50 percent to needs and 50 percent to performance. The portion of the formula attributed to needs is allocated to urban transit districts based on population in each urbanized area. For any state funded urban transit district with a population equal to or greater than 200,000, the maximum population of 199,999 is used for allocation of funding for need. Several measures are used to allocate the performance based funds. The four performance measures for urban transit are each weighted differently:
• local investment per operating expense – 30 percent, • revenue miles per operating expense – 20 percent, • passengers per revenue mile – 30 percent, and • passengers per capita – 20 percent.
State Transit Funds
Rural Transit District Funds
65% State Funds
Performance
35% Rural Funds
Local Investment per Operating Expense
33% Performance Funds
Revenue Miles per Operating Expense
33% Performance Funds
Passengers per Revenue Mile
33% Performance Funds
Needs
65% Rural Funds
Population
(Decennial Census)
75% Needs Funds
Land Area
(Square Miles)
25% Needs Funds
State Funded Urban Transit District Funds
35% State Funds
Performance
50% Urban Funds
Local Investment per Operating Expense
30% Performance Funds
Revenue Miles per Operating Expense
20% Performance Funds
Passengers per Revenue Mile
30% Performance Funds
Passengers per Capita
20% Performance Funds
Needs
50% Urban Funds
Population
(Decennial Census)
100% Needs Funds

25
The population used to calculate the passengers per capita measure for urban transit districts is based on total service area population. This differs from the needs factor calculation where the population is capped at 199,999 to calculate the needs factor. The rural transit funds are allocated 65 percent to needs and 35 percent to performance. The portion of the formula attributed to needs is allocated to rural transit systems based on 75 percent population and 25 percent land area. The three performance measures for rural transit are each weighted the same:
• local investment per operating expense – 33.33 percent, • revenue miles per operating expense – 33.33 percent, and • passengers per revenue mile – 33.33 percent.
Assumptions for Funding Analysis
The applications of the Texas transit funding formula in this chapter are based on the following assumptions for funding analysis:
• Annual state funds available for public transportation remain at the same level as 2009: $28,741,068.
• The distribution of annual state funds for public transportation between urban and rural is 35 percent to urban and 65 percent to rural: $10,059,374 for urban transit districts and $18,681,694 for rural transit districts.
• The annual allocation of federal Section 5311 Non-Urbanized funds for distribution by the Texas transit funding formula to rural transportation providers is $20,104,753.
• The formula is applied exactly the same for state rural transit funds and federal Section 5311 funds. Therefore, the results for rural transit districts are presented based on the sum of annual state $18,681,694 and federal funds $20,104,352 = $38,786,046.
• References to “baseline” funding for each transit district are calculated using 2000 Census population and land area for needs.
• Assumptions for performance indicators are the same for the baseline and for all scenarios: • 2009 performance indicators for rural transit districts, • 2008 performance indicators for urban transit districts (2009 urban transit district
data were not finalized at the time of this research), and • for any new urban transit district, the 2008 median performance for all urban
transit service providers was used for each performance indicator.
Urban Funds for Limited Eligibility Providers
Funding for urban transit is allocated in two tiers—urban transit districts and limited eligibility providers. See Chapter 2 for a discussion of limited eligibility providers. Funds for the four limited eligibility providers are first set-aside based on the populations of seniors and persons with disabilities in the four service areas as compared to the total urban population in the urban

26
areas eligible for state funds for transit. The formula for the percent limited eligibility provider set-aside is:
Eligible Population / (Eligible Population + State Funded Urban Transit District Population) = Percent of Urban Transit Funds Allocated to Limited Eligibility Providers
TxDOT currently sets aside 6.58 percent of the urban funds for limited eligibility providers based on the Census 2000 eligible population calculation (see Chapter 2). Table 13 calculates the projected 2010 set aside amount for each of the three scenarios.
Table 13. Projected 2010 Limited Eligibility Provider Set-Aside Percent. Population
Existing Scenario A Scenario B Scenario C A. Limited Eligibility Provider – Total Eligible Population 236,313 202,660 202,660 202,660 B. Urban Transit District Population 3,356,007 4,406,128 3,736,370 4, 228,551 C. Total 3,592,320 4,608,788 3,939,030 4,431,211 Percent Limited Eligibility (A/C) 6.58% 4. 40% 5.14% 4.57%
Each of the three scenarios reduces the set-aside amount for limited eligibility providers as compared to the current 6.58 percent. The impact is a reduction in funding available to the limited eligibility providers1. The set asides for limited eligibility providers are as follows:
• Baseline 6.58 percent of $10,059,374 urban funds = $661,907 • Scenario A 4.40 percent of $10,059,374 urban funds = $442,336 • Scenario B 5.14 percent of $10,059,374 urban funds = $517,547 • Scenario C 4.57 percent of $10,059,374 urban funds = $460,062
1The Transportation Code limits formula or discretionary funding for each of the four limited eligibility providers limits funding not to exceed the amount they each received in the 1996–1997 biennium (1): Arlington $341,663; Grand Prairie $170,584; Mesquite $142,456 and NETS $116,134. The cap is not exceeded in any of the scenarios developed in this report.

27
RESULTS FOR SCENARIO A: NEW SMALL URBANIZED AREAS
The results for Scenario A are presented in two parts, first the results for urban transit districts and second the results for rural transit districts.
Scenario A: New Small Urbanized Areas
Scenario A assumes five new state funded urban transit districts, increasing the number of state funded urban transit districts from 26 to 30 (excluding the 4 limited eligibility providers).
• Cleburne (impacts Cleburne Rural Transit District), • Conroe (impacts Brazos Rural Transit District), • Georgetown (impacts Capital Area Rural Transportation System), • New Braunfels (impacts Alamo Area Council of Governments), and • San Marcos-Kyle (impacts Capital Area Rural Transportation System).
Table 14 documents the results of the analysis for Scenario A for urban transit districts. Appendix E shows the detailed calculations.

28
Table 14. Scenario A. Urban Transit State Funding Summary of Results.
Principal City Current
Total Projected
2010 Total Difference Total Urban $10,059,374 $10,059,374 $0 Existing Urban Districts $9,397,468 $8,569,549 ($827,919) Population 3, 356,007 4,094,827 738,820 Abilene $ 364,513 $318,041 ($46,472) Amarillo $ 405,819 $366,646 ($39,173) Beaumont $ 439,859 $375,318 ($64,541) Brownsville $ 569,719 $532,933 ($36,786) College Station-Bryan $373,278 $341,301 ($31,978) Galveston $ 511,198 $454,498 ($56,699) Harlingen $ 213,120 $204,160 ($8,960) Killeen $ 404,769 $380,499 ($24,270) Lake Jackson-Angleton $173,061 $151,711 ($21,350) Laredo $ 708,885 $647,622 ($61,263) Longview $ 238,830 $209,757 ($29,073) Lubbock $ 634,681 $544,306 ($90,375) McAllen $ 467,943 $392,121 ($75,822) McKinney $ 254,272 $334,045 $79,773 Midland-Odessa $ 440,264 $369,064 ($71,201) Port Arthur $300,837 $252,929 ($47,908) San Angelo $266,188 $225,691 ($40,498) Sherman $ 236,608 $209,642 ($26,966) Temple $ 262,261 $241,101 ($21,160) Texarkana $ 250,284 $223,843 ($26,441) Texas City $210,550 $194,229 ($16,320) The Woodlands $417,689 $476,273 $58,584 Tyler $ 274,861 $263,737 ($11,124) Victoria $ 273,655 $240,513 ($33,142) Waco $ 401,623 $361,413 ($40,210) Wichita Falls $302,699 $255,154 ($47,545) New Urban Transit Districts $1,047,491 $ 1,047,491 Population 311,301 311,301 Cleburne (New) $196,820 $196,820 Conroe (New) $205,189 $205,189 Georgetown (New) $205,743 $205,743 New Braunfels (New) $210,301 $210,301 San Marcos (New) $232,438 $232,438 Limited Eligibility Providers $661,908 $442,336 ($219,572) Eligible Population 236,313 202,660 (33,653) Arlington $ 213,558 $143,227 ($70,331) Grand Prairie $151,798 $101,540 ($50,258) Mesquite $ 139,415 $91,080 ($48,335) NETS $ 157,134 $106,488 ($50,646)

29
Key findings for Scenario A urban transit districts are as follows.
Requirements for an Increase in Funding
The amount needed to fund the five new urban transit districts for both needs and performance is approximately $1,050,000 (see Table 14).
• Cleburne $ 197,000 • Conroe $ 205,000 • Georgetown $ 206,000 • New Braunfels $ 210,000 • San Marcos $ 232,000 • Total $ 1,050,000
The increase in population served for the existing 26 urban transit districts (excluding four limited eligibility providers) is 22 percent or 739,000 people (see Table 14). The baseline, state transit funds per capita for urban transit districts is $2.80 ($10,059,374 - $661,907 = $9,397,467/ 3,356,007), using Census 2000 population (see Table 14). To maintain an equivalent per capita investment using projected 2010 population, the necessary increase in state funding for the existing 26 urban transit districts is $2,069,000 (739,000 x $2.80). The total estimated requirement for additional state urban funds under Scenario A is $3,119,000 ($1,050,000 + $2,069,000).
Funding for Limited Eligibility Providers
The change in basis for estimating seniors and persons with disabilities for limited eligibility providers creates a challenge to estimate 2010 funding requirements. At a minimum, funding requirements under Scenario A will be $442,000 for 202,660 eligible population or about $2.18 per capita. This funding level is $220,000 less than the baseline of $662,000 for 236,313 eligible population and $2.80 per capita. A target of $2.80 per capita for the limited eligibility population will require funding of $568,000, or an additional $126,000 over $442,000. This is still below the baseline of $662,000.
Impact of No New Funding
Without an increase in funding, the baseline funding for Scenario A will be reallocated to include five additional urban transit districts and high growth transit districts (McKinney and The Woodlands). A total of $1,190,000 will be required, $1,050,000 for new urbanized areas, and $140,000 for McKinney and The Woodlands (Table 14). Assuming baseline state funds of $10,059,374 do not change, the funds for additional needs will come from existing urban transit providers and limited eligibility providers. The four limited eligibility transit providers will lose $220,000, or an average $55,000 in annual state funding ($220,000/4 = $55,000). This will leave a balance of $970,000 ($1,190,000 - $220,000 = $970,000) to be reallocated from the remaining 24 existing urban transit districts. Each transit

30
district will lose on average $40,000 in annual state funding ($970,000/24 = $40,000). Figure 5 illustrates the impact on each urban transit district (scale is set to be the same for all scenarios).
Figure 5. Scenario A: Urban Transit District State Funding Impact if No New Funds.
Without an increase in funding to address population increases, the per capita investment will be down from $2.80 in the baseline to $2.18, calculated from the projected 2010 population for Scenario A ($10,059,374 / (4,094,827 + 311,301 + 202,660 = 4,608,788)) (see Table 14).
Scenario A: Rural Transit Districts
Scenario A assumes four rural transit districts have portions of areas that become five small urbanized areas [Alamo Area Council of Governments (New Braunfels), Brazos Transit District (Conroe), Capital Area Rural Transportation System (San Marcos and Georgetown) and Cleburne]. This means a loss of land area and population and that will impact the transit funding formula for the needs factor. However, the growth in population for the remainder of the rural service area is large enough to at least partially offset the loss in population for the new urbanized areas for three of the four rural transit districts. If the City of Cleburne becomes an urbanized area, the remaining population in rural Cleburne County is 78,295, and the rural transit district will have a net loss in state and federal funds ($53,000 state and $57,000 federal). In the case of Capital Area Rural Transportation System, the increase in population in the rest of the transit district is greater than the loss of population to two new urbanized areas. Table 15 documents the results of the analysis for Scenario A for rural transit system state funding and Table 16 for rural transit systems federal. Appendix E shows the detailed calculations.
$(450,000)
$(400,000)
$(350,000)
$(300,000)
$(250,000)
$(200,000)
$(150,000)
$(100,000)
$(50,000)
$‐
$50,000
$100,000
$150,000
$200,000
$250,000
ABI
AMA
BMT
BRWN
CLEB
URB
CONRO
ECS
‐BRY
GALV
GEO
RGE
HRL KIL
LAR
LJ‐ANG
LNG
LUB
MCA
MCK
INMID‐ODS
NB PA
SANG
SHR
SM TMP
TWOO
TXA
TXC
TYL
VIC
WACO WF
Chan
ge Current to
Projected
State Funded Urban Transit Districts

31
Table 15. Rural Transit State Funding Summary of Results.
Rural Transit District *Impacted by new urbanized area
Baseline Total
2010 Projected
without New Urbanization
Difference from
Baseline
2010 Projected with New
Urbanization
Difference from
Baseline
Total $18,681,694 $18,681,694 $ 0 $18,681,694 $ 0 Alamo Area COG* $900,803 $954,961 $54,158 $899,103 ($1,700) Ark-Tex COG $640,334 $600,626 ( $39,708) $615,562 ( $24,772) Aspermont Small Bus. Dvlpmt. Ctr. $268,166 $258,330 ($9,836) $261,002 ($7,164) Bee Community Action Agency $288,586 $279,235 ($9,351) $284,578 ($4,008) Brazos Transit District* $1,628,661 $1,617,004 ( $11,657) $1,594,660 ( $34,001) Capital Area Rural Transportation System* $ 1,032,678 $1,208,024 $175,346 $1,052,835 $ 20,157 Central Texas Rural Transit District $627,089 $597,581 ($29,508) $610,331 ($16,758) Cleburne City of* $289,202 $301,224 $12,022 $236,137 ($53,065) Collin County Committee on Aging $233,830 $278,880 $45,050 $285,438 $51,608 Colorado Valley Transit $396,015 $393,222 ($2,793) $402,086 $6,071 Community Act. Council of South Texas $359,063 $361,006 $1,943 $367,441 $8,378 Community Council of Southwest Texas $494,477 $484,034 ($10,443) $491,927 ($2,550) Community Services, Inc. $423,691 $439,356 $15,665 $450,406 $26,715 Concho Valley COG $411,007 $400,685 ($10,322) $404,571 ($6,436) Del Rio, City of $277,937 $274,537 ($3,400) $277,816 ($121) East Texas COG $1,110,851 $1,057,300 ($53,551) $1,097,858 ($12,993) El Paso, County of $255,042 $285,036 $29,994 $289,043 $34,001 Fort Bend County $280,889 $288,660 $7,771 $291,939 $11,050 Golden Crescent RPC $543,451 $518,193 ($25,258) $529,365 ($14,086) Gulf Coast Center $261,982 $253,361 ($8,621) $260,768 ($1,214) Heart of Texas COG $463,548 $440,841 ($22,707) $452,620 ($10,928) Hill Country Transit District $530,944 $526,451 ($4 ,493) $537,987 $7,043 Kaufman Area Rural Transportation $331,927 $378,799 $46,872 $387,421 $55,494 Kleberg County Human Services $197,045 $190,245 ($6,800) $192,430 ($4,615) Lower Rio Grande Valley Dev. Council $353,318 $353,439 $121 $362,789 $9,471 Panhandle Community Services $841,610 $805,424 ($36,186) $820,967 ($20,643) Public Transit Services $412,604 $417,461 $4,857 $426,690 $14,086 Rolling Plains Management Corp. $384,665 $364,143 ($20,522) $369,729 ($14,936) Rural Economic Assist. League $389,401 $373,615 ($15,786) $380,173 ($9,228) Services Program for Aging Needs $269,408 $304,138 $34,730 $310,695 $41,287 Snr Center Res. & Public Transit Inc. $295,721 $295,843 $122 $301,672 $5,951 South East Texas RPC $371,103 $332,731 ($38,372) $340,988 ($30,115) South Padre Island, Town of $462,634 $462,391 ($243) $462,512 ($122) South Plains Comm. Action Assoc. $651,085 $610,406 ($40,679) $624,006 ($27,079) Texoma Area Paratransit System $531,036 $518,407 ($12,629) $533,100 $2,064 Transit System Inc., The $215,727 $225,198 $9,471 $229,327 $13,600 Webb Co. Community Action Agency $263,272 $276,508 $13,236 $278,572 $15,300 West Texas Opportunities, Inc. $992,892 $954,399 ($38 ,493) $967,150 ($25 ,742)

32
Table 16. Rural Transit Federal Funding Summary of Results.
Rural Transit District *Impacted by new urbanized area
Baseline Total
2010 Projected
without New Urbanization
Difference from
Baseline
2010 Projected with New
Urbanization
Difference from
Baseline Total $20,104,352 $20,104,352 $ 0 $20,104,352 $ 0 Alamo Area COG* $969,402 $1,027,685 $58,283 $967,573 ($1,829) Ark-Tex COG $689,097 $646,365 ( $42,732) $662,438 ( $26,659) Aspermont Small Bus. Dvlpmt Ctr. $288,588 $278,003 ($10,585) $280,878 ($7,710) Bee Community Action Agency $310,562 $300,500 ($10,062) $306,250 ($4,312) Brazos Transit District* $1,752,688 $1,740,142 ( $12,546) $1,716,098 ( $36,590) Capital Area Rural Transportation System* $1,111,318 $ 1,300,017 $188,699 $1,133,011 $21,693 Central Texas Rural Transit District $674,842 $643,087 ($31,755) $656,809 ($18,033) Cleburne City of* $311,225 $324,162 $12,937 $254,119 ($57,106) Collin County Committee on Aging $251,636 $300,118 $48,482 $307,175 $55,539 Colorado Valley Transit $426,172 $423,166 ($3,006) $432,706 $6,534 Community Act. Council of South Texas $386,406 $388,497 $2,091 $395,423 $9,017 Community Council of Southwest Texas $532,132 $520,893 ($11,239) $529,388 ($2,744) Community Services, Inc. $455,956 $472,814 $16,858 $484,706 $28,750 Concho Valley COG $442,306 $431,198 ($11,108) $435,380 ($6,926) Del Rio, City of $299,102 $295,443 ($3,659) $298,971 ($131) East Texas COG $1,195,445 $1,137,816 ($57,629) $1,181,462 ($13,983) El Paso, County of $274,465 $306,742 $32,277 $311,055 $36,590 Fort Bend County $302,279 $310,643 $8,364 $314,171 $11,892 Golden Crescent RPC $584,835 $557,654 ($27,181) $569,677 ($15,158) Gulf Coast Center $281,934 $272,656 ($9,278) $280,627 ($1,307) Heart of Texas COG $498,849 $474,413 ($24,436) $487,088 ($11,761) Hill Country Transit District $571,376 $ 566,541 ($4,835) $578,955 $7,579 Kaufman Area Rural Transportation $357,204 $407,646 $50,442 $416,924 $59,720 Kleberg County Human Services $212,051 $204,733 ($7,318) $207,085 ($4,966) Lower Rio Grande Valley Dev. Council $380,223 $380,354 $131 $390,416 $10,193 Panhandle Community Services $905,701 $866,759 ($38,942) $883,486 ($22,215) Public Transit Services $444,025 $449,252 $5,227 $459,183 $15,158 Rolling Plains Management Corp. $413,958 $391,874 ($22,084) $397,885 ($16,073) Rural Economic Assist. League $419,056 $402,067 ($16,989) $409,124 ($9,932) Services Program for Aging Needs $289,925 $327,299 $37,374 $334,355 $44,430 Snr Center Res. & Public Transit Inc. $318,242 $318,372 $130 $324,645 $6,403 South East Texas RPC $399,362 $358,068 ($41,294) $366,954 ($32,408) South Padre Island, Town of $497,864 $497,602 ($262) $497,733 ($131) South Plains Comm. Action Assoc. $700,667 $656,890 ($43,777) $671,526 ($29,141) Texoma Area Paratransit System $571,476 $557,886 ($13,590) $573,698 $2,222 Transit System Inc., The $232,155 $242,348 $10,193 $246,791 $14,636 Webb Co. Community Action Agency $283,321 $297,565 $14,244 $299,786 $16,465 West Texas Opportunities, Inc. $1,068,507 $1,027,082 ($41 ,425) $1,040,801 ($27 ,706)

33
Key findings for Scenario A for rural transit districts are as follows.
Requirements for an Increase in Funding
The net increase in population for the 38 rural transit districts (after adjusting for new urbanized population) is 12 percent or 693,000. According to the baseline for rural transit districts, state transit funds per capita are $3.24 ($3.49 federal), using Census 2000 population (see Table 6). To maintain an equivalent per capita investment using projected 2010 rural population, the necessary increase in state funding for the existing 38 rural transit districts is $2,250,000 (693,000 x $3.24). The necessary increase in federal Section 5311 funding is $2,420,000 (693,000 x $3.49).
Impact of No New Funding
Without an increase in funding, the baseline funding for Scenario A will be reallocated among 38 rural transit districts. Twenty-two transit districts lose funds and 16 gain funds (see Table 14). The existing investment of state and federal funds per capita is $3.24 for state funds and $3.49 for federal funds, based on Census 2000 population. Without an increase in funding, the state and federal investment per capita will drop to $2.89 state and $3.11 federal based on projected 2010 population. Most rural transit districts have an increase in population (35 of the 38). However because the needs factor is a ratio of the needs of each rural transit district to the state total of all rural transit district needs, a rural transit district may have an increase in population but have a decrease in the needs factor due to the change in ratio. In general, the rural transit districts with the highest rate of growth will receive more funding and the rural transit districts with the lower rates of growth (or loss of population) will lose funds from the state and from federal Section 5311. For example, East Texas Council of Governments has a population increase of 59,000; however, because the rate of increase in population in East Texas is not as great as other rural transit districts, the East Texas Council of Governments needs factor drops from 8.32 to 8.21 percent resulting in a decrease in funding (see Appendix E). Nineteen of the 35 rural transit districts have an increase in population but a decrease in funding. Figure 6 and Figure 7 illustrate the impact on each rural transit district. A total of $667,000 ($320,000 state funds and $347,000 federal funds) are reallocated from 22 rural transit districts that lose funds (an average of $30,000 per rural transit district) to the benefit of 16 rural transit districts that gain funds (an average of $42,000 per rural transit district). The rural transit districts with the largest increase in funds are Collin County Committee on Aging, Kaufman Area Rural Transit, and Service Program for Aging Needs.

34
Figure 6. Scenario A: Rural Transit District State Funding Impact if No New Funds.
Figure 7. Scenario A: Rural Transit District Federal Funding Impact if No New Funds.
$(60,000)
$(40,000)
$(20,000)
$‐
$20,000
$40,000
$60,000
$80,000
AACO
GARK
TASBDC
BCAA
BTD
CACST
CART
SCC
STCLEB
COLCO
CONVA CS
CTRT
DCV
TDR
EPC
ETCO
GFBC
GCC
GCR
PCHCT
DHTC
GKA
RTKC
HS
LRGVD
CPC
SPTS
REAL
RPMC
SCRP
TSETR
PCSPAN
SPCA
ASPI
TAPS TTS
WEB
BWTO
Chan
ge Current to
Projected
Rural Transit Districts
$(80,000)
$(60,000)
$(40,000)
$(20,000)
$‐
$20,000
$40,000
$60,000
$80,000
AACO
GARK
TASBDC
BCAA
BTD
CACST
CART
SCC
STCLEB
COLCO
CONVA CS
CTRT
DCV
TDR
EPC
ETCO
GFBC
GCC
GCR
PCHCT
DHTC
GKA
RTKC
HS
LRGVD
CPC
SPTS
REAL
RPMC
SCRP
TSETR
PCSPAN
SPCA
ASPI
TAPS TTS
WEB
BWTO
Chan
ge Current to
Projected
Rural Transit Districts

35
RESULTS FOR SCENARIO B: MERGERS TO LARGE URBANIZED AREAS
Scenario B is based on the merger of urban and rural transit districts into large urbanized areas, decreasing the number of state funded urban transit districts from 26 to 24 (excluding the 4 limited eligibility providers). State funded urban transit districts that are merged into large urbanized areas under Scenario B:
• The Woodlands with Houston, • McKinney with DFWA, and • Partial Texas City (Dickinson) with Houston – Texas City remains as urban district.
Current areas in rural transit districts that are merged into large urbanized areas under the assumptions for Scenario B:
• Cleburne with DFWA, • Conroe with Houston, • Georgetown with Austin, • New Braunfels with San Antonio, and • San Marcos with Austin.
Table 17 documents the Scenario B analysis for urban transit districts. Appendix F shows the detailed calculations.

36
Table 17. Scenario B. Urban Transit State Funding Summary of Results. Principal City *Impacted by Merger to Very Large Urbanized Area
Current Total
Projected 2010 Total Difference
Total Urban $10,059,374 $10,059,374 $0
Existing Urban $8,514,956 $9,350,812 $835,856 Population 3,115,620 3,657,248 541,628 Abilene $ 364,513 $396,366 $31,853 Amarillo $ 405,819 $452,189 $46,370 Beaumont $ 439,859 $468,877 $29,018 Brownsville $ 569,719 $656,277 $86,558 College Station-Bryan $373,278 $422,106 $48,828 Galveston $ 511,198 $550,879 $39,681 Harlingen $ 213,120 $249,822 $36,702 Killeen $ 404,769 $471,953 $67,184 Lake Jackson-Angleton $173,061 $188,560 $15,499 Laredo $ 708,885 $789,909 $81,024 Longview $ 238,830 $260,298 $21,468 Lubbock $ 634,681 $669,142 $34,461 McAllen $ 467,943 $487,048 $19,105 Midland – Odessa $440,264 $453,790 $13,526 Port Arthur $300,837 $315,495 $14,658 San Angelo $266,188 $281,297 $15,109 Sherman $ 236,608 $265,365 $28,757 Temple $ 262,261 $304,607 $42,346 Texarkana $ 250,284 $278,144 $27,860 Tyler $ 274,861 $324,385 $49,524 Victoria $ 273,655 $301,285 $27,630 Waco $ 401,623 $446,521 $44,898 Wichita Falls $302,699 $316,497 $13,798 Merged Urbans $882,511 $191,015 ($691,496) Population 240,387 79,122 (161,265) McKinney* $ 254,272 $0 ($254,272) Texas City* $210,550 $191,015 ($19,535) The Woodlands* $417,689 $0 ($417,689)
Limited Eligibility Provider $661,907 $517,547 ($144,360) Eligible Population 236,313 202,660 (33,653) Arlington $ 213,559 $167,580 ($45,979) Grand Prairie $151,799 $118,805 ($32,994) Mesquite $ 139,416 $106,566 ($32,850) NETS $ 157,134 $124,595 ($32,539)

37
Key findings for Scenario B for urban transit districts are as follows.
Requirements for an Increase in Funding
The increase in population served for the 24 urban transit districts that remain urban transit districts after mergers (26 less McKinney and The Woodlands equals 24) is 17 percent or 541,628 persons (see Table 17). The baseline for state transit funds per capita for urban transit districts is $2.80, using Census 2000 population. To maintain an equivalent per capita investment of $2.80 using projected 2010 population, the necessary increase in state funding for the existing 24 urban transit districts is $1,517,000 (541,628 x $2.80). The total estimated requirement for additional state urban funds under Scenario B is $1,517,000. Funding for Limited Eligibility Providers The change in basis for estimating seniors and persons with disabilities for limited eligibility providers creates a challenge to estimate 2010 funding requirements. At a minimum, funding requirements under Scenario B will be $518,000 or about $2.55 per capita for the 202,660 eligible population. This funding level is $144,000 less than the baseline of $662,000 and $2.80 per capita. A target of $2.80 per capita for the limited eligibility population will require funding of $568,000, or an additional $50,000 over $518,000. This is still below the baseline of $662,000. Impact of No New Funding Under Scenario B, the mergers of McKinney, The Woodlands, and a portion of Texas City into large urban areas will release $692,000 in state urban funds (see Table 17). Based on the revised basis for estimating seniors and persons with disabilities, the four limited eligibility providers will lose $144,000 or an average $36,000 per provider ($144,000/4 = $36,000). The total funding adjustment $836,000 ($692,000 + $144,000 = $836,000) will be reallocated among the remaining 24 urban transit districts. Each of the 24 urban transit districts will gain on average $35,000 per urban transit district ($836,000/24 = $35,000). Figure 8 illustrates the impact on each urban transit district. However, the funding adjustment does not fully address increases in population in the urban transit districts after mergers. Without an increase in funding, the per capita investment will be down from $2.80 in the baseline to $2.55, calculated from the projected 2010 population for Scenario B ($10,059,374 / (3,657,248 + 79,122 + 202,660 = 3,939,030).

38
Figure 8. Scenario B: Urban Transit District State Funding Impact if No New Funds.
Scenario B: Rural Transit Districts
Scenario B assumes four rural transit districts have portions of areas that will merge into large urban areas [Alamo Area Council of Governments (New Braunfels into San Antonio), Brazos Transit District (Conroe into Houston), Capital Area Rural Transportation System (San Marcos and Georgetown into Austin) and Cleburne (Cleburne urbanized area into DFWA)]. In Scenario B, the same newly urbanized areas that are no longer in rural transit districts are the same as Scenario A (in Scenario A the newly urbanized areas become small urbanized areas and in Scenario B the same areas merge into large urbanized areas). The affect on rural transit district funding is the same for across all scenarios. See Scenario A for a discussion of the impacts on rural transit districts (see Table 15 and Table 16).
$(450,000)
$(350,000)
$(250,000)
$(150,000)
$(50,000)
$50,000
$150,000
$250,000
ABI
AMA
BMT
BRWN
CS‐BRY
GALV
HRL KIL
LAR
LJ‐ANG
LNG
LUB
MCA
MCK
IN
MID‐ODS
PA
SANG
SHR
TMP
TWOO
TXA
TXC
TYL
VIC
WACO WF
Chan
ge Current to
Projected
State Funded Urban Transit Districts

39
RESULTS FOR SCENARIO C: MOST LIKELY
Scenario C represents the most likely change in population and land area for state funding transit districts as follows:
• Most likely new state funded urban transit districts: • Cleburne (impacts Cleburne Rural Transit District), • Conroe (impacts Brazos Rural Transit District), • Georgetown (impacts Capital Area Rural Transportation System), • New Braunfels (impacts Alamo Area Council of Governments), • San Marcos-Kyle (impacts Capita Area Rural Transportation System);
• Most likely mergers with large urbanized areas: • McKinney with DFWA, and • Partial Texas City (Dickinson) with Houston.
Scenario C increases the number of state funded urban transit districts from 30 to 34 (including 4 limited eligibility providers). Table 18 documents the results of the analysis for Scenario C for urban transit districts. Appendix G shows the detailed calculations.

40
Table 18. Scenario C. Urban Transit State Funding Summary of Results. Principal City *Impacted by Merger to Large UZA
Current Total
Projected 2010 Total Difference
Total Urban $10,059,374 $10,059,374 $0
Total Existing Urban (without Mergers) $8,932,644 $8,347,349 ($585,295) Population 3,205,065 3,838,128 633,063
Abilene $ 364,513 $330,623 ($33,890) Amarillo $ 405,819 $382,640 ($23,178) Beaumont $ 439,859 $389,786 ($50,073) Brownsville $ 569,719 $551,232 ($18,487) College Station-Bryan $373,278 $355,138 ($18,140) Galveston $ 511,198 $463,755 ($47,443) Harlingen $ 213,120 $213,888 $767 Killeen $ 404,769 $397,596 ($7,173) Lake Jackson-Angleton $173,061 $159,139 ($13,922) Laredo $ 708,885 $667,168 ($41,717) Longview $ 238,830 $218,126 ($20,704) Lubbock $ 634,681 $563,476 ($71,206) McAllen $ 467,943 $409,001 ($58,942) Midland-Odessa $ 440,264 $384,999 ($55,265) Port Arthur $300,837 $263,602 ($37,235) San Angelo $266,188 $235,356 ($30,832) Sherman $ 236,608 $219,067 ($17,541) Temple $ 262,261 $251,288 ($10,974) Texarkana $ 250,284 $231,429 ($18,854) The Woodlands $417,689 $494,372 $76,683 Tyler $ 274,861 $274,262 ($599) Victoria $ 273,655 $249,718 ($23,937) Waco $ 401,623 $376,410 ($25,213) Wichita Falls $302,699 $265,275 ($37,424)
Merged Urban $464,822 $161,002 ($303,820) Population 150,942 79,122 (71,820) McKinney* $ 254,272 ($254,272) Texas City* $210,550 $161,002 ($49,548)
New Urban $1,090,961 $ 1,090,961Population 311,301 311,301 Cleburne (New) $204,282 $204,282 Conroe (New) $213,049 $213,049 Georgetown (New) $213,630 $213,630 New Braunfels (New) $218,405 $218,405 San Marcos (New) $241,595 $241,595
Table 18 Continued

41
Principal City *Impacted by Merger to Large UZA
Current Total
Projected 2010 Total Difference
Limited Eligibility Providers $661,908 $ 460,062 ($201,845) Population 236,313 202,660 (33,653) Arlington $ 213,559 $148,967 ($64,592) Grand Prairie $151,799 $105,609 ($46,189) Mesquite $ 139,416 $94,730 ($44,686) NETS $ 157,134 $110,756 ($46,378)
Key findings for Scenario C urban transit districts are as follows. Requirements for an Increase in Funding The amount needed to fund the five new urban transit districts for both needs and performance is approximately $1,091,000 (see Table 18).
• Cleburne $ 204,000 • Conroe $ 213,000 • Georgetown $ 214,000 • New Braunfels $ 218,000 • San Marcos $ 242,000 • Total $ 1,091,000
The increase in population in the existing 24 urban transit districts that remain urban transit districts after mergers (excluding four limited eligibility providers) is 20 percent or 633,063 people (see Table 18). The baseline state funds per capita for urban transit districts is $2.80, using Census 2000 population. To maintain an equivalent per capita investment using projected 2010 population, the necessary increase in state funding for the existing 24 urban transit districts is $1,773,000 (663,063 x $2.80). The total estimated requirement for additional state urban funds under Scenario C is $2,864,000 ($1,091,000 + $1,773,000). Funding for Limited Eligibility Providers The change in basis for estimating seniors and persons with disabilities for limited eligibility providers creates a challenge to estimate 2010 funding requirements. At a minimum, funding requirements under Scenario C will be $460,000 for 202,660 eligible population, or about $2.27 per capita. This funding level is $202,000 less than the baseline of $662,000 and $2.80 per capita. A target of $2.80 per capita for the limited eligibility population will require funding of $568,000, or an additional $108,000 over $460,000. This is still below the baseline of $662,000.

42
Impact of No New Funding
Without an increase in funding, the baseline funding for Scenario C will be reallocated to include five additional urban transit districts and the one high growth transit district (The Woodlands). A total of $1,169,000 will be required, $1,091,000 for new urbanized areas and $78,000 for the urban transit districts receiving more state funds (see Table 18). Under Scenario C, the mergers of McKinney and a portion of Texas City into large urban areas will release $304,000 in state urban funds (see Table 18). Based upon the revised basis for estimating seniors and persons with disabilities, the four limited eligibility providers will lose $202,000 or an average $51,000 per provider ($202,000/4 = $51,000). The funding adjustments will partially account for the $1,169,000 funds needed for new urban areas and the growth of The Woodlands. An additional $663,000 ($1,169,000 - $304,000 - $202,000 = $663,000) will be reallocated from the other existing transit districts. The $663,000 will be reallocated among 23 urban transit districts (see Table 18). Each transit district will lose on average $29,000 ($663,000/23 = $29,000. Figure 9 illustrates the impact on each urban transit district.
Figure 9. Scenario C: Urban Transit District State Funding Impact if No New Funds.
Without an increase in funding, the per capita investment will be down from $2.80 in the baseline to $2.28, calculated using the projected 2010 population for Scenario C ($10,059,374 / (3,838,128 + 79,122 + 311,300 + 202,660 = 4,421,210)) (see Table 18).
$(450,000)
$(400,000)
$(350,000)
$(300,000)
$(250,000)
$(200,000)
$(150,000)
$(100,000)
$(50,000)
$‐
$50,000
$100,000
$150,000
$200,000
$250,000
ABI
AMA
BMT
BRWN
CLEB
URB
CONRO
ECS
‐BRY
GALV
GEO
RGE
HRL KIL
LAR
LJ‐ANG
LNG
LUB
MCA
MCK
INMID‐ODS
NB PA
SANG
SHR
SM TMP
TWOO
TXA
TXC
TYL
VIC
WACO WF
Chan
ge Current to
Projected
State Funded Urban Transit Districts

43
Scenario C: Rural Transit Districts
Scenario C assumes four rural transit districts have portions of areas that become five small urbanized areas [Alamo Area Council of Governments (New Braunfels), Brazos Transit District (Conroe), Capital Area Rural Transportation System (San Marcos and Georgetown) and Cleburne]. In Scenario C, the same newly urbanized areas that are no longer in rural transit districts are the same as Scenario A. The affect on rural transit district funding is the same for across all scenarios. See Scenario A for a discussion of the impacts on rural transit districts (see Table 15 and Table 16).
SUMMARY OF FUNDING ANALYSIS BY SCENARIO
Table 19 provides a summary of the state funding analysis by scenario for each urban transit district. Table 20 provides the summary for state and federal funding by scenario for each rural transit district. Each table documents the difference in funding from baseline by scenario for each transit district.

44
Table 19. Urban Transit State Funding Differences from Current Funding.
Principal City Scenario A Difference
Scenario B Difference
Scenario C Difference
Total Urban Transit Districts $219,570 $144,360 $201,845
Abilene ( $46,472) $31,853 ($33,890) Amarillo ($39 ,173) $46,370 ($23,178) Beaumont ( $64,541) $29,018 ($50,073) Brownsville ($36 ,786) $86,558 ($18,487) Cleburne (New) $196,820 $204,282 College Station-Bryan ($31,978) $48,828 ($18,140) Conroe (New) $205,189 $213,049 Galveston ( $56,699) $39,681 ($47,443) Georgetown (New) $205,743 $213,630 Harlingen ( $8,960) $36,702 $767 Killeen ( $24,270) $67,184 ($7,173) Lake Jackson-Angleton ($21,350) $15,499 ($13,922) Laredo ( $61,263) $81,024 ($41,717) Longview ( $29,073) $21,468 ($20,704) Lubbock ( $90,375) $34,461 ($71,206) McAllen ( $75,822) $19,105 ($58,942) McKinney (Merged Scenario B & C) $79,773 ($254,272) ($254,272) Midland – Odessa ($71,201) $13,526 ($55,265) New Braunfels (New) $210,301 $218,405 Port Arthur ($47,908) $14,658 ($37,235) San Angelo ($40,498) $15,109 ($30,832) San Marcos (New) $232,438 $241,595 Sherman ( $26,966) $28,757 ($17,541) Temple ( $21,160) $42,346 ($10,974) Texarkana ( $26,441) $27,860 ($18,854) Texas City (Partial Merged Scenario B & C) ($16,320) ($19,535) ($49,548) The Woodlands (Merged Scenario B) $58,584 ($417,689) $76,683 Tyler ( $11,124) $49,524 ($599) Victoria ( $33,142) $27,630 ($23,937) Waco ( $40,210) $44,898 ($25,213) Wichita Falls ($47,545) $13,798 ($37,424)
Limited Eligibility Providers ($219,572) ($14 4,360) ($20 1,845) Arlington ($70,331) ( $45,979) ( $64,592) Grand Prairie ($50,258) ( $32,994) ( $46,189) Mesquite ($48,335) ( $32,850) ( $44,686) NETS ($50,646) ( $32,539) ( $46,378)

45
Table 20. Rural Transit State and Federal Funding Differences from Current Funding.
Rural Transit District
Scenario A, B & C Difference in Funding State
Funding Federal Funding Total
Alamo Area COG ($1,700) ($1,829) ($3,529) Ark-Tex COG ($24,772) ($26,659) ($51,431) Aspermont Small Bus. Dvlpmt Ctr. ($7,164) ($7,710) ($14,874) Bee Community Action Agency ($4,008) ($4,312) ($8,320) Brazos Transit District ($34,001) ($36,590) ($70,591) Capital Area Rural Transportation System $20,157 $21,693 $41,850 Central Texas Rural Transit District ($16,758) ($18,033) ($34,791) Cleburne City of ($53,065) ($57,106) ($110,171) Collin County Committee on Aging $51,608 $55,539 $107,147 Colorado Valley Transit $6,071 $6,534 $12,605 Community Act. Council of South Texas $8,378 $9,017 $17,395 Community Council of Southwest Texas ($2,550) ($2,744) ($5,294) Community Services, Inc. $26,715 $28,750 $55,465 Concho Valley COG ($6,436) ($6,926) ($13,362) Del Rio, City of ($121) ($131) ($252) East Texas COG ($12,993) ($13,983) ($26,976) El Paso, County of $34,001 $36,590 $70,591 Fort Bend County $11,050 $11,892 $22,942 Golden Crescent RPC ($14,086) ($15,158) ($29,244) Gulf Coast Center ($1,214) ($1,307) ($2,521) Heart of Texas COG ($10,928) ($11,761) ($22,689) Hill Country Transit District $ 7,043 $7,579 $14,622 Kaufman Area Rural Transportation $55,494 $59,720 $115,214 Kleberg County Human Services ($4,615) ($4,966) ($9,581) Lower Rio Grande Valley Dev. Council $9,471 $10,193 $19,664 Panhandle Community Services ($20,643) ($22,215) ($42,858) Public Transit Services $14,086 $15,158 $29,244 Rolling Plains Management Corp. ($14,936) ($16,073) ($31,009) Rural Economic Assist. League ($9,228) ($9,932) ($19,160) Services Program for Aging Needs $41,287 $44,430 $85,717 Snr Center Res. & Public Transit Inc. $5,951 $6,403 $12,354 South East Texas RPC ($30,115) ($32,408) ($62,523) South Padre Island, Town of ($122) ($131) ($253) South Plains Comm. Action Assoc. ($27,079) ($29,141) ($56,220) Texoma Area Paratransit System $2,064 $2,222 $4,286 Transit System Inc., The $13,600 $14,636 $28,236 Webb Co. Community Action Agency $15,300 $16,465 $31,765 West Texas Opportunities, Inc. ($25,742) ($27 ,706) ($53,448)


47
CHAPTER 4: FINDINGS AND KEY POLICY IMPLICATIONS
The purpose of this chapter is to discuss findings for the projected changes in population for 2010 and to present the key policy implications in the allocation of funding using the Texas transit funding formula.
RESEARCH FINDINGS
The following section summarizes research findings about projected changes in population as of 2010 that affect the Texas transit funding formula.
Population Increase in Urban and Rural Transit Districts
Population is increasing in both urban and rural transit districts. Population in both urban and rural transit districts that receive state funds increase under every scenario analyzed, as illustrated in Table 21.
Table 21. Population Increase 2000 to 2010 for Baseline and Each Scenario.
2000 2010 Increase Percent Increase
Baseline State Funded Urban Transit 3,592,320 4,297,487 705,167 20% Rural Transit Districts 5,762,803 6,766,971 1,004,168 17% 9,355,123 11,064,458 1,709,335 18% Scenario A - New Urban State Funded Urban Transit 3,592,320 4,608,788 1,016,468 28% Rural Transit Districts 5,762,803 6,455,670 692,867 12% 9,355,123 11,064,458 1,709,335 18% Scenario B - Mergers State Funded Urban Transit 3,592,320 3,939,030 346,710 10% Rural Transit Districts 5,762,803 6,455,670 692,867 12% 9,355,123 10,394,700 1,039,577 11% Scenario C - Most Likely State Funded Urban Transit 3,592,320 4,359,121 766,801 21% Rural Transit Districts 5,762,803 6,455,670 692,867 12% 9,355,123 10,814,791 1,459,668 16%
The fastest population growth is in counties around the largest metropolitan areas and communities along the Texas border with Mexico. Existing urbanized areas are expanding in terms of population and land area that is urbanized.
Additional Large Urbanized Areas
Urbanized areas that may reach status as a large urbanized area with a population of 200,000 or more are Laredo, Brownsville, Killeen, and Amarillo. Under the Texas transit funding formula, the population used to calculate funding for needs will be limited to 199,999.

48
Under Federal Section 5307 funding regulations, an urban transit system in an urbanized area with a population over 200,000 cannot use federal funds for operating expenses. Use of federal funds is up to 80 percent of capital expenses, including preventive maintenance. State funds may be used as local share; however, additional sources of local funds may be required to fully leverage federal dollars. Stakeholders in these urbanized areas should anticipate a change in status of urbanized areas and plan to address funding challenges.
New Small Urbanized Areas
Increasing population in rural Texas will create more urbanized areas. Rapidly urbanizing rural areas could merge into large urban areas or become new urbanized areas. The most likely scenario is that five communities with a population over 50,000 will become small urbanized areas. The new urbanized areas are Cleburne, Conroe, Georgetown, New Braunfels, and San Marcos. Under the Texas transit funding formula, funds for transit districts in the new urbanized areas will be from the urban category rather than the rural category. The source of federal funds for new urban transit districts will be federal Section 5307. The transit districts may use Section 5307 funds for up to 50 percent of the operating deficit and up to 80 percent of capital expenses, including preventive maintenance. Administrative expenses are considered part of operating cost according to Section 5307; administrative expenses will no longer be eligible for 80 percent federal funding as provided under Section 5311 funding guidelines.
Population Increases in Rural Transit Districts Despite New Urbanized Areas
The population in rural transit districts is growing even though some rural areas are rapidly urbanizing. The increase in rural population is greater than the loss of population to urbanized areas. Population in rural transit districts will increase 12 percent under any scenario for the change in population in urban transit districts (see Table 21 above).
Urbanized Area below 50,000 Population
The population of Galveston may fall below 50,000 due to the impacts of Hurricane Ike in 2008. Such an outcome would place the current small urbanized area into the rural category. This scenario was not modeled in the analysis. Federal legislation may be proposed to grandfather urbanized areas that are recovering from national disasters at the time of the census in 2010.
POLICY IMPLICATIONS FOR FUNDING
The following section discusses the key policy implications of the projected change in population (and land area) in the allocation of funding using the Texas transit funding formula.
Transit Investments Per Capita are Declining
Assuming no new funds, per capita investment in transit will decline with the 2010 Census data. State funds are $10,059,374 per year for urban transit districts and $18,681,694 for rural transit districts. The annual allocation of federal Section 5311 funds under the Texas transit funding formula is $20,104,753 to rural transit districts. Without an increase in funding, the growth in

49
2010 population means the investment in public transportation will be less per capita than the existing baseline using 2000 population, as documented in Table 22.
Table 22. Transit Funds per Capita for Baseline and Each Scenario. Assuming No New Funds Baseline Scenario A Scenario B Scenario C
2000 Population
2010 New Urban
2010 Mergers
2010 Most Likely
Urban State $2.80 $ 2.18 $ 2.55 $2.28
Limited Eligibility $2.80 $ 2.18 $ 2.55 $2.27
Rural State $3.24 $ 2.89
Federal 5311 $3.49 $ 3.11
New Small Urban Transit Districts Require Funds
New small urban transit districts will require funding from urban state funds. The most significant impact on the distribution of state funding will occur if the rapidly urbanizing rural areas become new urban transit districts (Scenarios A and C). A new urban transit district requires funds based on needs and performance, or about $200,000 per urban transit district. Table 23 highlights the additional state funds required for five new urban transit districts under Scenarios A and C.
Table 23. Required Funding for New Urbanized Areas. Includes Needs and Performance Allocation Scenario A Scenari o B Scenari o C
2010 New Urban
2010 Mergers
2010 Most Likely
New Urban Transit Districts (5) $1,050,000 $ 0 $1,091,000
Without additional state resources, the requirement to fund new small urban transit districts will require reallocation of funds from existing urban transit districts that are eligible for state funds. Without additional state funds, some urban transit districts will lose funds although the population in the area is increasing.
Increase in Funding Required to Maintain Per Capita Investment
Additional funds are required to maintain the investment per capita in 2010 compared to the baseline per capita using 2000 population. Table 24 documents the additional state and federal funds required to maintain the per capita investment using 2010 population. The estimate of funds does not include funds for new urban transit districts reported in Table 23.

50
Table 24. Additional Funding to Maintain Baseline per Capita. Using 2010 Population
Baseline Scenario A Scenario B Scenario C
2000
Population 2010
New Urban 2010
Mergers 2010
Most Likely Urban State* $2.80 $2,069,000 $1,517,000 $1,773,000 Limited Eligibility State $2.80 $126,000 $50,000 $108,000
Rural State $3.24 $2,250,000
Federal 5311 $3.49 $2,420,000
Table 25 summarizes total funds required for new urban transit districts (Table 23) and to maintain per capita investment based on projected 2010 population in urban and rural transit districts (Table 24). State and federal funds are documented.
Table 25. Total Funds Required Based on Projected 2010 Population. Scenario A Scenario B Scenario C
2010
New Urban 2010
Mergers 2010
Most Likely Urban State $3,245,000 $1,567,000 $2,972,000 Rural State $2,250,000 Total State Urban and Rural $5,495,000 $3,817,000 $5,222,000
Federal 5311 $2,420,000
Funds Needed to Avoid Negative Impacts
Without new funds, current state dollars will be reallocated to provide funding for needs and performance for new urbanized areas and to provide funds for urban and rural transit districts with higher growth rates. The same redistribution occurs for Federal Section 5311 funds for rural transit districts. Without an increase in federal funds to address growth in population, federal funds will be reallocated from one rural transit district to increase the resources for another rural transit district. The reallocation of funds means many transit districts will lose funding in order to redistribute dollars to the transit districts with higher population growth. Table 26 documents the reallocation of existing dollars and shows what funds will be required to provide sufficient coverage for negative allocations (transit districts with lower growth rates that must reduce funds to provide an increase for other transit districts). These funds simply neutralize funding redistribution and do not provide sufficient resources to maintain per capita investment.

51
Table 26. Funds Needed to Avoid Negative Impacts after All Reallocation. Scenario A Scenario B Scenario C
2010
New Urban 2010
Mergers 2010
Most Likely
New Urban Areas $1,050,000 $ 0 $1,091,000
Growth Existing $140,000 $ 836,000 $78,000 Less Mergers $0 ($692,000) ( $304,000) Urban $1,190,000 $ 144,000 $865,000
Less Limited Eligibility ($220,000) ( $144,000) ( $202,000)
Balance Urban State Needed $970,000 $ 0 $663,000
Rural State Needed $323,000 $ 323,000 $323,000
Total State Needed $1,293,000 $323,000 $986,000
Federal 5311 Needed $347,000 $347,000 $347,000
Urban and Rural Ratio for Population Eligible for State Transit Funds
The ratio of urban and rural population eligible for funding under the Texas transit funding formula may change. The current percent of state funding allocation is 35 percent to urban and 65 percent to rural. This actual ratio of rural to urban population for the 2000 baseline is 38 percent urban and 62 percent rural. The proportion of population in state funded transit districts will increase for urban as compared to rural according to projected 2010 population for the baseline and for scenarios A and C, is shown in Table 27.
Table 27. Percent Urban/Rural Population for State-Funded Transit Districts.
Urban Transit Includes Eligible Population for Limited Eligibility Providers
2000
Population
Percent Urban Rural 2000
2010 Population
Percent Urban Rural 2010
Baseline State Funded Urban Transit 3,592,320 38% 4,297,487 39% Rural Transit Districts 5,762,803 62 % 6,766,971 61 % 9,355,123 11,064,458 Scenario A - New Urban State Funded Urban Transit 4,608,788 42% Rural Transit Districts 6,455,670 58 % 11,064,458 Scenario B - Mergers State Funded Urban Transit 3,939,030 38% Rural Transit Districts 6,455,670 62 % 10,394,700 Scenario C - Most Likely State Funded Urban Transit 4,359,121 40% Rural Transit Districts 6,455,670 60 % 10,814,791

52
Limited Eligibility Transit Providers
There are four transit providers in Texas designated as “limited eligibility providers”—Arlington, Northeast Transportation Services (NETS), Grand Prairie and Mesquite. These transit providers restrict transit eligibility to seniors and persons with disabilities. The Texas transit funding formula currently sets aside 6.58 percent of the urban funds for limited eligibility providers based on the Census 2000 eligible population calculation. There are two issues that suggest this percent estimate is not correct. First, researchers discovered that when the Texas transit funding formula was first applied for limited eligibility providers (in 2006), the eligible population for persons with disabilities was based on a Census 2000 report that tallies disabilities rather than persons with disabilities. This creates an inflated number to represent the eligible population served by limited eligibility providers. Second, the ACS is now used to identify the number of persons with disabilities. The ACS has changed the questions to collect data and the expected impact of the change is a smaller number of persons classified as having a disability. Overall, the number of eligible seniors and persons with disabilities in 2010 may be less than 2000. This will reduce the percent of state funds set aside for limited eligibility transit providers.
Sources of Data for Allocation of State Funds for Performance
Under past practice, when a new rural transit district became eligible for state or federal transit funding under the Texas transit funding formula, the transit district was required to wait a minimum of two years to earn performance dollars (after a period of time to establish transit service and gather performance data). However, when areas that were previously part of rural transit districts become a new urban transit district, there is a history of service. TxDOT will need to develop new procedures to establish the performance statistics that will be used to generate performance funds for the new urban transit district (and what the impact will be on performance statistics for the former rural transit district).
Requirements for Metropolitan Planning Processes
A new urbanized area is required to meet requirements for the metropolitan planning process in order to be eligible for Federal Section 5307 funds. State funds may be used as local share; however, sources of local funds may be required to fully leverage federal dollars. Stakeholders in rapidly urbanizing areas must anticipate the change in status as of 2012 announcements of new urbanized areas in order to fully apply funding opportunities. Areas that may merge into large urban areas will be subject to allocation of funding by the Metropolitan Planning Organization (MPO) and the designated recipient(s) for Section 5307 funds. Formal processes are in place for the sub allocation of funds in at least one large urbanized area in Texas. However, not all large urban areas have a formally recognized process for determining the funds that may be allocated to areas outside the service area of the designated recipient(s). Existing transit systems that operate in areas that may be merged into large urbanized areas should discuss the policies and practices for sub allocation of funding with the local MPO and the designated recipient for federal Section 5307 funds.

53
Gaps in Providing Transit Service
As urbanized areas expand, there are increasing possibilities that some areas are not included within the jurisdiction of a transit provider. In particular, the four rural transit districts that have portions of areas that may become five small urbanized areas [Alamo Area Council of Governments (New Braunfels), Brazos Transit District (Conroe), Capital Area Rural Transportation System (San Marcos and Georgetown) and Cleburne] should begin the conversation to determine how transit service will be delivered and funded after new urbanized areas are announced. TxDOT Project 0-6473 Filling the Transit Gap addresses other urbanized areas that are not included within the transit service area of an existing transit provider (urban gap). Urban gaps occur on the perimeter of urbanized areas that have grown beyond the jurisdiction of the transit provider in the principal city. The projections for expanded urbanized areas as a result of Census 2010 may increase the incidences of urban gaps.


55
REFERENCES
1. Texas Constitution and Statutes Homepage. Transportation Code, Title 6. Roadways,
Subtitle K. Mass Transportation, Chapter 458, Rural and Urban Transit Districts, Sec. 458.001. Definitions. http://www.statutes.legis.state.tx.us/Docs/TN/htm/TN.458.htm. Accessed August 2009.
2. U.S. Census Bureau. Disability Definitions.
http://www.census.gov/hhes/www/disability/disab_defn.html. Cited 2010 February 2010. 3. Texas Administrative Code, Title 43 Transportation, Part 1 Texas Department of
Transportation, Chapter 31 Public Transportation, Subchapter B State Programs, Rule §31.11 Formula Program.


57
APPENDICES
Appendix A: Population and Land Area for Each County Appendix B: Population for Each Urbanized Area Appendix C: Needs Funding Methodology and Assumptions Appendix D: Performance Funding Methodology and Assumptions Appendix E: Scenario A Funding Results Appendix F: Scenario B Funding Results Appendix G: Scenario C Funding Results


Source: The Institute for Demographic & Socioeconomic Research, The University of Texas at San Antonio 59
APPENDIX A: POPULATION AND LAND AREA FOR EACH COUNTY
County
2000 Population (Census)
Projected 2010
Population Differe nce %
Difference
Land Area (Square Miles)
State Total 20,851,820 25,373,947 4,522,127 21.6% 262,350 Anderson 55,109 57,852 2,743 5.0% 1,071
Andrews 13,004 14,302 1,298 10.0% 1,501
Angelina 80,130 85,116 4,986 6.2% 802
Aransas 22,497 27,530 5,033 22.4% 252
Archer 8,854 9,503 649 7.3% 910
Armstrong 2,148 2,279 131 6.1% 914
Atascosa 38,628 45,883 7,255 18.8% 1,232
Austin 23,590 28,739 5,149 21.8% 653
Bailey 6,594 6,327 (267) -4.0% 827
Bandera 17,645 21,266 3,621 20.5% 792
Bastrop 57,733 81,717 23,984 41.5% 888
Baylor 4,093 3,996 (97) -2.4% 871
Bee 32,359 34,105 1,746 5.4% 880
Bell 237,974 291,382 53,408 22.4% 1,060
Bexar 1,392,931 1,636,642 243,711 17.5% 1,247
Blanco 8,418 10,348 1,930 22.9% 711
Borden 729 768 39 5.3% 899
Bosque 17,204 17,775 571 3.3% 989
Bowie 89,306 92,942 3,636 4.1% 888
Brazoria 241,767 319,043 77,276 32.0% 1,386
Brazos 152,415 175,512 23,097 15.2% 586
Brewster 8,866 9,484 618 7.0% 6,193
Briscoe 1,790 1,861 71 4.0% 900
Brooks 7,976 7,866 (110) -1.4% 943
Brown 37,674 39,915 2,241 5.9% 944
Burleson 16,470 18,691 2,221 13.5% 666
Burnet 34,147 47,581 13,434 39.3% 996
Caldwell 32,194 38,724 6,530 20.3% 546
Calhoun 20,647 23,265 2,618 12.7% 512
Callahan 12,905 14,525 1,620 12.6% 899
Cameron 335,227 417,404 82,177 24.5% 906
Camp 11,549 13,400 1,851 16.0% 198
Carson 6,516 6,772 256 3.9% 923
Cass 30,438 30,631 193 0.6% 937
Castro 8,285 7,384 (901) -10.9% 898
Chambers 26,031 35,845 9,814 0.0% 599
Cherokee 46,659 49,990 3,331 7.1% 1,052
Childress 7,688 7,935 247 3.2% 710

Source: The Institute for Demographic & Socioeconomic Research, The University of Texas at San Antonio 60
County
2000 Population (Census)
Projected 2010
Population Differe nce %
Difference
Land Area (Square Miles)
Clay 11,006 11,218 212 1.9% 1,098
Cochran 3,730 3,477 (253) -6.8% 775
Coke 3,864 3,920 56 1.4% 899
Coleman 9,235 8,937 (298) -3.2% 1,260
Collin 491,675 842,364 350,689 71.3% 848
Collingsworth 3,206 3,155 (51) -1.6% 919
Colorado 20,390 22,255 1,865 9.1% 963
Comal 78,021 121,020 42,999 55.1% 561
Comanche 14,026 14,267 241 1.7% 938
Concho 3,966 3,851 (115) -2.9% 991
Cooke 36,363 40,851 4,488 12.3% 874
Coryell 74,978 81,216 6,238 8.3% 1,052
Cottle 1,904 1,873 (31) -1.6% 901
Crane 3,996 4,299 303 7.6% 786
Crockett 4,099 4,592 493 12.0% 2,807
Crosby 7,072 6,534 (538) -7.6% 900
Culberson 2,975 2,707 (268) -9.0% 3,812
Dallam 6,222 6,758 536 8.6% 1,505
Dallas 2,218,899 2,435,919 217,020 9.8% 880
Dawson 14,985 14,792 (193) -1.3% 902
Deaf Smith 18,561 20,547 1,986 10.7% 1,497
Delta 5,327 5,330 3 0.1% 277
Denton 432,976 706,103 273,127 63.1% 889
De Witt 20,013 20,570 557 2.8% 909
Dickens 2,762 2,795 33 1.2% 904
Dimmit 10,248 9,761 (487) -4.8% 1,331
Donley 3,828 3,871 43 1.1% 930
Duval 13,120 12,041 (1,079) -8.2% 1,793
Eastland 18,297 18,800 503 2.7% 926
Ector 121,123 132,817 11,694 9.7% 901
Edwards 2,162 2,213 51 2.4% 2,120
Ellis 111,360 159,281 47,921 43.0% 940
El Paso 679,622 773,125 93,503 13.8% 1,013
Erath 33,001 39,701 6,700 20.3% 1,086
Falls 18,576 18,745 169 0.9% 769
Fannin 31,242 34,764 3,522 11.3% 891
Fayette 21,804 25,232 3,428 15.7% 950
Fisher 4,344 4,165 (179) -4.1% 901
Floyd 7,771 6,910 (861) -11.1% 992
Foard 1,622 1,582 (40) -2.5% 707
Fort Bend 354,452 577,444 222,992 62.9% 875
Franklin 9,458 10,955 1,497 15.8% 286

Source: The Institute for Demographic & Socioeconomic Research, The University of Texas at San Antonio 61
County
2000 Population (Census)
Projected 2010
Population Differe nce %
Difference
Land Area (Square Miles)
Freestone 17,867 20,430 2,563 14.3% 877
Frio 16,252 17,956 1,704 10.5% 1,133
Gaines 14,467 16,459 1,992 13.8% 1,502
Galveston 250,158 293,945 43,787 17.5% 398
Garza 4,872 5,240 368 7.6% 896
Gillespie 20,814 25,873 5,059 24.3% 1,061
Glasscock 1,406 1,525 119 8.5% 901
Goliad 6,928 7,712 784 11.3% 854
Gonzales 18,628 20,371 1,743 9.4% 1,068
Gray 22,744 22,864 120 0.5% 928
Grayson 110,595 120,798 10,203 9.2% 934
Gregg 111,379 122,993 11,614 10.4% 274
Grimes 23,552 26,428 2,876 12.2% 794
Guadalupe 89,023 128,975 39,952 44.9% 711
Hale 36,602 37,156 554 1.5% 1,005
Hall 3,782 3,840 58 1.5% 903
Hamilton 8,229 8,938 709 8.6% 836
Hansford 5,369 5,221 (148) -2.8% 920
Hardeman 4,724 4,609 (115) -2.4% 695
Hardin 48,073 52,181 4,108 8.5% 894
Harris 3,400,578 4,096,052 695,474 20.5% 1,729
Harrison 62,110 67,673 5,563 9.0% 899
Hartley 5,537 5,810 273 4.9% 1,462
Haskell 6,093 5,899 (194) -3.2% 903
Hays 97,589 164,078 66,489 68.1% 678
Hemphill 3,351 3,600 249 7.4% 910
Henderson 73,277 81,314 8,037 11.0% 874
Hidalgo 569,463 793,137 223,674 39.3% 1,570
Hill 32,321 37,008 4,687 14.5% 962
Hockley 22,716 23,855 1,139 5.0% 908
Hood 41,100 54,656 13,556 33.0% 422
Hopkins 31,960 34,605 2,645 8.3% 782
Houston 23,185 24,488 1,303 5.6% 1,231
Howard 33,627 33,536 (91) -0.3% 903
Hudspeth 3,344 3,812 468 14.0% 4,571
Hunt 76,596 89,977 13,381 17.5% 841
Hutchinson 23,857 23,546 (311) -1.3% 887
Irion 1,771 1,824 53 3.0% 1,051
Jack 8,763 9,079 316 3.6% 917
Jackson 14,391 15,360 969 6.7% 829
Jasper 35,604 35,873 269 0.8% 937
Jeff Davis 2,207 2,846 639 29.0% 2,264

Source: The Institute for Demographic & Socioeconomic Research, The University of Texas at San Antonio 62
County
2000 Population (Census)
Projected 2010
Population Differe nce %
Difference
Land Area (Square Miles)
Jefferson 252,051 242,826 (9,225) -3.7% 904
Jim Hogg 5,281 5,506 225 4.3% 1,136
Jim Wells 39,326 42,455 3,129 8.0% 865
Johnson 126,811 169,350 42,539 33.5% 729
Jones 20,785 20,783 (2) 0.0% 931
Karnes 15,446 16,838 1,392 9.0% 750
Kaufman 71,313 107,604 36,291 50.9% 786
Kendall 23,743 35,351 11,608 48.9% 662
Kennedy 414 470 56 13.5% 1,457
Kent 859 860 1 0.1% 902
Kerr 43,653 46,829 3,176 7.3% 1,106
Kimble 4,468 4,784 316 7.1% 1,251
King 356 376 20 5.6% 912
Kinney 3,379 3,449 70 2.1% 1,363
Kleberg 31,549 31,990 441 1.4% 871
Knox 4,253 4,240 (13) -0.3% 849
Lamar 48,499 50,336 1,837 3.8% 917
Lamb 14,709 15,586 877 6.0% 1,016
Lampasas 17,762 22,609 4,847 27.3% 712
La Salle 5,866 6,029 163 2.8% 1,489
Lavaca 19,210 19,565 355 1.8% 970
Lee 15,657 18,119 2,462 15.7% 629
Leon 15,335 16,966 1,631 10.6% 1,072
Liberty 70,154 81,895 11,741 16.7% 1,160
Limestone 22,051 23,379 1,328 6.0% 909
Lipscomb 3,057 3,167 110 3.6% 932
Live Oak 12,309 12,409 100 0.8% 1,036
Llano 17,044 19,344 2,300 13.5% 935
Loving 67 65 (2) -3.0% 673
Lubbock 242,628 267,891 25,263 10.4% 899
Lynn 6,550 5,933 (617) -9.4% 892
McCulloch 8,205 8,669 464 5.7% 1,069
McLennan 213,517 233,552 20,035 9.4% 1,042
McMullen 851 878 27 3.2% 1,113
Madison 12,940 14,495 1,555 12.0% 470
Marion 10,941 11,032 91 0.8% 381
Martin 4,746 5,308 562 11.8% 915
Mason 3,738 3,837 99 2.6% 932
Matagorda 37,957 38,833 876 2.3% 1,114
Maverick 47,297 55,221 7,924 16.8% 1,280
Medina 39,304 45,657 6,353 16.2% 1,328
Menard 2,360 2,444 84 3.6% 902

Source: The Institute for Demographic & Socioeconomic Research, The University of Texas at San Antonio 63
County
2000 Population (Census)
Projected 2010
Population Differe nce %
Difference
Land Area (Square Miles)
Midland 116,009 129,715 13,706 11.8% 900
Milam 24,238 26,461 2,223 9.2% 1,017
Mills 5,151 5,520 369 7.2% 748
Mitchell 9,698 9,802 104 1.1% 910
Montague 19,117 20,232 1,115 5.8% 931
Montgomery 293,768 476,502 182,734 62.2% 1,044
Moore 20,121 21,097 976 4.9% 900
Morris 13,048 13,534 486 3.7% 255
Motley 1,426 1,422 (4) -0.3% 989
Nacogdoches 59,203 64,297 5,094 8.6% 947
Navarro 45,124 51,617 6,493 14.4% 1,008
Newton 15,072 14,887 (185) 0.0% 933
Nolan 15,802 14,411 (1,391) -8.8% 912
Nueces 313,645 323,890 10,245 3.3% 836
Ochiltree 9,006 9,985 979 10.9% 918
Oldham 2,185 2,341 156 7.1% 1,501
Orange 84,966 84,911 (55) -0.1% 356
Palo Pinto 27,026 29,650 2,624 9.7% 953
Panola 22,756 24,119 1,363 6.0% 801
Parker 88,495 118,438 29,943 33.8% 904
Parmer 10,016 10,226 210 2.1% 882
Pecos 16,809 17,819 1,010 6.0% 4,764
Polk 41,133 49,936 8,803 21.4% 1,057
Potter 113,546 126,354 12,808 11.3% 909
Presidio 7,304 8,663 1,359 18.6% 3,856
Rains 9,139 10,962 1,823 19.9% 232
Randall 104,312 120,306 15,994 15.3% 914
Reagan 3,326 3,121 (205) -6.2% 1,175
Real 3,047 3,351 304 10.0% 700
Red River 14,314 14,392 78 0.5% 1,050
Reeves 13,137 11,067 (2,070) -15.8% 2,636
Refugio 7,828 7,125 (703) -9.0% 770
Roberts 887 948 61 6.9% 924
Robertson 16,000 16,893 893 5.6% 855
Rockwall 43,080 85,251 42,171 97.9% 129
Runnels 11,495 11,770 275 2.4% 1,051
Rusk 47,372 50,021 2,649 5.6% 924
Sabine 10,469 10,847 378 3.6% 490
San Augustine 8,946 9,581 635 7.1% 528
San Jacinto 22,246 28,137 5,891 26.5% 571
San Patricio 67,138 70,895 3,757 5.6% 692
San Saba 6,186 6,389 203 3.3% 1,134

Source: The Institute for Demographic & Socioeconomic Research, The University of Texas at San Antonio 64
County
2000 Population (Census)
Projected 2010
Population Differe nce %
Difference
Land Area (Square Miles)
Schleicher 2,935 3,193 258 8.8% 1,311
Scurry 16,361 17,200 839 5.1% 902
Shackelford 3,302 3,464 162 4.9% 914
Shelby 25,224 26,609 1,385 5.5% 794
Sherman 3,186 3,361 175 5.5% 923
Smith 174,706 206,781 32,075 18.4% 928
Somervell 6,809 8,596 1,787 26.2% 187
Starr 53,597 67,382 13,785 25.7% 1,223
Stephens 9,674 10,258 584 6.0% 895
Sterling 1,393 1,473 80 5.7% 923
Stonewall 1,693 1,642 (51) -3.0% 919
Sutton 4,077 4,630 553 13.6% 1,454
Swisher 8,378 8,209 (169) -2.0% 900
Tarrant 1,446,219 1,825,548 379,329 26.2% 863 Taylor 126,555 131,285 4,730 3.7% 916 Terrell 1,081 1,107 26 2.4% 2,358
Terry 12,761 11,521 (1,240) -9.7% 890
Throckmorton 1,850 1,889 39 2.1% 912
Titus 28,118 32,001 3,883 13.8% 411
Tom Green 104,010 103,750 (260) -0.2% 1,522
Travis 812,280 992,773 180,493 22.2% 989
Trinity 13,779 15,180 1,401 10.2% 693
Tyler 20,871 22,127 1,256 6.0% 923
Upshur 35,291 38,291 3,000 8.5% 588
Upton 3,404 3,148 (256) -7.5% 1,242
Uvalde 25,926 27,857 1,931 7.4% 1,557
Val Verde 44,856 50,067 5,211 11.6% 3,170
Van Zandt 48,140 53,658 5,518 11.5% 849
Victoria 84,088 89,158 5,070 6.0% 883
Walker 61,758 65,237 3,479 5.6% 787
Waller 32,663 42,309 9,646 29.5% 514
Ward 10,909 9,914 (995) -9.1% 835
Washington 30,373 33,479 3,106 10.2% 609
Webb 193,117 257,590 64,473 33.4% 3,357
Wharton 41,188 43,789 2,601 6.3% 1,090
Wheeler 5,284 5,138 (146) -2.8% 914
Wichita 131,664 127,695 (3,969) -3.0% 628
Wilbarger 14,676 15,287 611 4.2% 971
Willacy 20,082 22,035 1,953 9.7% 597
Williamson 249,967 435,355 185,388 74.2% 1,123
Wilson 32,408 45,517 13,109 40.4% 807

Source: The Institute for Demographic & Socioeconomic Research, The University of Texas at San Antonio 65
County
2000 Population (Census)
Projected 2010
Population Differe nce %
Difference
Land Area (Square Miles)
Winkler 7,173 6,573 (600) -8.4% 841
Wise 48,793 61,562 12,769 26.2% 905
Wood 36,752 44,888 8,136 22.1% 650
Yoakum 7,322 8,260 938 12.8% 800
Young 17,943 18,637 694 3.9% 922
Zapata 12,182 15,266 3,084 25.3% 997
Zavala 11,600 12,844 1,244 10.7% 1,298


67
APPENDIX B: POPULATION FOR EACH URBANIZED AREA
Urban Area Census
2000 Projected
2010 Change PercentAbilene 107,041 112,000 4,959 4.6Amarillo 179,312 201,000 21,688 12.1Austin 901,920 1,183,000 281,080 31.2Beaumont 139,304 140,000 696 0.5Brownsville 165,776 215,000 49,224 29.7Cleburne 36,863 52,000 15,137 41.1College St - Bryan 132,500 152,000 19,500 14.7Conroe 41,402 58,000 16,598 40.1Corpus Christi 293,925 304,000 10,075 3.4Dallas - Ft Worth - Arlington 4,145,659 5,115,000 969,341 23.4Denton - Lewisville 299,823 432,000 132,177 44.1Eagle Pass 41,829 47,000 5,171 12.4El Paso 648,465 714,000 65,535 10.1Galveston 54,770 54,000 (770) -1.4Georgetown 32,663 59,000 26,337 80.6Harlingen 110,770 132,000 21,230 19.2Houston 3,822,509 4,831,000 1,008,491 26.4Killeen 167,976 200,000 32,024 19.1Lake Jackson-Angleton 73,416 79,000 5,584 7.6Laredo 175,586 227,000 51,414 29.3Longview 78,070 83,000 4,930 6.3Lubbock 202,225 225,000 22,775 11.3McAllen 523,144 740,000 216,856 41.5McKinney 54,525 147,000 92,475 169.6Midland 99,221 112,000 12,779 12.9New Braunfels 39,709 62,000 22,291 56.1Odessa 111,395 123,000 11,605 10.4Port Arthur 114,656 114,000 (656) -0.6San Angelo 87,969 88,000 31 0.0San Antonio 1,327,554 1,567,000 239,446 18.0San Marcos - Kyle 47,333 80,000 32,667 69.0Sherman 56,168 62,000 5,832 10.4Temple 71,937 86,000 14,063 19.5Texarkana 48,767 54,000 5,233 10.7Texas City 96,417 111,000 14,583 15.1The Woodlands 89,445 183,000 93,555 104.6Tyler 101,494 125,000 23,506 23.2Victoria 61,529 65,000 3,471 5.6Waco 153,198 170,000 16,802 11.0Wichita Falls 99,396 97,000 (2,396) -2.4Total 15,085,079 18,601,000 3,565,339 23.6


69
APPENDIX C: NEEDS FUNDING METHODOLOGY AND ASSUMPTIONS
Urban and Rural Transit District Needs Allocation Methodology The Texas Public Transportation Funding Formula allocates funds to each transit district according to needs and performance. Needs is allocated based on population for state funded urban transit districts and on population and land area for rural transit districts. For state funded urban transit districts, 50 percent of the available funds are allocated to needs and then distributed to each urban transit district based on the transit district portion of the population. For any state funded urban transit district with a population equal to or greater than 200,000, the maximum population of 199,999 is used for allocation of funding for need. For rural transit districts, 65 percent of funds are allocated to needs and then distributed to rural transit districts based the transit district population (weighted 75 percent) and land area (weighted 25 percent). Figure C1 illustrates the needs side of the Texas Public Transportation Funding Formula. For each scenario, researchers determined for each transit district the needs funding factor. The needs funding factor is a ratio of each transit district needs to total state needs. Researchers then calculated the transit district needs funding level by multiplying this needs factor by the total needs funding available.
Figure C1. State Transit District Needs Funding.
State Transit Funds
Rural Funds(65% of State Funds)
Needs Funds(65% of Rural
Funds)
Distributed based on 75% Population
(Decennial Census)
Distributed based on 25% Land Area
(Square Miles)
Urban Funds(35% of State Funds)
(Split: Limited Eligibility Set-Aside and State-Funded Urban
Transit District)
Needs Funds (50% of Urban Funds)
Distributed based on 100% Population(Decennial Census)
(cap at 199,999 population)


71
APPENDIX D: PERFORMANCE FUNDING METHODOLOGY AND ASSUMPTIONS
For each scenario, researchers calculated a performance factor for each of the transit districts. The performance factor portion of the formula is based on several performance measures. The performance measures for urban transit districts are weighted differently as follows:
local investment per operating expense – 30 percent, revenue miles per operating expenses – 20 percent, passengers per revenue mile – 30 percent, and passengers per capita – 20 percent.
The population used to calculate the passengers per capita measure for urban transit districts is based on total service area population. This differs from the needs factor calculation where the population is capped at 199,999 for calculating the needs factor.
The three performance measures for rural transit districts are weighted equally as follows:
local investment per operating expense – 33 percent, revenue miles per operating expenses – 33 percent, and passengers per revenue mile – 33 percent.
For state funded urban transit districts, 50 percent of the available funds are allocated to performance and then distributed to each urban transit district based on the transit district portion of the population. For rural transit districts, 35 percent of funds are allocated to performance. Figure D1 illustrates the performance side of the Texas Public Transportation Funding Formula.

72
Figure D1. State Transit District Performance Funding. For each scenario, researchers calculated the transit district performance measures based on the 2009 rural transit district state reported data and the 2008 urban transit district state reported data (2009 urban transit district data was not finalized at the time of this report). For new transit districts, researchers assumed the median performance for each measure.
State Transit Funds
Rural Funds(65% of State Funds)
Performance Funds(35% of Rural Funds)
33% riders / rev. mi.
33% rev. mi. / expense
33% local $ / expense
Urban Funds(35% of State Funds)
Performance Funds (50% of Urban Funds)
20% riders / capita
33% riders / rev. mi.
20% rev. mi. / expenses
30% local $ / expense

73
Urban Transit District Performance Measures (Fiscal Year 2008 Data).
Principal City
Local Funds/ Operating Expense
Ridership/ Capita
Passengers / Revenue
Mile
Revenue Miles /
Operating Expense
State-Funded Urban Transit Districts Abilene 56% 5.86 0.61 0.35 Amarillo 43% 2.08 0.42 0.22 Beaumont 88% 5.17 0.79 0.19 Brownsville 74% 10.71 1.78 0.15 Cleburne* 45% 2.76 0.56 0.26 College Station-Bryan 45% 4.43 0.64 0.28 Conroe* 45% 2.76 0.56 0.26 Galveston 23% 25.14 2.86 0.15 Georgetown* 45% 2.76 0.56 0.26 Harlingen 5% 0.05 0.11 0.20 Killeen 54% 1.55 0.34 0.33 Lake Jackson-Angleton 10% 0.16 0.08 0.30 Laredo 65% 24.92 2.33 0.14 Longview 25% 2.37 0.53 0.24 Lubbock 72% 15.22 1.38 0.25 McAllen 66% 0.87 0.57 0.22 McKinney 57% 2.72 0.21 0.51 Midland-Odessa 30% 2.28 0.56 0.28 New Braunfels* 45% 2.76 0.56 0.26 Port Arthur 48% 1.26 0.42 0.19 San Angelo 28% 2.81 0.37 0.37 San Marcos* 45% 2.76 0.56 0.26 Sherman 37% 1.80 0.33 0.52 Temple 66% 1.78 0.35 0.26 Texarkana 32% 5.85 0.82 0.27 Texas City 14% 0.23 0.11 0.26 The Woodlands 97% 5.97 1.19 0.26 Tyler 22% 2.66 0.64 0.19 Victoria 46% 5.15 0.57 0.35 Waco 49% 4.87 0.51 0.26 Wichita Falls 28% 3.24 0.67 0.33 Limited Eligibility Providers Arlington 45% 0.30 0.14 0.31 Grand Prairie 28% 0.31 0.31 0.23 Mesquite 36% 0.32 0.15 0.39 NETS 11% 0.07 0.11 0.36
*Assumes the median performance for new urban transit districts
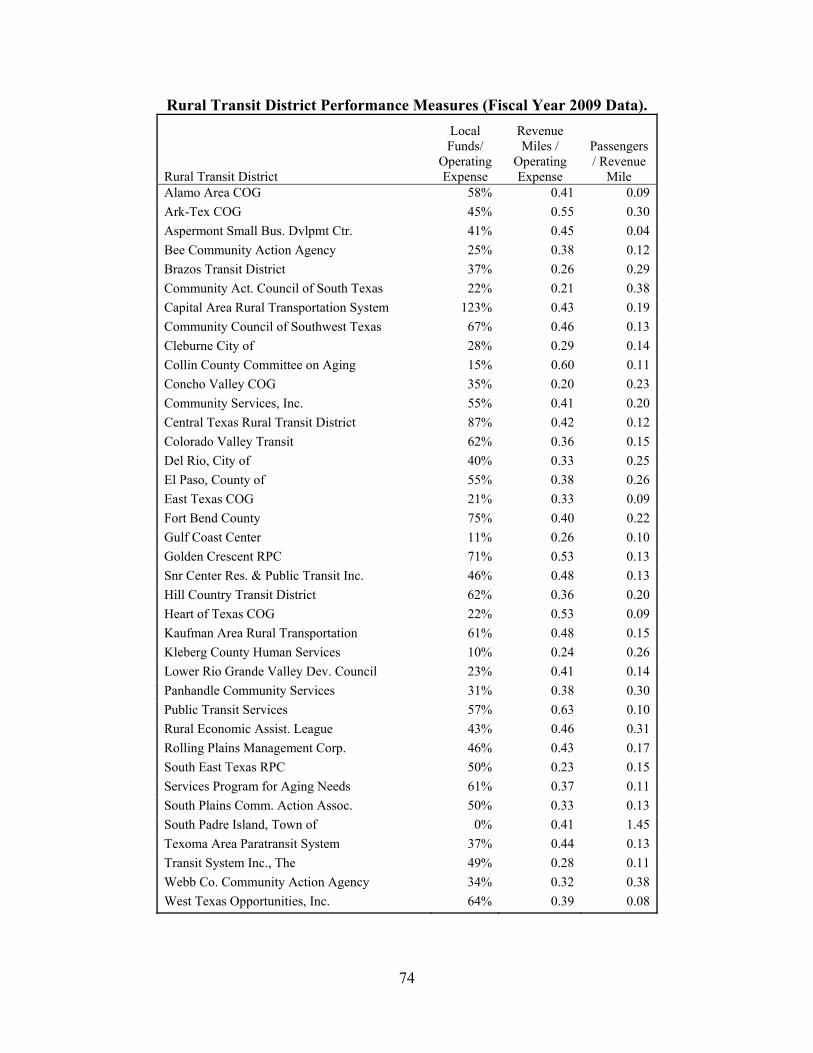
74
Rural Transit District Performance Measures (Fiscal Year 2009 Data).
Rural Transit District
Local Funds/
Operating Expense
Revenue Miles /
Operating Expense
Passengers / Revenue
Mile Alamo Area COG 58% 0.41 0.09 Ark-Tex COG 45% 0.55 0.30 Aspermont Small Bus. Dvlpmt Ctr. 41% 0.45 0.04 Bee Community Action Agency 25% 0.38 0.12 Brazos Transit District 37% 0.26 0.29 Community Act. Council of South Texas 22% 0.21 0.38 Capital Area Rural Transportation System 123% 0.43 0.19 Community Council of Southwest Texas 67% 0.46 0.13 Cleburne City of 28% 0.29 0.14 Collin County Committee on Aging 15% 0.60 0.11 Concho Valley COG 35% 0.20 0.23 Community Services, Inc. 55% 0.41 0.20 Central Texas Rural Transit District 87% 0.42 0.12 Colorado Valley Transit 62% 0.36 0.15 Del Rio, City of 40% 0.33 0.25 El Paso, County of 55% 0.38 0.26 East Texas COG 21% 0.33 0.09 Fort Bend County 75% 0.40 0.22 Gulf Coast Center 11% 0.26 0.10 Golden Crescent RPC 71% 0.53 0.13 Snr Center Res. & Public Transit Inc. 46% 0.48 0.13 Hill Country Transit District 62% 0.36 0.20 Heart of Texas COG 22% 0.53 0.09 Kaufman Area Rural Transportation 61% 0.48 0.15 Kleberg County Human Services 10% 0.24 0.26 Lower Rio Grande Valley Dev. Council 23% 0.41 0.14 Panhandle Community Services 31% 0.38 0.30 Public Transit Services 57% 0.63 0.10 Rural Economic Assist. League 43% 0.46 0.31 Rolling Plains Management Corp. 46% 0.43 0.17 South East Texas RPC 50% 0.23 0.15 Services Program for Aging Needs 61% 0.37 0.11 South Plains Comm. Action Assoc. 50% 0.33 0.13 South Padre Island, Town of 0% 0.41 1.45 Texoma Area Paratransit System 37% 0.44 0.13 Transit System Inc., The 49% 0.28 0.11 Webb Co. Community Action Agency 34% 0.32 0.38 West Texas Opportunities, Inc. 64% 0.39 0.08

75
The transit district performance factor is calculated in a two-step process. First, for each performance measure a ratio is calculated by dividing the transit district performance measure by the sum total of all transit districts for that measure. This ratio differs between scenarios as the number of transit districts changes the denominator, sum total of all transit districts. Second, for each transit district, each of the ratios is then multiplied by the weight for the performance measure and then summed together for a total. An example of the performance factor calculation is shown below. Researchers then calculated the performance funding by transit district by multiplying the performance factor to the total funding available for performance. Performance Factor Calculation Example
Local Funds/
Operating Expense (30%)
Ridership / Capita (20%)
Passengers / Revenue
Mile (30%)
Revenue Miles /
Operating Expense (20%)
Performance Factor
Step 1: Ratio Calculation Urban Transit District Performance 56% 5.86 0.61 0.35 / Total of all Urban Transit Districts 11.80 139.15 19.20 7.09
= Ratio 0.0478 0.0421 0.0317 0.0492 Step 2: Performance Factor * Measure Weight 30% 20% 30% 20% = Performance Factor 1.44% .84% .95% .98% 4.21%


77
APPENDIX E: SCENARIO A FUNDING RESULTS
Scenario A. Urban Transit Needs Factor - Current and Projected 2010. Current (based on 2000 Census) Projected 2010
Principal City Population Adjusted
Population Needs Factor Po pulation
Adjusted Population
Needs Factor
Total Urban 4,254,890 3,256,332 5,424,950 3,966,771 Total Urban Transit District
3,356,007 3,020,019 100%
4,406,128
3,764,111 100%
Abilene 107,041 107,041 3.5% 112,253 112,253 3.0%Amarillo 179,312 179,312 5.9% 201,289 199,999 5.3%Beaumont 139,304 139,304 4.6% 140,223 140,223 3.7%Brownsville 165,776 165,776 5.5% 214,428 199,999 5.3%Cleburne (New) 51,866 51,866 1.4%College Station-Bryan 132,500 132,500 4.4% 151,722 151,722 4.0%Conroe (New) 58,417 58,417 1.5%Galveston 54,770 54,770 1.8% 54,240 54,240 1.4%Georgetown (New) 58,851 58,851 1.6%Harlingen 110,770 110,770 3.7% 132,033 132,033 3.5%Killeen 167,976 167,976 5.6% 200,475 199,999 5.3%Lake Jackson-Angleton 73,416 73,416 2.4% 78,789 78,789 2.1%Laredo 175,586 175,586 5.8% 227,202 199,999 5.3%Longview 78,070 78,070 2.6% 83,225 83,225 2.2%Lubbock 202,225 199,999 6.6% 223,853 199,999 5.3%McAllen 523,144 199,999 6.6% 739,217 199,999 5.3%McKinney 54,525 54,525 1.8% 145,824 145,824 3.9%Midland-Odessa 210,616 199,999 6.6% 235,546 199,999 5.3%New Braunfels (New) 62,419 62,419 1.7%Port Arthur 114,656 114,656 3.8% 114,274 114,274 3.0%San Angelo 87,969 87,969 2.9% 87,710 87,710 2.3%San Marcos (New) 79,748 79,748 2.1%Sherman 56,168 56,168 1.9% 62,140 62,140 1.7%Temple 71,937 71,937 2.4% 86,175 86,175 2.3%Texarkana 48,767 48,767 1.6% 53,987 53,987 1.4%Texas City 96,417 96,417 3.2% 110,875 110,875 3.0%The Woodlands 89,445 89,445 3.0% 180,880 180,880 4.8%Tyler 101,494 101,494 3.4% 125,471 125,471 3.3%Victoria 61,529 61,529 2.0% 65,378 65,378 1.7%Waco 153,198 153,198 5.1% 170,155 170,155 4.5%Wichita Falls 99,396 99,396 3.3% 97,463 97,463 2.6%Limited Eligibility Providers 898,883 236,313 100%
1,018,822 202,660 100%
Arlington 335,164 86,396 36.6% 387,086 74,561 36.8%Grand Prairie 126,889 37,995 16.1% 154,157 32,673 16.1%Mesquite 123,800 34,209 14.5% 136,565 27,424 13.5%NETS 313,030 77,713 33.0% 341,014 68,002 33.6%

78
Scenario A. Rural Transit District Needs Factor - Current and Projected 2010. Current (Census 2000) Projected 2010
Rural Transit District Population Land Area
Needs Factor Po pulation
Land Area 25%
Needs Factor
Total 5,762,803
251,954 100% 6,455,67 251,437 10 0%
Alamo Area COG 392,995 10,130 6.12% 439,261 10,090 6.11%Ark-Tex COG 221,701 5,761 3.46% 230,739 5,761 3.25%Aspermont Small Bus. Dvlpmt Ctr. 39,877 6,317 1.15% 39,478 6,317 1.09%Bee Community Action Agency 75,844 4,051 1.39% 82,047 4,051 1.36%Brazos Transit District 798,164 16,910 12.07% 870,258 16,835 11.79%Capital Area Rural Transportation System 427,869 7,192 6.28% 494,444 7,082 6.45%Central Texas Rural Transit District 184,925 10,693 3.47% 195,080 10,690 3.33%Cleburne City of 103,238 710 1.41% 78,295 677 0.98%Collin County Committee on Aging 56,516 689 0.80% 100,216 650 1.23%Colorado Valley Transit 117,124 3,220 1.84% 135,438 3,220 1.89%Community Act. Council of South Texas 84,180 5,149 1.61% 100,195 5,149 1.68%Community Council of Southwest Texas 109,525 11,138 2.53% 120,725 11,138 2.51%Community Services, Inc. 135,414 1,924 1.95% 170,698 1,921 2.17%Concho Valley COG 56,505 15,309 2.26% 58,541 15,309 2.20%Del Rio, City of 44,856 3,170 0.90% 50,067 3,170 0.90%East Texas COG 565,616 9,613 8.32% 624,278 9,607 8.21%El Paso, County of 31,157 809 0.49% 59,174 781 0.77%Fort Bend County 37,891 747 0.57% 50,701 705 0.66%Golden Crescent RPC 160,333 7,088 2.79% 169,456 7,087 2.67%Gulf Coast Center 102,725 1,570 1.49% 114,403 1,545 1.48%Heart of Texas COG 168,338 5,478 2.73% 180,734 5,473 2.64%Hill Country Transit District 155,387 8,321 2.85% 179,046 8,313 2.91%Kaufman Area Rural Transportation 82,737 896 1.17% 132,068 886 1.62%Kleberg County Human Services 31,963 2,328 0.65% 32,460 2,328 0.61%Lower Rio Grande Valley Dev. Council 122,660 2,641 1.86% 44,271 2,614 1.94%Panhandle Community Services 223,550 25,749 5.46% 235,286 25,744 5.29%Public Transit Services 117,544 2,765 1.80% 141,657 2,763 1.92%Rolling Plains Management Corp. 86,084 6,553 1.77% 85,719 6,553 1.65%Rural Economic Assist. League 96,923 2,491 1.51% 102,017 2,491 1.43%Services Program for Aging Needs 62,453 748 0.89% 99,474 711 1.23%Snr Center Res. & Public Transit Inc. 76,596 841 1.08% 89,977 841 1.13%South East Texas RPC 131,130 2,027 1.91% 125,421 2,023 1.66%South Padre Island, Town of 2,422 2 0.03% 2,627 2 0.03%South Plains Comm. Action Assoc. 201,705 15,342 4.15% 206,432 15,337 3.92%Texoma Area Paratransit System 200,664 5,601 3.17% 226,167 5,599 3.18%Transit System Inc., The 47,909 609 0.68% 63,252 609 0.80%Webb Co. Community Action Agency 17,531 3,314 0.56% 30,388 3,313 0.68%West Texas Opportunities, Inc. 190,752 44,056 6.85% 195,180 44,053 6.65%

79
Scenario A. Urban Transit Needs State Funding - Current and Projected 2010.
Current (based on 2000
Census) Pr ojected 2010
Difference Principal City Needs Factor Needs
Funding Needs Factor
Needs Funding
Total Urban $5,029,687 $5,029,687 $0
Total Urban Transit Districts 1 00% $4,698,734 100% $4,808,519 $109,786Abilene 3 .54% $166,541 2.98% $143,399 $(23,142)Amarillo 5 .94% $278,985 5.31% $255,492 $(23,493)Beaumont 4 .61% $216,738 3.73% $179,130 $(37,608)Brownsville 5 .49% $257,925 5.31% $255,492 $(2,433)Cleburne (New) 1.38% $6 6,257 $6 6,257College Station-Bryan 4.39% $206,152 4.03% $193,820 $(12,332)Conroe (New) 1.55% $7 4,626 $7 4,626Galveston 1. 81% $85,215 1.44% $69,290 $(15,925)Georgetown (New) 1.56% $7 5,180 $7 5,180Harlingen 3 .67% $172,343 3.51% $168,667 $(3,675)Killeen 5 .56% $261,348 5.31% $255,492 $(5,856)Lake Jackson-Angleton 2.43% $114,225 2.09% $100,650 $(13,575)Laredo 5 .81% $273,188 5.31% $255,492 $(17,696)Longview 2. 59% $121,466 2.21% $106,317 $(15,149)Lubbock 6 .62% $311,171 5.31% $255,492 $(55,679)McAllen 6 .62% $311,171 5.31% $255,492 $(55,679)McKinney 1.81% $84,833 3.87% $ 186,285 $ 101,452Midland-Odessa 6 .62% $311,171 5.31% $255,492 $(55,679)New Braunfels (New) 1.66% $79,738 $79,738Port Arthur 3.80% $178,389 3.04% $145,981 $(32,408)San Angelo 2.91% $136,868 2.33% $112,046 $(24,821)San Marcos (New) 2.12% $101,875 $101,875Sherman 1. 86% $87,390 1.65% $79,382 $(8,008)Temple 2 .38% $111,924 2.29% $110,086 $(1,839)Texarkana 1. 61% $75,875 1.43% $68,966 $(6,908)Texas City 3.19% $150,012 2.95% $141,639 $(8,373)The Woodlands 2.96% $139,164 4.81% $231,068 $91,904Tyler 3 .36% $157,911 3.33% $160,285 $2,374Victoria 2. 04% $95,731 1.74% $83,518 $(12,213)Waco 5 .07% $238,355 4.52% $217,367 $(20,988)Wichita Falls 3.29% $154,646 2.59% $124,506 $(30,141)Limited Eligibility Providers 1 00% $330,954 100% $221,168 $(109,786)Arlington 36 .56% $120,996 36.79% $81,370 $(39,626)Grand Prairie 16.08% $53,211 16.12% $35,657 $(17,555)Mesquite 14 .48% $47,909 13.53% $29,929 $(17,981)NETS 32 .89% $108,836 33.55% $74,212 $(34,624)

80
Scenario A. Rural Transit Needs State Funding - Current and Projected 2010.
Cu rrent Projected 2010
Difference Rural Transit District Needs Factor
Needs Funding
Needs Factor
Needs Funding
Total 100% $ 12,044,172 100% $12,044,172 $0
Alamo Area COG 6.12% $743,158 6.11% $741,458 ($1,700)Ark-Tex COG 3.46% $419,787 3.25% $395,015 ($24,772)Aspermont Small Bus. Dvlpmt Ctr. 1.15% $139,160 1.09% $131,996 ($7,164)Bee Community Action Agency 1.39% $168,668 1.36% $164,660 ($4,008)Brazos Transit District 12.07% $1,465,065 11.79% $1,431,064 ($34,001)Capital Area Rural Transportation System 6.28% $762,830 6.45% $782,987 $20,157 Central Texas Rural Transit District 3.47% $421,123 3.33% $404,365 ($16,758)Cleburne City of 1.41% $171,703 0.98% $118,638 ($53,065)Collin County Committee on Aging 0.80% $97,631 1.23% $149,239 $51,608 Colorado Valley Transit 1.84% $223,919 1.89% $229,990 $6,071 Community Act. Council of South Texas 1.61% $195,140 1.68% $203,518 $8,378 Community Council of Southwest Texas 2.53% $307,342 2.51% $304,792 ($2,550)Community Services, Inc. 1.95% $237,276 2.17% $263,991 $26,715 Concho Valley COG 2.26% $273,827 2.20% $267,391 ($6,436)Del Rio, City of 0.90% $109,045 0.90% $108,924 ($121)East Texas COG 8.32% $1,009,699 8.21% $996,706 ($12,993)El Paso, County of 0.49% $59,015 0.77% $93,016 $34,001 Fort Bend County 0.57% $68,973 0.66% $80,023 $11,050 Golden Crescent RPC 2.79% $338,793 2.67% $324,707 ($14,086)Gulf Coast Center 1.49% $181,296 1.48% $180,082 ($1,214)Heart of Texas COG 2.73% $331,992 2.64% $321,064 ($10,928)Hill Country Transit District 2.85% $ 345,836 2.91% $352,879 $7,043 Kaufman Area Rural Transportation 1.17% $141,589 1.62% $197,083 $55,494 Kleberg County Human Services 0.65% $78,566 0.61% $73,951 ($4,615)Lower Rio Grande Valley Dev. Council 1.86% $225,619 1.94% $235,090 $9,471 Panhandle Community Services 5.46% $663,499 5.29% $642,856 ($20,643)Public Transit Services 1.80% $219,062 1.92% $233,148 $14,086 Rolling Plains Management Corp. 1.77% $215,054 1.65% $200,118 ($14,936)Rural Economic Assist. League 1.51% $183,239 1.43% $174,011 ($9,228)Services Program for Aging Needs 0.89% $107,709 1.23% $148,996 $41,287 Snr Center Res. & Public Transit Inc. 1.08% $131,145 1.13% $137,096 $5,951 South East Texas RPC 1.91% $231,569 1.66% $201,454 ($30,115)South Padre Island, Town of 0.03% $3,886 0.03% $3,764 ($122)South Plains Comm. Action Assoc. 4.15% $503,574 3.92% $476,495 ($27,079)Texoma Area Paratransit System 3.17% $384,572 3.18% $386,636 $2,064 Transit System Inc., The 0.68% $83,059 0.80% $96,659 $13,600 Webb Co. Community Action Agency 0.56% $67,637 0.68% $82,937 $15,300 West Texas Opportunities, Inc. 6.85% $ 832,288 6.65% $807,273 ($25,015)

81
Scenario A. Rural Transit Needs Federal Funding - Current and Projected 2010. Cu rrent Projected 2010
Difference Rural Transit District Needs Factor
Needs Funding
Needs Factor
Needs Funding
Total 1 00% $13,068,091 100% $13,068,091 $0Alamo Area COG 6.12% $799,751 6.11% $797,922 ($1,829)Ark-Tex COG 3.46% $451,755 3.25% $425,096 ($26,659)Aspermont Small Bus. Dvlpmt Ctr. 1.15% $149,757 1.09% $142,047 ($7,710)Bee Community Action Agency 1.39% $181,512 1.36% $177,200 ($4,312)Brazos Transit District 12.07% $1,576,634 11.79% $1,540,044 ($36,590)Capital Area Rural Transportation System 6.28% $820,921 6.45% $842,614 $21,693 Central Texas Rural Transit District 3.47% $453,192 3.33% $435,159 ($18,033)Cleburne City of 1.41% $184,779 0.98% $127,673 ($57,106)Collin County Committee on Aging 0.80% $105,065 1.23% $160,604 $55,539 Colorado Valley Transit 1.84% $240,971 1.89% $247,505 $6,534 Community Act. Council of South Texas 1.61% $210,000 1.68% $219,017 $9,017 Community Council of Southwest Texas 2.53% $330,747 2.51% $328,003 ($2,744)Community Services, Inc. 1.95% $255,345 2.17% $284,095 $28,750 Concho Valley COG 2.26% $294,680 2.20% $287,754 ($6,926)Del Rio, City of 0.90% $117,349 0.90% $117,218 ($131)East Texas COG 8.32% $1,086,590 8.21% $1,072,607 ($13,983)El Paso, County of 0.49% $63,510 0.77% $100,100 $36,590 Fort Bend County 0.57% $74,225 0.66% $86,117 $11,892 Golden Crescent RPC 2.79% $364,592 2.67% $349,434 ($15,158)Gulf Coast Center 1.49% $195,103 1.48% $193,796 ($1,307)Heart of Texas COG 2.73% $357,274 2.64% $345,513 ($11,761)Hill Country Transit District 2.85% $ 372,172 2.91% $379,751 $7,579 Kaufman Area Rural Transportation 1.17% $152,371 1.62% $212,091 $59,720 Kleberg County Human Services 0.65% $84,549 0.61% $79,583 ($4,966)Lower Rio Grande Valley Dev. Council 1.86% $242,800 1.94% $252,993 $10,193 Panhandle Community Services 5.46% $714,026 5.29% $691,811 ($22,215)Public Transit Services 1.80% $235,744 1.92% $250,902 $15,158 Rolling Plains Management Corp. 1.77% $231,431 1.65% $215,358 ($16,073)Rural Economic Assist. League 1.51% $197,194 1.43% $187,262 ($9,932)Services Program for Aging Needs 0.89% $115,912 1.23% $160,342 $44,430 Snr Center Res. & Public Transit Inc. 1.08% $141,133 1.13% $147,536 $6,403 South East Texas RPC 1.91% $249,203 1.66% $216,795 ($32,408)South Padre Island, Town of 0.03% $4,182 0.03% $4,051 ($131)South Plains Comm. Action Assoc. 4.15% $541,923 3.92% $512,782 ($29,141)Texoma Area Paratransit System 3.17% $413,858 3.18% $416,080 $2,222 Transit System Inc., The 0.68% $89,384 0.80% $104,020 $14,636 Webb Co. Community Action Agency 0.56% $72,788 0.68% $89,253 $16,465 West Texas Opportunities, Inc. 6.85% $ 895,669 6.65% $867,963 ($27,706)

82
Scenario A. Urban Performance State Funding - Current and Projected 2010.
Current Transit Districts Scenario A Transit Districts
Principal City Performance
Factor Funding for Performance
Performance Factor
Funding for Performance Diffe rence
Total Urban $5,029,687 $5,029,687 Total Transit Districts 100% $4,698,734 100% $4,808,519 $109,786Abilene 4 .21% $197,971 3.63% $174,641 $(23,330)Amarillo 2 .70% $126,834 2.31% $111,154 $(15,680)Beaumont 4 .75% $223,121 4.08% $196,188 $(26,933)Brownsville 6 .64% $311,795 5.77% $277,442 $(34,353)Cleburne 2.72% $130,563 $130,563College Station-Bryan 3.56% $167,127 3.07% $147,481 $(19,645)Conroe 2.72% $130,563 $130,563Galveston 9 .07% $425,983 8.01% $385,208 $(40,775)Georgetown 2.72% $130,563 $130,563Harlingen 0. 87% $40,778 0.74% $35,493 $(5,285)Killeen 3 .05% $143,421 2.60% $125,007 $(18,414)Lake Jackson-Angleton 1.25% $58,836 1.06% $51,061 $(7,775)Laredo 9 .27% $435,698 8.15% $392,131 $(43,567)Longview 2. 50% $117,364 2.15% $103,440 $(13,924)Lubbock 6 .89% $323,510 6.01% $288,815 $(34,696)McAllen 3 .34% $156,772 2.84% $136,630 $(20,143)McKinney 3 .61% $169,439 3.07% $147,760 $(21,678)Midland-Odessa 2 .75% $129,093 2.36% $113,572 $(15,521)New Braunfels 2.72% $130,563 $130,563Port Arthur 2.61% $122,448 2.22% $106,948 $(15,501)San Angelo 2.75% $129,321 2.36% $113,644 $(15,677)San Marcos 2.72% $130,563 $130,563Sherman 3 .18% $149,218 2.71% $130,260 $(18,958)Temple 3 .20% $150,337 2.72% $131,016 $(19,322)Texarkana 3 .71% $174,409 3.22% $154,876 $(19,532)Texas City 1.29% $60,538 1.09% $52,590 $(7,948)The Woodlands 5.93% $278,525 5.10% $245,205 $(33,320)Tyler 2 .49% $116,950 2.15% $103,452 $(13,498)Victoria 3 .79% $177,925 3.26% $156,995 $(20,929)Waco 3 .47% $163,268 3.00% $144,046 $(19,222)Wichita Falls 3.15% $148,053 2.72% $130,648 $(17,405)Limited Eligibility Providers 1 00% $330,954 100% $221,168 $(109,786)Arlington 27 .97% $92,562 27.97% $61,857 $(30,705)Grand Prairie 29.79% $98,587 29.79% $65,883 $(32,704)Mesquite 27 .65% $91,506 27.65% $61,151 $(30,355)NETS 14 .59% $48,298 14.59% $32,276 $(16,022)

83
Scenario A. Rural Performance State Funding - Current and Projected 2010.
Rural Transit District
Current and Projected 2010 Composite
of all Measures
Performance Funding
Total $6,538,725 Alamo Area COG 2.41% $157,645 Ark-Tex COG 3.37% $220,547 Aspermont Small Bus. Dvlpmt Ctr. 1.97% $129,006 Bee Community Action Agency 1.83% $119,918 Brazos Transit District 2.50% $163,596 Capital Area Rural Transportation System 4.13% $269,848 Central Texas Rural Transit District 3.15% $205,966 Cleburne City of 1.80% $117,499 Collin County Committee on Aging 2.08% $136,199 Colorado Valley Transit 2.63% $172,096 Community Act. Council of South Texas 2.51% $163,923 Community Council of Southwest Texas 2.86% $187,135 Community Services, Inc. 2.85% $186,415 Concho Valley COG 2.10% $137,180 Del Rio, City of 2.58% $168,892 East Texas COG 1.55% $101,152 El Paso, County of 3.00% $196,027 Fort Bend County 3.24% $211,916 Golden Crescent RPC 3.13% $204,658 Gulf Coast Center 1.23% $80,686 Heart of Texas COG 2.01% $131,556 Hill Country Transit District 2.83% $185,108 Kaufman Area Rural Transportation 2.91% $190,338 Kleberg County Human Services 1.81% $118,479 Lower Rio Grande Valley Dev. Council 1.95% $127,699 Panhandle Community Services 2.72% $178,111 Public Transit Services 2.96% $193,542 Rolling Plains Management Corp. 2.59% $169,611 Rural Economic Assist. League 3.15% $206,162 Services Program for Aging Needs 2.47% $161,699 Snr Center Res. & Public Transit Inc. 2.52% $164,576 South East Texas RPC 2.13% $139,534 South Padre Island, Town of 7.02% $458,748 South Plains Comm. Action Assoc. 2.26% $147,511 Texoma Area Paratransit System 2.24% $146,464 Transit System Inc., The 2.03% $132,668 Webb Co. Community Action Agency 2.99% $195,635 West Texas Opportunities, Inc. 2.46% $160,980

84
Scenario A. Rural Performance Federal Funding - Current and Projected 2010.
Rural Transit District
Current and Projected 2010 Composite
of all Measures
Performance Funding
Total 1 00.00% $7,036,662 Alamo Area COG 2.41% $169,651 Ark-Tex COG 3.37% $237,342 Aspermont Small Bus. Dvlpmt Ctr. 1.97% $138,831 Bee Community Action Agency 1.83% $129,050 Brazos Transit District 2.50% $176,054 Capital Area Rural Transportation System 4.13% $290,397 Central Texas Rural Transit District 3.15% $221,650 Cleburne City of 1.80% $126,446 Collin County Committee on Aging 2.08% $146,571 Colorado Valley Transit 2.63% $185,201 Community Act. Council of South Texas 2.51% $176,406 Community Council of Southwest Texas 2.86% $201,385 Community Services, Inc. 2.85% $200,611 Concho Valley COG 2.10% $147,626 Del Rio, City of 2.58% $181,753 East Texas COG 1.55% $108,855 El Paso, County of 3.00% $210,955 Fort Bend County 3.24% $228,054 Golden Crescent RPC 3.13% $220,243 Gulf Coast Center 1.23% $86,831 Heart of Texas COG 2.01% $141,575 Hill Country Transit District 2.83% $199,204 Kaufman Area Rural Transportation 2.91% $204,833 Kleberg County Human Services 1.81% $127,502 Lower Rio Grande Valley Dev. Council 1.95% $137,423 Panhandle Community Services 2.72% $191,675 Public Transit Services 2.96% $208,281 Rolling Plains Management Corp. 2.59% $182,527 Rural Economic Assist. League 3.15% $221,862 Services Program for Aging Needs 2.47% $174,013 Snr Center Res. & Public Transit Inc. 2.52% $177,109 South East Texas RPC 2.13% $150,159 South Padre Island, Town of 7.02% $493,682 South Plains Comm. Action Assoc. 2.26% $158,744 Texoma Area Paratransit System 2.24% $157,618 Transit System Inc., The 2.03% $142,771 Webb Co. Community Action Agency 2.99% $210,533 West Texas Opportunities, Inc. 2.46% $173,239

85
Scenario A. Urban Transit State Funding Summary of Results.
Principal City Current
Total Projected
2010 Total DifferenceTotal Urban $10,059,374 $10,059,374 $0
Total Urban Transit District $9,397,468 $9,617,038 $219,570 Abilene $ 364,513 $318,041 ($46,472)Amarillo $ 405,819 $366,646 ($39,173)Beaumont $ 439,859 $375,318 ($64,541)Brownsville $ 569,719 $532,933 ($36,786)Cleburne (New) $196,820 $196,820 College Station-Bryan $373,278 $341,301 ($31,978)Conroe (New) $205,189 $205,189 Galveston $ 511,198 $454,498 ($56,699)Georgetown (New) $205,743 $205,743 Harlingen $ 213,120 $204,160 ($8,960)Killeen $ 404,769 $380,499 ($24,270)Lake Jackson-Angleton $173,061 $151,711 ($21,350)Laredo $ 708,885 $647,622 ($61,263)Longview $ 238,830 $209,757 ($29,073)Lubbock $ 634,681 $544,306 ($90,375)McAllen $ 467,943 $392,121 ($75,822)McKinney $ 254,272 $334,045 $79,773 Midland-Odessa $ 440,264 $369,064 ($71,201)New Braunfels (New) $210,301 $210,301 Port Arthur $300,837 $252,929 ($47,908)San Angelo $266,188 $225,691 ($40,498)San Marcos (New) $232,438 $232,438 Sherman $ 236,608 $209,642 ($26,966)Temple $ 262,261 $241,101 ($21,160)Texarkana $ 250,284 $223,843 ($26,441)Texas City $210,550 $194,229 ($16,320)The Woodlands $417,689 $476,273 $58,584 Tyler $ 274,861 $263,737 ($11,124)Victoria $ 273,655 $240,513 ($33,142)Waco $ 401,623 $361,413 ($40,210)Wichita Falls $302,699 $255,154 ($47,545)
Limited Eligibility Providers $661,908 $442,336 ($219,572)Arlington $213,558 $143,227 ($70,331) $341,663 Cap* Grand Prairie $151,798 $101,540 ($50,258) $170,584 Cap* Mesquite $139,415 $91,080 ($48,335) $142,455 Cap* NETS $157,134 $106,488 ($50,646) $116,134 Cap*
*Limited eligibility providers are limited by statute to funding not to exceed these cap levels

86
Scenario A. Rural Transit State Funding Summary of Results.
Rural Transit District *Impacted by new urbanized area
Current Total
Projected 2010 Total Difference
Total $ 18,682,070 $18,682,070 $0Alamo Area COG* $900,803 $899,103 ($1,700)Ark-Tex COG $640,334 $615,562 ($24,772)Aspermont Small Bus. Dvlpmt Ctr. $268,166 $261,002 ($7,164)Bee Community Action Agency $288,586 $284,578 ($4,008)Brazos Transit District* $1,628,661 $1,594,660 ($34,001)Capital Area Rural Transportation System* $1,032,678 $1,052,835 $20,157 Central Texas Rural Transit District $627,089 $610,331 ($16,758)Cleburne City of* $289,202 $236,137 ($53,065)Collin County Committee on Aging $233,830 $285,438 $51,608 Colorado Valley Transit $396,015 $402,086 $6,071 Community Act. Council of South Texas $359,063 $367,441 $8,378 Community Council of Southwest Texas $494,477 $491,927 ($2,550)Community Services, Inc. $423,691 $450,406 $26,715 Concho Valley COG $411,007 $404,571 ($6,436)Del Rio, City of $277,937 $277,816 ($121)East Texas COG $1,110,851 $1,097,858 ($12,993)El Paso, County of $255,042 $289,043 $34,001 Fort Bend County $280,889 $291,939 $11,050 Golden Crescent RPC $543,451 $529,365 ($14,086)Gulf Coast Center $261,982 $260,768 ($1,214)Heart of Texas COG $463,548 $452,620 ($10,928)Hill Country Transit District $530,944 $537,987 $7,043 Kaufman Area Rural Transportation $331,927 $387,421 $55,494 Kleberg County Human Services $197,045 $192,430 ($4,615)Lower Rio Grande Valley Dev. Council $353,318 $362,789 $9,471 Panhandle Community Services $841,610 $820,967 ($20,643)Public Transit Services $412,604 $426,690 $14,086 Rolling Plains Management Corp. $384,665 $369,729 ($14,936)Rural Economic Assist. League $389,401 $380,173 ($9,228)Services Program for Aging Needs $269,408 $310,695 $41,287 Snr Center Res. & Public Transit Inc. $295,721 $301,672 $5,951 South East Texas RPC $371,103 $340,988 ($30,115)South Padre Island, Town of $462,634 $462,512 ($122)South Plains Comm. Action Assoc. $651,085 $624,006 ($27,079)Texoma Area Paratransit System $531,036 $533,100 $2,064 Transit System Inc., The $215,727 $229,327 $13,600 Webb Co. Community Action Agency $263,272 $278,572 $15,300 West Texas Opportunities, Inc. $993,268 $967,526 ($25,742)

87
Scenario A. Rural Transit Federal Funding Summary of Results.
Rural Transit District *Impacted by new urbanized area
Current Total
Projected 2010 Total Difference
Total $ 20,104,753 $20,104,753 $0 Alamo Area COG $969,402 $967,573 ($1,829)Ark-Tex COG $689,097 $662,438 ($26,659)Aspermont Small Bus. Dvlpmt Ctr. $288,588 $280,878 ($7,710)Bee Community Action Agency $310,562 $306,250 ($4,312)Brazos Transit District $1,752,688 $1,716,098 ($36,590)Capital Area Rural Transportation System $1,111,318 $1,133,011 $21,693 Central Texas Rural Transit District $674,842 $656,809 ($18,033)Cleburne City of $311,225 $254,119 ($57,106)Collin County Committee on Aging $251,636 $307,175 $55,539 Colorado Valley Transit $426,172 $432,706 $6,534 Community Act. Council of South Texas $386,406 $395,423 $9,017 Community Council of Southwest Texas $532,132 $529,388 ($2,744)Community Services, Inc. $455,956 $484,706 $28,750 Concho Valley COG $442,306 $435,380 ($6,926)Del Rio, City of $299,102 $298,971 ($131)East Texas COG $1,195,445 $1,181,462 ($13,983)El Paso, County of $274,465 $311,055 $36,590 Fort Bend County $302,279 $314,171 $11,892 Golden Crescent RPC $584,835 $569,677 ($15,158)Gulf Coast Center $281,934 $280,627 ($1,307)Heart of Texas COG $498,849 $487,088 ($11,761)Hill Country Transit District $571,376 $578,955 $7,579 Kaufman Area Rural Transportation $357,204 $416,924 $59,720 Kleberg County Human Services $212,051 $207,085 ($4,966)Lower Rio Grande Valley Dev. Council $380,223 $390,416 $10,193 Panhandle Community Services $905,701 $883,486 ($22,215)Public Transit Services $444,025 $459,183 $15,158 Rolling Plains Management Corp. $413,958 $397,885 ($16,073)Rural Economic Assist. League $419,056 $409,124 ($9,932)Services Program for Aging Needs $289,925 $334,355 $44,430 Snr Center Res. & Public Transit Inc. $318,242 $324,645 $6,403 South East Texas RPC $399,362 $366,954 ($32,408)South Padre Island, Town of $497,864 $497,733 ($131)South Plains Comm. Action Assoc. $700,667 $671,526 ($29,141)Texoma Area Paratransit System $571,476 $573,698 $2,222 Transit System Inc., The $232,155 $246,791 $14,636 Webb Co. Community Action Agency $283,321 $299,786 $16,465 West Texas Opportunities, Inc. $1,068,908 $ 1,041,202 ($27,706)

88
Scenario A. Rural Transit Combined State and Federal Funding Summary of Results.
Rural Transit District *Impacted by new urbanized area
Current Total
Projected 2010 W/O
New Urbanized
Difference from
Current
Projected 2010 Total with New Urbanized
Difference from
Current Total $38,786,046 $38,786,046 $0 $38,786,046 $0 Alamo Area COG* $1,870,205 $1,982,646 $112,441 $1,866,676 ($3,529)Ark-Tex COG $1,329,431 $1,246,991 ($82,440) $1,278,000 ($51,431)Aspermont Small Bus. Dvlpmt Ctr. $556,754 $536,333 ($20,421) $541,880 ($14,874)Bee Community Action Agency $599,148 $579,735 ($19,413) $590,828 ($8,320)Brazos Transit District* $3,381,349 $3,357,146 ($24,203) $3,310,758 ($70,591)Capital Area Rural Transportation System* $2,143,996 $2,508,041 $364,045 $2,185,846 $41,850 Central Texas Rural Transit District $1,301,931 $1,240,668 ($61,263) $1,267,140 ($34,791)Cleburne City of* $600,427 $625,386 $24,959 $490,256 ($110,171)Collin County Committee on Aging $485,466 $578,998 $93,532 $592,613 $107,147 Colorado Valley Transit $822,187 $816,388 ($5,799) $834,792 $12,605 Community Act. Council of South Texas $745,469 $749,503 $4,034 $762,864 $17,395 Community Council of Southwest Texas $1,026,609 $1,004,927 ($21,682) $1,021,315 ($5,294)Community Services, Inc. $879,647 $912,170 $32,523 $935,112 $55,465 Concho Valley COG $853,313 $831,883 ($21,430) $839,951 ($13,362)Del Rio, City of $577,039 $569,980 ($7,059) $576,787 ($252)East Texas COG $2,306,296 $2,195,116 ( $111,180) $2,279,320 ($26,976)El Paso, County of $529,507 $591,778 $62,271 $600,098 $70,591 Fort Bend County $583,168 $599,303 $16,135 $606,110 $22,942 Golden Crescent RPC $1,128,286 $1,075,847 ($52,439) $1,099,042 ($29,244)Gulf Coast Center $543,916 $526,017 ($17,899) $541,395 ($2,521)Heart of Texas COG $962,397 $915,254 ($47,143) $939,708 ($22,689)Hill Country Transit District $1,102,320 $1,092,992 ($9 ,328) $1,116,942 $14,622 Kaufman Area Rural Transportation $689,131 $786,445 $97,314 $804,345 $115,214 Kleberg County Human Services $409,096 $394,978 ($14,118) $399,515 ($9,581)Lower Rio Grande Valley Dev. Council $733,541 $733,793 $252 $753,205 $19,664 Panhandle Community Services $1,747,311 $1,672,183 ($75,128) $1,704,453 ($42,858)Public Transit Services $856,629 $866,713 $10,084 $885,873 $29,244 Rolling Plains Management Corp. $798,623 $756,017 ($42,606) $767,614 ($31,009)Rural Economic Assist. League $808,457 $775,682 ($32,775) $789,297 ($19,160)Services Program for Aging Needs $559,333 $631,437 $72,104 $645,050 $85,717 Snr Center Res. & Public Transit Inc. $613,963 $614,215 $252 $626,317 $12,354 South East Texas RPC $770,465 $690,799 ($79,666) $707,942 ($62,523)South Padre Island, Town of $960,498 $959,993 ($505) $960,245 ($253)South Plains Comm. Action Assoc. $1,351,752 $1,267,296 ($84,456) $1,295,532 ($56,220)Texoma Area Paratransit System $1,102,512 $1,076,293 ( $26,219) $1,106,798 $4,286 Transit System Inc., The $447,882 $467,546 $19,664 $476,118 $28,236 Webb Co. Community Action Agency $546,593 $574,073 $27,480 $578,358 $31,765 West Texas Opportunities, Inc. $2,061,399 $1,981,481 ($79 ,918) $2,007,951 ($53,448)

89
APPENDIX F: SCENARIO B FUNDING RESULTS
Scenario B. Urban Transit Needs Factor - Current and Projected 2010.
Current (based on 2000 Census) Projected 2010
Principal City Population Adjusted
Population Needs Factor Po pulation
Adjusted Population
Needs Factor
Total Urban 4,254,890 3,256,332 4, 755,192 3, 297,013 Total Urban Transit Districts 3,356,007 3,020,019 100% 3,736,370 3,094,353 100%Abilene 107,041 107,041 3.54% 112,253 112,253 3.63%Amarillo 179,312 179,312 5.94% 201,289 199,999 6.46%Beaumont 139,304 139,304 4.61% 140,223 140,223 4.53%Brownsville 165,776 165,776 5.49% 214,428 199,999 6.46%College Station-Bryan 132,500 132,500 4.39% 151,722 151,722 4.90%Galveston 54,770 54,770 1.81% 54,240 54,240 1.75%Harlingen 110,770 110,770 3.67% 132,033 132,033 4.27%Killeen 167,976 167,976 5.56% 200,475 199,999 6.46%Lake Jackson-Angleton 73,416 73,416 2.43% 78,789 78,789 2.55%Laredo 175,586 175,586 5.81% 227,202 199,999 6.46%Longview 78,070 78,070 2.59% 83,225 83,225 2.69%Lubbock 202,225 199,999 6.62% 223,853 199,999 6.46%McAllen 523,144 199,999 6.62% 739,217 199,999 6.46%McKinney 54,525 54,525 1.81% - - 0.00%Midland - Odessa 210,616 199,999 6.62% 235,546 199,999 6.46%Port Arthur 114,656 114,656 3.80% 114,274 114,274 3.69%San Angelo 87,969 87,969 2.91% 87,710 87,710 2.83%Sherman 56,168 56,168 1.86% 62,140 62,140 2.01%Temple 71,937 71,937 2.38% 86,175 86,175 2.78%Texarkana 48,767 48,767 1.61% 53,987 53,987 1.74%Texas City 96,417 96,417 3.19% 79,122 79,122 2.56%The Woodlands 89,445 89,445 2.96% - - 0.00%Tyler 101,494 101,494 3.36% 125,471 125,471 4.05%Victoria 61,529 61,529 2.04% 65,378 65,378 2.11%Waco 153,198 153,198 5.07% 170,155 170,155 5.50%Wichita Falls 99,396 99,396 3.29% 97,463 97,463 3.15%
Limited Eligibility Providers 898,883 36,313 100% 1,018,822
202,660 100%
Arlington 335,164 86,396 36.56% 387,086 74,561 36.79%Grand Prairie 126,889 37,995 16.08% 154,157 32,673 16.12%Mesquite 123,800 34,209 14.48% 136,565 27,424 13.53%NETS 313,030 77,713 32.89% 341,014 68,002 33.55%

90
Scenario B. Rural Transit District Needs Factor - Current and Projected 2010. Current (Census 2000) Projected 2010 Rural Transit District *Impacted by Merger to Very Large Urbanized Area Population
Land Area
Needs Factor Po pulation
Land Area 25%
Needs Factor
Total 5,762,803 251,954 100% 6,455,670 251,437 100%Ark-Tex COG 221,701 5,761 3.46% 230,739 5,761 3.25%Aspermont Small Bus. Dvlpmt Ctr. 9,877 6,317 1.15% 39,478 6,317 1.09%Bee Community Action Agency 75,844 4,051 1.39% 82,047 4,051 1.36%Brazos Transit District* 798,164 16,910 12.07% 870,258 16,835 11.79%Capital Area Rural Transportation System* 427,869 7,192 6.28% 494,444 7,082 6.45%Central Texas Rural Transit District 184,925 10,693 3.47% 195,080 10,690 3.33%Cleburne City of* 103,238 710 1.41% 78,295 677 0.98%Collin County Committee on Aging 56,516 689 0.80% 100,216 650 1.23%Colorado Valley Transit 117,124 3,220 1.84% 135,438 3,220 1.89%Community Act. Council of South Texas 84,180 5,149 1.61% 100,195 5,149 1.68%Community Council of Southwest Texas 109,525 11,138 2.53% 120,725 11,138 2.51%Community Services, Inc. 135,414 1,924 1.95% 170,698 1,921 2.17%Concho Valley COG 56,505 15,309 2.26% 58,541 15,309 2.20%Del Rio, City of 44,856 3,170 0.90% 50,067 3,170 0.90%East Texas COG 565,616 9,613 8.32% 624,278 9,607 8.21%El Paso, County of 31,157 809 0.49% 59,174 781 0.77%Fort Bend County 37,891 747 0.57% 50,701 705 0.66%Golden Crescent RPC 160,333 7,088 2.79% 169,456 7,087 2.67%Gulf Coast Center 102,725 1,570 1.49% 114,403 1,545 1.48%Heart of Texas COG 168,338 5,478 2.73% 180,734 5,473 2.64%Hill Country Transit District 155,387 8,321 2.85% 179,046 8,313 2.91%Kaufman Area Rural Transportation 82,737 896 1.17% 132,068 886 1.62%Kleberg County Human Services 31,963 2,328 0.65% 32,460 2,328 0.61%Lower Rio Grande Valley Dev. Council 122,660 2,641 1.86% 144,271 2,614 1.94%Panhandle Community Services 223,550 25,749 5.46% 235,286 25,744 5.29%Public Transit Services 117,544 2,765 1.80% 141,657 2,763 1.92%Rolling Plains Management Corp. 86,084 6,553 1.77% 85,719 6,553 1.65%Rural Economic Assist. League 96,923 2,491 1.51% 102,017 2,491 1.43%Services Program for Aging Needs 62,453 748 0.89% 99,474 711 1.23%Snr Center Res. & Public Transit Inc. 76,596 841 1.08% 89,977 841 1.13%South East Texas RPC 131,130 2,027 1.91% 125,421 2,023 1.66%South Padre Island, Town of 2,422 2 0.03% 2,627 2 0.03%South Plains Comm. Action Assoc. 201,705 15,342 4.15% 206,432 15,337 3.92%Texoma Area Paratransit System 200,664 5,601 3.17% 226,167 5,599 3.18%Transit System Inc., The 47,909 609 0.68% 63,252 609 0.80%Webb Co. Community Action Agency 17,531 3,314 0.56% 30,388 3,313 0.68%West Texas Opportunities, Inc. 190,752 44,056 6.85% 195,180 44,053 6.65%

91
Scenario B. Urban Transit Needs Funding - Current and Projected 2010.
Principal City
Current (based on 2000 Census) Projected 2010
Difference Needs Factor Needs
Funding Needs Factor
Needs Funding
Total $5,029,687 $5,029,687 $0 Total Urban Transit Districts 1 00% $4,698,734 100% $4,770,914 $72,180Abilene 3 .54% $166,541 3.63% $173,073 $6,532 Amarillo 5 .94% $278,985 6.46% $308,361 $29,376 Beaumont 4 .61% $216,738 4.53% $216,198 ($540)Brownsville 5 .49% $257,925 6.46% $308,361 $50,436 College Station-Bryan 4.39% $206,152 4.90% $233,927 $27,775 Galveston 1. 81% $85,215 1.75% $83,628 ($1,587)Harlingen 3 .67% $172,343 4.27% $203,570 $31,227 Killeen 5 .56% $261,348 6.46% $308,361 $47,014 Lake Jackson-Angleton 2.43% $114,225 2.55% $121,478 $7,253 Laredo 5 .81% $273,188 6.46% $308,361 $35,173 Longview 2. 59% $121,466 2.69% $128,317 $6,851 Lubbock 6 .62% $311,171 6.46% $308,361 ($2,810)McAllen 6 .62% $311,171 6.46% $308,361 ($2,810)McKinney 1. 81% $84,833 0.00% $0 ($84,833)Midland - Odessa 6.62% $311,171 6.46% $308,361 ($2,810)Port Arthur 3.80% $178,389 3.69% $176,189 ($2,200)San Angelo 2.91% $136,868 2.83% $135,232 ($1,635)Sherman 1. 86% $87,390 2.01% $95,808 $8,419 Temple 2 .38% $111,924 2.78% $132,866 $20,942 Texarkana 1. 61% $75,875 1.74% $83,238 $7,363 Texas City 3.19% $150,012 2.56% $121,991 ($28,020)The Woodlands 2.96% $139,164 0.00% $0 ($139,164)Tyler 3 .36% $157,911 4.05% $193,453 $35,542 Victoria 2. 04% $95,731 2.11% $100,801 $5,070 Waco 5 .07% $238,355 5.50% $262,347 $23,992 Wichita Falls 3.29% $154,646 3.15% $150,270 ($4,377)
Limited Eligibility Provider 1 00% $330,954 100% $258,773 ($72,180)Arlington 3 6.56% $120,996 36.79% $95,206 ($25,791)Grand Prairie 16.08% $53,211 16.12% $41,720 ($11,492)Mesquite 14 .48% $47,909 13.53% $35,017 ($12,892)NETS 3 2.89% $108,836 33.55% $86,831 ($22,006)

92
Scenario B. Rural Transit Needs State Funding - Current and Projected 2010. Rural Transit District Current Projected 2010
Difference *Impacted by Merger to Very Large Urbanized Area
Needs Factor
Needs Funding
Needs Factor
Needs Funding
Total 1 00% $12,143,345 100% $12,143,345 $0 Alamo Area COG* 6.12% $743,158 6.11% $741,458 ($1,700)Ark-Tex COG 3.46% $419,787 3.25% $395,015 ($24,772)Aspermont Small Bus. Dvlpmt Ctr. 1.15% $139,160 1.09% $131,996 ($7,164)Bee Community Action Agency 1.39% $168,668 1.36% $164,660 ($4,008)Brazos Transit District* 12.07% $1,465,065 11.79% $1,431,064 ($34,001)Capital Area Rural Transportation System* 6.28% $762,830 6.45% $782,987 $20,157 Central Texas Rural Transit District 3.47% $421,123 3.33% $404,365 ($16,758)Cleburne City of* 1.41% $171,703 0.98% $118,638 ($53,065)Collin County Committee on Aging 0.80% $97,631 1.23% $149,239 $51,608 Colorado Valley Transit 1.84% $223,919 1.89% $229,990 $6,071 Community Act. Council of South Texas 1.61% $195,140 1.68% $203,518 $8,378 Community Council of Southwest Texas 2.53% $307,342 2.51% $304,792 ($2,550)Community Services, Inc. 1.95% $237,276 2.17% $263,991 $26,715 Concho Valley COG 2.26% $273,827 2.20% $267,391 ($6,436)Del Rio, City of 0.90% $109,045 0.90% $108,924 ($121)East Texas COG 8.32% $1,009,699 8.21% $996,706 ($12,993)El Paso, County of 0.49% $59,015 0.77% $93,016 $34,001 Fort Bend County 0.57% $68,973 0.66% $80,023 $11,050 Golden Crescent RPC 2.79% $338,793 2.67% $324,707 ($14,086)Gulf Coast Center 1.49% $181,296 1.48% $180,082 ($1,214)Heart of Texas COG 2.73% $331,992 2.64% $321,064 ($10,928)Hill Country Transit District 2.85% $ 345,836 2.91% $352,879 $7,043 Kaufman Area Rural Transportation 1.17% $141,589 1.62% $197,083 $55,494 Kleberg County Human Services 0.65% $78,566 0.61% $73,951 ($4,615)Lower Rio Grande Valley Dev. Council 1.86% $225,619 1.94% $235,090 $9,471 Panhandle Community Services 5.46% $663,499 5.29% $642,856 ($20,643)Public Transit Services 1.80% $219,062 1.92% $233,148 $14,086 Rolling Plains Management Corp. 1.77% $215,054 1.65% $200,118 ($14,936)Rural Economic Assist. League 1.51% $183,239 1.43% $174,011 ($9,228)Services Program for Aging Needs 0.89% $107,709 1.23% $148,996 $41,287 Snr Center Res. & Public Transit Inc. 1.08% $131,145 1.13% $137,096 $5,951 South East Texas RPC 1.91% $231,569 1.66% $201,454 ($30,115)South Padre Island, Town of 0.03% $3,886 0.03% $3,764 ($122)South Plains Comm. Action Assoc. 4.15% $503,574 3.92% $476,495 ($27,079)Texoma Area Paratransit System 3.17% $384,572 3.18% $386,636 $2,064 Transit System Inc., The 0.68% $83,059 0.80% $96,659 $13,600 Webb Co. Community Action Agency 0.56% $67,637 0.68% $82,937 $15,300 West Texas Opportunities, Inc. 6.85% $ 832,288 6.65% $806,546 ($25,742)

93
Scenario B. Rural Transit Needs Federal Funding - Current and Projected 2010. Rural Transit District Current Projected 2010
Difference *Impacted by Merger to Very Large Urbanized Area
Needs Factor
Needs Funding
Needs Factor
Needs Funding
Total $20,104,352 $20,104,352 $0Alamo Area COG 6.12% $799,751 6.11% $797,922 ($1,829)Ark-Tex COG 3.46% $451,755 3.25% $425,096 ($26,659)Aspermont Small Bus. Dvlpmt Ctr. 1.15% $149,757 1.09% $142,047 ($7,710)Bee Community Action Agency 1.39% $181,512 1.36% $177,200 ($4,312)Brazos Transit District 12.07% $1,576,634 11.79% $1,540,044 ($36,590)Capital Area Rural Transportation System 6.28% $820,921 6.45% $842,614 $21,693 Central Texas Rural Transit District 3.47% $453,192 3.33% $435,159 ($18,033)Cleburne City of 1.41% $184,779 0.98% $127,673 ($57,106)Collin County Committee on Aging 0.80% $105,065 1.23% $160,604 $55,539 Colorado Valley Transit 1.84% $240,971 1.89% $247,505 $6,534 Community Act. Council of South Texas 1.61% $210,000 1.68% $219,017 $9,017 Community Council of Southwest Texas 2.53% $330,747 2.51% $328,003 ($2,744)Community Services, Inc. 1.95% $255,345 2.17% $284,095 $28,750 Concho Valley COG 2.26% $294,680 2.20% $287,754 ($6,926)Del Rio, City of 0.90% $117,349 0.90% $117,218 ($131)East Texas COG 8.32% $1,086,590 8.21% $1,072,607 ($13,983)El Paso, County of 0.49% $63,510 0.77% $100,100 $36,590 Fort Bend County 0.57% $74,225 0.66% $86,117 $11,892 Golden Crescent RPC 2.79% $364,592 2.67% $349,434 ($15,158)Gulf Coast Center 1.49% $195,103 1.48% $193,796 ($1,307)Heart of Texas COG 2.73% $357,274 2.64% $345,513 ($11,761)Hill Country Transit District 2.85% $372,172 2 .91% $379,751 $7,579 Kaufman Area Rural Transportation 1.17% $152,371 1.62% $212,091 $59,720 Kleberg County Human Services 0.65% $84,549 0.61% $79,583 ($4,966)Lower Rio Grande Valley Dev. Council 1.86% $242,800 1.94% $252,993 $10,193 Panhandle Community Services 5.46% $714,026 5.29% $691,811 ($22,215)Public Transit Services 1.80% $235,744 1.92% $250,902 $15,158 Rolling Plains Management Corp. 1.77% $231,431 1.65% $215,358 ($16,073)Rural Economic Assist. League 1.51% $197,194 1.43% $187,262 ($9,932)Services Program for Aging Needs 0.89% $115,912 1.23% $160,342 $44,430 Snr Center Res. & Public Transit Inc. 1.08% $141,133 1.13% $147,536 $6,403 South East Texas RPC 1.91% $249,203 1.66% $216,795 ($32,408)South Padre Island, Town of 0.03% $4,182 0.03% $4,051 ($131)South Plains Comm. Action Assoc. 4.15% $541,923 3.92% $512,782 ($29,141)Texoma Area Paratransit System 3.17% $413,858 3.18% $416,080 $2,222 Transit System Inc., The 0.68% $89,384 0.80% $104,020 $14,636 Webb Co. Community Action Agency 0.56% $72,788 0.68% $89,253 $16,465 West Texas Opportunities, Inc. 6.85% $895,669 6 .65% $867,963 ($27,706)
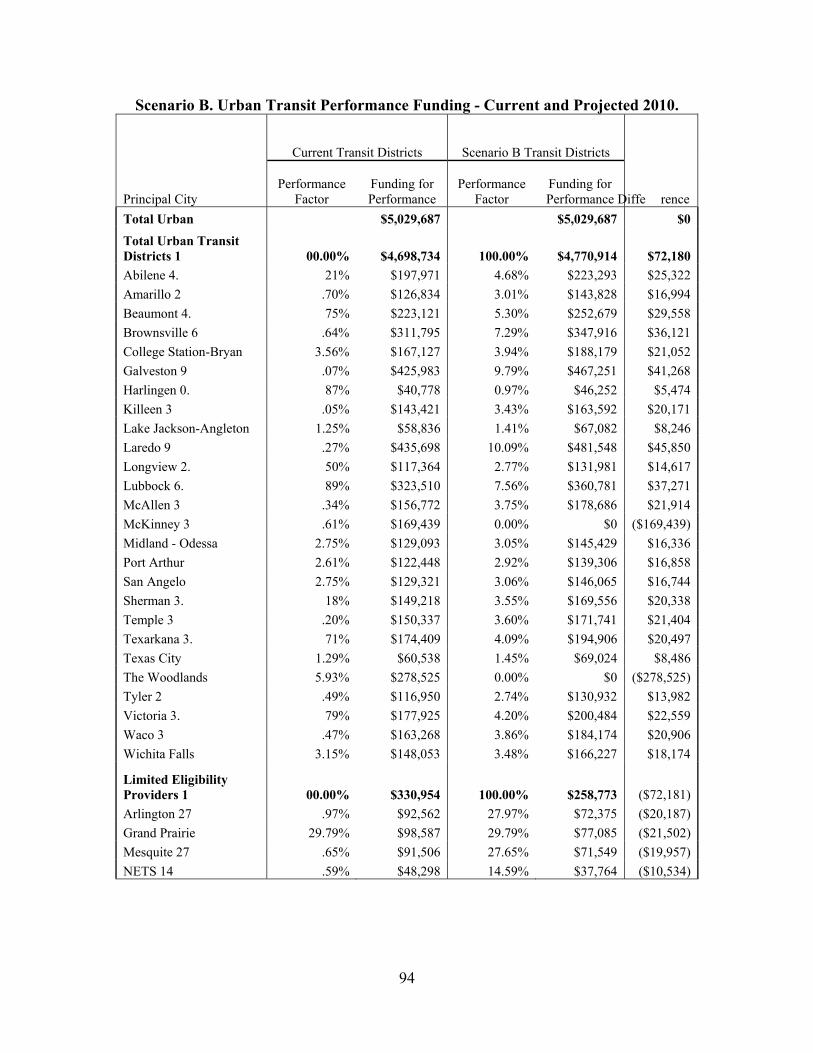
94
Scenario B. Urban Transit Performance Funding - Current and Projected 2010.
Principal City
Current Transit Districts Scenario B Transit Districts
Performance Factor
Funding for Performance
Performance Factor
Funding for Performance Diffe rence
Total Urban $5,029,687 $5,029,687 $0 Total Urban Transit Districts 1 00.00% $4,698,734 100.00% $4,770,914 $72,180 Abilene 4. 21% $197,971 4.68% $223,293 $25,322 Amarillo 2 .70% $126,834 3.01% $143,828 $16,994 Beaumont 4. 75% $223,121 5.30% $252,679 $29,558 Brownsville 6 .64% $311,795 7.29% $347,916 $36,121 College Station-Bryan 3.56% $167,127 3.94% $188,179 $21,052 Galveston 9 .07% $425,983 9.79% $467,251 $41,268 Harlingen 0. 87% $40,778 0.97% $46,252 $5,474 Killeen 3 .05% $143,421 3.43% $163,592 $20,171 Lake Jackson-Angleton 1.25% $58,836 1.41% $67,082 $8,246 Laredo 9 .27% $435,698 10.09% $481,548 $45,850 Longview 2. 50% $117,364 2.77% $131,981 $14,617 Lubbock 6. 89% $323,510 7.56% $360,781 $37,271 McAllen 3 .34% $156,772 3.75% $178,686 $21,914 McKinney 3 .61% $169,439 0.00% $0 ($169,439)Midland - Odessa 2.75% $129,093 3.05% $145,429 $16,336 Port Arthur 2.61% $122,448 2.92% $139,306 $16,858 San Angelo 2.75% $129,321 3.06% $146,065 $16,744 Sherman 3. 18% $149,218 3.55% $169,556 $20,338 Temple 3 .20% $150,337 3.60% $171,741 $21,404 Texarkana 3. 71% $174,409 4.09% $194,906 $20,497 Texas City 1.29% $60,538 1.45% $69,024 $8,486 The Woodlands 5.93% $278,525 0.00% $0 ($278,525)Tyler 2 .49% $116,950 2.74% $130,932 $13,982 Victoria 3. 79% $177,925 4.20% $200,484 $22,559 Waco 3 .47% $163,268 3.86% $184,174 $20,906 Wichita Falls 3.15% $148,053 3.48% $166,227 $18,174
Limited Eligibility Providers 1 00.00% $330,954 100.00% $258,773 ($72,181)Arlington 27 .97% $92,562 27.97% $72,375 ($20,187)Grand Prairie 29.79% $98,587 29.79% $77,085 ($21,502)Mesquite 27 .65% $91,506 27.65% $71,549 ($19,957)NETS 14 .59% $48,298 14.59% $37,764 ($10,534)

95
Scenario B. Urban Transit State Funding Summary of Results. Principal City *Impacted by Merger to Very Large Urbanized Area
Current Total
Projected 2010 Total Difference
Total Urban $10,059,374 $10,059,374 $0
Total Urban Transit Districts $9,397,467 $9,541,827 $144,360
Abilene $ 364,513 $396,366 $31,853 Amarillo $ 405,819 $452,189 $46,370 Beaumont $ 439,859 $468,877 $29,018 Brownsville $ 569,719 $656,277 $86,558 College Station-Bryan $373,278 $422,106 $48,828 Galveston $ 511,198 $550,879 $39,681 Harlingen $ 213,120 $249,822 $36,702 Killeen $ 404,769 $471,953 $67,184 Lake Jackson-Angleton $173,061 $188,560 $15,499 Laredo $ 708,885 $789,909 $81,024 Longview $ 238,830 $260,298 $21,468 Lubbock $ 634,681 $669,142 $34,461 McAllen $ 467,943 $487,048 $19,105 McKinney* $ 254,272 $0 ($254,272)Midland - Odessa $440,264 $453,790 $13,526 Port Arthur $300,837 $315,495 $14,658 San Angelo $266,188 $281,297 $15,109 Sherman $ 236,608 $265,365 $28,757 Temple $ 262,261 $304,607 $42,346 Texarkana $ 250,284 $278,144 $27,860 Texas City* $210,550 $191,015 ($19,535)The Woodlands* $417,689 $0 ($417,689)Tyler $ 274,861 $324,385 $49,524 Victoria $ 273,655 $301,285 $27,630 Waco $ 401,623 $446,521 $44,898 Wichita Falls $302,699 $316,497 $13,798
Limited Eligibility Provider $661,907 $517,547 ($144,360) Arlington $213,559 $167,580 ($45,979) $341,663 Cap* Grand Prairie $151,799 $118,805 ($32,994) $170,584 Cap* Mesquite $139,416 $106,566 ($32,850) $142,455 Cap* NETS $157,134 $124,595 ($32,539) $116,134 Cap*
*Limited eligibility providers are limited by statute to funding not to exceed these cap levels

96
Scenario B. Rural Transit State Funding Summary of Results. Rural Transit District *Impacted by Merger to Very Large Urbanized Area
Current Total
Projected 2010 Total Difference
Total $ 18,682,070 $18,682,070 $0 Alamo Area COG* $900,803 $899,103 ($1,700) Ark-Tex COG $640,334 $615,562 ($24,772) Aspermont Small Bus. Dvlpmt Ctr. $268,166 $261,002 ($7,164) Bee Community Action Agency $288,586 $284,578 ($4,008) Brazos Transit District* $1,628,661 $1,594,660 ($34,001) Capital Area Rural Transportation System* $1,032,678 $1,052,835 $20,157 Central Texas Rural Transit District $627,089 $610,331 ($16,758) Cleburne City of* $289,202 $236,137 ($53,065) Collin County Committee on Aging $233,830 $285,438 $51,608 Colorado Valley Transit $396,015 $402,086 $6,071 Community Act. Council of South Texas $359,063 $367,441 $8,378 Community Council of Southwest Texas $494,477 $491,927 ($2,550) Community Services, Inc. $423,691 $450,406 $26,715 Concho Valley COG $411,007 $404,571 ($6,436) Del Rio, City of $277,937 $277,816 ($121) East Texas COG $1,110,851 $1,097,858 ($12,993) El Paso, County of $255,042 $289,043 $34,001 Fort Bend County $280,889 $291,939 $11,050 Golden Crescent RPC $543,451 $529,365 ($14,086) Gulf Coast Center $261,982 $260,768 ($1,214) Heart of Texas COG $463,548 $452,620 ($10,928) Hill Country Transit District $530,944 $537,987 $7,043 Kaufman Area Rural Transportation $331,927 $387,421 $55,494 Kleberg County Human Services $197,045 $192,430 ($4,615) Lower Rio Grande Valley Dev. Council $353,318 $362,789 $9,471 Panhandle Community Services $841,610 $820,967 ($20,643) Public Transit Services $412,604 $426,690 $14,086 Rolling Plains Management Corp. $384,665 $369,729 ($14,936) Rural Economic Assist. League $389,401 $380,173 ($9,228) Services Program for Aging Needs $269,408 $310,695 $41,287 Snr Center Res. & Public Transit Inc. $295,721 $301,672 $5,951 South East Texas RPC $371,103 $340,988 ($30,115) South Padre Island, Town of $462,634 $462,512 ($122) South Plains Comm. Action Assoc. $651,085 $624,006 ($27,079) Texoma Area Paratransit System $531,036 $533,100 $2,064 Transit System Inc., The $215,727 $229,327 $13,600 Webb Co. Community Action Agency $263,272 $278,572 $15,300 West Texas Opportunities, Inc. $993,268 $967,526 ($25,742)

97
Scenario B. Rural Transit Federal Funding Summary of Results. Rural Transit District *Impacted by Merger to Very Large Urbanized Area
Current Total
Projected 2010 Total Difference
Total $ 20,104,753 $20,104,753 $0 Alamo Area COG $969,402 $967,573 ($1,829) Ark-Tex COG $689,097 $662,438 ($26,659) Aspermont Small Bus. Dvlpmt Ctr. $288,588 $280,878 ($7,710) Bee Community Action Agency $310,562 $306,250 ($4,312) Brazos Transit District $1,752,688 $1,716,098 ($36,590) Community Act. Council of South Texas $386,406 $395,423 $9,017 Capital Area Rural Transportation System $1,111,318 $1,133,011 $21,693 Community Council of Southwest Texas $532,132 $529,388 ($2,744) Cleburne City of $311,225 $254,119 ($57,106) Collin County Committee on Aging $251,636 $307,175 $55,539 Concho Valley COG $442,306 $435,380 ($6,926) Community Services, Inc. $455,956 $484,706 $28,750 Central Texas Rural Transit District $674,842 $656,809 ($18,033) Colorado Valley Transit $426,172 $432,706 $6,534 Del Rio, City of $299,102 $298,971 ($131) El Paso, County of $274,465 $311,055 $36,590 East Texas COG $1,195,445 $1,181,462 ($13,983) Fort Bend County $302,279 $314,171 $11,892 Gulf Coast Center $281,934 $280,627 ($1,307) Golden Crescent RPC $584,835 $569,677 ($15,158) Snr Center Res. & Public Transit Inc. $318,242 $324,645 $6,403 Hill Country Transit District $571,376 $578,955 $7,579 Heart of Texas COG $498,849 $487,088 ($11,761) Kaufman Area Rural Transportation $357,204 $416,924 $59,720 Kleberg County Human Services $212,051 $207,085 ($4,966) Lower Rio Grande Valley Dev. Council $380,223 $390,416 $10,193 Panhandle Community Services $905,701 $883,486 ($22,215) Public Transit Services $444,025 $459,183 $15,158 Rural Economic Assist. League $419,056 $409,124 ($9,932) Rolling Plains Management Corp. $413,958 $397,885 ($16,073) South East Texas RPC $399,362 $366,954 ($32,408) Services Program for Aging Needs $289,925 $334,355 $44,430 South Plains Comm. Action Assoc. $700,667 $671,526 ($29,141) South Padre Island, Town of $497,864 $497,733 ($131) Texoma Area Paratransit System $571,476 $573,698 $2,222 Transit System Inc., The $232,155 $246,791 $14,636 Webb Co. Community Action Agency $283,321 $299,786 $16,465 West Texas Opportunities, Inc. $1,068,908 $ 1,041,202 ($27,706)


99
APPENDIX G: SCENARIO C FUNDING RESULTS
Scenario C. Urban Transit District Needs Factor - Current and Projected 2010.
Current
(based on 2000 Census) Projected 2010
Principal City Population Adjusted
Population Needs Factor Po pulation
Adjusted Population
Needs Factor
Total Urban 4,254,890 3,256,332 5,247,373 3,789,194
Total Urban Transit Districts 3,356,007 3,020,019 100% 4,228,551 3,586,534 100%Abilene 107,041 107,041 3.54% 112,253 112,253 3.13%Amarillo 179,312 179,312 5.94% 201,289 199,999 5.58%Beaumont 139,304 139,304 4.61% 140,223 140,223 3.91%Brownsville 165,776 165,776 5.49% 214,428 199,999 5.58%Cleburne (New) 51,866 51,866 1.45%College Station-Bryan 132,500 132,500 4.39% 151,722 151,722 4.23%Conroe (New) 58,417 58,417 1.63%Galveston 54,770 54,770 1.81% 54,240 54,240 1.51%Georgetown 58,851 58,851 1.64%Harlingen 110,770 110,770 3.67% 132,033 132,033 3.68%Killeen 167,976 167,976 5.56% 200,475 199,999 5.58%Lake Jackson-Angleton 73,416 73,416 2.43% 78,789 78,789 2.20%Laredo 175,586 175,586 5.81% 227,202 199,999 5.58%Longview 78,070 78,070 2.59% 83,225 83,225 2.32%Lubbock 202,225 199,999 6.62% 223,853 199,999 5.58%McAllen 523,144 199,999 6.62% 739,217 199,999 5.58%McKinney 54,525 54,525 1.81% - - Midland-Odessa 210,616 199,999 6.62% 235,546 199,999 5.58%New Braunfels (New) 62,419 62,419 1.74%Port Arthur 114,656 114,656 3.80% 114,274 114,274 3.19%San Angelo 87,969 87,969 2.91% 87,710 87,710 2.45%San Marcos 79,748 79,748 2.22%Sherman 56,168 56,168 1.86% 62,140 62,140 1.73%Temple 71,937 71,937 2.38% 86,175 86,175 2.40%Texarkana 48,767 48,767 1.61% 53,987 53,987 1.51%Texas City 96,417 96,417 3.19% 79,122 79,122 2.21%The Woodlands 89,445 89,445 2.96% 180,880 180,880 5.04%Tyler 101,494 101,494 3.36% 125,471 125,471 3.50%Victoria 61,529 61,529 2.04% 65,378 65,378 1.82%Waco 153,198 153,198 5.07% 170,155 170,155 4.74%Wichita Falls 99,396 99,396 3.29% 97,463 97,463 2.72%

100
Limited Eligibility Provider 898,883 236,313 100% 1,018,822 202,660 100%Arlington 335,164 86,396 36.56% 387,086 74,561 36.79%Grand Prairie 126,889 37,995 16.08% 154,157 32,673 16.12%Mesquite 123,800 34,209 14.48% 136,565 27,424 13.53%NETS 313,030 77,713 32.89% 341,014 68,002 33.55%

101
Scenario C. Rural Transit District Needs Factor - Current and Projected 2010. Current (Census 2000) Projected 2010
Rural Transit District Population Land Area
Needs Factor Po pulation
Land Area 25%
Needs Factor
Total 5,762,803 251,954 100% 6,455,670 251,437 100% Alamo Area COG 392,995 10,130 6.12% 439,261 10,090 6.11%Ark-Tex COG 221,701 5,761 3.46% 230,739 5,761 3.25%Aspermont Small Bus. Dvlpmt Ctr. 39,877 6,317 1.15% 39,478 6,317 1.09%Bee Community Action Agency 75,844 4,051 1.39% 82,047 4,051 1.36%Brazos Transit District 798,164 16,910 12.07% 870,258 16,835 11.79%Capital Area Rural Transportation System 427,869 7,192 6.28% 494,444 7,082 6.45%Central Texas Rural Transit District 184,925 10,693 3.47% 195,080 10,690 3.33%Cleburne City of 103,238 710 1.41% 78,295 677 0.98%Collin County Committee on Aging 56,516 689 0.80% 100,216 650 1.23%Colorado Valley Transit 117,124 3,220 1.84% 135,438 3,220 1.89%Community Act. Council of South Texas 84,180 5,149 1.61% 100,195 5,149 1.68%Community Council of Southwest Texas 109,525 11,138 2.53% 120,725 11,138 2.51%Community Services, Inc. 135,414 1,924 1.95% 170,698 1,921 2.17%Concho Valley COG 56,505 15,309 2.26% 58,541 15,309 2.20%Del Rio, City of 44,856 3,170 0.90% 50,067 3,170 0.90%East Texas COG 565,616 9,613 8.32% 624,278 9,607 8.21%El Paso, County of 31,157 809 0.49% 59,174 781 0.77%Fort Bend County 37,891 747 0.57% 50,701 705 0.66%Golden Crescent RPC 160,333 7,088 2.79% 169,456 7,087 2.67%Gulf Coast Center 102,725 1,570 1.49% 114,403 1,545 1.48%Heart of Texas COG 168,338 5,478 2.73% 180,734 5,473 2.64%Hill Country Transit District 155,387 8,321 2.85% 179,046 8,313 2.91%Kaufman Area Rural Transportation 82,737 896 1.17% 132,068 886 1.62%Kleberg County Human Services 31,963 2,328 0.65% 32,460 2,328 0.61%Lower Rio Grande Valley Dev. Council 122,660 2,641 1.86% 144,271 2,614 1.94%Panhandle Community Services 223,550 25,749 5.46% 235,286 25,744 5.29%Public Transit Services 117,544 2,765 1.80% 141,657 2,763 1.92%Rolling Plains Management Corp. 86,084 6,553 1.77% 85,719 6,553 1.65%Rural Economic Assist. League 96,923 2,491 1.51% 102,017 2,491 1.43%Services Program for Aging Needs 62,453 748 0.89% 99,474 711 1.23%Snr Center Res. & Public Transit Inc. 76,596 841 1.08% 89,977 841 1.13%South East Texas RPC 131,130 2,027 1.91% 125,421 2,023 1.66%South Padre Island, Town of 2,422 2 0.03% 2,627 2 0.03%South Plains Comm. Action Assoc. 201,705 15,342 4.15% 206,432 15,337 3.92%Texoma Area Paratransit System 200,664 5,601 3.17% 226,167 5,599 3.18%Transit System Inc., The 47,909 609 0.68% 63,252 609 0.80%Webb Co. Community Action Agency 17,531 3,314 0.56% 30,388 3,313 0.68%

102
Scenario C. Urban Transit Needs State Funding - Current and Projected 2010.
Principal City
Current (based on 2000 Census) Projected 2010
Difference Needs Factor Needs
Funding Needs Factor
Needs Funding
Total Urban $ 5,029,687 $5,029,687 $0
Total Urban Transit Districts 1 00% $4,698,734 100% $4,799,656 $100,922 Abilene 3 .54% $166,541 3.13% $150,222 ($16,319)Amarillo 5 .94% $278,985 5.58% $267,647 ($11,337)Beaumont 4 .61% $216,738 3.91% $187,653 ($29,085)Brownsville 5 .49% $257,925 5.58% $267,647 $9,723 Cleburne 1.45% $6 9,409 $6 9,409 College Station-Bryan 4.39% $206,152 4.23% $203,041 ($3,111)Conroe 1.63% $7 8,176 $7 8,176 Galveston 1. 81% $85,215 1.51% $72,586 ($12,628)Georgetown 1.64% $7 8,757 $7 8,757 Harlingen 3 .67% $172,343 3.68% $176,692 $4,349 Killeen 5 .56% $261,348 5.58% $267,647 $6,300 Lake Jackson-Angleton 2.43% $114,225 2.20% $105,439 ($8,786)Laredo 5 .81% $273,188 5.58% $267,647 ($5,540)Longview 2 .59% $121,466 2.32% $111,375 ($10,091)Lubbock 6 .62% $311,171 5.58% $267,647 ($43,524)McAllen 6 .62% $311,171 5.58% $267,647 ($43,524)McKinney 1 .81% $84,833 ($84,833)Midland-Odessa 6 .62% $311,171 5.58% $267,647 ($43,524)New Braunfels 1.74% $8 3,532 $8 3,532 Port Arthur 3.80% $178,389 3.19% $152,926 ($25,462)San Angelo 2.91% $136,868 2.45% $117,377 ($19,490)San Marcos 2.22% $106,722 $106,722 Sherman 1. 86% $87,390 1.73% $83,158 ($4,231)Temple 2 .38% $111,924 2.40% $115,323 $3,399 Texarkana 1. 61% $75,875 1.51% $72,248 ($3,627)Texas City 3.19% $150,012 2.21% $105,885 ($44,127)The Woodlands 2.96% $139,164 5.04% $242,061 $102,897 Tyler 3 .36% $157,911 3.50% $167,911 $10,000 Victoria 2. 04% $95,731 1.82% $87,492 ($8,239)Waco 5 .07% $238,355 4.74% $227,709 ($10,646)Wichita Falls 3.29% $154,646 2.72% $130,429 ($24,217)Limited Eligibility Provider 1 00% $330,954 100% $230,031 ($100,922)Arlington 3 6.56% $120,996 36.79% $84,631 ($36,365)Grand Prairie 16.08% $53,211 16.12% $37,086 ($16,126)Mesquite 14 .48% $47,909 13.53% $31,128 ($16,781)NETS 3 2.89% $108,836 33.55% $77,186 ($31,650)
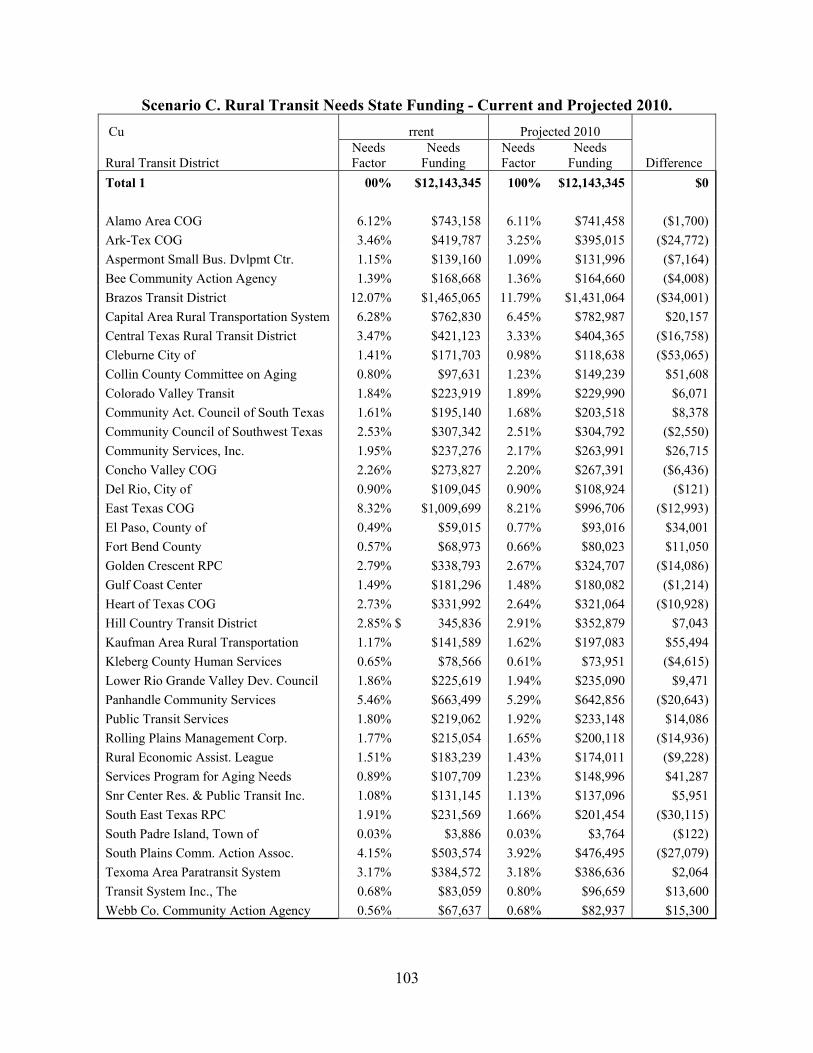
103
Scenario C. Rural Transit Needs State Funding - Current and Projected 2010. Cu rrent Projected 2010
Difference Rural Transit District Needs Factor
Needs Funding
Needs Factor
Needs Funding
Total 1 00% $12,143,345 100% $12,143,345 $0 Alamo Area COG 6.12% $743,158 6.11% $741,458 ($1,700)Ark-Tex COG 3.46% $419,787 3.25% $395,015 ($24,772)Aspermont Small Bus. Dvlpmt Ctr. 1.15% $139,160 1.09% $131,996 ($7,164)Bee Community Action Agency 1.39% $168,668 1.36% $164,660 ($4,008)Brazos Transit District 12.07% $1,465,065 11.79% $1,431,064 ($34,001)Capital Area Rural Transportation System 6.28% $762,830 6.45% $782,987 $20,157 Central Texas Rural Transit District 3.47% $421,123 3.33% $404,365 ($16,758)Cleburne City of 1.41% $171,703 0.98% $118,638 ($53,065)Collin County Committee on Aging 0.80% $97,631 1.23% $149,239 $51,608 Colorado Valley Transit 1.84% $223,919 1.89% $229,990 $6,071 Community Act. Council of South Texas 1.61% $195,140 1.68% $203,518 $8,378 Community Council of Southwest Texas 2.53% $307,342 2.51% $304,792 ($2,550)Community Services, Inc. 1.95% $237,276 2.17% $263,991 $26,715 Concho Valley COG 2.26% $273,827 2.20% $267,391 ($6,436)Del Rio, City of 0.90% $109,045 0.90% $108,924 ($121)East Texas COG 8.32% $1,009,699 8.21% $996,706 ($12,993)El Paso, County of 0.49% $59,015 0.77% $93,016 $34,001 Fort Bend County 0.57% $68,973 0.66% $80,023 $11,050 Golden Crescent RPC 2.79% $338,793 2.67% $324,707 ($14,086)Gulf Coast Center 1.49% $181,296 1.48% $180,082 ($1,214)Heart of Texas COG 2.73% $331,992 2.64% $321,064 ($10,928)Hill Country Transit District 2.85% $ 345,836 2.91% $352,879 $7,043 Kaufman Area Rural Transportation 1.17% $141,589 1.62% $197,083 $55,494 Kleberg County Human Services 0.65% $78,566 0.61% $73,951 ($4,615)Lower Rio Grande Valley Dev. Council 1.86% $225,619 1.94% $235,090 $9,471 Panhandle Community Services 5.46% $663,499 5.29% $642,856 ($20,643)Public Transit Services 1.80% $219,062 1.92% $233,148 $14,086 Rolling Plains Management Corp. 1.77% $215,054 1.65% $200,118 ($14,936)Rural Economic Assist. League 1.51% $183,239 1.43% $174,011 ($9,228)Services Program for Aging Needs 0.89% $107,709 1.23% $148,996 $41,287 Snr Center Res. & Public Transit Inc. 1.08% $131,145 1.13% $137,096 $5,951 South East Texas RPC 1.91% $231,569 1.66% $201,454 ($30,115)South Padre Island, Town of 0.03% $3,886 0.03% $3,764 ($122)South Plains Comm. Action Assoc. 4.15% $503,574 3.92% $476,495 ($27,079)Texoma Area Paratransit System 3.17% $384,572 3.18% $386,636 $2,064 Transit System Inc., The 0.68% $83,059 0.80% $96,659 $13,600 Webb Co. Community Action Agency 0.56% $67,637 0.68% $82,937 $15,300

104
Scenario C. Rural Transit Needs Federal Funding - Current and Projected 2010. Cu rrent Projected 2010
Difference Rural Transit District Needs Factor
Needs Funding
Needs Factor
Needs Funding
Total 1 00% $13,068,091 100% $13,068,091 $0Alamo Area COG 6.12% $799,751 2.41% $797,922 ($1,829)Ark-Tex COG 3.46% $451,755 3.37% $425,096 ($26,659)Aspermont Small Bus. Dvlpmt Ctr. 1.15% $149,757 1.97% $142,047 ($7,710)Bee Community Action Agency 1.39% $181,512 1.83% $177,200 ($4,312)Brazos Transit District 12.07% $1,576,634 2.50% $1,540,044 ($36,590)Capital Area Rural Transportation System 6.28% $820,921 4.13% $842,614 $21,693 Central Texas Rural Transit District 3.47% $453,192 3.15% $435,159 ($18,033)Cleburne City of 1.41% $184,779 1.80% $127,673 ($57,106)Collin County Committee on Aging 0.80% $105,065 2.08% $160,604 $55,539 Colorado Valley Transit 1.84% $240,971 2.63% $247,505 $6,534 Community Act. Council of South Texas 1.61% $210,000 2.51% $219,017 $9,017 Community Council of Southwest Texas 2.53% $330,747 2.86% $328,003 ($2,744)Community Services, Inc. 1.95% $255,345 2.85% $284,095 $28,750 Concho Valley COG 2.26% $294,680 2.10% $287,754 ($6,926)Del Rio, City of 0.90% $117,349 2.58% $117,218 ($131)East Texas COG 8.32% $1,086,590 1.55% $1,072,607 ($13,983)El Paso, County of 0.49% $63,510 3.00% $100,100 $36,590 Fort Bend County 0.57% $74,225 3.24% $86,117 $11,892 Golden Crescent RPC 2.79% $364,592 3.13% $349,434 ($15,158)Gulf Coast Center 1.49% $195,103 1.23% $193,796 ($1,307)Heart of Texas COG 2.73% $357,274 2.01% $345,513 ($11,761)Hill Country Transit District 2.85% $ 372,172 2.83% $379,751 $7,579 Kaufman Area Rural Transportation 1.17% $152,371 2.91% $212,091 $59,720 Kleberg County Human Services 0.65% $84,549 1.81% $79,583 ($4,966)Lower Rio Grande Valley Dev. Council 1.86% $242,800 1.95% $252,993 $10,193 Panhandle Community Services 5.46% $714,026 2.72% $691,811 ($22,215)Public Transit Services 1.80% $235,744 2.96% $250,902 $15,158 Rolling Plains Management Corp. 1.77% $231,431 2.59% $215,358 ($16,073)Rural Economic Assist. League 1.51% $197,194 3.15% $187,262 ($9,932)Services Program for Aging Needs 0.89% $115,912 2.47% $160,342 $44,430 Snr Center Res. & Public Transit Inc. 1.08% $141,133 2.52% $147,536 $6,403 South East Texas RPC 1.91% $249,203 2.13% $216,795 ($32,408)South Padre Island, Town of 0.03% $4,182 7.02% $4,051 ($131)South Plains Comm. Action Assoc. 4.15% $541,923 2.26% $512,782 ($29,141)Texoma Area Paratransit System 3.17% $413,858 2.24% $416,080 $2,222 Transit System Inc., The 0.68% $89,384 2.03% $104,020 $14,636 Webb Co. Community Action Agency 0.56% $72,788 2.99% $89,253 $16,465 West Texas Opportunities, Inc. 6.85% $ 895,669 2.46% $867,963 ($27,706)

105
Scenario C. Urban Performance State Funding - Current and Projected 2010. Current Transit Districts Scenario C Transit Districts
Principal City Performance
Factor Funding for Performance
Performance Factor
Funding for Performance Diffe rence
Total Urban $5,029,687 $5,029,687 $0 Total Urban Transit Districts 1 00.00% $4,698,734 100.00% $4,799,656 $100,922 Abilene 4 .21% $197,971 3.76% $180,401 ($17,570)Amarillo 2 .70% $126,834 2.40% $114,993 ($11,841)Beaumont 4 .75% $223,121 4.21% $202,134 ($20,987)Brownsville 6 .64% $311,795 5.91% $283,585 ($28,210)Cleburne 2.81% $134,873 $134,873 College Station-Bryan 3.56% $167,127 3.17% $152,097 ($15,030)Conroe 2.81% $134,873 $134,873 Galveston 9 .07% $425,983 8.15% $391,168 ($34,815)Georgetown 2.81% $134,873 $134,873 Harlingen 0. 87% $40,778 0.77% $37,195 ($3,582)Killeen 3 .05% $143,421 2.71% $129,949 ($13,473)Lake Jackson-Angleton 1.25% $58,836 1.12% $53,700 ($5,136)Laredo 9 .27% $435,698 8.32% $399,521 ($36,177)Longview 2 .50% $117,364 2.22% $106,751 ($10,613)Lubbock 6 .89% $323,510 6.16% $295,828 ($27,682)McAllen 3 .34% $156,772 2.95% $141,354 ($15,418)McKinney 3 .61% $169,439 ($169,439)Midland-Odessa 2 .75% $129,093 2.45% $117,352 ($11,741)New Braunfels 2.81% $134,873 $134,873 Port Arthur 2.61% $122,448 2.31% $110,676 ($11,773)San Angelo 2.75% $129,321 2.46% $117,979 ($11,342)San Marcos 2.81% $134,873 $134,873 Sherman 3 .18% $149,218 2.83% $135,908 ($13,310)Temple 3 .20% $150,337 2.83% $135,964 ($14,373)Texarkana 3 .71% $174,409 3.32% $159,182 ($15,227)Texas City 1.29% $60,538 1.15% $55,117 ($5,421)The Woodlands 5.93% $278,525 5.26% $252,311 ($26,214)Tyler 2 .49% $116,950 2.22% $106,351 ($10,599)Victoria 3 .79% $177,925 3.38% $162,227 ($15,698)Waco 3 .47% $163,268 3.10% $148,702 ($14,567)Wichita Falls 3.15% $148,053 2.81% $134,846 ($13,207)Limited Eligibility Providers 1 00.00% $330,954 100.00% $230,031 ($100,922)Arlington 27 .97% $92,562 27.97% $64,336 ($28,226)Grand Prairie 29.79% $98,587 29.79% $68,523 ($30,064)Mesquite 27 .65% $91,506 27.65% $63,602 ($27,904)NETS 14 .59% $48,298 14.59% $33,570 ($14,728)

106
Scenario C. Urban Transit State Funding Summary of Results. Principal City *Impacted by Merger to Very Large Urbanized Area
Current Total
Projected 2010 Total Difference
Total Urban $10,059,374 $10,059,374 $0
Total Urban Transit Districts $9,397,467 $9,599,312 $201,845
Abilene $ 364,513 $330,623 ($33,890)
Amarillo $ 405,819 $382,640 ($23,178)
Beaumont $ 439,859 $389,786 ($50,073)
Brownsville $ 569,719 $551,232 ($18,487)
Cleburne $204,282 $204,282
College Station-Bryan $373,278 $355,138 ($18,140)
Conroe $213,049 $213,049
Galveston $ 511,198 $463,755 ($47,443)
Georgetown $213,630 $213,630
Harlingen $ 213,120 $213,888 $767
Killeen $ 404,769 $397,596 ($7,173)
Lake Jackson-Angleton $173,061 $159,139 ($13,922)
Laredo $ 708,885 $667,168 ($41,717)
Longview $ 238,830 $218,126 ($20,704)
Lubbock $ 634,681 $563,476 ($71,206)
McAllen $ 467,943 $409,001 ($58,942)
McKinney $ 254,272 ($254,272)
Midland-Odessa $ 440,264 $384,999 ($55,265)
New Braunfels $218,405 $218,405
Port Arthur $300,837 $263,602 ($37,235)
San Angelo $266,188 $235,356 ($30,832)
San Marcos $241,595 $241,595
Sherman $ 236,608 $219,067 ($17,541)
Temple $ 262,261 $251,288 ($10,974)
Texarkana $ 250,284 $231,429 ($18,854)
Texas City $210,550 $161,002 ($49,548)
The Woodlands $417,689 $494,372 $76,683
Tyler $ 274,861 $274,262 ($599)
Victoria $ 273,655 $249,718 ($23,937)
Waco $ 401,623 $376,410 ($25,213)
Wichita Falls $302,699 $265,275 ($37,424)
Limited Eligibility Providers ($201,845)
Arlington $213,559 $148,967 ($64,592) $341,663 Cap* Grand Prairie $151,799 $105,609 ($46,189) $170,584 Cap* Mesquite $139,416 $94,730 ($44,686) $142,455 Cap* NETS $157,134 $110,756 ($46,378) $116,134 Cap*
*Limited eligibility providers are limited by statute to funding not to exceed these cap levels

107
Scenario C. Rural Transit State Funding Summary of Results.
Rural Transit District *Impacted by new urbanized area
Current Total
Projected 2010 Total Difference
Total $ 18,682,070 $18,682,070 $0 Alamo Area COG* $900,803 $899,103 ($1,700)Ark-Tex COG $640,334 $615,562 ($24,772)Aspermont Small Bus. Dvlpmt Ctr. $268,166 $261,002 ($7,164)Bee Community Action Agency $288,586 $284,578 ($4,008)Brazos Transit District* $1,628,661 $1,594,660 ($34,001)Capital Area Rural Transportation System* $1,032,678 $1,052,835 $20,157 Central Texas Rural Transit District $627,089 $610,331 ($16,758)Cleburne City of* $289,202 $236,137 ($53,065)Collin County Committee on Aging $233,830 $285,438 $51,608 Colorado Valley Transit $396,015 $402,086 $6,071 Community Act. Council of South Texas $359,063 $367,441 $8,378 Community Council of Southwest Texas $494,477 $491,927 ($2,550)Community Services, Inc. $423,691 $450,406 $26,715 Concho Valley COG $411,007 $404,571 ($6,436)Del Rio, City of $277,937 $277,816 ($121)East Texas COG $1,110,851 $1,097,858 ($12,993)El Paso, County of $255,042 $289,043 $34,001 Fort Bend County $280,889 $291,939 $11,050 Golden Crescent RPC $543,451 $529,365 ($14,086)Gulf Coast Center $261,982 $260,768 ($1,214)Heart of Texas COG $463,548 $452,620 ($10,928)Hill Country Transit District $530,944 $537,987 $7,043 Kaufman Area Rural Transportation $331,927 $387,421 $55,494 Kleberg County Human Services $197,045 $192,430 ($4,615)Lower Rio Grande Valley Dev. Council $353,318 $362,789 $9,471 Panhandle Community Services $841,610 $820,967 ($20,643)Public Transit Services $412,604 $426,690 $14,086 Rolling Plains Management Corp. $384,665 $369,729 ($14,936)Rural Economic Assist. League $389,401 $380,173 ($9,228)Services Program for Aging Needs $269,408 $310,695 $41,287 Snr Center Res. & Public Transit Inc. $295,721 $301,672 $5,951 South East Texas RPC $371,103 $340,988 ($30,115)South Padre Island, Town of $462,634 $462,512 ($122)South Plains Comm. Action Assoc. $651,085 $624,006 ($27,079)Texoma Area Paratransit System $531,036 $533,100 $2,064 Transit System Inc., The $215,727 $229,327 $13,600 Webb Co. Community Action Agency $263,272 $278,572 $15,300 West Texas Opportunities, Inc. $993,268 $967,526 ($25,742)

108
Scenario C. Rural Transit Federal Funding Summary of Results.
Rural Transit District *Impacted by new urbanized area
Current Total
Projected 2010 Total Difference
Total $ 20,104,753 $20,104,753 $0Alamo Area COG $969,402 $967,573 ($1,829)Ark-Tex COG $689,097 $662,438 ($26,659)Aspermont Small Bus. Dvlpmt Ctr. $288,588 $280,878 ($7,710)Bee Community Action Agency $310,562 $306,250 ($4,312)Brazos Transit District $1,752,688 $1,716,098 ($36,590)Capital Area Rural Transportation System $1,111,318 $1,133,011 $21,693 Central Texas Rural Transit District $674,842 $656,809 ($18,033)Cleburne City of $311,225 $254,119 ($57,106)Collin County Committee on Aging $251,636 $307,175 $55,539 Colorado Valley Transit $426,172 $432,706 $6,534 Community Act. Council of South Texas $386,406 $395,423 $9,017 Community Council of Southwest Texas $532,132 $529,388 ($2,744)Community Services, Inc. $455,956 $484,706 $28,750 Concho Valley COG $442,306 $435,380 ($6,926)Del Rio, City of $299,102 $298,971 ($131)East Texas COG $1,195,445 $1,181,462 ($13,983)El Paso, County of $274,465 $311,055 $36,590 Fort Bend County $302,279 $314,171 $11,892 Golden Crescent RPC $584,835 $569,677 ($15,158)Gulf Coast Center $281,934 $280,627 ($1,307)Heart of Texas COG $498,849 $487,088 ($11,761)Hill Country Transit District $571,376 $578,955 $7,579 Kaufman Area Rural Transportation $357,204 $416,924 $59,720 Kleberg County Human Services $212,051 $207,085 ($4,966)Lower Rio Grande Valley Dev. Council $380,223 $390,416 $10,193 Panhandle Community Services $905,701 $883,486 ($22,215)Public Transit Services $444,025 $459,183 $15,158 Rolling Plains Management Corp. $413,958 $397,885 ($16,073)Rural Economic Assist. League $419,056 $409,124 ($9,932)Services Program for Aging Needs $289,925 $334,355 $44,430 Snr Center Res. & Public Transit Inc. $318,242 $324,645 $6,403 South East Texas RPC $399,362 $366,954 ($32,408)South Padre Island, Town of $497,864 $497,733 ($131)South Plains Comm. Action Assoc. $700,667 $671,526 ($29,141)Texoma Area Paratransit System $571,476 $573,698 $2,222 Transit System Inc., The $232,155 $246,791 $14,636 Webb Co. Community Action Agency $283,321 $299,786 $16,465 West Texas Opportunities, Inc. $1,068,908 $ 1,041,202 ($27,706)