Embed Size (px)
Citation preview
Estimate the incubation period of coronavirus 2019 (COVID-19)
Ke Men1, Xia Wang2, Yihao, Li3, Guangwei Zhang1, Jingjing Hu1, Yanyan Gao1, Henry Han* 4
1. Institute for Research on Health Information and Technology, School of Public Health, Xi’an Medical
University, Xi’an, Shaanxi 710021, China
2. The Air Force Military Medical University, Xi’an, Shaanxi 710032, China
3. Business Analytics, Fordham University, Lincoln Center, New York, NY 10023, USA
4. Computer and Information Science, Fordham University, Lincoln Center, New York, NY 10023, USA
*Correspondence author
Abstract
Motivation: Wuhan pneumonia is an acute infectious disease caused by the 2019 novel coronavirus
(COVID-19). It is being treated as a Class A infectious disease though it was classified as Class B according
to the Infectious Disease Prevention Act of China. Accurate estimation of the incubation period of the
coronavirus is essential to the prevention and control. However, it remains unclear about its exact
incubation period though it is believed that symptoms of COVID-19 can appear in as few as 2 days or as
long as 14 or even more after exposure. The accurate incubation period calculation requires original chain-
of-infection data that may not be fully available in the Wuhan regions. In this study, we aim to accurately
calculate the incubation period of COVID-19 by taking advantage of the chain-of-infection data, which is
well-documented and epidemiologically informative, outside the Wuhan regions.
Methods: We acquired and collected officially reported COVID-19 data from 10 regions in China except
for Hubei province. To achieve the accurate calculation of the incubation period, we only involved the
officially confirmed cases with a clear history of exposure and time of onset. We excluded those without
relevant epidemiological descriptions, working or living in Wuhan for a long time, or hard to determine
the possible exposure time. We proposed a Monte Caro simulation approach to estimate the incubation of
COVID-19 as well as employed nonparametric ways. We also employed manifold learning and related
statistical analysis to decipher the incubation relationships between different age/gender groups.
All rights reserved. No reuse allowed without permission. (which was not certified by peer review) is the author/funder, who has granted medRxiv a license to display the preprint in perpetuity.
The copyright holder for this preprintthis version posted February 29, 2020. .https://doi.org/10.1101/2020.02.24.20027474doi: medRxiv preprint

Result: The incubation period of COVID-19 did not follow general incubation distributions such as
lognormal, Weibull, and Gamma distributions. We estimated that the mean and median of its incubation
were 5.84 and 5.0 days via bootstrap and proposed Monte Carlo simulations. We found that the incubation
periods of the groups with age>=40 years and age<40 years demonstrated a statistically significant
difference. The former group had a longer incubation period and a larger variance than the latter. It further
suggested that different quarantine time should be applied to the groups for their different incubation
periods. Our machine learning analysis also showed that the two groups were linearly separable.
incubation of COVID-19 along with previous statistical analysis. Our results further indicated that the
incubation difference between males and females did not demonstrate a statistical significance.
Introduction
Novel coronaviruses (COVID-19), which was found in Wuhan, China in December 2019 presents an acute
public health threat to the whole world [1-2]. The new virus is different from known coronaviruses such
as SARS and MERS, though they share some similar respiratory illness symptoms such as fever, cough,
or/and shortness of breath [2]. It is believed to root from the animal but spreads from person-to-person.
The COVID-19 spread even shows that persons without any symptoms or clinically negative in infection
can still spread it to others. There is no official vaccine or antiviral drug available up to now (Jan 30, 2020)
to treat COVID-19 infected patients [3-4]. The outbreak of COVID-19 infection is forcing China and many
countries to take harsh protection policies. More than eight-thousands of infections have been reported in
China and more than a dozen of countries until Jan 30, 2020. More than 15 cities including Wuhan have
been quarantined to halt the spread of the COVID-19. It is expected that millions of people can be on
lockdown because of COVID-19. WHO declared the coronavirus outbreak a global health emergency on
Jan 30, 2020.
It is essential to know the accurate incubation period of COVID-19 for the sake of deciphering dynamics of
its spread. The incubation period is the time from infection to the onset of the disease. It provides the
foundation for epidemiological prevention, clinical actions, and drug discovery. Different viruses have
different incubation periods that determine their different dynamics epidemiologically. The incubation
period of H7N9 (Human Avian Influenza A) is about 6.5 days, but the incubation period for SARS-CoV is
typically 2 to 7 days [5-6]. However, it remains unclear about its exact incubation period of COVID-19,
although WHO estimates it is between 2 to 14 days after exposure [8]. It can be difficult to estimate the
All rights reserved. No reuse allowed without permission. (which was not certified by peer review) is the author/funder, who has granted medRxiv a license to display the preprint in perpetuity.
The copyright holder for this preprintthis version posted February 29, 2020. .https://doi.org/10.1101/2020.02.24.20027474doi: medRxiv preprint

incubation period of COVID-19 by using original chain-of-infection data that may not be fully available in
the Wuhan regions. Or data may lack meaningful exposure history. Furthermore, it is also unknown
whether the incubation time will show some statistically significant with respect to Age and Gender. In
this study, we aim to accurately estimate the incubation period of COVID-19 by taking advantage of
datasets with a well-documented history of exposure. Our results show the incubation mean and median
of COVID-19 are 5.84 and 5.0 days respectively and there is a statistical significance with the role of
gender. However, the incubation periods of the groups with age>=40 years and age<40 years show a
statistically significant difference. Our machine learning analysis also shows that the two groups are
linearly separable that demonstrate a clear boundary in knowledge discovery visualization.
Methods
Data collection and preprocessing We collected a dataset with 59 officially confirmed COVID-19 cases from 10 regions in China except for
Hubei province, the assumed origin of the virus. The patient data was dated from Dec 29, 2019, to Feb 5,
2020. We only involved the officially confirmed cases with a clear history of exposure and time of onset in
data collection. We exclude those without relevant epidemiological descriptions, working or living in
Wuhan for a long time, or hard to determine the possible exposure time.
Data collected for this study included region, age, gender, exposure history, and illness onset. For those
cases whose incubation periods locate in an interval [𝑥!, 𝑥"], we use its midpoint 𝛿 = #!$#""
to represent its
incubation period. For example, Case no. 2 in our dataset went on a business trip in Wuhan on Jan 12th,
2020 and returned to Shaanxi on Jan 15th, 2020, but had fever symptoms on Jan 20th 2020. The incubation
will be calculated as 𝛿 = ("&'!")$("&'!))"
= 6.5 days. More details about the dataset can be found in the
Result section.
Monte Carlo simulation for incubation median and mean estimation
We propose a Monte Carlo simulation approach that takes advantage of bootstrap techniques to estimate
incubation median and mean estimation for the small sample with 59 cases. It is more data-driven
compared to traditional parametric approaches to handle parameter estimation for small datasets. The
proposed Monte Carlo simulation assumes we have a collected small incubation dataset 𝑋. We generate a
All rights reserved. No reuse allowed without permission. (which was not certified by peer review) is the author/funder, who has granted medRxiv a license to display the preprint in perpetuity.
The copyright holder for this preprintthis version posted February 29, 2020. .https://doi.org/10.1101/2020.02.24.20027474doi: medRxiv preprint
large incubation sample 𝑆* by concatenating n=1000 randomly sampled incubation segments 𝑢*+ each of
which contains at least 𝑙 entries in the interval [𝑙!, 𝑙"] drawn independently from the existing dataset 𝑋,
i.e., 𝑆* = ⋃ 𝑢*+ .,+-! Then the large incubation sample median is calculated: 𝑚* = 𝑚𝑒𝑑𝑖𝑎𝑛(𝑆*) + 𝜌 × 𝜖(0,1),
where 𝜖(0,1) is added Gaussian noise and 𝜌 ∈ [0,1] is a variance control parameter in simulation. Such a
procedure is repeated 𝑁 times, the population median 𝑚. =!/∑ 𝑚* ./*-! The estimated standard deviation
𝜎. is calculated as the standard deviation of the median sequence 𝑚!, 𝑚", ⋯𝑚/. In our simulation, we
chose 𝑁 = 100000, 𝑙! = 1, 𝑙" = 7, 𝜌 = .2 days in simulation and conduct simulations by employing Google
Colab with TPU acceleration [9-10]. The confidence level probability is calculated by the ratio 𝑇/𝑁, where
𝑇 counts the times that 𝑚* falls in the interval F𝑚. − 2𝜎., 𝑚. + 2𝜎.H in the simulation.
Similarly, we can estimate the population mean by using the same way where the large incubation sample
mean is calculated as 𝜇* =!|1#|∑ 𝑆*2 + 𝜌 × 𝜖(0,1)|1#|2-! each time. The population mean is estimated as 𝜇 =
!/∑ 𝜇*/*-! and the estimated standard deviation 𝜌. According to the central limit theorem, the population
mean will be subject to the normal distribution. The confidence interval probability is calculated by
following the same procedure.
Result
Our data consists of 34 male cases, 24 female cases and 1 unidentified gender case from ten regions in China.
All 59 cases have complete epidemiological descriptions about the history of exposure. The total 57 cases
have complete information in age and gender One case from Beijing has unknown age. The mean and
standard deviation of age are 41.9 and 13.2 years old. The mode of his dataset is 4.0 with 14 support cases.
The minimum and maximum age are 10 and 70 respectively.
Figure 1 summarizes age and incubation time variables with respect to region and gender. The median
incubation period of males (5.0 days) is slightly shorter than that of females 5.5 days. The median ages of
male and female groups are 41 and 42 years old although their age distributions are quite different. The
minimum and maximum incubation periods are 1 and 15 days respectively. Among all 10 regions, Shaanxi
and Guangdong have 18 and 14 cases that are the largest and 2nd largest subgroups whose median
incubation periods are 5.0 and 5.5 respectively.
All rights reserved. No reuse allowed without permission. (which was not certified by peer review) is the author/funder, who has granted medRxiv a license to display the preprint in perpetuity.
The copyright holder for this preprintthis version posted February 29, 2020. .https://doi.org/10.1101/2020.02.24.20027474doi: medRxiv preprint

Table 1 shows incubation statistics for five different groups: Male, Female, Age>=40, Age <40, and All that
include all cases. It indicates that the incubation period median and mean of patients more than 40 years
old are greater than those of patients less than 40 years old. Similar patterns are also observed for male and
female groups. The mean values are always larger than median values for each group suggests the right-
skewed distributions of incubation.
Fig 1. Age and incubation time summary with respect to region and gender.
All rights reserved. No reuse allowed without permission. (which was not certified by peer review) is the author/funder, who has granted medRxiv a license to display the preprint in perpetuity.
The copyright holder for this preprintthis version posted February 29, 2020. .https://doi.org/10.1101/2020.02.24.20027474doi: medRxiv preprint

Table 1 Incubation statistics for different groups
Incubation statistics
Group The number of cases mean ± std median IQR
Male 34 5.54±2.57 5.0 2.88
Female 24 6.33±3.41 5.5 3.25
Age >=40 32 6.73±3.20 6.0 4.0
Age<40 25 4.84±2.28 4.0 1.0
All 59 5.84±2.93 5.0 3.0
Fig 2. The probability density functions (p.d.f.) under Gaussian kernel density estimation for different groups.
Figure 2 illustrates the probability density functions (p.d.f) of ‘male’, ‘female’, and ‘all’ group incubation
using Gaussian kernel density estimation on the left plot. The three groups seem to have similar or the
same incubation distributions. The right plot in Figure 2 compares the probability function distributions
(p.d.f.) of those of the ‘age>= 40 years’ and ‘age < 40 years’ groups. It suggests that the age>=40 group
demonstrates very different incubation distributions compared to the age<40 group.
The distributions of the incubation of COVID-19.
The incubation of COVID-19 is not subject to neither of the widely used incubation distributions such as
normal, lognormal, Gamma, and Weibull distributions well [12]. We employ Shapiro-Wilk tests rather than
Kolmogorov–Smirnov tests to conduct normality tests because we only have 59 records and Shapiro-Wilk
tests can do a much better job on small datasets with a sample size of from 3 to 5000 [13]. Table 2 shows the
All rights reserved. No reuse allowed without permission. (which was not certified by peer review) is the author/funder, who has granted medRxiv a license to display the preprint in perpetuity.
The copyright holder for this preprintthis version posted February 29, 2020. .https://doi.org/10.1101/2020.02.24.20027474doi: medRxiv preprint
p-values under the Shapiro-Wilk tests for normal and lognormal distributions as well as Goodness-of-fit
tests for Gamma and Weibull distributions by using the R package ‘goft’ [14]. We can reject normal,
lognormal, and Weibull distributions strongly under the significance level of 0.05 cutoff [11-12]. Although
we can’t reject Gamma distributions for its boundary line p-value (0.06086), it can be risky to use it to fit
and estimate the distribution of the incubation period under a small sample size. We further employ the
maximum likelihood estimates (MLEs) for the parameters of the gamma, conduct the goodness-fit test, and
obtain p-value=8.6807e-04. As such, we only rely on nonparametric techniques in data analysis rather than
use any pre-assumed distributions.
Table 2. p-values for probability distribution tests
Distribution p-value
Normal 2.009e-06
Lognormal 0.01396
Gamma 0.06086
Weibull 6e-05
The incubation difference between males and females does not demonstrate a statistical significance
Mann-Whitney rank test shows that there are no significant differences between the incubation of males
and females with respect to median with p-value=0.267 for the null hypothesis 𝐻&: Male and female groups
have the same median. Similarly, we employ the Siegal-Tukey test to find the variances of incubation of
males and females are at the same level statistically. We have p-values: 0.74725, 0.376, and 0.6258 for the
corresponding hypotheses respectively: 𝐻!: male and female groups have different incubation variances,
𝐻": the variance of male incubation > and that of the females, and 𝐻3: the variance of male incubation < that
of the females. The results indicate that gender may not be a key factor affecting the incubation period of
COVID-19.
The incubation period of the age<40 group is statistically shorter than that of the age>=40 group
Pearson correlation coefficient analysis shows the R statistics is 0.244 with p-value: 0.06758. It suggests that
that the incubation period is somewhat correlated with age though not that strong. To verify whether the
incubation of the age>=40 group is different from that of the age<40 group statistically, Figure 3 compares
All rights reserved. No reuse allowed without permission. (which was not certified by peer review) is the author/funder, who has granted medRxiv a license to display the preprint in perpetuity.
The copyright holder for this preprintthis version posted February 29, 2020. .https://doi.org/10.1101/2020.02.24.20027474doi: medRxiv preprint

their incubation periods groups using different visualization tools. It indicates that the younger group
tends to have a shorter incubation period. The variance of their incubation period also seems to be smaller.
Fig 3. Compare the incubation periods of Age>=40 and Age< 40 groups.
The Mann-Whitney rank test shows that there’s a statistically significant difference between the incubation
of age<40 and age>=40 groups with the null hypothesis: the medians of incubation period between two
groups are the same. The p-values for corresponding alternative hypotheses: the age<40 group has a smaller
incubation median is 0.00474. It suggests that the age<40 group has a shorter incubation period than the
age>=40 group. Similarly, the Siegal-Tukey test indicates the younger group’s incubation variance is less
than the older group’s by p-value: 0.0083. It may suggest COVID-19 has a faster but relatively constant
spread speed among people <40 years old than people >=40 years old.
The incubation data of COVID-19 is linearly separable for Age>=40 and Age<40 groups
Figure 4 illustrates biplots of the dataset by removing two cases with missing items by using PCA (principal
component analysis), sparse PCA (sparse principal component analysis, t-SNE (t-distributed stochastic
neighbor embedding), and LLE (locally linear embedding) [16-19]. Data is partitioned as the age>=40 and
age<40 groups in visualization. t-SNE shows that only one case in the age>=40 group falls in the cluster of
the age < 40 group. But PCA, sparse PCA and LLE all show that the incubation of two groups is linearly
separable, which means there exists an obvious linear boundary to separate them, in the subspaces
generated by PCA, SPCA, t-SNE, or LLE. Such machine learning results indicate that the two groups are
actually independent clusters spatially. However, we also find that the incubation data will no longer
demonstrate the linear separability property when we partition it as age>=50 and age<50 groups or age>=55
All rights reserved. No reuse allowed without permission. (which was not certified by peer review) is the author/funder, who has granted medRxiv a license to display the preprint in perpetuity.
The copyright holder for this preprintthis version posted February 29, 2020. .https://doi.org/10.1101/2020.02.24.20027474doi: medRxiv preprint
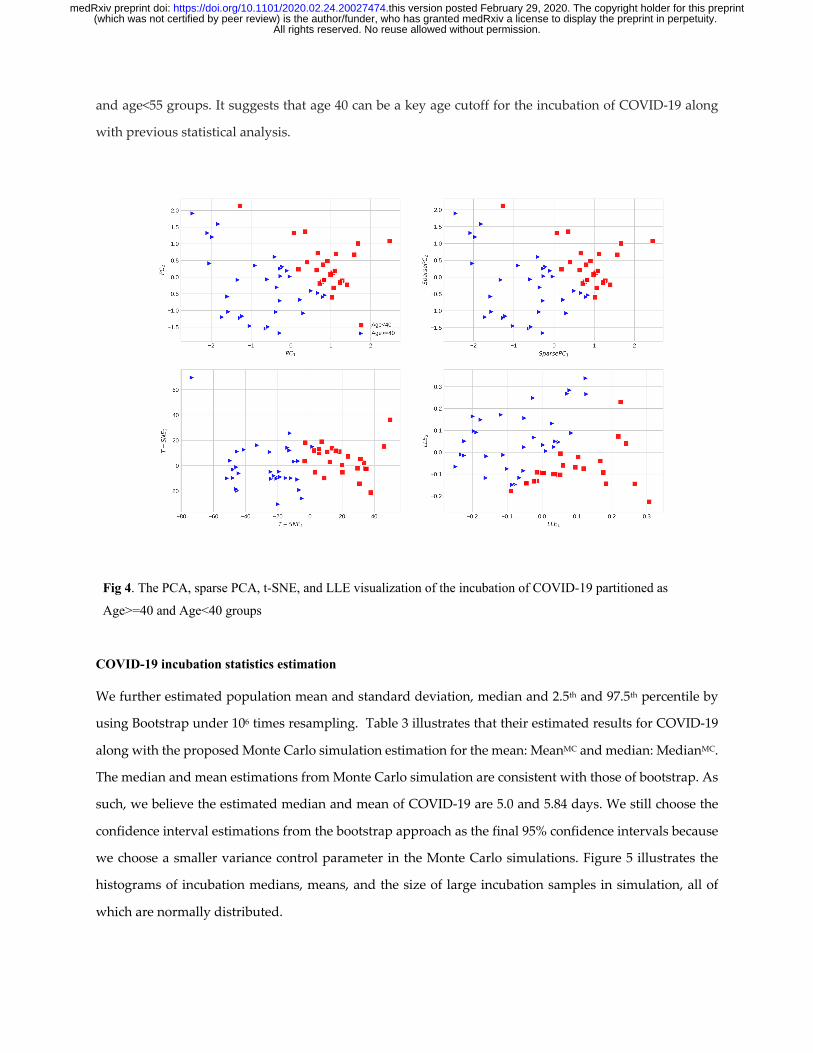
and age<55 groups. It suggests that age 40 can be a key age cutoff for the incubation of COVID-19 along
with previous statistical analysis.
Fig 4. The PCA, sparse PCA, t-SNE, and LLE visualization of the incubation of COVID-19 partitioned as
Age>=40 and Age<40 groups
COVID-19 incubation statistics estimation
We further estimated population mean and standard deviation, median and 2.5th and 97.5th percentile by
using Bootstrap under 106 times resampling. Table 3 illustrates that their estimated results for COVID-19
along with the proposed Monte Carlo simulation estimation for the mean: MeanMC and median: MedianMC.
The median and mean estimations from Monte Carlo simulation are consistent with those of bootstrap. As
such, we believe the estimated median and mean of COVID-19 are 5.0 and 5.84 days. We still choose the
confidence interval estimations from the bootstrap approach as the final 95% confidence intervals because
we choose a smaller variance control parameter in the Monte Carlo simulations. Figure 5 illustrates the
histograms of incubation medians, means, and the size of large incubation samples in simulation, all of
which are normally distributed.
All rights reserved. No reuse allowed without permission. (which was not certified by peer review) is the author/funder, who has granted medRxiv a license to display the preprint in perpetuity.
The copyright holder for this preprintthis version posted February 29, 2020. .https://doi.org/10.1101/2020.02.24.20027474doi: medRxiv preprint

Table 3 Estimated COVID-19 incubation statistics
Methods Estimation
(days)
95% CI
Mean 5.84 (5.07, 6.55)
MeanMC 5.84 (5.42, 6.25)
Std 2.98 (2.31, 3.72)
Median 5.01 (4.00, 6.00)
MedianMC 4.99 (4.59, 5.39)
2.5 percentile 2.69 (2.45, 2.95)
97.5 percentile 12.89 (11.00, 16.13)
Fig 5. The histograms of the sizes of large samples, incubation median, and means in simulation.
Discussion
We estimate the incubation period of COVID-19 in this study and analyze its properties by employing
statistical and machine learning techniques. We estimate that the mean and median of COVID-19 as 5.84
and 5.01 days by employing nonparametric techniques. The proposed Monte Carlo simulation method
echo the nonparametric estimation results. The incubation median of COVID-19: 5.01days (95% CI (4.0, 6.0)
days is close to that of SARS (4.6 days) (95%CI: (3.8,5.8)). Compared to the incubation mean of MERS: 5.5
days (95% CI: (3.6-10.2) days), the COVID-19 mean incubation period: 5.84 days (95% CI: (5.07, 6.45)) are
also slightly longer [21]. It suggests that COVID-19 could have a faster distribution speed than H7N9, but
the same spread speed as SARS and MERS in terms of their incubation periods [22]. The existing spread
of COVID-19 is faster than SARS partially because it has more complicate spread dynamics [2]. For example,
All rights reserved. No reuse allowed without permission. (which was not certified by peer review) is the author/funder, who has granted medRxiv a license to display the preprint in perpetuity.
The copyright holder for this preprintthis version posted February 29, 2020. .https://doi.org/10.1101/2020.02.24.20027474doi: medRxiv preprint

those without clinical symptoms can still spread the virus even if they are ‘officially negative’ in the
COVID-19 virus test [22].
We also investigate the incubation period of 12 family cases and 47 non-family cases in the dataset. The
family cases simply refer to the patients who were caught by COVID-19 because their family members had
been infected. The Mann-Whitney rank test shows that there are not significant differences between family
patients and non-family patients in terms of the median of incubation period. The Siegal-Tukey tests on
scale also verify that the incubation scales are at the same level for family patients and non-family patients.
Our studies indicate that incubation periods of the age>=40 years and age<40 years groups not only
statistically significant but also linearly separable in machine learning. It may suggest different treatments
should be considered for the two different groups. It will be more interesting to estimate different
incubation time for them separately. That the estimated 97.5th percentile of COVID-19 incubation is 12.89
days (95% CI: (11.00, 16.13)) may suggest a long isolation or quarantine time (e.g. 17 days) can be better
than the widely accepted 14 days. Furthermore, different quarantine time should be applied to the age>=40
years and age<40 years groups for their different incubation periods. Generally speaking, a longer
quarantine time can be considered for the old patients (>=40 years) than young patients (<40 years old). Our
ongoing work is to collect more qualified data to extend our existing results and investigate incubation of
COVID-19 for different groups besides comparing our incubation estimation with other studies [23].
Acknowledgement
This research was funded by The Emergency Program for Prevention and Control of Novel Coronavirus
of Xi’an Medical University (grant No. 2020ZX01).
Reference
1. Tan W, Zhao X, Ma X, et al. A novel coronavirus genome identified in a cluster of pneumonia cases —
Wuhan, China 2019−2020. http://weekly.chinacdc.cn/en/article/id/a3907201-f64f-4154-a19e-
4253b453d10c.
2. Huang et al (2020) Clinical features of patients infected with 2019 novel coronavirus in Wuhan, China,
https://doi.org/10.1016/ S0140-6736(20)30183-5
All rights reserved. No reuse allowed without permission. (which was not certified by peer review) is the author/funder, who has granted medRxiv a license to display the preprint in perpetuity.
The copyright holder for this preprintthis version posted February 29, 2020. .https://doi.org/10.1101/2020.02.24.20027474doi: medRxiv preprint
3. Hiroshi Nishiura, Sung-mok Jung, Natalie M. Linton, Ryo Kinoshita, Yichi Yang, Katsuma Hayashi,
Tetsuro Kobayashi, Baoyin Yuan and Andrei R. Akhmetzhanov (2020) The Extent of Transmission of
Novel Coronavirus in Wuhan, China, 2020. J. Clin. Med. 2020, 9, 330; doi:10.3390/jcm9020330
4. Shi Zhao, Jinjun Ran, Salihu S Musa, Guangpu Yang, Yijun Lou, Daozhou Gao, Lin Yang and Daihai
He (2020) Preliminary estimation of the basic reproduction number of novel coronavirus (COVID-19)
in China, from 2019 to 2020: A data-driven analysis in the early phase of the outbreak. bioRxiv,
http://dx.doi.org/10.1101/2020.01.23.916395
5. Cowling BJ, Jin L, Lau EHY, et al. Comparative epidemiology of human infections with avian influenza
A H7N9 and H5N1 viruses in China: a population-based study of laboratory-confirmed cases. Lancet.
2013;382(9887): 129–137.
6. Nishiura H, Inaba H. Estimation of the incubation period of influenza A (H1N1-2009) among imported
cases: addressing censoring using outbreak data at the origin of importation. J Theor Biol.
2011;272(1):123–130
7. WHO. Novel coronavirus – Republic of Korea (ex-China). Jan 21, 2020. http://www.who.int/csr/don/21-
january-2020-novel-coronavirus-republic-of-korea-ex-china/en/
8. CDC. First travel-related case of 2019 novel coronavirus detected in United States. Jan 21, 2020.
https://www.cdc.gov/media/ releases/2020/p0121-novel-coronavirus-travel-case.html
9. Google Colab: https://colab.research.google.com/
10. TPU: https://cloud.google.com/tpu/
11. Daniel, Wayne W. (1990). "Kolmogorov–Smirnov one-sample test". Applied Nonparametric Statistics
(2nd ed.). Boston: PWS-Kent. pp. 319–330
12. Hiroshi Nishiura Early efforts in modeling the incubation period of infectious diseases with an acute
course of illness, Emerging Themes in Epidemiology volume 4, Article number: 2 2007
13. Rahman und Govidarajulu (1997). "A modification of the test of Shapiro and Wilk for
normality". Journal of Applied Statistics. 24 (2): 219–236.
14. R package: goft https://cran.r-project.org/web/packages/goft/index.html
15. Grissom RJ (1994). "Statistical analysis of ordinal categorical status after therapies". Journal of
Consulting and Clinical Psychology. 62 (2): 281–284. doi:10.1037/0022-006X.62.2.281
16. Han X: Nonnegative principal component analysis for cancer molecular pattern discovery. IEEE/ACM
Transactions on Computational Biology & Bioinformatics 2010, 7(3):537-549
17. Li W, Cerise JE, Yang Y, Han H: Application of t-SNE to human genetic data. Journal of Bioinformatics
& Computational Biology 2017, 15(4):1750017.
All rights reserved. No reuse allowed without permission. (which was not certified by peer review) is the author/funder, who has granted medRxiv a license to display the preprint in perpetuity.
The copyright holder for this preprintthis version posted February 29, 2020. .https://doi.org/10.1101/2020.02.24.20027474doi: medRxiv preprint
18. Roweis, S and Saul, K: Nonlinear Dimensionality Reduction by Locally Linear Embedding," Science,
vol. 290, no. 5500, pp. 2323-2326, 2000
19. Jenatton, R, Obozinski, G, Bach, F: Structured Sparse Principal Component Analysis, ICML 2009
20. Xia et al (2014) Middle East respiratory syndrome coronavirus (MERS-CoV) entry inhibitors targeting
spike protein, Virus Res. 2014 Dec 19;194:200-10
21. Virlogeux et al Estimating the Distribution of the Incubation Periods of Human Avian Influenza
A(H7N9) Virus Infections, American Journal of Epidemiology, 182:8, DOI: 10.1093/aje/kwv115, 2015
22. Li, et al (2020) Early Transmission Dynamics in Wuhan, China, of Novel Coronavirus–Infected
Pneumonia, The New England Journal of Medicine, DOI: 10.1056/NEJMoa2001316
23. Guan et al (2020) Clinical characteristics of 2019 novel coronavirus infection in China,
doi: https://doi.org/10.1101/2020.02.06.20020974
All rights reserved. No reuse allowed without permission. (which was not certified by peer review) is the author/funder, who has granted medRxiv a license to display the preprint in perpetuity.
The copyright holder for this preprintthis version posted February 29, 2020. .https://doi.org/10.1101/2020.02.24.20027474doi: medRxiv preprint