Embed Size (px)
Citation preview

Chapter 05
DIRECTION OF INDIA’S FOREIGN TRADE
Estelar

93
CHAPTER-05
DIRECTION OF INDIA’S FOREIGN TRADE
Trade and commerce have always played a significant part in the rapidly expanding
multi faceted bilateral relations between India and U.S.A with each passing day there
are new Indian business houses opening up shops in the U.S.A and vice versa, which
in turn is helping the India US Trade to grow.
From a modest US $ 5600 million in 1991, the bilateral trade in merchandise
goods has increased upto US $ 31890 millionin 2006 and now it is 63704 US million
dollars present growth in a span of 50 percent increase in 8 years. Over the last 8
years US exports to India have more than 22 percent increase of exports helping to
create better paying jobs in the United State. Thereby improvingthe India US Trade
relations. India’s Merchandise exports to the US grew at 16.07 percent from US $
17350.51 million in 2005 to US $ 18853.46 million in 2006 and now the export to
USA by India is increased by 45% in the period of 8 years from 2006 to 2014.
Direction of India’s Foreign Trade
Direction of India’s Foreign Trade is studied in relation to the country’s
proportion of exports to different countries and her proportionate imports from
different countries. To study India’s direction of foreign trade, her trading partners
have been grouped in to fine major categories.
(i) Organisation of Economic co-operation and development (OECD) countries.
(ii) Organisation of petroleum export countries (OPEC).
(iii) Eastern Europe (EE).
(iv) Less Developed countries (LDC’s) excluding (OPEC).
(v) Others.
1. The OED is the largest trading partner of India.
Estelar

94
2. The share of this group in India’s total exports accounted for over 60 percent
in 1960-61. This had however declined to 46 percent in1980-81. Thereafter, it
again rose to 53.50 percent in 1990-91 and further to over 60 percent in 1992-
93 and now the share of OPEC has reduced marginally at the end of the period
of the study.
3. The U.S.A is a major trading partner of India. The share of U.S.A in India’s
total exports was 13.50 percent in 1960-61 which has increased to 18.10
percent in 1980-81 and further to 18.80 percent in 1992-93 and now it is
sharing only 12.52 percent.
4. The share of U.S.A in India’s import was over 29 percent in 1960-61. This
however declined to 12.90 percent in 1980-81 and now its share is 4.8% of
India imports from U.S.A in the context of world.
Everybodyknows that international trade is beneficial for all the trading
countries. Nobody thought that India should prepare its aircrafts. Many people’s are
suspicious about the international trade that instead of trading with one another why
don’t we got self sufficient to produce that commodities at its own. Undoubtedly, it is
possible but in realistic terms the international trade has real gains from trade in all
aspects. The Range of these benefits is quite wider.
It is common misconception that trade is harmful if there are large differences
between the two countries it means if one country is developing and having its trade
relations to the developed one than the developing country will face the definite losses
but this is not true. Both the countries should get ready to face some of the hurdles
which will definitely take place for both the countries. On the one hand if the less
developed country has a fear about their industries for the foreign competition, at the
same time the developed nations has also the fear of trading with less developed
country to dry their standard of living down. As result we can see at the present that
every (LDC) has its trade relations with the world’s topmost or rich country’s of the
world. Developing nations are considered one of the big sale markets for the
developed nations.
Estelar

95
We can simply say that there is a type of greediness in both the countries, as
the developed country was a need of the largest market for the sale of their goods and
at the same time the developing countries has the desperate need of commodities for
their consumption, by which they can enjoy by consuming the sophisticated goods
and keep maintain their standard of living. So by their policy both the trading partners
come very close with one another and finally their relationship turned in to friendship
and both the countries than after works for the welfare for one another and remarkably
improves the social, political and economical environment overall which is also
helpful for the peace and prosperity of both the nations. Thus, it is justified that trade
is a master model or a painkiller which can cure every type of disease among the
different nations in the world.
Now the question only arises that who to trade with whom? The answer of this
question is quite different but that is dependent upon the basis of necessity of both the
nations, only we have to find out abundance of our trading partner and if it fulfils` our
requirements then we can blindly call her for the trade negotiations. Ever since the
international trade has attracted the attention of economists from eighteenth century.
David Hume, Adam Smith, David Ricardo and John Stuart will laid the foundation of
the present day international trade. David Hume by his quantity theory of money tried
to explain the effects of foreign trade on domestic prices. Absolute advantage theory
of Adam Smith, comparative cost theory of David Ricardo and supply and Demand
Theory of J.S. Mill are used as the analytical tools by the modern economists. In the
modern times the balance of payments among the developed and developing nations
has become the debatable issue from east to west and north to south among the
economists. There is very rough and uneven trade share amongst the countries of the
world some countries are enjoying the largest share of the world and others are just
feeling about trade and in these countries now question arises in terms of shares.
In the present time Globalization has made all the nations of the world
integrated with one another and no country can live in isolation. There are generally
two basis of international trade. Firstly if there is uneven distribution of natural
resources. Secondly if the cost of production varies from nation to nation then there
are full chances of Trade between them. The country which is abundant in labour may
sell labour intensive goods and the country which is abundant in capital will export
Estelar

96
the capital intensive goods. In this way both the countries will gains from trade. But is
the price of an item is same in both the countries then there is no chance of trade and
then the countries will never trade to one another.
The maximum export and minimum imports results the favourable balance of
trade for a country. The division of labour also helps in more production, improves
qualities and lowers the cost of production thus bringing benefit to all the trading
nations. Trade not only makes the benefits in social and political relations but it also
helps in the improvement and distribution of technology among the different countries
of the world. Commodity worship becomes the accepted creed of the people; there
dawns in substance a new era of economic development with the bulk of the people
living in the elegant or luxurious urban areas, only the unskilled and buds being left to
till the land. Extension of markets and development of transport and power along with
the development of banking facilities integrates the distant parts of the growing
economy. The issue to examine is now this process called economic development
affiants foreign trade and is affected by foreign trade.
In other words the mutuality of cause and consequence relationship between
foreign trade and economic development is the question to examine.
International trade is a supplement of developing countries to domestic
savings by borrowing from affluent countries by this way the developing countries
can increase their rate of capital formation and can utilize their savings more
productively. Every small or big country would become a part of the world economy.
Therefore in the recent past the inter dependence among the different countries took
place due to the technological revolution in communication and transport sector. The
internationalization makes a country to think about the implications of its policies
beyond its boundaries. The economic integration of nations is increasing the scope of
international trade. The interdependence of economics makes them sensitive to the
international happenings. Now the domestic economics are infect influence by the
international happenings. Every economy of the world designs its monetary and fiscal
policies to keep the outside world under consideration.
The consequences of the development of the under development countries on
the nature and composition of internal trade say after some years when most of the
Estelar

97
countries of the world would become self radiant then there will be the new face of
the world economics which would be quite interesting to examine. We can simply
guess two possibilities. One is that there is fear in the advanced countries that they
may possibly lose the markets for their manufactures in the backward countries
succeed in their programme of industrialization they would manufacture all the things
which they use to import from foreign countries will manufacture in their own
country. Secondly, it is also argued that impact the international trade has got a fresh
stimulus because of the increase in the national income of currently backward
countries. The underdeveloped countries would also be able to have a much greater
exportable surplus when they attain to a high stage of development. Hence, the
demand for imports of developing countries from the developed one country is likely
to be increased.
The field of international trade has become more debatable in the recent years
with views emerging on trade policy, determination of rate of exchange and the
international coordination of macroeconomic policies. Although knowing this very
well the underdeveloped countries undergo loses if they will keep themselves away
from the world economy still they stressed on self reliance. They often try to protect
themselves from foreign products.
The world trade organisation (WTO) has gone a long way in the recent years
to reduce the various tariff barriers for free trade, yet the non-tariff barriers are often
restored to by nations to protect their markets from the outside products. The
international trade analyse the various trade issues like subsidy, tariff, quota etc.,
while it also involves currency fluctuation, types of securities and moments in
International capital market. According to Mordechai E. Kreinin, “the international
economics are concerned with the flow of commodity services and productive factors
(Capital and Labour) across the national boundaries”. There are three things which are
necessary to understand that are:
Trade in commodities, capital flow and labour flow. Trade in commodities
simply refers to the imports and exports performed by the companies of one country
for the residence of another capital flows means that the establishment of
manufacturing plants in foreign countries. Labour flow describes the international
flow of workers. The developed nations can help for the promotion of the process of
Estelar

98
industrialization in an underdeveloped country by various means such as by reducing
the tariff barriers and by accepting its consumer goods and semi-manufactured goods.
Undoubtedly foreign aid is necessary for an underdeveloped country, but trade is
more significant. As a result, ‘Trade and Aid’ the most famous slogan which has been
raised by the underdeveloped nations of the world.
Diversification of Export
After independence, when it thought for the increase in our exports. Firstly it
is necessary to diversify them. The large numbers of industries have been developed
since independence in India. The factories have been set up to produce the
engineering goods, sewing machines, electrical goods, shoes, leather goods and
machine tools etc. firstly these industries have been set up to meet out the domestic
requirement for consumption but later on to give these industries more stress these
factories are able to produce for exports also.
Thus the industrialisation and economic development proved to be of supreme
importance to our country after independence. Anyhow Indian Industries have a great
need of raw material, technical known how which can be only possible by imports.
India has not sufficient foreign exchange to take the industrial level at the top at their
own level. At that time the foreign exchange we acquire to stabilize our economy in
each and every field is in the shape of foreign in each and every field is In the shape
of foreign aid or foreign debt and all is possible due to the openness of the Indian
economy which helped particularly the industrial sector of India to reach at the
prestigious level and shares upto 26% at the total Indians GDP present.
For the long term interests of the country the planners feels to lay the stress on
self reliance and to earn the foreign exchange by exporting maximum to the foreign
countries. Indian has shown despotic upward exporting trends since independence are
given in the forth coming tables and has also shown the directions of India’s foreign
trade overall.
Estelar

99
Table No. 5.1
Export import and Trade balance of India (In US Million Dollar)
Year Exports Import TB Exports
(%change)
Imports
(% change)
Export
% GDP
Import
% GDP
1991-92 17998 19551 -1553 -0.83 -16.68 6.3 7.31 1992-93 17437 20583 -3146 -3.12 5.28 7.3 8.42 1993-94 22213 23305 -1092 27.39 13.22 8.06 8.45 1994-95 26337 28662 -2325 18.57 22.99 8.14 8.86 1995-96 31842 36730 -4888 20.90 28.15 8.92 10.29 1996-97 33498 39165 -5667 5.20 6.63 8.62 10.08 1997-98 35049 41535 -6486 4.63 6.05 8.52 10.10 1998-99 33211 42379 -9168 -5.24 2.03 7.98 10.18 1999-00 36760 49799 -13039 10.68 17.51 8.15 11.04 2000-01 44147 50056 -5909 20.10 0.52 9.58 10.86 2001-02 43958 51567 -7609 -0.43 3.02 9.17 10.76 2002-03 52823 61533 -8710 20.17 19.33 10.39 12.11 2003-04 63886 78203 -14317 20.94 27.09 10.85 13.04 2004-05 83502 111472 -27970 30.70 42.54 11.58 15.45 2005-06 103075 149144 -46069 23.44 33.80 12.36 17.89 2006-07 126276 185081 -58805 22.51 24.10 13.32 19.52 2007-08 162988 249791 -86803 29.07 34.96 13.15 20.16 2008-09 183091 299311 -116220 12.33 19.82 15.06 24.62 2009-10 178345 287647 -109302 -2.59 -3.90 12.91 20.82 2010-11 251957 352274 -100317 41.28 22.47 14.58 20.32 2011-12 304624 489417 -183356 21.8 32.3 17.81 28.62 2012-13 300401 490737 -190336 -1.8 0.3 15.97 26.10 2013-14(P)a 312610 450068 -137458 4.1 -8.3 16.82 24.22
Source: - DGCI&S Kolkata
P: Provisional
a) Growth rate on Provisional over revised basis and based on Department of
Commerce Methodology.
Estelar

100
In the table No. 5.1 the export and import of India to the world are shown and
trade balance realised that throughout the different years from 1991-92 to 2012-13
India is facing the trade in deficit which is increasing continuously throughout the
years from 1991-92 upto now whereas in 1991-92 India exported worth 17998 US $
million increased more than double in the period of ten years reaches upto 43958 US
$ million in 2001-02 which further raised to 300401 US $ million with an increment
more than six times in a period of ten years from 2001-02 to 2013-2013 can be
concluded that the magnitude of exports of India to world are showing impressive
results in relative and absolute terms. As if the import side of India from the different
countries as the world on value basis in 1991-92 India imported the goods valued
19551 US $ millions which increased upto 51568 US $ millions in 2001-02 with an
increment of more than double as in the exports of India to world. The imports of
India further increased by more than nine times in ten years period and reaches upto
4907365 US $ millions in 2012-13. The deficit in trade is one of the most burning and
high priority issues in front of the planners of India.
Table no. 5.2
Export of different groups of commodities from 2000-01 to 2010-11 (in US
Million)
Groups Years %share total
exports
2000-01 2010-11 2000-01 2010-11
Agriculture and Allied Products 5982.94 24695.83 13.55 9.80
Ores and Minerals 1154.87 10660.03 2.62 4.23
Manufactured goods 34391.24 164107.00 77.90 65.13
Chemical and related products 4260.14 21513.18 9.65 8.53
Engineering Goods 6761.16 68796.70 15.31 27.30
Textile (Excluding RMG) 5725.40 12178.97 12.97 4.83
RMG 5577.97 11175.76 12.63 4.43
Rubber Manufacture Products 351.57 1706.60 0.80 0.67
Gems and Jewellery 7396.05 36632.07 16.75 14.53
Source:- Computed from CMIE Bombay, DGCI&S Kolkata 2012
Estelar

101
Table No. 5.3
Principle Export of India: We export almost 210 commodities from our country to
the other countries of the world. All the commodities are categorised in to nine
groups. The groups and the number of commodities full under these are as:
S. No. Groups No. of commodities
1 Agriculture allied products 37
2 Ores and Minerals 05
3 Manufactured good 07
4 Chemical and Related products 06
5 Engineering goods 12
6 Textiles (Exc. RMG) 18
7 RMG 05
8 Rubber manufactured products 01
9 Gems and Jewellery 01
10 others 18
Source:- Computed from CMIE and DGCI&S Kolkata.
The table No. 5.2 shows the trends of directions of the composition of exports
of different commodities from India to world during the period of the study from
2001-02 to 2010-11. In this table manifested good are showing its highest
contribution shares 77.90 percent at the start of the period of study i.e. in (2001-02)
and then slightly reduced to 65.13 percent at the end of the study period. Any how the
share of manufactured goods in the export of India’s to the world is one of the
significant contributions in the exports of India to world. Then engineering goods are
also sharing at its high 27.30 percent in the total exports of India to world. Relatively
Engineering goods recorded very impressive contribution in the share of engineering
goods to USA also. After that Gems and Jewellery, Agriculture and Allied products
and some others are shown in the table with their contributions in percentage share in
the total exports of India to the world.
The principle exports of India are shown in the table No. 5.3 in which the
commodities are almost grouped into ten groups against their numbers in front of
them. These no. of commodities giving us an interesting story that agriculture and
Estelar

102
allied products have the no. of 37 commodities but shares only 9.80 percent in the
total exports of India to the world Although the engineering good and Gems and
Jewellery has 12 and 1 number of commodities respectively but shares almost eighty
percent of the total exports of India.
Table no. 5.4
Trends of India’s Foreign Trade (1990-91 to 2010-11) (Imports and Exports in Billion Rupees)
Year Import Exports Trade bal Changes in imports %
Change in export %
Trade bal as % of exports
1990-91 431.90 325.50 -106.40 22.00 17.60 32.70
1991-92 478.50 440.40 -38.10 78.00 35.30 8.70
1992-93 633.70 536.90 -96.80 32.40 21.90 18.10
1993-94 728.10 696.50 32.60 14.90 29.50 4.70
1994-95 899.70 826.70 73.00 23.60 18.60 6.60
1995-96 1226.80 1063.60 -163.30 36.40 28.60 15.30
1996-97 1889.10 1188.10 -201.00 13.20 11.70 16.90
1997-98 1541.70 1301.00 -240.70 10.90 9.50 18.50
1998-99 1760.90 1418.10 -344.80 14.20 8.80 24.30
1999-00 2152.40 1595.60 -556.80 20.70 14.20 34.80
2000-01 2308.70 2035.70 -273.00 7.30 27.60 13.41
2001-02 2452.00 2090.20 -361.80 6.20 2.70 17.31
2002-03 2972.00 2551.40 -420.60 21.20 22.10 16.40
2003-04 3591.00 2933.60 -657.40 20.80 15.00 22.40
2004-05 5010.10 3753.40 -1256.70 39.50 27.90 35.40
2005-06 6604.10 4564.20 -2039.90 31.80 21.60 44.60
2006-07 8405.10 5717.70 -2687.40 27.30 25.30 47.00
2007-08 10123.20 6558.64 -3564.48 8.19 14.70 54.34
2008-09 13744.36 8407.55 -5336.81 35.77 28.19 63.47
2009-10 13637.36 8455.34 -5182.34 -0.77 0.56 61.28
2010-11 16834.67 11426.49 -5408.18 23.44 35.13 47.33
Source:- Department of Commerce (Export and Import Data Bank) various Economic Survey and DGCI&S Kolkata for the year of 2001-02 and 2011-12.
Estelar

103
Table No. 5.5
Merchandise Import and Export in US Dollar Billion
Year Import Exports Trade bal Changes in imports %
Change in export %
Trade bal as% of exports
1990-91 24.1 18.1 -5.9 13.2 9.1 32.6 1991-92 19.4 17.9 -1.5 19.5 6.2 8.7 1992-93 21.9 18.6 -3.3 12.9 1.8 18.1 1993-94 23.2 22.2 -1.0 - 9.5 4.7 1994-95 28.6 26.3 -2.3 23.2 18.4 8.8 1995-96 36.6 31.7 -4.9 27.9 20.5 15.3 1996-97 39.3 33.4 -5.9 7.3 5.3 16.9 1997-98 41.4 35.1 -6.3 5.3 5.1 18.5 1998-99 41.8 33.6 -8.2 A.0 4.2 24.3 1999-00 49.7 36.8 -12.9 17.2 10.8 33.33 2000-01 50.5 44.6 -5.9 A.7 21 13.23 2001-02 51.4 43.8 -7.6 A.7 -1.6 17.35 2002-03 61.4 52.7 -8.7 19.4 20.3 16.51 2003-04 78.2 63.9 -14.3 27.3 21.8 22.37 2004-05 11.5 83.5 -28.0 42.7 30.8 33.53 2005-06 149.2 103.0 -46.2 33.8 23.4 44.85 2006-07 185.70 126.30 -59.40 24.50 22.60 47.00 2007-08 225.10 147.90 -77.20 21.21 17.10 52.10 2008-09 303.56 185.29 -180.00 10.93 4,97 63.15 2009-10 288.37 178.75 -109.62 -5.00 -3.52 61.32 2010-11 369.76 251.13 -118.63 28.22 40.62 47.23
Source:- Department of Commerce (Export – Import Data Bank) various issues of Economics Survey and DGCI&S Kolkata RBI.
In the larger and long term interest of the country the planners considered it
desirable to lay emphasis on self reliance and to earn foreign exchange through
increased exports. India’s exports experienced and upward trend during the years
immediately following independence. Overall trends in merchandise trade on customs
basis during the recent years both in dollar and rupee terms are given in table No. 5.4
and 5.5 Table 5.4 depicts that India’s imports have increased to Rs. 16834.67 billion
in 2010-11 as compared to Rs. 431.90 billion during 1990-91, while the exports has
increased Rs. 11426.49 billion in 2010-11 as compared to Rs. 325.50 billion in 1990-
91 and also the trade deficit has become more upto Rs. 5408.18 billion in 2010-11 as
compared to Rs. 106.40 billion 1990-91. This performance is marked by a high trade
deficit about Rs. 4435.75 billion per annum during the last five years of the period
Estelar

104
study. The capacity of exports to finance imports (exports / imports ratio) declined in
1990-91 to about 75 percent from 78 percent in the in the previous years in the face of
a fall in the growth of exports and sizeable growth in imports. However during 1991-
92 to 1993-94 the trade deficit has been curtailed by nearly sixty percent (in dollar
terms) due to sharp reduction in imports and then it has been increasing continuously
upto 2008 India’s merchandise exports and imports in (US $) grew by 40.62 percent
and 28.22 percent respectively in 2010-11, recording the lowest gap between growth
rates after 2009-10 i.e. 3.52 percent and 5.00 percent.
Table No. 5.6
India’s Export, Import and Trade Balance (1950-51 to 2010-11)
(In Rs. Crore)
Year Export Re-Export
Growth Rate
Import Growth Rate
Trade Balance
1950-51 606 24.9 608 -1.5 -2 1960-61 643 0.5 1122 16.8 -479 1970-71 1535 8.6 1634 3.3 199 1980-81 6711 4.6 12549 37.3 -5838 1990-91 32553 17.6 43193 22.0 10640 1991-92 44041 35.3 47851 10.8 3810 1992-93 53688 21.9 63375 32.4 9687 1993-94 69547 29.5 72805 14.9 -3259 1994-95 82674 28.6 89971 23.5 -7297 1995-96 106353 28.6 122678 36.3 -16325 1996-97 118817 11.7 138920.0 13.2 -20103 1997-98 130101 9.5 154176 11.0 -24075 1998-99 139752 7.4 178332 15.7 -38580 1999-2000 159561 14.2 215236 20.7 -55675 2000-01 203571 27.6 230875.0 7.3 -27302 2001-02 209018 2.7 245200 6.2 -36182 2002-03 255137 22.1 297206 21.2 -42069 2003-04 293367 15.0 359108 20.8 -65741.0 2004-05 375340 27.9 501065 39.5 -125725 2005-06 456418 21.6 660409 31.8 -203991 2006-07 5717779 25.3 840506 27.3 -268727 2007-08 655864 14.7 1012312 20.4 -356448 2008-09 840755 28.2 1374436 35.8 -533681 2009-10 845534 0.6 1363736 -0.8 -518202 2010-11 1142649 35.1 1683467 23.4 -626533
Source: Various Economic Survey of Different years from (1951 to 2012)
Estelar

105
India’s total exports, imports and trade rates balance are shown in Table. 5.6
from 1950-51 to 2010-11 (in terms of rupees). It is clear from the table export touched
the mark of Rs. 1142649 crores in 2010-11, compared to Rs. 606 crores during 1950-
51. Trade Deficit increased more rapidly in the same period from 2 crores to Rs.
626533 crores. The depressed international economic and trading environment a
difficult balance of payments position and the dwindling foreign exchange reserves of
the country continued to pose a serious challenge to export promotion effort of India.
To meet these challenges effectively, a multipronged and multi-faceted approach has
been adopted in the recent years in the form of innovative measures encompassing
policy framework, institutional service support export incentives and new tools of
exports promotion.
Total volumes of trade under various five years plans are shown in Table.
Table No. 5.7 India’s foreign Trade in Plan period (Average)
(Rs. in Crore) Period Exports Imports Balance
of Trade Export as percentage of Imports
First Plan 1951-52 to 1955-56 609 723 -114 85
Second Plan 1956-57 to 1960-61 624 985 -361 63
Third Plan 1961-62 to 1968-69 752 1241 -489 61
Three Annual Plan 1966-67 to 1968-69 1247 1991 -744 63
Fourth Plan 1969-70 to 1973-74 1807 1972 -465 91
Fifth Plan 1974-75 to 1977-78 4441 5147 -706 86
Sixth plan 1980-81 to 1984-85 8904 14547 -5643 61
Seventh Plan 1985-86 to 1989-90 17336 25038 -7742 69
Annual Plan 1990-91 1991-92
32553 44292
43193 47301
-10460 3009
75.37 93.64
Eighth Plan (1992-1997) 86216 97550 -11334 88
Ninth Plan 1997-2002 168400 204763 -36363 82
Tenth plan 2002-2007 1952041 2658294 -706253 73.43
Eleventh Plan (2007-12) 4851077 6398604 -4211473 75.81
Source: Department of commerce (Export-Import Data Bank) Government of India annual report and economic survey of different years.
Estelar

106
The table No. 5.7 deficits the volume of trade under the various five year plans
in (Rs. crores) the table shows the performance of trade in Indian economy on value
basis areas as:
So far in India there has been framed eleven five years plan covering almost
all the sectors of the country which may support to enhance the overall GDP of India,
but particularly in this chapter the Import and export pattern in India has been
analysed throughout the plan periods. India has also experienced three annual plans
from 1966-67 to 1968-69 and the Annual Plans of 1990-91 and 1991-92.
- First and Second Five years Plans:- The First Plan has been announced and
implemented in the year 1951-52 for the five years upto the years 1955-56 the
exports during this plan period was estimated of Rs. 609 crores and imports of Rs.
723 crores facing the trade deficit of 114 cores. Similarly in the second five year
plan the exports increased upto only 624 crores but correspondingly the imports
increased highly and reached on 985 Rs. crores increased the trade in deficit to
361 Rs. crores and the growth rate has 1 percent and 2.2 percent for its respective
plans.
- Third Five Years Plan:- By the implementation of fiscal, financial and
institutional measures by government of India to increase the exports and
attractive proposition. The earth of India reached at the take off stage during this
plan and got a big boost.
- Three Annual Plans (1966-67 to 1968-69):- In June 1966 the Indian Government
has devalued as India became more competitive in the global market but the
devaluation also does not gave the good result and the position of India remained
unaffected due to the withdrawals in incentive schemes coupled with drought
conditions and poor harvests during the years 1967-68 results to widened the trade
deficit during these three Annual Plans.
- Fourth Five Year Plan:- India experienced for a single time in the trade history
of India to accrue the trade surplus of Rs. 104 crores in 1972-1973. This has
happened because of the approval of export policy resolution in 1970 and import
were liberalised to facilitate the greater export production early 1970’s witnessed
a commodity boom in global markets.
Estelar

107
- Consecutively During the three five years plans of Fifth, Sixth and Seventh,
undoubtedly the export rose by more than double from Rs. 4441 crores to 8904
Rs. crores in the 6th plan and then to 17336 crores but correspondingly when the
import side is analysed the Imports increased by more than five times during the
three plan periods and at the end of the end of the seventh five year plan, as a
result shows very depressive trends particularly regarding trade of India.
- Two annual plans (1990-91) and 1991-92, Eight, Ninth and Tenth Plans:- The
annual plans 1990-91 and 1991-92 shows somewhat optimistic trends relatively at
the end of the 7th five year plans in 1991-92 India the trade in surplus of 3001 Rs.
crores but after that for the 8th, 9th and 10th five year plans the Indian economy
again disappointed with the huge trade in deficit which reaches on 706253 Rs.
crores at the end of the Tenth Five year plan. Just because of the non specific
policies of Indian Government towards International trade and Indian
manufacturing sector.
Eleventh Five Year Plan: The eleventh five years plan the original annual growth
target was put at 9 percent at the beginning of the plan due to the impact of global
economic crisis during the years 2008-09 and 2009-10. The set target of the eleventh
Five year plan was 9% but it remained unattainable and slipped down to almost 8%.
The growth rates for the first three years raised up from 6.7% to 9% in 2009-10. As a
result the trade patterns of India have also declined by the hindrances faced during the
period of five year plan. In table no. 5.7. It is clear that the exports of India
undoubtedly raised upto 4851077 crores relatively over the preceding Five year plan
from Rs. 1952040 crores but still shows the high trade in deficit of India estimating
almost of Rs. 4211473 crores at the end of the plan.
Twelfth Five Year Plan: In 2012 the Twelfth Five Year Plan was set up and
implement on 27 December 2012 by the then government under the Prime Minister
ship of Dr. Manmohan Singh. The Twelfth Five Year Plan is based on the following
assumptions are as:
- Enhancing the capacity for Growth.
- Enhancing Skills and Faster Generation of employment.
- Markets for efficiency and inclusion.
- Technology and Innovation.
- Managing Urbanisation.
Estelar

108
Table No. 5.8 Direction of India’s Exports (During 2001-02 to 2010-11)
(US Million $) Year/countries 2001-02 2002-03 2003-04 2004-05 2005-06 2006-07 2007-08 2008-09 2009-10 2010-11
EU 10155.37
(23.17) 11886.41 (22.54)
14516.59 (22.73)
18249.02 (21.84)
23228.84 (22.35)
26784.99 (21.19)
34490.16 (21.17)
38228.93 (21.93)
36028 (20.15)
48599 (19.35)
Southern Africa 463.12 (1.05)
640.51 (1.21)
791.43 (1.23)
1262.90 (1.51)
1940.02 (1.88)
2816.32 (2.22)
3607.46 (2.21)
3231.99 (1.85)
3309 (1.86)
5701 (2.27)
ASEAN 3457.02 (7.88)
4618.54 (8.76)
5821.74 (9.11)
8425.89 (10.08)
10411.30 (10.09)
12603.86 (9.97)
16376.24 (10.05)
18277.06 (10.48)
18114 (10.13)
27278 (10.86)
WANA 5777.83 (13.18)
7528.76 (14.28)
10185.03 (15.95)
14232.44 (17.03)
16685.21 (16.18)
23038.29 (18.23)
30357.15 (18.63)
36830.13 (21.13)
39354 (22.02)
56758 (22.60)
NE Asia 5822.46 (13.28)
7868.64 (14.91)
9387.17 (14.70)
13223.15 (15.82)
16226.10 (15.73)
19359.80 (15.32)
26437.06 (16.22)
24059.49 (13.80)
28905 (16.17)
42142 (16.78)
North America 9098.16 (20.75)
11594.03 (21.99)
12253.31 (19.19)
14632.55 (17.51)
18374.64 (17.82)
19960.96 (15.79)
21977.28 (13.49)
22235.73 (12.76)
20658 (11.56)
26913 (10.72)
East Asia 506.76 (1.15)
604.39 (1.14)
703.52 (110)
859.83 (1.02)
1004.50 (0.97)
1488.86 (1.17)
1409.11 (0.86)
1692.53 (0.97)
1690 (0.94)
1966 (0.78)
South Asia 2050.38 (4.67)
2784.90 (5.28)
4293.55 (6.72)
4606.14 (5.51)
5547.65 (5.38)
6464.42 (5.11)
9617.24 (5.9)
8823.60 (5.06)
8391 (4.69)
12879 (5.13)
Other CIS Countries 903.59 (2.06)
836.13 (1.58)
884.71 (1.38)
902.04 (1.07)
1079.16 (1.04)
1285.55 (1.01)
1505.44 (0.92)
1699.06 (0.97)
418 (0.79)
2570 (1.03)
Other developing countries 5592.31 (12.75)
4361.69 (8.27)
5005.95 (7.84)
7141.04 (8.54)
8594.58 (8.33)
12556.95 (9.93)
17126.86 (10.51)
19209.48 (11.02)
20884 (11.68)
26330 (10.48)
Total 43827 (100.00)
52719 (100.00)
63843 (100.00)
83535 (100.00)
103092 (100.00)
126360 (100.00)
162904 (100.00)
174288 (100.00)
178751 (100.00)
251163 (100.00)
Source:- Department of Commerce, various Economic Surveys, DGCI&S of various years from 2001 to 2012.
Estelar

109
Direction of India’s Trade
To study the Directions of India’s Forests Trade. It is most appropriate to
select the different regions of the world to which India exports its major proportion of
the total exports to the world. In the table No. 5.8 it is clear that to simplify the
magnitude of trade of India to the world is divided into ten regions are shown in the
table no. 5.8 in which EU, South Africa, ASEAN, WANA, NE Asia, North America,
East Asia, South Asia other CIS countries and other developing countries to these
regions of the world India has significant exporting trade in terms of values in US $
million with the percentage share given with the given values in the same table. In the
year 2001-02 India shares its maximum export to the EU North of value 10155.37 US
$ in shares 23.17 percentage of the total exports of India to the world which goes up
almost four times increase to 48599 at the end of the period of the study but the share
slipped slightly down by the share of 19.35 percentage. Similarly other regions of the
world are the significant share holders of the exports of the India from India.
Table No. 5.8 further depicts that particularly the North America imported
9095.16 US $ million in 2001-02 increased more than double and reaches up to 26913
US $ million but the percentage is 70.75 percent in the total exports of India to the
world but slipped down to 10.72 percent in 2010-11 shows very negative trends in
terms of the percentage share.
The table No. 5.9 (a), 5.9 (b) and 5.9 (c) again shows that the direction of
India’s exports on the basis of the groups of countries the world is already clustered in
different regions in the table No. 5.8 but for the purpose of the study in table No. 5.9
the regions are further divided into different countries which received the exports
from India on the value basis year wise. In this chapter almost 40 countries have been
taken 10 crore the trends of exports of India to U.S.A which is shown in the table No.
5.9 purposively if the exports of India to U.S.A are concerned India exports worth US
$ million 8513.34 in the year 2001-02 which raised upto 25552 US $ million with an
increment of more than three times increased constantly year wise during the period
of the study but shows a little decrease in the year (2009-10) from 208933 US $
million to 19535 US $ million, concluded it can be said that the share of exports of
India to U.S.A is significantly increasing as compared to others countries of the
world showing one by one in the table no. 5.9.
Estelar

110
Further in table no. 5.10 the percentage share of exports of India is analysing
country wise during the different years of the period of the study. This table depicts
that the EU is the largest recipient of Indian goods computing 23.17 percent of India’s
total exports in the year 2001-02 and at second number the North America attracts the
maximum exporting percentage in which U.S.A receives about 19 percent of the
exports of India in the total exports to world in the year 2001-02.
In the some table the percentage share of India’s export shows fluctuating
trends during the period of the study relatively shows significant and drastic declining
change took place reaches down to 0.62 percent in 2009-10 from 11.98 percent in
2008-09 and further decreased to 0.54 in 2010-11 which became a serious matter of
discussion by the view point of trade declined pattern of India particularly to U.S.A.
Direction of India’s Trade Bilateral and Regional Cooperation:
Particularly with U.S.A India is moving towards the commercial and most
favourable economic environment, although the trade between India and U.S.A are
not occurring very high in terms of figures but in the long term India and U.S.A will
be presentable examples of economic ties in the world.
Generally India has always stood for an open equitable, predictable, non
discriminatory and Role based international trade system. Considering that regional
and bilateral trade and economic cooperation agreements scorning as building blodes
towards achieving the multilateral trade liberalisation and bilateral negotiation with
her trading partners to diversity and expand the markets for its exports. Some of the
recent developments related to major Free Trade Agreements (FIAs) are as follows:
i) India Japan Comprehension Economic Partnership Agreement (CEPA).
ii) India – ASEAN Trade in Goods Agreement.
iii) India – EU Trade and Investment Agreement Negotiations.
iv) India – European Free Trade Association (EFTA).
v) India – New Zealand FTA / CECA.
vi) India – Australia CECA.
Estelar

111
Table No. 5.9 (a) Direction of India’s Exports (During 2001-02 to 2010-11)
(on the basis of Groups of Blocks) (US million $)
Years/countries 2001-02 2002-03 2003-04 2004-05 2005-06 2006-07 2007-08 2008-09 2009-
10
2010-
11
1.EU of which 10155.37 11886.41 14516.59 18249.02 23228.84 26784.99 34490.16 38228.93 36028 480599
1.1 Belgium 1390.62 1661.84 1805.73 2509.71 2871.23 3471.73 4208.65 4617.06 3759 6296
1.2 France 945.00 1074.09 1280.89 1680.94 2079.59 2099.16 2596.61 2895.33 3820 5068
1.3 Germany 1788.36 2106.68 2544.57 2826.25 3586.12 3976.43 5116.39 5812.53 5413 6762
1.4 others 6031.39 7043.80 8885.40 11232.12 14691.90 17237.67 22568.81 24904.01 23036 30473
2. South Africa of
which
463.12 640.51 791.43 1262.90 1940.02 2816.32 3607.46 3231.99 3309 5701
2.1 South Africa 352.94 483.98 539.43 984.04 1526.87 2244.74 2657.37 2075.50 2059 3985
2.2 Zimbabwe 12.50 15.83 23.51 23.45 23.99 31.90 31.90 70.93 49 114
2.3 Others 97.68 140.70 228.57 255.41 389.16 539.68 918.19 1085.56 1201 1602
3. ASEAN of Which 3457.02 4618.54 5821.74 8425.89 10411.30 12603.86 16376.24 18277.06 18114 27278
3.1 Indonesia 533.71 826.06 1127.21 1332.60 1380.20 2026.50 2159.12 2421.46 3063 6245
3.2 Malaysia 773.69 749.37 892.77 1084.06 1161.86 1303.26 2567.59 2701.06 2835 3957
3.3 Singapore 972.31 1421.58 2124.84 4000.61 5425.29 6064.19 7367.54 8676.93 7592 10303
3.4 Others 1177.31 1621.53 1676.92 2008.62 2443.95 3209.88 4281.99 4477.61 4624 6773
Estelar

112
Table No. 5.9 (b) Direction of India’s Exports (During 2001-02 to 2010-11)
(on the basis of Groups of Blocks) (US million $)
Years/countries 2001-02 2002-03 2003-04 2004-05 2005-06 2006-07 2007-08 2008-09 2009-10 2010-11
4.WANA of which 5777.83 7528.76 10185.03 14232.44 16685.21 23038.29 30357.15 36830.13 39354 56758
4.1 Israel 428.02 634.54 723.98 1005.76 1201.50 1320.39 1602.90 1537.46 1969 3030
4.2 Saudi Arbia 826.43 940.74 1123.31 1412.06 1809.77 2586.15 3706.48 5451.99 3907 5227
4.3 UAE 2491.97 3327.48 5125.61 7347.88 8591.79 12022.77 15626.91 19229.46 23970 34349
4.4 Others 1945.66 2626.00 3212.13 4466.74 5082.15 9436.62 9420.86 10611.22 9508 14152
5. NE Asia 5822.46 7868.64 9387.17 13223.15 16226.10 19359.80 26437.06 24059.49 28905 42142
5.1 Hong Kong 2366.36 2613.33 3261.83 3691.82 4471.32 4676.92 6305.22 6461.59 7888 10330
5.2 Japan 1510.44 1864.03 1709.30 2127.91 2481.26 2860.47 3853.78 3011.73 3630 5192
5.3 China 951.95 1975.48 2955.10 5615.88 6759.10 8293.97 10828.78 9353.50 11618 19616
5.4 Others 993.71 1410.80 1460.94 1787.54 2514.42 3528.44 5449.28 5232.67 5769 7005
6. North America 9098.16 11594.03 12253.31 14632.55 18374.64 19960.96 21977.28 22235.73 20658 26913
6.1 Canada 584.82 698.27 763.20 866.80 1021.58 1109.53 1265.25 1342.39 1123 1361
6.2 USA 8513.34 10895.76 11490.11 13765.75 17353.06 18851.42 20712.03 20893.33 19535 25552
7. East Asia 506.76 604.39 703.52 859.83 1004.50 1488.86 1409.11 1692.53 1690 1966
7.1 Australia 418.02 504.18 584.30 720.25 821.23 924.05 1150.04 1364.40 1385 1717
7.2 New Zealand 62.21 67.70 85.97 93.22 141.90 502.97 158.51 195.60 255 194
7.3 Others 26.63 32.51 33.25 46.36 41.37 61.84 100.56 132.53 50 55
Estelar

113
Table No. 5.9 (c) Direction of India’s Exports (During 2001-02 to 2010-11)
(on the basis of Groups of Blocks) (US million $)
Years/countries 2001-02 2002-03 2003-04 2004-05 2005-06 2006-07 2007-08 2008-09 2009-10 2010-11
8.South Asia 2050.38 2784.90 4293.55 4606.14 5547.65 6464.42 9617.24 8823.60 8391 12879
8.1 Nepal 214.46 350.36 669.36 743.14 859.97 927.77 1506.05 1479.99 1533 2204
8.2 Pakistan 144.01 206.16 286.94 521.05 689.23 1348.55 1944.17 1445.33 1573 2334
8.3 Others 1691.91 2228.38 3337.25 3341.95 3998.45 4188.10 6167.02 5898.28 5285 8341
9. Other CSI Countries 903.59 836.13 884.71 902.04 1079.16 1285.55 1505.44 1699.06 1418 2570
9.1 Russia 798.18 704.00 713.76 631.26 733.15 902.17 939.74 1075.33 981 1580
9.2 Ukraine 91.05 93.70 110.27 207.73 258.19 289.41 398.60 447.46 289 824
9.3 Others 24.36 38.43 60.66 63.05 87.82 98.97 167.10 176.27 148 166
10.Other developing countries 5592.31 4361.69 5005.95 7141.04 8594.58 12556.95 17126.86 19209.48 20884 26330
10.1 Brazil 219.01 479.03 275.62 678.17 1090.61 1452.31 25126.86 3137.73 2414 3971
10.2 Kenya 156.01 203.59 229.48 426.64 576.54 1314.47 1578.73 1459.20 1452 2288
10.3 Others 5217.39 3679.07 4500.85 6036.23 6924.43 9790.17 13031.59 14612.55 17018 20071
India’s total export 43827 52719 63843 83535 103092 126360 162904 174288 178751 251136
Source:- Department of Commerce (Export and Import Bank) various years of (DGCI&S) Kolkata
Estelar
114
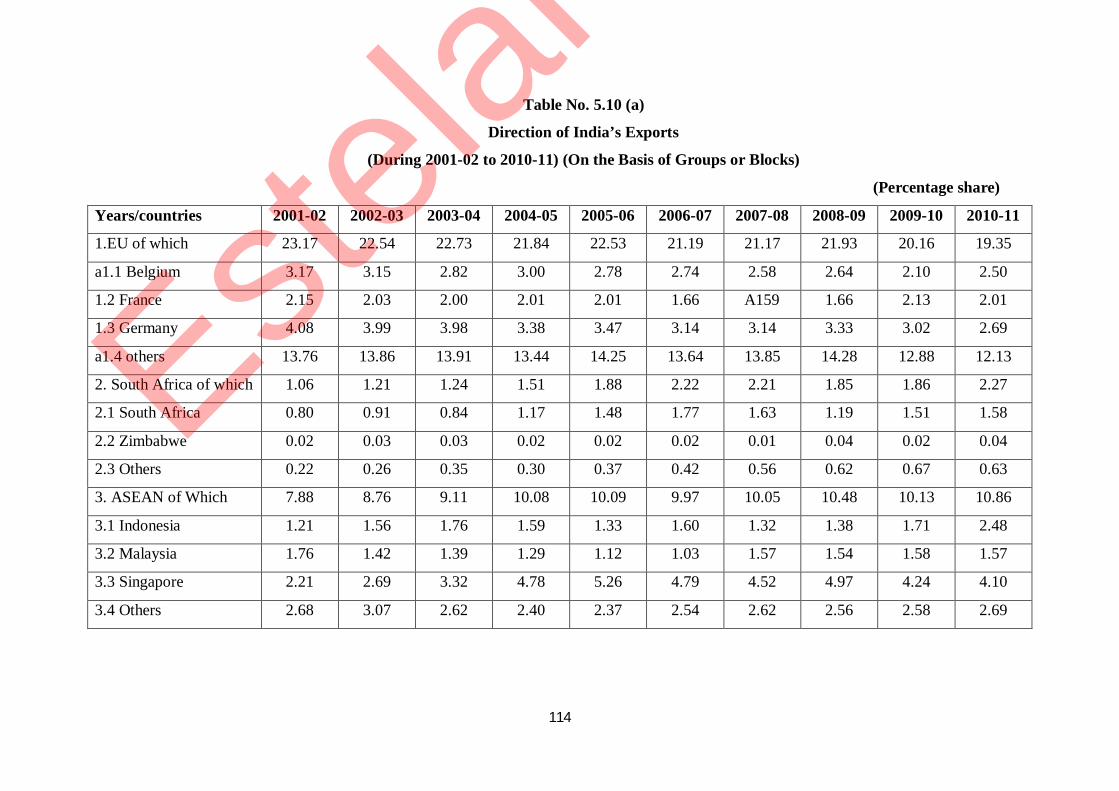
Table No. 5.10 (a)
Direction of India’s Exports
(During 2001-02 to 2010-11) (On the Basis of Groups or Blocks)
(Percentage share)
Years/countries 2001-02 2002-03 2003-04 2004-05 2005-06 2006-07 2007-08 2008-09 2009-10 2010-11
1.EU of which 23.17 22.54 22.73 21.84 22.53 21.19 21.17 21.93 20.16 19.35
a1.1 Belgium 3.17 3.15 2.82 3.00 2.78 2.74 2.58 2.64 2.10 2.50
1.2 France 2.15 2.03 2.00 2.01 2.01 1.66 A159 1.66 2.13 2.01
1.3 Germany 4.08 3.99 3.98 3.38 3.47 3.14 3.14 3.33 3.02 2.69
a1.4 others 13.76 13.86 13.91 13.44 14.25 13.64 13.85 14.28 12.88 12.13
2. South Africa of which 1.06 1.21 1.24 1.51 1.88 2.22 2.21 1.85 1.86 2.27
2.1 South Africa 0.80 0.91 0.84 1.17 1.48 1.77 1.63 1.19 1.51 1.58
2.2 Zimbabwe 0.02 0.03 0.03 0.02 0.02 0.02 0.01 0.04 0.02 0.04
2.3 Others 0.22 0.26 0.35 0.30 0.37 0.42 0.56 0.62 0.67 0.63
3. ASEAN of Which 7.88 8.76 9.11 10.08 10.09 9.97 10.05 10.48 10.13 10.86
3.1 Indonesia 1.21 1.56 1.76 1.59 1.33 1.60 1.32 1.38 1.71 2.48
3.2 Malaysia 1.76 1.42 1.39 1.29 1.12 1.03 1.57 1.54 1.58 1.57
3.3 Singapore 2.21 2.69 3.32 4.78 5.26 4.79 4.52 4.97 4.24 4.10
3.4 Others 2.68 3.07 2.62 2.40 2.37 2.54 2.62 2.56 2.58 2.69
Estelar

115
Table No. 5.10 (b) Direction of India’s Exports
(During 2001-02 to 2010-11) (On the Basis of Groups or Blocks) (Percentage share)
Years/countries 2001-02 2002-03 2003-04 2004-05 2005-06 2006-07 2007-08 2008-09 2009-10 2010-11
4.WANA of which 13.18 14.28 15.95 17.03 16.18 18.23 18.63 21.13 22.02 22.60
4.1 Israel 0.97 1.20 1.13 1.20 1.16 1.04 0.98 0.86 1.10 1.20
4.2 Saudi Arbia 1.88 1.78 1.75 1.69 1.75 2.04 2.27 3.12 2.18 20.08
4.3 UAE 5.68 6.31 8.02 8.79 8.33 9.51 9.59 11.03 13.40 13.6
4.4 Others 4.43 4.98 5.03 5.34 4.92 7.46 5.78 6.08 5.31 5.63
5.NE Asia 13.28 14.91 14.70 15.52 15.73 15.32 16.22 13.80 16.17 16.78
5.1 Hong Kong 5.39 4.95 5.10 4.41 4.33 3.70 3.87 3.70 4.41 4.11
5.2Japan 3.44 3.53 2.67 2.54 2.40 2.26 2.36 1.72 2.03 2.06
5.3China 2.17 3.75 4.62 6.72 6.55 6.56 6.64 5.04 6.49 7.81
5.4Others 2.26 2.67 2.29 2.13 2.43 2.80 3.34 3.00 3.22 2.78
6.North America 20.75 21.99 19.19 17.51 17.82 15.79 13.49 12.75 11.56 10.72
6.1Canada 1.33 1.32 1.19 1.03 0.99 0.87 0.77 0.77 10.92 10.17
6.2 USA 19.42 20.66 17.99 16.47 16.83 14.91 12.71 11.98 0.62 0.54
7.East Asia 1.15 1.14 1.10 1.02 0.97 1.17 0.86 0.97 0.94 0.78
7.1Australia 0.95 0.95 0.91 0.86 0.79 0.73 0.70 0.78 0.77 0.68
7.2 New Zealand 0.14 0.12 0.13 0.11 0.13 0.39 0.09 0.11 0.14 0.07
7.3Others 0.06 0.05 0.05 0.05 0.04 0.04 0.06 0.07 0.02 0.02
Estelar

116
Table No. 5.10 (c)
Direction of India’s Exports
(During 2001-02 to 2010-11) (On the Basis of Groups or Blocks)
(Percentage share)
Years/countries 2001-02 2002-03 2003-04 2004-05 2005-06 2006-07 2007-08 2008-09 2009-10 2010-11
8.South Asia 4.67 5.28 6.72 5.51 5.38 5.11 5.90 5.06 4.69 5.13
8.1 Nepal 0.48 0.66 1.04 0.89 0.83 0.73 0.92 0.84 0.85 0.87
8.2Pakistan 0.32 0.39 0.44 0.62 0.66 1.06 1.19 0.82 0.87 0.92
8.3 Others 3.86 4.22 5.22 4.00 3.87 3.31 3.78 3.38 2.95 3.32
9.Other CSI Countries 2.06 1.56 1.38 1.07 1.04 A101 0.92 0.97 0.79 1.03
9.1Russia 1.82 1.33 1.11 0.75 0.71 0.71 0.57 0.61 0.54 0.62
9.2Ukraine 0.18 0.17 0.17 0.24 0.25 0.22 0.24 0.25 0.16 0.32
9.3Others 0.05 0.07 0.09 0.07 0.08 0.07 0.10 0.10 0.08 0.06
10.Other developing
countries
12.76 8.27 7.84 8.54 8.33 9.93 10.51 11.02 11.68 10.48
10.1Brazil 0.49 0.90 0.43 0.81 1.05 1.14 1.54 1.80 1.35 1.58
10.2 Kenya 0.35 0.38 0.35 0.51 0.55 1.04 0.96 0.83 0.81 0.91
10.3 Others 11.90 6.97 7.04 7.22 6.71 7.74 7.99 8.38 9.52 7.99
Indias total export 100.00 100.00 100.00 100.00 100.00 100.00 100.00 100.00 100.00 100.00
Source: Department of Commerce (Export and Import Data Bank) various Economic Survey and DGCI and S, Kolkata.
Estelar

117
Table No. 5.11
Export Growth and Share in world Exports of Selected Countries
(During 2004 to 2010-11)
Percentage Growth Rate Percentage Share
Countries/Years 2004-05 2005-06 2006-07 2007-08 2008-09 2009-10 2010-11 2004-05 2005-06 2006-07 2007-08 2008-09 2009-10 2010-11
China 35.5 28.5 25.8 27.6 -15.9 31.3 24.0 6.6 7.4 7.8 8.4 9.7 10.5 10.1
Malaysia 26.9 12.1 15.1 7.7 -24.9 26.2 17.6 1.4 1.4 1.4 1.3 1.3 a.3 1.3
Indonesia 11.2 18.2 17.4 13.6 -14.4 32.1 27.6 0.8 0.8 0.9 0.8 1.0 1.0 1.1
Singapore 25.3 15.6 34.5 36.2 -20.2 30.4 21.9 2.0 2.2 2.3 2.7 2.2 2.3 2.3
Thailand 20.9 14.6 20.0 13.7 -13.6 28.6 17.3 1.1 1.1 1.1 1.1 a.2 a.3 a.3
Israel 26.2 28.4 21.5 15.8 16.8 15.3 14.9 0.7 0.9 1.0 1.0 0.9 0.8 0.9
Korea 29.3 11.8 13.7 8.7 -14.3 29.0 24.2 2.8 2.7 2.7 2.2 2.9 3.1 3.2
India 28.1 30.0 40.4 14.5 -15.2 35.1 55.00 0.8 1.0 a.0 1.0 a.3 a.5 a.9
USA 36.3 28.8 21.5 22.8 21.5 21.3 20.7 1.0 1.0 1.0 1.0 1.1 0.9 0.8
Developing
countries
27.0 21.8 23.1 15.5 18.2 18.7 17.9 38.8 43.8 44.8 45.0 43.2 41.5 40.9
World 21.6 13.9 16.4 13.8 13.4 12.1 11.9 100.00 100.00 100.00 100.00 100.00 100.00 100.00
Source: Department of commerce (Export-Import Data Bank) various Economic survey and DGCI&s, Kolkata
Estelar

118
Percentage share of India’s major trading partners in the world trade is thrown
light with the help of Table. 5.12. It is observed from the table that U.S.A is the only
country whose share the consistently during the period of study. UAE has made a
remarkable increase in its share in the total world trade which has gone from 3.4
percent to 10.81 percent at the end. After UAE, similar is the case with China whose
share has increased from 2.5 percent to 10.16 percent during the period. Thus U.S.A
holding the third position after UAE and China at the end of the period. The fourth
place goes to Singapore whose share has also slightly increased from 2.5 percent to
2.81 percent during the period. U.S.A still hold the third position after China which
has an important place in the total world trade but its share has come down from 13.0
percent in the beginning to 7.35 percent at the end of the period. However, Germany
has almost maintained its position with almost the same share in the total world trade
during the period. On the other hand the share of UK, Belgium, Israel, Japan and
Hong Kong has consistently come down almost the year after year during the period
of study. Thus, it may be inferred that China and UAE.
Table No. 5.12
India’s Trade Share and Export – Import
Ratio with major trading partners
Rank Country Share in total trade Export / Import Ratioa 2010-11 2011-12 2012-13 2013-14 2010-11 2011-12 2012-13 2013-14P
1. China 9.50 9.15 8.32 8.63 0.36 0.33 0.26 0.20
2. USA 7.30 7.31 7.76 8.06 1.26 1.49 1.433 1.76
3. UAE 10.72 9.14 9.54 7.82 1.03 0.98 0.93 1.05
Source:- Computed from DGCI&S data.
Note:- aA coefficient of export and import ratio between 0 and 1 implies that India’s imports are greater than exports and if the coefficient in greater than one, India exports more than its imports. P: Provisional
India’s trade share and export Ratio with major trading partners are shown in
the table No. 5.12 with the performance of share in total trade in the recent years in
the years 2010-11, 2011-12, 2012-13 and 2013-14 (Provisional) China is the leading
head followed by U.S.A with the total share of trade of 7.30 percent in 2010-11 which
raised exclusively upto 8.06 percent provisionally in the year 2013-14, which is then
followed by UAE.
Estelar

119
Table No. 5.13
India’s Major Trading Partners percentage share in total Trade
(Exports + Imports) (During 2000-01 to 2010-11)
S.No. Countries/
Years
2000-01 2001-02 2002-03 2003-04 2004-05 2005-06 2006-07 2007-08 2008-09 2009-10 2010-11
1 USA 13.0 12.2 13.4 11.6 10.7 10.6 9.8 10.1 8.2 7.83 7.35
2 UK 5.7 5.0 4.6 4.4 3.7 3.6 3.1 2.8 2.6 2.29 2.02
3 Belgium 4.6 4.4 4.7 4.1 3.6 3.0 2.4 2.1 2.2 2.09 2.40
4 Singapore 2.5 2.4 2.5 3.0 3.4 3.5 3.7 3.7 3.3 3.01 2.81
5 Israel 0.95 0.89 1.08 1.08 1.02 0.88 0.76 0.73 0.78 0.83 0.91
6 UAE 3.4 3.6 3.8 5.1 6.2 6.2 6.6 7.0 8.1 9.29 10.81
7 Japan 3.8 3.8 3.2 3.1 2.8 2.6 2.4 2.5 2.3 2.22 2.23
8 Germany 3.9 4.0 4.0 3.9 3.5 3.8 3.7 3.6 3.6 3.37 3.00
9 China 2.5 3.1 4.2 5.0 6.5 7.0 8.3 9.2 8.6 9.09 10.16
10 Hong kong 3.7 3.2 3.1 3.4 2.8 2.7 2.3 2.2 2.6 2.70 3.18
Total 44.05 42.59 44.58 43.68 44.22 43.88 43.06 43.93 42.28 42.72 44.87
Source: Department of commerce (Export-import Data bank) various Economic survey and DGCI&S Kolkata.
Estelar

120
Have been successful increasing their share in the world trade almost
throughout the period of study leaving UAE and other countries except China behind
in respect of share in the world.
Table No. 5.14 India’s share in world Exports
(During 1950 to 2011) Year Share in percent Year Share in percent 1950 1960 1970 1980 1981 1982 1983 1984 1985 1986 1987 1988 1989 1990 1991 1992 1993 1994
1.80 1.00 0.63 0.43 0.42 0.51 0.47 0.40 0.48 0.46 0.49 0.50 0.50 0.50 0.42 0.41 0.48 0.57
1995 1996 1997 1998 1999 2000 2001 2002 2003 2004 2005 2006 2007 2008 2009 2010 2011 2012
0.58 0.58 0.56 0.57 0.60 0.70 0.70 0.80 0.80 0.80 1.00 1.00 1.00 1.10 1.30 1.50 1.60 1.60
Source: various issues of United Nations ‘ International Trade Statistics Year Book, and for the year 2001 & 2012 data accessed on 26th may, 2014.
It is clear from the Table 5.14 that India’s share in world merchandise exports
after remaining unchanged at 0.80 percent 2003 and 2004 and has touched the level of
1.60 percent in 2011. This increase was due to India’s exports growing at more than
double rate of growth of world exports since 2005. U.S.A has been a star exports
growth was surpassed that of China, India’s significant exports growth in recent year
was because of a most of favourable external developments and domestic policy
initiatives, improved global growth and recovery in world trade aided the growth of
India’s Exports. The opening up of the economy and corporate restricting has
enhanced that competitiveness of Indian industry. There is far greater Export
orientation of domestic manufactures and corporate sector has been pursuing new
growth strategies in response to economic reforms. Firming up of domestic economic
activity, especially resurgence of manufacturing sector.
Estelar