Embed Size (px)
Citation preview

Regulatory Toxicology and Pharmacology 65 (2013) 325–333
Contents lists available at SciVerse ScienceDirect
Regulatory Toxicology and Pharmacology
journal homepage: www.elsevier .com/locate /yr tph
Establishment of the cumulative margin of exposure for a group ofpolychlorinated biphenyl (PCB) congeners using an improved approach thataccounts for both variability and uncertainty
Fereshteh Kalantari a,⇑, Charlotte Bergkvist d,1, Marika Berglund a, Elena Fattore b, Anders Glynn c,Helen Håkansson a, Salomon Sand c
a Institute of Environmental Medicine, Karolinska Institutet, P.O. Box 210, 17177 Stockholm, Swedenb ‘‘Mario Negri’’ Institute for Pharmacological Research, Via Giuseppe La Masa 19, 20156 Milano, Italyc National Food Agency, P.O. Box 622, 75126 Uppsala, Swedend European Food Safety Authority (EFSA), Via Carlo Magno 1/A, 431 26 Parma, Italy
a r t i c l e i n f o a b s t r a c t
Article history:Received 7 August 2012Available online 27 January 2013
Keywords:Cumulative risk assessmentMargin of exposureBenchmark doseHealth-based guidance valueDietary exposurePolychlorinated biphenylsHepatic vitamin ARetinoid system
0273-2300/$ - see front matter � 2013 Elsevier Inc. Ahttp://dx.doi.org/10.1016/j.yrtph.2013.01.005
⇑ Corresponding author. Fax: +46 8 34 38 49.E-mail address: [email protected] (F. Kalan
1 The paper is published under the sole responsibilconsidered as an EFSA output. The positions and opinioauthors alone and are not intended to represent thpresented in herein was performed at the time whresearcher at the Karolinska Institutet, Stockholm, Swe
In this study, the cumulative margin of exposure (MOE) was estimated for a group of polychlorinatedbiphenyls (PCBs) based on reduction of hepatic retinoids as a mode-of-action relevant toxicological end-point. The MOE was defined as the ratio between a reference dose, derived using the benchmark dose(BMD) approach, and the estimated human dietary PCB exposure. A distribution for the cumulativeMOE was established, taking into account inter- and intra-individual variability as well as uncertaintyin data measurements. The cumulative MOE reflected mainly the MOE for PCB 126; other PCB congenershad little contribution to the cumulative exposure and MOE. The median of the 0.1st percentile for thecumulative MOE was about 20 for women; depending on the percentile, cumulative MOE was 2–4 timeshigher for men compared to women. Furthermore, a relative potency factor (RPF) based approach wascompared to an RPF-free approach for estimating the cumulative MOE. The RPF-free approach more com-pletely accounts for variability and uncertainty but is more data intensive than the RPF-based approach,which can be more easily implemented in practice and allows for a use of historical data on RPFs. Con-sideration of the discussed approaches may contribute to improving cumulative health risk assessments.
� 2013 Elsevier Inc. All rights reserved.
1. Introduction
Humans are exposed to mixtures of chemicals via food and theenvironment. The development of risk assessment strategies thatconsider combined exposure of several chemical mixtures repre-sents a major challenge. This study focuses on the cumulative die-tary exposure to a group of polychlorinated biphenyls (PCBs), andthe impact of this exposure is assessed by a generalized margin ofexposure (MOE) approach using reduction of hepatic retinoids as amode-of-action relevant toxicological endpoint.
The MOE is commonly defined as the ratio between a referencepoint derived from the dose–response animal data, like the no-ob-served-adverse-effect level (NOAEL) or the lower confidence limit
ll rights reserved.
tari).ity of the authors, and is notns presented are those of thee views of EFSA. The work
en the second author was aden.
of the benchmark dose (BMDL), and the theoretical, predicted, orestimated exposure dose or concentration, e.g., the estimated die-tary exposure in the human population (WHO/IPCS, 2009).
A MOE approach using the BMDL has been suggested by boththe European Food Safety Authority (EFSA) and the Joint FAO/WHO Committee on Food Additives (JECFA) for risk assessmentof substances that are both genotoxic and carcinogenic (Barlowet al., 2006). For several years, the BMDL has been proposed to re-place the NOAEL as a reference point in quantitative health riskassessment of chemicals (Crump, 1984; Sand et al., 2011, 2008),and more recently the EFSA recommended the use of the bench-mark dose (BMD) approach in a general risk assessment context(EFSA, 2009). In conventional applications of the MOE, besidesusing the BMDL as the numerator, one or several point estimatesof the human exposure can be used as the denominator of theMOE. The mean or median human exposure provides a picture ofthe general exposure situation, while the use of upper-bound per-centiles of exposure provides information about high consumers inthe case of dietary exposure (Benford et al., 2010).
Using more advanced approaches, a distribution for the MOE(instead of point estimates) can be obtained that reflects
326 F. Kalantari et al. / Regulatory Toxicology and Pharmacology 65 (2013) 325–333
inter-individual variation due to differences in susceptibility tochemical toxicity and variability in exposure. The approach usedin this paper is an extension of the concepts presented earlier forsingle and multiple chemicals (van der Voet and Slob, 2007; vander Voet et al., 2009). A distribution for the BMD reflecting inter-individual variability, after accounting for animal to man extrapo-lation, is used as the numerator of the MOE. This BMD is herein re-ferred to as a reference dose (RfD). Uncertainty is also accountedfor in the estimation of the distribution for the RfD. Sometimesthe term margin of safety (MOS) is used, rather than the MOE,when a health-based guidance value is used instead of a referencepoint (e.g., the BMDL) in the MOE calculations (WHO/IPCS, 2004,2009). The term MOE is used in this paper since the estimatedRfD based on hepatic retinoid reduction does not represent anestablished health-based guidance value. The denominator in thepresent MOE approach is a distribution for the dietary exposuredescribing inter-individual variability in food consumption. Theuse of so called probabilistic exposure assessment approaches, thatattempt to characterize both variability and uncertainty, areincreasingly applied (Bergkvist et al., 2010; Cullen and Frey,1999; van der Voet and Slob, 2007). The variability and uncertaintywith respect to dietary consumption patterns and concentrationsof the PCBs in the different food items is in this study accountedfor by using an extension of the approach described in Sand andBecker (2012), where the uncertainty and variability in dietarycadmium exposure for the Swedish adult population was esti-mated by using a non-parametric bootstrap approach.
Humans are always exposed to mixtures of PCB congeners,which are man-made toxic compounds, comprising a group of209 individual congeners with variable pattern of chlorine substi-tution. PCBs have the ability to accumulate in the food chain, per-sist in the environment for long periods of time and pose toxicthreats to humans and wildlife, which is why PCBs were bannedin most countries during the 1970’s. Since then, the levels of PCBsin the environment and in humans have decreased markedly (Lig-nell et al., 2009; Noren and Meironyte, 2000), but the current back-ground PCB exposure levels are still of concern to human health(EFSA, 2005). PCBs elicit a wide range of toxicities in all speciesthrough different mechanisms of action depending on their chem-ical structure. Some PCB congeners elicit dioxin-like (DL) effectsdue to high-affinity binding to the aryl hydrocarbon receptor(AhR) and have been assigned a toxic equivalency factor (TEF) inthe scheme established by the World Health Organisation (Vanden Berg et al., 2006). PCB congeners, which lack such a TEF, are of-ten referred to as non dioxin-like (NDL) and have the ability tomodulate alternative signalling pathways, sometimes in additionto low affinity AhR activation (EFSA, 2005; Fernandes et al.,2010; Kretschmer and Baldwin, 2005).
In the present study, we have chosen modulations of the reti-noid system as a sensitive and toxicologically relevant effect mar-ker of PCB exposure for the MOE calculations. It is well establishedthat PCB congeners modulate the retinoid system at dose-levelswhere few other effects are observed (Nilsson and Hakansson,2002; Novak et al., 2008; Zile, 1992), and detailed analyses ofhigh-affinity AhR ligands have demonstrated tissue-specificchanges in polar and apolar retinoid levels (Fletcher et al., 2005;Nilsson et al., 2000; Schmidt et al., 2002, 2003), and turn over rates(Kelley et al., 1998, 2000) as well as tissue specific changes in theexpression of enzymes controling retinoid storage (Hoegberget al., 2003, Nilsson et al., 1996, 2000) and signalling (Jacobset al., 2010).
Consequences of a modulated retinoid system are expected to bebroad and serious since these nonsteroidal hormones, via their nu-clear receptor families, the RARs and RXRs, regulate the transcriptionof hundreds of genes (Balmer and Blomhoff, 2002), which play vitalroles in numerous physiological functions such as developmental
programming, skeletal morphogenesis, embryonic and postnatalgrowth, sex differentiation, vascularization, vision, immunocompe-tence, tissue homeostasis, and reproduction (Balmer and Blomhoff,2005; Brtko and Dvorak, 2011; Novak et al., 2008; Theodosiouet al., 2010). At the same time, many characteristics of PCB toxicityare compatible with signs of retinoid system abnormalities (Nilssonand Hakansson, 2002; Novak et al., 2008; Zile, 1992). On some ofthese grounds, it has been proposed that the retinoid system shouldbe incorporated into existing standard guidelines for the testing ofchemicals for potential endocrine disruptor properties (OECD,2011). Furthermore, retinoid system parameters have been used inthe regulatory processes by WHO to revise the internationally recog-nized TEFs for dioxin-like compounds (Van den Berg et al., 2006) andby USEPA to support the identification of critical dose levels in thehealth risk assessment for TCDD (USEPA, 2012). Hence, reductionof hepatic retinoids could be considered as a relevant endpoint to de-rive acceptable levels of human exposure to PCBs.
The approach used in the present study for estimating thecumulative MOE for a group of PCB congeners, accounts for vari-ability and uncertainty. This approach therefore represents a sig-nificant development compared to more conventional MOEapproaches that gives a single estimate for the MOE, i.e., by divid-ing the NOAEL or BMDL with some percentile of exposure. The pa-per investigates the relative contribution from the individual PCBcongeners to the cumulative MOE, gender related differences inthe cumulative MOE, and compares different approaches for esti-mating the cumulative MOE.
2. Materials and methods
2.1. Data used for modeling
2.1.1. Experimental dose–response dataPreviously published experimental dose–response data on eight
individual PCB congeners was used for the BMD analysis in thepresent study (Chu et al., 1998, 1995, 1994, 1996a,b; Lecavalieret al., 1997). Briefly, each experimental study included male and fe-male Sprague–Dawley rats that were randomly divided into groupsof 10 animals. The animals were maintained for 90 days on dietsconsisting of corn oil mixed with different concentrations of theindividual PCB congeners (Table 1). Control animals received theequivalent amount of corn oil only.
Dose-response analysis of all toxicological effect data derivedfrom the eight individual PCB studies have shown that changesin hepatic retinoid levels was the most suitable endpoint for thepresent analysis based on the criteria that 1) the effect should beobserved in the low-dose area, 2) that significant effects shouldbe observed for most of the PCB congeners under investigation,allowing the inclusion of a larger number of PCBs in the cumulativeapproach, and 3) that dose-response curves should be parallel (Kal-antari et al., 2012). In the case of non-parallel curves, RPFs will de-pend on the exposure level and such a situation is not directlyapplicable in a cumulative risk assessment framework. Hepatic ret-inoid levels were analyzed by HPLC as vitamin A, i.e., retinol ex-tracted from fully hydrolyzed tissue (Hakansson et al., 1987).
Non-selected endpoints that were affected for some of thecongeners, or at higher doses, included gross changes such as fattyliver and spleen enlargement, organ weights, clinical chemistrychanges, and haematological changes such as anaemia (Chuet al., 1998, 1995, 1996a,b; Lecavalier et al., 1997). Growth rateand food consumption were affected in both male and female ratsin the highest dose group after exposure to PCB 126 (Chu et al.,1994).
For the further analysis PCB 126 was selected as the referencecompound since it is the most potent congener among those inves-

Table 1Summarized study designs of the eight 13-week dietary treatment experiments of male and female Sprague–Dawley rats with corresponding doses of the investigated dioxin-like(DL) and non dioxin-like (NDL) PCB congeners.a
Congener (Referencec) Gender Treatment (lg/kg diet) Dose (lg/kg bw/day)b Animals per group
NDL PCB 28 (Chu et al., 1996) Male 0, 50, 500, 5000, 50000 0; 2,8; 36; 359; 3783 10Female 0, 50, 500, 5000, 50000 0; 2.9; 37; 365; 3956 10
DL PCB 77 (Chu et al., 1995) Male 0, 10, 100, 1000, 10000 0; 0.73; 7.1; 75; 768 10Female 0, 10, 100, 1000, 10000 0; 0.92; 8.7; 89; 892 10
DL PCB 105 (Chu et al., 1998) Male 0, 50, 500, 5000, 50000 0; 3.9; 39; 404; 4327 10Female 0, 50, 500, 5000, 50000 0; 4.2; 44; 449; 3960 10
DL PCB 118 (Chu et al., 1995) Male 0, 10, 100, 1000, 10000 0; 0.66; 6.9; 70; 683 10Female 0, 2, 20, 200, 2000 0; 0.17; 1.8; 17; 170 10
DL PCB 126 (Chu et al., 1994) Male 0, 0.1, 1, 10,100 0; 0.01; 0.08; 0.74; 7.4 10Female 0, 0.1, 1, 10,100 0; 0.01; 0.09; 0.84; 8.7 9
NDL PCB 128 (Lecavalier et al., 1997) Male 0, 50, 500, 5000, 50000 0; 4.2; 42; 425; 4210 10Female 0, 50, 500, 5000, 50000 0; 4.5; 45; 441; 4397 10
NDL PCB 153 (Chu et al., 1996) Male 0, 50, 500, 5000, 50000 0; 3.6; 34; 346; 3534 10Female 0, 50, 500, 5000, 50000 0; 4.2; 42; 428; 4125 10
DL PCB 156 (7) Male 0, 10, 100, 1000, 10000 0; 0.7; 6.87; 67.7; 697 10Female 0, 10, 100, 1000, 10000 0; 0.8; 8.1; 81.2; 809 10
a DL-PCB congeners have been assigned a toxic equivalency factor (TEF) in the scheme established by the World Health Organisation (Van den Berg et al., 2006) in order toallow for the cumulative assessment of exposure to mixtures of compounds, which bind to the Ah-receptor and exhibit the toxicological effect profile typical to the one of2,3,7,8-tetrachlorodibenzo-p-dioxin (TCDD). NDL PCB congeners lack such a TEF-value.
b The daily dose was estimated based on the food consumption of the corresponding group of animals.c Reference: (7). Previously unpublished data, obtained after personal communication with Professor Ih Chu (PCB 156).
F. Kalantari et al. / Regulatory Toxicology and Pharmacology 65 (2013) 325–333 327
tigated in reducing hepatic retinoids. Furthermore, PCB 126 is wellrecognized as a reference compound for dioxin-like effects, and hasbeen used as the reference compound instead of 2,3,7,8-TCDD forestimating relative potency values in several rat studies (Van denBerg et al., 2006).
2.1.2. Human exposure dataConsumption data from the food consumption survey on adults
conducted in 1997–1998 by the National Food Administration incollaboration with the Swedish Statistical Agency (Riksmaten 97–98) were used (Becker and Pearson, 2002). Riksmaten 97–98 isbased on a 7-day dietary record, and consumption data are avail-able for 1211 individuals 17–80 years of age. The study populationwas systematically selected from the national population registry,which guarantees an even geographical distribution of the studypopulation. Participants recorded their daily food consumptionfor 7 consecutive days starting at different time points during a12 month period. A food frequency questionnaire was also usedto avoid zero consumption of rarely consumed fish. The consump-tion data from Riksmaten 97–98 was herein divided into 12 foodcategories; meat from game, beef, pork, dairy products, butter, veg-etable fat, poultry, sausage, liver pate, kidney/liver, egg and fish.Fish was further divided into 12 categories; cod, plaice, cannedherring, canned fish, fish sticks and other fish products, Baltic Seaherring, Atlantic herring, farmed salmon, Baltic Sea salmon, fresh-water fish, eel and shellfish. The average daily consumption offoods was expressed in grams per kilo body weight per day (g/kgbw/day) per individual. The final study population used hereinconsisted of 1185 individuals (567 men and 618 women). The fre-quency questionnaire of fish consumption has been validated inanother population-based study of food habits among adults inSweden by analyses of correlations between reported fish con-sumption and levels of the omega-3 fatty acids DHA (docosahexa-enoic acid) and EPA (eicosapentaenoic acid) in blood serum. TheSpearman’s correlation coefficient for total fish consumption vs.%DHA + EPA in blood lipids was 0.42 (p < 0.001).
Concentration data for the different PCB congeners (no datawas, however, available for PCB 128), for each food category (mg/kg), was obtained from the Swedish National Food Agency (NFA)through the dioxin control program from 2003 and onwards andfrom food monitoring studies from 1999 and onwards. The analyt-ical methods for PCBs in food included extractions with organic
solvents, clean-up steps, and final quantification using gas chroma-tography coupled to high resolution mass spectrometry (GC/HRMS) (Danielsson et al., 2005; Isaac et al., 2005; Jensen et al.,2003). The laboratories were all accredited and successfully partic-ipated in proficiency tests. In order to check the quality of the anal-yses control samples were analyzed regularly. Values below thelimit of quantification (LOQ), i.e., mean of the blank samples plussix times the standard deviation, were replaced by ½ LOQ. The foodconcentration data for each PCB congener was extrapolated with a3.3–8.6% decrease per year, depending on the congener (Lignellet al., 2009), to mirror the concentrations present in food in 2009.
2.2. Dose–response modeling and estimation of RfDs
2.2.1. BMD analysisThe family of Hill models was used for describing the experi-
mental dose–response data:
lðdijÞ ¼ ai þ hi
dgiij
kgii þ dgi
ij
!; ð1Þ
where ai describes the background response at zero dose for PCBcongener i; ki is the location parameter for PCB congener i (whichequals the ED50 dose); gi is the parameter that describes the shapeof the dose response curve for PCB congener i; hi is the parameterthat describes the dynamic range of response (the difference be-tween the estimated maximum and minimum response level) forPCB congener i; and dij is the dose of PCB congener i administeredto the j’th treatment group. The Hill model was fitted by maximumlikelihood. Both the three-parameter Hill model (as given above)and a two-parameter version, with gi = 1, were considered; the pre-ferred model was selected based on a likelihood ratio test. The BMDwas defined as a 5% change in response compared to the back-ground mean response; this is suggested by the European FoodSafety Authority (EFSA, 2009) as the default benchmark response(BMR), associated with the BMD for continuous data.
2.2.2. Estimation of RfDsAn RfD was estimated by applying inter- and intra-species
extrapolation factors to the BMD. As described below, these factorsare represented in terms of distributions that are based on the de-fault uncertainty factor of 100 (van der Voet and Slob, 2007). A sub-

328 F. Kalantari et al. / Regulatory Toxicology and Pharmacology 65 (2013) 325–333
chronic to chronic extrapolation factor is also used which is basedon body weight and liver weight data on mice and rats (Bokkersand Slob, 2005). The approach described below was performedwith respect to each PCB (126, 77, 105, 153 and 156):
1. A parametric bootstrap sample was drawn from the dose–response curve selected for the experimental PCB dataset. Theappropriate Hill model was then re-fitted/selected for this boot-strap sample and the BMD05 was estimated, as described in theprevious section.
2. An interspecies extrapolation factor (EFinter), which accounts fordifferences in sensitivity between animals and humans, wasdrawn as a random value from a log-normal distribution witha geometric mean equal to 4 and a geometric standard devia-tion equal to 1.48 (van der Voet and Slob, 2007). The ratBMD05 value resulting from the individual bootstrap samplewas then divided by a random value of EFinter to obtain aBMD05 value relevant for the average human.
3. The variability in the BMD values among human individualswas described by an intraspecies extrapolation factor (EFintra);20,000 values were drawn from a log-normal distribution witha geometric mean equal to 1 and a geometric standard devia-tion equal to 1:98�
ffiffiffiffiffiffiffiffiffiffiffi5=v2
5
q, where v2
5 is a random value drawfrom a Chi-square distribution with five degrees of freedom.An RfD distribution, describing variability among human indi-viduals, was estimated by dividing the BMD05 value relevantfor the average human with the 20,000 EFintra values (see bullet1).
4. An assessment factor was also added to the RfD distribution toextrapolate the sub-chronic results in the experimental studiesto chronic, which is more relevant for humans. This extrapola-tion factor was assumed to have a lognormal distribution withgeometric mean equal to 1.7 and a geometric standard devia-tion equal to 2.3 (Bokkers and Slob, 2005). The 20,000 simulatedRfDs were divided by a random value drawn from thisdistribution.
5. Uncertainty analysis; the process described in bullets 1–4 wasrepeated 500 times (one round for each bootstrap sample gen-erated from the experimental dose–response data).
2.2.3. Estimation of RPFsAn RPF approach was used for estimating the cumulative expo-
sure to the five PCB congeners 126, 77, 105, 153 and 156. UsingPCB 126 as the reference compound, relative potencies have beenestimated for PCB 28, 105, 118, 153 and 156 (Kalantari et al., unpub-lished data) (Table 2). These estimated relative potencies were used
Table 2Relative potency factors (RPFs) estimated for individual PCB congeners in relation toPCB 126, based on hepatic retinoid data for male and female Sprague-Dawley rats.a,b,c
PCB Congener RPF (Lower bound (P5), Upper bound (P95))
PCB 28 NAd
PCB 77 9.0e-04(5.6e-04, 1.3e-03)
PCB 105 4.5e-04(2.6e-04, 7.8e-04)
PCB 118 NAPCB 153 1.5e-04
(1.0e-04, 2.0e-04)PCB 156 4.5e-03
(2.6e-03, 6.9e-03)
a Common RPFs were statistically supported for male and female data.b There was no exposure data available for PCB 128 hence no analysis or calcu-
lation was performed.c For details regarding the RPF-calculations see Kalantari et al., (2012).d Not applicable: the saturated model was not significantly different from the no-
response model, i.e., no dose–response relationship was observed.
as RPFs in the present analysis. There was no statistical difference inrelative potency based on the male and female data, except for PCB153. Since results were similar for all but one congener in this re-spect, it was preferred to use a common RPF for males and femalesin the current analysis. The uncertainty in the RPFs was quantifiedby bootstrap analysis. The RPFs were assumed to be log-normallydistributed, with a geometric mean equal to the point estimates ofthe RPFs. The geometric standard deviation was estimated from atwo-sided 90% confidence interval established for each RPF (Table 2).
2.3. Estimation of human dietary exposure
The dietary exposure was estimated with regard to each PCBcongener and summarized over all congeners as a cumulativemeasure:
1. A non-paramteric bootstrap sample was drawn with replace-ment from the original consumption data matrix.
2. From the food concentration data matrix, a non-parametricbootstrap sample was drawn with replacement. A mean PCBconcentration level was then calculated for each food category.Correlations between the PCB concentration data in the differ-ent food categories were accounted for in this process.
3. For all individuals in the consumption survey, the (average)daily bodyweight-adjusted exposure over all food groups, Ii
(ng/kg/day), was calculated with respect to each PCB congener(PCBi, where i = 1–5).
4. From the RPF distribution estimated for each PCB congener, avalue, Ri, was randomly drawn. Ii was multiplied by the corre-sponding Ri. For each congener (PCBi) this gives the adjustedexposure in terms of PCB 126. For all individuals, the adjustedexposure was then summed over all congeners to give thecumulative dietary exposure, Icumulative (ng/kg/day). The log-normal probability density function (IEcumulative) was fitted tothe cumulative exposure data/estimates. The log-normal prob-ability density function was also fitted separately to theadjusted exposure data for each PCB in the evaluation of conge-ner specific exposures.
5. In order to perform uncertainty analysis, the process describedunder bullets 1–4 was repeated 500 times.
2.4. Estimation of MOE
The MOE was estimated as the ratio between the RfD and thedietary exposure:
MOE ¼ RfDexposure
ð2Þ
A cumulative MOE was derived in two ways. Using a ‘‘RPF-based’’ approach (Fig. 2), the MOE was estimated by dividing theRfD distribution (based on 20,000 values) for PCB 126 with thecumulative dietary exposure distribution (IEcumulative: 20,000 val-ues were randomly generated from the fitted log normal model,see previous section). The cumulative MOE was also derived undera ‘‘RPF-free’’ approach. This can be done by summing the inverse ofthe PCB specific MOEs (i.e. the ratio of PCB specific RfD distributionand the PCB specific exposure distribution); the inverse of this sumis the cumulative MOE. It can be shown that these two approaches,which are based on the assumption of dose addition, are theoreti-cally equivalent (van der Voet et al., 2009). The results from theRPF-based and RPF-free approaches were compared.

Fig. 1. The contribution of the individual PCB congeners to the cumulative PCBexposure, in terms of PCB 126 equivalents based on reduction of hepatic retinoids,for men (Part A) and women (Part B) 17–80 years of age. The relative contributionsare based on the mean exposure.
F. Kalantari et al. / Regulatory Toxicology and Pharmacology 65 (2013) 325–333 329
3. Results
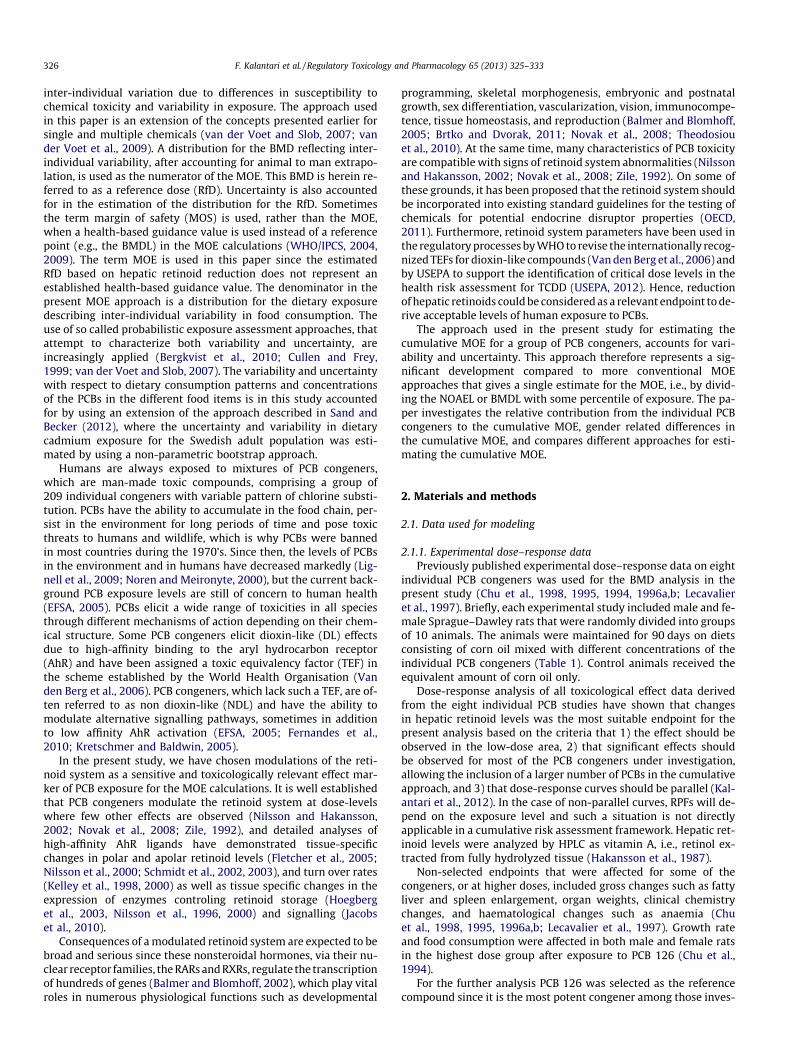
Estimated RfDs for PCBs 126, 77, 105, 153 and 156 are pre-sented in Table 3, in terms of the 50th (P50), 5th (P5) and 95th(P95) percentile; the differences between the percentiles describethe variability in sensitivity determined by the intraspecies extrap-olation factor (EFintra). Each percentile is presented with a medianand 90% confidence intervals as a measure of uncertainty. Thisuncertainty results from bootstrap analysis of the experimentaldose–response data, and the random sampling of the interspeciesextrapolation factor (EFinter) and the sub-chronic to chronic extrap-olation factor. The lowest RfD was observed for PCB 126 followedby PCB 156, PCB 77, PCB 105 and PCB 153. The RfD was generallylower for the female data. This was most pronounced for PCB126 where the point estimate of the median (P50) was approxi-mately 2 times lower for the female data compared to the males.
The dietary exposure to the five individual PCB congeners, aswell as the cumulative exposure, is given in Table 4, in terms ofthe 50th, 95th, and 99th percentiles. As presented in Table 4, thedietary exposure to individual PCBs and the cumulative exposurelevel, in terms of PCB 126 equivalents, are slightly higher for wo-men compared to men. By comparing Tables 3 and 4, it can be ob-served that there is a margin to the RfD in all cases; i.e., EXP < RfD.
The relative contribution of each individual PCB congener to thecumulative exposure is given in Table 4 and Fig. 1. PCB 126 contrib-uted the most (87%), followed by PCB 156 and PCB 153 (5–7%each), and PCB 105 and PCB 77 (<1% each). The same pattern wasobserved for both men and women.
The cumulative MOEs are presented in Table 5 in terms of the0.1st, 1st, 5th and 50th percentiles. MOE results are presented fortwo approaches; the RPF-based (Fig. 2) and the RPF-free ap-proaches. The median of the different percentiles is similar acrossthe two approaches, while the confidence intervals appear to besomewhat wider for the RPF-based approach relative to the RPF-free approach. The median of the 0.1st percentile for the cumula-tive MOEs is in the range of 20–70, depending on sex. This, moreor less, reflects the MOE for PCB 126. As pointed out previously,
the other PCB congeners contribute very little to the cumulativeexposure (Fig. 1), which is also reflected in the cumulative MOE.
The 0.1st percentile of the cumulative MOEs estimated for wo-men are the lowest MOE values obtained. The results in Table 5indicate that females have lower cumulative MOEs compared tomales; the median of the different percentiles (the 0.1st, 1st, 5thand 50th) is a factor 2–4 lower for females compared to males, con-sidering both approaches for estimating the cumulative MOE.
4. Discussion
In the present study we estimated a cumulative MOE, consider-ing a group of five PCB congeners, which accounts for inter-individ-ual differences and uncertainty. To date, some studies have applieda similar probabilistic risk assessment framework, but merely forpesticides (Bosgra et al., 2009; Muller et al., 2009). This is the firststudy to use such a concept for estimating the MOE cumulativelyover several PCBs. Generally speaking, fish consumption contrib-utes on average with over 60% to the total PCB intake among Swed-ish adults. The intake comes mainly from globally available marinefish with a small, on average 10%, contribution from consumptionof local PCB-contaminated fatty Baltic Sea fish (Tornkvist et al.,2011).
The lowest value for the cumulative MOE in the present studywas 20 (90% confidence interval of 5–80) and suggests that 1 outof 1000 women have a MOE less than 20 (with high confidence thisMOE value is not lower than 5, if also accounting for the uncer-tainty) (Table 5). This value was almost four times lower thanthe corresponding value for men. The result of a lower MOE for wo-men is mainly due to that the RfD for the reference compound, PCB126, is higher for men compared to women (Table 3), while thecumulative exposure for men and women is more similar (Table 4).The cumulative MOE was, more or less, equal to the MOE for PCB126, showing that the other congeners (PCBs 153, 156, 105 and77) contributed very little to the cumulative MOE, and thus tothe cumulative exposure (Fig. 1). While the cumulative exposureto the five PCB congeners was addressed in this study, additionalcongeners, and other compounds with retinoid-system modulatingproperties, such as other high- and low-affinity AhR ligands, pesti-cides, pharmaceuticals, industrial chemicals, metals and alcohol(Berg et al., 2008; Fattore et al., 2001; Lemaire et al., 2005; Leoet al., 1984; Rasmussen et al., 1985; Wang, 2005) could also be in-cluded in this model. If acting additive, the cumulative MOE is thenexpected to be lower than presented here.
The estimation of the cumulative MOE was performed consider-ing two approaches; an RPF-based approach, using PCB 126 as thereference compound (Fig. 2), and an RPF-free approach. The resultsfor the two approaches were similar with respect to estimates ofmedian MOE values, but the confidence intervals appeared to besomewhat wider for the RPF-based approach relative to the RPF-free approach (Table 5). It has been discussed that the RPF-free ap-proach used in the present study is equivalent to an RPF-based ap-proach (van der Voet et al., 2009). The implementation of the twoapproaches is, however, likely to differ in practice. The RPF-basedapproach requires the direct use of RPFs; such values are normallyestablished as single (average/median) values for each compound,and the uncertainty in the RPFs may also be estimated as was per-formed herein (Table 2). In van der Voet et al. (2009), on the otherhand, the RPFs have been defined as the ratio between individualreference doses that accounts for both variability and uncertainty(i.e. not conventional BMD ratios based on experimental data only).In consequence, the RPF-free approach can indirectly be regardedto account for both variability and uncertainty in relative potency.Thus, the main difference between the implementation of the twoapproaches discussed in current study is that uncertainty in rela-

Fig. 2. Illustration of the approach used for derivation of a cumulative (RPF-based) MOE for men 17–80 years of age. (Part A) Animal toxicity data for PCB126 (male rats) wasanalyzed using the BMD approach. The BMD was divided by extrapolation factors, EFinter, EFintra and EFsubchronic–chronic, by Monte Carlo simulations, resulting in a distributionfor the RfD. To account for uncertainties, the process of estimating the RfD was repeated, n = 500 times (see materials and methods). (Part B) The distribution for thecumulative exposure (expressed in terms of the PCB126 equivalents) is obtained by (1) combining consumption amounts and average PCB concentrations for each foodgroup; (2) adjusting the total exposure for each PCB by applying the appropriate RPF, and (3) summing adjusted exposures over all PCB congeners. The distribution of thecumulative MOE is the ratio between the RfD distribution and the cumulative exposure distribution, obtained by Monte Carlo simulations. To account for uncertainties, theprocess of estimating the cumulative MOE was repeated, n = 500 times (see Section 2).
330 F. Kalantari et al. / Regulatory Toxicology and Pharmacology 65 (2013) 325–333
tive potency is only accounted for in the RPF-based approach,while both variability and uncertainty in relative potency is indi-rectly accounted for in the RPF-free approach. This can explainthe observed differences in the numerical outputs from the two ap-proaches (Table 5).
While the RPF-free approach also accounts for variability (be-sides uncertainty) at the level of relative potency it may be re-garded as more data intensive since it requires the dose–
response data for all compounds considered for estimating thecumulative MOE. An advantage of the RPF-based approach is thatthe implementation of this method only requires detailed toxico-logical dose–response data on the reference compound (PCB126in this case) and RPFs derived from previous analysis may be used.
The present formulation of the MOE differs from more conven-tional approaches that typically use a reference point (i.e., NOAELor BMDL) in combination with some estimate of the human expo-
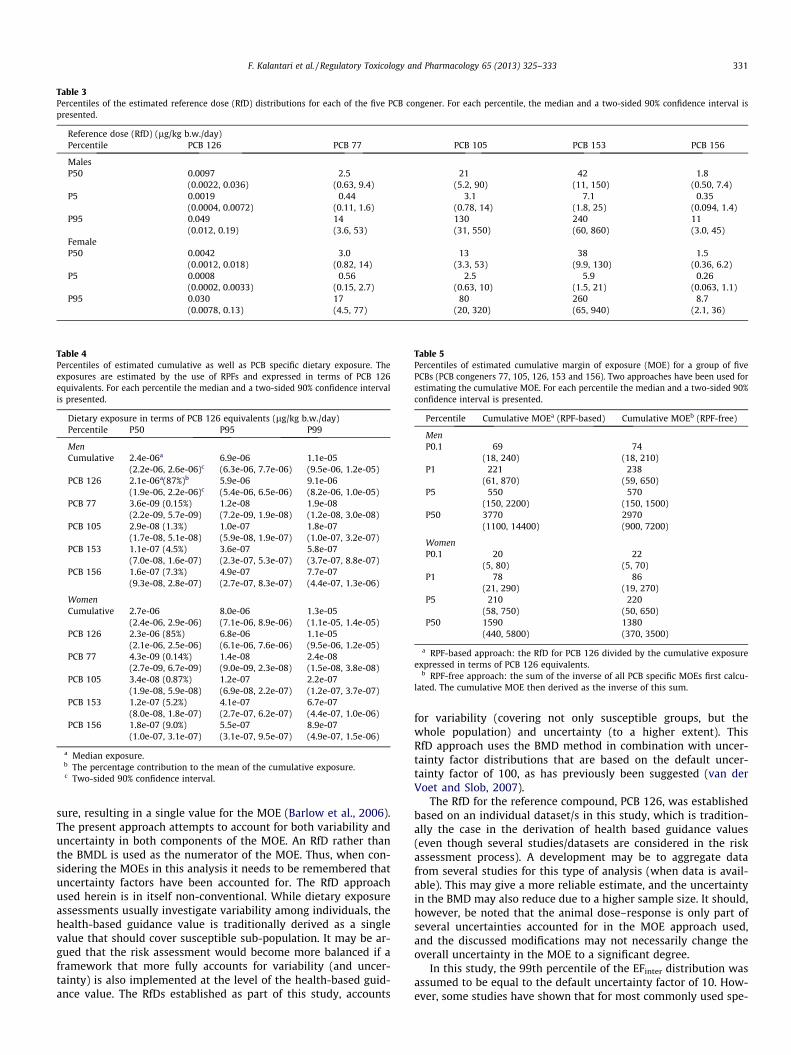
Table 3Percentiles of the estimated reference dose (RfD) distributions for each of the five PCB congener. For each percentile, the median and a two-sided 90% confidence interval ispresented.
Reference dose (RfD) (lg/kg b.w./day)Percentile PCB 126 PCB 77 PCB 105 PCB 153 PCB 156
MalesP50 0.0097
(0.0022, 0.036)2.5
(0.63, 9.4)21
(5.2, 90)42
(11, 150)1.8
(0.50, 7.4)P5 0.0019
(0.0004, 0.0072)0.44
(0.11, 1.6)3.1
(0.78, 14)7.1
(1.8, 25)0.35
(0.094, 1.4)P95 0.049
(0.012, 0.19)14(3.6, 53)
130(31, 550)
240(60, 860)
11(3.0, 45)
FemaleP50 0.0042
(0.0012, 0.018)3.0
(0.82, 14)13
(3.3, 53)38
(9.9, 130)1.5
(0.36, 6.2)P5 0.0008
(0.0002, 0.0033)0.56
(0.15, 2.7)2.5
(0.63, 10)5.9
(1.5, 21)0.26
(0.063, 1.1)P95 0.030
(0.0078, 0.13)17(4.5, 77)
80(20, 320)
260(65, 940)
8.7(2.1, 36)
Table 4Percentiles of estimated cumulative as well as PCB specific dietary exposure. Theexposures are estimated by the use of RPFs and expressed in terms of PCB 126equivalents. For each percentile the median and a two-sided 90% confidence intervalis presented.
Dietary exposure in terms of PCB 126 equivalents (lg/kg b.w./day)Percentile P50 P95 P99
MenCumulative 2.4e-06a
(2.2e-06, 2.6e-06)c6.9e-06(6.3e-06, 7.7e-06)
1.1e-05(9.5e-06, 1.2e-05)
PCB 126 2.1e-06a(87%)b
(1.9e-06, 2.2e-06)c5.9e-06(5.4e-06, 6.5e-06)
9.1e-06(8.2e-06, 1.0e-05)
PCB 77 3.6e-09 (0.15%)(2.2e-09, 5.7e-09)
1.2e-08(7.2e-09, 1.9e-08)
1.9e-08(1.2e-08, 3.0e-08)
PCB 105 2.9e-08 (1.3%)(1.7e-08, 5.1e-08)
1.0e-07(5.9e-08, 1.9e-07)
1.8e-07(1.0e-07, 3.2e-07)
PCB 153 1.1e-07 (4.5%)(7.0e-08, 1.6e-07)
3.6e-07(2.3e-07, 5.3e-07)
5.8e-07(3.7e-07, 8.8e-07)
PCB 156 1.6e-07 (7.3%)(9.3e-08, 2.8e-07)
4.9e-07(2.7e-07, 8.3e-07)
7.7e-07(4.4e-07, 1.3e-06)
WomenCumulative 2.7e-06
(2.4e-06, 2.9e-06)8.0e-06(7.1e-06, 8.9e-06)
1.3e-05(1.1e-05, 1.4e-05)
PCB 126 2.3e-06 (85%)(2.1e-06, 2.5e-06)
6.8e-06(6.1e-06, 7.6e-06)
1.1e-05(9.5e-06, 1.2e-05)
PCB 77 4.3e-09 (0.14%)(2.7e-09, 6.7e-09)
1.4e-08(9.0e-09, 2.3e-08)
2.4e-08(1.5e-08, 3.8e-08)
PCB 105 3.4e-08 (0.87%)(1.9e-08, 5.9e-08)
1.2e-07(6.9e-08, 2.2e-07)
2.2e-07(1.2e-07, 3.7e-07)
PCB 153 1.2e-07 (5.2%)(8.0e-08, 1.8e-07)
4.1e-07(2.7e-07, 6.2e-07)
6.7e-07(4.4e-07, 1.0e-06)
PCB 156 1.8e-07 (9.0%)(1.0e-07, 3.1e-07)
5.5e-07(3.1e-07, 9.5e-07)
8.9e-07(4.9e-07, 1.5e-06)
a Median exposure.b The percentage contribution to the mean of the cumulative exposure.c Two-sided 90% confidence interval.
Table 5Percentiles of estimated cumulative margin of exposure (MOE) for a group of fivePCBs (PCB congeners 77, 105, 126, 153 and 156). Two approaches have been used forestimating the cumulative MOE. For each percentile the median and a two-sided 90%confidence interval is presented.
Percentile Cumulative MOEa (RPF-based) Cumulative MOEb (RPF-free)
MenP0.1 69
(18, 240)74
(18, 210)P1 221
(61, 870)238
(59, 650)P5 550
(150, 2200)570
(150, 1500)P50 3770
(1100, 14400)2970(900, 7200)
WomenP0.1 20
(5, 80)22
(5, 70)P1 78
(21, 290)86
(19, 270)P5 210
(58, 750)220
(50, 650)P50 1590
(440, 5800)1380(370, 3500)
a RPF-based approach: the RfD for PCB 126 divided by the cumulative exposureexpressed in terms of PCB 126 equivalents.
b RPF-free approach: the sum of the inverse of all PCB specific MOEs first calcu-lated. The cumulative MOE then derived as the inverse of this sum.
F. Kalantari et al. / Regulatory Toxicology and Pharmacology 65 (2013) 325–333 331
sure, resulting in a single value for the MOE (Barlow et al., 2006).The present approach attempts to account for both variability anduncertainty in both components of the MOE. An RfD rather thanthe BMDL is used as the numerator of the MOE. Thus, when con-sidering the MOEs in this analysis it needs to be remembered thatuncertainty factors have been accounted for. The RfD approachused herein is in itself non-conventional. While dietary exposureassessments usually investigate variability among individuals, thehealth-based guidance value is traditionally derived as a singlevalue that should cover susceptible sub-population. It may be ar-gued that the risk assessment would become more balanced if aframework that more fully accounts for variability (and uncer-tainty) is also implemented at the level of the health-based guid-ance value. The RfDs established as part of this study, accounts
for variability (covering not only susceptible groups, but thewhole population) and uncertainty (to a higher extent). ThisRfD approach uses the BMD method in combination with uncer-tainty factor distributions that are based on the default uncer-tainty factor of 100, as has previously been suggested (van derVoet and Slob, 2007).
The RfD for the reference compound, PCB 126, was establishedbased on an individual dataset/s in this study, which is tradition-ally the case in the derivation of health based guidance values(even though several studies/datasets are considered in the riskassessment process). A development may be to aggregate datafrom several studies for this type of analysis (when data is avail-able). This may give a more reliable estimate, and the uncertaintyin the BMD may also reduce due to a higher sample size. It should,however, be noted that the animal dose–response is only part ofseveral uncertainties accounted for in the MOE approach used,and the discussed modifications may not necessarily change theoverall uncertainty in the MOE to a significant degree.
In this study, the 99th percentile of the EFinter distribution wasassumed to be equal to the default uncertainty factor of 10. How-ever, some studies have shown that for most commonly used spe-

332 F. Kalantari et al. / Regulatory Toxicology and Pharmacology 65 (2013) 325–333
cies in toxicological testing, the default factor of 10 corresponds toa lower percentile of EFinter distributions (Bokkers & Slob, 2007).Therefore, the EFinter distribution applied herein may not suffi-ciently cover the potential interspecies differences between ratand human. Therefore, the EFinter distribution applied herein maynot sufficiently cover the potential interspecies differences be-tween rat and human. Similar to EFinter we decided to also basethe within human variability, EFintra, on the conventional assess-ment factor of 10 in this study, since this corresponds to the mostestablished approach. Previous analysis of sensitive differences inthe retinoid response using dioxin sensitive Long-Evans and dioxinresistant Han/Wistar rats as model, generally indicated a 5-fold dif-ference (Sand et al., 2010). While understanding potential limita-tions of any animal model in a human health context, it may benoted that the approach used herein appears conservative com-pared to the endpoint specific results from the animal model (i.e.a factor 10 vs. a factor 5 difference in sensitivity). The RfD approachin this study also used a sub-chronic to chronic extrapolation factordistribution (see materials and methods). The sub-chronic tochronic extrapolation factor distribution that was considered inthis study is larger than the default uncertainty factors that havebeen used for such extrapolation (Bokkers and Slob, 2005). Hence,this distribution seems to be sufficiently protective.
The MOE approach may be used as a tool for investigating therelative level of concern for different chemicals (WHO/IPCS,2009). When using the approach presented in this study it shouldbe kept in mind that the number and type of uncertainty factorsused, as part of the RfD establishment, will impact on the MOE.Conventional MOEs may also not be readily comparable from caseto case, e.g., depending on what exposure percentiles are used(Barlow et al., 2006). Also, a MOE in terms of the BMDL dividedby some exposure percentile is a value that can be highly affectedby the uncertainty in these quantities. In the present approach, theeffect of uncertainty is better isolated.
5. Conclusions
The cumulative MOE was in this study estimated for a group offive PCB congeners based on reduction of hepatic retinoids as amode-of-action relevant toxicological endpoint. A framework thataccounts for variability and uncertainty, with regard to both com-ponents of the MOE, was applied. Exposure guidelines for individ-ual PCB congeners were derived by benchmark dose analysis ofexperimental dose–response data and the application of inter-spe-cies, intra-species, and sub-chronic to chronic assessment factordistributions. The dietary exposure to individual PCBs was esti-mated using consumption data on the adult Swedish populationand occurrence data on PCBs in foods from the NFA. Under aRPF-approach, the cumulative MOE was estimated by comparingan established RfD for PCB 126 with the cumulative exposure interms of PCB 126 equivalents. Derivation of a cumulative MOEwas also done under a RPF-free approach. The median of the0.1st percentile for the cumulative MOEs was about 20 for womenand about 70 for men. Depending on the percentile, or part of thepopulation considered, the cumulative MOE could be 2–4 timeslower for women compared to men. Estimates of the cumulativeMOE, more or less, reflected the MOE for PCB 126; the other PCBcongeners contribute little to the cumulative MOE. The RPF-freeapproach more completely accounts for variability and uncer-tainty, but is more data intensive, relative to the RPF-based ap-proach. An advantage with the RPF-based approach is that it canbe more easily implemented in practice and allows for a use of his-torical data on RPFs. Compared to conventional MOE approaches,these newer approaches provide an improved tool under which po-
tential health concerns can be assessed by accounting for both var-iability and the various uncertainties involved quantitatively.
Conflict of interest statement
The authors declare that there are no conflicts of interest.
Acknowledgments
The research presented in this paper was funded by the Net-work of Excellence CASCADE (FOOD-CT-2004-506319) and fundsfrom Karolinska Institutet foundations. The authors would like tothank Drs. Ih Chu (Scientist Emeritus), Wayne Bowers and col-leagues from Health Canada, for access to raw data files.
References
Balmer, J.E., Blomhoff, R., 2002. Gene expression regulation by retinoic acid. J. LipidRes. 43, 1773–1808.
Balmer, J.E., Blomhoff, R., 2005. A robust characterization of retinoic acid responseelements based on a comparison of sites in three species. J. Steroid Biochem.Mol. Biol. 96, 347–354.
Barlow, S. et al., 2006. Risk assessment of substances that are both genotoxic andcarcinogenic report of an International Conference organized by EFSA and WHOwith support of ILSI Europe. Food Chem. Toxicol. 44, 1636–1650.
Becker, W., Pearson, M., 2002. Riksmaten 1997–98. Kostvanor och näringsintag ISverige. Metod-och resultatanalysis (Dietary habits and nutrient intake inSweden 1997–98). Livsmedelsverket (National Food Administration), pp. 1–201.
Benford, D. et al., 2010. Application of the Margin of Exposure (MOE) approach tosubstances in food that are genotoxic and carcinogenic. Food Chem. Toxicol. 48(Suppl. 1), S2–S24.
Berg, A.L. et al., 2008. Early stellate cell activation and veno-occlusive-disease(VOD)-like hepatotoxicity in dogs treated with AR-H047108, animidazopyridine proton pump inhibitor. Toxicol. Pathol. 36, 727–737.
Bergkvist, C. et al., 2010. A probabilistic approach for estimating infant exposure toenvironmental pollutants in human breast milk. J. Environ. Monit. 12, 1029–1036.
Bokkers, B.G., Slob, W., 2005. A comparison of ratio distributions based on theNOAEL and the benchmark approach for subchronic-to-chronic extrapolation.Toxicol. Sci. 85, 1033–1040.
Bokkers, B.G., Slob, W., 2007. Deriving a data-based interspecies assessment factorusing the NOAEL and the benchmark dose approach. Crit. Rev. Toxicol. 37, 355–373.
Bosgra, S. et al., 2009. An integrated probabilistic framework for cumulative riskassessment of common mechanism chemicals in food: an example withorganophosphorus pesticides. Regul. Toxicol. Pharmacol. 54, 124–133.
Brtko, J., Dvorak, Z., 2011. Role of retinoids, rexinoids and thyroid hormone in theexpression of cytochrome p450 enzymes. Curr. Drug Metab. 12, 71–88.
Chu, I. et al., 1998. Subchronic toxicity of PCB 105 (2,3,30 ,4,40-pentachlorobiphenyl)in rats. J. Appl. Toxicol. 18, 285–292.
Chu, I. et al., 1995. Toxicity of PCB 77 (3,3’,4,4’-tetrachlorobiphenyl) and PCB 118(2,3’,4,4’5-pentachlorobiphenyl) in the rat following subchronic dietaryexposure. Fundam. Appl. Toxicol. 26, 282–292.
Chu, I. et al., 1994. Subchronic toxicity of 3,3’,4,4’,5-pentachlorobiphenyl in the rat.I. Clinical, biochemical, hematological, and histopathological changes. Fundam.Appl. Toxicol. 22, 457–468.
Chu, I. et al., 1996a. Toxicity of 2,2’,4,4’,5,5’-hexachlorobiphenyl in rats: effectsfollowing 90-day oral exposure. J. Appl. Toxicol. 16, 121–128.
Chu, I. et al., 1996b. Toxicity of 2,4,4’-trichlorobiphenyl in rats following 90-daydietary exposure. J. Toxicol. Environ. Health 49, 301–318.
Crump, K.S., 1984. A new method for determining allowable daily intakes. Fundam.Appl. Toxicol. 4, 854–871.
Cullen, A.C., Frey, H.C., 1999. Probabilistic Techniques in Exposure Assessment aHandbook for Dealing with Variability and Uncertainty in Models and Inputs.Plenum Press, Cop, New York, London.
Danielsson, C. et al., 2005. Trace analysis of polychlorinated dibenzo-p-dioxins,dibenzofurans and WHO polychlorinated biphenyls in food usingcomprehensive two-dimensional gas chromatography with electron-capturedetection. J. Chromatogr. A 1086, 61–70.
EFSA, 2005. Opinion of the Scientific Panel on contaminants in the food chain[CONTAM] related to the presence of non dioxin-like polychlorinated biphenyls(PCB) in feed and food. EFSA J. 284, 1–137.
EFSA, 2009. Guidance of the Scientific Committee on a request from EFSA on the useof the benchmark dose approach in risk assessments. EFSA J. 1150 (8), 1–72.
Fattore, E. et al., 2001. Toxicity of a technical mixture of polybominated diphenylethers following 28 days of oral exposure in male and female rats.Organohalogen Compd. 53, 357–360.
Fernandes, E.C. et al., 2010. Activation and potentiation of human GABAA receptorsby non-dioxin-like PCBs depends on chlorination pattern. Toxicol. Sci. 118, 183–190.

F. Kalantari et al. / Regulatory Toxicology and Pharmacology 65 (2013) 325–333 333
Fletcher, N. et al., 2005. Altered retinoid metabolism in female Long-Evans and Han/Wistar rats following long-term 2,3,7,8-tetrachlorodibenzo-p-dioxin (TCDD)-treatment. Toxicol. Sci. 86, 264–272.
Hakansson, H. et al., 1987. Effects of 2,3,7,8-tetrachlorodibenzo-p-dioxin (TCDD) inthe lactating rat on maternal and neonatal vitamin A status. J. Nutr. 117, 580–586.
Hoegberg, P., Schmidt, C.K., Nau, H., Ross, A.C., Zolfaghari, R., Fletcher, N., Trossvik,C., Nilsson, C.B., Hakansson, H., 2003. 2,3,7,8-tetrachlorodibenzo-p-dioxininduces lecithin: retinol acyltransferase transcription in the rat kidney. Chem.Biol. Interact. 145, 1–16.
Isaac, G. et al., 2005. Total lipid extraction of homogenized and intact lean fishmuscles using pressurized fluid extraction and batch extraction techniques. J.Agric. Food Chem. 53, 5506–5512.
Jacobs, E.T. et al., 2010. Genetic variation in the retinoid X receptor and calcium-sensing receptor and risk of colorectal cancer in the Colon Cancer FamilyRegistry. Carcinogenesis 31, 1412–1416.
Jensen, S. et al., 2003. A quantitative lipid extraction method for residue analysis offish involving nonhalogenated solvents. J. Agric. Food Chem. 51, 5607–5611.
Kalantari, F. et al., 2012. Estimation of relative potency values for polychlorinatedbiphenyl (PCB) congeners based on hepatic endpoints of toxicity. Manuscript inThesis at Karolinska Institutet. ISBN 978-91-7457-868-3.
Kelley, S.K., Nilsson, C.B., Green, M.H., Green, J.B., Håkansson, H., 1998. Use ofmodel-based compartmental analysis to study effects of 2,3,7,8-tetrachlorodibenzo-p-dioxin on vitamin A kinetics in the rat. Toxicol. Sci. 44,1–13.
Kelley, S.K., Nilsson, C.B., Green, M.H., Green, J.B., Hakansson, H., 2000. Mobilizationof vitamin A stores in rats after administration of 2,3,7,8-tetrachlorodibenzo-p-dioxin: a kinetic analysis. Toxicol. Sci. 55, 478–484.
Kretschmer, X.C., Baldwin, W.S., 2005. CAR and PXR: xenosensors of endocrinedisrupters? Chem. Biol. Interact. 155, 111–128.
Lecavalier, P. et al., 1997. Subchronic toxicity of 2,2’,3,3’,4,4’-hexachlorobiphenyl inrats. J. Toxicol. Environ. Health 51, 265–277.
Lemaire, G. et al., 2005. Activation of retinoic acid receptor-dependent transcriptionby organochlorine pesticides. Toxicol. Appl. Pharmacol. 202, 38–49.
Leo, M.A. et al., 1984. Decreased hepatic vitamin A after drug administration in menand in rats. Am. J. Clin. Nutr. 40, 1131–1136.
Lignell, S. et al., 2009. Persistent organochlorine and organobromine compounds inmother’s milk from Sweden 1996–2006: compound-specific temporal trends.Environ. Res. 109, 760–767.
Muller, A.K. et al., 2009. Probabilistic cumulative risk assessment of anti-androgenicpesticides in food. Food Chem. Toxicol. 47, 2951–2962.
Nilsson, C.B., Hakansson, H., 2002. The retinoid signaling system – a target in dioxintoxicity. Crit. Rev. Toxicol. 32, 211–232.
Nilsson, C.B., Hoegberg, P., Trossvik, C., Azais-Braesco, V., Blaner, W.S., Fex, G.,Harrison, E.H., Nau, H., Schmidt, C., van Bennekum, A.M., Håkansson, H., 2000.2,3,7,8-Tetrachlorodibenzo-p-dioxin (TCDD) increases serum and kidneyretinoic acid levels and kidney retinol esterification in the rat. Toxicol. Appl.Pharmacol. 169, 121–131.
Nilsson, C., Hanberg, A., Trossvik, C., Manzoor, E., Håkansson, H., 1996. 2,3,7,8-Tetrachlorodibenzo-p-dioxin affects retinol esterification in rat hepatic stellatecells and kidneys. Environ. Toxicol. Pharmacol. 2, 17–23.
Noren, K., Meironyte, D., 2000. Certain organochlorine and organobrominecontaminants in Swedish human milk in perspective of past 20–30 years.Chemosphere 40, 1111–1123.
Novak, J. et al., 2008. Disruption of retinoid transport, metabolism and signaling byenvironmental pollutants. Environ. Int. 34, 898–913.
OECD, 2011. Draft Detailed Review PaperState of the Science on Novel In Vitro andIn Vivo Screening and Testing Methods and Endpoints for Evaluating EndocrineDisruptors. Research Triangle Park: OECD, USA.
Rasmussen, M. et al., 1985. Retinol and retinyl esters in parenchymal andnonparenchymal rat liver cell fractions after long-term administration ofethanol. J. Lipid Res. 26, 1112–1119.
Sand, S., Becker, W., 2012. Assessment of dietary cadmium exposure in Sweden andpopulation health concern including scenario analysis. Food Chem. Toxicol. 50,536–544.
Sand, S. et al., 2011. A signal-to-noise crossover dose as the point of departure forhealth risk assessment. Environ. Health Perspect. 119, 1766–1774.
Sand, S. et al., 2010. Quantitative and statistical analysis of differences in sensitivitybetween Long-Evans and Han/Wistar rats following long-term exposure to2,3,7,8-tetrachlorodibenzo-p-dioxin. Regul. Toxicol. Pharmacol. 57, 136–145.
Sand, S. et al., 2008. The current state of knowledge on the use of the benchmarkdose concept in risk assessment. J. Appl. Toxicol. 28, 405–421.
Schmidt, C.K., Hoegberg, P., Fletcher, N., Nilsson, C.B., Trossvik, C., Hakansson, H.,Nau, H., 2003. 2,3,7,8-tetrachlorodibenzo-p-dioxin (TCDD) alters theendogenous metabolism of all-trans retinoic acid in the rat. Arch. Toxicol. 77,371–383.
Schmidt, C.K., Volland, J., Hamscher, G., Nau, H., 2002. Characterization of a newendogenous vitamin A metabolite. Biochim. Biophys. Acta. 1583, 237–251.
Theodosiou, M. et al., 2010. From carrot to clinic: an overview of the retinoic acidsignaling pathway. Cell Mol. Life Sci. 67, 1423–1445.
Tornkvist, A. et al., 2011. PCDD/F, PCB, PBDE, HBCD and chlorinated pesticides in aSwedish market basket from 2005 – levels and dietary intake estimations.Chemosphere 83, 193–199.
USEPA, 2012. EPA’s Reanalysis of Key Issues Related to Dioxin Toxicity andResponse to NAS Comments in Support of Summary Information on theIntegrated Risk Information System (IRIS), Vol. 1. U.S. Environmental ProtectionAgency, OCSPP Chemical Library/Washington,DC, 2012..
Van den Berg, M. et al., 2006. The 2005 World Health Organization reevaluation ofhuman and Mammalian toxic equivalency factors for dioxins and dioxin-likecompounds. Toxicol. Sci. 93, 223–241.
van der Voet, H., Slob, W., 2007. Integration of probabilistic exposure assessmentand probabilistic hazard characterization. Risk Anal. 27, 351–371.
van der Voet, H. et al., 2009. A model for probabilistic health impact assessment ofexposure to food chemicals. Food Chem. Toxicol. 47, 2926–2940.
Wang, X.D., 2005. Alcohol, vitamin A, and cancer. Alcohol 35, 251–258.WHO/IPCS, 2004. Harmonization Document No. 1 IPCS Risk Assessment
Terminology. World Health Organization, Geneva, Switzerland.WHO/IPCS, 2009. Principles for Modeling Dose–Response for the Risk Assessment of
Chemicals. World Health Organization, Geneva, Switzerland.Zile, M.H., 1992. Vitamin A homeostasis endangered by environmental pollutants.
Proc. Soc. Exp. Biol. Med. 201, 141–153.