Embed Size (px)
Citation preview

Establishment and survival of woody seedlingsin a semi-arid savanna in southern Botswana
Karin Bengtsson-Sjörs
Arbetsgruppen för Tropisk Ekologi Minor Field Study 123 Committee of Tropical Ecology ISSN 1653-5634 Uppsala University, Sweden
November 2006 Uppsala

Establishment and survival of woody seedlings in a semi-arid savanna in southern Botswana
Karin Bengtsson-Sjörs
Cover photo: Red hartebeest i Mokolodi Nature Reserve (Karin Bengtsson-Sjörs)

Establishment and survival of woody seedlings in a semi-arid savanna in southern Botswana
Abstract The regeneration pattern of woody dry savanna species in conditions with and without browsing of large herbivores in a dry savanna was described in Mokolodi Nature Reserve (24o45’S, 25o55’E) in southeastern Botswana. An inventory of wooded seedlings was carried out in the spring of 2001. The performance and survival of natural seedlings, both those surviving from the wet season 1999/2000 and those germinating during the 2000/2001 season, were recorded in experimental plots at Mokolodi. A planting experiment with seedlings of Combretum apiculatum was also conducted in the same plots. Seedlings from 22 woody species were found. The most numerous species or genera were, in descending order, Grewia spp., Euclea spp., Dichrostachys cinerea, Combretum apiculatum, Combretum hereroense, and Spirostachys africana. The density was unexpectedly high. The majority of the seedlings in the six plots had been established in the year 2000, probably because of good rains. This resulted in a “window of opportunity” with greater success in seedling recruitment than normal years. Thus, the situation in 2000/2001 was different from that reported by Flyman (1999) from the dryer rainy season 1998/1999. The density of seedlings in this study was roughly four times as high as that observed by Flyman (1999). The number of woody seedlings counted was higher in grazed controls than in exclosures without large herbivores, but the difference was not statistically significant. Seedling establishment was best together with a moderate cover of live and dead field layer vegetation and under trees or under shrub cover. This could be due to shade but could also be a consequence of more seeds dropped by birds sitting in the trees. After the first year of survival the performance of seedlings and saplings depends on browsing and trampling by large herbivores and, particulary, on the length of the dry periods. In a planting experiment with tree seedlings a high loss of individuals was found. It is likely that drought caused the deaths. Keywords: Botswana; semi-dry savannas; tree regeneration; seedlings; large herbivores; insect herbivory; windows of opportunity.
1

Introduction The dynamics of dry savannas are often explained by competitive relations between a grass-dominated herbaceous layer and a layer of woody plants. Impact on one of these layers may cause considerable changes in the other (Walker and Noy-Meir 1982, Stuart-Hill and Tainton 1989, Skarpe 1992). There is evidence that dry savanna vegetation, under the influence of large herbivores and fire, may change between different stages with widely different tree/grass ratio (Archer et al. 1992, Skarpe 1990), and thus, different net primary productivity and value for human land use. Four principle factors determining savanna structure and function are moisture (Plant Available Moisture = PAM), nutrients (Plant Available Nutrients = PAN), fire and herbivores (Flyman 1990, Scholes and Walker 1993, Skarpe 1992). The woody species, trees and shrubs, thus play a major role in the savanna biome and the population dynamics of the savanna trees and shrubs is of utmost importance for the savanna structure and function (Belsky 1994). Woody plants are also important for the dry savanna ecology as they, for example, give shade, alter evapo-transpiration and affect nutrient status of the soil. These species are also food for a great number of wild and domestic herbivores. Tree recruitment is a crucial step in tree population dynamics and the recruitment is likely to be limited by survival of tree seedlings, since they are vulnerable to many factors, such as drought, herbivores and fire (Crawley 1983). The impact of the herbivores on tree seedling survival is not well known, although several studies have speculated on the effects of individual herbivore species on savanna tree recruitment (Belsky 1984, Dublin 1995, Sinclair 1995). In many studies, the presence of trees improved the establishment and/or growth of seedlings and saplings. Numerous factors may be responsible for improved establishment under a canopy, such as moderated temperature, improved water availability, nutrient enrichment of soil by litter, or reduced predation (Hunter and Aarssen 1988, Hoffman 1996). Favorable sequences of rainfall and fires (Veenendaal et al. 1996) may provide a "window of opportunity" for seedlings to germinate and establish. Regeneration from seeds is important as a long-term strategy. Some years there may be a good establishment of seedlings but most of them die due to a number of causes, not least drought (Gerhardt 1993, Flyman 1999). This process may be influenced indirectly by large herbivores, as well as by small mammals (Linzey & Kesner 1997, Rudinow-Saetnan 2000) and insects (Bryant, et al. 1991, Bergström et al. 2000), as they change the field layer vegetation and, thus, the competitive situation for seedlings (Gerhardt 1993, Flyman 1999). Large herbivores may also play a direct role as a mortality factor of seedlings by browsing and trampling (Prins & van der Jeugd 1993, Rutina et al. 2004), thereby affecting not only numbers of surviving seedlings but also their spatial distribution. Large herbivores may directly and indirectly interact with the regeneration of woody species, and may in that way affect the population dynamics of the woody species and ultimately the physiognomy and functioning of the savanna ecosystem. How important such impacts is for the population dynamics and spatial distribution of woody species is currently little known. In dry savannas, many woody species regenerate vegetatively through suckers and basal shoots (van der Valk 1992). Sexual regeneration through seed dispersal, germination and subsequent
2

seedling establishment is believed to be a rare event in dry savannas. An earlier study (Flyman 1999) suggests that the performance of seedings of woody speciesis affected by large herbivore grazing. Objectives The intention with this study was to investigate and describe the regeneration pattern of woody species in conditions with and without browsing and grazing of large herbivores in a dry savanna. This was done by two approaches, a field survey and a planting experiment. The survey involved the following specific questions: Are large herbivores affecting woody seedlings in terms of:
-number of browsed seedlings -survival and development (with consideration to yearly weather variations) -species diversity and density -length and numbers of leaves -occurrence in relation to cover of herbs and standing litter
The experimentally planted woody seedlings were studied to evaluate survival and performance with and without large herbivores. Study area The study was performed in Mokolodi Nature Reserve (24o45’S, 25o55’E) about 15 km SW of Gaborone in southeastern Botswana. The reserve is a former cattle ranch and encompasses, after a recent extension, approximately 4 500 ha. The cattle keeping stopped in 1986 and the reserve was established in 1994. Today the reserve is fenced to keep domestic animals out and wild animals in. Since the area was turned into a reserve, eight species of large herbivores, which all occurred in the area before it was used for cattle grazing, have been re-introduced. The introductions were carried out between 1992 and 1994 (Bråten 1997). In total there are 16 large herbivore species in the reserve, and out of these, eight species are grazers, five are browsers and three are mixed feeders (Table 1).
3

Table 1. Large herbivores at Mokolodi Nature Reserve. Each species is presented with English name, scientific name, type of feeder (grazer = g, browser = b) and if introduced to the reserve 1992 – 1994 with a “y” (Bråten 1997). English name ScientificName Type of feeder IntroducedImpala Aepyceros melampus g + bHartebeest Alcelaphus buselaphus g yWhite rhinoceros Ceratotherium simum g yBlue wildebeest Connochaetes taurinus g yBurchell´s zebra Equus burchellii g yGiraffe Giraffa camelopardalis b yCommon waterbuck Kobus ellipsiprymnus g yKlippspringer Oreotragus oreotragus bGemsbok Oryx gazella g yWarthog Phacoochoerus aethiopicus gSteinbok Raphicerus campestris g + bMountain reedbuck Redunca fulvorufula gGrey duiker Sylvicapra grimmia bEland Taurotragus oryx g + b yBushbuck Tragelaphus scriptus bGreater kudu Tragelaphus strepsiceros b
The topography of southeastern Botswana, where the study area is situated, is undulating with low hills rising from the plains. This contrasts with the rest of the country, which is flat and largely sand-covered. The study area was located at an altitude of approximately 1050 meters. The soils belong to the eutric regosols with a dominant lithic phase. The soil is grayish brown to yellowish red in colour and can be described as very shallow to shallow coarse sand, moderately to excessively drained (De Wit & Nachtergaele 1990). The climate is semi-arid with an average annual precipitation of 538 mm (in Gaborone, 30 years´ mean; Botswana Weather Bureau, unpublished). Rainfall is strongly seasonal and occurs mostly in the summer months November to February. December is the hottest month with a mean maximum temperature of 32.6 oC. June and July are the coldest months with a mean minimum temperature of 3 oC (Tolsma et al. 1987), and frequent night frosts. The vegetation in the study area is a wooded savanna in which at least three vegetation types can be described (Skarpe et al. 2000). The Combretum-zone on the upper hill slopes is dominated by Combretum apiculatum, the Acacia-zone on the lower hill slopes is characterized by Acacia tortilis and the Spirostachys-zone along drainage lines is defined by dominance of Spirostachys africana. Methods Plots A project to study herbivore impact on semi-arid savanna was started in 1997 by NORAD (Norwegian Agency for Development Cooperation) in cooperation with the University of Botswana. The project is centered on three pairs of 140 x 140 m permanent plots, subjectively
4

placed within representative parts of the acacia-zone in the Mokolodi Nature Reserve. Each pair of plots was placed in as similar vegetation as possible and one plot per pair was fenced (fenced area 150 x150 m, i.e. a bufferzone of 5 m between fence and plot) to exclude animals larger than the size of a scrub hare (Lepus saxatilis). The unfenced plots in each pair serve as a control. Each 140 x 140 m plot, referred to as main plot, was divided into 196 subplots of 10 x 10 meters. The corners of the subplots were marked with metal pegs. In 1997 a baseline study was conducted. In the plots, all woody plants > 0.3 m high were mapped and measured at the start of the experiment in 1997 (Sjögren, 2000). Inventory After the start of the project in Mokolodi in 1997 several studies and experiments have been conducted in the permanent plots. My study of wooded seedlings was carried out in 2001 (the end of January until the end of March). Naturally occurring seedlings of woody species were mapped and marked in sampling transects, located with the help of the 10 x 10 m grid in all plots. Two transects (4 x 100 meters) from W to E were laid out per main plot (three unfenced and three fenced), which resulted in a total surveyed area of 800 m2 per main plot. The two transects were located with a spacing of 60 meters in N and S direction. In one plot an extra transect was laid out (2 x 100 meters) with a distance of 30 meters between the other two transects, which gives a total surveyed area of 1000 m2 in that plot. Each transect was marked with measure tapes placed between the pegs, which marked the middle of each transect. To record coordinates for all living woody seedlings rulers were used. Seedlings were defined as individuals of tree or shrub species having started their growth during the current rainy season 2000/2001 (denoted Yr 1) or during the preceding rainy season 1999/2000 (denoted Yr 2). Suckers from stumps or dead or living trees were excluded if an original plant could be identified at the base of the young plant. For each seedling found the following variables were recorded:
- species (nomenclature according to Coates-Palgrave 1983). Due to difficulties in identifying seedlings, some were sometimes only classified to genus (some Acacia, Grewia and Euclea; these are also called species in this thesis).
- estimated age of the seedling was given as germinated during current (1) or last (2) wet season.
- plant length was measured in centimetres with one decimal with the plant stretched out as far as was feasible without damaging it.
- plant leaves were counted. All fully developed leaves were counted, excluding undeveloped, still folded, young leaves. Completely dead leaves were not counted.
- insect damage of plant leaves was estimated as % of total leaf area removed or mined.
- plant vigour was subjectively estimated as 1 – seedling in poor condition, 2 – seedling in normal condition, and 3 – seedling in excellent condition.
5

The environment surrounding each seedling was described with the following variables: - total cover of the field layer, i.e. the combined cover of live and dead plant material
less than 50 cm high. Cover was estimated as percentage of a circular plot of 0.8 m2
with the seedling in the centre. - cover of live field layer vegetation, estimated as percentage of total cover. - height of the field layer, recorded as an average of the height in cm of the field layer
in the circular plot. - tree canopy cover, vertically above the seedling, recorded with the dominant species
name, alternatively “not present”. This was recorded independent of the height of the tree.
The inventory was conducted in all six main plots as described above. A re-examination of the seedlings was made after three weeks.
Planting experiment In total 110 cultivated seedlings of Combretum apiculatum, which is an important deciduous tree species in the system, was planted in different microenvironments in the exclosure and the control plots. The seedlings were raised in a nursery during November to February of 2000/2001and planted in the end of February / beginning of March. Eighteen plants were planted in each plot with an extension in two plots (control 2 and 4) were number of plants were 19. The plants were planted in a 10 x 10 m grid in each plot, 30 m south from the second transect with surveyed natural seedlings, with a regular pattern between the subplots. In each 10 x 10 m quadrate four seedlings were planted along the diagonals, 3.5 m from each corner. Plants were numbered from 1 to 18 or 19 and the planting order was NW, SW, SE and NE. Criteria and methods for recording data of the plants and their surrounding environment were the same as for the inventory of the natural seedlings. Calculation and statistical analyses All data treatment and statistical work were carried out in Excel. Each seedling is one sampling unit in all analyses. Samples recorded from the exclosure areas have been compared with samples recorded from the control areas. To test whether specific distributions diverge or not between the two treatments, grazing or not grazing, “Wilcoxon test” was used. In the analyses, the data was pooled for each transect and the two transects in the exclosure were compared with the two transects in the control in all three pairs of plots. The Wilcoxon test for matched pairs is a simple non-parametric test for comparing the medians of two matched samples. It calls for the calculation of a test statistic T whose probability distribution is known (Fowler 1998). In the test, one observation in a matched pair is subtracted from each other. Observations must therefore be measured on an interval scale. In this study, for
6

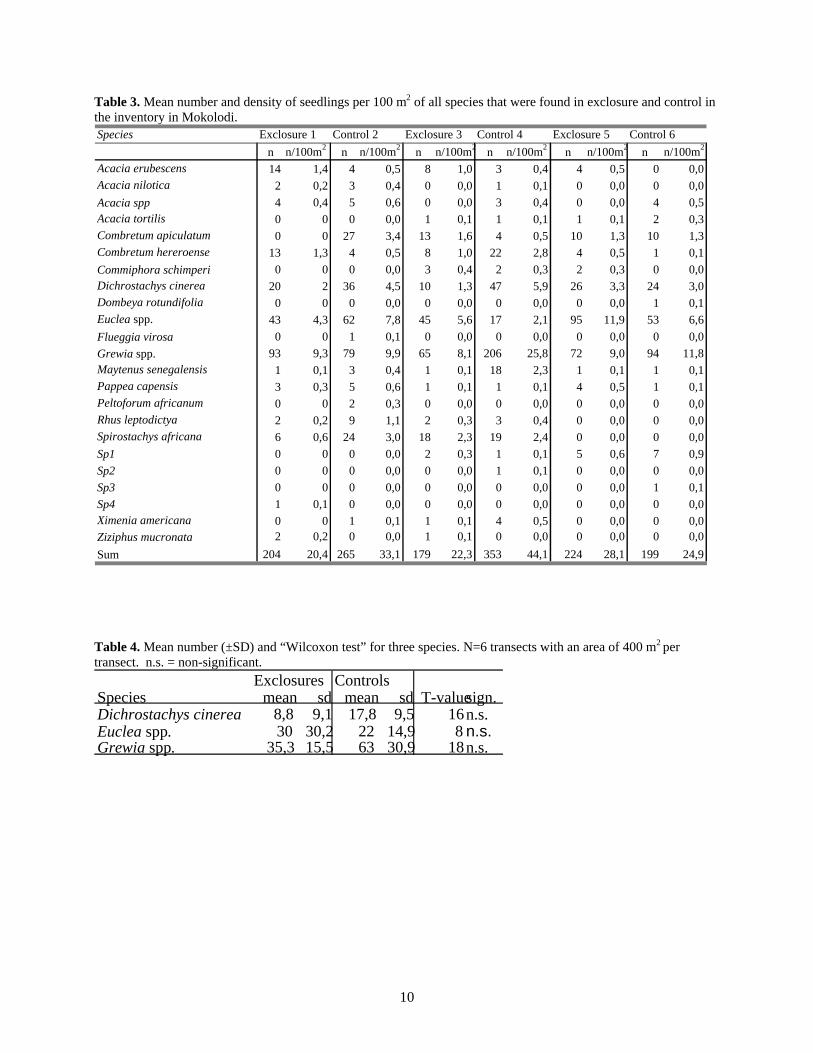
example, transect 1 in exclosure 1 was subtracted from transect 1 in the corresponding control and so on. Significance was identified at p<0.05. Results Species diversity and abundance Overall, seedlings from 22 woody species were found. Table 2 shows all the woody species that were recorded as seedlings or trees. Grewia spp. were noted as one group, and so were Acacia spp, except for A. nilotica, A. erubescens and A. tortilis, which could be identified as seedlings with certainty (Table 2). Euclea spp. was also noted as one group. A maximum of 353 seedlings were found in control main plot no. 4 (Table 3). This corresponds to 44.1 seedlings per 100 m2. Exclosure 3 had the lowest number of seedlings per 100 m2 (22.4). The number of woody seedlings was higher in the controls than in the exclosures (Fig. 1). To use the Wilcoxon test on the data, the plots were pooled into transects (2 in each plot). The extra transect in plot 1 was excluded from the data. The difference between total numbers of seedling in exclosure, with a mean of 92, 8 (SD=38, 3) seedlings per 100 m2, and controls, with a mean of 136, 2 (SE=46, 4) seedlings per 100 m2 , were statistically non-significant. This result was found for seedlings both from Yr 1 and Yr 2. However, the difference in numbers of seedlings between the treatments where largest in pair 2 (excl. 3 and contr. 4). Ninety-seven % more seedlings were found in the control, with grazing, than in the exclosure. Most of the recorded seedlings had been established in season 2 (year 2000); almost three times as many as had been established in season 1 (year 2001; Fig. 1 and Table 3). The most numerous species were, in descending order, Grewia spp., Euclea spp., Dichrostachys cinerea, Combretum apiculatum, Combretum hereroense, and Spirostachys africana (Table 3). Species that were found in all plots were: Combretum hereroense, D. cinerea, Euclea spp., Grewia spp, Maythenius senegalensis, and Pappea capensis. The latter two species had few observed seedlings in each site (Table 3). Four different types of the surveyed seedlings could not be identified. Those seedlings were given the names Sp1, 2, 3 and Sp4 (Table 3).
7
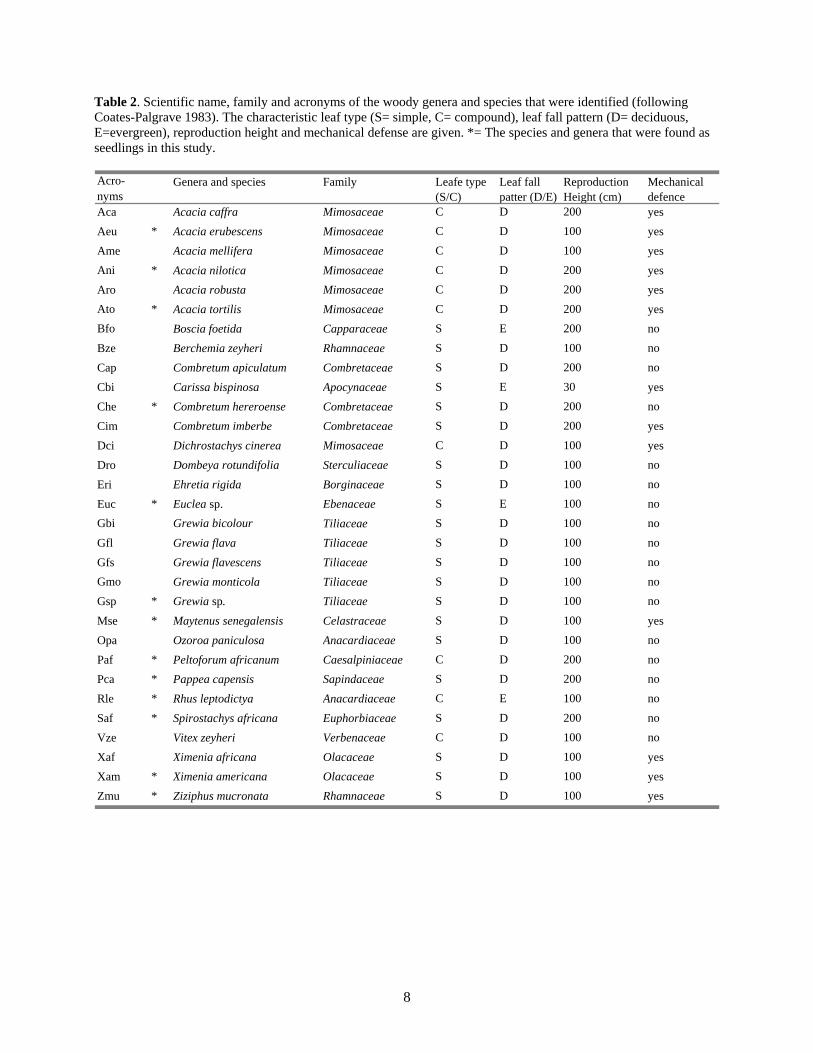
Table 2. Scientific name, family and acronyms of the woody genera and species that were identified (following Coates-Palgrave 1983). The characteristic leaf type (S= simple, C= compound), leaf fall pattern (D= deciduous, E=evergreen), reproduction height and mechanical defense are given. *= The species and genera that were found as seedlings in this study.
Genera and species Acro- Leaf fall Reproduction Mechanical Family Leafe type nyms
Aca Acacia caffra Mimosaceae C Dpatter (D/E)
200 Height (cm)
yesdefence
* 100 Acacia erubescens C DMimosaceae yesAeu100 Ame Acacia mellifera C DMimosaceae yes
Ani * 200 C DAcacia nilotica Mimosaceae yes200 C DAcacia robusta MimosaceaeAro yes
Ato * 200 C DAcacia tortilis Mimosaceae yesBfo 200 S E noBoscia foetida Capparaceae
100 Berchemia zeyheri S D noRhamnaceaeBze200 noS DCombretum apiculatum CombretaceaeCap30 Carissa bispinosa S EApocynaceae yesCbi
* 200 Combretum hereroense S D noCombretaceaeChe200 Cim S DCombretum imberbe Combretaceae yes100 Dichrostachys cinerea C DMimosaceae yesDci100 Dombeya rotundifolia S D noSterculiaceaeDro100 S D noEhretia rigida BorginaceaeEri
* 100 S E noEuclea sp. EbenaceaeEucGbi Grewia bicolour 100 S D noTiliaceae
100 noS DGrewia flava TiliaceaeGfl100 Gfs Grewia flavescens S D noTiliaceae
Gmo 100 Grewia monticola S D noTiliaceae* 100 Gsp Grewia sp. S D noTiliaceae* 100 Maytenus senegalensis S DCelastraceaeMse yes
100 Ozoroa paniculosa S D noAnacardiaceaeOpa* 200 Peltoforum africanum C D noCaesalpiniaceaePaf* 200 Pappea capensis S D noSapindaceaePca* 100 Rhus leptodictya noC EAnacardiaceaeRle* 200 S D noSpirostachys africana EuphorbiaceaeSaf
100 noC DVitex zeyheri VerbenaceaeVze100 S DXimenia africana OlacaceaeXaf yes
* 100 Xam Ximenia americana S DOlacaceae yes* 100 Ziziphus mucronata S DRhamnaceae yesZmu
(S/C)
8

0
20
40
60
80
100
120
140
160N
o. o
f see
dlin
gs
Excl YR1 Contr YR1 Excl YR2 Contr YR2
Figure 1. Mean number (+SE) of seedlings in control and exclosures and from 2001 (Yr 1) and 2000 (Yr 2). When tested for the common species, there were no significant differences between the treatments (Table 4). However, the overall pattern indicated more seedlings of Grewia spp., in the controls (63 seedlings) than in the exclosures (35.3 seedlings; Fig. 2 & Table 4). The largest difference was found between control and exclosure in pair 2, where seedling numbers in control 4 (25.5 seedlings per 100 m2) were more than three times as many as those found in exclosure 3.
9
10
Table 3. Mean number and density of seedlings per 100 m2 of all species that were found in exclosure and control in the inventory in Mokolodi.
Table 4. Mean number (±SD) and “Wilcoxon test” for three species. N=6 transects with an area of 400 m2 per transect. n.s. = non-significant.
Speciesn n/100m 2 n n/100m2 n n/100m2 n n/100m2 n n/100m 2 n n/100m2
Acacia erubescens 14 1,4 4 0,5 8 1,0 3 0,4 4 0,5 0 0,0Acacia nilotica 2 0,2 3 0,4 0 0,0 1 0,1 0 0,0 0 0,0Acacia spp 4 0,4 5 0,6 0 0,0 3 0,4 0 0,0 4 0,5Acacia tortilis 0 0 0 0,0 1 0,1 1 0,1 1 0,1 2 0,3Combretum apiculatum 0 0 27 3,4 13 1,6 4 0,5 10 1,3 10 1,3Combretum hereroense 13 1,3 4 0,5 8 1,0 22 2,8 4 0,5 1 0,1Commiphora schimperi 0 0 0 0,0 3 0,4 2 0,3 2 0,3 0 0,0Dichrostachys cinerea 20 2 36 4,5 10 1,3 47 5,9 26 3,3 24 3,0Dombeya rotundifolia 0 0 0 0,0 0 0,0 0 0,0 0 0,0 1 0,1Euclea spp. 43 4,3 62 7,8 45 5,6 17 2,1 95 11,9 53 6,6Flueggia virosa 0 0 1 0,1 0 0,0 0 0,0 0 0,0 0 0,0Grewia spp. 93 9,3 79 9,9 65 8,1 206 25,8 72 9,0 94 11,8Maytenus senegalensis 1 0,1 3 0,4 1 0,1 18 2,3 1 0,1 1 0,1Pappea capensis 3 0,3 5 0,6 1 0,1 1 0,1 4 0,5 1 0,1Peltoforum africanum 0 0 2 0,3 0 0,0 0 0,0 0 0,0 0 0,0Rhus leptodictya 2 0,2 9 1,1 2 0,3 3 0,4 0 0,0 0 0,0Spirostachys africana 6 0,6 24 3,0 18 2,3 19 2,4 0 0,0 0 0,0Sp1 0 0 0 0,0 2 0,3 1 0,1 5 0,6 7 0,9Sp2 0 0 0 0,0 0 0,0 1 0,1 0 0,0 0 0,0Sp3 0 0 0 0,0 0 0,0 0 0,0 0 0,0 1 0,1Sp4 1 0,1 0 0,0 0 0,0 0 0,0 0 0,0 0 0,0Ximenia americana 0 0 1 0,1 1 0,1 4 0,5 0 0,0 0 0,0Ziziphus mucronata 2 0,2 0 0,0 1 0,1 0 0,0 0 0,0 0 0,0Sum 204 20,4 265 33,1 179 22,3 353 44,1 224 28,1 199 24,9
Exclosure 5 Control 6Exclosure 1 Control 2 Exclosure 3 Control 4
Exclosures ControlsSpecies mean sd mean sd T-valuesign.Dichrostachys cinerea 8,8 9,1 17,8 9,5 16n.s.Euclea spp. 30 30,2 22 14,9 8 n.s.Grewia spp. 35,3 15,5 63 30,9 18n.s.

0
10
20
30
40
50
60
70
80
90
100N
o. o
f see
dlin
gs
Excl YR1 Contr YR1 Excl YR2 Contr YR2
Figure 2. Mean number (+SE) of Grewia spp. Seedlings in exclosures and controls and seedlings established in 2001 (Yr 1) and in 2000 (Yr 2). Seedlings length distribution The seedlings showed a tendency to be on average longer in exclosures than in controls (0.13 m, SE = 1.9 versus 0.11 m, SE = 1.1) in controls. The difference in length between the treatments was tested with Wilcoxon and the difference was non-significant for seedlings established both in 2001 (Yr 1) and in 2000 (Yr 2). The smallest seedlings were about 0.01 m and the longest 1.35 m. The dominating length class in all plots was 0.01 – 0.10 m. Between 80 % and 95 % of the seedlings were shorter than 0.2 m. The number of seedlings appears to decrease exponentially as seedling length increases. This was true in both controls and exclosures (Fig. 3a & 3b), although there are few individuals in the shortest class for Yr 2 seedlings.
0
0,5
1
1,5
2
2,5
3
3,5
4
4,5
1-5 5-10 10-15 15-20 20-30 30-40 40-50 50-60 60+
Num
ber o
f see
dlin
gs/1
00 m
2
Excl Yr 1
Contr Yr 1
Figure 3a. Mean number of individuals per 100 m2 established in 2001 (Yr 1) and categorized by length (cm) in the exclosures and the controls.
11

0
2
4
6
8
10
12
14
1-5 5-10 10-15 15-20 20-30 30-40 40-50 50-60 60+
Num
ber o
f see
dlin
gs/1
00 m
2
Excl Yr 2
Contr Yr 2
Figure 3b. Mean number of individuals per 100 m2 established in 2000 (Yr 2) and categorized by length (cm) in the exclosures and the controls. Results from the Wilcoxon test show that the difference in seedling length between exclosure and control was non-significant for Dichrostachys cinerea, Euclea spp. and Grewia spp. The largest difference in length between the treatments was shown for D. cinerea seedlings, that tended to be longer in the exclosures than in the controls (Table 5). Table 5. Mean (±SE) number of seedling length (cm) and number of leaves for three species in exclosure and control.
Exclosure Control Exclosure ControlNumber of Number of
SE SE leaves leavesLength Length SESpecies SE35,9 24,5 6,7 Dichrostachys cinerea 13,9 4,2 34,0 24,3 18,815,6 3,9 6,8 13,4 6,2 14,0 3,1 14,0Euclea spp.
1,3 2,3 Grewia spp. 7,9 7,5 0,5 7,8 1,3 8,3
Number of leaves Seedlings from Yr2 in exclosures showed a tendency to have a higher number of leaves (13.8) than those in controls (12.4) (Fig. 4), but the difference was small and non-significant according to the Wilcoxon test. The seedlings were classified according to the number of leaves they had. Intervals of 5 were used in this case. 1 – 5 leaves was most common among the seedlings that were established in season 1. Correspondingly, 5 – 10 was the most common number of leaves among seedlings from season 2.
12

02468
101214161820
No.
of le
aves
per
see
dlin
g
Excl Yr 1 Contr Yr 1 Excl Yr 2 Contr Yr 2
Figure 4. Mean number and SE of leaves per seedling in exclosure and control for seedlings established in 2001 (Yr 1) and 2000 (Yr2). In terms of number of leaves per seedling, there was no significant difference between exclosure and control, although values for Dichrostachys cinerea indicated higher values in the exclosure (Table 5). Herbivory Slightly higher number of seedlings showed sign of invertebrate herbivory in the exclosure, compared with the control (Fig. 5a-b). The differences between the treatments were not significant. In all investigated sites, invertebrates had typically eaten 1 % to 5 % of a seedling´s leaf area. Invertebrate herbivory exceeding 15 % was uncommon.
0
10
20
30
40
50
60
70
% o
f see
dlin
gs w
ith h
erbi
vory
Excl YR1 Control YR1
Figure 5a. Percentage of seedlings from 2001 (Yr 1) with invertebrate herbivory in the exclosures and the controls.
13

0102030405060708090
% o
f see
dlin
gs w
ith h
erbi
vory
Excl YR2 Control YR2
Figure 5b. Percentage of seedlings from 2002 (Yr 2) with invertebrate herbivory in the exclosures and the controls. The results from this study indicate that seedlings established in 2001 had more damage caused by invertebrates than the seedlings from year 2000. On average about 2 % more leaf area (%) of Grewia spp. seedlings (Yr 1) was consumed by invertebrates in exclosures (4,83 %) than in controls (2,71%). Seedlings of Euclea spp. (Yr1) showed a similar pattern, were the mean % of leaf area consumed was about 3 % higher in the exclosures (7,33%) than in the controls (4,29 %). Invertebrates damaged yr 2 seedlings of Grewia spp, were roughly equally abundant in both treatment classes (Table 6). However, the exclosure yr 1 seedlings were more often damaged (70 %) than the control yr 1 seedlings (48 %). Table 6. Number of seedlings (%) with invertebrate herbivory and mean leaf area (%) attacked for five tree species established in 2001 (Yr 1) and established in 2000 (Yr 2), in exclosures and controls.
Exclosure Control Exclosure ControlYr 1 Yr 1 Yr 2 Yr 2
Species % seedl.% area % seedl.% area% seedl.% area% seedl.% areaC. apiculatum 71,0 1,37 90,0 1,60 56,0 2,40 81,0 2,96 D. cinerea 54,0 2,83 53,0 6,63 70,0 3,44 90,0 4,04 Euclea spp. 62,0 7,33 46,0 4,29 92,0 6,39 90,0 7,09 Grewia spp. 70,0 4,83 48,0 2,71 82,0 3,87 80,0 3,53 S. africana 0,0 0,00 67,0 6,00 39,0 1,21 50,0 1,14
Only 16 seedlings had new bites from large herbivores or rodents and 15 seedlings had old bites in the control plots in this study. Most of the bitten seedlings were 2 seasons old. Dichrostachys cinerea was one of the species that had most seedlings with both new and old bites in the controls. In the exclosures, only 6 seedlings had new bites from rodents, and those seedlings were established in year 2000 and five of them were Euclea spp. No seedlings of Grewia spp. in the plots were attacked by rodents or by large herbivores.
14

Seedling distribution in relation to herb/litter cover Generally herbs and standing litter covered approximately 50 – 60 % of the area (0.8 m2) closest to the seedlings. Most of the litter cover consisted of dry grass and herbs. Cover of live vegetation (green forbs and grasses) was low. The mean percentage ground cover, total and live, and vegetation height was tested, with the Wilcoxon test to reveal possible differences between exclosures and controls (Table 7). There was significantly higher total ground cover around the seedlings in the exclosure than in the control (p< 0.05). A comparison with seedlings length and vegetation cover indicates that seedlings (from 2000) that were longer than 40 cm were most often found in a cover of more than 40 % (Fig. 6b). Generally the seedlings had up to 30 % of green vegetation in their surroundings (0.8 m2), and up to 10 % of live herbs and grasses were most common. There was no significant difference in mean percentage of live plants between exclosure and control. Plants tended to be higher in the exclosures than in the controls but the difference was not significant. In general the height of the surrounding vegetation around the seedlings was about 11 to 20 cm. This was typical both for seedlings established year 2000 and year 2001. Table 7. Results of Wilcoxon test for differences in mean (±SE) cover of herbs and standing litter, total and live, and plant height, between exclosure and controls for all seedlings. n.s.= not significant and * = p<0.05
Mean SE Mean SE T-value Sign.Total cover (%) 71,2 8,0 61,2 8,0 0 *Live cover (%) 14,2 2,4 14,2 3,2 10 n.s.Height (cm) 21,8 3,7 18,1 3,1 4 n.s.
Exclosure Control
Seedling length versus plant cover. YR1
0
5
10
15
20
25
30
35
40
45
50
0 20 40 60 80 10Cover %
See
dlin
g le
ngth
(cm
)
0
Exclosure Control
Figure 6a. Seedling length versus total plant cover of surrounding vegetation (0.5 m2) for seedlings that were established in 2001 (Yr 1), in exclosure and control.
15

Seedling length versus plant cover. YR2
0
10
20
30
40
50
60
70
80
90
0 20 40 60 80 1Cover %
See
dlin
g le
ngth
(cm
)
00
Exclosure Control
Figure 6b. Seedlings length versus total plant cover of surrounding vegetation (0.5 m2) for seedlings that were established in 2002 (Yr 2), in exclosure and control. The mean percentage ground cover around seedlings was higher in the exclosure than in the controls for Dichrostachys cinerea, Euclea spp. and Grewia spp. (Table 8). Grewia spp. seedlings showed significant difference in total cover of field layer vegetation between exclosure and control. D. cinerea was the species that had the lowest percentage cover of field layer vegetation in both treatments and Euclea spp. had the highest ground cover. Table 8. Results of Wilcoxon test for differences in mean (±SE) cover of herbs and standing litter measured as percentage cover of a circular plot of 0.5 m2 with the seedling in the center. Mean total cover, SE, maximum and minimum cover in exclosures and controls for three species are also shown. n.s.= not significant and * = p<0.05 Exclosure Control Species Cover % SE Max MinCover % SE Max Min T-value Sign. Dichrostachys cinerea 62,0 13,5 95 60 47,6 7,6 80 25 1 n.s Euclea spp. 76,4 11,0 100 50 72,7 6,9 100 20 10 n.s Grewia spp. 74,7 4,7 100 60 60,0 8,8 95 25 0 *
Dichrostachys cinerea, had the largest difference in height of field layer vegetationbetween the treatments with a mean height in the exclosure of 24.1 cm (SE=9.9) and 17.2 cm (SE=1.6) in the controls. Number of seedlings that were growing under trees or bushes was higher in the controls than in the exclosure, but the difference in percentage of seedlings with and without tree/shrub cover was small for all species (Table 9). On average the percentage of seedlings with canopy cover was 85 % (in exclosures) and 90 % (in controls). Dichrostachys cinerea was the only species with higher percentage of seedlings growing with canopy cover in exclosure, 77 %, than in the control, 65%. These seedlings seemed relatively successful in habitats without tree canopy cover compared to other species.
16

Table 9. Mean number and percentage (%) of seedlings with tree cover in exclosure and control. All seedlings and individuals of common species are presented in the table. Exclosure Control %%Species Number Number 170,7 85 244,0 90All seedlings Combretum apiculatum 6,3 83 12,3 90 Dichrostachys cinerea 14,3 77 23,3 65
Euclea spp. 52,0 85 41,7 95 Grewia spp. 68,7 90 120,7 96 Spirostachys africana 2,7 33 11,0 77
Seedlings survival and development (after a 3 week period) We measured each seedling two times with approximately 3 weeks interval. The weather was rainy during this period. Very few seedlings had died between the two measurements. The highest numbers of seedlings that died was in a control (only 3 individuals had died). Few seedlings had increased in length during the three weeks between the measurements. The difference between exclosure and control in length increase was small. The planting experiment
Mortality In general, 18 seedlings of Combretum apiculatum were planted in each plot. After about three weeks the plants were observed again. Ca 80 % of the planted seedlings had then died (Fig. 7). The difference between number of surviving seedlings in exclosure and control was small. The total number of surviving seedlings planted in all the exclosure plots was 14 and 13 in the control plots. However, approximately 4 seedlings per plot in both treatments had survived.
Number of planted seedlings (I) and survived seedlings (II).
02468
101214161820
Num
ber o
f see
dlin
gs
Excl I Contr I Excl II Contr II
Figure 7 Numbers of Combretum apiculatum seedlings that were planted (I) and survived seedlings (II) in exclosure and controls.
17

Invertebrate herbivory Very few of the seedlings in the planting experiment showed signs of invertebrate herbivory. From none to 1 % of the planted seedlings in the plots had traces from invertebrate herbivory. Seedlings that were attacked by insects had up to 5 % of the leaf area removed or mined.
Litter and herbs The seedlings of Combretum apiculatum were planted in a range with field layer vegetation cover from less than 10 % to more than 90 % in the plots (Table 10). Most of the seedlings that survived in the exclosures had more than 60 percent of field layer cover. In the controls surviving seedlings most frequently had a cover of 30 to 60 percent. Table 10. Number of planted and survived C. apiculatum seedlings related to total plant cover in their surroundings in exclosure and control. %= survival seedlings in percent.
Total plant cover Planted Survived Planted Survived0 - 30 % 2,0 0,0 5,0 0,7<30 - 60 % 4,0 0,3 8,0 2,3<60-100 % 12,0 4,3 6,0 1,3
Sum of individuals 18,0 4,7 19,0 4,3
Exclosure Control
Discussion Seedling diversity and density In total, 22 woody plant species were found as seedlings, but only three of these species (D. cinerea, Euclea spp., and Grewia spp,) had many individuals in all sites. The number of different seedling species did not differ significantly between exclosures and controls. However, higher numbers of several species seedlings were found in the controls than in the exclosures. There may be several explanations to this. For example: the plots were situated in three different areas (the vegetation in the areas are similar) so the possibilities for recruitment of different species may vary from one site to another. Spirostachys africana seedlings were only found in two of the areas. This just tells us that the studied savanna does not constitute a stable mixture of trees and grasses, but rather an inherently unstable mixture that persists due to disturbances (Scholes & Walker 1993). Another explanation is that there is a competition between forbs and grasses on one side and tree seedlings on the other. This possible explanation is supported by a higher cover of herbs and grasses in the excloures (see below). The seedling density found per area unit was unexpectedly high. A total of 353 seedlings were found in control 4, which had the highest number of individuals. This corresponds to 44.1 seedlings per 100 m2. In earlier studies, numbers of seedlings in arid savannas have generally been reported to be low (Kiyiapi 1994, Flyman 1999). In Flyman´s study, which was conducted in the same area as the present study (in plot 1 and 2), approximately 5.7 seedlings per 100 m2 were found (Käller 2003, Flyman 1999). There was a higher number of seedlings established in
18

year 2000 compared to year 2001, which was probably due to the wet rainy season 1999/2000. Several studies have found that a “minimum amount of rainfall” is required before and probably also after germination of seedlings in order for seedlings to establish and develop (Flyman 1999, Veenedaal 1996). Flyman (1999) observed that seedlings survived better in the control plots than in the exclosures. The same tendency was observed in this study. The greatest difference was found in plot pair 2, where the control plot contained 97% more seedlings than the exclosure did. This might be attributed to a reduced herb interference (see below). Seedling length and leaves Both the seedlings established in 2000 and 2001 tended to be slightly longer in the exclosures than in the controls, but the difference was not significant. However, the reduced length in the control could be an important survival factor for the seedlings, as shorter seedlings could be better protected from large herbivores by surrounding bushes and standing litter. The dominating lengths in all plots were 0.01 – 0.10 m and more than 80 % of the seedlings in the plots were shorter than 0.2 m. The relatively short seedlings could be because more resources have been allocated to the root system than to parts above ground. Enhanced initial root growth increases total moisture uptake capacity, which is important for early survival during dry periods (Gerhardt 1993). Dry forest seedlings have a higher root/shoot ratio than wet forest seedlings (Liberman & Li 1992). Height growth is a useful indicator of a young plant’s fitness because it measures seedlings response to competition for light (Fetcher et al. 1983). Most of the seedlings in this study had 1 to 10 leaves. The difference in numbers of leaves per seedling between the treatments was small. Seedlings in exclosures tended to have almost equal mean number of leaves (13.8) as seedlings in the controls (12.4). This indicates that leaf picking by large herbivores is not a common phenomenon on the seedlings. For long-term survival, the young plants have to grow substantially in the wet season. With the exception of Euclea spp. the woody plants drop their leaves in the winter. Besides other risks, summer droughts are common. Herbivory In all investigated plots, insects had eaten 1 % - 5 % of the leaf area of a typical seedling. Insect herbivory exceeding 15 % were uncommon on the seedling level. One reason for this might be that invertebrate herbivory may be episodic and associated with the prevailing environmental conditions (Flyman 1999). The mean % of Grewia spp. seedlings (Yr 2) leaf area that were consumed by invertebrates showed to be similar in both treatments. However, more individuals of Grewia spp. (Yr 2) had invertebrate herbivory in the exclosure than in the controls, but the difference was not statistically significant. If this trend reflects a pattern the reason could be a higher total vegetation cover around the seedlings in exclosures (see below), and a subsequent increased attractiveness for the herbivorous invertebrates. However, it seems that invertebrate leaf herbivory was not a threat for seedlings in this savanna at this time. Although large herbivores were expected to inflict considerable damage on woody plant seedlings in the controls, their impact was minimal. Only a few individuals had traces from browsing by large animals. The seedlings were probably not browsed because they were too small to be found by the herbivores, and browsing was reduced because the surrounding herb cover protected the
19

seedlings. Some large mammalian herbivores are known to ignore tree individuals within certain height categories (Belsky 1994). Rudinow-Saetnan (2000) found the exclosure sites were more attractive for rodents and other small mammals than the controls, and Flyman (1999) recorded that seedlings had a higher mortality caused by rodents in the exclosure than in the controls. In this study, rodents had attacked very few seedlings. Vegetation cover, height and tree canopy cover The mean vegetation cover around the seedlings was significantly higher in the non-grazed areas than in the grazed areas. However, in both control sites and exclosures, there were more seedlings where the vegetation cover was dense. Standing litter as well as herbs and woody species may protect the seedlings from desiccation and high temperatures, while at the same time reducing light availability (Käller 2003). The litter cover was composed of relatively much dry grass and herbs and not so much live vegetation (green herbs and grass). Optimal vegetation cover for the seedlings germination seems to be 50 to 70 % in the surroundings, although I have not been able to test this as I did not have random control plots. More than 70 % vegetation cover might be too shady and give too little light for the germination process. However, seedlings that are surrounded by a vegetation cover of less than 50 % may be more exposed to risks like drought and trampling by mammals. Woody seedlings and herbs may compete for the same resources (Belsky 1994, Scholes & Walker 1993, Stuart-Hill & Tainton, 1989), which in turn may affect seedling establishment in herb-covered areas. Stuart-Hill and Tainton (1989) showed that a healthy grass sward has a suppressive effect on woody plants. The mean percentage ground cover around seedlings was higher in the exclosure than in the controls for Dichrostachys cinerea, Euclea spp. and Grewia spp. Seedling density in a dry forest in Ghana was higher in well-shaded sites than in exposed, open sites (Lieberman and Li 1992). In my study, Grewia spp. was the only species that had significantly higher vegetation cover around the seedlings in non-grazed areas. Most of the seedlings in this study were found under a tree or a shrub, and higher numbers of seedlings with covering canopy was found in the controls than in the exclosure. This could be explained by a generally high cover of trees and shrubs or because trees have an obvious effect on the microclimate under the canopy by intercepting direct solar radiation (Veetas 1992). As the field layer cover was lesser in grazed areas, trees and/or shrubs may be more important for the seedlings there. The shady habitat under a shrub or in a field layer might be a favorable microhabitat for seedling germination and survival in dry savannas. Seedling density in a dry forest in Ghana was higher in well-shaded sites than in exposed open sites (Liberman and Li 1992). The high seedling density under trees in this study could depend on shade conditions, but it may also be a result of more seeds dispersed by birds resting or feeding in the trees. Käller (2003) concluded that seedlings grow relatively close to a potential mother plant and this could be explained by the way different species disperse their seeds. Grewia spp. and Euclea spp. both have edible fruits and may be spread by birds and mammals that eat them. The seeds may also fall directly on the ground underneath the mother plant. According to earlier studies in the same area, saplings and shrubs were more abundant than higher trees (Sjögren, 2000). Dichrostachys cinerea was the only species with higher percentage of seedlings growing with canopy cover in
20

exclosure than in the control, the seedlings were also relatively successful in habitats without tree canopy cover compared to other species. Survival and development after 3 weeks Very few seedlings (3 individuals) had died after 3 weeks time. This indicates that once the seedlings are established, they have pretty good chance to survive. However, there were three rainy, favorable weeks for the seedlings, so a low mortality is not surprising. During a year of drought or during the dry winter the mortality is probably much higher. Few seedlings had increased in length after the three weeks between the measurements. The difference between exclosure and control in increased length was small. Planted seedlings The results from the planting experiment showed a high loss of individuals. Most of the seedlings had died 3 weeks after planting. The difference in survival between seedlings in exclosure and control was small; the percentages of survivors were 26 % (exclosure) and 23 % (control). This confirms the vulnerability of the seedling stage in the regeneration dynamics of woody plants. During the plantation the soil was wet, it had been raining constantly for one week. Rainfall may be important for woody plant establishment in semi-arid savannas (Houle 1998). In the study of Flyman (1999) the planting experiment indicated similar results, where 92 % of the planted seedlings died in Mokolodi Nature Reserve. Very few of the seedlings in my planting experiment had invertebrate herbivory, so is unlikely that insect herbivory was the cause of the high mortality. It is more likely that drought caused the deaths. For a species to successfully reproduce sexually, its seedling must establish and quickly grow to drought-tolerant size within a short period of time between precipitation events (Flyman 1999). In this study the planted seedlings had similar size as the natural seedlings established in 2001 (Yr 1). In spite of good rains at time of establishment, I hypothesize that the high mortality was a lack of water during the three weeks period. Most of the seedlings that survived in the exclosures had more than 60 percent of cover by field layer vegetation. In the controls, surviving seedlings most frequently had a field layer cover of 30 to 60 percent. Results from planted seedlings indicated woody canopy cover to be a strong predictor of survival. Most of the surviving planted seedlings had tree or shrub canopy cover. Planted seedlings of both Acacia tortilis and Combretum apiculatum survived longer under high canopy cover than under little or no cover in the same study area (Flyman 1999). Seedlings of Acacia karro were also favoured by shade (O’Connor 1995). Lack of shade might be one of the reasons that the survival rate was low. Another reason may be root damage by small ants which were attracted to the fine “potting soil” used for raising the seedling. Flyman (1999) states that the potting soil, because of its fine texture, retain moisture better than the ambient soil, thus providing the ants with an ideal nesting ground and a readily available food resource in the form of seedling roots. Most likely, the planting process in itself could be a frequent failure, due to insufficient rest contact with the root, too high shoot/root ratio, or other causes.
21
Conclusion
•The number of seedlings found was roughly four times higher than observed in an earlier study in the same area, and differed depending on age.
•There was a higher number of seedlings established year 2000 compared to year 2001, and that could be explain by the rain-rich season 1999/2000.
•Most seedlings were found in a field layer with a moderate cover of live and dead vegetation and under trees and shrubs.
•The exclusion of large herbivores resulted in tendencies to:
•lower density of seedlings and the reason could be that the germination or establishment process is negatively affected by a denser herbaceous cover with no grazing. •higher frequncy of insect herbivory on Grewia spp, perhaps indicating that invertebrates prefer habitats with denser and taller field layer. •significantly higher percentage of total cover by field layer vegetation in the seedling surroundings which can be explained by a reduced trampling and grazing (most large herbivores in the area are grazers).
Acknowledgements First, I would like to express my warm gratitude to my supervisors Roger Bergström and Christina Skarpe for their support and patient during the process of finishing this report. I am grateful for your help in Botswana Christina. I would also like to thank the Mokolodi Nature Reserve for the opportunity to work in the reserve, and to all the people working in the reserve. A special thank to Anna Käller, my dear friend and co-worker in the savanna, I couldn’t have done this without you! Finally, I thank my family for their patient and support. I also thank my dear grandfather Hugo Sjörs for good advice on the report. Financial support was received by the Swedish International Development Agency (Sida) through the Committee of Tropical Ecology (ATE) at Uppsala University. References Archer, S. 1992. Woody plant enchroachment into southwestern grasslands and savannas: rates, patterns and proximate causes. In: Vavra, M., Laycock, W. and Pieper, R. (eds.), Ecological implications of livestock herbivory in the west.
Belsky, A. J. 1994. Influences of trees on savanna productivity: tests of shade, nutrients, and tree-grass competition Ecology 75: 922-932.
Bergström, R., Skarpe, C. & Danell, K. 2000. Plant responses and herbivory following simulated browsing and stem cutting of Combretum apiculatum. Journal of Vegetation Science 11: 409-414.
Bråten, A. L. 1997. Browsing by large herbivores in a hetergenous savanna landscape of Southern Africa. Candidatus Scentiarium thesis, Dept. Botany, Norweigan University of Science and Technology, NTNU Trondheim, Norway. 50 pp.
22

Bryant, J. P., Heitkonig, I., Kuropat, P. & Owen-Smith, N. 1991. Effects of severe defoliation on the long term resistance to insect attack and on leaf chemistry in six woody species of the southern African savanna. American Naturalist 137: 50-63.
Coates-Palgrave, K. 1983. Trees of Southern Africa, 2nd edn. Struik Publishers, Cape Town.
Crawley, M. 1983. Herbivory: the dynamics of animal-plant interactions. Studies in Ecology. 10. University of California Press.
De Wit, P.V. & Nachtergaele, F.O. 1990. National soil map of Botswana. Food and Agricultural Organization of the United Nations, United Nations Development Program, Governmn of Botswana.
Dublin, H.T. 1995. Vegeteation dynamics in the Serengeti-Mara ecosystem: the role of elephants, fire and other factors. -In: Sinclair, A. R. E. and Arcese, P. (eds), Serengeti II: dynamics, manegement and conservation of an ecosystem, pp. 71-90. University of Chicago Press.
Fetcher, N., Strain, B.R. and Oberbauer, S.F. 1983. Effects of light regime on the growth, leaf morphology, and water relations of seedlings of two species of tropical trees. Oecologia 58: 314–319.
Flyman, M. V. 1999. The fate of woody plant seedlings in the presence and absence of large herbivores in a semi-arid savanna. Master of Philosophy Thesis, University of Botswana.
Gerhardt, K. 1993. Tree seedling development in tropical dry abandoned pasture and in secondary forest, Costa Rica. Journal of Vegetation Science 4: 95-102
Hoffman, W.A. 1996. The effects of fire and cover on seedling establishment in a neotropical savanna. Journal of Ecology 84:383-393.
Hunter, A.F. & Aarssen, L.W. 1998. Plants helping plants. Bioscience 38: 34-40.
Käller, A. 2003. Growth pattern and reproduction of woody vegetation in a semi-arid savanna in southern Botswana. Committee of Tropical Ecology, Minor Field Study 86.
Kiyiapi, J. L. 1994. Structure and characteristics of Acacia tortilis woodland on the Njemps Flats. Advances in GeoEcology, 27: 47-69.
Linzey, A. V. & Kesner, M. H. 1997. Small mammals of a woodland-savanna ecosystem in Zimbabwe. I. Density and habitat occupancy patterns. . Journal of the Zoological Society of London 243: 137-152.
Prins, H. H. H. & van der Jeugd, H. P. 1993. Herbivore population crashes and woodland structure in East Africa. Journal of Ecology 81: 305-314
Rudinow-Saetnan, E. 2000. Small mammals in grazed and un-grazed savanna of southeastern Botswana. Cand. Scient. thesis, Norwegian University of Science and technology, Trondheim
Scholes, R.J and Walker, B.H 1993. An African savanna: Synthesis of the Nysvley Study. Cambridge University Press, Cambridge, UK.
Sinclair, A.R.E. 1995. Equilibria in plant-herbivore interactions. In: Sinclair, A.R.E. and Arcese, P. (eds), Serengeti II: dynamics, manegement and conservation of an ecosystem. University of Chicago Press.
23

Sjögren, H. 2000. Composition and structure of woody vegetation in a semi-arid savanna with particular reference to browsing. Thesis in zoological ecology, The Swedish University of Agricultural Sciences, Umeå.
Skarpe, C. 1990. Shrub layer dynamics under different herbivore densities in an arid savannah, Botswana. Journal of Applied Ecology 27: 873-885.
Skarpe, C. 1992. Dynamics of savanna ecosystems. Journal of Vegetation Science 3: 293-300.
Skarpe, C., Bergström, R., Bråten, A. L. & Danell, K. 2000. Browsing in a heterogeneous savanna. Ecography 23: 632-640.
Smit, N. 1999. Guide to Acacias of South Africa. Briza Publications.
Stuart-Hill, G.C. & Tainton, N.M. 1989. The competitive interaction between Acacia karoo and the herbaceous layer and how this is influenced by defoliation. Journal of Applied Ecology 26: 285-298.
Tolsma, D.J., Ernst, W.H., & Verway, R.A. 1987. Nutrients in soil and vegetation around two artificial water points in eastern Botswana. Journal of Applied Ecology 24: 991-100.
van der Valk, A. G. 1992. Establishment, colonization and persistence. In: Glenn Lewin, D.C., Peet, R.K. & Veblen, T.T. (eds.), Plant succession: theory and prediction. Chapman and Hall, London.
Veenendaal, E.M., Ernst, W.H.O. & Modise, G.S. 1996. Effects of seasonal rainfall pattern on seedling emergence and establishment of grasses in a savanna in south-eastern Botswana. Journal of Arid Environments 32: 305-317.
Walker, B.H. & Noy-Meir, I. 1982. Aspects of stability and resilienci of savanna ecosystems. In: Huntley, B.J. & Walker, B.H. (eds.), Ecology of tropical savannas, pp 577-590. Springer Verlag, Berlin.
24