Embed Size (px)
Citation preview

Aus der Poliklinik für Kieferorthopädie
der Ludwig-Maximilians-Universität München
Direktorin: Prof. Dr. Andrea Wichelhaus
Establishment and application of an in vitro method to
investigate the intercellular communication between cells
involved in orthodontic tooth movement
Dissertation
zum Erwerb des Doktorgrades der Zahnmedizin
an der Medizinischen Fakultät der
Ludwig-Maximilians-Universität zu München
vorgelegt von
Jianwei Shi
aus
Shenyang, China
2018

II
Mit Genehmigung der Medizinischen Fakultät �
der Universität München
Berichterstatterin: Prof. Dr. med. dent. Andrea Wichelhaus
Mitberichterstatter: Prof. Dr. Matthias Folwaczny PD Dr. Jan-Frederik Güth
Mitbetreuung durch den promovierten Mitarbeiter:
Dr. rer. nat. Uwe Baumert, Diplom-Biologe
Dekan: Prof. Dr. med. dent. Reinhard Hickel
Tag der mündlichen Prüfung: 15. 05. 2018

III
Contents
1 Introduction ............................................................................................................................ 1 2 Literature Review ................................................................................................................... 2
2.1 Orthodontic tooth movement ..................................................................................... 2 2.2 Periodontal tissues involved in orthodontic tooth movement .................................... 3
2.2.1 Periodontal ligament fibroblasts .................................................................... 3 2.2.2 Osteoblasts ..................................................................................................... 4
2.3 Factors involved in orthodontic tooth movement ....................................................... 4 2.3.1 Prostaglandin-endoperoxide synthase 2 (PTGS2) and
Prostaglandin E2 (PGE2) .................................................................................. 5 2.3.2 Interleukin 6 (IL6) ........................................................................................... 6 2.3.3 Runt-related transcription factor 2 (RUNX2) .................................................. 6 2.3.4 Purinergic receptor/ion channel P2RX7 ......................................................... 6 2.3.5 Tumor Necrosis Factor (TNF) .......................................................................... 7
2.4 Experimental designs to simulate orthodontic tooth movement in vitro ................... 7 2.4.1 Influence of mechanical force ........................................................................ 8 2.4.2 In vitro culture systems .................................................................................. 9
3 Aim of the study ................................................................................................................... 12 4 Materials and Methods ........................................................................................................ 13
4.1 Materials .................................................................................................................... 13 4.1.1 Chemicals ..................................................................................................... 13 4.1.1 Apparatus ..................................................................................................... 14 4.1.2 Consumables ................................................................................................ 15
4.2 Cell culture ................................................................................................................. 17 4.2.1 Cells used ..................................................................................................... 17 4.2.2 Mycoplasma assay........................................................................................ 18 4.2.3 Cell counting ................................................................................................. 19
4.3 Force application ....................................................................................................... 19 4.3.1 Pretesting temperature stability and apoptosis induction ........................... 19 4.3.2 Seeding of mono-culture setup .................................................................... 24
4.4 Gene expression analysis ........................................................................................... 27 4.4.1 RNA Purification ........................................................................................... 27 4.4.2 Quality and quantification of total RNA ....................................................... 28 4.4.3 Complementary DNA (cDNA) synthesis ....................................................... 28 4.4.4 PCR primer design ........................................................................................ 29 4.4.5 Quantitative real-time reverse transcriptase polymerase chain
reaction (RT-PCR) ......................................................................................... 30 4.5 Analysis of cell culture supernatants using enzyme-linked immunosorbent
assays ......................................................................................................................... 34 4.5.1 Measurement of IL6 protein concentration ................................................. 34 4.5.2 Measurement of TNF protein levels ............................................................. 36 4.5.3 Measurement of PGE2 levels ........................................................................ 36
4.6 Statistical analysis ...................................................................................................... 37

IV
5 Results.................................................................................................................................385.1 Validationoftheinvitromodelforcompressiveforceapplication..........................385.2 “Directsampling”......................................................................................................40
5.2.1 Geneexpressioninmono-culturedcellsafterlowmechanicalforceapplication..........................................................................................40
5.2.2 Geneexpressioninmono-culturedcellsafterhighermechanicalforceapplication..........................................................................................43
5.2.3 Geneexpressioninco-culturedcellsafterlowermechanicalforceapplication...................................................................................................45
5.2.4 EffectsofcompressiveforceonPGE2,IL6andTNFproductionaftermechanicalforceapplication..............................................................47
5.2.5 Comparisonoftheforceinducedchangesingeneandproteinexpressionaccordingtocultureconditions.................................................49
5.3 “Pulsechasesampling”.............................................................................................515.3.1 Lowercompressiveforceonmono-culturedcells.......................................515.3.2 Highercompressiveforceonmono-culturedcells......................................535.3.3 Lowercompressiveforceonco-culturedcells.............................................56
6 Discussion............................................................................................................................596.1 Technicalaspectsoftheexperimentaldesign..........................................................59
6.1.1 Forceapplication.........................................................................................596.1.2 Cellviability.................................................................................................606.1.3 Invitroco-culture........................................................................................626.1.4 Samplingprocedure.....................................................................................63
6.2 Expressionofgenesandmetabolites.......................................................................646.2.1 TNF,IL6,PTGS2andPGE2.............................................................................656.2.2 Runt-relatedtranscriptionfactor2(RUNX2)...............................................666.2.3 PurinergicreceptorP2RX7...........................................................................67
6.3 Outlook.....................................................................................................................687 Conclusion...........................................................................................................................698 Summary.............................................................................................................................709 Zusammenfassung...............................................................................................................7110 References...........................................................................................................................7211 Appendix-Exampleofbioinformaticsprimertesting.........................................................7912 Acknowledgement...............................................................................................................85

V
Abbreviations used µm Micrometer ANOVA Analyses of variance ATP Adenosine triphosphate B2M Beta-2-microglobulin BMP Bone morphogenetic protein cDNA complementary DNA cm2 Square centimeter CO2 Carbon dioxide DMEM Dulbecco’s Modified Eagle Medium DMSO Dimethylsulfoxid DNA Desoxyribonucleic acid DTT Dithiotreitol EDTA Ethylenediaminetetraacetic acid ELISA Enzyme-Linked Immunosorbent Assay FBS Fetal bovine serum g Constant of gravity; 9.81 m/s2 g/cm2 Gram per square centimeter GCF Gingival crevicular fluid h Hour hOB human osteoblasts hPDLF human periodontal ligament fibroblasts IL1$ Interleukin 1D IL1% Interleukin 1E IL6 Interleukin 6 LCD liquid-crystal display MEM Minimum Essential Medium Mg Magnesium min Minute mL Milliliter mm Millimeter mM Millimolar mm2 Square millimeter Na Sodium OPG Osteoprotegerin OTM Orthodontic tooth movement P2RX7 Purinergic receptor P2RX7 PCR Polymerase chain reaction PDL Periodontal ligament PGE2 Prostaglandin E2 PTGS2 Prostaglandin-endoperoxide synthase 2 (= cyclooxygenase 2) RANKL Receptor activator of NF-kappaB ligand

VI
RNA Ribonucleic acid rpm Revolution per minute RT-PCR Reverse transcriptase polymerase chain reaction RUNX2 Runt-related transcription factor 2 SD Standard deviation SaOS-2 Osteosarcoma cell line TNF Tumor necrosis factor TRAF TNFR-associated factor U/µl Units per Microliter μL Microliter

1
1 Introduction
Orthodontic tooth movement (OTM) is accomplished by application of external forces
on a tooth or a group of teeth and is accompanied by extensive bone remodeling: bone
resorption on the compression side and bone formation on the tension side of force
application (Kim et al. 2006; Liu et al. 2009; Long et al. 2001; Mayahara et al. 2012).
Three main cell types, osteoblasts, osteoclasts and periodontal ligament
fibroblasts, are involved in this remodeling process. In orthodontic therapy,
mechanical forces are loaded onto teeth. These forces are transmitted primarily to
periodontal ligament fibroblasts (PDLF). The PDLF response to this force and interact
with other cell types within the periodontal tissue to regulate the remodeling of the
bone matrix (Kanzaki et al. 2002; Lekic and McCulloch 1996). Without PDLF tooth
cannot be moved in the alveolar bone under orthodontic mechanical force (Mitchell
and West 1975). Osteoblasts are responsible for bone matrix formation relevant to
bone differentiation and resorption (Garlet et al. 2007; Grimm et al. 2015).
Numerous studies evidenced that cytokines play pivotal roles in bone
remodeling and bone homeostasis (Jacobs et al. 2014; Kanzaki et al. 2002; Mah et al.
2014). Specifically, either physical or chemical factors stimulate periodontal tissue
cells to produce cytokines and growth factors which then regulate the micro
environment surrounding the tooth (Li et al. 2013a; Ren and Vissink 2008).

2
2 Literature Review
2.1 Orthodontic tooth movement
Orthodontic tooth movement (OTM) is achieved by sequential bone remodeling
(Figure 1): bone resorption on the compressive side and bone formation on the tension
side during orthodontic therapy (Wang et al. 2012). Periodontal tissues including
periodontal ligament, gingival tissues and alveolar bone are involved in this process.
Inflammatory response in the periodontal tissue occurs upon mechanical force
stimulation. The inflammatory reaction varies depending on the force magnitudes and
force types (Koyama et al. 2008), and it finally regulates bone reconstruction (Koyama
et al. 2008; Krishnan and Davidovitch 2006).
Figure 1. Bone remodeling during orthodontic force application: (A) orthodontic force is loaded on a tooth. (B) Osteoblasts accumulate on the tension side and osteoclasts on the compression side. (C) Bone remodeling occurs by a sequential bone resorption on the compressive side and bone formation on the tensile side (redrawn and modified after Kitaura et al. 2014).
According to Krishnan and Davidovitch (2006, p. 469.e17), OTM includes the
following sequence of events:
1. “Movement of PDL fluids from areas of compression into areas of tension. 2. A gradual development of strain in cells and ECM in involved paradental tissues. 3. Direct transduction of mechanical forces to the nucleus of strained cells through
the cytoskeleton, leading to activation of specific genes.
3
4. Release of neuropeptides (nociceptive and vasoactive) from paradental afferent nerve endings.
5. Interaction of vasoactive neuropeptides with endothelial cells in strained paradental tissues.
6. Adhesion of circulating leukocyte to activated endothelial cells. 7. Plasma extravasation from dilated blood vessels. 8. Migration by diapedesis of leukocytes into the extravascular space. 9. Synthesis and release of signal molecules (cytokines, growth factors, and CSFs)
by the leukocytes that have migrated into the strained paradental tissues. 10. Interaction of various types of paradental cells with the signal molecules released
by the migratory leukocytes. 11. Activation of the cells to participate in the modeling and remodeling of the
paradental tissues.”
2.2 Periodontal tissues involved in orthodontic tooth movement
2.2.1 Periodontal ligament fibroblasts
In periodontal tissue, the periodontal ligament (PDL), a connective ligament tissue, is
located between cementum and alveolar bone. It can be regarded as a specialized
connector joining tooth and bone (Berkovitz 1990; Li et al. 2013b; Sodek and
Limeback 1979). To maintain integrity and stability of tooth, PDL distributes and
buffers force loaded by masticatory or external forces (Lekic and McCulloch 1996).
Orthodontic tooth movement relies on biological reactions in the PDL and
alveolar bone to mechanical force. Without PDL, tooth cannot be moved during
orthodontic therapy (Mitchell and West 1975), a situation found in “ankylosed teeth”
for example. These are teeth that are fused with the alveolar bone due to missing PDL.
The first step in tooth movement is the transduction of orthodontic forces
applied to the tooth. Due to its anatomical location situated between teeth and alveolar
bone, PDL acts like a transmitter of external forces from the teeth to the surrounding
tissue (Reitan 1960). Here, osteoblasts, osteoclasts and other cells in the surrounding
tissue react regulating the resorption and formation of bone matrix (Kanjanamekanant
et al. 2013; Kanzaki et al. 2002; Lekic and McCulloch 1996). Upregulation of several
inflammatory factors associated with osteogenesis and bone degradation are detectable

4
in the PDL fibroblasts (PDLF) after mechanical force stimulations (Kanzaki et al.
2002; Kook et al. 2009). This is closely linked to physiological changes of osteoblasts
and osteoclasts during orthodontic tooth movement (Davidovitch 1991; Long et al.
2001; Maeda et al. 2007; Shimizu et al. 1994).
2.2.2 Osteoblasts
Bone plays an important supportive role of the whole body. In the oral cavity, alveolar
bone maintains teeth in their positions to drive their normal physiological function. On
the other hand, alveolar bone shows plasticity under mechanical force stimulation
(Katagiri and Takahashi 2002). Previous studies showed that with mechanical forces
applied osteoblasts produce various cytokines. This contributes to the mechano-
transduction process (Ducy et al. 2000; Li et al. 2007) leading to the remodeling of
periodontal tissues. Osteoblasts also play a role in the balance of the PDL and its
surrounding cells during alveolar bone remodeling (Beertsen et al. 1997; Yamazaki et
al. 2014).
However, osteoblast regulation after mechanical force application is not yet
fully understood; in particular, how different magnitudes of force influence this
process and how PDL is involved in this.
2.3 Factors involved in orthodontic tooth movement
The significance of the mechanical loading for bone resorption and bone formation is
undisputed. Extracellular matrix molecules, ion channels, signal molecules and
integrin play active roles in mechanic transduction (Kanzaki et al. 2002; Maeda et al.
2007). On the other hand, the mechanisms of transduction on cellular and subcellular
level in bone remodeling are still not fully understood (Nakao et al. 2007).
During orthodontic tooth movement (OTM), different inflammatory cytokines,
including interleukin 6 (IL6) (Jacobs et al. 2014), interleukin 1E (IL1%) (Shimizu et al.
1994), prostaglandin-endoperoxide synthase 2 (PTGS2; previous name: cyclooxy-
genase-2, COX2) (Shimizu et al. 1998), tumor necrosis factor (TNF) (Kim et al. 2013),
receptor activator of NF-N% ligand (RANKL) (Yamaguchi 2009), the runt-related

5
transcription factor 2 (RUNX2) (Baumert et al. 2004; Ziros et al. 2002) and the
purinergic receptor/ion channel P2RX7 in periodontal tissue (Kanjanamekanant et al.
2013; Viecilli et al. 2009).
The cytokines mentioned above are either released by periodontal tissue cells
(i.e. PDL, osteoblasts and osteoclasts) or were shown to be regulated (i.e., RUNX2,
P2RX7) by mechanical force stimulation and thus play regulatory roles in alveolar
bone reconstructions during tooth movement (Kanjanamekanant et al. 2013; Li et al.
2013a; Mayahara et al. 2012).
2.3.1 Prostaglandin-endoperoxide synthase 2 (PTGS2) and
Prostaglandin E2 (PGE2)
The isoenzymes of prostaglandin-endoperoxide synthase (PTGS), PTGS1
(cyclooxygenase 1, “COX1”) and PTGS2 (cyclooxygenase 2, “COX2”), are widely
studied as key enzymes in prostaglandin biosynthesis (O'Neill and Ford-Hutchinson
1993). Prostaglandins are part of several pathways leading to the activation and
secretion of pro-inflammatory mediators, like cytokines, mitogens, and
lipopolysaccharides (Hla and Neilson 1992; Jones et al. 1993; Lee et al. 1992), and
were shown to accelerate bone resorption in the alveolar bone during orthodontic
therapy (Klein and Raisz 1970). In the initial stage of orthodontic therapy, PDLF
produce prostaglandin-related acute inflammatory factors in response to orthodontic
mechanical stimulation. PTGS2 is induced in periodontal tissue cells, including
osteoblasts, osteoclasts, gingival fibroblasts, cementoblasts and PDLF (Römer et al.
2013; Yucel-Lindberg et al. 2006), leading to prostaglandin E2 (PGE2) secretion
(Kraemer et al. 1992; Kujubu and Herschman 1992). PTGS2 gene expression is
closely correlated with PGE2 biosynthesis during inflammatory reactions. PGE2 is
detectable after orthodontic force loading in periodontal tissues; it is known as a pro-
inflammatory intermediary, an effective factor for inducing osteoclasts (Mayahara et al.
2012; Römer et al. 2013; Saito et al. 1991). Additionally, it was shown that PGE2
secretion in response to mechanical force changes along with PTGS2 enzyme activity
under mechanical load (Shimizu et al. 1998).

6
2.3.2 Interleukin 6 (IL6)
Interleukin 6 (IL6) is a cytokine associated with changes of bone mass (Bakker et al.
2014). Overexpression of IL6 accelerates bone reconstruction by decreasing bone
resorption and increasing bone formation (Baker et al. 1999). Differentiation of
progenitor cells to osteoblasts is also facilitated by IL6 (Bellido et al. 1997). In
contrast, lack of IL6 lowers bone mass via reducing the numbers of osteoblasts (Balto
et al. 2001; Yang et al. 2007). Periodontal tissue remodeling during inflammatory
response and orthodontic tooth movement is affected by IL6 (Alhashimi et al. 2001).
Differential expression of IL6 were detected in gingival crevicular fluid and PDLF
after orthodontic force loading, indicating IL6 might play a role in the bone
remodeling process after mechanical stimuli (Madureira et al. 2015; Ren et al. 2007).
2.3.3 Runt-related transcription factor 2 (RUNX2)
Runt-related transcription factor 2 (RUNX2) promotes the differentiation of progenitor
cells into mature osteoblasts. In general, RUNX2 plays an important role in bone
growth equilibrium and bone remodeling. RUNX2 knockout mice show a complete
lack of bone formation (Komori et al. 1997) and heterozygous RUNX2 mutations lead
to cleidocranial dysplasia (Baumert et al. 2005). RUNX2, thereby, is considered as a
“master gene” or “pacemaker gene” for bone development and is part of several
signaling pathways in osteoblastic differentiation (Ducy et al. 1999).
RUNX2 itself is induced by bone morphogenetic proteins (BMP) in cells of the
osteoblast lineage in advance of osteoblast differentiation (Ducy et al. 1997). In the
promoter region of many osteogenic specific genes (i.e. osteocalcin, alkaline
phosphatase, type-I collagen) RUNX2 binding sites exist (Colden et al. 2017; Kern et
al. 2001; Zhang et al. 2017).
2.3.4 Purinergic receptor/ion channel P2RX7
P2RX7 receptor is an adenosine triphosphate (ATP)-dependent ion channel and plays
a crucial role in bone biology and inflammation (North 2002). Mechanical forces
induce the increase of extracellular ATP concentration, which is considered a cellular
stress signal (Kanjanamekanant et al. 2013). Upon binding extracellular ATP, the

7
P2RX7 ion channel opens and Ca2+ enter the cell (Kariya et al. 2015; Schneider et al.
2006; Trubiani et al. 2014; Viecilli et al. 2009). This leads to accumulation of
intracellular calcium and liberation of fundamental inflammatory mediators, like TNF,
IL6, IL1$, and IL1%, which regulate bone physiology (Ferrari et al. 2006; Lister et al.
2007). Another major function of P2RX7 is to accelerate necrotic tissue metabolism.
However, it is still unclear concerning the effects of P2RX7 on bone remodeling and
tooth movement (Viecilli et al. 2009).
2.3.5 Tumor Necrosis Factor (TNF)
The tumor necrosis factor (TNF� is a pro-inflammatory cytokine which can induce
apoptosis in PDLF and osteoblasts (Alikhani et al. 2004; Pavalko et al. 2003).
Increased levels of TNF were discovered in osteoporosis and periodontitis patients
(Ralston et al. 1990), as well as in PDL on tension or compression side after
mechanical force load during orthodontic tooth movement (Uematsu et al. 1996). This
leads to a stimulation of osteoclastogenesis and an inhibition of bone formation and
thus to an adjustment in bone remodeling (Bertolini et al. 1986; Tan et al. 2006).
2.4 Experimental designs to simulate orthodontic tooth
movement in vitro
In vivo studies on orthodontic tooth movement are conducted in human and animal
models (e.g. rat, beagle dogs, and mice). Analysis of tissue reactions are mostly
limited to the screening of cytokines released to the gingival crevicular fluids, and
histologic dissections of tissue reactions due to force application (Thilander et al. 2005;
von Böhl et al. 2004). Due to the complexity of the tissues involved in orthodontic
tooth movement, subcellular investigations specific to individual cell types is
performed using in vivo studies. These exclude non-experimental tissues and cell
interference thus alleviating the examination of specific intra- and intercellular signal
transduction pathways (Kim et al. 2006).

8
2.4.1 Influence of mechanical force
Mechanical force is considered not only a main element in regulating bone
homeostasis, but also a morphological determinant in bone development and
reconstruction (Kook et al. 2009; Meazzini et al. 1998; Yokoya et al. 1997). Various
aspects, such as osteogenic differentiation, bone morphology, gene expression,
osteocyte proliferation and apoptosis are analyzed (Hughes-Fulford and Lewis 1996;
Li et al. 2007; Meazzini et al. 1998).
During orthodontic tooth movement, mechanical forces are transmitted to the
periodontal tissue (see also Section 2.1). In this process, spatial and temporal changes
occur in parallel in different cell types of periodontal tissue. For example, cell damage
due to tissue injury happens along with cellular reactions based on force stimulation.
Additionally, sequential intra- and intercellular changes induce bone resorption
(Chambers et al. 1993; Lanyon 1992; Rubin et al. 1995). A suitable mechanical force
is essential for inducing physiological bone changes instead of damaging teeth or
periodontal tissues (Koyama et al. 2008; Mayahara et al. 2012).
To simulate the condition during orthodontic force loading as near as possible
to the in vivo situation, experimental studies used different setups to produce
mechanical force on adherent cells in vitro (Figure 2). Clinically, two types of force,
tension and pressure, are mainly involved in orthodontic tooth movement. Pressure
narrows the width of the PDL. This induces the expression of bone remodeling
markers. Histological alteration on the compressive side in the periodontal tissues are
detectable (Otero et al. 2016).
Concerning sampling, two different sampling procedures are applied in studies related
to compressive force application: “direct sampling” and “pulse-chase sampling”. In
“direct sampling” biological samples (i.e. supernatant, protein lysate, cell lysate) are
drawn directly after force application stopped (e.g. Morikawa et al. 2016; Redlich et al.
2004a). The procedure of “pulse chase sampling” involves the application of a force
(i.e. the “pulse”) to the specimen for a defined period of time. Then, samples are
drawn at defined time intervals after force application stopped (e.g. Baumert et al.

9
2004). Both sampling procedures in common is the “pulse” step; the difference is the
time point when samples are drawn for further analysis. With “direct sampling” only a
small “time window” is available for analysis. The position of this “window” in
relation to the time point of force release is not stated in any publication. “Pulse chase
sampling”, on the other hand, enables to study the effect of a stress application over a
longer period of time. Gene expression and translation take time and this time differs
between different genes. Some genes are rapidly transcribed after stimulation
(“primary” or “early” response genes) and some genes are slowly induced (“secondary”
or “late” response genes) (Sandoval et al. 2016). “Pulse chase sampling” is therefore
suitable for screening purposes.
2.4.2 In vitro culture systems
A variety of methods to study the mechanical responses of periodontal tissue cells in
vitro were applied using cell type-specific experimental designs (Baumert et al. 2004;
Redlich et al. 2004a; Römer et al. 2013; Ziros et al. 2002). In the in vivo situation,
intercellular communication between the different cells and cell types of the
periodontal tissues is taking place. Adaptation of the in vivo situation to in vitro
models would therefore involve force application not only on one cell type but on two
Figure 2. Summary of experimental methods to apply different types of force related to OTM on adherent cells in vitro (image contributed by Dr. Baumert).

10
or more different cell types simultaneously, thus enabling communication between
these different cell types during force application.
Currently, intercellular communication cannot be fully elucidated during
mechanical loading in vivo. A possible way to investigate intercellular communication
between cells is a special kind of in vitro cell culture system that is called “co-culture”
(Figure 3).
Figure 3. The two types of “co-culture”: (A) “Direct contact co-culture”: cell types A and B share the same space and grow next to each other. (B) “Indirect contact co-culture”: cell type B is growing on a permeable membrane sharing the same culture medium as cell type A without touching each other.
“Co-culture” describes various techniques where different types of cell
populations are cultivated near to each other in the same cell culture environment
(Figure 3). At present, two types of co-culture systems are used: “direct contact co-
culture” and “indirect contact co-culture”. In “direct contact co-culture”, two types of
cells are cultivated directly next to each other (Figure 3A). Direct cell-cell contacts can
be established as well as paracrine signaling pathways (Jones et al. 2009). However,
some drawbacks exist with this mixed co-culture model:
1. If one cell type outgrowths the other one and thus occupying most of the limited
growth space, it might cause massive cell death.
2. The analysis of gene expression in both cell types separately is technically
demanding in this totally mixed environment.

11
Taken together, with direct-contact co-culture it is not possible to analyze the effects
of long-term force application or to conduct gene expression studies on each cell type
separately.
These issues can be solved in the “indirect contact co-culture system”. In this
system, two types of cells share the same growth environment without contacting each
other directly (Figure 3B). Intercellular communication via the release of cytokines
and growth factors is still possible. The indirect contact co-culture system is
established using a double-chamber that is formed by inserting cell culture inserts into
suitable cell culture plates. The separation is achieved by a porous membrane that
forms the bottom of the cell culture inserts. Its pore size inhibits cell migration through
the membrane but enables molecules (i.e. from the cultivation medium, signaling
molecules or metabolites) to pass through. Using this setup, two different kinds of
cells can be cultivated using the identical medium without physically contact to each
other. Afterwards, these cell types can be analyzed and evaluated separately by
moving the inserts to another suitable plate (Hatherell et al. 2011).
In summary, previous studies have several technical drawbacks: (1) Force is applied
mostly on cells in mono-culture. (2) Co-culture models are used but not with force
applied. (3) During force application, physiological conditions like temperature are
not controlled. (4) “Direct sampling” procedures are used and the duration of
sampling is not reported.

12
3 Aim of the study
Aim of this study, therefore, was to establish an in vitro method to investigate the
intercellular communication between cells during orthodontic tooth movement
meeting the following prerequisites:
• Compressive force application to hPDLF and hOB in co-culture;
• Access to both cell types after centrifugation without cross-contamination;
• Application of force at physiological conditions;
• Application of a stringent “pulse chase” sampling regime.
To meet the prerequisites, compressive force was applied onto both hPDLF and hOB
in indirect co-culture using a laboratory centrifuge for 1, 2 and 4 h. Due to the
technical limitations of the available centrifuge force application took place at a
reduced temperature at 30 °C instead of 37 °C. Reproducibility and validity of the
setup was evaluated by testing cell viability and apoptosis induction. The temperature
conditions were monitored in all experimental conditions (force magnitude, force
duration, culture condition) for both experimental groups and negative control groups.
Genes or metabolites known to be regulated in intercellular communication during
orthodontic tooth movement were further analyzed in hPDLF and hOB at 2, 4, 8 and
16 min after compressive force application, i.e. IL6, TNF, PTGS2, RUNX2, P2RX7
and PGE2. The experiments were repeated with mono-cultured cells for direct
comparison.
To make the results of the “pulse chase” sampling more comparable with
previous published studies applying “direct” sampling, the results of both the gene
expression analysis and the ELISA testing are presented in two different ways: (1)
“direct” sampling: measurements from 2 and 4 min chase are combined; (2) “pulse
chase” sampling as is.

13
4 Materials and Methods
4.1 Materials
4.1.1 Chemicals
All chemicals were purchased at the highest available purity from the companies listed.
Reagent kits are listed below and are described in the relevant methods section.
Chemicals name Supplier
Agarose LE Agarose (Biozym, Hessisch Oldendorf)
Apoptosis kit Multi-Parameter Apoptosis Assay Kit (Cayman, Ann Arbor, USA)
cDNA synthesis kit SuperScript® IV First-Strand Synthesis System (Thermo, Munich)
Cell culture medium • MEM-Alpha-Medium (Thermo, Munich) • Dulbecco´s Modified Eagle´s Medium/Nutrient Mixture
F-12 Ham (Sigma Aldrich, Steinheim) • Dulbecco's MEM (Biochrom, Berlin)
Dimethylsulfoxid (DMSO) Cell culture grade (AppliChem, Darmstadt)
Dithiothreitol (DTT) 1 M solution (AppliChem, Darmstadt)
DNA ladder Thermo, Munich:
• GeneRuler 100bp Plus DNA Ladder • GeneRuler Low Range DNA Ladder
DNA loading buffer 6× Loading Buffer with orange G (Genaxxon, Ulm)
ELISA kits R&D Systems, Minneapolis, USA:
• Human IL6 Duo Set • Human IL6 Quantikine Kit • PGE2 Parameter Assay • Human TNFα Duo Set
Ethanol For disinfection: 70% denatured (CLM GmbH, Niederhummel)
For Zymo kit application: 99.8%, denatured (Carl Roth, Karlsruhe)
Ethidium bromide Ethidium bromide solution (0.07%) “Dropper-Bottle” (Applichem, Darmstadt)
FBS Fetal Bovine Serum Low in Endotoxin (Sigma Aldrich, Steinheim)
Glutamine 200 mM L-Glutamin solution, sterile-filered (BioXtra, Sigma Aldrich, Steinheim)
Incidin Incidin®Liquid (Ecolab, Monheim am Rhein)
MEM-Vitamines MEM-Vitamine Solution (100×) (Biochrom, Berlin)
Mycoplasma Test PCR Mycoplasma Test Kit I/C (Promokine, Heidelberg)
PBS-Buffer PBS Dulbecco without Ca2+ w/o Mg2+ (Biochrom, Berlin)

14
Chemicals name Supplier
PCR primers Synthesis by Metabion, Planegg: IL6, PTGS2, RUNX2, P2RX7, B2M, TNF
PCR water Aqua ad iniectabilia (Braun, Melsungen)
qPCR-Mastermix Luminaris Color HiGreen qPCR-Mastermix (Thermo, Munich)
Resazurin Resazurin sodium salt (Sigma Aldrich, Steinheim)
RNA isolation kit Quick-RNATM MicroPrep (Zymo Research, USA)
RNA lysis buffer RNA Lysis Buffer (Zymo Research, Irvine, USA)
RNase inhibitor Recombinant RNasin® Ribonuclease Inhibitor (Promega, Madison, USA)
TAE-Buffer TAE buffer (50×) Molecular biology grade (AppliChem, Darmstadt)
Trypan blue Trypan Blue Solution (0.4%) (Sigma Aldrich, Steinheim)
Trypsin Trypsin/EDTA-Solution (0.05% / 0.02%) (Biochrom, Berlin)
4.1.1 Apparatus Type of apparatus Exact apparatus name, company
Agarose electrophoresis chamber EasyPhor Horizontal Agarose Gel System (Biozym, Hess. Oldendorf):
• EasyPhor Midi • EasyPhor Maxi
Autoclave Tuttnauer-Laborautoklav 3150 EL (Tuttnauer, Gießen)
Balance Satorius, Göttingen:
• TE 1502S • MSA2203P-000-DE
Cell culture safety cabinet HERA safe KS (ThermoScientific, Langenselbold)
Centrifuge • Refrigerated Centrifuge 4-16K (Sigma Aldrich, Osterode am Harz)
• Centrifuge Mikro 200R (Hettich, Tuttlingen) • Sprout mini centrifuge with SnapSpinTM Rotors
(Healthrow Scientific®, Vernon Hills, USA)
CO2 cell culture incubators CellIncubator 120 & CellIncubator 250 (Thermo, Munich)
Dishwasher Laboratory Dish Washer G7883 (Miele, Gütersloh)
ELISA reader Varioscan (Thermo Electron Corporation, Vantaa, Finland)
Fluorescence microscope EVOS® fl Color (Invitrogen, Carlsbad, CA)
Image Anaysis System LIAS (Avegene Life Science, Taiwan, China)
Magnetic hotplate stirrer RCT classic IKAMAG® (IKA®-Werke GmbH &Co. KG, Staufen)
Microbiological incubator Incubator BD23 (Binder, Tuttlingen)
Microwave oven Microwave R-939-A (Sharp Electronics, Hamburg)
Mixing Block Mixing Block MB-107 (Biozym, Hessisch Oldendorf)

15
Type of apparatus Exact apparatus name, company
PCR machines • TProfessional Thermocycler (Biometra, Göttingen) • LightCycler480 (Roche, Basel, Switzerland)
pH Meter HI 2210 pH Meter (Hanna Instruments, Vöhringen)
Pipetman Eppendorf Easypet® 4432 (Eppendorf, Hamburg)
Pipettes Eppendorf, Hamburg:
• Eppendorf Research® • Eppendorf Reference® • Multipette® stream
Proline® Plus (Biohit, Helsinki, Finnland)
Power supply EV202 (Consort, Turnhout, Belgium)
Refrigerator • 4 °C Refrigerator (Liebherr, Ochsenhausen) • -20 °C Refrigerator (Siemens, Munich) • -80 °C Refrigerator (Thermo Fisher Scientific, Munich)
Shaker Lab dancer (vwr, Darmstadt)
Spectrophotometer Nanodrop 1000 (Peqlab, Erlangen)
Sterilizatior APT.lineTM ED (E2) (Binder, Tuttlingen)
Temperature date logger From Elektronik Fuchs (Weingarten):
DS1921H-F5 Thermochron iButton®
1-Wire Network Cable
Thermo printer Video Graphic Printer (Sony, Tokio, Japan)
Ultra-pure water machine Arium® 611VF (Sartorius, Göttingen)
Vortexer Vortex-Genie®2 (Si Scientific Industries, Inc., Bohemia, USA)
Water bath LAUDA Aqualine (Lauda, Lauda-Königshofen)
4.1.2 Consumables Consumable item Supplier
“Eppendorf” tips Sarstedt, Nümbrecht:
• Biosphere® Fil. Tip: 20 µL, 100 µL • Biosphere® Fil. Tip 1250 µL, Long • Pipette tips 1250 µL, Long • Pipette tips 250 µL
Adhesive film Optical clear adhesive sealing tape for PCR (Sarstedt, Nümbrecht)
Cell counting chamber G-Slide Neubauer (C-Chip) (Kisker, Steinfurt)
Cell culture flask From Sarstedt (Nümbrecht):
• Cell culture flask T-25 • Cell culture flask T-75
Cell culture inserts ThinCert cell culture inserts for 12-well plates (Greiner Bio-One, Frickenhausen)

16
Consumable item Supplier
Labels From Diverified Biotech (Dedham, USA):
• Teeny Tough-Tags® • Cryo-Babies® • Microtube Tough-Tags®
Multi-pipette tip From Eppendorf (Hamburg):
• Combitips advanced®, 5.0 mL, Farbcode blue • Eppendorf Quality™ Combitips 10 mL
Multiwell plates • Cell culture multiwell plate (12 well) (Greiner Bio-One, Frickenhausen)
• 384 Well Lightcycler plate (Sarstedt, Nümbrecht)
Pipette Serological Pipette (2 mL, 5 mL, 10 mL, 25 mL) (Sarstedt, Nümbrecht)
QIA shredder QIA shredder (Qiagen, Hilden)
Reaction tubes Sarstedt, Nümbrecht:
• Micro Tube: 0.5 mL, 1.5 mL, 2.0 mL • 15 mL centrifuge tube (“Falcon” type) • 50 mL centrifuge tube (“Falcon” type)
Cryo.s™ 2 ml (Greiner Bio-One, Frickenhausen)
Quali-PCR-Tubes 0.2 mL (Kisker, Steinfurt)
Syringe BD, Heidelberg:
• BD Discardit™ II Syringe 5 mL • BD Microlance™ 3 Needle

17
4.2 Cell culture
4.2.1 Cells used
Human periodontal ligament fibroblasts (HPDLF) and human osteoblasts (hOB) were
obtained from healthy tissue of patients undergoing surgery for orthodontic reasons
with informed consent (Ethics Committee LMU Munich Medical Center, registration
number: 045-09). The following in-house established human primary cells were used:
Type of cell
Patient Id. Age Gender Orthodontic treatment
Medium
hPDLF 170946 31 female Unknown DMEM, 10% FBS, 2% L-glutamine
hOB 379583 20 male Pretreatment DMEM/F12 (1:1), 10% FBS, 2% MEM
vitamins
The primary cells were prepared using explant culture techniques according to Ng and
Schantz (2010) with the following modifications. Freshly extracted teeth or bone
biopsies were collected separately in sterile 50 mL centrifuge tubes (“Falcon tubes”)
containing transport medium: PBS with 2u antibiotics/antimycotic mixture (Life
TechnologiesTM, Darmstadt, Germany) and 2u gentamycin (Biochrom, Berlin,
Germany). The samples were processed directly after collection.
hPDLF: The teeth were washed with transport medium. The middle third of
the tooth root surface was scraped off using a sterile surgical blade and the
periodontal ligament explants were placed in 6-well plates and cultivated with
Dulbecco’s Modified Eagle’s medium (Biochrom, Berlin, Germany) supplemented
with 10% fetal bovine serum (FBS) (Sigma-Aldrich, Steinheim, Germany), 2% L-
glutamine (Sigma-Aldrich, Steinheim, Germany) and 1u antibiotics/antimycotic
mixture (Life TechnologiesTM, Darmstadt, Germany).
Bone: Bone biopsies from alveolar bone were diced into small pieces and
washed three times with transport medium. Afterwards, they were three times
digested with collagenase II, each time for 30 min at 37 °C. Cells from the last

18
digestion step were cultivated using Dulbecco’s Modified Eagle’s Medium/Nutrient
Mixture F-12 Ham (DMEM/F-12; Sigma-Aldrich, Steinheim, Germany) with 10%
FBS and 2% MEM-vitamins (Biochrom, Berlin, Germany) and 1u
antibiotics/antimycotic mixture (Life TechnologiesTM, Darmstadt, Germany). The
bone pieces were washed again in transport medium, placed in 6 well plates and
covered with the same medium.
Both explant cultures, from hPDLF and hOB were placed in the CO2 incubator
with 5 % CO2 at 37 °C in humidified atmosphere and incubated until the cells started
outgrowing (“E1”). Upon reaching confluency, they were passaged (split ratio 1:3)
and cultivated in the corresponding medium using 0.05 % trypsin-EDTA solution
(Biochrom, Berlin, Germany). Cells at the fifth passage were used for processing the
experiments.
The human osteosarcoma cell line SaOS-2 (bought from DSMZ) was used for
evaluation and testing purposes. Cultivation was done using the same medium and
procedures as described for human osteoblasts.
4.2.2 Mycoplasma assay
Regularly, cell culture supernatants are tested for mycoplasma infection. For
mycoplasma testing, cell culture supernatants were collected from growing cell
cultures at confluency. The supernatants were processed using the PCR Mycoplasma
Test Kit I/C (PromoKine, Heidelberg, Germany) according to the manufacturer’s
instructions.
Specifically, testing samples (sample tube, 23 µl rehydration buffer and 2 µl
sample), positive control (positive tube, 23 µl rehydration and 2 µl DNA-free water)
and negative control (negative tube, 23 µl rehydration and 2 µl DNA-free water) were
prepared. Then PCR was performed according to the manufacturers’s protocol. Tubes
were placed in the TProfessional Thermocycler (Biometra, Göttingen, Germany)
machine. The PCR program consisted of the following steps: denaturation for 2 min
at 95 °C; 40 cycles of 30 s denaturation at 94 °C, 30 s primer annealing at 55 °C, 40 s
primer extension at 72 °C, and cooling to 4 - 8 °C.
19
PCR products were separated on a 1.5% standard agarose as described in Section
4.4.5: 8 µl of each PCR product and 5 µl of molecular weight marker per lane were
loaded. Separation was done using agarose electrophoresis for 45 min at 90 V in 2%
agarose, 1u TAE buffer.
4.2.3 Cell counting
When cells reached confluence, they were digested using 0.05 % trypsin-EDTA
solution at 37 °C and 5% CO2 for 5 min. Digestion was stopped using the respective
cell culture medium. Cell counting was done using single-use Neugebaur counting
chamber (Kisker Biotech, Steinfurt, Germany) and an inverted microscope (EVOSfl,
Invitrogen, Carlsbad, USA). Cell suspension and trypan blue solution (0.4%) (Sigma-
Aldrich, Steinheim, Germany) were mixed 1:1. Ten microliters of this mixture was
pipetted into each side of the counting chamber. Cells were counted at 10×
magnification under the phase contrast microscope. Cells at four corner quadrants of
each side of the chamber were counted as described in the documentation of the
counting chamber used.
4.3 Force application
After cell preparation, compressive force (CF) was applied to hPDLF and hOB
respectively using centrifugation according to Redlich et al. (1998), with modifications
from Baumert et al. (2004). This model resembled clinical orthodontic force.
4.3.1 Pretesting temperature stability and apoptosis induction
In pre-experiments the temperature stability during centrifugation was examined and
a workflow for CF application was established. To test the effect of temperature
(30 °C vs 37 °C) an assay was used to test apoptosis induction.
4.3.1.1 Temperature stability during centrifugation
Long-term temperature stability during centrifugation was monitored using the
Thermochrom iButton® data logger DS1921H-F5 (Maxim Integrated, San Jose, USA).

20
These data logger measure the temperature within a range of 0 to 46 °C with an
accuracy of ±1 °C and measuring intervals from 1 to 255 minutes.
The data logger was programmed and read-out using the OneWireViewer
program, version 0.3.17.44 (Maxim Integrated, San Jose, USA) together with the 1-
Wire Network Cable, DS1402D-DR8 (Maxim Integrated, San Jose, USA) (Figure 4).
Force application was done using the SIGMA 4-16K centrifuge (Sigma,
Osterode am Harz, Germany). Speed, time and temperature are adjustable and read via
a LCD display in front of the centrifuge. In parallel to the centrifugation cells, cells
serving as negative controls are incubated in a microbiological incubator (Binder
Incubator BD 23, Binder, Tuttlingen, Germany).
To establish a stable temperature during centrifugation, pretesting was done
measuring by iButton devices. One iButton device was put on bench for measuring the
room temperature, one was installed in the microbiological incubator (set at 30 °C)
and another two were placed into the centrifuge at beginning (one for temperature
measurement, the other for equilibrium). Different combinations of centrifugation
speed, temperature preset and (with the aid of the technical service of the manufacturer)
temperature offset (in the manufacturer settings of the centrifuge) were evaluated to
achieve a constant and reproducible temperature regime.
21
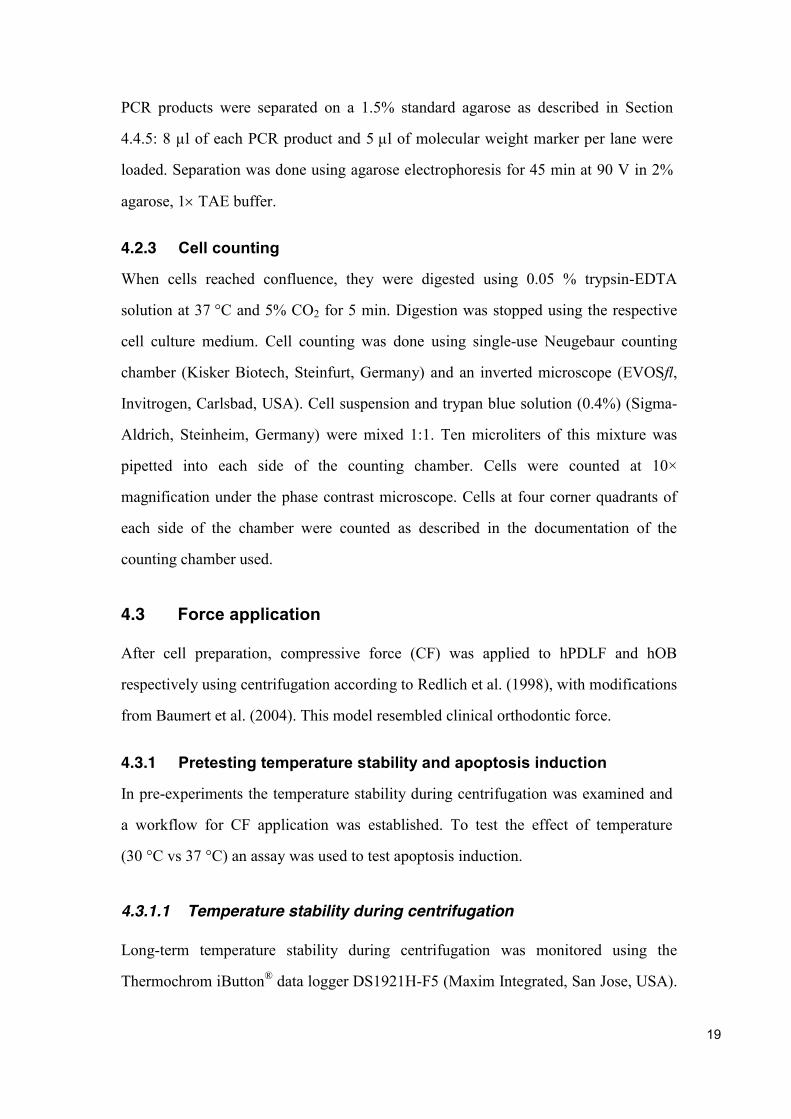
Figure 4. The interface of OneWireViewer program, version 0.3.17.44. (A) Programming for iButton device. (B) Read-out of iButton device.
4.3.1.2 Apoptosis assay
Cellular apoptosis was examined to test cell viability after incubation at 30 °C for up
to 4 h in comparison to 37 °C. HPDLF and hOB were seeded in 12-well plates with
1×10⁵ cells/ well, followed by overnight incubation at 37 °C with 5% CO2. Plates
representing the experimental group were incubated at 30 °C in a microbiological
incubator. Control plates were kept at 37 °C and 5 % CO2. After 1, 2 and 4 h of
incubation, the cells were stained using the Multi-Parameter Apoptosis Assay Kit

22
(Cayman, Ann Arbor, USA) according to the manufacturer’s protocol. Nuclear
fragmentation was detected by Hoechst Dye staining, reversal of the mitochondrial
membrane potential with TMRE and the flipping of the membrane lipids using
Annexin V-FITC. Immediately after staining, the cells were examined using a
fluorescence microscope (EVOSfl, Invitrogen, Carlsbad, USA). These assays were
repeated three times for both cell types.
4.3.1.3 Procedure for compressive force application
All CF applications were monitored using iButton devices as follows: two iButton
devices were used to monitor the room temperature and the temperature of the
negative controls placed into the microbiological incubator. The centrifugation
temperature was set to 30 °C and the temperature offset to -2.3. After positioning a
third iButton device into the centrifuge, the centrifuge was pre-run at 800×g until the
centrifuge reached the pre-set temperature of 30 °C shown on the centrifuge’s display.
Cells seeded in 12-well plates were placed in the centrifuge and the fourth iButton
device was placed in the counter-weight plate. All centrifugations were done on the
same day at 200×g and all centrifugations (1, 2, and 4 h) were monitored using iButton
devices. The negative controls were kept in the microbiological incubator at 30 °C for
the same durations as centrifugation (Figure 5).

23
Figure 5. Temperature profile of a typical experiment running in total over 8 h. The temperatures (centrifuge, biological incubator and room temperature) were monitored using iButton® temperature data loggers. The centrifuge was pre-run at 800ug to reach the required temperature (30 °C) quickly. Then the experiments were performed at 200ug.
The cells were centrifuged at 200ug, 30 °C for 1, 2 and 4 h, respectively.
Different levels of force (47.4 and 73.7 g/cm2) were adjusted by adjusting the volume
of cell culture medium within each well according to the following formula (Redlich
et al. 2004a; Redlich et al. 2004b):
𝑃 = 𝑚 × 𝑟 × 𝑟𝑝𝑚2 × 𝜋2
𝐴 × 9.8 × 900
Force (P): 47.4 g/cm2 73.7 g/cm2 Mass of medium [m]: 0.9 g (~900 µL) 1.4 g (~1,400 µL) Radius of centrifuge rotor (r): 0.16 m 0.16 m Speed of centrifuge [rpm]: 970 rpm 970 rpm Growth area of cells (A): 3.8 cm2 3.8 cm2
Cells in the microbiological incubator at 30 °C served as negative controls. For each
cell type/culture combination six samples were used. Thereafter, CF was applied to the
co-cultured hPDLF and hOB in the same way as mono-cultured, described previously.

24
4.3.2 Seeding of mono-culture setup
HPDLF and hOB were cultured in their specific culture media with 37 °C and 5% CO2
in humidified atmosphere. Both cell types, hPDLF and hOB, were seeded the same
way: in each well of a 12-well plate 105 cells/well were seeded with 900 or 1400 µL
culture medium. For 1, 2 and 4 h experimental durations, three plates were prepared as
described above: one will be placed into the centrifuge for CF application
(“experimental group”), one in the biological incubator (30 °C) as negative control and
one will be used as blank control (T0) (Figure 6). After attachment (about 6 h) in 37 °C
and 5% CO2, cell culture medium was replaced with cell culture medium containing 1%
FBS (“serum starvation”). The plates were placed back to the 37 °C/ 5% CO2 and
incubated overnight for 10 h.
Figure 6. Cells were seeded in 12-well plates with 1u105 cells/well. The same seeding condition for both cell types (hPDLF and hOB). (A) Plates were seeded for CF application in the centrifuge, (B) negative control in biological incubator and (C) blank control (T0) in cell culture incubator, respectively. This seeding was proceeded for each duration period (1, 2 and 4 h).
4.3.2.1 Cell culture inserts
ThinCert™ cell culture inserts (Greiner Bio-One, Frickenhausen, Germany) (Figure 7)
is a device for indirect contact co-culture; different cell populations can be cultivated
in the same cell culture environment. The advantage of this insert is that it keeps the
two co-cultured cell populations separated from each other via a porous membrane
made from a polyethylene terephthalate capillary pore membrane tightly sealed to the
polystyrene housings. The pore size of the optical transparent membrane is 1.0 µm
with 2 u 106 pores/cm2. Due to its physical and chemical properties, the cell culture

25
inserts are applicable for light microscopy, electron microscopy, fluorescence
microscopy, immunocytochemistry and co-culture experiments. The cell culture
surface of a 12-well insert is 113.1 mm2 with an inner diameter 13.85 mm, an outer
diameter 15.85 mm and an overall height of 16.25 mm. The working volume is 0.3 -
1.0 ml per insert.
Using the cell culture inserts, two cell populations can be co-cultivated, one in
the insert and the other one in the well. They are physically separated sharing the same
culture environment. Paracrine communication is possible via the pores of the
membrane.
Figure 7. Cell culture inserts used: (A) Greiner ThinCert™ cell culture insert; (B, C) Inserts in 12-well plate.
4.3.2.2 Co-culture of human PDL fibroblasts and human osteoblasts
HPDLF and hOB were co-cultured. In hPDLF setup, hPDLF was seeded in 12-well
plates at a density of 1×10⁵ cells per well (Figure 8A). HOBs were seeded in
ThinCert™ cell culture inserts (Greiner Bio-One, Frickenhausen, Germany) at a
density of 5u104 cells per insert (Figure 8B). After attachment (about 6 h), cell culture
media were removed. DMEM/F-12 containing 1% FBS was added to the wells. The
seeded inserts were placed into the corresponding wells (Figure 8C) and also filled
with DMEM/F-12 giving a total volume of 900 µL or 1400 µL. They were co-
cultivated for at least 10 h. Then, CF was applied to co-cultured hPDLF and hOB in
the same way as mono-cultured force loading. In hOB setup, the positions of cell types
were switched (Figure 8D-F). Same amount of plates was seeded as mono-culture.

26
Figure 8. Co-culture setup. (A) hPDLF was seeded in the wells of 12-well plates. (B) hOB was seeded in the cell culture inserts. (C) Cell culture inserts were placed into wells at least 10 h before CF application. (D) hOB was seeded in the wells of 12-well plates. (E) hPDLF was seeded in the cell culture inserts. (F) Cell culture inserts were placed into wells at least 10 h before CF application.
4.3.2.3 Pulse chase multi-sampling
After each centrifugation and incubation, samples were collected at 2, 4, 8, and 16 min.
Time was counted strictly with timer and three biological replications were performed
for every chase point. From each sample 800 µl of cell culture supernatant was
collected, centrifuged at 15,000 rpm, 4 °C for 10 min and then transferred to a fresh
Eppendorf tube. These samples were used for ELISA analysis of PGE2, IL6 and TNF���
After removal of the cell culture supernatants from each well, hPDLF and hOB
were lysed using a total amount of 750 μL RNA lysis buffer (Zymo Research, Irvine,
America) with 40 mM dithiotreitol (DTT) (AppliChem, Darmstadt). The cell lysates
from each well were transferred to fresh, sterile 1.5 ml Eppendorf tubes and stored
at-80 °C until further processing. These lysates were used for gene expression analysis
of IL6, TNF��RUNX2, P2RX7, and PTGS2. After rigorously testing several potential
genes, B2M was selected as the reference gene (see below).

27
4.4 Gene expression analysis
All samples from one experimental condition (cell type, force magnitude, force
duration, culture condition) were processed and analyzed in parallel.
4.4.1 RNA Purification
The required RNA lysates were defrosted. Before continuing RNA isolation, all cell
lysates were vortexed and spun down briefly. All further procedures were carried out
at room temperature. First, the cell lysates were passed through individual
QIAshredder columns (Qiagen, Germany) to fragment high molecular weight genomic
DNA and other high molecular cellular components. This is fundamental for a
successful RNA isolation. Afterwards, total RNA was isolated using the Quick-
RNATM MicroPrep Kit (Zymo Research, Irvine, America) according to the instruction
manual as following:
1. An equal volume of ethanol (95-100 %) was added to the sample and mixed.
2. The mixture was transferred to a Zymo-Spin IC Column placed into a collection
tube and centrifuged for 30 seconds. The flow-through was discarded. To process
samples >800 µL, samples were stepwise loaded onto the same Zymo-Spin
columns.
3. RNA Wash Buffer was added to the column and centrifuged for 30 seconds.
Flow-through was discarded.
4. For in-column DNase I treatment the DNase I reaction mix provided by the
manufacturer was added directly to the column matrix, incubated at room
temperature for 30 minutes and then centrifuged for 30 seconds.
5. RNA Prep Buffer was added to the column and centrifuged for 30 seconds. Flow-
through was discarded.
6. RNA Wash Buffer was added to the column and centrifuged for 30 seconds.
Flow-through was discarded.
7. RNA Wash Buffer was added and centrifuged the column for 2 minutes to ensure
complete removal of the wash buffer.

28
8. The column was placed into an RNase-free tube. DNase/RNase-Free Water
(15 µL, preheated to 95 °C) was added directly to the column matrix and
centrifuged at 15,000 rpm for 30 seconds.
9. RNAsin® ribonuclease inhibitor (Promega, Madison, USA) was added to the total
RNA preparation to give a final concentration of 1U/µL: for 15 µL total RNA
solution 0.375 µL RNAsin® was added.
10. The processed RNA samples were stored at -80°C until further use.
4.4.2 Quality and quantification of total RNA
Total RNA yields were quantified using the NanoDrop1000 photometer (Peqlab,
Erlangen, Germany) directly after purification. All samples were vortexed and spun
down for a few seconds. One microliter of each sample was used for RNA quality and
quantification examination using the absorbance readings at 230 nm, 260 nm and
280 nm. Pure RNA preparations have a A260/A280 in the range of 2.0-2.2 (Green and
Sambrook 2012, pp. 365-366). Ratios below indicate contamination with proteins or
phenol. The ratio A260/A230 is used to evaluate possible contamination with organic
compounds or chaotropic salts. For pure RNA a A260/A230 ratio of 2.0 should be
expected (Green and Sambrook 2012, pp. 365-366).
4.4.3 Complementary DNA (cDNA) synthesis
From each RNA sample 600 ng total RNA was reverse transcribed into cDNA using
the SuperScript® IV First-Strand Synthesis System (Thermo Fisher Scientific,
Waltham, USA) in a TProfessional Thermocycler (Biometra, Göttingen, Germany).
cDNA synthesis process was performed according to the instruction manual:
1. To remove possible secondary structures in the RNA and to ease primer annealing,
600 ng total RNA (volume depending on RNA concentration), random hexamers
(50 ng/µL), 10 mM dNTP mix in a total volume of 13 µL are heated to 65 °C for
5 min and then rapidly cooled down on ice.
2. After addition of SSIV buffer (5u), DTT (100 mM), 2.0 U/µL RNase inhibitor and
200 U/µL reverse transcriptase, incubation continues according to the following
temperature profile: 10 min at 23 °C; 10 min at 50 °C; 10 min at 80 °C

29
3. After completion, RNA was eliminated from the reaction mixture with the addition
of 1 µL RNase H and further incubation for 20 min at 37 °C.
4. The cDNA was stored at -20 °C and diluted 1:5 for gene quantification using
quantitative real-time PCR.
4.4.4 PCR primer design
Potential PCR primers derived from the literature or bought from
Realtimeprimers.com (with purchase of a primer pair the relevant primer sequences
were made available) were evaluated using the following workflow adapted from
Thornton and Basu (2015) exemplified for human PTGS2 in the appendix:
x “HomoloGene”1 at NCBI was used for selection of the current version of the
mRNA reference sequence and checking for splice variants.
x “Electronic PCR”2 (Rotmistrovsky et al. 2004) was used to test the specificity of
mRNA/cDNA amplification and possible genomic DNA co-amplifications due to
genomic DNA contamination of the samples. The size deviation of transcriptome
was chosen up to 200 base pairs and genome up to 500 base pairs. A maximum of
2 mismatches and 2 gaps were allowed. “Electronic PCR” is now defunct and
replaced by “Primer Blast”3 (Ye et al. 2012).
x Energy considerations of PCR products were checked using the “UNAFold”
implementation at IDTdna4 (maximum sequence length allowed: 255 bp) using the
following settings: nucleotide type “DNA”; sequence type “linear”; temperature at
60 °C; Na+ concentration at 50 mM; Mg2+ concentration at 3 mM; all the others
were left with default.
x “Beacon Designer Free Edition”5 (Premier Biosoft, Palo Alto, America) was used
for energy evaluation. The web service was used with the default settings.
1 URL: http://www.ncbi.nlm.nih.gov/homologene/ (Date accessed: 06-12-2017) 2 URL: http://www.ncbi.nlm.nih.gov/projects/e-pcr/reverse.cgi (not available anymore!) 3 URL: http://www.ncbi.nlm.nih.gov/BLAST/ (Date accessed: 06-12-2017) 4 URL: http://eu.idtdna.com/UNAFold (Date accessed: 06-12-2017) 5 URL: http://www.premierbiosoft.com/qOligo/Oligo.jsp?PID=1 (Date accessed: 06-12-2017)

30
x De novo PCR primer design was applied using “Primer3plus”6 with the following
settings: reference mRNA sequence file with GenBank accession number; product
size ranges from 90 to 200; primer size with 18-20-27; primer Tm with 58-60-62;
Maximum Tm difference with 2; Mispriming/Repeat library “HUMAN”.
Forward and reverse primers (Table 1) were synthesized by Metabion (Planegg,
Germany) and delivered separately as 100 µM solutions in 10 mM Tris-EDTA (TE)
buffer. Primer pairs from Realtimeprimers.com were delivered already diluted to
0.1 µM.
4.4.5 Quantitative real-time reverse transcriptase polymerase chain
reaction (RT-PCR)
The sequences of the gene-specific primers are listed in Table 1. Quantitative real-
time RT-PCR was carried out using the Luminaris Color HiGreen qPCR-Mastermix
(Thermo Scientific, Schwerte, Germany) in a LightCycler 480 PCR (Roche, Basel,
Switzerland) according to the instructions of manufacturer. Each PCR reaction (final
volume: 20 µL) consisted of
x 2 μL of diluted cDNA,
x 10 μL of qPCR-MasterMix,
x 0.3 μM of each forward and reverse primer (synthesized primers) or
0.2 µM of Realtimeprimers.com primer solution,
x 6.8 μL of deionized water.
The RT-PCR was started with a pretreatment step for 2 min at 50 °C and followed by
an initial denaturation step for 10 min at 95 °C. Then amplification of 45 PCR cycles
had been done, which contained 15 s denaturation at 95 °C, 30 s primer annealing at
primer specific temperatures (Table 1), 30 s primer extension at 72 °C, and additional
data acquisition step at 5 °C below specific gene melting point (Table 1) for 5 s. The
6 URL: http://primer3plus.com/cgi-bin/dev/primer3plus.cgi (Date accessed: 06-12-2017)

31
PCR products of each gene were further tested by electrophoresis on a 2% agarose gel
to ensure the specificity of each primer and PCR fragment.
Table 1: The gene-specific primer sequences for the forward (f) and reverse (r) primers and the specific reaction conditions of B2M, PTGS2, IL6, RUNX2, P2RX7 and TNF.
Primer efficiency was evaluated for all primer pairs as follows: total RNA preparations
from SaOS-2 cells generated during pre-tests of the force application protocol were
used. Serial dilutions of cDNA were prepared: undiluted, 1:10, 1:100, 1:1000, and
1:10000. Quantitative real-time RT-PCR was carried out as described above. Standard
curves were generated using the LightCycler® 480 software (version 1.5.1) and the
primer efficiency was calculated. This is exemplified for B2M primer efficiency
determination in Figure 9.
Gene Primer sequence or order information Reference sequence [GenBank accession number]
Ampli-con length [bp]
Annea–ling temp. [°C]
Data acqui–sition temp. [°C]
Primer efficiency
B2M Realtimeprimers.com: HHK-1 NM_004048.2 86 58 77 1.887 PTGS2 f: AAG CCT TCT CTA ACC TCT CC
r: GCC CTC GCT TAT GAT CTG TC NM_000963.3 234 58 77 1.921
IL6 f: TGG CAG AAA ACA ACC TGA ACC r: TGG CTT GTT CCT CAC TAC TCT C
NM_000600 168 58 76 1.85
RUNX2 f: GCG CAT TCC TCA TCC CAG TA r: GGC TCA GGT AGG AGG GGT AA
NM_001015051 176 58 81 1.875
P2RX7 f: AGT GCG AGT CCA TTG TGG AG r: CAT CGC AGG TCT TGG GAC TT
NM_002562 143 58 78 1.916
TNF Realtimeprimers.com: VHPS-9415 NM_000594 173 58 79 1.933

32
Figure 9. B2M primer efficiency was determined after quantitative real-time RT-PCR. (A) Amplification curves of serial dilutions of cDNA were shown. (B) Standard curve was calculated.
Five potential genes (PGK1, PPIA, RPL, B2M and TFRC) from
realtimeprimers.com “housekeeping panel” HHK-1 were examined to serve as a
potential reference gene for relative quantitative real-time PCR. To do so, cDNA from
both negative control and experimental condition, drawn during the validation of the
centrifugation model, were prepared as described above. Quantitative real-time PCR
was done as shown above and the results were evaluated. A “reference gene” (also
called “housekeeping gene”) is a gene that is neither regulated in the negative controls
A
B
33
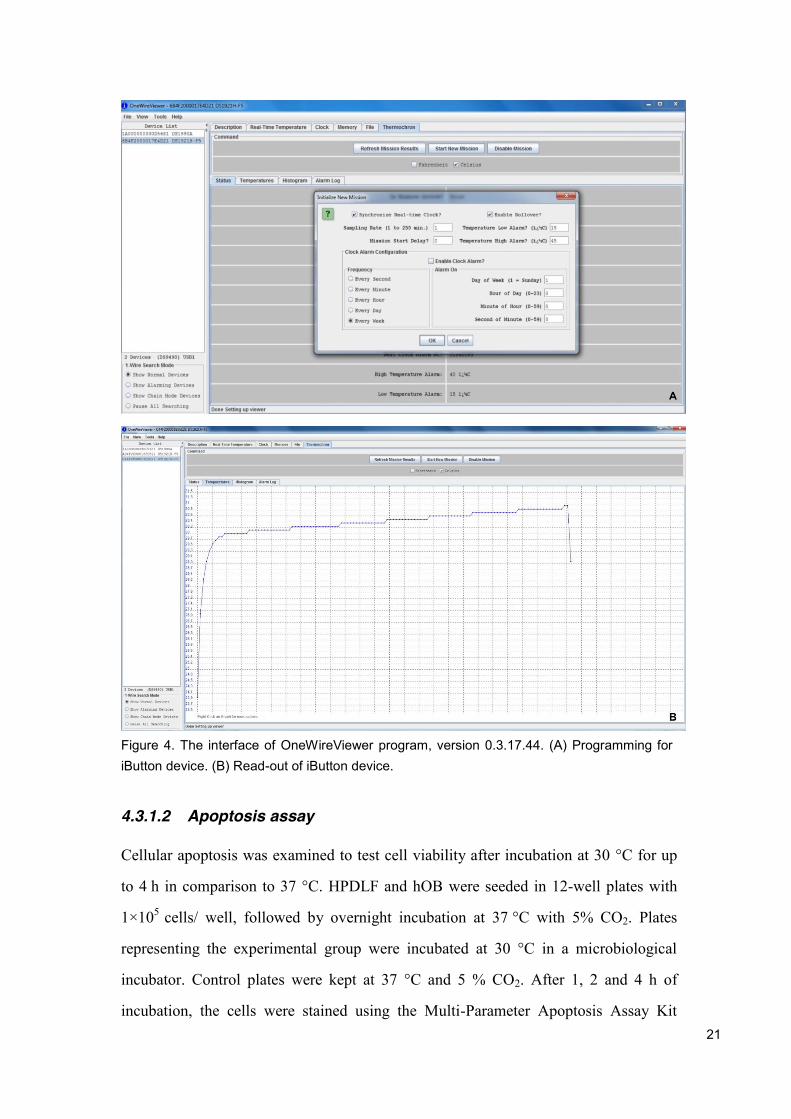
nor in the experimental condition. Therefore, it has to be established for each
experimental condition separately. B2M was selected as the reference gene, because it
showed the most stable gene expression within an experiment independently of being
negative control, T0 or experimental condition (Figure 10).
Figure 10. The boxplots show the Cq raw values generated by LightCycler480 software in automatic modus. Each experiment consisted of three sample sets: samples from negative control, T0 and experimental condition. Experiments A to C were mono-cultures. Experiments D and E were co-cultures with changed cell types in well and cell culture insert.
After each PCR, the specificity and size of the PCR products was evaluated
using 2 % agarose gels. These gels were prepared according to the manufacturer of the
agarose gel apparatus (EasyPhor Midi, Biozym, Hess. Oldendorf, Germany):
1. The running buffer was prepared from 50uTAE buffer by dilution to 1uTAE
buffer using distilled water.
2. To prepare a 2 % agarose solution, 1 g agarose was dissolved in 50 mL 1uTAE
with boiling in the microwave oven. This amount is enough, to pour one agarose
gel of 10u10 cm2 size.
3. After cooling down to ca. 50 °C, two drops of 0.07 % ethidium bromide
(Applichem, Darmstadt, Germany) were added.
4. The gel was poured according to the manufacturer’s instructions and the sample
loading combs were inserted. After solidification, the gel was transferred to the
tank and prepared according to the manufacturer’s instructions.

34
5. From each individual PCR reaction 10 µL PCR product and 2 µL DNA loading
buffer (containing Orange G) were mixed.
6. After the gel was solidified, 8 μL of each prepared sample and 5 µL of DNA
molecular weight marker (“GeneRuler 100bp Plus DNA Ladder”, “GeneRuler
Low Range DNA Ladder”) were loaded onto the gel.
7. Then the gel was run at 90 V for 45 minutes.
8. Visualization of the DNA pattern was done using the LIAS image analysis system
(Avegene Life Science, Chinese Taipei). Printouts were prepared using a thermos
printer (Video Graphic Printer, Sony, Tokyo, Japan).
4.5 Analysis of cell culture supernatants using enzyme-linked
immunosorbent assays
HPDLF and hOB cells were subjected to CF at 30 °C for 1, 2 and 4 h in two different
setups (mono- and co-culture). After each experimental condition, 800 µl cell culture
supernatant was collected at 2, 4, 8 and 16 min. To remove cell debris and other
particular material all samples were centrifuged at 15,000 rpm for 10 minutes at 4 °C.
The clear cell culture supernatant was then transferred into a fresh tube and stored at
80 °C. These samples were used for enzyme-linked immunosorbent assay (ELISA) for
IL6, TNF, and PGE2 concentration determination.
4.5.1 Measurement of IL6 protein concentration
Samples of cell culture medium supernatants stored at -80 °C were defrosted. IL6
protein concentration in the supernatants was measured using the “Human IL6 Duo
Set ELISA kit” (R&D Systems, Minneapolis, USA) according to the manufacturer’s
instruction. In short, the specific procedure was performed as follows:
1. The 96-well plate was coated with diluted capture antibodies overnight at room
temperature.
2. The next morning, the 96-well plate was washed three times with diluted wash
buffer.

35
3. Then, the plate was blocked with reagent diluent for 1.5 h at room temperature.
4. Afterwards, the plate was washed again three times with diluted wash buffer.
5. The IL6 standard provided with the kit was prepared according to the
manufacturer’s instructions by serial dilution using reagent diluent solution:
6. Sample and standards were added in to defined wells and incubated at room
temperature for 2 h.
7. The plate was washed three times with diluted wash buffer.
8. Diluted detection antibody was added to each well and incubated at room
temperature for 2 h.
9. The plate was washed three times with diluted wash buffer.
10. Streptavidin-HRP was diluted as stated in the protocol. The diluted Streptavidin-
HRP was then added to each well and incubated for 20 min at room temperature
11. The plate was washed three times with diluted wash buffer.
12. Substrate Solution was added to each well and incubated for 20 min at room
temperature.
13. Stop Solution was added to each well.
14. Optical density of each well was determined immediately using a microplate
reader at 450 nm and 540 nm.
15. IL6 concentration was determined using a four-parameter logistic (4-PL) curve
using the IL6 standards included in each measurement.
36
4.5.2 Measurement of TNF protein levels
TNF protein concentrations in cell culture medium was measured using the “Human
TNFD Duo Set ELISA kit” (R&D Systems, Minneapolis, USA) according to the
manufacturer’s instruction. The procedure follows the same steps as exemplified with
the “IL6 Duo Set ELISA kit” from the same manufacturer (see above).
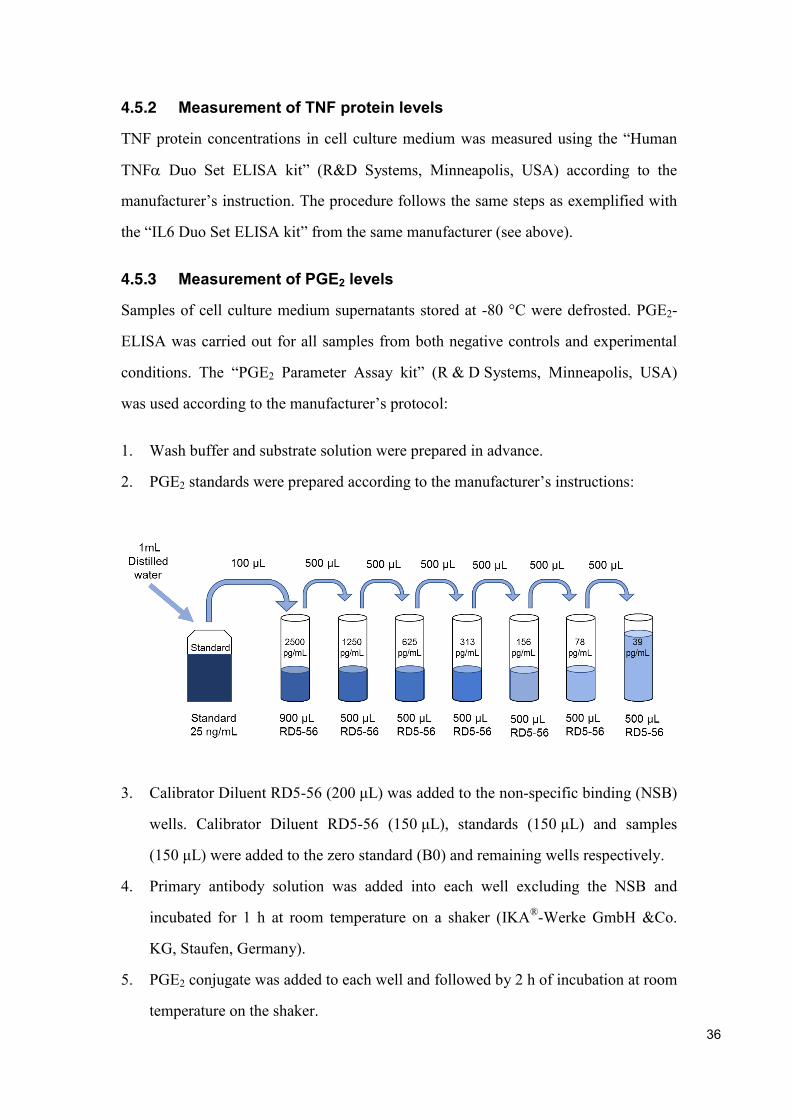
4.5.3 Measurement of PGE2 levels
Samples of cell culture medium supernatants stored at -80 °C were defrosted. PGE2-
ELISA was carried out for all samples from both negative controls and experimental
conditions. The “PGE2 Parameter Assay kit” (R & D Systems, Minneapolis, USA)
was used according to the manufacturer’s protocol:
1. Wash buffer and substrate solution were prepared in advance.
2. PGE2 standards were prepared according to the manufacturer’s instructions:
3. Calibrator Diluent RD5-56 (200 μL) was added to the non-specific binding (NSB)
wells. Calibrator Diluent RD5-56 (150 μL), standards (150 μL) and samples
(150 μL) were added to the zero standard (B0) and remaining wells respectively.
4. Primary antibody solution was added into each well excluding the NSB and
incubated for 1 h at room temperature on a shaker (IKA®-Werke GmbH &Co.
KG, Staufen, Germany).
5. PGE2 conjugate was added to each well and followed by 2 h of incubation at room
temperature on the shaker.

37
6. The whole plate was washed four times with wash buffer.
7. Substrate solution was added to each well and incubated 30 min at room
temperature in the dark.
8. Stop solution was added to each well.
9. Optical density was determined at 450 nm and 540 nm using a microplate reader.
10. PGE2 concentration was determined using a four-parameter logistic (4-PL) curve
using the standards included in each measurement.
4.6 Statistical analysis
To evaluate significant changes between negative control and experimental condition
the independent-samples Mann-Whitney U test was applied using IBM SPSS
Statistics 24 (IBM Corp., Armonk, N.Y.). The p < 0.05 was considered as a
statistically significant difference.

38
5 Results
An experimental setup was established to enable compressive force (CF) application
on cells in co-culture enabling variations in force magnitude and force duration. This
new model differed from previously established models in two ways: (1) force was
applied to cells in mono- and co-culture using a temperature adjusted centrifuge
running at 30 °C and (2) for durations of 1, 2 and 4 h.
The performance of this model was controlled using a set of temperature data
loggers to monitor temperature stability and a microscopic apoptosis assay to evaluate
the influence of temperature (30 °C vs. 37 °C) on cell viability. These results are
presented in Section 5.1.
Human periodontal ligament fibroblasts (hPDLF) and human primary
osteoblasts (hOB) were cultivated in mono- and co-culture and subjected to
centrifugation forces for different durations. Gene expression for TNF, IL6, PTGS2,
RUNX2 and P2RX7 was evaluated using quantitative real-time PCR (qPCR), protein
secretion into the cell culture supernatant was determined using ELISA for PGE2, IL6
and TNF. Results from mono- and co-culture were compared. To mimic “direct
sampling”, measurements from 2 and 4 min chase are combined and presented in
Section 5.2. “Pulse chase” sampling results are shown as is in Section 5.3.
5.1 Validation of the in vitro model for compressive force
application
To evaluate the effect of the reduced temperature during centrifugation, apoptosis
assays were used. HPDLF and hOB seeded in 12-well plates were incubated at 30 °C
(experimental groups) and at 37 °C (control groups) for 4 h. The assay was a multi
parameter assay detecting different stages of apoptosis in the same sample.
Defragmentation of nuclei was assessed using Hoechst Dye staining, mitochondrial
membrane potential break-down was detected using TMRE staining and flipping of
membrane lipids was detected using annexin V-FITC antibody labeling. The results of
a representative experiment are shown in Figure 11. Both, the experimental group at

39
30 °C as well as the control group at 37 °C present identical findings: after up to 4 h of
incubation at 30 °C in comparison to 37 °C no signs of apoptosis were detectible.
Hoechst staining showed that all the cells presented round and intact nuclei
(Figure 11, a4-d4), TMRE staining revealed that cells had undisrupted mitochondrial
membrane (Figure 11, a3-d3) and all the cells were annexin V negative (Figure 11, a2-
d2).
hPD
LF
30 °C
37
°C
hOB
30
°C
37 °C
Figure 11: Apoptosis staining of hPDLF (a, b) and hOB (c, d) incubated at 30 °C (a, c) or 37 °C (b, d) for 4 h. Cells were stained with TMRE/Hoechst Dye and annexin V-FITC. Phase contrast (a1-d1), annexin V (a2-d2), mitochondrial membrane potential (a3-d3), DNA fragmentation (a4-d4) and overlay (a5-d5) images are shown. Scale bar: 200 µm.
To evaluate temperature stability during force application with centrifugation,
temperature data loggers were used to monitor the temperatures during centrifugation

40
in the centrifuge and in the microbiological incubator used for the controls.
Additionally, the room temperature during centrifugation was measured. The
temperature was recorded throughout all experiments. Figure 5 shows the
measurements during an experimental cycle: force applications for 1, 2 and 4 h were
applied in order on the same day. The room temperature was constant at 23±1 °C
during the experiments. To shorten total centrifugation time and to reach a stable
temperature of 30 °C, the centrifuge was set to 800ug for 47 min. Afterwards, the
centrifuge was set to 200ug and this setting was then used for all three consecutive
experimental force applications. The data shows, that the temperature within the
centrifuge was stable at 30.5±1 °C (Figure 5). Identical temperature profiles were
recorded in all experiments.
5.2 “Direct sampling”
5.2.1 Gene expression in mono-cultured cells after low mechanical
force application
Tumor necrosis factor (TNF) gene expression was slightly upregulated in human
periodontal ligament fibroblasts (hPDLF) (Figure 12A) after 1, 2 and 4 h of CF
application. Prostaglandin-endoperoxide synthase 2 (PTGS2) gene expression
increased significantly 2.25-fold (p = 0.001) after 1 h of CF and this increase was even
more pronounced (4.86-fold) (p < 0.001) after 2 h of CF (Figure 12C). Interleukin 6
(IL6) gene expression showed a significant 1.34-fold (p < 0.001) upregulation after 1 h,
1.41-fold (p < 0.001) upregulation after 2 h and 1.13-fold upregulation after 4 h of CF
application (Figure 12E). Runt-related transcription factor 2 (RUNX2) gene expression
increased significantly after 1, 2 and 4 h of CF durations in hPDLF (Figure 12G).
Gene expression of the purinergic ion channel/receptor P2RX7 increased after
2 (p = 0.005) and 4 h (p = 0.012) of CF in hPDLF (Figure 12I).
In human osteoblasts (hOB), TNF gene expression significantly increased 4-
fold (p < 0.001) after 1 h of CF but remained unchanged after 2 and 4 h CF application
(Figure 12B). PTGS2 gene expression showed a 2.5-fold upregulation (p < 0.001) after

41
1 and 2 h of CF application, and continuously increased to 4.37-fold (p < 0.001) after
4 h of CF application (Figure 12D). A similar pattern was observed for IL6 gene
expression: only a small but significant increase in IL6 gene expression after
1 (p<0.001) and 2 h (p<0.001) of CF but 5.15-fold (p<0.001) after 4 h of CF
application (Figure 12F). RUNX2 gene expression was upregulated after 1 (p < 0.001)
and 2 h (p < 0.001) of CF (Figure 12H), and P2RX7 gene expression increased after
1 h (p = 0.01) but decreased after 4 h (p < 0.001) of CF (Figure 12J).

42
Figu
re 1
2. G
ene
expr
essi
on o
f TN
F, P
TGS
2, IL
6, R
UN
X2
and
P2R
X7
in m
ono-
cultu
red
hPD
LF a
nd h
OB
afte
r 1, 2
and
4 h
of
CF
at 4
7.4
g/cm
2 . The
∆∆C
q m
etho
d w
as a
pplie
d an
d B2
M w
as u
sed
as th
e re
fere
nce
gene
. Exp
ress
ion
leve
l of c
ontro
l was
de
fined
as
1. V
alue
s ar
e pr
esen
ted
as m
ean
± S
D (*
p <
0.05
, **p
< 0
.01,
***
p <
0.00
1). F
: Con
trol J
: CF.

43
5.2.2 Gene expression in mono-cultured cells after higher mechanical
force application
HPDLF and hOB were also subjected to 73.7 g/cm2 CF in mono-cultured setup. After
1, 2 and 4 h force application, gene expression of TNF, PTGS2, IL6, RUNX2 and
P2RX7 in hPDLF and hOB were measured using quantitative real-time PCR.
Presented in Figure 13, TNF was upregulated after 1 (p < 0.001) and 4 h of CF, but
slightly decreased after 2 h of CF in hPDLF (Figure 13A). PTGS2 and IL6 gene
expression showed significant increase after 1, 2 and 4 h of CF durations (p < 0.001)
in hPDLF (Figures 13C, 13E). As shown, RUNX2 (p = 0.003) (Figure 13G) and
P2RX7 (p = 0.002) (Figure 13I) gene expression were increased remarkable after 1 h
of CF in hPDLF.
In hOB, the gene expression of TNF was no regulated after 1 h of CF in
hPDLF. Whereas it was decreased after 2 h (p < 0.001) and increased significantly
after 4 h (p < 0.001) of CF in hPDLF (Figure 13B). Both PTGS2 and IL6 gene
expression were significantly upregulated after 1, 2 and 4 h of CF durations (p < 0.001)
(Figures 13D, 13F). No significant regulation of RUNX2 and P2RX7 gene expression
was observed after 1, 2 and 4 h of CF durations (Figures 13H, 13J).

44
Fi
gure
13.
Gen
e ex
pres
sion
of T
NF,
PTG
S2,
IL6,
RU
NX
2 an
d P
2RX
7 in
mon
o-cu
lture
d hP
DLF
and
hO
B a
fter 1
, 2 a
nd 4
h o
f C
F at
73.
7 g/
cm2 . T
he ∆
∆Cq m
etho
d w
as a
pplie
d an
d B2
M w
as u
sed
as th
e re
fere
nce
gene
. Exp
ress
ion
leve
l of c
ontro
l was
de
fined
as
1. V
alue
s w
ere
pres
ente
d as
mea
n ±
SD
(*p
< 0.
05, *
*p <
0.0
1, *
**p
< 0.
001)
. F: C
ontro
l J: C
F.

45
5.2.3 Gene expression in co-cultured cells after lower mechanical force
application
Lower (47.4 g/cm2) CF was applied on co-cultured hPDLF and hOB and gene
expression was analyzed using quantitative real-time PCR. In hPDLF, no significant
gene expression regulation was detected for TNF (Figure 14A). PTGS2 gene
expression was upregulated 1.89-fold (p = 0.005) after 1 h of CF. However, it
decreased significantly (p < 0.001) after 4 h of CF (Figure 14C). IL6 gene expression
showed significant decrease after 4 h of CF (p = 0.001), but no significant difference
was found after 1 and 2 h of CF (Figure 14E). RUNX2 gene expression was
downregulated after 4 h of CF (p = 0.001) (Figure 14G). P2RX7 gene expression was
upregulated after 1 (p < 0.001) and 4 h of CF (p = 0.004) (Figure 14I).
In hOB, TNF gene expression slightly increased 1.74-fold (p = 0.002) after 2 h
of CF (Figure 14B). PTGS2 gene expression significantly increased after 1 h of CF
(1.41-fold; p < 0.001) and 2 h of CF (2.87-fold; p < 0.001) but reduced to control level
after 4 h of CF (Figure 14D). IL6 gene expression was upregulated 2.91-fold
(p = 0.001) after 2 h and 1.39-fold (p = 0.005) after 4 h of CF (Figure 14F). Both
RUNX2 and P2RX7 gene expression showed significant decrease after 2 and 4 h of CF
(Figures 14H, 14J).

46
Fi
gure
14.
Gen
e ex
pres
sion
of T
NF,
PTG
S2,
IL6,
RU
NX
2 an
d P
2RX
7 in
co-
cultu
red
hPD
LF a
nd h
OB
afte
r 1, 2
and
4 h
of C
F at
47.
4 g/
cm2 .
The
∆∆C
q m
etho
d w
as a
pplie
d an
d B2
M w
as u
sed
as t
he r
efer
ence
gen
e. E
xpre
ssio
n le
vel o
f co
ntro
l was
de
fined
as
1. V
alue
s w
ere
pres
ente
d as
mea
n ±
SD
(*p
< 0.
05, *
*p <
0.0
1, *
**p
< 0.
001)
. F: C
ontro
l; J
: CF.

47
5.2.4 Effects of compressive force on PGE2, IL6 and TNF production
after mechanical force application
TNF, PGE2 and IL6 concentrations in mono- and co-cultured supernatants were
measured after CF application of 1, 2 and 4 h using analytic specific ELISA.
Additionally, the ratio between PGE2 concentration after centrifugation and the
corresponding control was calculated.
TNF production in the cell culture supernatant was determined using a TNF
specific ELISA. In both setups (mono- and co-culture), TNF concentration was below
the detection limit of the assay applied at any points after all force durations.
In mono-culture hPDLF, PGE2 concentration was upregulated after 1, 2 and
4 h of CF application in comparison to the corresponding controls (Figure 15A). After
1 h (p = 0.016) and 4 h (p = 0.004) of CF application, PGE2 increased significantly
(Figure 15A). In hOB, the PGE2 production increased after 1 (p = 0.038) and 2 h
(p = 0.038) of CF application, but decreased after 4 h of CF (Figure 15B). Additionally,
IL6 production in hPDLF was significantly higher than controls after 2 h (p = 0.002)
and 4 h (p = 0.041) of CF application (Figure 15C), but no significant difference was
found in hOB after 1, 2 and 4 h of CF application (Figure 15D).

48
Figure 15. PGE2 (A, B) and IL6 (C, D) concentrations in mono-cultured supernatants of hPDLF (A, C) and (B, D) hOB after 1, 2 and 4 h of CF at 47.4 g/cm2 were measured using ELISA. Control groups were not subjected to CF. Values were presented as mean ± SEM (*p < 0.05, **p < 0.01, ***p < 0.001). F: Control; J: CF.
In co-culture, the production of PGE2 was significantly lower than controls
when hPDLF were exposed to 1 (p = 0.002), 2 and 4 h (p = 0.002) of CF (Figure 16A).
In hOB, the PGE2 significantly increased after 2 h (p = 0.038) of CF but was smaller
after 1 h and 4 h of CF (Figure 16B). Concerning IL6 production, decrease was found
in hPDLF after 1 h (p = 0.026) and 2 h of CF application (Figure 16C). However, in
hOB, IL6 production showed a significant decrease after 1 h (p = 0.041) of CF, but
increase was observed after 2 (p = 0.015) and 4 h of CF (Figure 16D).

49
Figure 16. PGE2 (A, B) and IL6 (C, D) concentration in co-cultured supernatants of hPDLF (A, C) and hOB (B, D) after 1, 2 and 4 h of CF at 47.4 g/cm2 was measured using ELISA. Control groups were not subjected to CF. Values were presented as mean ± SEM (*p < 0.05, **p < 0.01, ***p < 0.001). F: Control; J: CF.
5.2.5 Comparison of the force induced changes in gene and protein
expression according to culture conditions
Gene expression changes induced by CF showed considerable dependency on the
culturing conditions. With exception of the TNF gene expression at 1 h the co-
culturing of both tested cell types significantly attenuated the CF induced
augmentation of TNF, PTGS2 and IL6 gene expression as well as the PGE2 and IL6
protein expression in hPDLF in comparison to the separate culturing method
(Table 2). A comparable reduction of the force induced changes in gene and protein
expression was also found in hOB, but not for the samples that have been exposed to

50
CF for 2 h and for the protein expression of IL6 at 4 h. Likewise, except the P2RX7
gene expression of hPDLF at 1 h, RUNX2 and P2RX7 showed subdued gene
expression in both cell types when they were co-cultured in comparison to that in
mono-culture.
Table 2. Comparison of co-culture vs. mono-culture gene expression and ELISA results for hPDLF and hOB. Given are the ratios of CF/control and co-/mono-culture, P values from the Mann-Whitney U test and significance levels (*p < 0.05, **p < 0.01, ***p < 0.001). ↑ = increase; ↓ = decrease.
Method Gene, gene product, metabolite
Cell type Time Ratio CF/control Compari-son (co--/ mono-culture)
P values
Signifi-cance Mono-
culture Co-culture
qPCR TNF hPDLF 1 h 1.19 1.29 ↑ 0.887 2 h 1.74 1.15 ↓ 0.198 4 h 1.19 0.73 ↓ 0.089 hOB 1 h 4.00 1.19 ↓ <0.001 *** 2 h 1.14 1.72 ↑ 0.014 ** 4 h 1.03 0.87 ↓ 0.078 PTGS2 hPDLF 1 h 2.23 1.89 ↓ 0.219 2 h 4.86 1.16 ↓ <0.001 *** 4 h 1.37 0.40 ↓ <0.001 *** hOB 1 h 2.45 1.41 ↓ <0.001 *** 2 h 2.56 2.87 ↑ 0.799 4 h 4.37 1.06 ↓ <0.001 *** IL6 hPDLF 1 h 1.33 0.91 ↓ <0.001 *** 2 h 1.40 1.14 ↓ 0.033 * 4 h 1.13 0.76 ↓ 0.024 * hOB 1 h 1.56 1.11 ↓ 0.003 ** 2 h 1.47 2.91 ↑ 0.114 4 h 5.15 1.39 ↓ <0.001 *** RUNX2 hPDLF 1 h 1.29 1.13 ↓ 0.114 2 h 1.35 1.01 ↓ 0.005 ** 4 h 1.76 0.88 ↓ 0.005 ** hOB 1 h 1.50 0.98 ↓ <0.001 *** 2 h 1.13 0.87 ↓ <0.001 *** 4 h 0.95 0.78 ↓ 0.020 * P2RX7 hPDLF 1 h 1.04 1.16 ↑ 0.843 2 h 1.30 1.07 ↓ 0.008 ** 4 h 1.26 1.13 ↓ 0.178 hOB 1 h 1.24 1.03 ↓ 0.089 2 h 1.00 0.77 ↓ 0.001 ** 4 h 0.80 0.77 ↓ 0.443
ELISA PGE2 hPDLF 1 h 7.29 0.39 ↓ 0.010 ** 2 h 3.79 0.74 ↓ 0.002 ** 4 h 6.33 0.26 ↓ 0.002 ** hOB 1 h 3.39 0.29 ↓ 0.024 * 2 h 1.85 4.29 ↑ 0.009 ** 4 h 0.67 0.34 ↓ 0.381 IL6 hPDLF 1 h 1.01 0.78 ↓ 0.010 ** 2 h 1.36 0.88 ↓ 0.002 ** 4 h 1.20 0.99 ↓ 0.015 * hOB 1 h 0.95 0.75 ↓ 0.024 * 2 h 1.03 1.49 ↑ 0.015 * 4 h 1.15 1.33 ↑ 0.714

51
5.3 “Pulse chase sampling”
5.3.1 Lower compressive force on mono-cultured cells
After mono-cultured cells were subjected to CF at 47.4 g/cm2, the total RNA was
isolated at 2, 4, 8 and 16 min. Gene expressions of TNF, PTGS2, IL6, RUNX2 and
P2RX7 were measured using quantitative real-time PCR.
TNF gene expression in hPDLF increased at 2 min after 1 h (p = 0.002) of CF,
decreased at 4, 8, 16 min. After 2 h of CF, increase was observed at 2 (p = 0.002) and
8 min. After 4 h of CF, TNF gene expression was downregulated at 2 min (p = 0.002),
and upregulated at 4 (p = 0.002), 8 (p = 0.004), and 16 min (p = 0.002) (Figure 17A).
PTGS2 gene expression in hPDLF was increased at different chase points after
1 and 2 h of CF. After 4 h of CF, slight increase of PTGS2 gene expression only
observed at 4 and 8 min in hPDLF (Figure 17C).
The increase of IL6 gene expression in hPDLF was observed at different chase
points except 16 min after 1 h of CF and 2 min after 4 h of CF (Figure 17E).
RUNX2 gene expression in hPDLF after 1 and 2 h of CF increased
significantly at 2 min (p = 0.002) and diminished at the following chase points.
However, after the application of 4 h of CF, it dramatically upregulated at 4 min
(p = 0.002) and slipped slightly at 8 min (p = 0.002) (Figure 17G).
Application of CF increased the P2RX7 gene expression at 2 min after 1
(p = 0.004) and 2 h (p = 0.002) of CF in hPDLF. An upregulation was observed at
4 min (p = 0.015) after 4 h of CF but it rapidly dropped back to control level at 8 min
(p = 0.026) and 16 min (Figure 17I).

52
Fi
gure
17.
Rea
l-tim
e P
CR
resu
lts o
f the
gen
e ex
pres
sion
of T
NF,
PTG
S2,
IL6,
RU
NX
2 an
d P
2RX
7 in
mon
o-cu
lture
d hP
DLF
and
hO
B at
de
fined
cha
se p
oint
s (2
, 4, 8
and
16
min
) afte
r the
app
licat
ion
of C
F at
47.
4 g/
cm2 fo
r 1, 2
and
4 h
. Val
ues
are
pres
ente
d as
mea
n ±
SD.
Stat
istic
al s
igni
fican
t diff
eren
ces
betw
een
expe
rimen
tal c
ondi
tion
and
nega
tive
cont
rol a
re s
how
n fo
r 1 h
(*),
2 h
(#) a
nd 4
h o
f ce
ntrif
ugat
ion
(+).
*, #,
+: p
< 0
.05;
**,
##, +
+: p
< 0
.01;
***
, ###
, +++
: p <
0.0
01.

53
In hOB, TNF gene expression was no change at different chase points after
2 and 4 h of CF. However, an upregulation was observed at 2 min (p = 0.002) and this
variation even higher at 4 min (p = 0.002) after 1 h of CF. But it dropped back control
level at 8 and 16 min (p = 0.002) (Figure 17B). Upregulation of PTGS2 and IL6 gene
expression showed at all chases points (2, 4, 8 and 16 min) after 1, 2 and 4 h of CF
duration. However, the ratio of upregulations of both genes after 4 h was higher than 1
and 2 h (Figures 17D, 17F). RUNX2 gene expression increased significantly at
2 (p = 0.002) and 4 min (p = 0.009) after 1 h of CF. Besides, a significant increase at
16 min (p = 0.002) after 2 h of CF and a mild decrease at 8 min (p = 0.002) after 4 h of
CF emerged (Figure 17H). The application of CF upregulated P2RX7 at 2 (p = 0.009)
and 4 min after 1 h of CF and at 16 min (p = 0.002) after 2 h of CF. But
downregulation was detected at 4 and 8 min (p = 0.002) after 4 h of CF (Figure 17J).
5.3.2 Higher compressive force on mono-cultured cells
Total RNA of 2, 4, 8 and 16 min was isolated after 73.7 g/cm2 loaded on mono-
cultured cells. Gene expression of TNF, PTGS2, IL6, RUNX2 and P2RX7 was
examined using quantitative real-time PCR.
In hPDLF, the TNF gene expression was dramatically increased at 2 (p = 0.002)
and 4 min (p = 0.002) and decreased at 8 min (p = 0.002) after 1 h of CF. After 2 h of
CF, the gene expression was decreased at 2 min (p = 0.002) and increased at 4, 8
(p = 0.002) and 16 min. And after 4 h of CF, TNF gene expression was increased at 2
and 4 min but decrease at 8 (p = 0.002) and 16 min (p = 0.026) (Figure 18A).
Significant increase of PTGS2 gene expression in hPDLF was observed at all
chase points independent of the CF durations (Figure 18C).
For IL6 gene expression in hPDLF, the upregulation emerged at different chase
points after 1, 2 and 4 h of CF durations excepted 8 min after 4 h of CF (Figure 18E).
RUNX2 gene expression in hPDLF showed upregulation at different chase
points excepted 8 min after 1 h and 4 min after 2 h of CF (Figure 18G).

54
Concerning P2RX7 hPDLF, the application of CF only induced the gene
expression significantly at 4 min (p = 0.002) after 1 h of CF (Figure 18I).
In hOB, significant decrease at 2 (p = 0.002) and 4 min (p = 0.002) after 2 h
and increase at 4 (p = 0.002) and 8 min (p = 0.002) after 4 h was observed in TNF
gene expression (Figure 18B).
PTGS2 and IL6 gene expression presented upregulated at every chase point
after 1, 2 and 4 h of CF durations in hOB (Figure 18D, 18F).
A slight increase was observed at 8 (p = 0.002) and 16 min (p = 0.026) after
2 h of CF as well as at 2 min (p = 0.002) after 4 h of CF for RUNX2 gene expression
in hOB. No significant RUNX2 gene expression was detected at all the other chase
points (Figure 18H).
P2RX7 gene expression was significantly increased at 16 min (p = 0.002) after
2 h and at 2 min (p = 0.009) after 4 h of CF in hOB (Figure 18J).

55
Fi
gure
18.
Rea
l-tim
e PC
R re
sults
of t
he g
ene
expr
essi
on o
f TN
F, P
TGS
2, IL
6, R
UN
X2
and
P2R
X7
in m
ono-
cultu
red
hPD
LF a
nd h
OB
at
2, 4
, 8 a
nd 1
6 m
in a
fter t
he a
pplic
atio
n of
CF
at 7
3.7
g/cm
2 (ce
ntrif
uge
at 4
00xg
) for
1, 2
and
4 h
. Val
ues
are
pres
ente
d as
mea
n ±
SD.
Stat
istic
al s
igni
fican
t di
ffere
nces
bet
wee
n ex
perim
enta
l co
nditi
on a
nd n
egat
ive
cont
rol
are
show
n fo
r 1
h (*
), 2
h (#
) an
d 4
h of
ce
ntrif
ugat
ion
(+).
*, #,
+: p
< 0
.05;
**,
##, +
+: p
< 0
.01;
***
, ###
, +++
: p <
0.0
01.

56
5.3.3 Lower compressive force on co-cultured cells
The pulse chase protocol was also applied to cells in co-culture submitted to a
compressive force of 47.4 g/cm2. Total RNA was isolated at 2, 4, 8 and 16 min after
CF loaded. And gene expressions of TNF, PTGS2, IL6, RUNX2 and P2RX7 were
measured using quantitative real-time PCR.
In hPDLF, TNF gene expression increased at 2 and 4 min and decrease at 8 and
16 min (p = 0.015) after the 1 h of CF. It was increased at 2 min and decreased at 4, 8
and 16 min (p = 0.002) after 2 h of CF. After 4 h, TNF gene expression was decreased
at 2 min (p = 0.002) and increased at 8 and 16 min (Figure 19A).
PTGS2 gene expression was upregulated at different chase points after 1 h of
CF. At 2 (p = 0.002), 4 and 16 min, PTGS2 gene expression was decreased after 4 h of
CF. And it showed significant increase at 2 min (p = 0.002) and decrease at 4
(p < 0.002) and 16 min (p < 0.002) after 2 h of CF in hPDLF (Figure 19C).
IL6 gene expression increased at 2 (p = 0.004) and 8 min after 2 h of CF and
decreased at four chase points after 4 h and at 4 min after 1 h of CF in hPDLF
(Figure 19E).
RUNX2 gene expression in hPDLF was downregulated at 8 and 16 min after
1 h of CF, at 8 min (p = 0.002) after 2 h of CF and at 2 min (p = 0.002) after 4 h of CF
(Figure 19G).
Concerning P2RX7 in hPDLF, the application of CF induced the gene
expression at 2 and 4 min (p = 0.002) after 1 h, at 2 min (p = 0.041) after 2 h and at 2
and 4 min (p = 0.015) after 4 h of CF (Figure 19I).

57
Fi
gure
19.
Rea
l-tim
e PC
R r
esul
ts o
f the
gen
e ex
pres
sion
of T
NF,
PTG
S2,
IL6,
RU
NX
2 an
d P
2RX
7 in
co-
cultu
red
hPD
LF a
nd h
OB
at 2
, 4,
8 a
nd 1
6 m
in a
fter
the
appl
icat
ion
of C
F at
47.
4 g/
cm2 f
or 1
, 2
and
4 h.
Val
ues
are
pres
ente
d as
mea
n ±
SD.
Stat
istic
al s
igni
fican
t di
ffere
nces
bet
wee
n ex
perim
enta
l con
ditio
n an
d ne
gativ
e co
ntro
l are
sho
wn
for
1 h
(*),
2 h
(#)
and
4 h
of c
entri
fuga
tion
(+).
*, #
, +: p
<
0.05
; **,
##, +
+: p
< 0
.01;
***
, ###
, +++
: p <
0.0
01.

58
In hOB, TNF gene expression showed significantly upregulated at 2 min
(p = 0.002) after 2 h and 8 (p = 0.002) and 16 min (p = 0.002) after 4 h of CF. But it
was downregulated at 16 min after 1 (p = 0.002) and 2 h (p = 0.004) and 4 min (p =
0.002) after 4 h of CF (Figure 19B). PTGS2 gene expression was increased at all the
chase points after 1 h and 2, 4 and 8 min after 2 h of CF (Figure 19D). The IL6 gene
expression was upregulated at different chase points after 1, 2 and 4 h of CF durations
except the 2 min after 1 h and 8 min after 4 h of CF (Figure 19F). Concerning the gene
expression of RUNX2 and P2RX7, slight decrease was observed at different chase
points independent of the CF durations except the 2 min after 1 h of CF (Figures 19H
and 19J).

59
6 Discussion
The effect of mechanical force on bone remodeling during orthodontic tooth
movement is yet mostly studied using mono-cultured cells in vitro (Jacobs et al. 2014;
Koyama et al. 2008). However, in vivo, the periodontal tissue represents a
heterogeneous population of different cell types which might be functionally closely
interrelated (Li et al. 2013a). During orthodontic tooth movement, these cells are
subjected to mechanical force simultaneously leading to more or less intensive
intercellular communication in this complex tissue microenvironment (Krishnan and
Davidovitch 2006; Morikawa et al. 2016). Therefore, co-culturing of various cell
types together seems more appropriate since it reflects the real physiological
conditions more closer and, in addition, enables the investigation of intercellular
communication in vitro (Hatherell et al. 2011). In this study, indirect-contact co-
culture was applied to identify any kind of communication between various
periodontal cell types, i.e. human periodontal ligament fibroblasts (hPDLF) and
human osteoblasts (hOB) when subjected to static compressive force (CF) application.
The indirect-contact co-culture model as used herein separated the hPDLF from the
hOB with a porous membrane but kept both cell types under common growth
conditions allowing signaling molecules and other mediators, e.g. cytokines, growth
factors and metabolites to pass the membrane unrestrictedly.
6.1 Technical aspects of the experimental design
6.1.1 Force application
Cellular and molecular responses occurred under orthodontic forces during
orthodontic therapy result in tooth movement. The bone remodeling markers and
histological changes and performs in different pattern in the compression side and
tension side of PDL (Otero et al. 2016). In orthodontic tooth movement, CF is an
essential factor for bone resorption (Wise and King 2008). In previous in vitro studies,
CF was applied using different methods such as hydrostatic pressure (Nakago-Matsuo

60
et al. 1996), direct weight application (Kanzaki et al. 2002), or even micro-gravity
(Carmeliet et al. 1998). Additionally, centrifugation for in vitro mechanical
stimulation of cells was also described (Baumert et al. 2004; Fitzgerald and Hughes-
Fulford 1999; Inoue et al. 1993; Redlich et al. 1998; Theilig et al. 2001).
In this study, centrifuge was used as the device to produce CF on mono- and
co-cultured primary cells (hPDLF and hOB). The force calculation was based on the
formula published by Redlich et al. (2004a; 2004b). Since growth area and the radius
of the centrifuge must be considered constant, force magnitudes can be varied via
changing centrifugation speed or volume (i.e. weight) of cell culture medium. In this
experimental setup, compressive forces of 47.4 and 73.7 g/cm2 were applied by
variation of the cell culture medium within each well of mono-cultured cells. These
forces are in the range of orthodontic force during tooth movement (Ren et al. 2003;
Wichelhaus 2017). The relevant inflammatory factors were measured and analyzed for
1, 2 and 4 h of force application. In mono-culture the induction of inflammatory
factors was more pronounced with the application of 47.4 g/cm2. Therefore, this CF
was chosen for the co-culture study (see below).
6.1.2 Cell viability
In this study, pressure type of force was applied using a conventional laboratory
centrifuge. This setup has been successfully applied in other studies (Baumert et al.
2004; Redlich et al. 1998) to impose CF on cells in vitro. Nevertheless, one of the
most important parameters for cell growth is the culture temperature. In in vitro
studies, most mammalian cells are cultivated at 37 °C to simulate the body
environment. Cultivation at temperatures below 37 °C will first slow down cell
metabolism (“Q10 rule”) and over longer periods of time will most probably induce
apoptosis and cell death. Only a few studies took this into account in their
experimental setup (Hacopian et al. 2011; Ueda et al. 2016).
The centrifuge used in these experiments operated at ranges between +4 °C and
+25 °C with active cooling. The temperature inside this centrifuge mainly depends on
the mass of the rotor, its speed, and factors such as the amount and mass of the

61
samples to be centrifuged and the intraday room temperature in the laboratory. After
longer periods of centrifugation the temperature within the centrifuge reached 30 °C,
but not in a constant and predictable manner. In agreement with the manufacturer we
tested several centrifuge presets using temperature data loggers to monitor and record
the temperature data within the centrifuge during centrifugation. Here, the
experimental temperature should fulfill two conditions: (1) a temperature closer to
physiological characteristic of the cells used and (2) a stable temperature during
centrifugation at predefined forces. Finally, CF was applied to cells with
centrifugation using the protocol shown in Section 4.3.1.3. Within the limitations of
the centrifuge, all experiments were run at 30 °C. The centrifuge was equilibrated to
this temperature using an additional pre-step (50 min at 800ug) before cells were
exposed to CF by centrifugation at 30 °C for 1, 2 and 4 h.
As mentioned above, decreased temperature can induce metabolic changes in
the cells. If this occurs over longer periods of time, apoptosis is induced. Apoptosis,
also known as “programmed cell death”, is accompanied by a series of characteristic
morphological and metabolic changes in cells undergoing apoptosis (Kerr et al. 1972;
McCance et al. 2010). Apoptosis is a naturally occurring process and basis of
differentiation and growth (Hale et al. 1996) and influences many physiological
processes, such as the immune system, embryonic development, metamorphosis and
hormone dependent atrophy, and of course cell death (Cohen et al. 1992; McCance et
al. 2010).
Apoptosis is divided into seven steps (Abcam 2017): 1. loss of membrane
asymmetry; 2. caspase, calpain and cathepsin activation; 3. mitochondrial membrane
potential and cytochrome c release; 4. nuclear condensation; 5. DNA fragmentation; 6.
Sub G1 population increase; 7. Cell membrane blabbing. These steps happen in
parallel and many of them overlap. “Loss of membrane asymmetry or initiation of
caspase cascade are biochemical featuresof apoptosis which do not necessarily lead
to cell death. However, other downstream features such as decrease of the
mitochondrial membrane potential and concomitant release of cytochrome C into the
cytosol, are generally considered points of no return, after which it is very unlikely the

62
cell will survive.” (Abcam 2017; p. 7) In this study, loss of membrane asymmetry,
change of the mitochondrial membrane potential and DNA fragmentation were
determined by annexin V-FITC, TMRE and Hoechst dye staining, respectively.
The influence of temperature on cell viability of hPDLF and hOB were tested
within the experimental conditions applied (at 30 °C, up to 4 h). In comparison to the
negative control (at 37 °C, up to 4 h), no apoptosis signs were observed after 4 h
incubation at 30 °C. The cells maintained their physiological characteristics during the
experimental conditions in this study. Hence, an experimental temperature at 30 °C is
feasible for in vitro experiments up to 4 h. This observation is in correspondence with
previous studies on PDLF viability after traumatic avulsion of permanent teeth (Souza
et al. 2010).
6.1.3 In vitro co-culture
Co-culture is an appropriate design reflecting a situation closer to physiology and thus
enabling the investigation of intra- and intercellular communication in vitro (Hatherell
et al. 2011; Morikawa et al. 2016). Two types of co-culture systems have been
reported: direct and indirect contact co-culture systems. Both are applied to co-
incubate two types of cells in the same optimal cell culture environment, which can
create a native functional condition to maintain cell features in vitro. In direct contact
system two types of cells get into contact with each other thus allowing to establish
direct cell-cell contacts and thus enabling intercellular communication (Jones et al.
2009). However, this may cause massive cell death of one cell type if the other one is
growing faster and thus outgrows the other. From the experimental point of view,
direct co-culture imposes technical challenges to isolate and purify a specific cell type
from a mixed co-culture cell population. Therefore, indirect contact co-culture models
were established to overcome this limitation. Both cell types are grown separately
from each other but share the same cell culture environment (Figure 3). In this study,
hPDLF and hOB are grown using the indirect co-culture method. Cell culture inserts
with a membrane containing pores small enough, that cells cannot migrate through,
were combined with 12-well plates to the reconstruct the co-culture system. HPDLF

63
and hOB share the same nourishment from two different areas: the insert itself and the
wells. Intercellular communication is taking place via releasing cytokines and growth
factors into the chamber and through the porous membrane. Both cell types can be
analyzed and assessed separately after mechanical stimulation. In this setup,
equivalent CF were loaded on two different types of cells simultaneously. According
to the calculation in Redlich et al. (1998), the CF loading on cells was 47.4 g/cm2 in
the well and 49.1 g/cm2 on cell culture insert respectively:
𝑃 = 𝑚 × 𝑟 × 𝑟𝑝𝑚2 × 𝜋2
𝐴 × 9.8 × 900
Force (P): 47.4 g/cm2 49.1 g/cm2 Mass of medium (m): 0.9 g (~900 µL) 0.28 g (~280 µL) Radius of centrifuge rotor (r): 0.160 m 0.1585 m Speed of centrifuge (rpm): 970 rpm 970 rpm Growth area of cells (A): 3.8 cm2 1.131 cm2
6.1.4 Sampling procedure
Two different sampling procedures are applied in studies related to CF application: (1)
samples are drawn directly after force application (“direct sampling”) or (2) “pulse
chase sampling”. With “pulse chase sampling”, force (i.e. the “pulse”) is applied to the
specimen for a defined period of time. Then, samples are drawn at defined time
intervals after force application stopped.
“Direct sampling” after force application is easy to handle and widely used in
many studies (e.g. Morikawa et al. 2016; Redlich et al. 2004a). Since duration of
sampling is not stated in any publication, results are not comparable between studies.
“Pulse chase sampling”, on the other hand, enables to study the effect of a stress
application over a longer period of time (Baumert et al. 2004). Gene expression and
translation takes time and this time differs between different genes. Some genes are
rapidly transcribed after stimulation, so called “primary” or “early” response genes,
such as EGR1, ATF3, IL1B. Some genes are induced more slowly and are called

64
“secondary” or “late” response gene, such as IL6 and TNF (Sandoval et al. 2016). This
can be exemplified by two different studies, both applying “pulse-chase” sampling.
Matsunaga et al. (2016) applied 12 h constant pressure on human cementoblasts using
the weight approach. At 0, 7, 14 and 21 days after force release, they collected samples
and analyzed gene expression of RUNX2, WNT5A, ALP, and SPON1. Baumert et al.
(2004), on the other hand, applied centrifugation force on human osteoblasts for 45
and 90 min. Sampling took place at 2, 4, 8, 16 and 32 min after centrifugation stopped
and RUNX2 expression was analyzed in these samples.
In this study, samples were collected at 2, 4, 8 and 16 min after 1, 2 and 4 h of
centrifugation/incubation. The results showed that gene expression always varies at
different time points after mechanical force in both mono- and co-culture setups.
Namely, the changes of gene expression and protein synthesis sustain even after CF
application. Hence, the pulse chase multi-sampling would be necessary in future
studies to monitor a dynamic process of gene expression and protein synthesis after
mechanical stimulation.
6.2 Expression of genes and metabolites
Orthodontic tooth movement is a process of bone remodeling under mechanical force
stimulation. Periodontal tissue cells surrounding tooth release some inflammatory
factors which affect formation and absorption of bone via regulating gene expression
and protein synthesis during this process. In this study, mechanical forces were applied
on mono- (47.4 and 73.7 g/cm2) and co-cultured (47.4 g/cm2) hPDLF and hOB. Gene
expression of several related inflammatory factors (TNF� IL6, PTGS2), the
transcription factor RUNX2 and the purinergic receptor P2RX7, were analyzed using
quantitative real-time PCR for the different experimental conditions. After evaluation
of different reference genes for qRT-PCR, B2M was selected as the reference gene.
Protein synthesis (IL6, TNF) or metabolite production (PGE2) were determined using
ELISA.
65
6.2.1 TNF, IL6, PTGS2 and PGE2
Cytokines regulate the inflammatory reaction after orthodontic force application on
periodontal tissue cells (Li et al. 2013b). In this study, we found that the inflammatory
cytokines TNF, PTGS2 and IL6 were regulated after CF application in a duration and
culture type depending manner under the CF of 47.4 g/cm2. Gene expression of TNF,
PTGS2 and IL6 after all three durations (1, 2 and 4 h) of CF is upregulated in mono-
cultured hPDLF and hOB, as well as the production of PGE2 and IL6. With one
exception (2 h CF in hOB), gene expression downregulation and decreased ratios of
CF vs. control were found for TNF, PTGS2 and IL6 in co-cultured hPDLF and hOB
compared to mono-culture. This correlates with the results of PGE2 and IL6 ELISA
measurements. In light of these findings, CF did increase the gene expression of
TNF�� PTGS2 and IL6 after 1, 2 and 4 h of CF in mono-culture setup and most of
durations in co-culture setup in both cell types. Similar findings were reported in
other studies (Kanzaki et al. 2002; Koyama et al. 2008; Mayahara et al. 2007; Römer
et al. 2013). In contrast, after 2 h of CF application in hOB co-cultured with hPDLF,
increased ratios of CF vs. control were found in TNF, PTGS2 and IL6 gene expression,
compared to the mono-culture situation (Table 2). These findings are supported by
ELISA measurements of PGE2 and IL6. Previous studies applying co-culture showed
that this cultivation technique promotes the expression of inflammatory cytokines
after mechanical force (Morikawa et al. 2016). Therefore, intercellular
communication might facilitate the gene expression of TNF, PTGS2 and IL6 in hOB
co-cultured with hPDLF.
The aforementioned inflammatory cytokines are part of the TNF signaling
pathway (KEGG pathway #ko04668; Manyam et al. 2015) regulating bone remodeling.
More specifically, TNF is as a pro-inflammatory cytokine. It inhibits osteoblastic bone
formation, enhances osteoclastic bone resorption and induces bone loss accordingly
(Koyama et al. 2008; Kuno et al. 1994). PTGS2 is an enzyme involved in periodontal
inflammatory responses (Römer et al. 2013) and its gene expression is upregulated
after force application (Kanzaki et al. 2002). PTGS2 plays a central role in PGE2
biosynthesis and is therefore relevant to the formation of PGE2 during inflammatory

66
reaction (Kanzaki et al. 2002). In a previous study, the authors suggested that PGE2
production in response to mechanical force can be contributed to the upregulation of
PTGS2 gene expression after force application (Shimizu et al. 1998). Additionally, IL6
is a critical regulatory factor affecting the development of skeleton (De Benedetti et al.
2006). Lack of IL6 can lower bone mass (Baker et al. 1999) via reducing numbers of
osteoblasts (Bakker et al. 2014; Yang et al. 2007). Exogenous IL6 can enhance
osteogenic differentiation of osteoblasts by affecting signaling molecule production
(Bakker et al. 2014). Additionally, appropriate levels of mechanical force induce the
secretion of IL6 (Jacobs et al. 2014; Koyama et al. 2008) which reduces bone loss
(Baker et al. 1999).
Taken together, the reported in vitro findings support the establishment of
bone resorption at the compression side during orthodontic tooth movement (Wise
and King 2008). However, due to the considerable differences between mono- and co-
culture results, intercellular communication (Kim et al. 2006; Kook et al. 2009;
Mayahara et al. 2012) might exist between co-cultured hPDLF and hOB, leading to a
downregulation of TNF, PTGS2 and IL6 gene expression after CF application. This
downregulation in co-culture setup might, to some extent, influence the speed of bone
resorption during orthodontic tooth movement.
Concerning the “pulse chase” design applied gene expression of TNF, PTGS2
and IL6 in both hPDLF and hOB varies from chase to chase after 1, 2 and 4 h of CF
durations in mono- and co-cultured setups. Namely, the application of CF could
induce gene regulation of TNF, PTGS2 and IL6, and this was still detectable up to
16 min. These findings show that “pulse chase” sampling is a feasible way to explore
delayed reactions over time in cells after experimental stimulations.
6.2.2 Runt-related transcription factor 2 (RUNX2)
RUNX2, one of the major genes of bone growth equilibrium, is essential for the
differentiation of osteoblasts from uniform progenitor cells. Loss of RUNX2 hinders
the differentiation of osteoblast (Komori et al. 1997). RUNX2, thereby, is considered
as a main gene for bone development and contributes a lot on signal transduction

67
pathways (Ducy et al. 1997). Additionally, RUNX2 influences bone matrix deposition
and factors like BMP growth factor group in differentiated osteoblasts (Ducy et al.
1999). RUNX2 binding sites exist in regulatory parts of some major osteoblast-
specific genes, such as osteocalcin, alkaline phosphatase, and the type-I collagen
(Ducy et al. 1997; Harada et al. 1999; Kern et al. 2001).
In this study, gene expression of RUNX2 was analyzed with quantitative real-
time PCR after application of different magnitude of force (47.4 and 73.7 g/cm2) in
mono- and co-cultured hPDLF and hOB. The results demonstrate nearly no variations
independent of force magnitude and cell type. Only after 4 h of CF application in
hPDLF, the RUNX2 gene expression increased apparently, and this upregulation was
more obvious under 47.4 g/cm2 CF. Taken together, the presented results show, that
mechanical force influenced the RUNX2 gene expression, and a lighter CF was more
efficient than a heavier one. It may indicate that mechanical force affects the bone
remodeling in a certain extent, lower force can improve the efficiency of this process.
In co-culture, RUNX2 gene expression decreased in comparison to mono-culture setup
independent of force durations or cell types. Applying the “pulse chase” design,
samples were analyzed at 2, 4, 8 and 16 min after 1, 2 and 4 h of CF application on
cells in mono- and co-culture. No clear pattern in relation to force magnitude in
RUNX2 gene expression was detectable, neither in mono- nor in co-culture or between
the different force durations.
6.2.3 Purinergic receptor P2RX7
P2RX7 receptor is an adenosine triphosphate (ATP)-gated ionotropic channel and
plays a crucial role in bone biology and inflammation (North 2002). After binding of
extracellular ATP, a cellular stress signal that is also released with mechanical stress,
P2RX7 can be activated (Brough et al. 2003; Li et al. 2005; Milner et al. 1990;
Schneider et al. 2006). This process leads to accumulation of intracellular calcium and
the release of fundamental inflammatory mediators, such as PGE2, IL1A, and IL1B,
which regulate bone physiology (Ferrari et al. 2006; Lister et al. 2007). Another major
function of P2RX7 is to accelerate necrotic tissue metabolism. However, the role of

68
P2RX7 in bone remodeling during orthodontic tooth movement is still unclear
(Viecilli et al. 2009).
In this study, P2RX7 gene expression of was analyzed with quantitative real-
time PCR after force application on hPDLF and hOB in mono- (47.4 and 73.7 g/cm2)
and co-culture (47.4 g/cm2). In mono-culture, P2RX7 gene expression in both cell
types showed very slight upregulation after all three force durations under both
magnitude of force. A higher level of P2RX7 gene expression was found at 47.4 g/cm2
CF in comparison to 73.7 g/cm2 CF application. It can be concluded, that mechanical
force application influences P2RX7 gene expression and this effect is stronger under
lower CF. Comparing both culture conditions, P2RX7 gene expression either
decreased or remained at the same level in co-culture if the same CF was applied. In
co-culture P2RX7 gene expression might therefore be regulated by a paracrine
mechanism, e.g. by increasing extracellular ATP concentration (Brough et al. 2003; Li
et al. 2005; Milner et al. 1990; Schneider et al. 2006).
Concerning pulse chase measurements, samples were analyzed at 2, 4, 8 and
16 min after CF application. P2RX7 gene expression showed similar changes as
RUNX2 gene expression. In this case also, clear patterns related to force magnitude,
force duration or culture conditions were not detectable.
6.3 Outlook There are still some limitations in this study that can be further developed. Firstly, co-
cultured two types of primary cells (hPDLF and hOB) were investigated in this study.
Other types of cells, however, including osteoclasts, blood cells and bone marrow
cells, also participate in bone remodeling during orthodontic tooth movement.
Thereby, multi-culture setup would be considered in further studies. Secondly, in the
present study, centrifuge was used for CF loading. Both temperature condition and
force magnitude are related to the rolling speed of the centrifuge. It is limited to
maintain the temperature at 37 °C with a demanding magnitude of force. Therefore,
an innovative way could be developed to equilibrate the conditions for an optimal
study setup.

69
7 Conclusion
Primary cells, human periodontal ligament fibroblasts (hPDLF) and osteoblasts (hOB)
can survive at least for 4 h at 30 °C. Hence, culture temperature at 30 °C would be
available for in vitro experiment within 4 h.
Mechanical force induces inflammatory reaction accompanied by sequence of
cytokine regulations. These regulations influence bone remodeling which is the base
of orthodontic tooth movement. Therefore, an optimal mechanical force for an
effective tooth movement without side effects is desirable.
Our data indicate CF can induce the gene expression of TNF, PTGS2, IL6,
RUNX2 and P2RX7 and protein synthesis of PGE2 and IL6 in hPDLF and hOB.
Communication might exist between co-cultured hPDLF and hOB subjected to CF to
some extent, leading to a dominant inhibition effect on TNF, PTGS2, IL6, RUNX2 and
P2RX7 gene expression and PGE2 and IL6 protein synthesis compared to that in
mono-cultured setup.
Cell reactions could be observed at least 16 min after stimulations. Namely,
gene expression and protein synthesis keep varying for a period of time even after the
termination of stimulation. Accordingly pulse chase setup is a feasible way to
investigate the delayed reactions. Moreover, a fixed time point for collecting samples
after mechanical stimulation is essential to make results comparable between different
studies.

70
8 Summary
This study established an in vitro model to investigate the intra- and intercellular communication in co-cultured human periodontal ligament fibroblasts (hPDLF) and osteoblasts (hOB) and the changes in gene expression for selected genes after mechanical force loading. Identical procedures were applied to both cell types in mono-culture for comparison purposes. Mono- and co-cultured hPDLF and hOB were subjected to CF (47.4 or
73.7 g/cm2) for 1, 2 and 4 h at 30 °C respectively. Control cells received same treatment in parallel without force application. After each centrifugation/incubation, samples (i.e. cell culture supernatants, cell lysates) were collected at 2, 4, 8, and 16 min. From each of the cell lysates, total RNA was isolated and reverse transcribed to cDNA. Gene expression of tumor necrosis factor alpha (TNF), prostaglandin-endoperoxide synthase 2 (PTGS2), interleukin 6 (IL6), runt-related transcription factor 2 (RUNX2) and purinergic receptor P2RX7 were determined using quantitative real-time polymerase chain reaction. Productions of TNF, IL6 and Prostaglandin E2 (PGE2) were determined using enzyme-linked immunosorbent assay (ELISA). The results show, that (1) an in vitro model applicable to both in mono- and co-culture setups was successfully established. Within the experimental conditions applied, no significant induction of apoptosis within 4 h at 30 °C in comparison to 37 °C was detected. (2) Mechanical force induces gene expression in several inflammatory reaction-related cytokines and other genes of interest, which may influence orthodontic tooth movement. (3) Intercellular communication (paracrine regulation) between co-cultured hPDLF and hOB subjected to mechanical stimulation may exist. (4) Gene expression and protein synthesis of those genes and their gene products/metabolites analyzed varied even after termination of mechanical stimulation.
In future in vitro studies, the experimental temperature should be carefully considered and monitored. The developed and established indirect co-culture model is an innovative way to simulate a situation close to the physiological condition. “Pulse chase” sampling should be applied to investigate more precisely the dynamics in gene expression and protein synthesis after mechanical stimulation.

71
9 Zusammenfassung
In der vorgelegten Studie wurde ein in vitro Modell zur Untersuchung der intra- und interzellulären Kommunikation in ko-kultivierten humanen parodontalen Ligamentzellen (hPDLF) und Osteoblasten (hOB) etabliert und die Genexpression ausgewählter Gene nach Kraftapplikation untersucht. Zur Kontrolle wurden beide Zelltypen in Mono-Kultur denselben Kräften unterworfen. Die anschließende Analyse erfolge analog. Mono- und ko-kultivierte hPDLF und hOB wurden zentrifugalem Druck (47,4 bzw. 73,7 g/cm2) für 1, 2 und 4 Stunden bei 30 °C ausgesetzt. Als Kontrolle dienen Zellen, die den gleichen Kultivierungs- und Temperaturbedingungen unterworfen wurden, aber keinem Druck ausgesetzt waren. Vor der eigentlichen Zentrifugation und 2, 4, 8 und 16 Minuten nach jeder Zentrifugation bzw. Inkubation wurden Proben (Zelllysat, Zellkulturüberstand) genommen. Aus den Zelllysaten wurde die Gesamt-RNA isoliert und in cDNA umgeschrieben. Die Genexpression von Tumornekrosefaktor-α (TNF), Prostaglandinsynthase-2 (PTGS2), Interleukin 6 (IL6), Runt-related Transkriptionsfaktor 2 (RUNX2) und P2X-Purinorezeptor 7 (P2RX7) wurden mittels quantitativer Realtime-PCR bestimmt. Die Produktion von IL6, TNF und Prostaglandin E2 (PGE2) wurden mittel ELISA („Enzyme-Linked ImmunoSorbent Assay“) ermittelt. Die Ergebnisse zeigen, dass (1) ein in vitro Modell erfolgreich entwickelt wurde, das sowohl für Zellen in Mono- als auch Ko-Kultur angewandt werden kann. Innerhalb der experimentellen Parameter wurde keine Apoptose-Induktion innerhalb von 4 Stunden bei 30 °C im Vergleich zu 37 °C beobachtet. (2) Mechanische Druckeinwirkung induziert die Genexpression mehrere an der Entzündungsreaktion beteiligter Zyktokine und andere Gene von Interesse. Dies könnte die kieferorthopädische Zahnbewegung beeinflussen. (3) Die Ergebnisse deuten auf eine interzelluläre Kommunikation (parakrine Regulation) zwischen ko-kultivierten Zellen unterschiedlichen Typs hin, die beide einer mechanischen Stimulation ausgesetzt waren. (4) Genexpression und Proteinsynthese der untersuchten Gene bzw. Metabolite variieren nach Abschluss der mechanischen Stimulation.
In zukünftigen Forschungsprojekten sollte die Temperatur ein bedeutender Faktor bei der Durchführung von in vitro Experimenten sein. Das indirekte Ko-Kulturmodell ist ein innovativer und praktischer Weg, um die in vivo Situation zu simulieren. Probenahme nach dem „pulse chase“-Prozedere ermöglicht präzisere zeitliche Aussagen bezüglich der Dynamik von Genexpression und Proteinsynthese nach mechanischer Stimulation.
72
10 References
Abcam (2017). Apoptosis - Tools for cell death series 1 Cambridge, UK: Abcam plc. URL: www.abcam.com/apoptosis (19-02-2018).
Alhashimi N, Frithiof L, Brudvik P, Bakhiet M (2001). Orthodontic tooth movement and de novo synthesis of proinflammatory cytokines. Am J Orthod Dentofacial Orthop; 119(3):307-12.
Alikhani M, Alikhani Z, Raptis M, Graves DT (2004). TNF-D in vivo stimulates apoptosis in fibroblasts through caspase-8 activation and modulates the expression of pro-apoptotic genes. J Cell Physiol; 201(3):341-8.
Baker PJ, Dixon M, Evans RT, Dufour L, E. J, D.C. R (1999). CD4+ T cells and the proinflammatory cytokines gamma interferon and interleukin-6 contribute to alveolar bone loss in mice. Infect Immun; 67:2804-2809.
Bakker AD, Kulkarni RN, Klein-Nulend J, Lems WF (2014). IL-6 alters osteocyte signaling toward osteoblasts but not osteoclasts. J Dent Res; 93(4):394-9.
Balto K, Sasaki H, Stashenko P (2001). Interleukin-6 deficiency increases inflammatory bone destruction. Infect Immun; 69(2):744-50.
Baumert U, Golan I, Becker B, Hrala BP, Redlich M, Roos HA, Reichenberg E, Palmon A, Müßig D (2004). Pressure simulation of orthodontic force in osteoblasts: a pilot study. Orthod Craniofacial Res 7:3-9.
Baumert U, Golan I, Redlich M, Aknin JJ, Muessig D (2005). Cleidocranial dysplasia: molecular genetic analysis and phenotypic-based description of a Middle European patient group. Am J Med Genet A; 139A(2):78-85.
Beertsen W, McCulloch CA, Sodek J (1997). The periodontal ligament: a unique, multifunctional connective tissue. Periodontol 2000; 13:20-40.
Bellido T, Borba VZ, Roberson P, Manolagas SC (1997). Activation of the Janus kinase/STAT (signal transducer and activator of transcription) signal transduction pathway by interleukin-6-type cytokines promotes osteoblast differentiation. Endocrinology; 138(9):3666-76.
Berkovitz BK (1990). The structure of the periodontal ligament: an update. Eur J Orthod; 12(1):51-76. Bertolini DR, Nedwin GE, Bringman TS, Smith DD, Mundy GR (1986). Stimulation of bone resorption
and inhibition of bone formation in vitro by human tumour necrosis factors. Nature 319:516-518.
Brough D, Le Feuvre RA, Wheeler RD, Solovyova N, Hilfiker S, Rothwell NJ, Verkhratsky A (2003). Ca2+
stores and Ca2+ entry differentially contribute to the release of IL-1E and IL-1D from murine macrophages. J Immunol; 170(6):3029-36.
Carmeliet G, Nys G, Stockmans I, Bouillon R (1998). Gene expression related to the differentiation of osteoblastic cells is altered by microgravity. Bone; 22(5 Suppl):139S-143S.
Chambers TJ, Evans M, Gardner TN, Turner-Smith A, Chow JWM (1993). Induction of bone formation in rat tail vertebrae by mechanical loading. Bone Miner; 20(2):167-178.
Cohen JJ, Duke RC, Fadok VA, Sellins KS (1992). Apoptosis and programmed cell death in immunity. Annu Rev Immunol; 10:267-293.
Colden M, Dar AA, Saini S, Dahiya PV, Shahryari V, Yamamura S, Tanaka Y, Stein G, Dahiya R, Majid S (2017). MicroRNA-466 inhibits tumor growth and bone metastasis in prostate cancer by direct regulation of osteogenic transcription factor RUNX2. Cell Death Dis; 8(1):e2572.
Davidovitch Z (1991). Tooth movement. Crit Rev Oral Biol Med 2(4):411- 450.

73
De Benedetti F, Rucci N, Del Fattore A, Peruzzi B, Paro R, Longo M, Vivarelli M, Muratori F, Berni S, Ballanti P, Ferrari S, Teti A (2006). Impaired skeletal development in interleukin-6-transgenic mice: a model for the impact of chronic inflammation on the growing skeletal system. Arthritis Rheum; 54(11):3551-63.
Ducy P, Zhang R, Geoffroy V, Ridall AL, Karsenty G (1997). Osf2/Cbfa1: a transcriptional activator of osteoblast differentiation. Cell; 89:747-754.
Ducy P, Starbuck M, Priemel M, Shen J, Pinero G, Geoffroy V (1999). A Cbfa1-dependent genetic pathway controls bone formation beyond embryonic development. Genes Dev; 13:1025–1036.
Ducy P, Schinke T, Karsenty G (2000). The osteoblast: a sophisticated fibroblast under central surveillance. Science; 289:1501–1504.
Ferrari D, Pizzirani C, Adinolfi E, Lemoli RM, Curti A, Idzko M, Panther E, Di Virgilio F (2006). The P2X7 receptor: a key player in IL-1 processing and release. J Immunol; 176(7):3877-3883.
Fitzgerald J, Hughes-Fulford M (1999). Mechanically induced c-fos expression is mediated by cAMP in MC3T3-E1 osteoblasts. FASEB J; 13(3):553-7.
Garlet TP, Coelho U, Silva JS, Garlet GP (2007). Cytokine expression pattern in compression and tension sides of the periodontal ligament during orthodontic tooth movement in humans. Eur J Oral Sci; 115:355–362.
Green MR, Sambrook J (2012). Molecular Cloning: A Laboratory Manual; Volume 1. 4th Ed. Cold Spring Harbor, New York: Cold Spring Harbor Laboratory Press.
Grimm S, Walter C, Pabst A, Goldschmitt J, Wehrbein H, Jacobs C (2015). Effect of compressive loading and incubation with clodronate on the RANKL/OPG system of human osteoblasts. J Orofac Orthop; 76(6):531-42.
Hacopian N, Nik TH, Ghahremani MH, Rahimi HR, Ostad SN (2011). Effects of Continuous and Interrupted Forces on Gene Transcription in Periodontal Ligament Cells in Vitro. Acta Medica Iranica; 49(10):643-649.
Hale AJ, Smith CA, Sutherland LC, Stoneman VE, Longthorne V, Culhane AC, Williams GT (1996). Apoptosis: molecular regulation of cell death. Eur J Biochem; 236(3):1-26.
Harada H, Tagashira S, Fujiwara M, Ogawa S, Katsumata T, Yamaguchi A (1999). Cbfa1 isoforms exert functional differences in osteoblast differentiation. J Biol Chem 274:6972–6978.
Hatherell K, Couraud PO, Romero IA, Weksler B, Pilkington GJ (2011). Development of a three-dimensional, all-human in vitro model of the blood-brain barrier using mono-, co-, and tri-cultivation Transwell models. J Neurosci Methods; 199(2):223-9.
Hla T, Neilson K (1992). Human cyclooxygenase-2 cDNA. Proc Natl Acad Sci U S A; 89(16):7384-8. Hughes-Fulford M, Lewis ML (1996). Effects of microgravity on osteoblast growth activation. Exp Cell
Res; 224(1):103-9. Inoue H, Nakamura O, Duan Y, Hiraki Y, Sakuda M (1993). Effect of centrifugal force on growth of
mouse osteoblastic MC3T3-E1 cells in vitro. J Dent Res; 72(9):1351-5. Jacobs C, Walter C, Ziebart T, Grimm S, Meila D, Krieger E, Wehrbein H (2014). Induction of IL-6 and
MMP-8 in human periodontal fibroblasts by static tensile strain. Clin Oral Investig; 18(3):901-8.
Jones DA, Carlton DP, Mclntyre TM, Zimmerman GA, Prescott SM (1993). Molecular cloning of human Prostaglandin endoperoxide synthase type II and demonstration of expression in response to cytokines. J Biol Chem; 268:9049-9054.

74
Jones GL, Motta A, Marshall MJ, El Haj AJ, Cartmell SH (2009). Osteoblast: osteoclast co-cultures on silk fibroin, chitosan and PLLA films. Biomaterials; 30(29):5376-84.
Kanjanamekanant K, Luckprom P, Pavasant P (2013). Mechanical stress-induced interleukin-1beta expression through adenosine triphosphate/P2X7 receptor activation in human periodontal ligament cells. J Periodontal Res; 48(2):169-76.
Kanzaki H, Chiba M, Shimizu Y, Mitani H (2002). Periodontal ligament cells under mechanical stress induce osteoclastogenesis by receptor activator of nuclear factor kappaB ligand up-regulation via prostaglandin E2 synthesis. J Bone Miner Res; 17(2):210–220.
Kariya T, Tanabe N, Shionome C, Manaka S, Kawato T, Zhao N, Maeno M, Suzuki N, Shimizu N (2015). Tension force-induced ATP promotes osteogenesis through P2X7 receptor in osteoblasts. J Cell Biochem; 116(1):12-21.
Katagiri T, Takahashi N (2002). Regulatory mechanisms of osteoblast and osteoclast differentiation. Oral Dis; 8(3):147-59.
Kern B, Shen J, Starbuck M, Karsenty G (2001). Cbfa1 contributes to the osteoblast-specific expression of type I collagen genes. J Biol Chem; 276(10):7101-7.
Kerr JFR, Wyllie AH, Currie AR (1972). Apoptosis: a basic biological phenomenon with wide-ranging implications in tissue kiinetics Br J Cancer; 26(4):239-257.
Kim CH, You L, Yellowley CE, Jacobs CR (2006). Oscillatory fluid flow-induced shear stress decreases osteoclastogenesis through RANKL and OPG signaling. Bone; 39(5):1043-7.
Kim SJ, Park KH, Park YG, Lee SW, Kang YG (2013). Compressive stress induced the up-regulation of M-
CSF, RANKL, TNF-D expression and the down-regulation of OPG expression in PDL cells via the integrin-FAK pathway. Arch Oral Biol; 58(6):707-16.
Kitaura H, Kimura K, Ishida M, Sugisawa H, Kohara H, Yoshimatsu M, Takano-Yamamoto T (2014). Effect of cytokines on osteoclast formation and bone resorption during mechanical force loading of the periodontal membrane. ScientificWorldJournal; 2014:617032.
Klein DC, Raisz LG (1970). Prostaglandins: stimulation of bone resorption in tissue culture. Endocrinology; 86(6):1436-40.
Komori T, Yagi H, Nomura S, Yamaguchi A, Sasaki K, Deguchi K (1997). Targeted disruption of Cbfa1 results in a complete lack of bone formation owing to maturational arrest of osteoblasts. Cell 89:755–764.
Kook SH, Son YO, Hwang JM, Kim EM, Lee CB, Jeon YM, Kim JG, Lee JC (2009). Mechanical force inhibits osteoclastogenic potential of human periodontal ligament fibroblasts through OPG production and ERK-mediated signaling. J Cell Biochem; 106(6):1010-9.
Koyama Y, Mitsui N, Suzuki N, Yanagisawa M, Sanuki R, Isokawa K, Shimizu N, Maeno M (2008). Effect of compressive force on the expression of inflammatory cytokines and their receptors in osteoblastic Saos-2 cells. Arch Oral Biol; 53(5):488-96.
Kraemer SA, Meade EA, DeWitt DL (1992). Prostaglandin endoperoxide synthase gene structure: identification of the transcriptional start site and 5'-flanking regulatory sequences. Arch Biochem Biophys; 293(2):391-400.
Krishnan V, Davidovitch Z (2006). Cellular, molecular, and tissue-level reactions to orthodontic force. Am J Orthod Dentofacial Orthop; 129(4):469 e1-32.
Kujubu DA, Herschman HR (1992). Dexamethasone inhibits mitogen induction of the TIS 10 prostaglandin synthase/cyclooxygenase gene. J Biol Chem 267:7991-7994.
Kuno H, Kurian SM, Hendy GN, White J, deLuca HF, Evans CO, Nanes MS (1994). Inhibition of 1,25-

75
dihydroxyvitamin D3 stimulated osteocalcin gene transcription by tumor necrosis factor-D: structural determinants within the vitamin D response element. Endocrinology; 134(6):2524-31.
Lanyon LE (1992). The success and failure of the adaptive response to functional load-bearing in averting bone fracture. Bone; 13 Suppl 2:S17-21.
Lee SH, Soyoola E, Chanmugam R (1992). Selective expression of mitogen-inducible cyclooxygenase in macrophages stimulated with lipopolysaccharide. J Biol Chem; 267:25934-25938.
Lekic P, McCulloch CA (1996). Periodontal ligament cell population: the central role of fibroblasts in creating a unique tissue. Anat Rec; 245(2):327-41.
Li J, Liu D, Ke HZ, Duncan RL, Turner CH (2005). The P2X7 nucleotide receptor mediates skeletal mechanotransduction. J Biol Chem; 280(52):42952-9.
Li J, Chen G, Zheng L, Luo S, Zhao Z (2007). Osteoblast cytoskeletal modulation in response to compressive stress at physiological levels. Mol Cell Biochem; 304(1-2):45-52.
Li J, Wan Z, Liu H, Li H, Liu L, Li R, Guo Y, Chen W, Zhang X, Zhang X (2013a). Osteoblasts subjected to mechanical strain inhibit osteoclastic differentiation and bone resorption in a co-culture system. Ann Biomed Eng; 41(10):2056-66.
Li Y, Li M, Tan L, Huang S, Zhao L, Tang T, Liu J, Zhao Z (2013b). Analysis of time-course gene expression profiles of a periodontal ligament tissue model under compression. Arch Oral Biol; 58(5):511-22.
Lister MF, Sharkey J, Sawatzky DA, Hodgkiss JP, Davidson DJ, Rossi AG, Finlayson K (2007). The role of the purinergic P2X7 receptor in inflammation. J Inflamm (Lond); 4:5.
Liu J, Zhao Z, Zou L, Li J, Wang F, Li X, Zhang J, Liu Y, Chen S, Zhi M, Wang J (2009). Pressure-loaded MSCs during early osteodifferentiation promote osteoclastogenesis by increase of RANKL/OPG ratio. Ann Biomed Eng; 37(4):794-802.
Long P, Hu J, Piesco N, Buckley M, Agarwal S (2001). Low magnitude of tensile strain inhibits IL-1E-dependent induction of pro-inflammatory cytokines and induces synthesis of IL-10 in human periodontal ligament cells in vitro. J Dent Res; 80(5):1416-20.
Madureira DF, da Silva JM, Teixeira AL, Abreu MH, Pretti H, Lages EM, da Silva TA (2015). Cytokine measurements in gingival crevicular fluid and periodontal ligament: Are they correlated? Am J Orthod Dentofacial Orthop; 148(2):293-301.
Maeda A, Soejima K, Bandow K, Kuroe K, Kakimoto K, Miyawaki S, Okamoto A, Matsuguchi T (2007). Force-induced IL-8 from periodontal ligament cells requires IL-1beta. J Dent Res; 86(7):629-34.
Mah S-J, Lee Y, Chun Y-S, Lim WH (2014). Expression of MMP-9 and -13 on the Pressure Side under Orthodontic Loading. Open Journal of Stomatology; 04(08):412-417.
Manyam G, Birerdinc A, Baranova A (2015). KPP: KEGG Pathway Painter. BMC Syst Biol; 9 Suppl 2:S3. Matsunaga K, Ito C, Nakakogawa K, Sugiuchi A, Sako R, Furusawa M, Muramatsu T (2016). Response to
light compressive force in human cementoblasts in vitro. Biomedical Research 37(5):293–298.
Mayahara K, Kobayashi Y, Takimoto K, Suzuki N, Mitsui N, Shimizu N (2007). Aging stimulates cyclooxygenase-2 expression and prostaglandin E2 production in human periodontal ligament cells after the application of compressive force. J Periodontal Res; 42(1):8-14.
Mayahara K, Yamaguchi A, Takenouchi H, Kariya T, Taguchi H, Shimizu N (2012). Osteoblasts stimulate osteoclastogenesis via RANKL expression more strongly than periodontal ligament cells do in

76
response to PGE2. Arch Oral Biol; 57(10):1377-84. McCance KL, Huether SE, Brashers VL, Rote NS (2010). Pathophysiology - The Biologic Basis for Disease
in Adults and Children. 6th Ed. Maryland Heights, Missouri, USA: Mosby Elsevier. Meazzini MC, Toma CD, Schaffer JL (1998). Osteoblast cytoskeletal modulation in response to
mechanical strain in vitro. J Orthop Res 16:170–180. Milner P, Bodin P, Loesch A, Burnstock G (1990). Rapid release of endothelin and ATP from isolated
aortic endothelial cells exposed to increased flow. Biochem Biophys Res Commun; 170(2):649-56.
Mitchell DL, West JD (1975). Attempted orthodontic movement in the presence of suspected ankylosis. Am J Orthod; 68(4):404-11.
Morikawa T, Matsuzaka K, Nakajima K, Yasumura T, Sueishi K, Inoue T (2016). Dental pulp cells
promote the expression of receptor activator of nuclear factor-NB ligand, prostaglandin E2 and substance P in mechanically stressed periodontal ligament cells. Arch Oral Biol; 70:158-164.
Nakago-Matsuo C, Matsuo T, Nakago T (1996). Intracellular calcium response to hydraulic pressure in human periodontal ligament fibroblasts. Am J Orthod Dentofacial Orthop; 109(3):244-8.
Nakao K, Goto T, Gunjigake KK, Konoo T, Kobayashi S, Yamaguchi K (2007). Intermittent force induces high RANKL expression in human periodontal ligament cells. J Dent Res; 86(7):623-8.
Ng KW, Schantz J-T (2010). A Manual for Primary Human Cell Culture. [Manuals in Biomedical Research; 6] 2nd Ed. New Jersey: World Scientific.
North RA (2002). Molecular physiology of P2X receptors. Physiol Rev; 82(4):1013-67. O'Neill GP, Ford-Hutchinson AW (1993). Expression of mRNA for cyclooxygenase-1 and
cyclooxygenase-2 in human tissues. FEBS Lett; 330(2):156-60. Otero L, Garcia DA, Wilches-Buitrago L (2016). Expression and Presence of OPG and RANKL mRNA and
Protein in Human Periodontal Ligament with Orthodontic Force. Gene Regul Syst Bio; 10:15-20.
Pavalko FM, Gerard RL, Ponik SM, Gallagher PJ, Jin Y, Norvell SM (2003). Fluid shear stress inhibits TNF-alpha-induced apoptosis in osteoblasts: a role for fluid shear stress-induced activation of PI3-kinase and inhibition of caspase-3. J Cell Physiol; 194(2):194-205.
Ralston SH, Russell RG, Gowen M (1990). Estrogen inhibits release of tumor necrosis factor from peripheral blood mononuclear cells in postmenopausal women. J Bone Miner Res; 5(9):983-8.
Redlich M, Palmon A, Zaks B, Geremi E, Rayzman S, Shoshan S (1998). The effect of centrifugal force on the transcription levels of collagen type I and collagenase in cultured canine gingival fibroblasts. Arch Oral Biol (43):313–316.
Redlich M, Asher Roos H, Reichenberg E, Zaks B, Mussig D, Baumert U, Golan I, Palmon A (2004a). Expression of tropoelastin in human periodontal ligament fibroblasts after simulation of orthodontic force. Arch Oral Biol; 49(2):119-24.
Redlich M, Roos H, Reichenberg E, Zaks B, Grosskop A, Bar Kana I, Pitaru S, Palmon A (2004b). The effect of centrifugal force on mRNA levels of collagenase, collagen type-I, tissue inhibitors of metalloproteinases and b-actin in cultured human periodontal ligament fibroblasts. J Periodontal Res; 39:27-32.
Reitan K (1960). Tissue behavior during orthodontic tooth movement. Am J Orthod; 46(12):881-900. Ren Y, Maltha JC, Kuijpers-Jagtman AM (2003). Optimum Force Magnitude for Orthodontic Tooth

77
Movement: A Systematic Literature Review. Angle Orthodontist; 73(1):86-92. Ren Y, Hazemeijer H, de Haan B, Qu N, de Vos P (2007). Cytokine profiles in crevicular fluid during
orthodontic tooth movement of short and long durations. J Periodontol; 78(3):453-8. Ren Y, Vissink A (2008). Cytokines in crevicular fluid and orthodontic tooth movement. Eur J Oral Sci;
116(2):89-97. Römer P, Köstler J, Koretsi V, Proff P (2013). Endotoxins potentiate COX-2 and RANKL expression in
compressed PDL cells. Clin Oral Investig; 17(9):2041-8. Rotmistrovsky K, Jang W, Schuler GD (2004). A web server for performing electronic PCR. Nucleic Acids
Res; 32(Web Server issue):W108-12. Rubin CT, Gross TS, McLeod KJ, Bain SD (1995). Morphologic stages in lamellar bone formation
stimulated by a potent mechanical stimulus. J Bone Miner Res; 10(3):488-95. Saito S, Ngan P, Rosol T, Saito M, Shimizu H, Shinjo N, Shanfeld J, Davidovitch Z (1991). Involvement of
PGE synthesis in the effect of intermittent pressure and interleukin-1E on bone resorption. J Dent Res; 70(1):27-33.
Sandoval J, Pereda J, Perez S, Finamor I, Vallet-Sanchez A, Rodriguez JL, Franco L, Sastre J, Lopez-Rodas G (2016). Epigenetic Regulation of Early- and Late-Response Genes in Acute Pancreatitis. J Immunol; 197:4137-4150.
Schneider EM, Vorlaender K, Ma X, Du W, Weiss M (2006). Role of ATP in trauma-associated cytokine release and apoptosis by P2X7 ion channel stimulation. Ann N Y Acad Sci; 1090:245-52.
Shimizu N, Yamaguchi M, Goseki T, Ozawa Y, Saito K, Takiguchi H, Iwasawa T, Abiko Y (1994). Cyclic-
tension force stimulates interleukin-1E production by human periodontal ligament cells. J Periodontal Res; 29(5):328-33.
Shimizu N, Ozawa Y, Yamaguchi M, Goseki T, Ohzeki K, Abiko Y (1998). Induction of COX-2 expression by mechanical tension force in human periodontal ligament cells. J Periodontol; 69(6):670-7.
Sodek J, Limeback HF (1979). Comparison of the rates of synthesis, conversion, and maturation of type I and type III collagens in rat periodontal tissues. J Biol Chem; 254(20):10496-502.
Souza BD, Lückemeyer DD, Felippe WT, Simões CM, Felippe MC (2010). Effect of temperature and storage media on human periodontal ligament fibroblast viability. Dent Traumatol; 26(3):271-5.
Tan SD, Kuijpers-Jagtman AM, Semeins CM, Bronckers ALJJ, Maltha JC, Von den Hoff JW, Everts V,
Klein-Nulend J (2006). Fluid shear stress inhibits TNFD-induced osteocyte apoptosis. J Dent Res; 85(10):905-909.
Theilig C, Bernd A, Leyhausen G, Kaufmann R, Geurtsen W (2001). Effects of mechanical force on primary human fibroblasts derived from the gingiva and the periodontal ligament. J Dent Res; 80(8):1777-80.
Thilander B, Rygh P, Reitan K (2005). Tissue reactions in orthodontics. In: Graber TM, Vanarsdall RL, Jr., Vig KWL (Eds.). Orthodontics: Current Principles & Techniques.] 4th Ed. St. Louis: Elsevier Mosby; pp. 145-219.
Thornton B, Basu C (2015). Rapid and simple method of qPCR primer design. In: Basu C (Ed.). PCR Primer Design. [Methods in Molecular Biology; 1275] 2nd Ed. New York: Humana Press; pp. 173-179.
Trubiani O, Horenstein AL, Caciagli F, Caputi S, Malavasi F, Ballerini P (2014). Expression of P2X7 ATP receptor mediating the IL8 and CCL20 release in human periodontal ligament stem cells. J Cell Biochem; 115(6):1138-46.

78
Ueda M, Goto T, Kuroishi KN, Gunjigake KK, Ikeda E, Kataoka S, Nakatomi M, Toyono T, Seta Y, Kawamoto T (2016). Asporin in compressed periodontal ligament cells inhibits bone formation. Archives of Oral Biology; 62:86-92.
Uematsu S, Mogi M, Deguchi T (1996). Interleukin (IL)-1E, IL-6, tumor necrosis factor-D, epidermal growth factor, and E2-microglobulin levels are elevated in gingival crevicular fluid during human orthodontic tooth movement. J Dent Res; 75(1):562-567.
Viecilli RF, Katona TR, Chen J, Hartsfield JK, Jr., Roberts WE (2009). Orthodontic mechanotransduction and the role of the P2X7 receptor. Am J Orthod Dentofacial Orthop; 135(6):694.e1-16; discussion 694-5.
von Böhl M, Maltha J, Von den Hoff H, Kuijpers-Jagtman AM (2004). Changes in the periodontal ligament after experimental tooth movement using high and low continuous forces in beagle dogs. Angle Orthod; 74(1):16-25.
Wang Y, Wang XX, Zhang LN, Jin SM, Zhang J (2012). Effects of traditional Chinese medicine on bone remodeling during orthodontic tooth movement. J Ethnopharmacol; 141(2):642-6.
Wichelhaus A (2017). Orthodontic Therapy - Fundamental Treatment Concepts. New York: Thieme. Wise GE, King GJ (2008). Mechanisms of tooth eruption and orthodontic tooth movement. J Dent Res;
87(5):414-34. Yamaguchi M (2009). RANK/RANKL/OPG during orthodontic tooth movement. Orthod Craniofac Res;
12(2):113-9. Yamazaki MO, Yamaguchi M, Kikuta J, Shimizu M (2014). Jagged1 stimulates bone resorption during
orthodontic tooth movement. Int J Oral-Med Sci; 13(2):59-65. Yang X, Ricciardi BF, Hernandez-Soria A, Shi Y, Pleshko Camacho N, Bostrom MP (2007). Callus
mineralization and maturation are delayed during fracture healing in interleukin-6 knockout mice. Bone; 41(6):928-36.
Ye J, Coulouris G, Zaretskaya I, Cutcutache I, Rozen S, Madden TL (2012). Primer-BLAST: a tool to design target-specific primers for polymerase chain reaction. BMC Bioinformatics; 13:134.
Yokoya K, Sasaki T, Shibasaki Y (1997). Distributional changes of osteoclasts and pre-osteoclastic cells in periodontal tissues during experimental tooth movement as revealed by quantitative immunohistochemistry of H+-ATPase. J Dent Res; 76(1):580-7.
Yucel-Lindberg T, Olsson T, Kawakami T (2006). Signal pathways involved in the regulation of prostaglandin E synthase-1 in human gingival fibroblasts. Cell Signal; 18(12):2131-42.
Zhang Y, Gao Y, Cai L, Li F, Lou Y, Xu N, Kang Y, Yang H (2017). MicroRNA-221 is involved in the regulation of osteoporosis through regulates RUNX2 protein expression and osteoblast differentiation. Am J Transl Res; 9(1):126-135.
Ziros PG, Gil AP, Georgakopoulos T, Habeos I, Kletsas D, Basdra EK, Papavassiliou AG (2002). The bone-specific transcriptional regulator Cbfa1 is a target of mechanical signals in osteoblastic cells. J Biol Chem; 277(26):23934-41.

79
11 Appendix - Example of bioinformatics primer testing
1. Genomic structure of the human PTGS2 gene: Gene-Id: 5743 mRNA reference sequence NM_000963.3 Genomic reference sequence NG_028206.2 Ensemble Id:
ENSG00000073756
Splice variants (Ensmbl):
2. Potential primers Primer no Forward Reverse Product size 1 GGAACACAACAGAGTCTGAG AAGGGGATGGCCAGTGTATAGA 2 AGAACTGGTACATCAGCAAG GAGTTTACAGGAAGCAGACA 3 AAGCCTTCTCTAACCTCTCC GCCCTCGCTTATGATCTGTC 234 bp (514-747)
Reference sequence used is GenBank accession number NM_00096.3

80
3. Testing primer specificy with “electronic PCR” (“ePCR”) and Primer-BLAST. Since the “ePCR” service is not provided anymore, only Primer-BLAST results are shown.
For Primers #1 and #2, Primer-BLAST output generated was: “Specified left primer cannot be found in template...make sure this primer is on the plus strand of your template.”
For Primer #3 the following output was generated showing the primer binding side with respect to the gene’s exon structure:
Primer pair 1 Sequence (5'->3') Template
strand
Length Start Stop Tm GC% Self-
comple-
mentarity
Self 3'
comple-
mentarity
Forw. AAGCCTTCTCTAACCTCTCC Plus 20 514 533 55.95 50.00 5.00 0.00
Rev. GCCCTCGCTTATGATCTGTC Minus 20 747 728 58.21 55.00 4.00 1.00
Product length 234
Products on intended target >NM_000963.3 Homo sapiens prostaglandin-endoperoxide synthase 2
(prostaglandin G/H synthase and cyclooxygenase) (PTGS2), mRNA
product length = 234
Forward primer 1 AAGCCTTCTCTAACCTCTCC 20
Template 514 .................... 533
Reverse primer 1 GCCCTCGCTTATGATCTGTC 20
Template 747 .................... 728
Products on potentially unintended templates >XM_011520202.1 PREDICTED: Homo sapiens solute carrier family 35
(GDP-fucose transporter), member C1 (SLC35C1), transcript variant X1,
mRNA
product length = 231
Forward primer 1 AAGCCTTCTCTAACCTCTCC 20
Template 915 ..C.........T......G 934
Forward primer 1 AAGCCTTCTCTAACCTCTCC 20
Template 1145 ...G....C.A.C....... 1126
>NM_001145266.1 Homo sapiens solute carrier family 35 (GDP-fucose
transporter), member C1 (SLC35C1), transcript variant 3, mRNA

81
product length = 231
Forward primer 1 AAGCCTTCTCTAACCTCTCC 20
Template 1661 ..C.........T......G 1680
Forward primer 1 AAGCCTTCTCTAACCTCTCC 20
Template 1891 ...G....C.A.C....... 1872
>NM_001145265.1 Homo sapiens solute carrier family 35 (GDP-fucose
transporter), member C1 (SLC35C1), transcript variant 2, mRNA
product length = 231
Forward primer 1 AAGCCTTCTCTAACCTCTCC 20
Template 1758 ..C.........T......G 1777
Forward primer 1 AAGCCTTCTCTAACCTCTCC 20
Template 1988 ...G....C.A.C....... 1969
>NM_018389.4 Homo sapiens solute carrier family 35 (GDP-fucose
transporter), member C1 (SLC35C1), transcript variant 1, mRNA
product length = 231
Forward primer 1 AAGCCTTCTCTAACCTCTCC 20
Template 2032 ..C.........T......G 2051
Forward primer 1 AAGCCTTCTCTAACCTCTCC 20
Template 2262 ...G....C.A.C....... 2243
4. Energy considerations on the PCR product using UNAfold service at IDT. For
Primers #1 and #2 the following error message was generated: “PRIMERQUEST ERROR: Specified forward primer not in sequence; Specified reverse primer not in sequence”.
With Primer #3 the following amplification product from mRNA/cDNA is produced. The primers are shown here with underlines:
AAGCCTTCTCTAACCTCTCCTATTATACTAGAGCCCTTCCTCCTGTGCCTGATGATTGCCCG
ACTCCCTTGGGTGTCAAAGGTAAAAAGCAGCTTCCTGATTCAAATGAGATTGTGGAAAAATT
GCTTCTAAGAAGAAAGTTCATCCCTGATCCCCAGGGCTCAAACATGATGTTTGCATTCTTTG
CCCAGCACTTCACGCATCAGTTTTTCAAGACAGATCATAAGCGAGGGC

82
The following energy considerations were generated: Structure Name 'G (kcal mol-1) TM (°C) 'H (kcal mol-1) 'S (cal K-1 mol-1) 1 -1.06 69 -40.5 -118.38 2 -0.65 62.6 -83.7 -249.3 3 -0.27 61.4 -61.6 -184.1 5. “Beacon Designer Free Edition” was additionally used for energy considerations.
For Primer #3 the following output was generated: Name: PTGS2_P3 Assay Type:SYBR®Green
Nucleic Acid Concentration (nM) 0.25 Monovalent Concentration (mM) 50
Free Mg++ Concentration (mM) 3 Total Na+ Concentration (mM) 269.09
Sense Primer: AAGCCTTCTCTAACCTCTCC

83
Length (bp) Tm (°C) GC% GC Clamp Cross Dimer (ΔG) Self-Dimer (ΔG) Hairpin (ΔG)
20 52.87 50 2 -2.9 -0.5 0.0
Anti-sense Primer: GCCCTCGCTTATGATCTGTC
Length (bp) Tm (°C) GC% GC Clamp Cross Dimer (ΔG) Self Dimer (ΔG) Hairpin (ΔG)
20 55.23 55 2 -2.9 -2.0 0.0
Secondary Structures for Sense Primer Dimer:- 5' AAGCCTTCTCTAACCTCTCC 3' ||| ¦¦¦ 3' CCTCTCCAATCTCTTCCGAA 5' -0.5
Hairpin:- Not Found Secondary Structures for Anti-Sense Primer Dimer:- 5' GCCCTCGCTTATGATCTGTC 3' |||| 3' CTGTCTAGTATTCGCTCCCG 5' -2.0
Hairpin:- Not Found Cross Dimer Cross Dimer between Sense Primer and Anti-sense Primer:- 5' AAGCCTTCTCTAACCTCTCC 3' |||| ¦ 3' CTGTCTAGTATTCGCTCCCG 5' -2.9 5' AAGCCTTCTCTAACCTCTCC 3' ¦ ||| ¦ 3' CTGTCTAGTATTCGCTCCCG 5' 0.3
6. Final check with Primer3plus for Primer #3
Left Primer 1:
Start: 514
Length: 20 bp
Tm: 55.9 C
GC: 50.0 %
Any: 0.0
End: 0.0
TB: 7.0
HP: 0.0
3' Stab: 3.7
Penalty: 4.054
Library Mispriming: 13.00, reverse MLT1R MLT1-Mammalian LTR retrotransposon internal sequence - a consensus Problems Temperature too low; Similarity to non-template sequence too high Right Primer 1:
Start: 747
Length: 20 bp
Tm: 58.2 C
GC: 55.0 %
Any: 0.0
End: 0.0
TB: 8.0
HP: 0.0
3' Stab: 3.5
Penalty:1.790
Library Mispriming: 12.00, MSTAR MSTa-Mammalian LTR internal retrotransposon sequence - a consensus
AAGCCTTCTCTAACCTCTCC
GCCCTCGCTTATGATCTGTC

84
Pair: Product Size: 234 bp
Any: 0.0
End: 0.0
TB: 15.0
Penalty: 5.844
Library Mispriming:
21.00, L1 Human L1 interspersed repetitive sequence - full length copy
1 GACCAATTGT CATACGACTT GCAGTGAGCG TCAGGAGCAC GTCCAGGAAC
[…deleted…] 451 CCAGATCACA TTTGATTGAC AGTCCACCAA CTTACAATGC TGACTATGGC
501 TACAAAAGCT GGGAAGCCTT CTCTAACCTC TCCTATTATA CTAGAGCCCT
551 TCCTCCTGTG CCTGATGATT GCCCGACTCC CTTGGGTGTC AAAGGTAAAA
601 AGCAGCTTCC TGATTCAAAT GAGATTGTGG AAAAATTGCT TCTAAGAAGA
651 AAGTTCATCC CTGATCCCCA GGGCTCAAAC ATGATGTTTG CATTCTTTGC
701 CCAGCACTTC ACGCATCAGT TTTTCAAGAC AGATCATAAG CGAGGGCCAG
751 CTTTCACCAA CGGGCTGGGC CATGGGGTGG ACTTAAATCA TATTTACGGT
801 GAAACTCTGG CTAGACAGCG TAAACTGCGC CTTTTCAAGG ATGGAAAAAT
[…deleted…] 4451 TTATTTTTGT ACTATTTAAA AATTGACAGA TCTTTTCTGA AGAAAAAAAA
4501 AAAAAAA
Statistics: Left Primer: considered 1, unacceptable product size 1, tm diff too large 1, primer in pair overlaps a primer in a better pair 1, ok 1

85
12 Acknowledgement
I would like to express my supreme gratitude to my supervisor Prof. Dr. Andrea
Wichelhaus for providing me the opportunity to do my study and finish doctoral study
in this group.
Special thanks to my co-supervisor Dr. Uwe Baumert who guided me every step
during my study, including experiment design, experimental technical guidance, result
analyzation, thesis correction and so on. He showed his kindest help to me on every
aspect from beginning to the end.
I would also like to thank to my colleagues, Christine Schreindorfer, Lisa Reuther,
and Mila Janjic. They gave me tremendous supports on my lab work, my life, my
language and my spirit. Their advice helped a lot when I met some problems either on
my study or my life.
I am grateful Dr. Julia Diegelmann and Mrs. Brigitte Hackl from Department of
Conservative Dentistry and Parodontology Research Laboratory. They provided
technical support during my study. They showed enough patients to solve my
problems and tried their best to help me.
I want to convey my sincere thanks to my husband Yang Yang. He encouraged
and supported me when I encountered obstacles in my experiments. He also gave me
the confidence to complete my work.
Thanks to the financial support from China Scholarship Council (CSC). Thanks
to opportunity from Ludwig-Maximilians-Universität München. Thanks to all the
Germany people’s warm and friend treatment to a foreigner.

München, 16.05.2018