Embed Size (px)
Citation preview
Work Package 31 IMPACT Report Appendix 15(a)
1
Establish framework for encouraging distributed domestic power generation
1. EXECUTIVE SUMMARY
1.1. The cost efficacy of various decarbonisation policies adopted in the United Kingdom (UK) during the period 2010 to 2018 were examined and revealed that carbon prices and large scale renewable subsidies were the most cost effective measure in delivering long term and sustainable carbon dioxide savings.
1.2. Small scale renewable subsidies proved to be the least cost effective. Current progress in the development of sustainable generation tariffs both on the Isle of Man and Ireland were investigated and the factors contributing to the success and failure of the Green Deal scheme in the UK are highlighted.
1.3. A simple framework agreement to encourage domestic renewable schemes for the Isle of Man is outlined but based on a recent UK’s Ofgem report is not expected to be the most cost effective route to supporting the transition to a decarbonised economy. However it should play a dominant role in enhancing awareness, education and promotion of sustainability issues amongst the domestic sector and encourage Island-wide engagement and commitment to achieving a net zero emissions target by 2050.
1.4. An opportunity arises for other Isle of Man energy related utilities such as Manx Gas, EVF and Manx Petroleum to establish collaborative working partnerships, possibly with Manx Utilities Authority (MUA), along the lines of Energy Service Companies (ESCO). A comprehensive suite of products and services could be supplied to the domestic sector including energy management, low carbon heating, e-mobility, smart LED lighting services on a subscription basis as well as the opportunity to lease renewable schemes comprising solar PV, micro-wind and battery storage.
2. THE CHALLENGE Historical and Present Energy Generation Mix Status
2.1. Electrical power Generation on the Isle of Man represented c.199,000 (24% of total) of carbon related emissions when last officially recorded in 2016. This figure will have subsequently increased in the last year due to a relatively steep jump in volumes of wholesale electricity exported to the UK via the undersea interconnector due to favourable economic conditions.
2.2. Currently the renewable content of Manx Utilities’ generation comprises the output from a 1 MW hydro generation plant located in Sulby on the Island which produces on average c.3.5 GWhs of electricity. In addition a c.5 MW Energy-from-Waste plant owned by SITA has exported average electricity supplies of c. 25 GWh/annum to the
Work Package 31 IMPACT Report Appendix 15(a)
2
MUA’s grid but this volume has progressively fallen from an annual peak yield of over 30 GWh in the early years of commissioning in 2005. The Isle of Man’s gross annual electricity retail consumption – taking into account parasitic loads at the power stations and transmission/distribution losses – is c. 405 GWh. Prior to the ‘financial crash’ in 2008-09, MUA’s gross electricity revenues amounted to over 441 GWh and exhibited an annual growth rate of close to 3%. Subsequently, during the last decade, there has been a sustained downward trend of c.1% /annum in the Island’s retail sales due to the adoption of extensive energy efficiency practices predominantly the adoption of LED lighting amongst households and businesses together with structural changes in the composition of the Island’s economy resulting from consolidation of commercial activities within both the private and public sectors.
2.3. Extensive investment in the electrical generation supply and network reinforcement in the period 2000-2005 has resulted in a very secure and resilient electricity supply industry for the future but has subjected MUA to significant level of indebtedness. The latter has determined the scope, structure and rate of increase in subsequent electricity tariffs implemented to recover historic investments and has heavily influenced the degree of financial incentives that could be offered to encourage domestic and commercial customers investing in low and zero carbon technologies.
Historic and current status of self-generation and renewables on the Island:
2.4. Self-generation in the form of large (> 70 kVA) Combined Heat and Power plant (CHPs) featured strongly from 2005 amongst large commercial and public sector organisations when Manx Gas transferred a significant proportion of its customers in Douglas and Onchan from LPG/Town gas to natural gas following the commissioning of MU’s gas fired generation plant. A total of 10 CHPs were commissioned by Manx Gas in the period 2003-2005 primarily amongst the island’s hotels and schools with the largest (=750 kVA) installed at Nobles hospital. In aggregate, they represented a total of c.1.8MVA of self-generation capacity - and resulted in the ‘loss’ of c.8 GWh/annum of electricity retail sales to MUA. However, following the end of their standard 10 year service life, the majority of these CHPs have now been decommissioned and their replacements have not been installed. Small scale domestic micro-CHPs have been trialled in the past in the UK but their economics did not justify a mass rollout but the technology is subject to constant review.
2.5. To encourage renewable generation on the Isle of Man, the former Manx Electricity Authority (MEA) introduced a domestic home generation tariff which permitted households to install a maximum of 10 kWp of self-generation with the majority choosing 4 kWp of solar photovoltaic (PV) panels subject to local system integrity. These customers benefited from a net metering scheme whereby their surplus renewable units exported to MEA’s network system were credited to their electricity accounts at the prevailing unit tariff rate. A maximum total of 19 customers took advantage of this scheme and averaged 35 MWh/annum of sales to MEA. In 2015-16, no further domestic customers were permitted to take advantage of the net
Work Package 31 IMPACT Report Appendix 15(a)
3
metering scheme which was replaced with the Domestic Sustainable Generation that initially offered a reduced rate of c.8 p/kWh for excess units of renewable generation exported to MUA. At September 2019, 58 customers are registered with MUA on the DSG tariff representing a growth rate of 40%/annum albeit from a small baseline. These customers’ self-generation projects predominantly comprised domestic solar PV panels although there were a few customers with micro-wind turbines. The current export credit on offer from MUA for DSG customers is 9.1 p/kWh which is considered very financially attractive especially given that the UK have abandoned their feed-in-tariff and export tariff of 5.4 p/kWh from April 2019.
MUA’s current range of renewable generation tariffs
2.6. In 2016-17 MUA raised the limit for self-generation to 50 kWp and introduced a Commercial Sustainable Generation tariff which currently benefits seven commercial customers.
2.7. MUA is presently considering extending the Sustainable Generation tariff to industrial customers on the Maximum Demand tariff and is reviewing the current terms and conditions that were historically applicable with the onset of CHPs by Manx Gas. Current practice instigated following the advent of CHPs demanded that large scale self-generation – defined as >50 kW – made a contribution to MUA’s annual costs of operating the network to a high standard level of quality and security of electricity supplies. In addition the requirement for MUA to carry spinning reserve i.e. spare generation headroom on its existing generation plant resulted in further costs from the loss of export potential. A Reserve Demand Charge (RDC) was subsequently implemented which is currently levied at the rate of £3.48 /kW/month to reflect the high load factor and loss of retail electricity units due predominantly to the CHPs. However it is recognised that low and zero carbon technologies present significantly lower load factors than CHPs and therefore if maintained at the present rate, the RDC would represent a major financial deterrent to future installation of solar PV generation in particular by industrial customers. Moreover the MUA also do not presently provide any credit to excess units exported to their network for large scale renewable schemes as is the case for commercial customers with renewable generation capacity of less than 50 kW.
2.8. Since 2011, MUA has also offered a Green tariff which matches the annual electricity consumption of a large commercial organisation with the generation output of the Sulby Hydro generation plant. This was initially offered to Marks & Spencer (IoM) as they embarked on a green strategy known internally as a ‘Plan A’ scheme which aimed to secure the electricity consumed at all their UK retailing and distribution centres wholly from either a dedicated localised renewable energy source or by purchasing an accredited green electricity supply from a UK energy supplier. To extend this scheme to the Isle of Man, MUA devised their own Green tariff and Marks & Spencer became its first beneficiary. Subsequently additional Island based customers have signed onto the Green tariff. The premium levied by MUA is 1p/kWh
Work Package 31 IMPACT Report Appendix 15(a)
4
above their standard electricity tariff and at its peak generated c. £40k/annum of ‘green’ revenues from three major organisations on the Island. The annual revenues were utilised to support the activities of MUA’s Energy Efficiency officer.
Isle of Man Government’s Green Loans
2.9. Isle of Man Government’s Dept. for Enterprise (DfE) renamed their “Green Loan Scheme” to “Business Energy Saving Scheme” and relaxed the eligibility criteria to commercial businesses. Energy efficiency projects could receive support from £1,000 to a maximum value of £20,000 which was interest free and repayment terms up to five years. Applications for loans to the value of £5,000 would be fast tracked for completion. During the period February 2012 and December 2018, the former 2Green loan Scheme’ attracted 95 enquiries of which 25 subsequently received approval with the total value of loans exceeding £0.25 million.
2.10. Energy saving projects considered included heating and lighting controls, insulation upgrades, solar heating systems, wind turbines and EV charging points. They also offered Environmental Consultancy to the value of £5,000 under the Business Improvement Scheme which would cover 50% of the costs for those companies wishing to adopt energy efficient practices or install low carbon/renewable technologies.
UK’s Experience with former Green Deal the different phases of the Energy Company Obligation (ECO) scheme.
2.11. In 2012/13, the UK introduced the Green Deal and Energy Company Obligation (ECO) schemes to encourage energy efficiency and adoption of low carbon technologies for households and small businesses.
The Green Deal
2.12. The Green Deal was a previously untested policy instrument which allowed financing of energy efficiency retrofits of buildings by way of an on-bill charge attached to the property and not the occupant. Whilst ECO was a continued obligation of energy companies to deliver energy efficiency measures across the housing stock but with a dominant emphasis on higher cost insulation measures. Additional emission reduction schemes introduced in 2012 were specifically aimed at households and included the Carbon Emissions Reduction Target (CERT) and the Community Energy Saving programme (CESP). The latter policies were eventually replaced with ECO which was targeted at replacing both carbon saving and fuel poverty programmes.
2.13. However the National Audit Office in the UK concluded that the Department of Energy and Climate Change (DECC)’s £240 million Green Deal scheme achieved “virtually nothing” and “has not achieved value for money”. The Green Deal exemplified a ‘Pay-as-you-Save’ scheme where loans were secured to fund energy efficiency measures and were expected to be repaid over time from the financial
Work Package 31 IMPACT Report Appendix 15(a)
5
savings created by the measures. However the main deterrent was perceived to be the 7-10% APR interest rate on the loan levied onto householders and therefore was not considered affordable give that personal loans were available at a lower interest rate. Its main tenet was the ‘Golden Rule’ which stipulated that the energy cost savings must not be more than the cost of the energy efficiency measures. Finance was attached to the property and recovered through additional charges on the electricity bill – even when the cost saving measures related to a different fuel such as gas. The final result was that over 300,000 Green Deal assessments led to just 1,815 ‘live‘plans – a conversion rate of 0.6%.
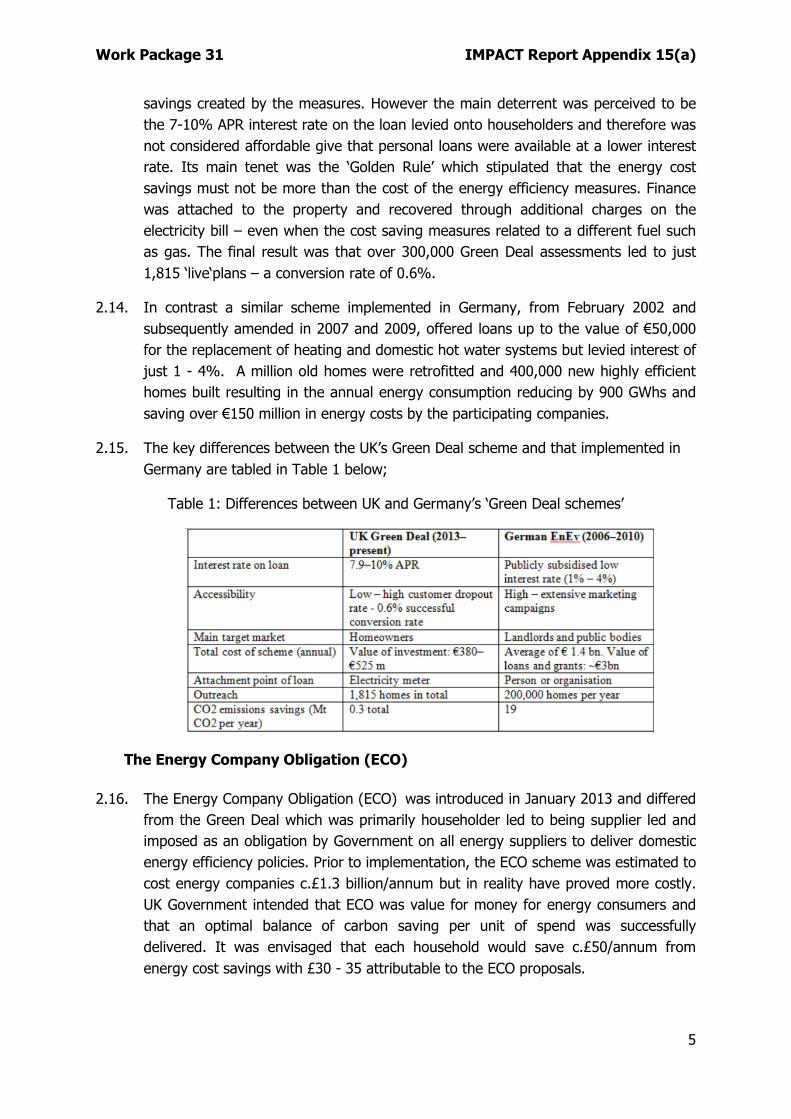
2.14. In contrast a similar scheme implemented in Germany, from February 2002 and subsequently amended in 2007 and 2009, offered loans up to the value of €50,000 for the replacement of heating and domestic hot water systems but levied interest of just 1 - 4%. A million old homes were retrofitted and 400,000 new highly efficient homes built resulting in the annual energy consumption reducing by 900 GWhs and saving over €150 million in energy costs by the participating companies.
2.15. The key differences between the UK’s Green Deal scheme and that implemented in Germany are tabled in Table 1 below;
Table 1: Differences between UK and Germany’s ‘Green Deal schemes’
The Energy Company Obligation (ECO)
2.16. The Energy Company Obligation (ECO) was introduced in January 2013 and differed from the Green Deal which was primarily householder led to being supplier led and imposed as an obligation by Government on all energy suppliers to deliver domestic energy efficiency policies. Prior to implementation, the ECO scheme was estimated to cost energy companies c.£1.3 billion/annum but in reality have proved more costly. UK Government intended that ECO was value for money for energy consumers and that an optimal balance of carbon saving per unit of spend was successfully delivered. It was envisaged that each household would save c.£50/annum from energy cost savings with £30 - 35 attributable to the ECO proposals.
Work Package 31 IMPACT Report Appendix 15(a)
6
2.17. The ECO obligation as at September 2018 has delivered over 2.4 million improvements in 1.9 million homes. The 2015 Government Spending Review disclosed that the supplier obligation would run for 5 years from April 2017 to March 2022 at an estimated cost of £640 million/annum. It has successfully aligned with Government’s aims to encourage reliable, low cost and clean energy as well as committing to raise the energy efficiency of fuel poor homes to EPC Band C by 2030. The Electricity and Gas (ECO) Order of 2018 set the regulations to establish a third ECO scheme which would be targeted to predominantly support low income, vulnerable and fuel poor households. Main energy efficiency measures focused on loft, cavity and solid wall insulation and gas boiler upgrades.
Isle of Man Domestic Electricity Demand composition
2.18. The AE Technology (2010) report identified significant opportunities for improved energy efficiency and specifically for the domestic sector identified measures including loft and cavity wall insulation, draught proofing, improved heating controls and improved lighting. As these measures are cheaper than subsidising small scale renewable generation they should be pursued as a policy priority. In respect to heat only technologies, AET referred to the carbon reduction benefits afforded by biomass technologies for a range of applications but highlighted that some capital subsidy was necessary to facilitate the transition to small scale bio-mass in the domestic sector an economically viable proposition. Again heat pumps were referred to as another alternative low carbon heating solution but some degree of capital subsidy, grant or loan was required to contribute to the average (= c.£10 k/HP) cost of the domestic HP.
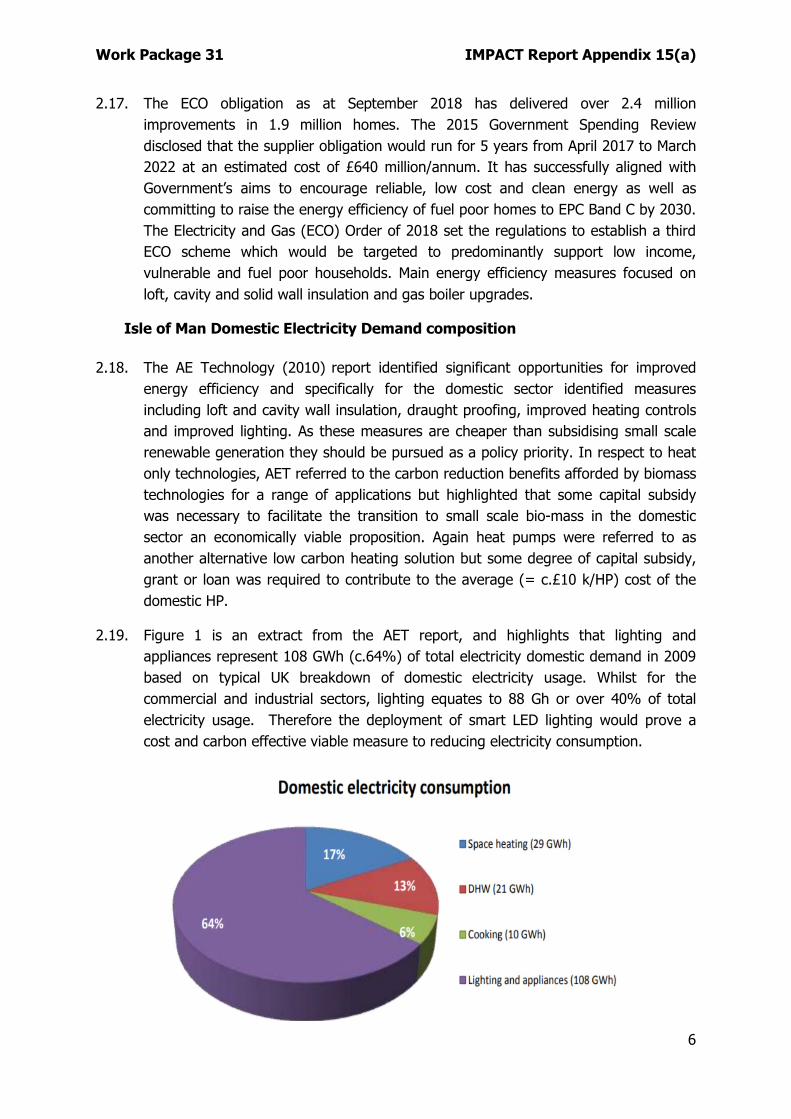
2.19. Figure 1 is an extract from the AET report, and highlights that lighting and appliances represent 108 GWh (c.64%) of total electricity domestic demand in 2009 based on typical UK breakdown of domestic electricity usage. Whilst for the commercial and industrial sectors, lighting equates to 88 Gh or over 40% of total electricity usage. Therefore the deployment of smart LED lighting would prove a cost and carbon effective viable measure to reducing electricity consumption.
Work Package 31 IMPACT Report Appendix 15(a)
7
Figure 1: Main components of Domestic Electricity Consumption on the Isle of Man in 2009
2.20. In 2008/09 the total domestic electricity consumption was determined at 168 GWh and predominantly associated with lighting and appliances. A decade later the total value for domestic electricity consumption in 2018/19 is less than 159 GWh – a reduction of almost 10%. This is mainly attributable to the widespread introduction of smart LED lighting schemes, purchase of more energy efficient energy appliances and an increased awareness in the financial advantages benefits of energy efficiency. This negative trend in electricity demand is expected to continue in the short term despite positive growth in the Island’s population and number of new houses planned to be built in the future.
AEA Technology Report – Key Conclusions in 2010
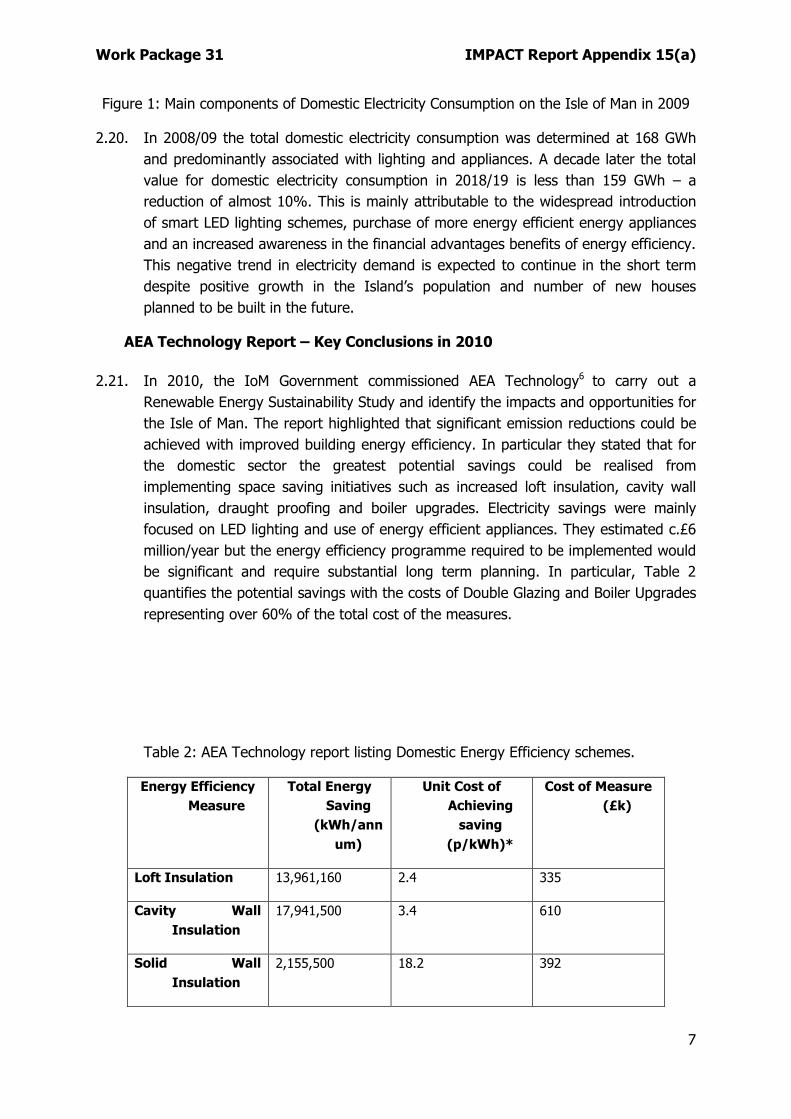
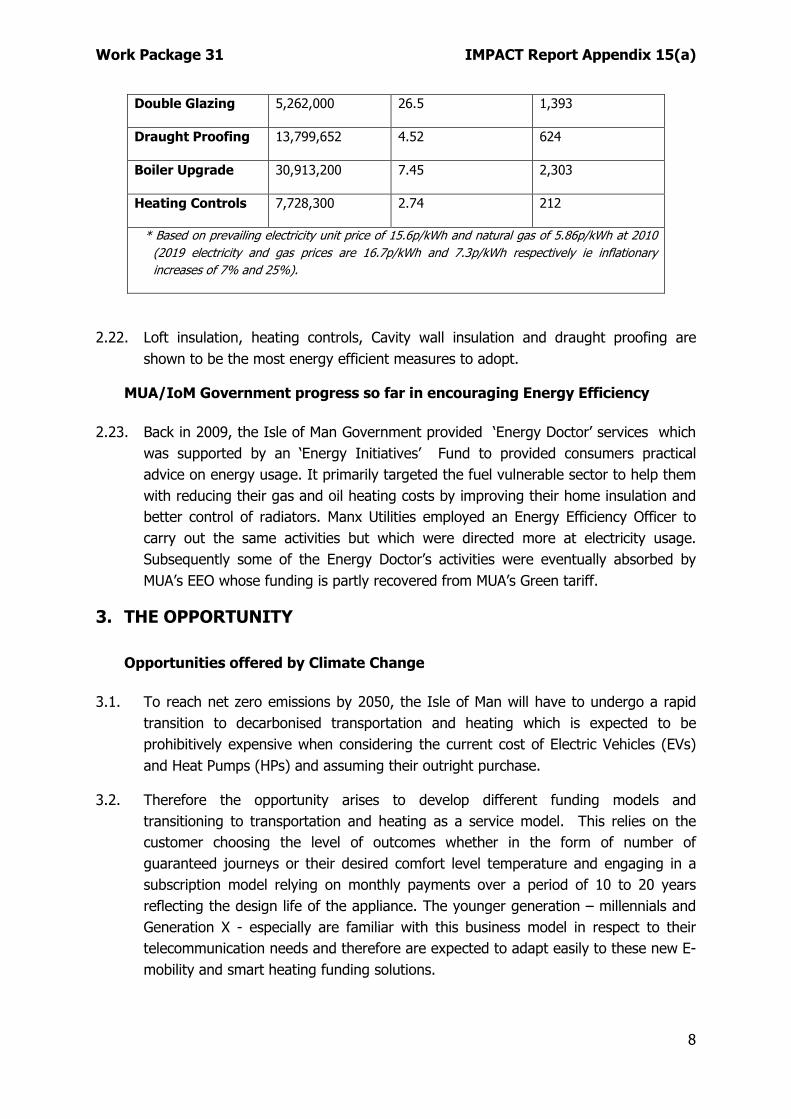
2.21. In 2010, the IoM Government commissioned AEA Technology6 to carry out a Renewable Energy Sustainability Study and identify the impacts and opportunities for the Isle of Man. The report highlighted that significant emission reductions could be achieved with improved building energy efficiency. In particular they stated that for the domestic sector the greatest potential savings could be realised from implementing space saving initiatives such as increased loft insulation, cavity wall insulation, draught proofing and boiler upgrades. Electricity savings were mainly focused on LED lighting and use of energy efficient appliances. They estimated c.£6 million/year but the energy efficiency programme required to be implemented would be significant and require substantial long term planning. In particular, Table 2 quantifies the potential savings with the costs of Double Glazing and Boiler Upgrades representing over 60% of the total cost of the measures.
Table 2: AEA Technology report listing Domestic Energy Efficiency schemes.
Energy Efficiency Measure
Total Energy Saving
(kWh/annum)
Unit Cost of Achieving
saving (p/kWh)*
Cost of Measure (£k)
Loft Insulation 13,961,160 2.4 335
Cavity Wall Insulation
17,941,500 3.4 610
Solid Wall Insulation
2,155,500 18.2 392
Work Package 31 IMPACT Report Appendix 15(a)
8
Double Glazing 5,262,000 26.5 1,393
Draught Proofing 13,799,652 4.52 624
Boiler Upgrade 30,913,200 7.45 2,303
Heating Controls 7,728,300 2.74 212
* Based on prevailing electricity unit price of 15.6p/kWh and natural gas of 5.86p/kWh at 2010 (2019 electricity and gas prices are 16.7p/kWh and 7.3p/kWh respectively ie inflationary increases of 7% and 25%).
2.22. Loft insulation, heating controls, Cavity wall insulation and draught proofing are shown to be the most energy efficient measures to adopt.
MUA/IoM Government progress so far in encouraging Energy Efficiency
2.23. Back in 2009, the Isle of Man Government provided ‘Energy Doctor’ services which was supported by an ‘Energy Initiatives’ Fund to provided consumers practical advice on energy usage. It primarily targeted the fuel vulnerable sector to help them with reducing their gas and oil heating costs by improving their home insulation and better control of radiators. Manx Utilities employed an Energy Efficiency Officer to carry out the same activities but which were directed more at electricity usage. Subsequently some of the Energy Doctor’s activities were eventually absorbed by MUA’s EEO whose funding is partly recovered from MUA’s Green tariff.
3. THE OPPORTUNITY Opportunities offered by Climate Change
3.1. To reach net zero emissions by 2050, the Isle of Man will have to undergo a rapid transition to decarbonised transportation and heating which is expected to be prohibitively expensive when considering the current cost of Electric Vehicles (EVs) and Heat Pumps (HPs) and assuming their outright purchase.
3.2. Therefore the opportunity arises to develop different funding models and transitioning to transportation and heating as a service model. This relies on the customer choosing the level of outcomes whether in the form of number of guaranteed journeys or their desired comfort level temperature and engaging in a subscription model relying on monthly payments over a period of 10 to 20 years reflecting the design life of the appliance. The younger generation – millennials and Generation X - especially are familiar with this business model in respect to their telecommunication needs and therefore are expected to adapt easily to these new E-mobility and smart heating funding solutions.
Work Package 31 IMPACT Report Appendix 15(a)
9
3.3. The accelerated movement towards EVs and HPs will financially impact on the profitability of the gas and oil based utilities on the Island unless Energy Service Companies (ESCos) involving working relationships between different utilities – such as Manx Gas and Manx Utilities - are established which involve close collaboration and alignment of business objectives to the environmental benefit of the Isle of Man’s community.
3.4. The basic principles behind the creation of ESCos is that third party funding would be initially used to implement energy efficiency measures or install renewable energy projects with the subsequent annual energy costs savings recovered by the third party over a typical 20 year project life.
3.5. Therefore in the short to medium term there could be a proliferation of bivalent low carbon heating systems comprising heat pumps and smaller gas boilers which would provide a sustainable revenue stream to the jointly owned ESCo possibly comprising Manx Gas and Manx Utilities. The heat pump/gas boiler hybrid model features strongly in NGC’s ‘Two Degrees’ energy scenario with 2030 forecast volumes around 40% of ASHP projected volumes. Bivalent heating models would provide an added benefit to network operators by deferring major capital investment by Manx Utilities on its Island distribution network necessitated by an increase in the number of individual heat pumps in the future. During very cold winters, householders can switch solely to their gas boiler operation and therefore avoid adding incremental load to MUA’s winter peak demand.
3.6. Similarly an interim transition in the transportation sector could be Plug-in Hybrids, especially if the latter were reconfigured to use bio-fuels as an alternative to petrol or diesel, mitigating an owners’ concerns over the comparatively smaller driving range and relatively slow charging capability of EV charging stations. In the medium to long term as the batteries for new EVs become progressively larger in capacity – and therefore offering a longer driving range – and there is an increase in both the availability and accessibility to rapid charge EV charging stations, original PHEV owners will gradually switch to EVs.
3.7. Apart from low carbon demand-side technologies such as EVs and HPs, further support is required to encourage the growth of domestic and commercial solar PV installations. Competitively priced battery storage enhance the economic viability of solar PV installations and offer the opportunity to provide aggregated flexibility services to utilities to support their function of ensuring constant balancing of intermittent electrical supply and demand elements in the future.
Review of UK and Ireland’s practices to encourage Distributed Energy Resources (DER)
3.8. Back in 2010, the UK introduced the Feed–in-Tariff and Export Tariff for a range of small and large scale renewable technologies including domestic solar PV installations to mitigate the significant upfront capital costs of renewable generation schemes at
Work Package 31 IMPACT Report Appendix 15(a)
10
the time. This was set initially at c.43p/kWh for solar PV, subject to annual inflation and payable for up to 20 years to reflect the high purchase costs of the solar PV panels. Degression limits were set whereby as certain renewable capacity thresholds were achieved, this would trigger a reduction in the level of the FiT payment which was aligned with the progressive fall in the capital costs of solar PV panels as the industry matured and benefited from economies of scale.
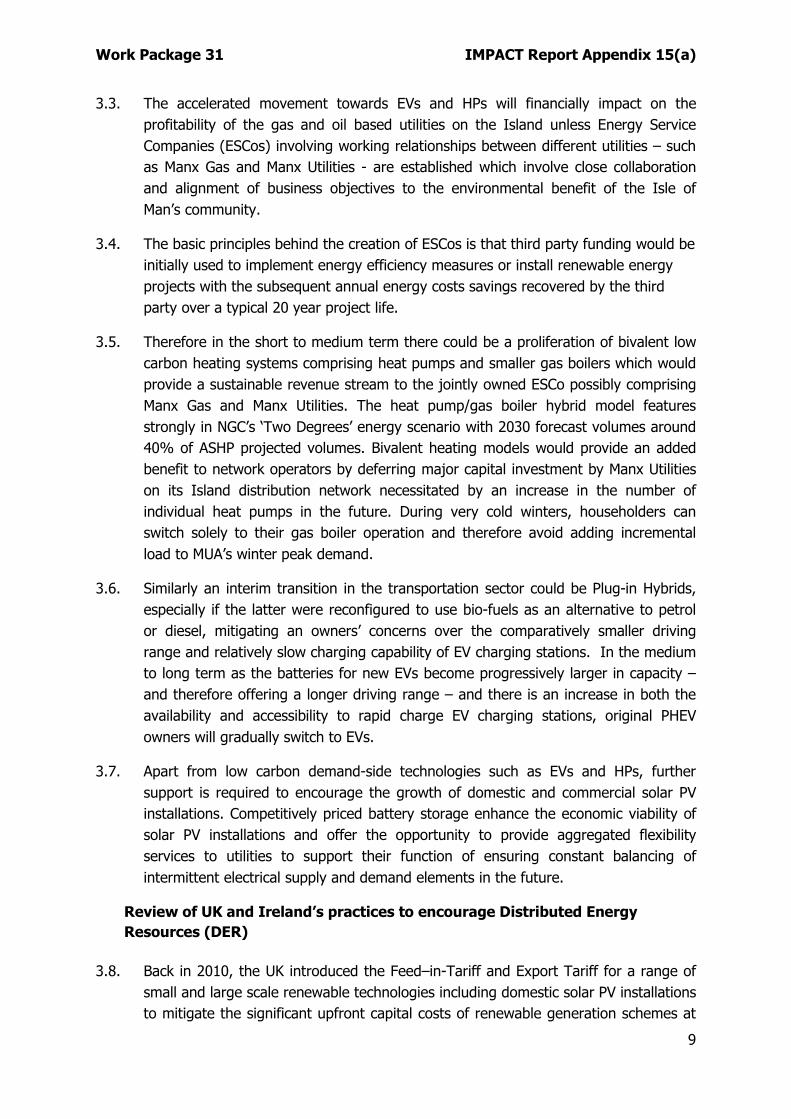
3.9. FiT Export and Generation tariffs in the UK have fallen substantially in percentage terms since their inception in 2010 as shown in Figure 2.
Figure 2: Feed-in-Tariffs 2010 to 2019
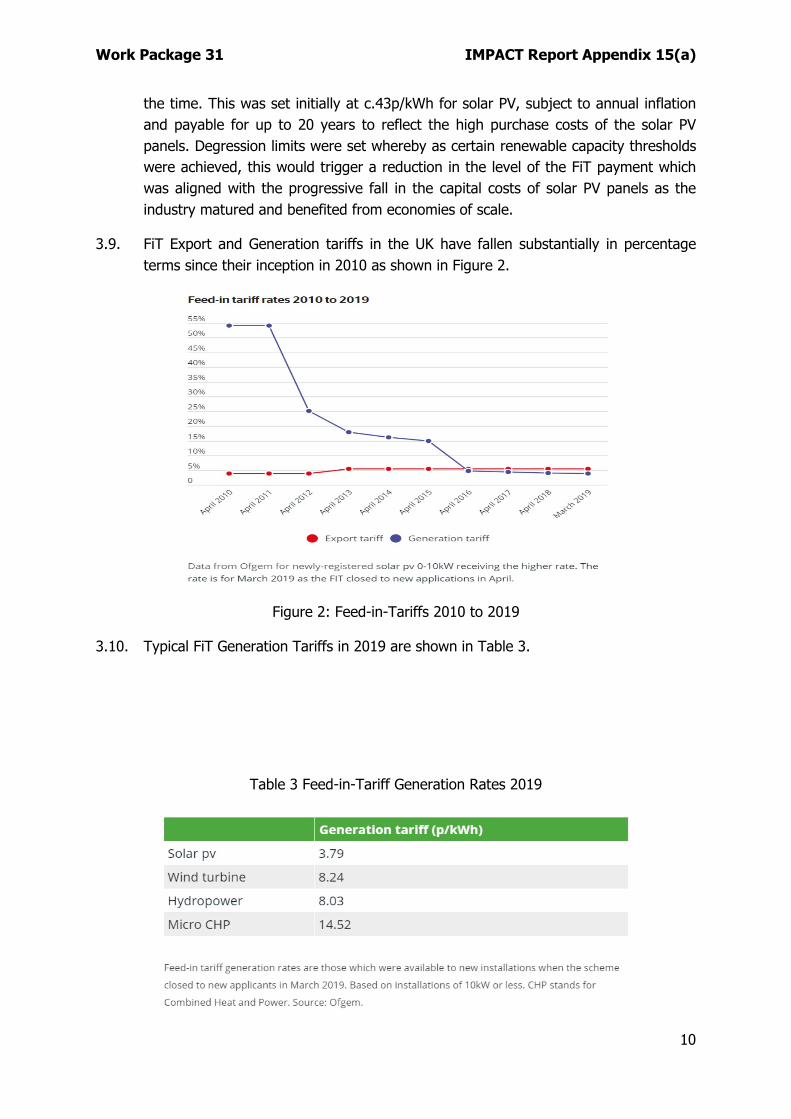
3.10. Typical FiT Generation Tariffs in 2019 are shown in Table 3.
Table 3 Feed-in-Tariff Generation Rates 2019
Work Package 31 IMPACT Report Appendix 15(a)
11
3.11. Before its closure in March 2019, it was estimated that 80,000 homes in the UK were generating renewable electricity predominantly from solar photovoltaic (PV) panels.
3.12. A new incentive scheme named ‘The Smart Export Guarantee’ (SEG) has been introduced to replace the former FiT to reward homes for the surplus renewable electricity that they generate and export into the network. All energy suppliers in the UK with more than 150,000 customers are now obliged to offer the SEG tariff by the end of 2019. A stricter regime will be adopted to ensure that SEG payments are based on measured export of electricity volumes whereas previously ‘deemed’ volumes – normally 50% of the renewable generation used for self-consumption – were used to determine FiT payments. Individual supply companies will set the rates for SEG tariffs – not Government – and a smart meter will be needed to accurately measure and validate the renewable export on a half-hourly basis.
3.13. Homeowners in Ireland can access grants of €700/kWp of solar PV but limited to 2 kWp. However a further fixed grant of €1,000 is also available for a battery storage system for a solar PV installation with a capacity of up to 4 kWp. For a typical three-bedroomed semi-detached, the solar PV installation was expected to cost c.€1,800 but would result in an annual cost saving of €220. The grants are planned to be administered by the Sustainable Energy Authority of Ireland (SEAI) and once approved, homeowners are given six months to have the works completed by a registered contractor. The scheme will be subject to 6 monthly reviews and the costs scrutinised before broadening the scope to encompass other groups and technologies.
3.14. Other UK based energy efficiency schemes included the Energy Company Obligation (ECO) which commenced in 2013 and replaced the former energy supplier obligations of Carbon Emissions Reduction Target (CERT) and Community Energy Savings Programme (CESP).
3.15. Ofgem in its 2019 State of the Energy Market report stated that households and businesses collectively spend c.£55 billion on energy each year. To protect ‘vulnerable’ consumers, Ofgem implemented Government legislation to cap the price of default energy tariffs from January 2019. Direct subsidies targeted at vulnerable households amounted to £2.5 billion for winter 2018 with Winter Fuel payment providing £2 billion each year to pensioners. The report also highlights that greenhouse gas emissions from the UK electricity sector have fallen by more than 50% since 2012 and recognise that more aggressive targets for the decarbonisation of heat and transport are essential to achieve 2050 carbon targets. Carbon dioxide emissions from electricity generation in the UK fell by 11% in 2018 mainly attributable to wind, solar and bioenergy with a reduced reliance on coal. Ofgem have estimated that the carbon price underpinning the transition to a more renewable-centric generation mix has cost consumers c.£31/tonne of carbon
Work Package 31 IMPACT Report Appendix 15(a)
12
emissions avoided between 2010 and 2018. Whereas small scale renewable subsidies have subjected consumers to costs of c.£322.
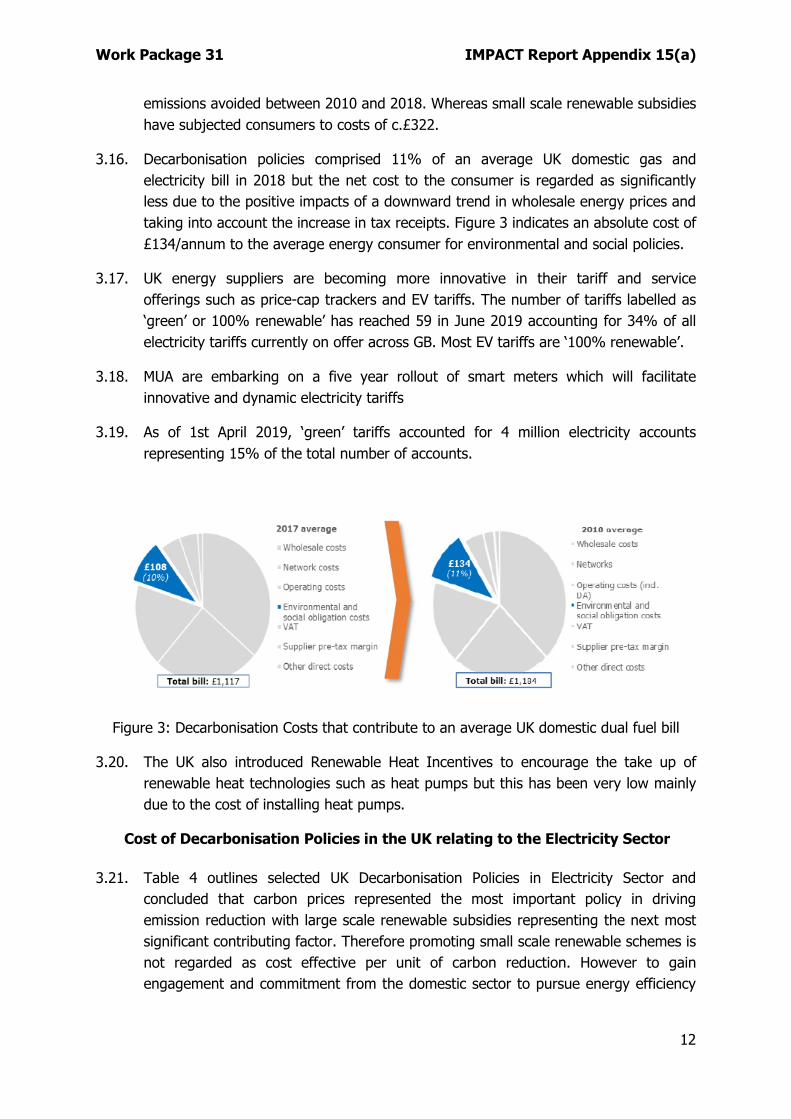
3.16. Decarbonisation policies comprised 11% of an average UK domestic gas and electricity bill in 2018 but the net cost to the consumer is regarded as significantly less due to the positive impacts of a downward trend in wholesale energy prices and taking into account the increase in tax receipts. Figure 3 indicates an absolute cost of £134/annum to the average energy consumer for environmental and social policies.
3.17. UK energy suppliers are becoming more innovative in their tariff and service offerings such as price-cap trackers and EV tariffs. The number of tariffs labelled as ‘green’ or 100% renewable’ has reached 59 in June 2019 accounting for 34% of all electricity tariffs currently on offer across GB. Most EV tariffs are ‘100% renewable’.
3.18. MUA are embarking on a five year rollout of smart meters which will facilitate innovative and dynamic electricity tariffs
3.19. As of 1st April 2019, ‘green’ tariffs accounted for 4 million electricity accounts representing 15% of the total number of accounts.
Figure 3: Decarbonisation Costs that contribute to an average UK domestic dual fuel bill
3.20. The UK also introduced Renewable Heat Incentives to encourage the take up of renewable heat technologies such as heat pumps but this has been very low mainly due to the cost of installing heat pumps.
Cost of Decarbonisation Policies in the UK relating to the Electricity Sector
3.21. Table 4 outlines selected UK Decarbonisation Policies in Electricity Sector and concluded that carbon prices represented the most important policy in driving emission reduction with large scale renewable subsidies representing the next most significant contributing factor. Therefore promoting small scale renewable schemes is not regarded as cost effective per unit of carbon reduction. However to gain engagement and commitment from the domestic sector to pursue energy efficiency
Work Package 31 IMPACT Report Appendix 15(a)
13
measures is a required step and probably more financially rewarding in reducing heating costs than electricity related measures such as LED lighting.
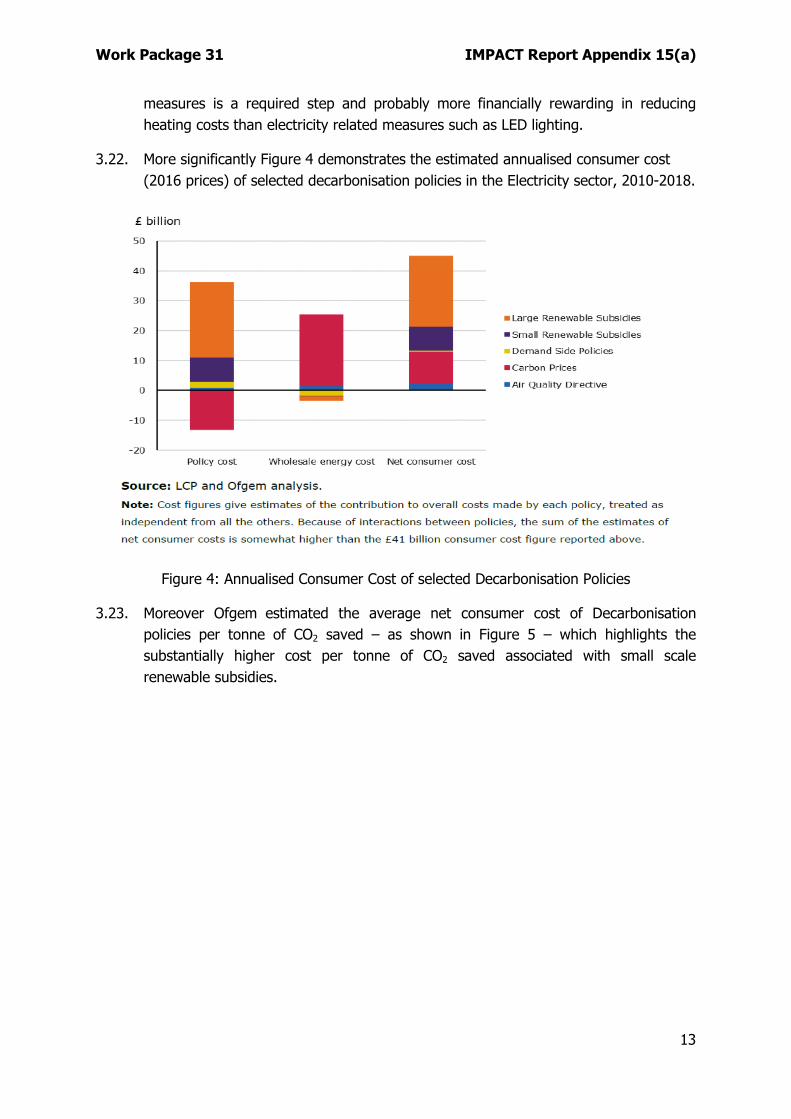
3.22. More significantly Figure 4 demonstrates the estimated annualised consumer cost (2016 prices) of selected decarbonisation policies in the Electricity sector, 2010-2018.
Figure 4: Annualised Consumer Cost of selected Decarbonisation Policies
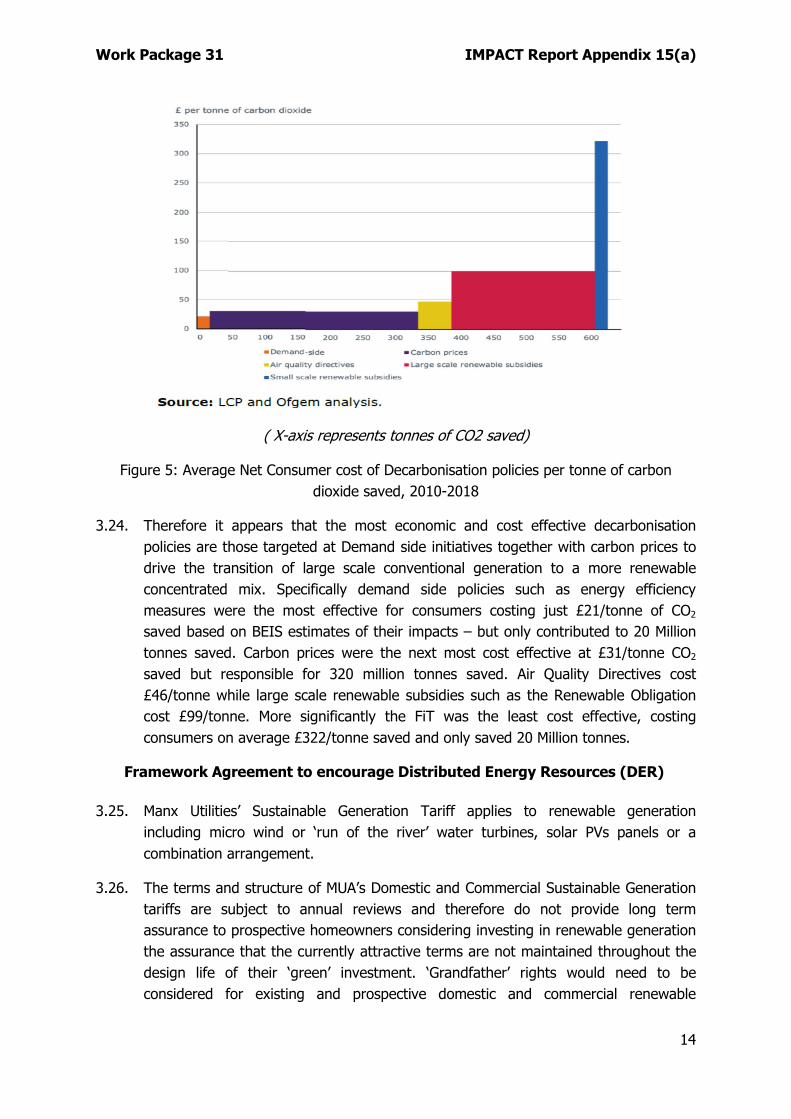
3.23. Moreover Ofgem estimated the average net consumer cost of Decarbonisation policies per tonne of CO2 saved – as shown in Figure 5 – which highlights the substantially higher cost per tonne of CO2 saved associated with small scale renewable subsidies.
Work Package 31 IMPACT Report Appendix 15(a)
14
( X-axis represents tonnes of CO2 saved)
Figure 5: Average Net Consumer cost of Decarbonisation policies per tonne of carbon dioxide saved, 2010-2018
3.24. Therefore it appears that the most economic and cost effective decarbonisation policies are those targeted at Demand side initiatives together with carbon prices to drive the transition of large scale conventional generation to a more renewable concentrated mix. Specifically demand side policies such as energy efficiency measures were the most effective for consumers costing just £21/tonne of CO2 saved based on BEIS estimates of their impacts – but only contributed to 20 Million tonnes saved. Carbon prices were the next most cost effective at £31/tonne CO2 saved but responsible for 320 million tonnes saved. Air Quality Directives cost £46/tonne while large scale renewable subsidies such as the Renewable Obligation cost £99/tonne. More significantly the FiT was the least cost effective, costing consumers on average £322/tonne saved and only saved 20 Million tonnes.
Framework Agreement to encourage Distributed Energy Resources (DER)
3.25. Manx Utilities’ Sustainable Generation Tariff applies to renewable generation including micro wind or ‘run of the river’ water turbines, solar PVs panels or a combination arrangement.
3.26. The terms and structure of MUA’s Domestic and Commercial Sustainable Generation tariffs are subject to annual reviews and therefore do not provide long term assurance to prospective homeowners considering investing in renewable generation the assurance that the currently attractive terms are not maintained throughout the design life of their ‘green’ investment. ‘Grandfather’ rights would need to be considered for existing and prospective domestic and commercial renewable
Work Package 31 IMPACT Report Appendix 15(a)
15
investments where both the level of export tariff is ‘guaranteed’ throughout the life of the renewable scheme and no disadvantageous fixed standing charges are applied which impair the investment return for the project.
4. CONCLUSION
4.1. Exploring extensively best practices in the UK to assess the most cost effective decarbonisation policies to transition to a net zero emissions position, the introduction of carbon prices appear to be the most cost effective solution and the use of small scale renewable subsidies appear to be the least cost effective strategy.
4.2. However to encourage individual and community engagement, some small scale renewable subsidies are required in the short term and this would best be implemented using a standard Framework agreement.
4.3. Key issues to be addressed by a new MUA Framework Agreement include:
• Agreement on the baseline level of export tariff and some robust indication of the rate of escalation of the unit export price over the lifetime of the renewable investment project – in most cases this would be for 20 years;
• No disadvantageous fixed standing charges imposed during the life of the commercial ‘green’ investment;
• Currently MUA’s industrial customers on a Maximum Demand (MD) tariff considering renewable schemes greater than 50 kW in capacity are subject to an onerous Reserve Demand Charge (RDC) which historically was levied on large scale Combined Heat and Power plant (CHP). A ‘green’ significantly lighter RDC should be levied on renewable self-generation which reflects the significantly smaller load factor that say solar PV installations impose on MUA’s network system;
• MD customers do not receive an export tariff for their renewable schemes. This should be changed to a level at a small premium to MUA’s CCGT levelised cost of generation to reflect the green premium;
• Surplus renewable generation from embedded ‘green ‘ generation should be directed to future EV and HP households to guarantee a ‘green ‘ supply and reduced carbon footprint.
Work Package 31 IMPACT Report Appendix 15(a)
16
5. FURTHER READING 1. https://www.manx.net/isle-of-man-news/2957/mea-commends-m-s-as-first-green-
tariff-customer;
2. http://eng.janrosenow.com/uploads/4/7/1/2/4712328/rosenow_and_eyre_2013_the_green_deal_and_the_energy.pdf
3. https://www.energy-storage.news/news/ireland-to-incentivise-solar-plus-storage-with-household-grants
4. https://www.manxutilities.im/media/1783/sgt001.pdf
5. https://www.ofgem.gov.uk/publications-and-updates/state-energy-market-2019
6. https://assets.publishing.service.gov.uk/government/uploads/system/uploads/attachment_data/file/775333/energy-company-obligation-guidance-2018.pdf
7. https://www.gov.im/media/624419/aeamainreport.pdf