Embed Size (px)
Citation preview
NATIONAL CENTER FOR EDUCATION STATISTICS
Essential Skills inMathematicsA Comparative Analysis ofAmerican and Japanese Assessmentsof Eighth-Graders
John A. DosseyDepartment of MathematicsIllinois State University
Lois Peak and Dawn Nelson, Project OfficersNational Center for Education Statistics
U.S. Department of EducationOffice of Educational Research and Improvement NCES 97-885
For sale by the U.S. Ckwemment Riming OfficeSuperintendent of Dncuments, Mail Stop SSOP, Wadungton, DC 20402-932S
U.S. Department of EducationRichard W. RileySecretatyOffice of Educational Research and ImprovementMarshall S. SmithActing Assistant Secreta~
National Center for Education StatisticsPascal D. Forgione, Jr.Commissioner
The National Center for Education Statistics (NCES) is the primary federal entity for collecting,analyzing, and reporting data related to education in the United States and other nations. Itfulfills a congressional mandate to collect, collate, analyze, and report full and completestatistics on the condition of education in the United States; conduct and publish reports andspecialized analyses of the meaning and significance of such statistics; assist state and localeducation agencies in improving their statistical systems; and review and report on educationactivities in foreign countries.
NCES activities are designed to address high prioriy education data needs; provide consistent,reliable, complete, and accurate indicators of education status and trends; and report timely,useful, and high quality data to the U.S. Department of Education, the Congress, the states,other education policymakers, practitioners, data users, and the general public.
We strive to make our products available in a variety of formats and in language that isappropriate to a variety of audiences. You, as our customer, are the best judge of our successin communicating information effectively. If you have any c6mments or suggestions about thisor any other NCES product or report, we would like to hear from you. Please direct yourcomments to:
National Center for Education StatisticsOffice of Educational Research and ImprovementU.S. Department of Education555 New Jersey Avenue NWWashington, DC 20208-5574
April 1997
The NCES World Wide Web Home Page ishttp:/Avww.ed.govlNC ESI
Suggested CitationU.S. Department of Education. National Center for Education Statistics. Essential Skills inMathematics: A Comparative Analysis of American and Japanese Assessments ofEighth-Gmders, NCES 97-885, by John A. Dossey. Lois Peak and Dawn Nelson, ProjectOfficers. National Household Education Survey, Washington, DC: 1997.
Each year the National Center for Education Statistics (NCES) commissions papers byrecognized experts on topics of interest. These ppers are published by NCES to preserve theinformation contained in these documents and to promote the sharing of valuable workexperience, unique expertise, and knowledge. However, these papers do not undergo vigorousNCES publication review and editing prior to their publication. The conclusions, opinions,and/or recommendations contained in the ~pers are those of the authors and do notnecessarily reflect the views of NCES or the U.S. Department of Education. Consequently, weencourage readers of the papers to contact the individual authors regarding questions and forcitations.
Contact:Dawn Nelson(202) 219-1740
Acknowledgments
The present report was completed in 1996 and is the result of significant input from a number ofindividuals. Lois Peak at the National Center for Education Statistics (NCES) initiated the study and suggestedimportant frames of reference throughout the early stages of its development.
Along the way, I profited by continued input from Sayuri Takahira who carefully translated the Japaneseresults and provided interpretive guidance on exact meanings of several terms. Colleagues, including EizoNagasaki, Toshio Swada, and Hanako Senuma, at the National Institute for Educational Research at theMinistry of Education in Tokyo, Japan, also provided input and helpful assistance at points in the analysis ofresults and interpretations of the curriculum in Japan. Similar input was received from Steve German andSharif Shakrani who reviewed the document at NCES and from Mary M. Lindquist, Call away Professor ofMath Education at Columbus State University.
Ina Mull is (formerly at the National Assessment of Educational Progress Center at Educational TestingService (ETS) and now at Boston College) and Chan Jones and Jeff Haberstroh at ETS provided support inidenti~ing and classi~ing comparable items from the NAEP item pool for comparative analysis. Pat Kenneyof the University of Pittsburgh’s Learning Research and Development Center’s NCTM/NAEP InterpretiveProject provided helpful assistance in tracking down elusive p-values for several items.
Dawn Nelson at NCES carefull y guided the report through its final development and publ ication processat NCES. And last, but not least, my wife Anne assisted through data analysis, proof-reading, and providedother forms of support across the span of the project,
.
. . .Ill

Contents
Acknowledgments . . . . . . . . . . . . . . . . . . . . . . . . . . . . . . . . . . . . . .
Chapter l: Background and Purpose. . . . . . . . . . . . . . . . . . . . . . . . . . . .
Introduction . . . . . . . . . . . . . . . . . . . . . . . . . . . . . . . . . . . . . . .
Data Sources . . . . . . . . . . . . . . . . . . . . . . . . . . . . . . . . . . . . . .
FormatoftheStudies . . . . . . . . . . . . . . . . . . . . . . . . . . . . . . . . . .
Chapter2:TheMathematicsAssessments . . . . . . . . . . . . . . . . . . . . . . . . .
JapaneseContentTests . . . . . . . . . . . . . . . . . . . . . . . . . . . . . . . . .
NAEPContentTests . . . . . . . . . . . . . . . . . . . . . . . . . . . . . . . . . .
Chapter3: The Items . . . . . . . . . . . . . . . . . . . . . . . . . . . . . . . . . . . . .
NumbersandOperations . . . . . . . . . . . . . . . . . . . . . . . . . . . . . . . .
Measurement . . . . . . . . . . . . . . . . . . . . . . . . . . . . . . . . . . . . . .
Geometry . . . . . . . . . . . . . . . . . . . . . . . . . . . . . . . . . . . . . . . .
Data Analysis, Statistics, and Probability. . . . . . . . . . . . . . . . . . . . . . . .
AlgebraandFunctions . . . . . . . . . . . . . . . . . . . . . . . . . . . . . . . . . .
Chapter4:ARetrospectiveView . . . . . . . . . . . . . . . . . . . . . . . . . . . . . .
The Assessments . . . . . . . . . . . . . . . . . . . . . . . . . . . . . . . . . . . .
The Curriculum . . . . . . . . . . . . . . . . . . . . . . . . . . . . . . . . . . . . .
FocusandIntensity . . . . . . . . . . . . . . . . . . . . . . . . . . . . . . . . . . .
References . . . . . . . . . . . . . . . . . . . . . . . . . . . . . . . . . . . . . . . . . .
Appendix A: Content Matrix for the 1992 NAEPMathematics Assessment . . . . . . .
Appendix B: Mathematical Abilities forthe 1992 NAEPMathematics Assessment . . .
Appendix C: Framework forthe Japanese Essential Mathematics Assessment . . . . . .
. . .111
1
1
.2
.2
.7
.8
.9
13
13
14
15
24
26
37
37
38
39
41
43
53
57
v

Chapter 1: Background and PurposeIntroduction
The definition of essential skills in mathematics has long been a goal of mathematics educators andothers interested in the school mathematics curriculum. From the late 1970s forward, attempts have beenmade in the United States to provide a framework defining the basic essentials of mathematics that all studentsshould know and be able to apply (National Council of Supervisors of Mathematics, 1977; National Councilof Teachers of Mathematics, 1980, 1981). Such recommendations for new directions in school mathematicscalled for a broader view of content and, in general, an increased emphasis on the development of studentabilities to solve non-routine problems. These changes brought incremental changes in classrooms wherethe overall focus remained on number work and teacher dominated discussion of mathematics. In the late1980s, the Nat ional Counci I of Teachers of Mathematics (NCTM) produced its Curriculum and EvaluationStandardsforSchoo/ Mathematics (NCTM, 1989). This document was designed to help strengthen the effortsin the United States toward developing foci for the mathematics curriculum. While its goals have yet to beimplemented on a wide scale basis (Weiss, 1995), it has influenced changes made in the definition ofmathematics used for the Department of Education’s National Assessment of Education Progress (NAEP)mathematics assessments (NAEP, 1987, 1988).
Over this same period of time, from the 1970s through the 1980s, there was increasing evidence thatthe traditional mathematics curriculum was not preparing U.S. students to the same level of understandingas the Japanese curriculum was preparing students in Japanese schools (Husen, 1967; McKnight, et al., 1987;Travers & Westbury, 1989; Robitaille & Garden, 1989). Although the Second International MathematicsStudy (SIMS) was unable to locate specific factors accounting for the differences in U.S. and Japanesestudents’ performance by the junior high school level, there was strong circumstantial evidence that theoutmoded and unfocused mathematics curricular program of the early grades combined with the ways inwhich mathematics is taught in the elementary and middle grades was a probable cause (Leestma & Walberg,1992; Stevenson, et al., 1990; Stigler, et al, 1990: Stigler & Perry, 1988). Specific evidence indicated thatstudents in Japanese classrooms had greater opportunities to learn and were often expected to mastermathematical topics one- to two-years ahead of the time that American students first encountered similartopics. However, great emphasis was also placed on the differences in child-rearing and in the earlyeducational experiences of children in the two societies as significant factors in creating the differences inmathematical performance.
Studies comparing the mathematical achievement, or proficiency, of the two nations’ students havebeen hard to interpret. Studies by the International Association for the Evaluation of Educational Achieve-ment (IEA) have provided one vantage point. However, many critics contend that the IEA analyses are basedon tests that contain items which not all students have had equal opportunities to learn in their schooling.The IEA tests are aimed to measure across a broad framework of mathematical skills and abilities, butinvariably measure items included in neither country’s curriculum. Analyses indicated that the IEA testswere probably equal I y disadvantageous to each group of students. In the Second International MathematicsStudy, the comparison groups of students were Japan’s seventh-graders and the United States’ eighth-graders.Studies carried out by Stevenson and Stigler and their associates measured student achievement with testsbetter fitted to the curricula studied by Japanese and American students, but their work only included studentsthrough the fifth grade level. In the early 1990s, new sets of data became available that made another formof comparison possible between Japanese and American eighth-graders. This was data from assessmentsgiven in each country, using tests developed via governmental agencies. In Japan, the test was developed bythe Japanese National Institute of Educational Research and administered to a sample of eighth-graders inschools chosen according to some criteria. In the United States, the test administered to a random sample ofeighth-graders was developed for the National Assessment of Educational Progress (NAEP). In both cases,these tests were developed to mirror the basic curricula currently being offered to students in the two
countries. Unlike other comparative studies, these tests were developed to assess the essential componentsof the taught curriculum in each country. During this period of time, both countries were undergoingsignificant changes in their school mathematics programs (Ministry of Education, n.d.; NIER, 1992; NationalCouncil of Teachers of Mathematics, 1989; NAEP, 1988).
In each country, students were assessed using examinations designed specifically for students in theircountry. The present paper compares the nature of these examinations, the expectations based on thecurriculum, and student performances on the included items. This comparison, combined with an accompa-nying analysis of the curricular intents for students of grade two in the lower secondary school in Japan, theequivalent of grade eight in American schools, and students in grade eight in the United States provides arich picture of the differences in student performance and curricular emphases and expectations that markthis study. From this point forward, we shall refer to both groups as eighth-graders.
Data Sources
The study makes use of data drawn from the Japanese National Institute of Educational Research’sSpecial Study on Essential Skills in Mathematics (NIER, 1992) and data from U.S. student performance onthe 1990 and 1992 NAEP mathematics assessment (Mullis, et al., 1991, 1993). These data provide the firstcomparison of Japanese eighth-graders and American eighth-graders since the data collected during 1964 inthe First International Mathematics Study (Hus6n, 1967). However, in this case, the performance of eachgroup of students is measured on a different set of items developed in their own country.
Format of the Studies .Each of the studies described in the following sections examined content achievement assessments,
students’ and teachers’ beliefs and attitudes, as well as environmental characteristics of the classroom, school,and community. While the full nature of the studies is briefly detailed to understand the context of the datacollection, the following analyses are limited to the:
● comparison of mathematics items tested on the Japanese NIER and American NAEP mathematicsexaminations, and
● comparison of items to the espollsed curriculum that each student was to have studied.
In doing so, the NAEP item and ability classifications will be used to describe items of content andtheir intent (NAEP, 1988).
Japanese Study. The Japanese data result from a study conducted by the National Institute ofEducational Research to develop a definition of “essential achievement level” in mathematics and todetermine the variables which may influence the formation of essential achievement. To accomplish thispurpose, the study investigated the relationships between mathematics achievement and a number ofvariables, including:
. Student attitudes: Motivation, interest, self assessment of performance or achievement, plans for thefuture, purpose of the studying, etc.
. School environment: Teacher attitudes (teaching, teacher training, and specialization), schoolcharacteristics (number of teachers in each subject, number of students, number of classrooms, andfrequency of use).
. Environment outside school: Population of the town or city, distinction between urban and ruralareas (NIER, 1992, p. 1).
2
This study encompassed the areas of mathematics, Japanese language, social studies, science, andEnglish. The data examined in the present paper result from the 1990 testing of eighth-graders in mathematics.The actual assessment instruments were constructed by teachers from public schools, university faculty, andinvestigators from the ministry of education.
The resulting examinations, to be described later, were administered to a nationally representativesample of students selected from schools in eight prefectures and two cities, see figure 1. The prefecturesw e r e Hokkaido, lwate Ken, Chiba Ken, Toyama Ken, Shiga Ken. Okayama Ken. Kagawa Ken, a n dKagoshima Ken. The cities were Tokyo and Nagoya. Four schools were selected in each of the cities andfour schools were selected in each prefecture. In each prefecture, one school was selected from each of thefollowing areas:
● capital city of prefecture;
● suburbs of each capital city;
● city or town with population less than 100,000; and
● areas neighboring city or town with population less than 100,000 (NIER, 1992, p. 2).
In each school selected, one eighth-grade classroom was selected and all students in that class servedas subjects in the study for that school site. This resulted in 40 classrooms of students with 1,441 studentsfor an average class size of 36 students.
The administration of assessment instruments was done by thi students’ classroom teachers. For theeighth-grade mathematics assessment, there were two forms of the mathematics achievement instrument anda questionnaire for both students and teachers to acquire background information on student attitudes andenvironmental variables, as described above. These instruments were completed in two successive classperiods. During the first session, students were given 45 minutes to complete the 22 mathematics achievementitems on their tests. This gave Japanese students about twice the amount of time per mathematics item asgiven American students on the NAEP examination. During the following session, students were given 40minutes to complete the student background questionnaires concerning their attitudes and other relevantfamily and environmental information. This assessment took place in a time period between January21, 1990and March 20, 1990.
United States Stud’. The NAEP mathematics assessments have been given on a somewhat regularschedule since 1973, with assessments in 1973, 1978, 1982, 1986, 1990, and 1992. These assessments havemeasured the performance of U.S. students at both ages 9, 13, and 17, and grades 4, 8, and 12. Assessmentsare given in a wide variety of areas including mathematics, science, social studies, reading, and writing. Thedata collected are used to provide a rich mosaic picture of the current status of schooling in the United States.Achievement tests in the subject areas provide a picture of the proficiency levels of students at the respectiveages or grades. They also provide information about long-term trends in what students know and are able todo in particular subject-matter areas in the curriculum. The assessments also collect background data onstudent attitudes and beliefs, as well as demographic information about their homes, families, and mathe-matical backgrounds. Additional information is gathered from teachers and administrators about the class-room and school environments. This data contains background information on teachers, their teaching styles,the school curricula, and the community.
The NAEP mathematics assessment instruments are developed by a committee of mathematics teachers,university faculty, and mathematics professionals on the staff of Educational Testing Service, the contractorresponsible to the government for conduct of the study. Prior to usage, the tests and questionnaires go throughan approval process that includes representatives from both the policy and mathematics branches of stateeducation agencies.
3
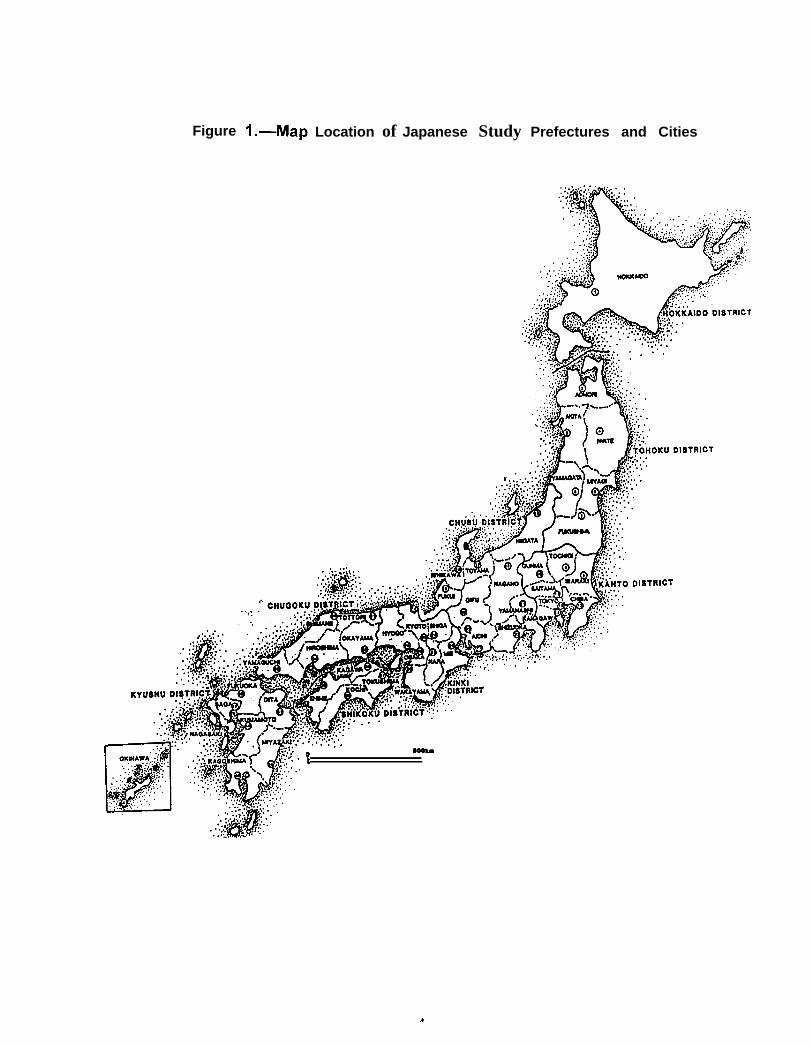
Figure 1 .—Map Location of Japanese Study Prefectures and Cities
.-!
mom
4
The actual sampling of students and data collection for both the 1990 and 1992 NAEP eighth-grademathematics assessments was conducted by Westat, Inc. The three-stage sampling design for NAEPassessments consists of the selection of geographical sampling units, the random selection of schools withinthat geographical region, and the random selection of eighth-graders from within the chosen schools. Somestudents, less than 6 percent, are excluded due to limited English proficiency or severe disabilities. In both1990 and 1992, 406 schools containing eighth-graders participated in the NAEP study. This number ofschools represented an 84 percent participation rate in 1990 and an 87 percent participation rate in 1992 fromamong the schools randomly chosen to participate in the study. Within these schools, lists of students wereagain randomly sampled. In 1990, 8,888 students participated and in 1992, 9,432 students participated. Ineach year, the percentage of students participating represented 89 percent of the students random Iy selectedfor participation.
Each student received a booklet containing a set of questions about his/her mathematics background,three 15-minute blocks of mathematics items, and a set of questions about his/her motivation. Students wereallowed 50 minutes to respond to the three blocks of mathematics items and the background information.The mathematics items in the three blocks to which an individual student would respond were portions of abroader set of mathematics items. This broader set of items consisted of191 items in 10 different blocks in1990 and 235 items in 16 blocks in 1992. These items were spiraled into students’ test booklets accordingto a balanced incomplete block design which allows for broader coverage of the mathematics content whileminimizing the burden placed on any individual student. Thus, during the 45 minute mathematics examina-tion period, an individual eighth-grader in the U.S. had approximately 57 items to respond to in 1990 and 44items to respond to in 1992. This decrease in the average number of items per student between the assessmentswas accompanied by an increase in the number of items requiring students to construct their own responseto the item, rather than select a response from a multiple choice question. In these years, the individualeighth-grader in the U.S. had approximately 2 to 2.5 times as many items as Japanese students were askedto do in a similar time period.
Trained field staff provided by Westat collected all of the data for the 1992 mathematics assessment.The data was collected from January, 1992 through mid-March, 1992. The materials collected were scoredby National Computer Systems. This scoring included the open-ended student constructed response itemsincluded as part of the assessment. (Mullis, et al., 1991, 1993).
5

Chapter 2: The Mathematics AssessmentsThe mathematics content tests given students as part of both nations’ examinations were intended to
be reflective of content that was deemed appropriate for eighth-grade students in Japan. In the United States,items were chosen according to the content matrix established for the 1990 and 1992 NAEP mathematicsassessments. This matrix was developed in late fall 1988 by a committee of teachers of mathematics, statesupervisors of mathematics, and university faculty in mathematics education and mathematics. In doing so,the NAEP mathematics framework committee, chosen by the Council of Chief State School Officers, useda draft of the NCTM Standards as a guide to item specification and grade level emphasis. A copy of th iscontent matrix is included in appendix A. This framework divides school mathematics into five major contentareas: Numbers and Operations; Measurement; Geometry; Data Analysis, Statistics, and Probability; andAlgebra and Functions. The content to be included in each of these areas is rather self-explanatory. A moredetailed definition of each of the areas is given in appendix A. For each subarea of content within the fivegroups, a darkened bullet is displayed to the right in the appendix materials indicating if that material isappropriate for assessment purposes at grade 4, 8, or 12. These judgments were developed by the NAEPmathematics framework committee and were open to comment by mathematics educators nationwide beforefinal revisions and final adoption.
The Japanese mathematics assessment was constructed based on a framework developed specificallyfor the research study of which it was a part (NIER, 1992). The material accompanying the assessmentmaterials detai Is attempts to develop a position on essent ial mathematics achievement. In attempting to moveto such a definition, the researchers established the following tenets:
.. Mathematics achievement extends beyond the acquisition of concepts and related skills, to include
individuals’ attitudes and motivations in mathematical situations.
● While mathematics problems worked in class oflen have little relationship to reality, individualsshould be able to successfully deal with mathematics problems in their everyday lives and theclassroom, by solving them and verifying their solutions.
. Individuals should be able to productively transfer their mathematical concepts and skills, as wellas problem-solving abilities, from mathematics classrooms to other situations in their lives.
Using these tenets, the researchers at the Japanese National Institute of Educational Research (NIER,1992) defined essential achievement in mathematics as:
Essential mathematical achievement is a necessary level of achievement in order to solveproblems mathematically in academic institutions and society. It includes the possibility ofbeing able to cope with new situations. From the viewpoint of the development of students,the contents of the basic achievement level ought to make it possible for teachers to guideand teach students. The essential achievement level should be learned effectively in theschool system (p. 11).
In many ways, this movement to define essential achievement in mathematics for Japanese eighth-grad-ers is similar to the attempts to define achievement levels for American students of the same age for theNAEP assessment analyses.
In structuring the mathematics assessments, the Japanese developers created a three-dimensional matrixframework. The dimensions of the matrix were behavior types, contents of mathematics, and mathematicalprocesses. The subcategories of each are similar in some ways to the contents of the NAEP framework. Thebehavior types dimension was further divided into the behaviors of knowledge, understanding, thoughts,skit Is, and attitudes. The contents of mathematics dimension was divided into three branches: numericalcontent, geometrical content, and relational content. The third dimension, mathematical processes, wasbroken into the subcategories of mathematicalization, mathematical transaction, and mathematical verifica-
7
tion. These three process categories define the dynamic use of mathematics by students as they apply it totranslating problems into mathematics, using mathematical knowledge to solve the problems, and verifyingthat the results obtained fit the problem and answer the original questions. A further description of theJapanese framework is contained in appendix C.
Japanese Content Tests
The 40 items chosen by the research group designing the assessments for the Japanese study wereplaced into two forms, C and D, for ease of administration. Each form contained 22 items. Four items wereincluded on both forms of the examination as a cross-check on the comparability of the two forms. Thuseach form had 18 unique items and the set of four items used as a cross-check between Forms C and D.Students in each of the classes were divided into two groups and the members of each group received oneof the forms of the test. They were given 45 minutes to complete the 22 items on the form, All, but two, ofthe items were mu Itiple-choice in format. The two exceptions were an item which required students to sketchthe planar net associated with a spatial perception item and another item which required students to draw aline having a special property onto a figure.
The items included in the 40-item pool reflected current thinking about the nature of mathematicalessentials al I students at the grade level should have. However, eight items were chosen from earlier studies:the survey of achievement level ( 198 1-82) and the academ ic achievement survey which was conducted before1981 (NIER, 1992).
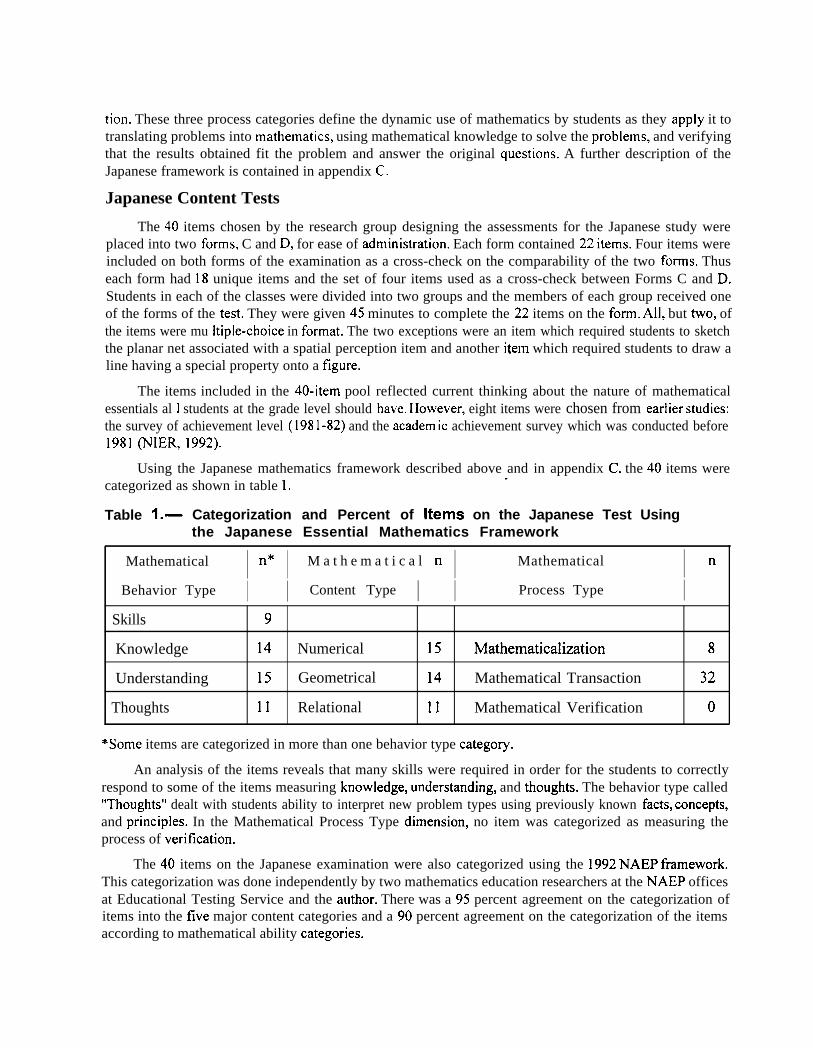
Using the Japanese mathematics framework described above and in appendix C. the 40 items werecategorized as shown in table 1,
.
Table l.— Categorization and Percent of Items on the Japanese Test Usingthe Japanese Essential Mathematics Framework
Mathematical I n* I M a t h e m a t i c a l n I Mathematical I n
Behavior Type I I Content Type I I Process Type ISkills 9
Knowledge 14 Numerical 15 Mathematicalization 8
Understanding 15 Geometrical 14 Mathematical Transaction 32
Thoughts 11 Relational 11 Mathematical Verification o
*Some items are categorized in more than one behavior type category.
An analysis of the items reveals that many skills were required in order for the students to correctlyrespond to some of the items measuring knowledge, understanding, and thoughts. The behavior type called“Thoughts” dealt with students ability to interpret new problem types using previously known facts, concepts,and principles. In the Mathematical Process Type dimension, no item was categorized as measuring theprocess of verification.
The 40 items on the Japanese examination were also categorized using the 1992 NAEP framework.This categorization was done independently by two mathematics education researchers at the NAEP officesat Educational Testing Service and the author. There was a 95 percent agreement on the categorization ofitems into the five major content categories and a 90 percent agreement on the categorization of the itemsaccording to mathematical ability categories.
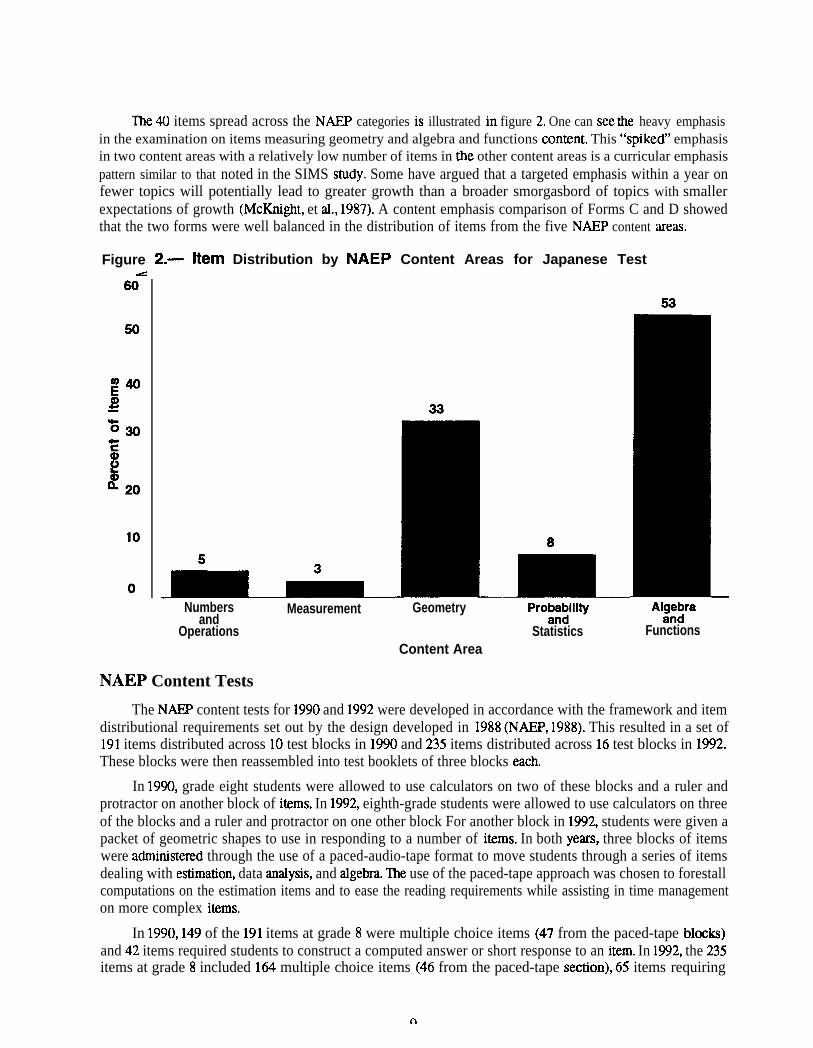
The 40 items spread across the NAEP categories is illustrated in figure 2. One can seethe heavy emphasisin the examination on items measuring geometry and algebra and functions content. This “spiked” emphasisin two content areas with a relatively low number of items in the other content areas is a curricular emphasispattern similar to that noted in the SIMS study. Some have argued that a targeted emphasis within a year onfewer topics will potentially lead to greater growth than a broader smorgasbord of topics with smallerexpectations of growth (McKnight, et al., 1987). A content emphasis comparison of Forms C and D showedthat the two forms were well balanced in the distribution of items from the five NAEP content areas.
Figure 2.— Item Distribution by NAEP Content Areas for Japanese Test
53
53
33
*Numbers Measurement Geometry Proba~illty Alge~ra
andOperations Statistics Functions
Content Area
NAEP Content Tests
The NAEP content tests for 1990 and 1992 were developed in accordance with the framework and itemdistributional requirements set out by the design developed in 1988 (NAEP, 1988). This resulted in a set of191 items distributed across 10 test blocks in 1990 and 235 items distributed across 16 test blocks in 1992.These blocks were then reassembled into test booklets of three blocks each.
In 1990, grade eight students were allowed to use calculators on two of these blocks and a ruler andprotractor on another block of items, In 1992, eighth-grade students were allowed to use calculators on threeof the blocks and a ruler and protractor on one other block For another block in 1992, students were given apacket of geometric shapes to use in responding to a number of items. In both years, three blocks of itemswere administered through the use of a paced-audio-tape format to move students through a series of itemsdealing with estimation, data analysis, and algebra. ‘I%e use of the paced-tape approach was chosen to forestallcomputations on the estimation items and to ease the reading requirements while assisting in time managementon more complex items.
In 1990, 149 of the 191 items at grade 8 were multiple choice items (47 from the paced-tape blocks)and 42 items required students to construct a computed answer or short response to an item. In 1992, the 235items at grade 8 included 164 multiple choice items (46 from the paced-tape section), 65 items requiring
9
students to construct a computed answer or write a short response to the item, and 6 items that required anextended written response on the part of the student.
Independent of which set of three blocks an individual student received in an individual student testbooklet, they had 45 minutes to respond to approximately 57 questions in 1990 and 44 questions in 1992.This was a much higher level of average number of items per student for a comparable time period than wasobserved in the Japanese tests. This placed from 2.5 to 2 times as much item response load per time periodon individual U.S. students, plus 22 percent of the NAEP items in 1990 and 30 percent in 1992 required U.S.students to produce some form of self-constructed written response.
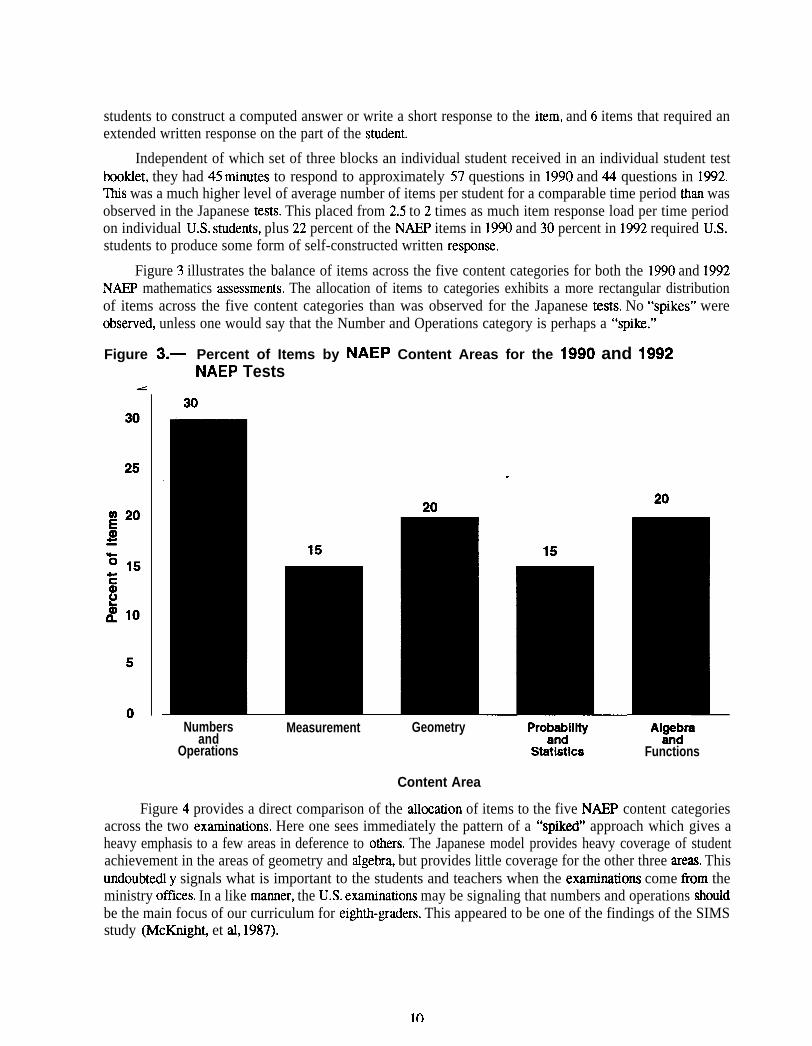
Figure 3 illustrates the balance of items across the five content categories for both the 1990 and 1992NAEP mathematics assessments. The allocation of items to categories exhibits a more rectangular distributionof items across the five content categories than was observed for the Japanese tests. No “spikes” wereobserved, unless one would say that the Number and Operations category is perhaps a “spike.”
Figure 3.— Percent of Items by NAEP Content Areas for the 1990 and 1992NAEP Tests
30
15
.
20
15
Numbers Measurement Geometry Probd#ty Ala~~reand
Operations Statlstlce Functions
Content Area
Figure 4 provides a direct comparison of the allmation of items to the five NAEP content categoriesacross the two examinations. Here one sees immediately the pattern of a “spiked” approach which gives aheavy emphasis to a few areas in deference to others. The Japanese model provides heavy coverage of studentachievement in the areas of geometry and algebr~ but provides little coverage for the other three areas. Thisundoubted y signals what is important to the students and teachers when the exarnimtions come horn theministry oftlces, In a like manner, the U.S. examimtions may be signaling that numbers and operations shouldbe the main focus of our curriculum for eighth-graders. This appeared to be one of the findings of the SIMSstudy (McKnigh6 et al, 1987).
10
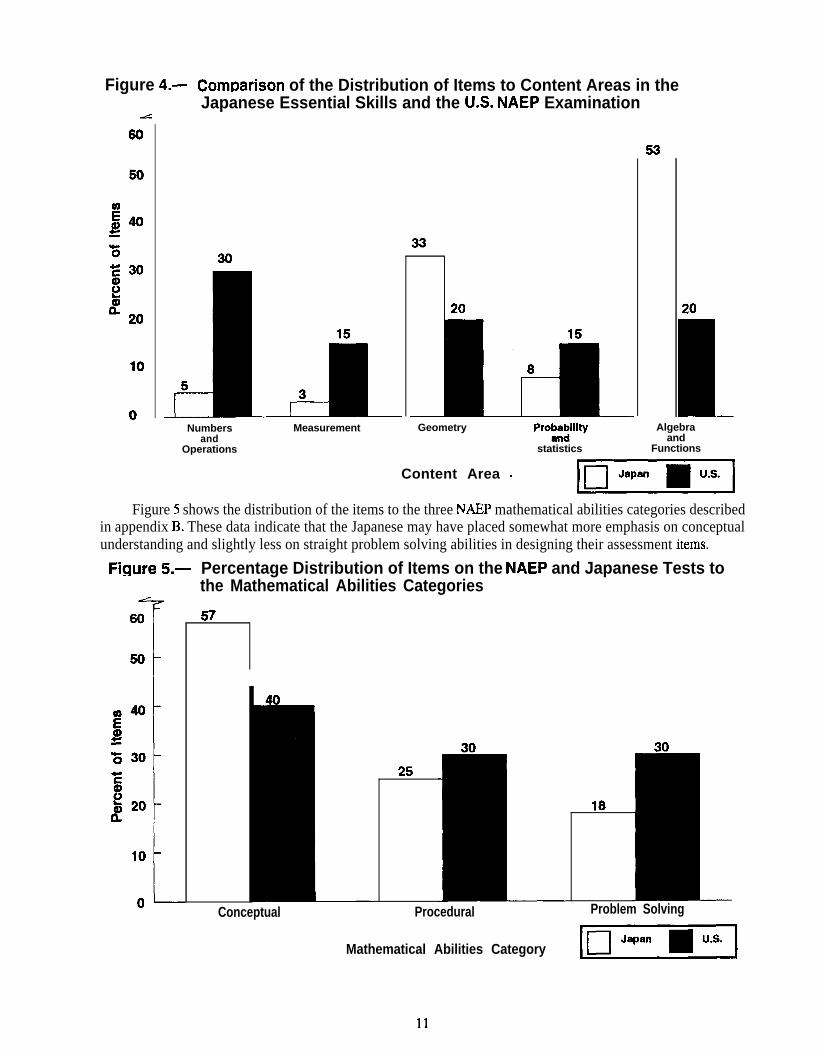
Figure 4.— Com~arison of the Distribution of Items to Content Areas in theJapanese Essential Skills and the U.S. NAEP Examination
30
Numbers Measurementand
Operations
33
20
Geometry Proba:llity
statistics
Content Area .
53
20
LAlgebra
andFunctions
Figure 5 shows the distribution of the items to the three NAEP mathematical abilities categories describedin appendix B. These data indicate that the Japanese may have placed somewhat more emphasis on conceptualunderstanding and slightly less on straight problem solving abilities in designing their assessment items.
Figure 5.— Percentage Distribution of Items on the NAEP and Japanese Tests tothe Mathematical Abilities Categories
T60
50)-1
57
25
10
0 LConceptual Procedural
Mathematical Abilities Category
18
Problem Solving
DEEl11

Chapter 3: The ItemsIn the following sections, each devoted to a content area, examples of the items from each assessment
will be provided to compare the nature of the items and the cognitive load each presents for the studentstaking the examinations. In a direct comparison of items from the NAEP pool. 38 items were classified inthe same cells as those from the Japanese assessment. Of these, 21 are still in the secure pool for use in laterNAEP assessments for the determination of proficiency, trends in the content areas. These items will not bedisplayed, but performance on those from the grade eight examinations and general descriptions of theircontent and format will be provided to give some idea of the comparability of the assessments and their results.More in-depth analysis of the 1990 and 1992 NAEP assessments and items can be found in the national reportsdescribing these assessments (Mull is, et al., 1991,1993).
Numbers and Operations
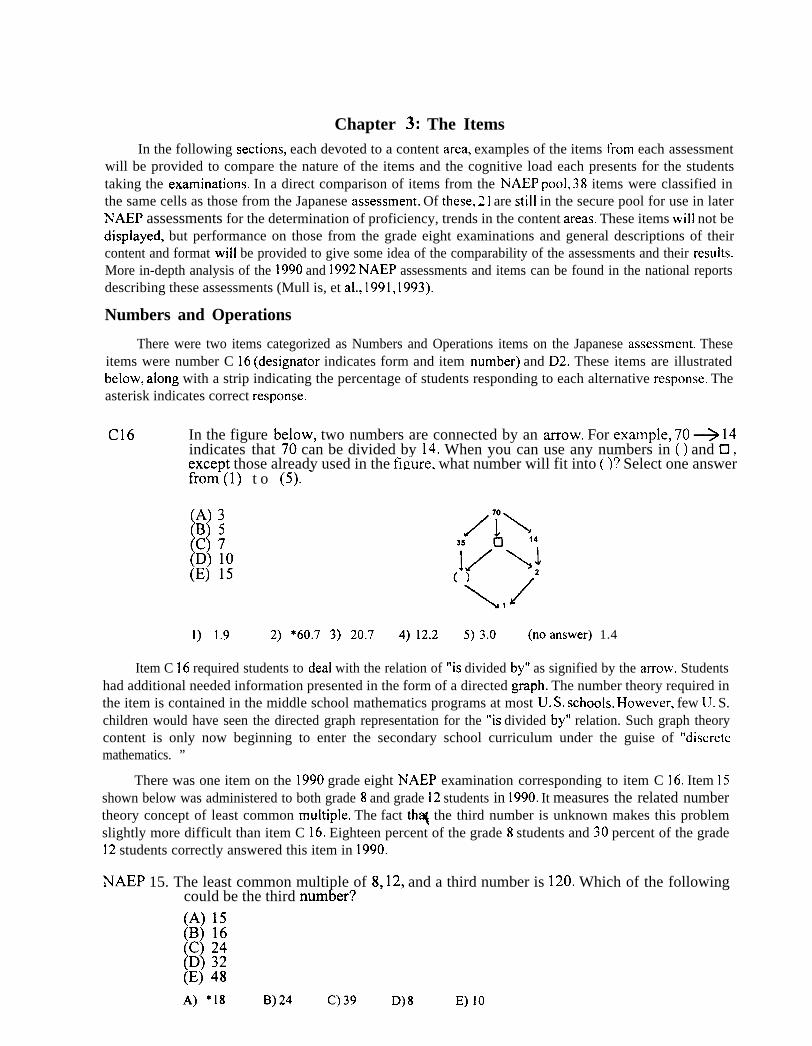
There were two items categorized as Numbers and Operations items on the Japanese assessment. Theseitems were number C 16 (designator indicates form and item number) and D2. These items are illustratedbelow, along with a strip indicating the percentage of students responding to each alternative response. Theasterisk indicates correct response.
C16 In the figure below, two numbers are connected by an arrow. For example, 70 + 14indicates that 70 can be divided by 14. When you can use any numbers in ( ) and D ,exceut those already used in the figure, what number will fit into ( )? Select one answerfrom’(1) t o (5). -
(A) 3(B) 5
[c) 7D) 10
(E) 15
1) 1.9 2) “60.7 3) 20.7 4) 12.2 5) 3.0 (no answer) 1.4
Item C 16 required students to deal with the relation of “is divided by” as signified by the arrow. Studentshad additional needed information presented in the form of a directed graph. The number theory required inthe item is contained in the middle school mathematics programs at most U. S. schools. However, few U. S.children would have seen the directed graph representation for the “is divided by” relation. Such graph theorycontent is only now beginning to enter the secondary school curriculum under the guise of “discretemathematics. ”
There was one item on the 1990 grade eight NAEP examination corresponding to item C 16. Item 15shown below was administered to both grade 8 and grade 12 students in 1990. It measures the related numbertheory concept of least common multiple. The fact th~ the third number is unknown makes this problemslightly more difficult than item C 16. Eighteen percent of the grade 8 students and 30 percent of the grade12 students correctly answered this item in 1990.
NAEP 15. The least common multiple of 8, 12, and a third number is 120. Which of the followingcould be the third number?
(A) 15
I
B) 16C) 24D) 32
(E) 48A) *18 B) 24 C)39 D) 8 E) 10
Item D2 of the Japanese examination required students to compare five numerical expressions whereoperations involving signed numbers were performed with an unknown number a and to decide which of thefive expressions represented the “biggest number.” While not required, no qualifications were placed on thevalues that a itself could be.
Like its predecessor, Item D2 had no direct counterpart on the 1992 NAEP examination. The contentof the item was judged as appropriate for assessing at the grade eight level, but no specific item measuringthe same content was included on the 1992 assessment.
D2. Which one is the biggest number among the following? Select one answer from (1)to (5).
(1) a-(-2)
(2) a - (-1/3)
(3) a - O
(4) a + (-1/3)
(5) a + (-2)1) *g65 2) 2.9 3) 5.2 4) 2.2 5) 2.9 (no answer) 0.1
Measurement
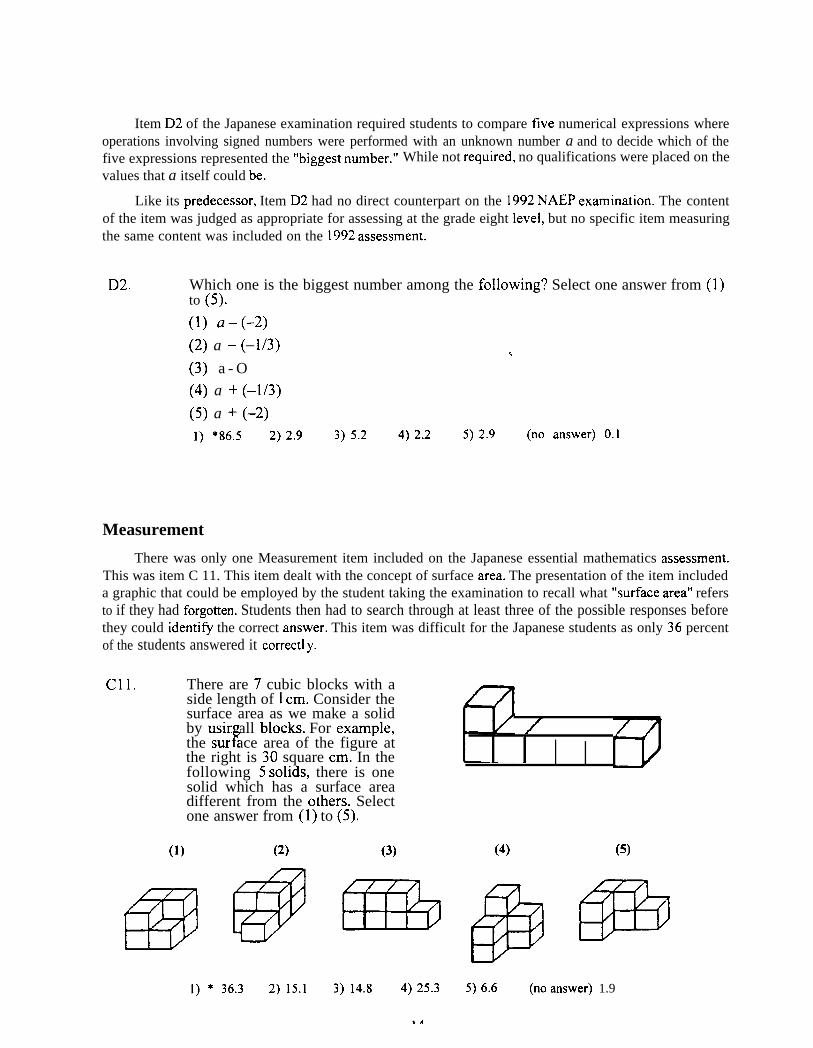
There was only one Measurement item included on the Japanese essential mathematics assessment.This was item C 11. This item dealt with the concept of surface area. The presentation of the item includeda graphic that could be employed by the student taking the examination to recall what “surface area” refersto if they had forgotten. Students then had to search through at least three of the possible responses beforethey could identifi the correct answer. This item was difficult for the Japanese students as only 36 percentof the students answered it correct] y.
C1l. There are 7 cubic blocks with aside length of 1 cm. Consider thesurface area as we make a solidby usin all blocks. For example,
Fthe sur ace area of the figure atthe right is 30 square cm. In thefollowing 5 solids, there is onesolid which has a surface areadifferent from the others. Selectone answer from (1) to (5).
(1) (2) (3)
m@Q=$[ 1 v
]) * 36.3 2) 15.1 3) 14.8 4) 25.3
14
I I I 10(4) (5)
5) 6.6 (no answer) 1.9
There were two unreleased (secure) items on the 1990 NAEP that correspond to item C 11. The first ofthese required students to identi~ which of five possible alternatives gave the surface area for a rectangularsolid of blocks when provided with a graphic illustration of a pile of blocks similar to that shown in C 11.Only 20 percent of the students taking this item completed it correctly. The cognitive load for this item wasless, since there were no indentations in the surface. The derivation of the answer \vas very straightforward.There was little a student could do with the item stem to discover the meaning of “surface area” had theyforgotten. as was possible in item C 11.
The other corresponding item on the 1990 NAEP examination was an item which presented studentswith a planar net for a cube and asked them to identifi a pair of opposite surfaces. Performance wasconsiderable y higher on this item, with 51 percent of the students correctly answering the item. This item isconsidered to correspond to C 11 because some spatial representation skills are needed to correctly completeeither item.
Geometry
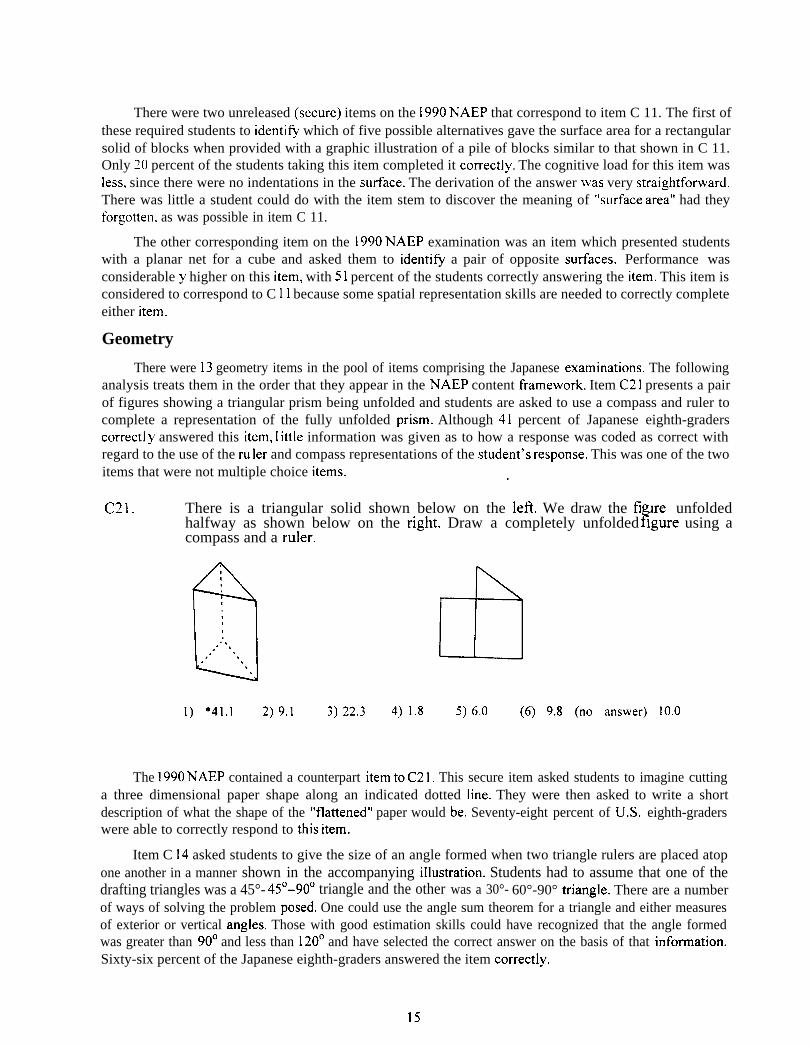
There were 13 geometry items in the pool of items comprising the Japanese examinations. The followinganalysis treats them in the order that they appear in the NAEP content framework. Item C21 presents a pairof figures showing a triangular prism being unfolded and students are asked to use a compass and ruler tocomplete a representation of the fully unfolded prism. Although 41 percent of Japanese eighth-graderscorrect] y answered this item, I ittle information was given as to how a response was coded as correct withregard to the use of the ru Ier and compass representations of the student’s response. This was one of the twoitems that were not multiple choice items. .
C21. There is a triangular solid shown below on the left. We draw the fi ure unfoldedFhalfway as shown below on the right. Draw a completely unfolded lgure using a
compass and a ruler.
0,. .. $.,“ .
.
1) *411 2) 9.1 3) 22.3 4) 1.8 5) 6,0 (6) 9.8 (no answer) 10.0
The 1990 NAEP contained a counterpart itemtoC21. This secure item asked students to imagine cuttinga three dimensional paper shape along an indicated dotted line. They were then asked to write a shortdescription of what the shape of the “flattened” paper would be. Seventy-eight percent of U.S. eighth-graderswere able to correctly respond to this item.
Item C 14 asked students to give the size of an angle formed when two triangle rulers are placed atopone another in a manner shown in the accompanying illustration. Students had to assume that one of thedrafting triangles was a 45°- 45°-900 triangle and the other was a 30°- 60°-90° triangle. There are a numberof ways of solving the problem posed. One could use the angle sum theorem for a triangle and either measuresof exterior or vertical angles. Those with good estimation skills could have recognized that the angle formedwas greater than 90° and less than 120° and have selected the correct answer on the basis of that information.Sixty-six percent of the Japanese eighth-graders answered the item correctly.
15
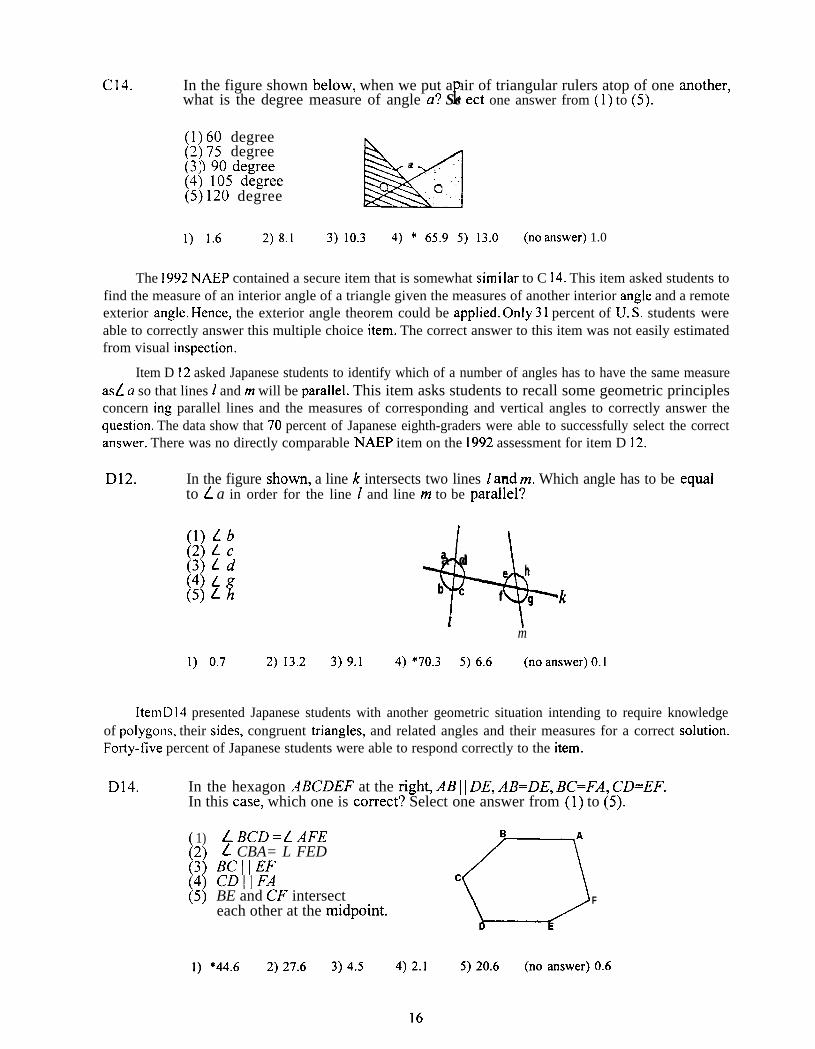
C14. In the figure shown below, when we put a air of triangular rulers atop of one another,rwhat is the degree measure of angle a? Se ect one answer from (1) to (5).
(1) 60 degree(2) 75 degree
- ) 90 demee kXl
a(3;(4) 105 d;gree(5) 120 degree
1) 1.6 2) 8.1 3) 10.3 4) * 65.9 5) 13.0 (no answer) 1.0
The 1992 NAEP contained a secure item that is somewhat simi Iar to C 14. This item asked students tofind the measure of an interior angle of a triangle given the measures of another interior angle and a remoteexterior angle. Hence, the exterior angle theorem could be applied. Only 31 percent of U. S. students wereable to correctly answer this multiple choice item. The correct answer to this item was not easily estimatedfrom visual inspection.
Item D 12 asked Japanese students to identify which of a number of angles has to have the same measureas~ a so that lines 1 and m will be parallel. This item asks students to recall some geometric principlesconcern ing parallel lines and the measures of corresponding and vertical angles to correctly answer thequestion. The data show that 70 percent of Japanese eighth-graders were able to successfully select the correctanswer. There was no directly comparable NAEP item on the 1992 assessment for item D 12.
D12. In the figure shown, a line k intersects two lines 1 and m. Which angle has to be equalto L a in order for the line 1 and line m to be parallel?
(1) L b(2) L c(3) L d
$jif
+---i-
a dh
b f gk1
m
1) 0.7 2) 13.2 3) 9.1 4) *70.3 5) 6.6 (no answer) 0.1
Item D 14 presented Japanese students with another geometric situation intending to require knowledgeof polygons, their sides, congruent triangles, and related angles and their measures for a correct solution.Focty-five percent of Japanese students were able to respond correctly to the item.
D14. In the hexagon ABCDH’ at the right, All I \ DE, AlI=DE, BC=l?A, CD=EF.In this case, which one is correct? Select one answer from (1) to (5).
[1)2)
(:)
[)5
L BCD =[ AFEL CBA= L FED m;h’\\;.
cBE and CF intersect
w
Feach other at the midpoint.
1) *44.6 2) 27.6 3) 4.5 4) 2.1 5) 20.6 (no answer) 0.6
16
Like the preceding item, there was no direct counterpart to this item on either the 1990 or 1992 NAEPexaminations. This item called for several applications of geometric properties usually taught in either theninth- or tenth-grade in the U. S. It seems, based on students’ opportunity to learn, that such an item wouldbe inappropriate at the present for the great majority of U.S. eighth-graders. Visually the item is much easierthan actually having to construct the location of point P,
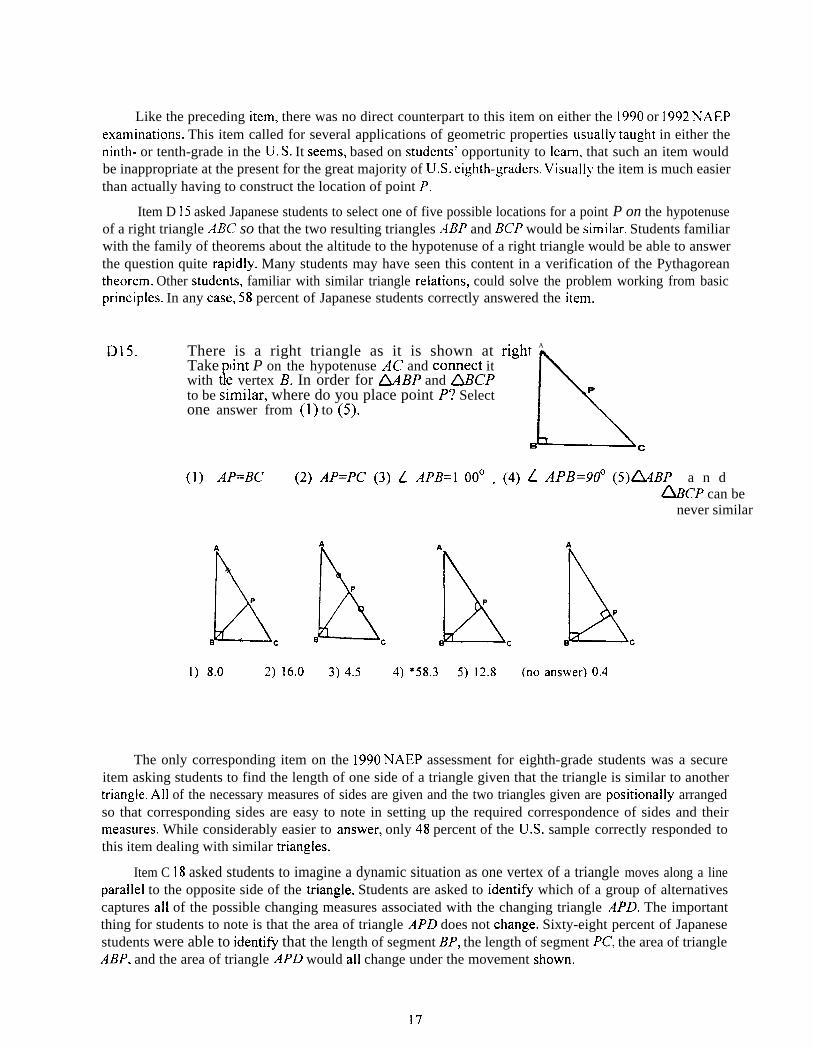
Item D 15 asked Japanese students to select one of five possible locations for a point P on the hypotenuseof a right triangle ABC so that the two resulting triangles ABP and BCP would be similar. Students familiarwith the family of theorems about the altitude to the hypotenuse of a right triangle would be able to answerthe question quite rapidly. Many students may have seen this content in a verification of the Pythagoreantheorem. Other students, familiar with similar triangle relations, could solve the problem working from basicprinciples. In any case, 58 percent of Japanese students correctly answered the item.
D15. There is a right triangle as it is shown at right. A
Take oint P on the hypotenuse AC and connect it[with t e vertex B. In order for LMBP and LM?CP
to be similar, where do you place point P? Select
h
P
one answer from (1) to (5).
c
(1) z4P=BC (2) AP=PC (3) L APB=l OOO . (4) ~ APB=900 (5)UBP a n d&K’P can be
never similar
1) 8.0 2) 16.0 3) 4.5 4) *583 5) 12.8 (no answer) 0.4
The only corresponding item on the 1990 NAEP assessment for eighth-grade students was a secureitem asking students to find the length of one side of a triangle given that the triangle is similar to anothertriangle. All of the necessary measures of sides are given and the two triangles given are positionally arrangedso that corresponding sides are easy to note in setting up the required correspondence of sides and theirmeasures. While considerably easier to answer, only 48 percent of the U.S. sample correctly responded tothis item dealing with similar triangles.
Item C 18 asked students to imagine a dynamic situation as one vertex of a triangle moves along a lineparallel to the opposite side of the triangle. Students are asked to identifj which of a group of alternativescaptures all of the possible changing measures associated with the changing triangle APD. The importantthing for students to note is that the area of triangle APD does not change. Sixty-eight percent of Japanesestudents were able to identifi that the length of segment BP, the length of segment PC, the area of triangleABP. and the area of triangle APD would all change under the movement shown.
17
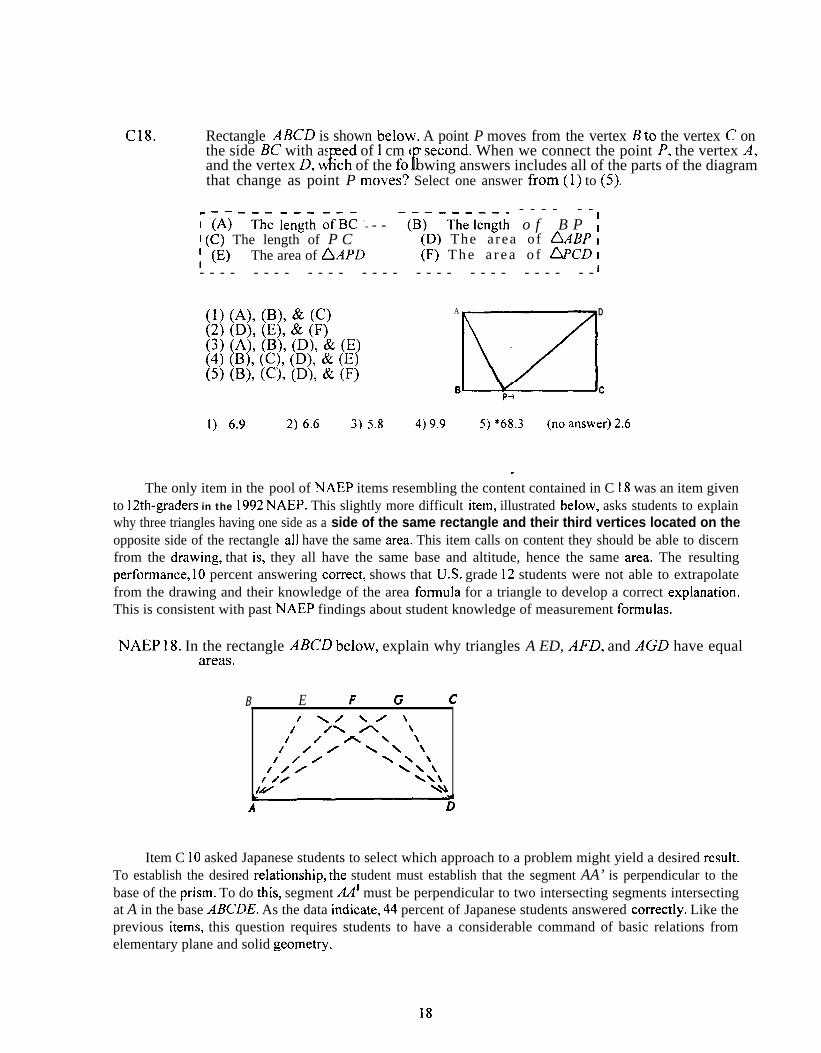
C18. Rectangle MICD is shown below. A point P moves from the vertex B to the vertex C onthe side X with as eed of 1 cm er second. When we connect the point P, the vertex A,
1! fand the vertex D, w ich of the fo lowing answers includes all of the parts of the diagramthat change as point P moves? Select one answer from(1) to (5).
- - - - - -r iAj - ~h~ ~n~t~ ~f>; -
- - - ‘(~)- ‘T~~l~n~th o f B P ~I (C) The length of P C (D) The a rea of QABP ,; (E) The area of AAPD (F) T h e a r e a o f ~CD 1
I- - - - - - - - - - - - - - - - - - - - - - - - - - - - - -
(1) (A), (B), & (C) A
m
D
(2) (D), (E), & (F)(3) (A), (B), (D), & (E)(4) (B), (C), (D), & (E)(5) (B), (C), (D), & (F)
I) 6.9
The only item in the
B-c
2) 6.6 3) 5.8 4) 9,9 5) *68.3 (no answer) 2.6
.pool of NAEP items resembling the content contained in C 18 was an item given
to 12th-graders in the 1992 NAEP. This slightly more difficult item, illustrated below, asks students to explainwhy three triangles having one side as a side of the same rectangle and their third vertices located on theopposite side of the rectangle all have the same area. This item calls on content they should be able to discernfrom the drawing, that is, they all have the same base and altitude, hence the same area. The resultingperformance, 10 percent answering correct, shows that U.S. grade 12 students were not able to extrapolatefrom the drawing and their knowledge of the area formula for a triangle to develop a correct explanation.This is consistent with past NAEP findings about student knowledge of measurement formulas.
NAEP 18. In the rectangle i4BCD below, explain why triangles A ED, AFD, and AGD have equalareas.
B E FG c\/\l\
/ /\A\/A\\/’//\\\/// \\\/// \\\/ // \\\
/..44 \\
A D
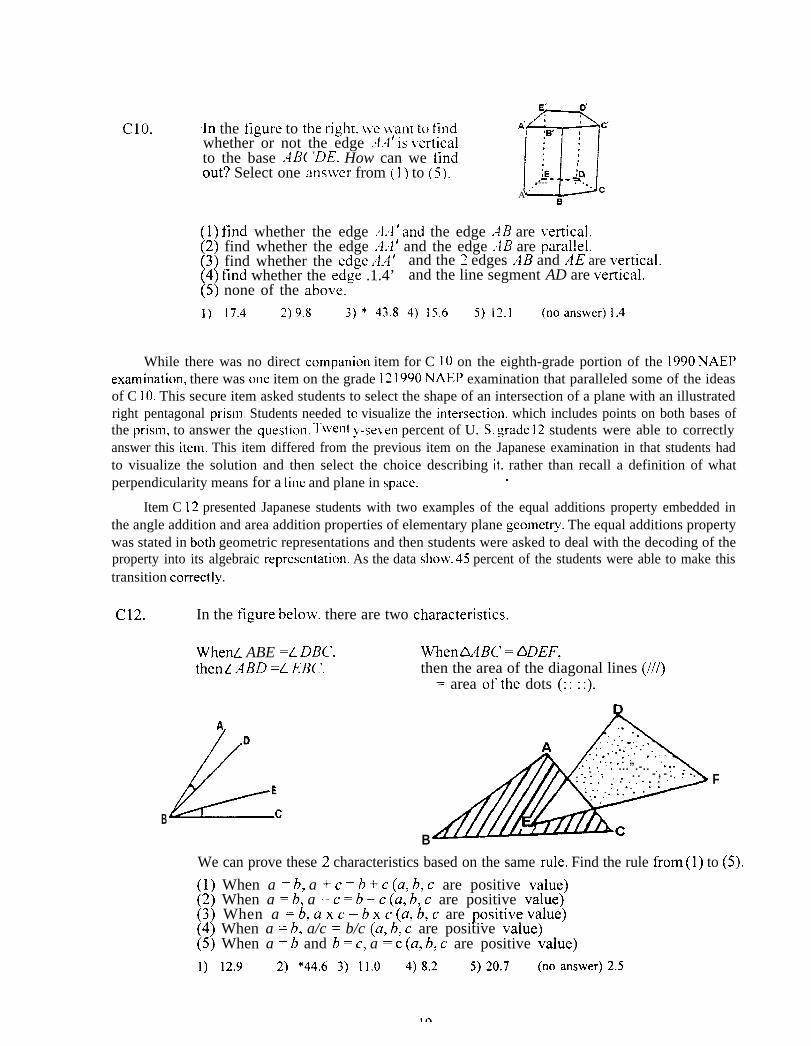
Item C 10 asked Japanese students to select which approach to a problem might yield a desired result.To establish the desired relationship, the student must establish that the segment AA’ is perpendicular to thebase of the prism. To do this, segment AA’ must be perpendicular to two intersecting segments intersectingat A in the base ABCDE. As the data indicate, 44 percent of Japanese students answered correctly. Like theprevious items, this question requires students to have a considerable command of basic relations fromelementary plane and solid geometry.
18
E’ D’
Clo. in the figure to the right. \ve ~~ant to find
m
A’ c’; B’
whether or not the edge .4.4’ is \erticalto the base ABC ‘DE. How can we tindout? Select one anslver from ( 1 ) to (5). ;E _ ~D
---- . .A ‘“ -c
B
(1) find whether the edge .4A’ and the edge .-Jll are ~ertical.(2) find whether the edge .4.4’ and the edge .4B are parallel.(3) find whether the edge AA’ and the 2 edges .4B and AE are vertical.(4) tind whether the edge .1.4’ and the line segment AD are vertical.(5) none of the above.
1) 17.4 2) 9.8 3) * 43.8 4) 15.6 5) 12.1 (no answer) I.4
While there was no direct companion item for C 10 on the eighth-grade portion of the 1990 NAEPexamination, there was one item on the grade 12 1990 NAEP examination that paralleled some of the ideasof C 10. This secure item asked students to select the shape of an intersection of a plane with an illustratedright pentagonal prism. Students needed to visualize the intersection. which includes points on both bases ofthe prism, to answer the question. Twenty -se\en percent of U. S. grade 12 students were able to correctlyanswer this item. This item differed from the previous item on the Japanese examination in that students hadto visualize the solution and then select the choice describing it. rather than recall a definition of whatperpendicularity means for a line and plane in space. ,
Item C 12 presented Japanese students with two examples of the equal additions property embedded inthe angle addition and area addition properties of elementary plane geometry. The equal additions propertywas stated in both geometric representations and then students were asked to deal with the decoding of theproperty into its algebraic representation. As the data sholv. 45 percent of the students were able to make thistransition correctly.
C12. In the figure below. there are two characteristics.
Wheti ABE =L DBC. WhenAABC = ADEF,then~ ABD =L EBC’. then the area of the diagonal lines (///)
= area of the dots (: :: :).
la
L
D
. . ...”.-.. ,, :...--. ”:-. . . - , - . . .. . . . . . . . . . . . .“
EF
B c
B
We can prove these 2 characteristics based on the same rule, Find the rule from(1) to (5).
(1) When a = b, a + c = b + c (a, b, c are positive value)(2) When a = b, a - c = b - c (a, b, c are positive value)(3) When a = b, a x c = b x c (a, b, c are positive value)(4) When a = b, a/c = b/c (a, b, c are positive value)(5) When a = b and b = c, a = c (a, b, c are positive value)
1) 12.9 2) *44.6 3) 11.0 4) 8.2 5) 20.7 (no answer) 2.5
19
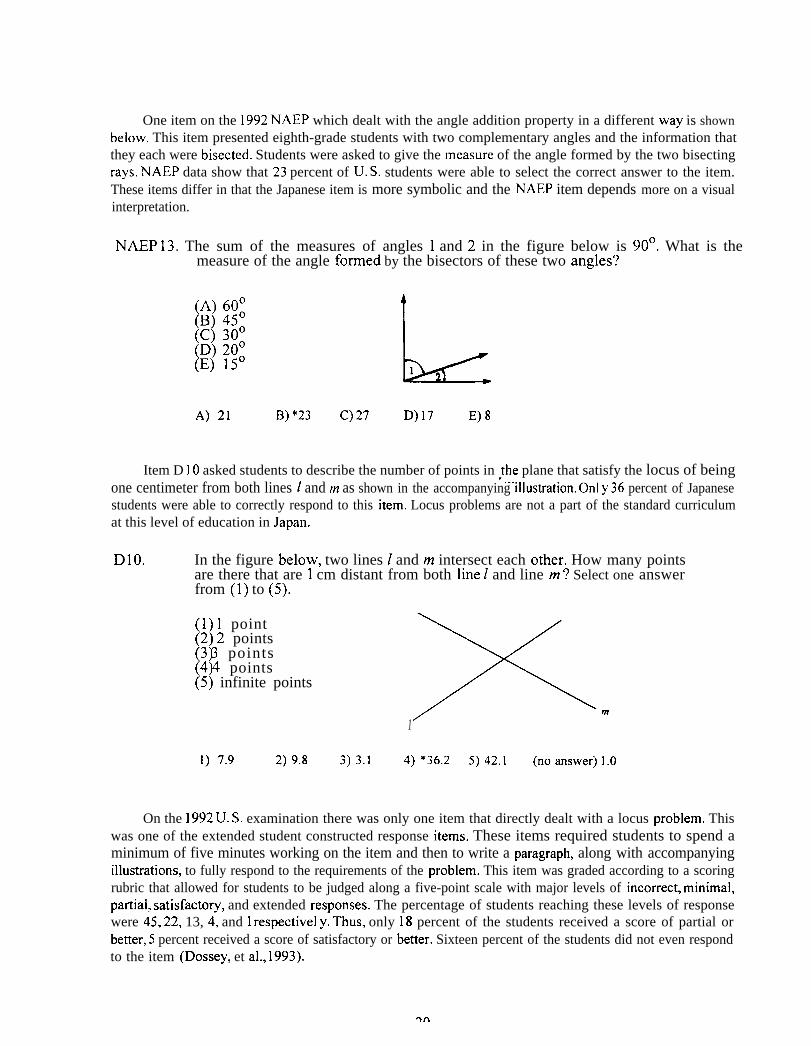
One item on the 1992 NAEP which dealt with the angle addition property in a different way is shownbelow. This item presented eighth-grade students with two complementary angles and the information thatthey each were bisected. Students were asked to give the lmeasure of the angle formed by the two bisectingrays. NAEP data show that 23 percent of U. S. students were able to select the correct answer to the item.These items differ in that the Japanese item is more symbolic and the NAEP item depends more on a visualinterpretation.
NAEP 13. The sum of the measures of angles 1 and 2 in the figure below is 90°. What is themeasure of the angle formed by the bisectors of these two angles?
(;] (55:
[c) 30°
[D) 20°E) 15°
L1
A) 21 B) *23 C) 27 D)17 E) 8
Item D 10 asked students to describe the number of points in ~.he plane that satisfy the locus of beingone centimeter from both lines 1 and m as shown in the accompanying Illustration. Onl y 36 percent of Japanesestudents were able to correctly respond to this item. Locus problems are not a part of the standard curriculumat this level of education in Japan.
D1O. In the figure below, two lines 1 and m intersect each other. How many pointsare there that are 1 cm distant from both hne / and line m ? Select one answerfrom (1) to (5).
(1) 1 point(2) 2 points
[13 3 points4 4 points5) infinite points
m
1
1) 7.9 2) 9.8 3) 3.1 4) *36.2 5) 42.1 (no answer) 1.0
On the 1992 U. S. examination there was only one item that directly dealt with a locus problem. Thiswas one of the extended student constructed response items. These items required students to spend aminimum of five minutes working on the item and then to write a paragraph, along with accompanyingillustrations, to fully respond to the requirements of the problem. This item was graded according to a scoringrubric that allowed for students to be judged along a five-point scale with major levels of incorrect, minimal,partial, satisfactory, and extended responses. The percentage of students reaching these levels of responsewere 45, 22, 13, 4, and 1 respective y. Thus, only 18 percent of the students received a score of partial orbetter, 5 percent received a score of satisfactory or better. Sixteen percent of the students did not even respondto the item (Dossey, et al., 1993).
20
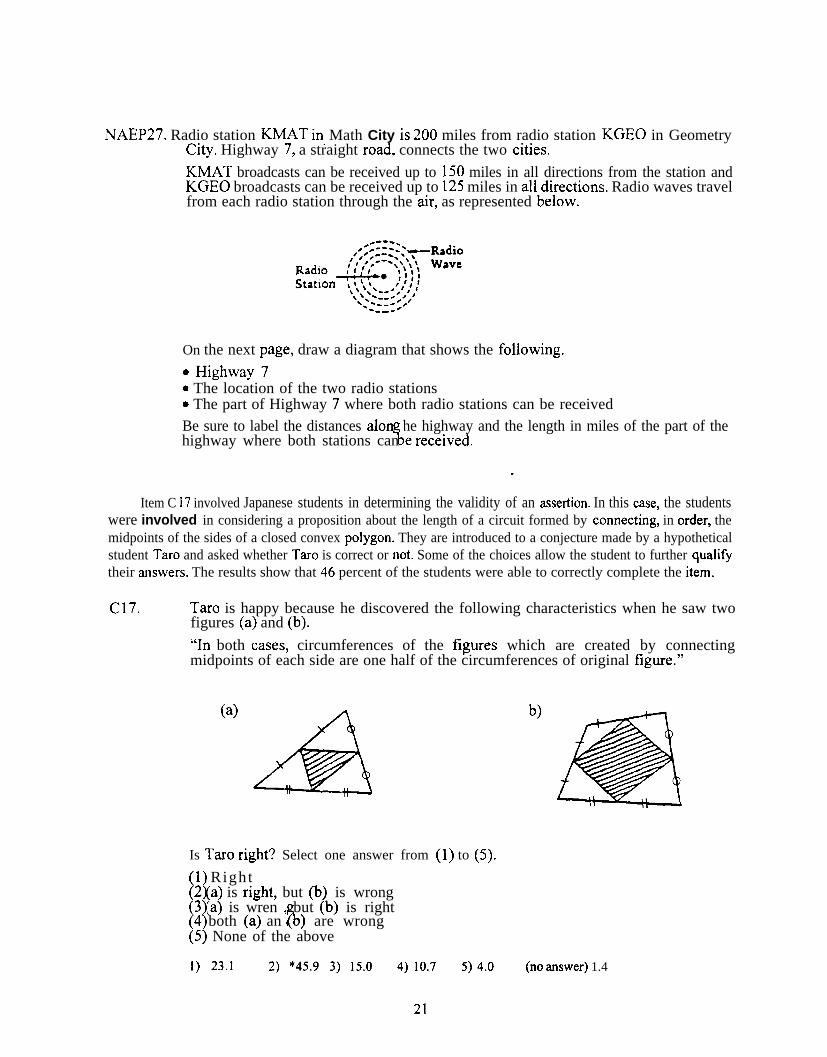
NAEP27. Radio station KMAT in Math City is 200 miles from radio station KGEO in GeometryCity. Highway 7, a straight road, connects the two cities.
KMAT broadcasts can be received up to 150 miles in all directions from the station andKGEO broadcasts can be received up to 125 miles in all directions. Radio waves travelfrom each radio station through the air, as represented below.
On the next page, draw a diagram that shows the following.
. Highway 7
. The location of the two radio stations
. The part of Highway 7 where both radio stations can be receivedBe sure to label the distances alon the highway and the length in miles of the part of the
%highway where both stations can e received.
.
Item C 17 involved Japanese students in determining the validity of an assertion. In this case, the studentswere involved in considering a proposition about the length of a circuit formed by connecting, in order, themidpoints of the sides of a closed convex polygon. They are introduced to a conjecture made by a hypotheticalstudent Taro and asked whether Taro is correct or not. Some of the choices allow the student to further quali~their answers. The results show that 46 percent of the students were able to correctly complete the item.
C17. Taro is happy because he discovered the following characteristics when he saw twofigures (a) and (b).
“In both cases, circumferences of the figures which are created by connectingmidpoints of each side are one half of the circumferences of original figure.”
Is Taro right? Select one answer from (1) to (5).
[11 R ight2 (a) is right, but (b) is wrong3 (a) is wren , but (b) is right[) %4 both (a) an (b) are wrong(5) None of the above
b)
1) 23.1 2) *45.9 3) 15.0 4) 10.7 5) 4.0 (no answer) 1.4
21
There were no comparable geometry items for U. S. grade eight students included in the 1992 NAEPassessment, as verification of geometric conjectures receives low priority in the current mathematicscurriculum at the eighth-grade level.
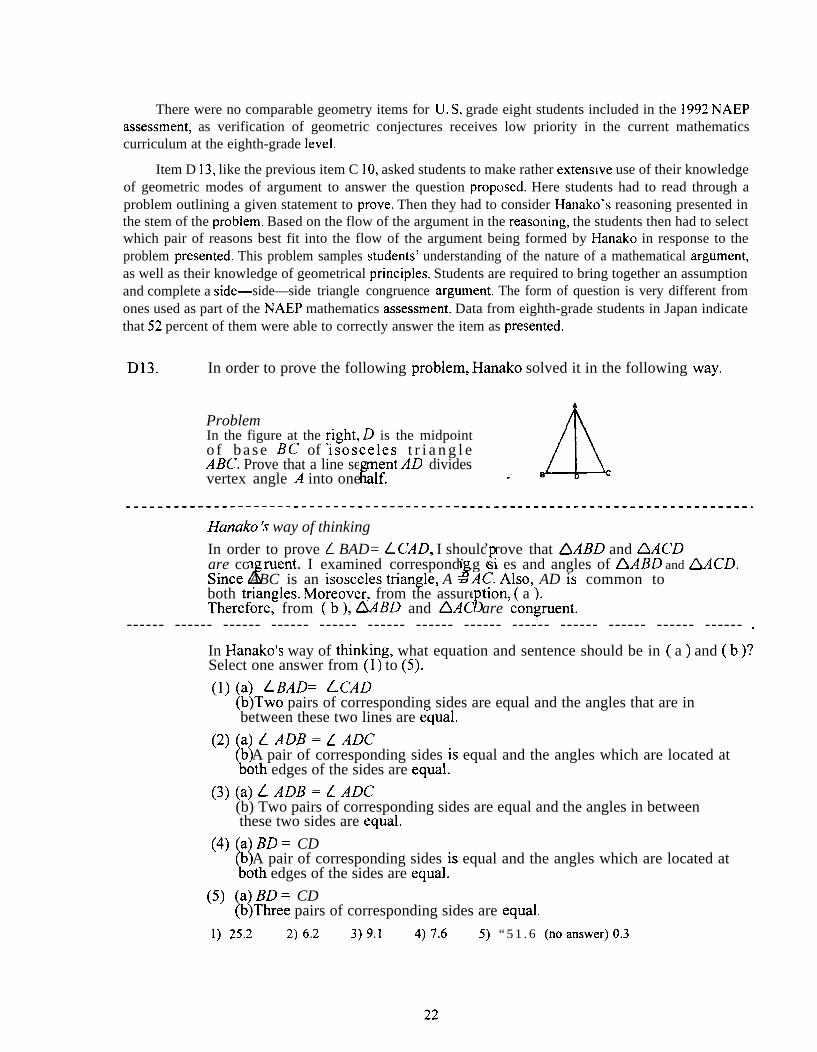
Item D 13, like the previous item C 10, asked students to make rather extenswe use of their knowledgeof geometric modes of argument to answer the question proposed. Here students had to read through aproblem outlining a given statement to prove. Then they had to consider Hanako’s reasoning presented inthe stem of the problem. Based on the flow of the argument in the reasoning, the students then had to selectwhich pair of reasons best fit into the flow of the argument being formed by Hanako in response to theproblem presented. This problem samples students’ understanding of the nature of a mathematical argument,as well as their knowledge of geometrical principles. Students are required to bring together an assumptionand complete a side—side—side triangle congruence argument. The form of question is very different fromones used as part of the NAEP mathematics assessment. Data from eighth-grade students in Japan indicatethat 52 percent of them were able to correctly answer the item as presented.
D13. In order to prove the following problem, Hanako solved it in the following way.
A
ProblemIn the figure at the right, D is the midpointo f b a s e BC of lsosceles t r i a n g l eABC. Prove that a line se ment Al divides
Evertex angle A into one alf. Ac.
------- ------- ------- ------- ------- ------- ------- ------- ------- ------- ------- -.
Hanako h way of thinking
In order to prove L BAD= L CAD, I should rove that bABD and QACD(!’are con ruent. I examined corresponding si es and angles of ~ABD and fLACD.
k JSince ABC is an isosceles triangle, A = AC. Also, AD is common toboth triangles. Moreover, from the assure tion, ( a ).
5Therefore, from ( b ), 6ABD and Z3AC are congruent.------ ------ ------ ------ ------ ------ ------ ------ ------ ------ ------ ------ ------ .
In Hanako’s way of thinking, what equation and sentence should be in ( a ) and ( b )?Select one answer from (1) to (5).
(1)
(2)
(3)
(4)
(5)
(a) LBAD= ~CAD(b)Two pairs of corresponding sides are equal and the angles that are inbetween these two lines are equal.
(a) L ADB = L ADCb A pair of corresponding sides is equal and the angles which are located atVoth edges of the sides are equal.
(a) ~ ADB = L ADC(b) Two pairs of corresponding sides are equal and the angles in betweenthese two sides are equal.
(a) BD = CDb A pair of corresponding sides is equal and the angles which are located atVoth edges of the sides are equal.
(a) BD = CD(b)Three pairs of corresponding sides are equal,
1) 25.2 2) 6.2 3) 9.1 4) 7.6 5) “ 5 1 . 6 (no answer) 0.3
22
There are no comparable items for eighth-grade students in the U. S. on the 1992 NAEP assessment.Such forms of verification are not a major portion of the grade eight geometry strand in most schools andmost students do not have an opportunity to study the various methods for proving a pair of trianglescongruent.
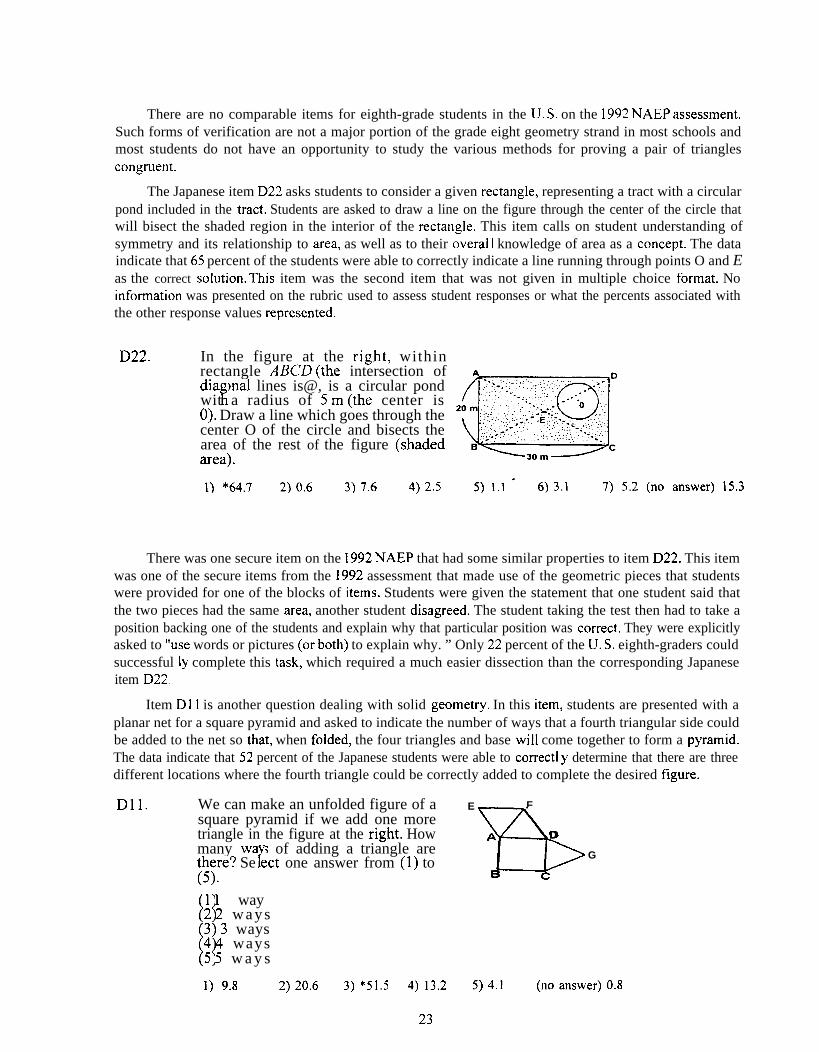
The Japanese item D22 asks students to consider a given rectangle, representing a tract with a circularpond included in the tract. Students are asked to draw a line on the figure through the center of the circle thatwill bisect the shaded region in the interior of the rectangle. This item calls on student understanding ofsymmetry and its relationship to area, as well as to their overai I knowledge of area as a concept. The dataindicate that 65 percent of the students were able to correctly indicate a line running through points O and Eas the correct solution. This item was the second item that was not given in multiple choice format. Noinformation was presented on the rubric used to assess student responses or what the percents associated withthe other response values represented.
D22. In the figure at the right, withinrectangle ABCD (the intersection ofdia onal lines is@, is a circular pond
Rwit a radius of 5 m (the center isO). Draw a line which goes through thecenter O of the circle and bisects thearea of the rest of the figure (shadedarea).
1) *64.7 2) 0.6 3) 7.6 4) 2.5 5) 1.1 “ 6) 3.1 7) 5.2 (no answer) 15.3
There was one secure item on the 1992 NAEP that had some similar properties to item D22. This itemwas one of the secure items from the 1992 assessment that made use of the geometric pieces that studentswere provided for one of the blocks of items. Students were given the statement that one student said thatthe two pieces had the same area, another student disagreed. The student taking the test then had to take aposition backing one of the students and explain why that particular position was correct. They were explicitlyasked to “use words or pictures (or both) to explain why. ” Only 22 percent of the U. S. eighth-graders couldsuccessful Iy complete this task, which required a much easier dissection than the corresponding Japaneseitem D22.
Item D11 is another question dealing with solid geometry. In this item, students are presented with aplanar net for a square pyramid and asked to indicate the number of ways that a fourth triangular side couldbe added to the net so that, when folded, the four triangles and base will come together to form a pyramid.The data indicate that 52 percent of the Japanese students were able to correctl y determine that there are threedifferent locations where the fourth triangle could be correctly added to complete the desired figure.
D1l. We can make an unfolded figure of asquare pyramid if we add one moretriangle in the figure at the right. Howmany wa s of adding a triangle are
rthere? Se ect one answer from (1) to(5).
[11 1 way2 2 ways
(3) 3 ways
[)4 4 ways5 5 w a y s
1) 9.8 2) 20.6 3) *515 4) 13.2
23
E F
b
A D
G
c
5) 4.1 (no answer) 0.8
An analysis of the NAEP items from 1990 revealed one secure item that was somewhat similar to D 11.This item required students to identify which, of a number of potential nets, that when folded, would notform a particular geometric solid. This item lacked the combinatorial aspect of asking how many ways anadditional needed piece could be added to a partially completed net, but required that more information beprocessed. Fifty-eight percent of U. S. eighth-graders were able to answer this easier item. Analysis ofupcoming NAEP assessment blocks for mathematics indicates that another similar item will, most probably,be included in the next mathematics assessment.
Data Analysis, Statistics, and Probability
The Japanese essential mathematics assessment contained three items measuring content that wouldbe classified in the NAEP content category of Data Analysis, Statistics, and Probability. This content is anarea of some interest in the curriculum for Japanese eighth-graders (Ministry of Education, n.d.). This isespecially true for content dealing with collecting real world data, making tables and graphs, and consideringthe nature of the resulting distributions, patterns of frequencies, and central tendencies.
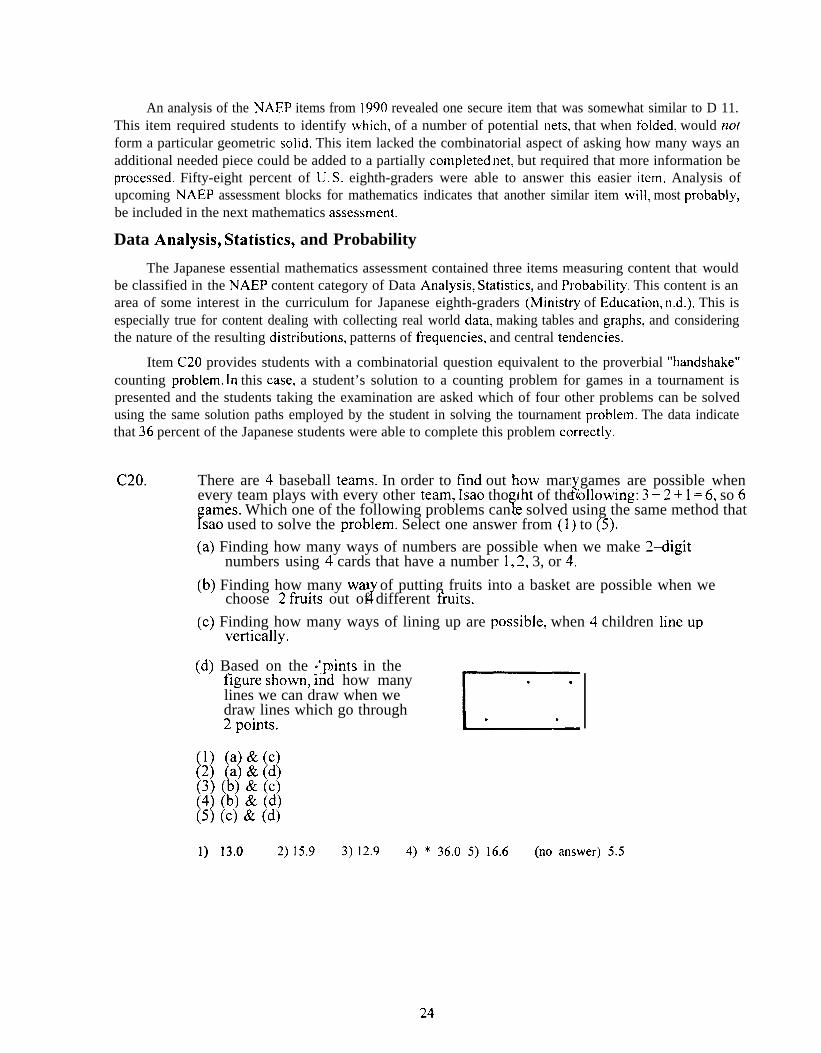
Item C20 provides students with a combinatorial question equivalent to the proverbial “handshake”counting problem. In this case, a student’s solution to a counting problem for games in a tournament ispresented and the students taking the examination are asked which of four other problems can be solvedusing the same solution paths employed by the student in solving the tournament problem. The data indicatethat 36 percent of the Japanese students were able to complete this problem correctly.
C20. There are 4 baseball teams. In order to find out how man games are possible when1’every team plays with every other team, Isao thou ht of the ollowing: 3 + 2 + 1 =6, so 6
F%ames. Which one of the following problems can e solved using the same method that
sao used to solve the problem. Select one answer from (1) to (5).
(a) Finding how many ways of numbers are possible when we make 2cligitnumbers using 4 cards that have a number 1, 2, 3, or 4.
(b) Finding how many wa s of putting fruits into a basket are possible when weJchoose 2 fmits out of different fruits.
(c) Finding how many ways of lining up are possible, when 4 children lineupvertically.
(d) Based on the 4 oints in the?figure shown, md how many
lines we can draw when wedraw lines which go through2 points.
M WI(3) (b) & (C)(4) (b) & (d)(5) (C) & (d)
1) 13.0 2) 15.9 3) 12.9 4) * 36.0 5) 16.6 (no answer) 5.5
24
An analysis of problems on the grade eight portion of the 1992 NAEP located one secure item testingsimilar material. This item was one of the extended student constructed response items. It required studentsto consider various combinations possible when two coins are split into two groupings. In particular, the itemextended the situation to ask for the probability that the student described would have sufficient money inone pocket to make a particular type of purchase. Data shows that 18 percent of LT. S. eighth-graders wereable to give a satisfactory or better response to this extended response item.
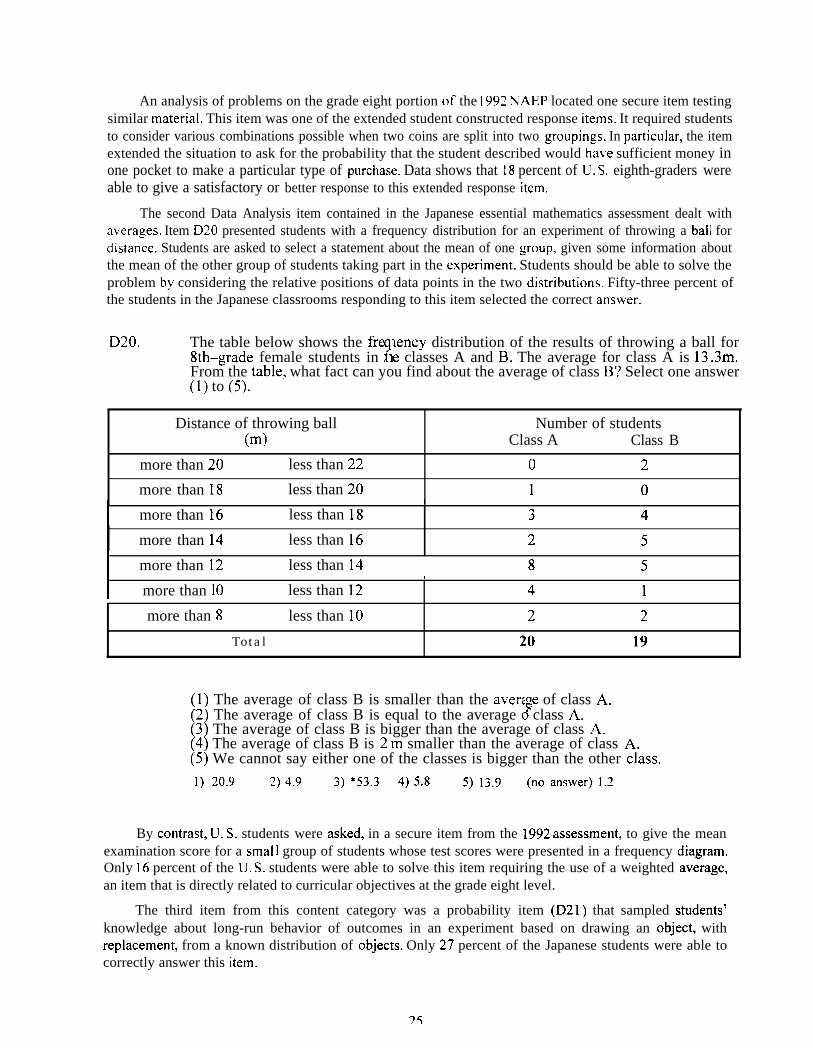
The second Data Analysis item contained in the Japanese essential mathematics assessment dealt withaverages. Item D20 presented students with a frequency distribution for an experiment of throwing a ball fordistance. Students are asked to select a statement about the mean of one group, given some information aboutthe mean of the other group of students taking part in the experiment. Students should be able to solve theproblem by considering the relative positions of data points in the two distributions. Fifty-three percent ofthe students in the Japanese classrooms responding to this item selected the correct answer.
D20. The table below shows the fre uency distribution of the results of throwing a ball for:8th–grade female students in t e classes A and B. The average for class A is 13 .3m.
From the table, what fact can you find about the average of class B? Select one answer(1) to (5).
Distance of throwing ball Number of students(m) Class A Class B
more than 20 less than 22 0 2
more than 18 less than 20 1 0II more than 16 less than 18 3 4
I more than 14 less than 16 2 51
I more than 12 less than 14 8 51
I more than 10 less than 12 4 1
more than 8 less than 10 2 2
Total 20 19
(1) The average of class B is smaller than the a}era e of class A.f(2) The average of class B is equal to the average o class A.
(3) The average of class B is bigger than the average of class A.(4) The average of class B is 2 m smaller than the average of class A.(5) We cannot say either one of the classes is bigger than the other class.
1) 20.9 2) 4.9 3) *53.3 4) 5.8 5) 13.9 (no answer) I.2
By contrast, U. S. students were asked, in a secure item from the 1992 assessment, to give the meanexamination score for a smal I group of students whose test scores were presented in a frequency diagram.Only 16 percent of the U. S. students were able to solve this item requiring the use of a weighted average,an item that is directly related to curricular objectives at the grade eight level.
The third item from this content category was a probability item (D21 ) that sampled students’knowledge about long-run behavior of outcomes in an experiment based on drawing an object, withreplacement, from a known distribution of objects. Only 27 percent of the Japanese students were able tocorrectly answer this item.
25
D21. There are two red balls and eight blue balls in a bag. From this bag, take one ball at atime and examine the color of the ball and then return it to the ba . When we repeat this,
7which one of the following is right? Select one answer from ( 1 to (5).
(1) When ou take a ball only once, the ball is blue.?(2) If the lrst ball is blue, the second ball will be red.
3 If we repeat this 10 times, 8 times ou will certainly get blue balls.[) {4 If we repeat this 100 times, about O times, we may get blue balls.(5) No matter how many times we repeat this, we cannot predict how many times
we may get blue balls.
1) 3.5 2) 2.9 3) 12.6 4) *27.2 5) 52.6 (no answer) 1.1%
There was one somewhat related probability item in the secure 1990 NAEP items for grade eight. Itdealt, however, with sampling objects from a large set to estimate the number of defective objects in the set.Thirty-six percent of the U. S. students were able to correctly answer this item.
Algebra and Functions.
The content area of Algebra and Functions contains nearly half of the items presented to students onthe Japanese tests. Algebra and the study of variation in the form of direct proportion is at the heart of thegrade one and grade two (U.S. eighth-grade equivalent) mathematics curricula for lower secondary schoolsin Japan. This emphasis is strongly represented in the items chosen for this portion of the essentialmathematics assessment.
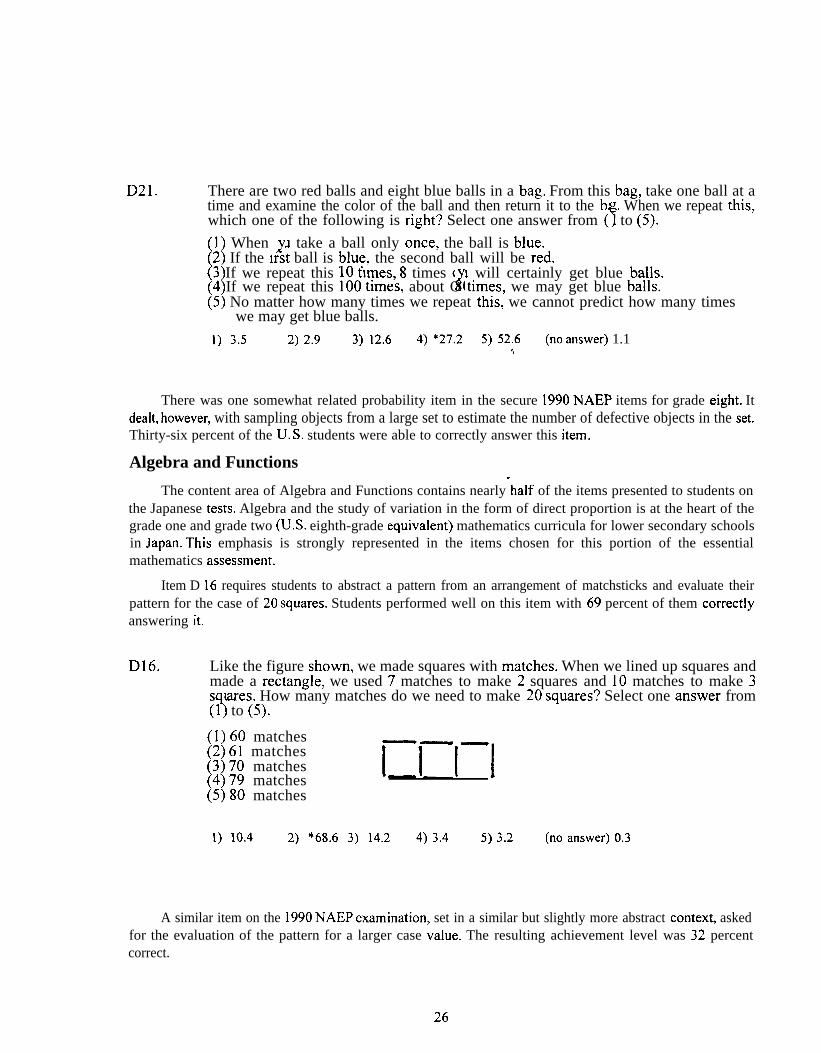
Item D 16 requires students to abstract a pattern from an arrangement of matchsticks and evaluate theirpattern for the case of 20 squares. Students performed well on this item with 69 percent of them correctlyanswering it.
D16. Like the figure shown, we made squares with matches. When we lined up squares andmade a rectangle, we used 7 matches to make 2 squares and 10 matches to make 3s uares. How many matches do we need to make 20 squares? Select one answer from(3 to (5).
(1) 60 matches(2) 61 matches(3) 70 matches(4) 79 matches rim
(5) 80 matches
1) 10.4 2) *68.6 3) 14.2 4) 3.4 5) 3.2 (no answer) 0.3
A similar item on the 1990 NAEP examination, set in a similar but slightly more abstract context, askedfor the evaluation of the pattern for a larger case value. The resulting achievement level was 32 percentcorrect.
26
NAEP 32. Ifthis pattern of dot–figures is continued, how many dots will be in the 100th figure?
●
● ● 9
● ● * ● .
● ● * . . ● ●● * . * ● ● ● ●
I ~ 3 4
(A) 100(B) 101
[c) 199D) 200
(E) 201
A) 6 B) 12 c) 17 D) 29 E) *34 omit) 2
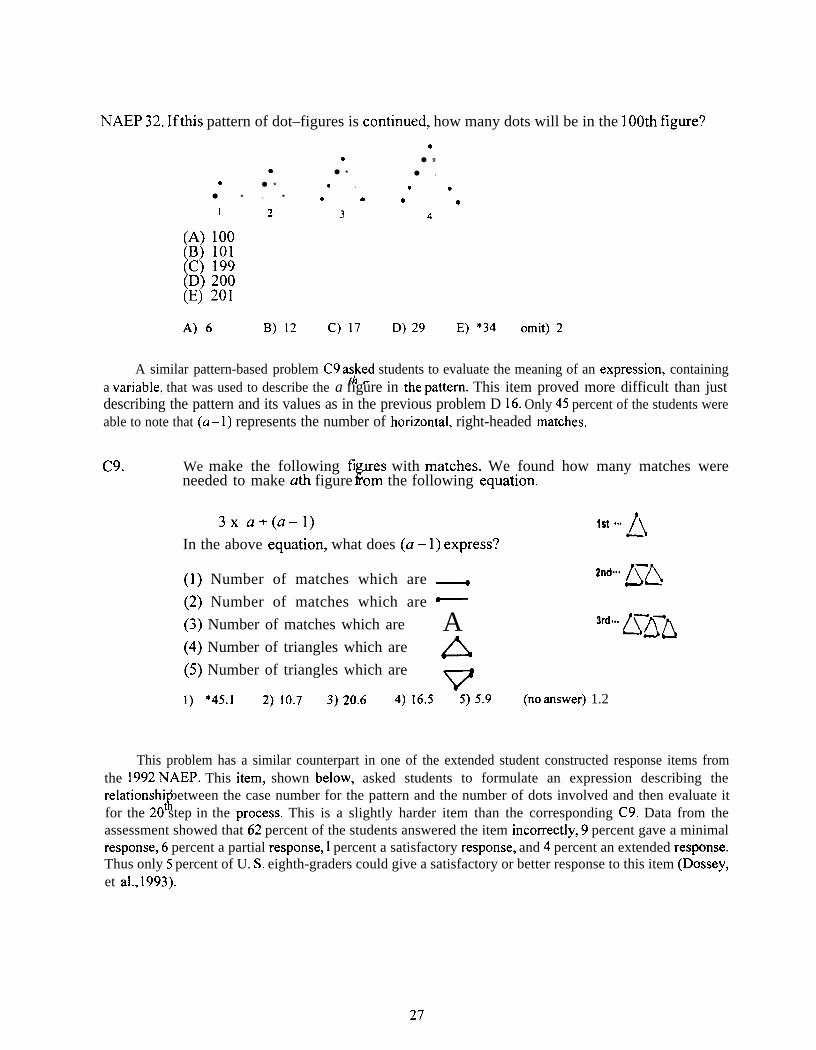
A similar pattern-based problem C9 a;~d students to evaluate the meaning of an expression, containinga variable, that was used to describe the a figure in the pattern. This item proved more difficult than justdescribing the pattern and its values as in the previous problem D 16. Only 45 percent of the students wereable to note that (a – 1) represents the number of horizontal, right-headed matches.
C9. We make the following fi ures with matches. We found how many matches werefneeded to make ath figure rom the following equation.
3xa+(a-1) 1st ‘“” ~In the above equation, what does (a – 1) express?
(1) Number of matches which are ~ 2rKi””” &&
(2) Number of matches which are ~
(3) Number of matches which are A ml...~ry~’(4) Number of triangles which are 44(5) Number of triangles which are
v1) *45.1 2) 10.7 3) 20.6 4) 16.5 5) 5.9 (no answer) 1.2
This problem has a similar counterpart in one of the extended student constructed response items fromthe 1992 NAEP. This item, shown below, asked students to formulate an expression describing therelationshi between the case number for the pattern and the number of dots involved and then evaluate it
t!?for the 20 step in the process. This is a slightly harder item than the corresponding C9. Data from theassessment showed that 62 percent of the students answered the item incorrectly, 9 percent gave a minimalresponse, 6 percent a partial response, 1 percent a satisfactory response, and 4 percent an extended response.Thus only 5 percent of U. S. eighth-graders could give a satisfactory or better response to this item (Dossey,et al., 1993).
27
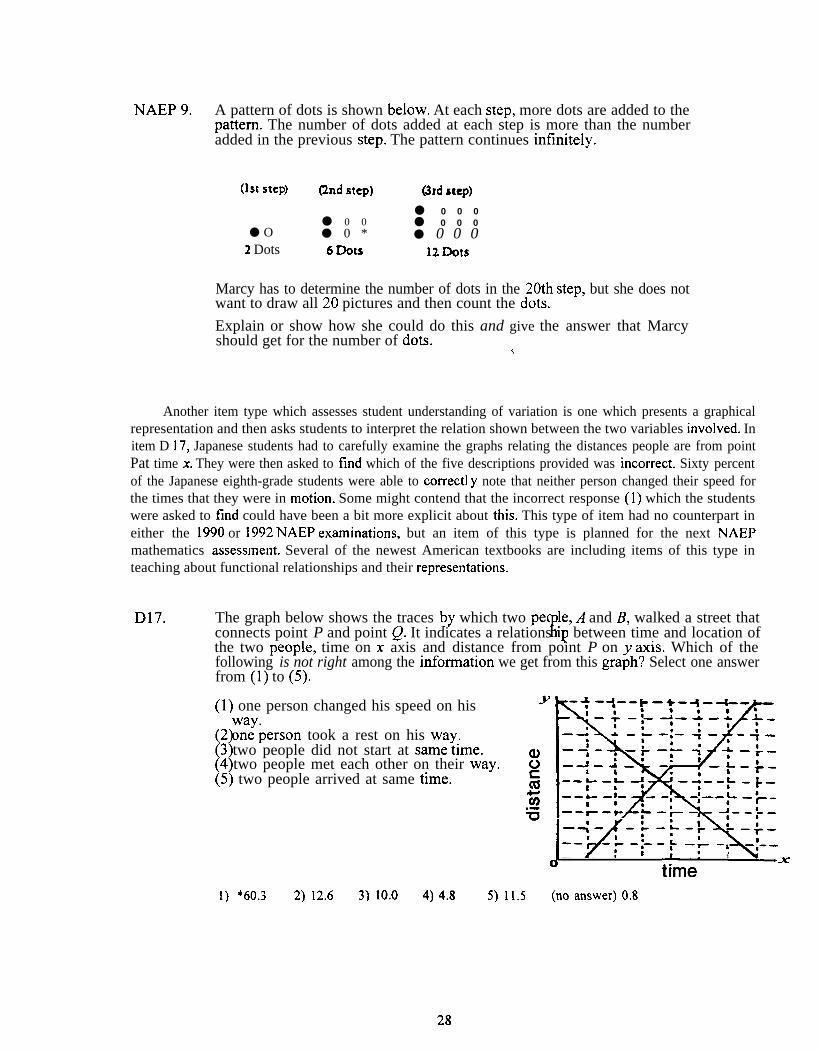
NAEP 9. A pattern of dots is shown below. At each step, more dots are added to thepattern. The number of dots added at each step is more than the numberadded in the previous step. The pattern continues infinitely.
(Ist step) (2nd step) (3rd step)
● 0 0 0● 0 0 ● 0 0 0
● O ● 0 * ● 0 0 02 Dots 6 Dots 12 Dots
Marcy has to determine the number of dots in the 20th step, but she does notwant to draw all 20 pictures and then count the dots.
Explain or show how she could do this and give the answer that Marcyshould get for the number of dots. %
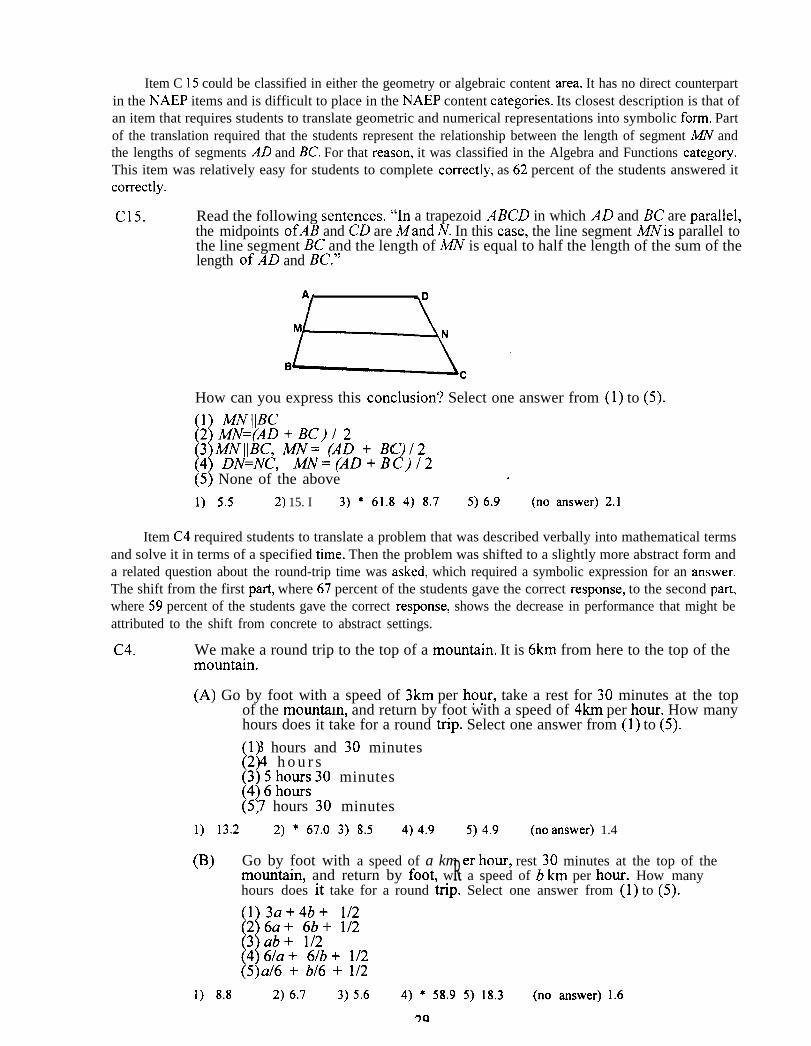
Another item type which assesses student understanding of variation is one which presents a graphicalrepresentation and then asks students to interpret the relation shown between the two variables involved. Initem D 17, Japanese students had to carefully examine the graphs relating the distances people are from pointPat time x. They were then asked to find which of the five descriptions provided was incorrect. Sixty percentof the Japanese eighth-grade students were able to correctl y note that neither person changed their speed forthe times that they were in motion. Some might contend that the incorrect response (1) which the studentswere asked to find could have been a bit more explicit about this. This type of item had no counterpart ineither the 1990 or 1992 NAEP examinations, but an item of this type is planned for the next NAEPmathematics assessment. Several of the newest American textbooks are including items of this type inteaching about functional relationships and their representations.
D17. The graph below shows the traces by which two peo Ie, A and B, walked a street thatEconnects point P and point Q. It indicates a relations i~ between time and location of
the two people, time on x axis and distance from point P on y axis. Which of thefollowing is not right among the information we get from this graph? Select one answerfrom (1) to (5).
(1) one person changed his speed on his
(2 %~person took a rest on his way.
[13 two people did not start at same time.4 two people met each other on their way.
(5) two people arrived at same time.
J8 i 1
-,__~
1 \x8—r -, -,--I t
0time’
1) *60.3 2) 12.6 3) 10.0 4) 4.8 5) 11.5 (no answer) 0.8
28
Item C 15 could be classified in either the geometry or algebraic content area. It has no direct counterpartin the NAEP items and is difficult to place in the NAEP content categories. Its closest description is that ofan item that requires students to translate geometric and numerical representations into symbolic form. Partof the translation required that the students represent the relationship between the length of segment ~ andthe lengths of segments AD and BC. For that reason, it was classified in the Algebra and Functions category.This item was relatively easy for students to complete correctly, as 62 percent of the students answered itcorrectly.
C15. Read the following sentences. “In a trapezoid ABCD in which AD and BC are parallel,the midpoints of-4B and CD are Mand N. In this case, the line segment MNis parallel tothe line segment K and the length of MN is equal to half the length of the sum of thelength of AD and BC.”
How can you express this conclusion? Select one answer from (1) to (5).
(1) MN\lBc(2) it4N=@D + BC) / 2
[13 A4NI[BC, MN= (AD + BC /2
c?4 DN=NC, A4N=(AD+B )/2(5) None of the above .
1) 5.5 2) 15. I 3) * 61.8 4) 8.7 5) 6.9 (no answer) 2.1
Item C4 required students to translate a problem that was described verbally into mathematical termsand solve it in terms of a specified time. Then the problem was shifted to a slightly more abstract form anda related question about the round-trip time was asked, which required a symbolic expression for an answer.The shift from the first part, where 67 percent of the students gave the correct response, to the second part,where 59 percent of the students gave the correct response, shows the decrease in performance that might beattributed to the shift from concrete to abstract settings.
C4. We make a round trip to the top of a mountain. It is 6krn from here to the top of themountain.
(A) Go by foot with a speed of 3km per hour, take a rest for 30 minutes at the topof the mountam, and return by foot with a speed of 4km per hour. How manyhours does it take for a round trip. Select one answer from (1) to (5).
1 3 hours and 30 minutes[12 4 h o u r s(~) ~ Em 30 minutes
[15 7 hours 30 minutes
1) 13.2 2) * 67.0 3) 8.5 4) 4.9 5) 4.9 (no answer) 1.4
(B) Go by foot with a speed of a km er hour, rest 30 minutes at the top of theRmountain, and return by foot, wit a speed of b km per hour. How manyhours does it take for a round trip. Select one answer from (1) to (5).
1 3a+4b+ l/2
11
; &z: f12+ 1/2
4 61a+ 61b+ 1/25 a16 + b16 + 1/2
1) 8.8 2) 6.7 3) 5.6 4) * 58.9 5) 18.3 (no answer) 1.6
29
There are no comparable NAEP items at the grade eight level. A similar item was field tested in 1993,but so few students were able to perform on it that it was omitted from the test form in favor of an item thatwould at least be able to discern differences in student performance.
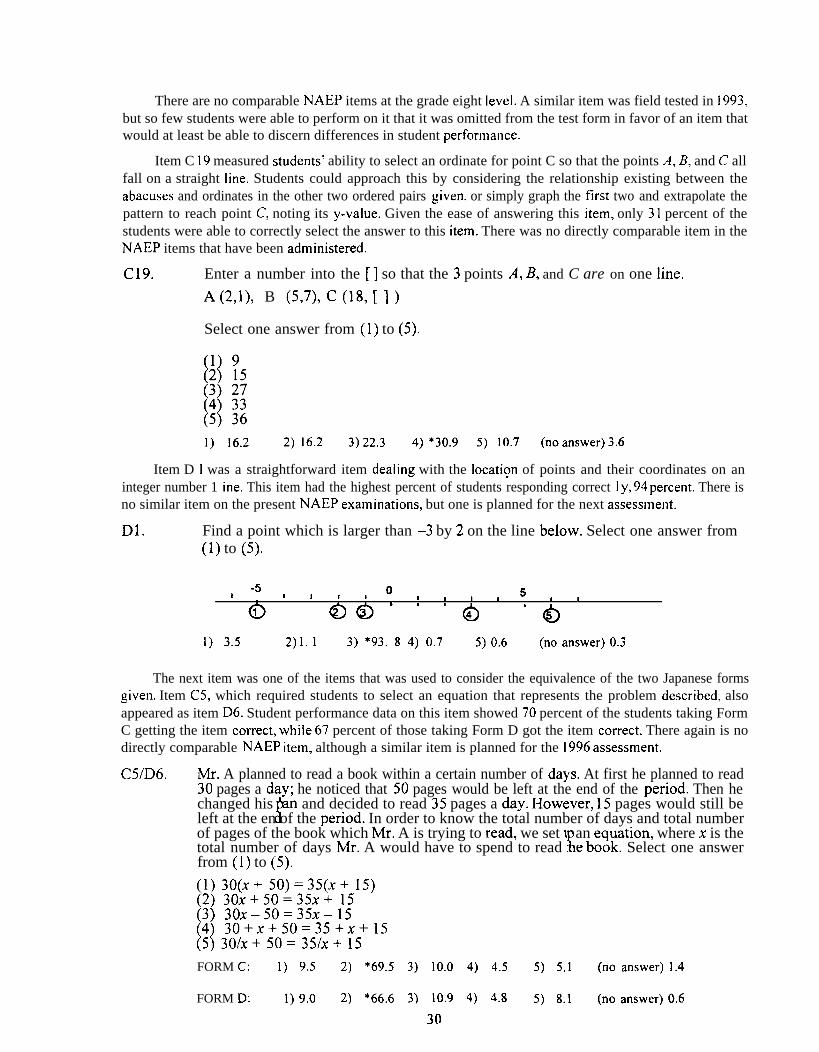
Item C 19 measured students’ ability to select an ordinate for point C so that the points A, B, and C allfall on a straight line. Students could approach this by considering the relationship existing between theabacuses and ordinates in the other two ordered pairs given, or simply graph the first two and extrapolate thepattern to reach point C, noting its y-value. Given the ease of answering this item, only 31 percent of thestudents were able to correctly select the answer to this item. There was no directly comparable item in theNAEP items that have been administered.
C19. Enter a number into the [ ] so that the 3 points A, B, and C are on one line.
A(2,1), B (5,7), C (18, [ ] )
Select one answer from (1) to (5).
1) 16.2 2) 16.2 3) 22.3 4) *30.9 5) 10.7 (no answer) 3.6
Item D 1 was a straightforward item dealing with the locati?n of points and their coordinates on aninteger number 1 inc. This item had the highest percent of students responding correct 1 y, 94 percent. There isno similar item on the present NAEP examinations, but one is planned for the next assessment.
D1. Find a point which is larger than –3 by 2 on the line below. Select one answer from(1) to (5).
-5I 1 1 0# 1 1 I I 51t 1 I, , I
1) 3.5 2)1. 1 3) *93. 8 4) 0.7 5) 0.6 (no answer) 0.3
The next item was one of the items that was used to consider the equivalence of the two Japanese formsgiven. Item C5, which required students to select an equation that represents the problem described, alsoappeared as item D6. Student performance data on this item showed 70 percent of the students taking FormC getting the item correct, while 67 percent of those taking Form D got the item correct. There again is nodirectly comparable NAEP item, although a similar item is planned for the 1996 assessment.
C51D6. Mr. A planned to read a book within a certain number of days. At first he planned to read30 pages a day; he noticed that 50 pages would be left at the end of the period. Then hechanged his lan and decided to read 35 pages a day. However, 15 pages would still be
ileft at the en of the period. In order to know the total number of days and total numberof pages of the book which Mr. A is trying to read, we set u an equation, where x is the
{total number of days Mr. A would have to spend to read t e book. Select one answerfrom (1) to (5).
(1) 30(X+ 50)=35(X+ 15)(2) 30X+50=35X+ 15
[3) 30X–50=35X–154) 30+X+50=35+X+15
(5) 30/x+ 50= 35/x+ 15
FORM C: 1) 9.5 2) *69.5 3) 10.0 4) 4.5 5) 5.1 (no answer) l.4
FORM D: 1) 9.0 2) *66.6 3) 10.9 4) 4.8 5) 8.1 (no answer) 0.6
30
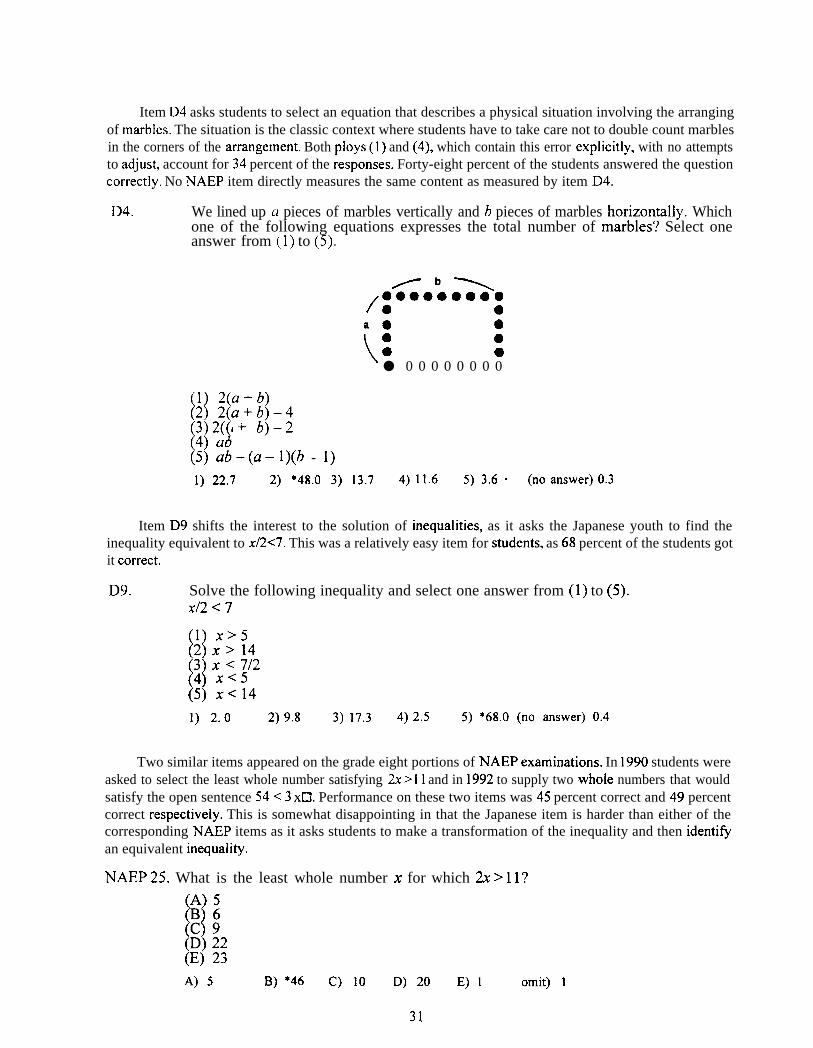
Item D4 asks students to select an equation that describes a physical situation involving the arrangingof marbles. The situation is the classic context where students have to take care not to double count marblesin the corners of the arrangement. Both ploys(1) and (4), which contain this error explicitly, with no attemptsto adjust. account for 34 percent of the responses. Forty-eight percent of the students answered the questioncorrectly. No NAEP item directly measures the same content as measured by item D4.
D4. We lined up a pieces of marbles vertically and b pieces of marbles horizontally. Whichone of the following equations expresses the total number of marbles? Select oneanswer from (1) to (5).
/b\
/:0000000:
a. ●
( ● ●● c● 0 0 0 0 0 0 0 0
(1 2(a+b)1(2 2(a+b)-4
3 2a+ b)-2u i(:) %qZ- l)(b - 1)
1) 22.7 2) *48.O 3) 13.7 4) 11.6 5) 3.6 “ (no answer) 0.3
Item D9 shifts the interest to the solution of inequalities, as it asks the Japanese youth to find theinequality equivalent to x/2<7. This was a relatively easy item for students, as 68 percent of the students gotit correct.
D9. Solve the following inequality and select one answer from (1) to (5).X12 ~ 7
(1) X>5(:) ; ~ ;f2
[]4 X<5(5 X<14
1) 2.0 2) 9.8 3) 17.3 4) 2.5 5) *68.O (no answer) 0.4
Two similar items appeared on the grade eight portions of NAEP examinations. In 1990 students wereasked to select the least whole number satisfying 2x >11 and in 1992 to supply two whole numbers that wouldsatisfy the open sentence 54<3 xCL Performance on these two items was 45 percent correct and 49 percentcorrect respectively. This is somewhat disappointing in that the Japanese item is harder than either of thecorresponding NAEP items as it asks students to make a transformation of the inequality and then identi~an equivalent inequality.
NAEP 25. What is the least whole number x for which 2x > 11?
()
A) 5B6
(s) ;2(E) 23
A) 5 B) *46 c) 10 D) 20 E) 1 omit) 1
31
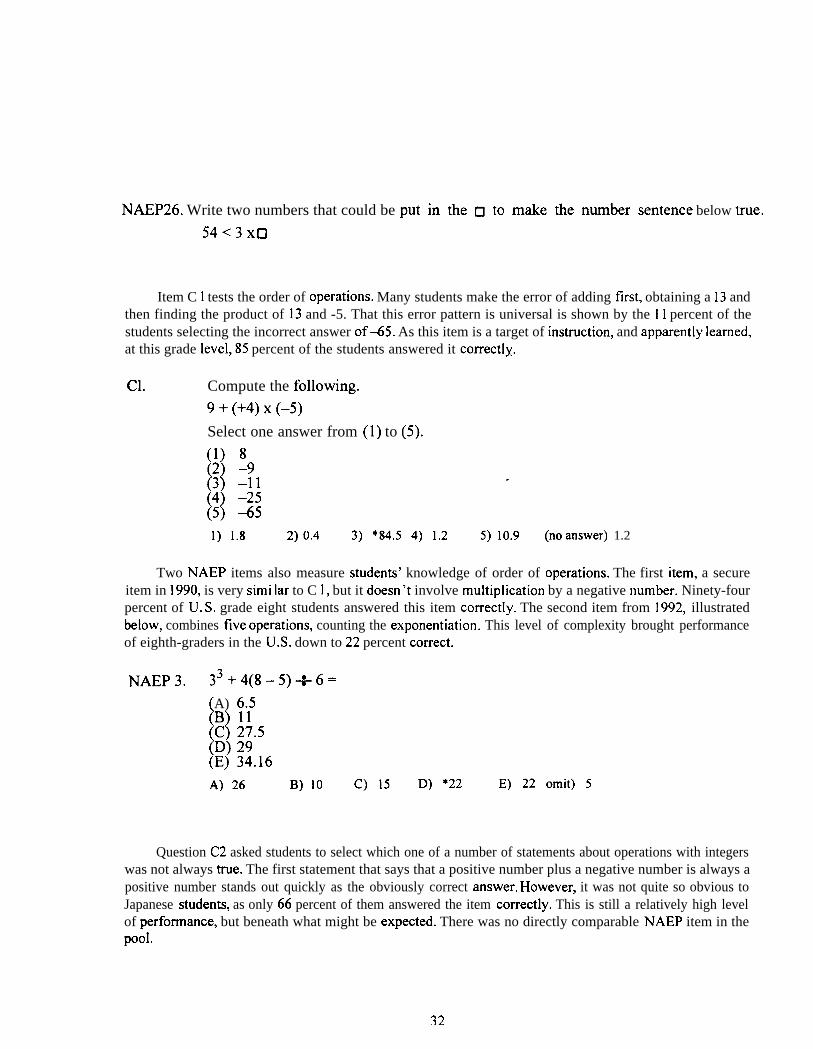
NAEP26. Write two numbers that could be put in the o to make the number sentence below true,
54 <3X0
Item C 1 tests the order of operations. Many students make the error of adding first, obtaining a 13 andthen finding the product of 13 and -5. That this error pattern is universal is shown by the 11 percent of thestudents selecting the incorrect answer of-65. As this item is a target of instruction, and apparently learned,at this grade level, 85 percent of the students answered it correctly.
cl. Compute the following.
9 + (+4)x (-5)
Select one answer from (1) to (5).
(y ~9
H3 -11 r(4) -25(5) -65
1) 1.8 2) 0.4 3) *84.5 4) 1.2 5) 10.9 (no answer) 1.2
Two NAEP items also measure students’ knowledge of order of operations. The first item, a secureitem in 1990, is very simi Iar to C 1, but it doesn ‘t involve multiplication by a negative number. Ninety-fourpercent of U. S. grade eight students answered this item correctly. The second item from 1992, illustratedbelow, combines five operations, counting the exponentiation. This level of complexity brought performanceof eighth-graders in the U.S. down to 22 percent correct.
NAEP 3. 33+4(8-5)+6=
[A) 6.5B) 11
[C) 27.5D) 29
(E) 34.16
A) 26 B) 10 c) 15 D) *22 E) 22 omit) 5
Question C2 asked students to select which one of a number of statements about operations with integerswas not always true. The first statement that says that a positive number plus a negative number is always apositive number stands out quickly as the obviously correct answer. However, it was not quite so obvious toJapanese students, as only 66 percent of them answered the item correctly. This is still a relatively high levelof performance, but beneath what might be expected. There was no directly comparable NAEP item in thepool.
32
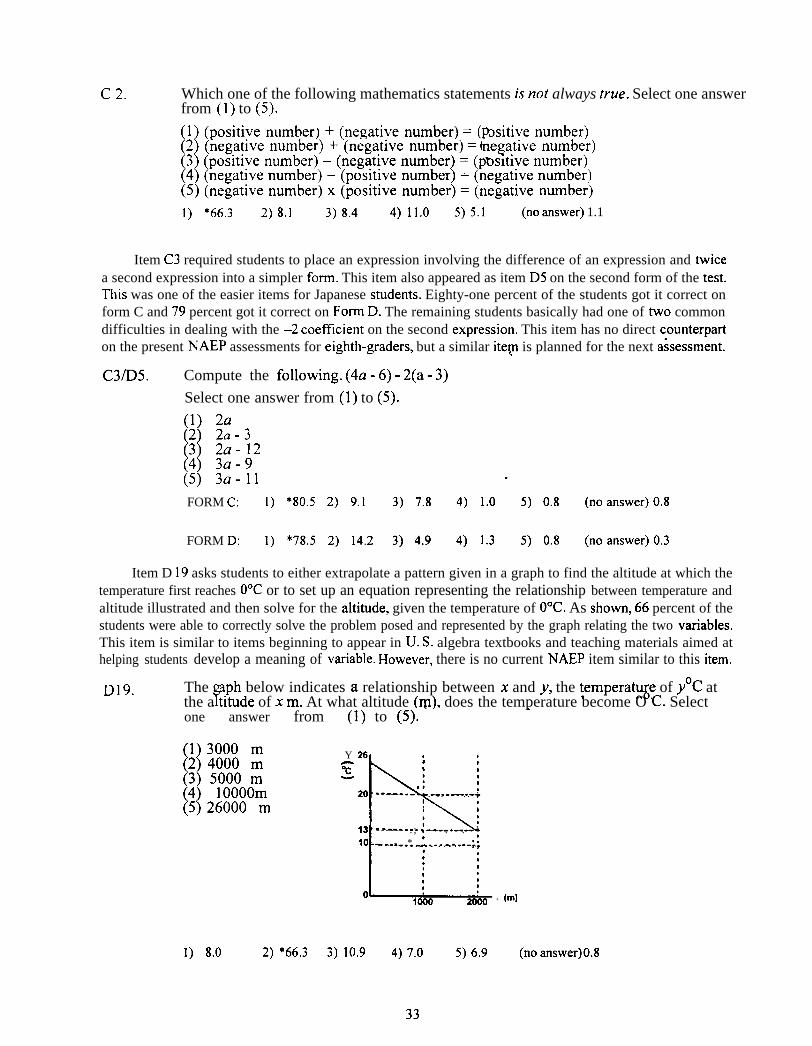
c 2. Which one of the following mathematics statements is not always true. Select one answerfrom (1) to (5).
(1) (positive number) + (negative number)= ( ositive number)t(2) (negative number) + (negative number)= negative number)
(3) (positive number) - (negative number) = (p~sltive number)(4) (negative number) - (positive number) = (negative number)(5) (negative number) x (positive number)= (negative number)
1) *66.3 2) 8.1 3) 8.4 4) 11.0 5) 5.1 (no answer) 1.1
Item C3 required students to place an expression involving the difference of an expression and twicea second expression into a simpler form. This item also appeared as item D5 on the second form of the test.This was one of the easier items for Japanese students. Eighty-one percent of the students got it correct onform C and 79 percent got it correct on Form D. The remaining students basically had one of two commondifficulties in dealing with the -2 coel%cient on the second expression. This item has no direct counterpation the present NAEP assessments for eighth-graders, but a similar ite~ is planned for the next a&essment.
C31D5. Compute the following. (4a - 6) - 2(a - 3)
Select one answer from (1) to (5).
(1) 2a(:) ;:-;2
[)4 3a:9(5) 3a-n .
FORM C: 1) *80.5 2) 9.1 3) 7.8 4) 1.0 5) 0.8 (no answer) 0.8
FORM D: 1) *78.5 2) 14.2 3) 4.9 4) 1.3 5) 0.8 (no answer) 0.3
Item D 19 asks students to either extrapolate a pattern given in a graph to find the altitude at which thetemperature first reaches O°C or to set up an equation representing the relationship between temperature andaltitude illustrated and then solve for the altitude, given the temperature of O°C. As shown, 66 percent of thestudents were able to correctly solve the problem posed and represented by the graph relating the two variables.This item is similar to items beginning to appear in U. S. algebra textbooks and teaching materials aimed athelping students develop a meaning of variable. However, there is no current NAEP item similar to this item.
D19. The raph below indicates a relationship between x and y, the tempera~e of y°C atYthe a titude of x m. At what altitude (ml does the temperature become O C. Select
one answer from (1) to (5). ‘ ‘
u1 3000 m2 4000 m
(3) 5000 m
[14 1000Om5 26000 m
1) 8.0 2) *(j63
Y 26
E
;~
#ns
20 ------- ‘ .-.. --..-:I
I
13 -------.; ----. -.--’,
10 . . ...-...* . . . . . . . ..-.,,* *
tI: I
o1000 2000 x
3) 10.9 4) 7.0 5) 6.9
(m)
(no answer)O.8
33
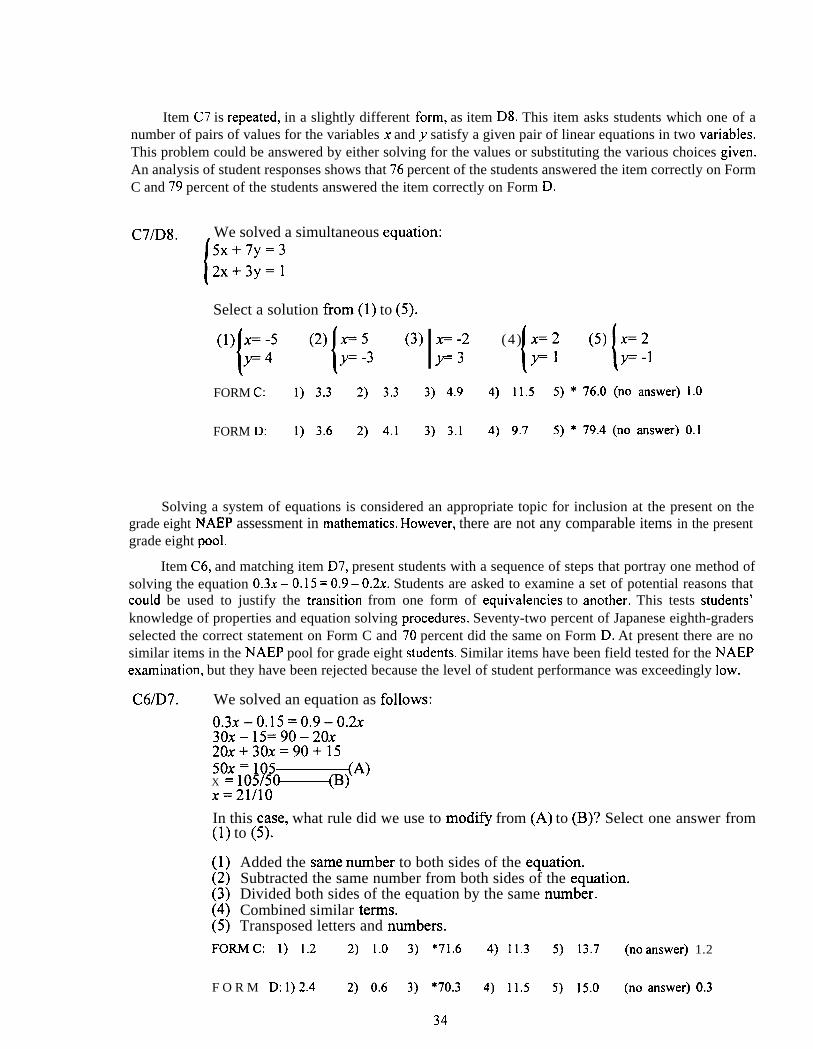
Item C7 is repeated, in a slightly different form, as item D8. This item asks students which one of anumber of pairs of values for the variables x and y satisfy a given pair of linear equations in two variables.This problem could be answered by either solving for the values or substituting the various choices given.An analysis of student responses shows that 76 percent of the students answered the item correctly on FormC and 79 percent of the students answered the item correctly on Form D.
C71D8. , We solved a simultaneous equation:
[
5x+7y=32x+3y=l
Select a solution from(1) to (5)<
r– -2y=3
FORM C: 1) 3.3 2) 3.3 3) 4.9
FORM D: 1) 3.6 2) 4.1 3) 3.1
((4 ) x=2 (5)y=l
4) 11.5 5) * 76.0 (no answer) 1.0
4) 9.7 5) * 79.4 (no answer) 0.1
Solving a system of equations is considered an appropriate topic for inclusion at the present on thegrade eight NAEP assessment in mathematics. However, there are not any comparable items in the presentgrade eight pool.
Item C6, and matching item D7, present students with a sequence of steps that portray one method ofsolving the equation 0.3x - 0.15 = 0.9 – 0.2x. Students are asked to examine a set of potential reasons thatcould be used to justify the tramition from one form of equivalences to another. This tests students’knowledge of properties and equation solving procedures. Seventy-two percent of Japanese eighth-gradersselected the correct statement on Form C and 70 percent did the same on Form D. At present there are nosimilar items in the NAEP pool for grade eight students. Similar items have been field tested for the NAEPexamination, but they have been rejected because the level of student performance was exceedingly low.
C6/D7. We solved an equation as follows:
0.3X -0.15 = 0.9- 0.2X30X – 15=90 – 20X20x+30x=90+1550x = 105~A)X = 105/50—(B)x=21/lo
In this case, what rule did we use to modifi from (A) to (B)? Select one answer from(1) to (5).
(1)(2)(3)(4)(5)
Added the same number to both sides of the equation.Subtracted the same number from both sides of the equation.Divided both sides of the equation by the same number.Combined similar terms.Transposed letters and numbers.
FORMC: 1) 1.2 2) 1.0 3) *71.6 4) 11.3 5) 13.7 (no answer) 1.2
F O R M D: 1) 2.4 2) 0.6 3) “70.3 4) 11.5 5) 15.0 (no answer) 0.3
34
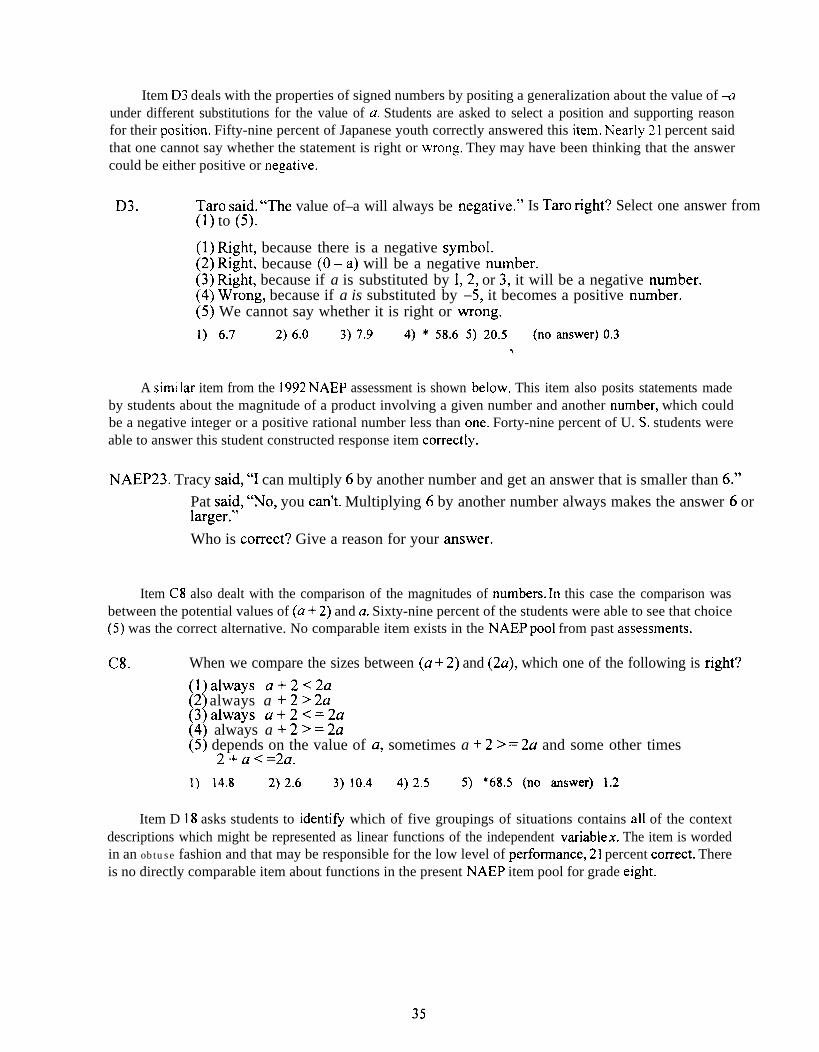
Item D3 deals with the properties of signed numbers by positing a generalization about the value of -aunder different substitutions for the value of a. Students are asked to select a position and supporting reasonfor their position. Fifty-nine percent of Japanese youth correctly answered this item. Nearly21 percent saidthat one cannot say whether the statement is right or wrong. They may have been thinking that the answercould be either positive or negative.
D3. Taro said. “The value of–a will always be negative.” Is Taro right? Select one answer from(1) to (5).
(1) Right, because there is a negative symbol.(2) Right, because (O -a) will be a negative number.(3) Right. because if a is substituted by 1,2, or 3, it will be a negative number.(4) Wrong, because if a is substituted by -5, it becomes a positive number.(5) We cannot say whether it is right or wrong.
1) 6.7 2) 6.0 3) 7.9 4) * 58.6 5) 20.5 (no answer) 0.35
A simi Iar item from the 1992 NAEP assessment is shown below. This item also posits statements madeby students about the magnitude of a product involving a given number and another number, which couldbe a negative integer or a positive rational number less than one. Forty-nine percent of U. S. students wereable to answer this student constructed response item correctly.
NAEP23. Tracy said, “I can multiply 6 by another number and get an answer that is smaller than 6.”
Pat said, “No, you can’t. Multiplying 6 by another number always makes the answer 6 orlarger.”
Who is correct? Give a reason for your answer.
Item C8 also dealt with the comparison of the magnitudes of numbers. In this case the comparison wasbetween the potential values of (a + 2) and a. Sixty-nine percent of the students were able to see that choice(5) was the correct alternative. No comparable item exists in the NAEP pool from past assessments.
C8. When we compare the sizes between (a + 2) and (2a), which one of the following is right?
(1 always a+2<2a
[12 always a + 2> 2a3 always a+2~=2a
(4) always a + 2> = 2a(5) depends on the value of a, sometimes a + 2> = 2a and some other times
2+ac=2a.
1) 14.8 2) 2.6 3) 10.4 4) 2.5 5) *68.5 (no answer) 1.2
Item D 18 asks students to identi& which of five groupings of situations contains all of the contextdescriptions which might be represented as linear functions of the independent variablex. The item is wordedin an obtuse fashion and that may be responsible for the low level of performance, 21 percent correct. Thereis no directly comparable item about functions in the present NAEP item pool for grade eight.
35
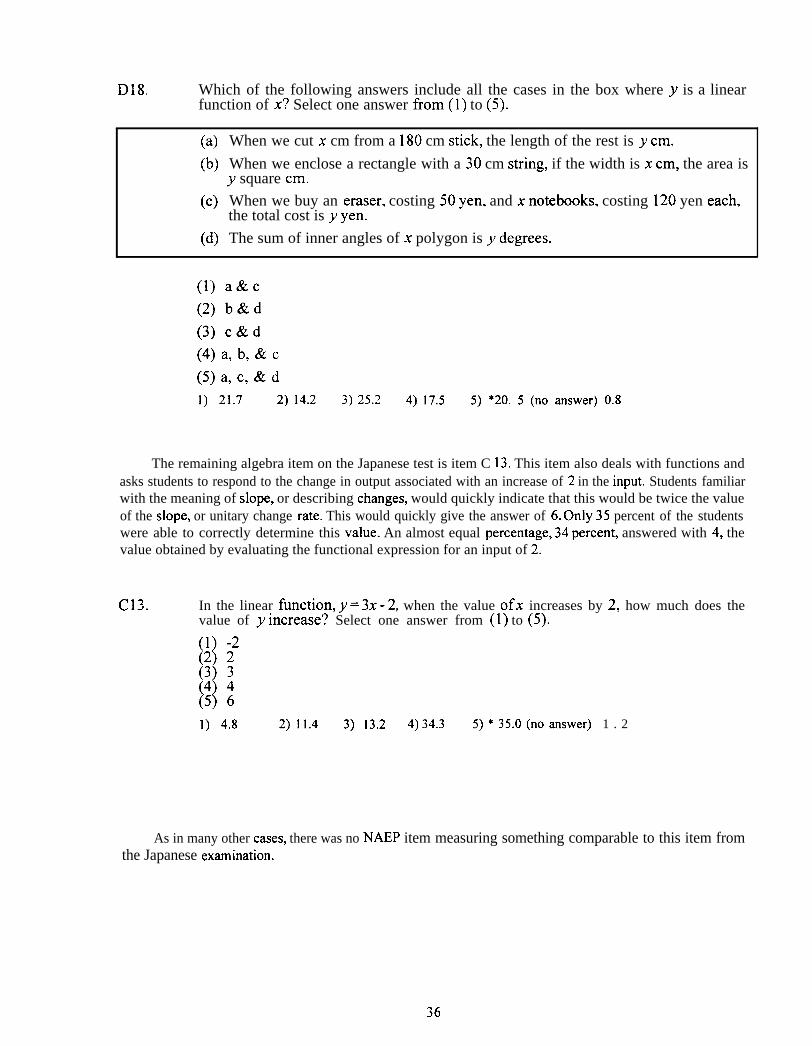
D18. Which of the following answers include all the cases in the box where y is a linearfunction of x? Select one answer from(1) to (5).
(a)
(b)
(c)
(d)
When we cut x cm from a 180 cm stick, the length of the rest is y cm.
When we enclose a rectangle with a 30 cm string, if the width is x cm, the area isy square cm.
When we buy an eraser, costing 50 yen. and x notebooks, costing 120 yen each,the total cost is y yen.
The sum of inner angles of x polygon is y degrees.
(1) a&c
(2) b&d
(3) c&d
(4) a, b, & c
(5) a, c, & d
1) 21.7 2) 14.2 3) 25.2 4) 17.5 5) “20. 5 (no answer) 0.8
The remaining algebra item on the Japanese test is item C 13. This item also deals with functions andasks students to respond to the change in output associated with an increase of 2 in the input. Students familiarwith the meaning of slope, or describing changes, would quickly indicate that this would be twice the valueof the slope, or unitary change rate. This would quickly give the answer of 6. Only35 percent of the studentswere able to correctly determine this value. An almost equal percentage, 34 percent, answered with 4, thevalue obtained by evaluating the functional expression for an input of 2.
C13. In the linear function, y= 3x -2, when the value ofx increases by 2, how much does thevalue of y increase? Select one answer from (1) to (5).
[)1 -2
(;) :
[156
1) 4.8 2) 11.4 3) 13.2 4) 34.3 5) * 35.0 (no answer) 1 . 2
As in many other cases, there was no NAEP item measuring something comparable to this item fromthe Japanese examination.
36
Chapter4: A Retrospective ViewAfler an examination of the intent of the essential mathenmtics study and the items gi}’en students, along
with comparable NAEP items, it is important to pause and consider the differences and ivhat they might tel iabout the mathematics education of the two groups of students in~o]ved. in doing so. it is important toremember the difficulty and dangers involved in drawing simple conclusions about cross-cultural differencesfrom a small sample of items reflecting learning that has taken place in two different cultures” homes andeducational systems over a period of nearly thirteen years for the students involved (Stigier. et al.. 1990:Leestma and Walberg. 1992; Medrich and Griffith, 1992: Robitaille and ‘rravers. 1992). Even in the face ofsuch obstacles, it is important to consider the patterns observed and trj to fit them with other observed workand form inferences from the data.
The Assessments
A consideration of the items on the Japanese essential mathematics assessment forms rather clearlyshows the greater cognitive demand the items place on students than the items drawn from the same contentareas in NAEP. This is almost uniformly true, from the first item examined in Numbers and Operationsthrough the final question examined in Algebra and Functions. In format, the Japanese items were essentiallyall multiple choice, with the exception of the paper unfolding item (C21 ) and area bisection item (D22) inGeometry. The NAEP examination had a broader venue of response forms, includinS both regular andextended student constructed response items. Given the same amount of time to respond. the average numberof items asked of Japanese students was about half the number given to U. S. students. However. the Japaneseitems tended to present the mathematics assessed in forms that were:
.. more verbally intensive. The item stems were longer and provided more context or information. As
such, they placed greater reading and, in many cases, organizational loads on the students in thestudy.
● more focused on strategies for problem solving. Several items asked students to either side with oneor another of two potential avenues for dealing with a contextual situation, often by agreeing ordisagreeing with a potential solution path. Other items asked what Information needed to beestablished in order to either establish a ciaim or move forward from a given position. AS a particularexample, consider item D 13 in Geometry.
. more invoived. Wi~ile items on the NAEP established whether or not students knew given “factoids”of information or could correctiy impiement an algorithm or procedure, items on the Japaneseexamination often started witil sucil an assumption and then asked an additional step. requiring someinsightful anaiysis, of the students. For example, consider tile first item in Numbers and Operations,C 16, or DI 1 and D22 in Geometry, or item C 13 in Aigebra and Functions.
Tilese differences are, no doubt, reflective of even greater differences in the two groups of students’opportunity to iearn in ciassroom settings, the nature of the iearning environments in their ciasses, and theexpectations tilat their parents, teachers, and cuitures place on them. Tilese differences are well deveiopedand anaiyzed elsewilere in tile literature.
However, these differences notwithstanding, an objective analysis of tile comparabi Iity of the items. atan item-by-item levei, wouid indicate that the items on the Japanese eigilth-grade assessment are moredifficuit than their content-area matches on the NAEP tests. That said, it is difficuit to, as directly, comparethe diflicuity of tile assessment forms and contexts themselves. Students working on tile NAEP examinationhave to compiete aimost twice the number of items in the same time period. The press piaced on U. S. studentsis indicated by the increase in non-completion of items near the end of severai of the fifteen minute blocksof items. Thus the NAEP test has three rushes to completion in the 45 minute testing period. Anaiysis of theperformance data on the iast few items of the Japanese assessment did not indicate an increase in non-corn -pietion.
37
Beyond form differences, there is evidence in the cross-cultural literature of differences in studentmotivation associated with taking such examinations. Some of this comes from the perceived importance ofdoing well on the assessment (Lapointe, et al., 1992), other influences ma> come from the perceivedrelationship of the match between the assessment’s contents and the curriculurn<overage that the studentstaking the assessment have experienced in their current school >ear (Robitai Ile and Travers, 1992).
The Curriculum
Probably the greatest difference in the assessments. and the program of studies preparing the studentsin mathematics, is the form and substance of the mathematics curriculum itself. The nature of these differenceshas been covered by global. and some local, analyses in the past (ivlcKni@. et al.. 1987; Travers andWestbury, 1989; Robitaille and Garden, 1989; and Robitaille and Travers. 1992). However, the opportunityto examine the differences from the actual items on a Japanese examination purporting to measure the “basicessentials” in mathematics that students should have garnered from their learning experiences and theopportunity to match those observations to the nature of the age~grade level curriculum provides a venue ofcomparison not afforded by the nature of most cross-cultural studies focusing on achievement or proficiencydifferences based from a common examination.
The Japanese mathematics curriculum for students in lok~ er secondary school is quite explicit in itsgoals and expectations (Ministry of Education, n.d. ). At grade one of the lower secondary school (equivalentto the U.S. seventh grade), the grade preceding the grade in which the assessment was given. the curriculumfocuses on the system of integers and their operations; use of variables to represent physical situationsinvolving linear equations; construction of basic geometric figur’es using straightedge and compass; consid-eraticm of the properties of elementary translations, reflections, and rotations of basic geometric figures; andgraphing basic functional relationships in the Cartesian plane.
Grade two mathematics of the lower secondary school (equivalent to the U. S. eighth grade) has theobjectives (Ministry of Education, n.d.) of
. To help students develop their abilities to compute and transform algebraic expressions using lettersymbols, according to their purposes, and to help them understand linear inequalities and simultane-OLIS equations, and to foster their abilities to use them.
. To help students deepen their understanding of the properties of the fundamental figures in a plane,and thereby understand the significance and methods of mathematical inference with reference toconsideration of the properties of figures, and to foster their abilities to precisely represent the processof inference.
. To help students further deepen their way of viewing and thinking variation and correspondence andunderstand the characteristics of linear functions, and foster their abilities to use them. Furthermore,to help students adequately represent numbers according to their purposes and develop their abilitiesto grasp the tendencies of statistical phenomena (p. 27).
These objectives of study for the year are followed by a careful curriculum content breakdown thatshows a close correlation with the content found on the essential mathematics assessment. A section followingthe listing of the content provides direction on the comparison of the importance of the three objectives. Inthe teaching of content related to the first objective, teachers should represent the procedures through the useof flow-charting methods and see that students real [y cover the work on systems of equat ions in two variables;in the teaching of the second objective, teachers should ensure that students see the applications of similarityto the measurement of height and distance; in the consideration of content related to the third objective, focusshould be given to the a x 10” + . . . standard form for showing decimal expansions of real numbers and todaily-life phenomena for data analysis situations.
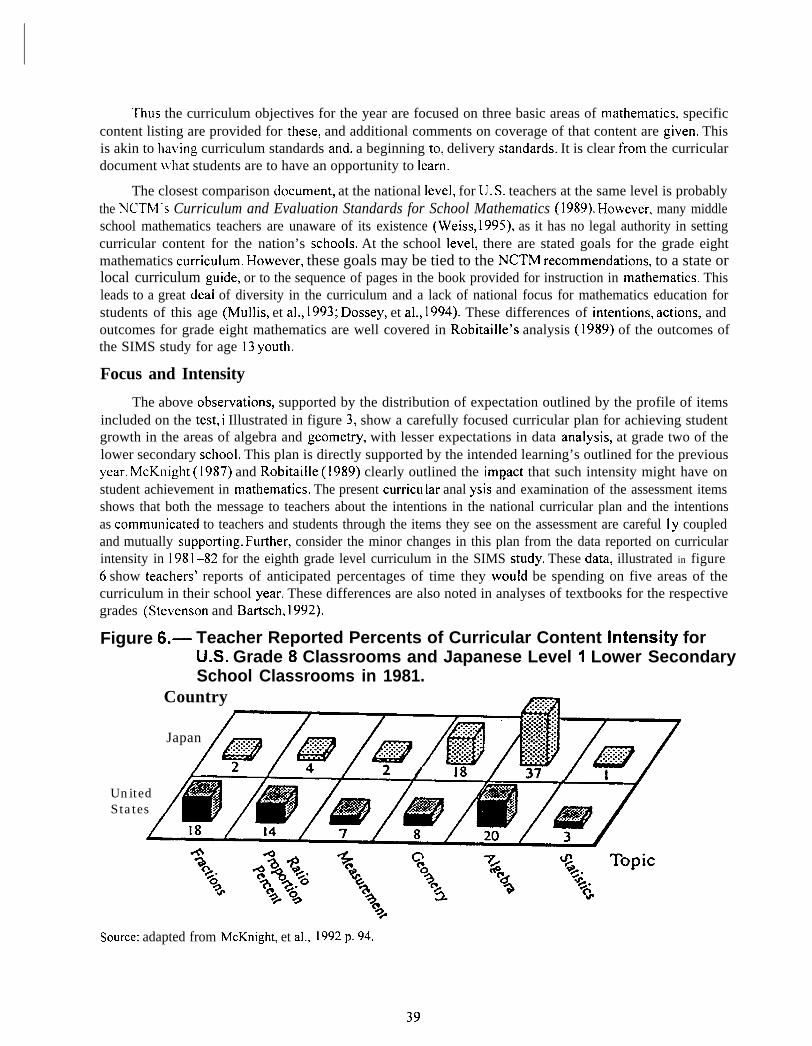
ThLIs the curriculum objectives for the year are focused on three basic areas of Imathernatics, specificcontent listing are provided for these, and additional comments on coverage of that content are given. Thisis akin to Ila\ing curriculum standards and, a beginning to, delivery standards. It is clear frolm the curriculardocument ~ihat students are to have an opportunity to learn.
The closest comparison document, at the national level, for U. S. teachers at the same level is probablythe NCTM’s Curriculum and Evaluation Standards for School Mathematics ( 1989). However, many middleschool mathematics teachers are unaware of its existence (Weiss, 1995), as it has no legal authority in settingcurricular content for the nation’s schools. At the school level, there are stated goals for the grade eightmathematics curriculum. However, these goals may be tied to the NCTM recommendations, to a state orlocal curriculum guide, or to the sequence of pages in the book provided for instruction in mathematics. Thisleads to a great deal of diversity in the curriculum and a lack of national focus for mathematics education forstudents of this age (Mullis, et al., 1993; Dossey, et al., 1994). These differences of intentions, actions, andoutcomes for grade eight mathematics are well covered in Robitaille’s analysis (1989) of the outcomes ofthe SIMS study for age 13 youth.
Focus and Intensity
The above observations, supported by the distribution of expectation outlined by the profile of itemsincluded on the test, i Illustrated in figure 3, show a carefully focused curricular plan for achieving studentgrowth in the areas of algebra and geometry, with lesser expectations in data analysis, at grade two of thelower secondary school. This plan is directly supported by the intended learning’s outlined for the previousyear. McKnigllt (1987) and Robitaille (1989) clearly outlined the impact that such intensity might have onstudent achievement in mathematics. The present curricu Iar anal ysis and examination of the assessment itemsshows that both the message to teachers about the intentions in the national curricular plan and the intentionsas communicated to teachers and students through the items they see on the assessment are careful I y coupledand mutually supporting. Further, consider the minor changes in this plan from the data reported on curricularintensity in 1981 –82 for the eighth grade level curriculum in the SIMS study. These data, illustrated in figure6 show teachers’ reports of anticipated percentages of time they would be spending on five areas of thecurriculum in their school year. These differences are also noted in analyses of textbooks for the respectivegrades (Stevenson and Bartsch, 1992).
Figure 6.— Teacher Reported Percents of Curricular Content Intensity forU.S. Grade 8 Classrooms and Japanese Level 1 Lower SecondarySchool Classrooms in 1981.
Country
Japan
UnitedStates
Source: adapted from McKnight, et al., 1992 p. 94.
39
These differences in intensity, or narrowed content focus, during a school year are directly related tothe philosophical differences in the actual construction of the curricula. American textbooks, which defineclassroom activities in mathematics more than any other source, present a broad homogeneous contentintroduction for students, attempting to address in each year all of the potential topics outlined in theCurriculum and Evaluation Standards for School Mathematics (1989) appropriate for the intended gradelevel. There is ample review and some extension at each grade level, based on a “spiral” model for contentintroduction and coverage. This same pattern of broad coverage of possible topics of instruction with littlechange from year to year is modeled by the ubiquitous achievement tests used in schools and state assessments.Japanese textbooks, and the essential mathematics examination, paint a much narrower focus for the schoolcurriculum.
This is a focus of few major objectives for a year’s study. The ensuing intensity has a number ofpotential y strong outcomes related to observed proficiency and the supporting personal construction ofknowledge in students. A prolonged focus on a smaller set of content topics in a given grade may allow forteachers to observe students’ knowledge of the related concepts, procedures, understandings, and problem-solving skills in greater depth. This narrowed responsibility in coverage allows the teachers to become a bitmore specialized in their teaching, allowing more preparation aimed at the connections necessary for realstudent growth in these few areas. The greater period of time devoted to these topics allows for teachers toobserve more than the quick review and minimal extension of a topic before rotating to the next content areain a spirally designed curriculum.
The greater opportunity to observe student knowledge and ability to apply that knowledge allows forgreater opportunity for the teacher to assess, plan, implement, and assess again relevant aspects of the enablingknowledges that students need to master the targeted objectives. The rapid coverage and rotation betweentopics in a spirally organized curriculum with many more grade level objectives and minimal growthexpectations per grade does not afford teachers with such an opportunity to use their teaching skills.
Beyond the ability to actually implement good teaching aimed at bringing all students to a minimalperformance level, as was evidenced by the performance of Japanese students on the items analyzed earlier,the narrowed focus potentially communicates both expectation and accountability to Japanese students andteachers. It is clear what they are to accomplish in a given school year. NCTM’S Curriculum and EvaluationStandards for School Mathematics ( 1989) presents a first step towards such a possible change in U. S. schoolmathematics. However, the broad statement of individual process and content standards for problem solving,communication, reasoning, connections, number and number relationships, number systems and numbertheory, computation and estimation, patterns and functions, algebra, statistics, probability, geometry, andmeasurement for grades five through eight does not sufficiently guide either a school, materials producer, orteacher to develop the focus observed in the Japanese curriculum and the related examinations. To achievethe coherence and focus observed in the Japanese materials, the Curriculum and Evaluation Standards forSchool Mathematics need to be futiher extended to provide grade level guidance about focus and primaryactivities for given years. This step to achievement and delivery standards for school mathematics iscurricularly achievable within the framework outlined by the NCTM content standards. Whether it ispolitically acceptable or systemically implementable are larger and more volatile questions.
40
ReferencesDossey, J. A., Mullis, I. V. S., and Jones, C. O. (1993). Can students do mathematical problem
solving? Resultsfiom constructed-response questions in NAEP’s 1992 mathematics assess-ment. Washington, DC: National Center for Education Statistics.
Dossey, J. A., Mullis, I., German, S., and Latharn, A. (1994). How school mathematics func[ions:Perspectivesfiom the NAEP 1990 and 1992 Assessments. Washington, DC: National Centerfor Education Statistics.
Grouws, D. A. (Ed.). (1992). Handbook of research on mathematics teaching and learning. NewYork, NY: Macmillan.
Husen, T. (Ed.). (1967). International study of achievement in mathematics: A comparison of twelvecountries. (2 vols.). New York, NY: John Wiley and Sons.
Lapointe, A., Mead, N., and Askew, J. (1992). Learning ma$ematics. Princeton, NJ: EducationalTesting Service.
Leestma, R., and Walberg, H. (Eds.). (1992). Japanese educational productivity. Ann Arbor, MI:Center for Japanese Studies, The University of Michigan.
McKnight, C. C., Crosswhite, F. J., Dossey, J. A., Kifer, E., Swafford, J. O., Travers, K. J., a n dCooney, T. J. (1987). The underachieving curriculum: Assessing U. S. School mathematicsfrom an international perspective. Champaign, IL: Stipes Publishing.
Medrich, E., and Griffith, J. ( 1992). International mathematics; and science assessments: What havewe learned? Washington, D. C.: National Center for Education Statistics.
Ministry of Education. (n.d.). Excerptfiom the National Courses of Study: Revised by the Ministryo fEducation. (Mathematics Sections). (Translated by Nagasaki, E., Sawada, T., and Senuma,H.) Tokyo, Japan: Japan Society of Mathematical Education.
Mullis, I., Dossey, J., Owen, E., and Phillips, G. (1993). NAEP 1992 mathematics report card forthe nation and states: Datafiom the national and trial state assessments. Washington, D. C.:National Center for Education Statistics.
Mullis, I., Dossey,J., Owen, E., and Phillips, G. (1991). The State of Mathematics Achievement:NAEPs 1990 Assessment of the Nation and the Trial Assessment of the States. Washington,D. C.: National Center for Education Statistics.
National Assessment of Educational Progress. (1988). Mathematics objectives: 1990 assessment.Princeton, NJ: Educational Testing Service.
National Assessment of Educational Progress. (1 987). Mathematics objectives: 1985-86 assessment.Princeton, NJ: Educational Testing Service.
National Council of Supervisors of Mathematics. (1977). National Council of Supervisors ofMathematics Position Paper on Basic Mathematics Skills. Minneapolis, MN: NationalCouncil of Supervisors of Mathematics.
National Council of Teachers of Mathematics. (1980). An agenda for action: Recommendations forschool mathematics of the 1980s. Reston, VA: National Council of Teachers of Mathematics.
National Council of Teachers of Mathematics. (1981). Priorities in school mathematics: Executivesummary of the PRISM Project. Reston, VA: National Council of Teachers of Mathematics.
41
National Council of Teachers of Mathematics. (1989). Curriculum and evaluation standards forschool mathematics. Reston, VA: National Council of Teachers of Mathematics.
National Institute of Educational Research. (1992). Special Study on “Essential Skills” StatisticalReport No. 1:1990 data. (Translated by S. Takahira). Tokyo, Japan: National Institute ofEducational Research.
Robitaille, D., and Garden, R. (1989). The IEA Study of Mathematics II: Contexts and outcomes ofschool mathematics. New York, NY: Pergamon Press.
Robitaille, D. (1989). Students’ achievements: Population A. In D. Robitaille and R. Garden. TheIEA Study ofllathematics II: Contexts and outcomes of school mathematics. New York, NY:Pergamon Press. @p. 102-125).
Robitaille, D., and Travers, K. (1992). International studies of achievement in mathematics. In D.A. Grouws, (Ed.). Handbook of research on mathematics teaching and learning. New York,NY: Macmillan. @p. 687-709)
Travers, K., and Westbury, I. (1989). The IEA Study of Mathematics I: Analysis of mathematicscurricula. New York, NY: Pergamon Press.
Sawada, T. (1983). Mathematics achievement and teaching practice in lower secondary schools(Grade 7). Tokyo, Japan: National Institute for Educational Research.
Stevenson, H., and Bartsch, K. (1992). An analysis of Japanese and American textbooks inmathematics. In R. Leestma and H. Walberg. (Eds.). Japanese educationalproductivity. AnnArbor, MI: Center for Japanese Studies, University of Michigan. (pp. 103-134).
Stevenson, H., Lummins, M., Lee, S., and Stigler, J. W. (1990). Making the grade in mathematics:Elementary school mathematics in the United States, Taiwan, and Japan. Reston, VA:National Council of Teachers of Mathematics.
Stigler, J., and Perry,M.(1988). Cross-cultural studies of mathematics teaching and learning: Recentfindings and new directions. In D. Grouws, T. Cooney, and D. Jones. (Eds.). Perspectiveson research on eflective mathematics teaching. Reston, VA: National Council of Teachersof Mathematics.
Stigler, J., Lee, S., and Stevenson, H. (1990). Mathematical knowledge of Japanese, Chinese, andAmerican elementary school children. Reston, VA: National Council of Teachers of Mathe-matics.
Westbury, I., Ethington, C., Sosniak, L., and Baker, D. P. (Eds.). (1994). In search of more eflectivemathematics education.” Examining data ji-om the IEA Second International MathematicsStudy. Norwood, NJ: Ablex Publishing Company.
Weiss, I. (1 995). A profile of science and mathematics in the United States: 1993. Chapel Hill, NC:Horizon Research, Inc.
42
Appendix A:
Content Matrix for the
1992 NAEP Mathematics Assessment
Taken from:
National Assessment of Educational Progress. (1988). Mathematics objectives:1990 assessment. Princeton, NJ: Educational Testing Service.
Note: These objectives were also used for the 1992 NAEP assessment.
43
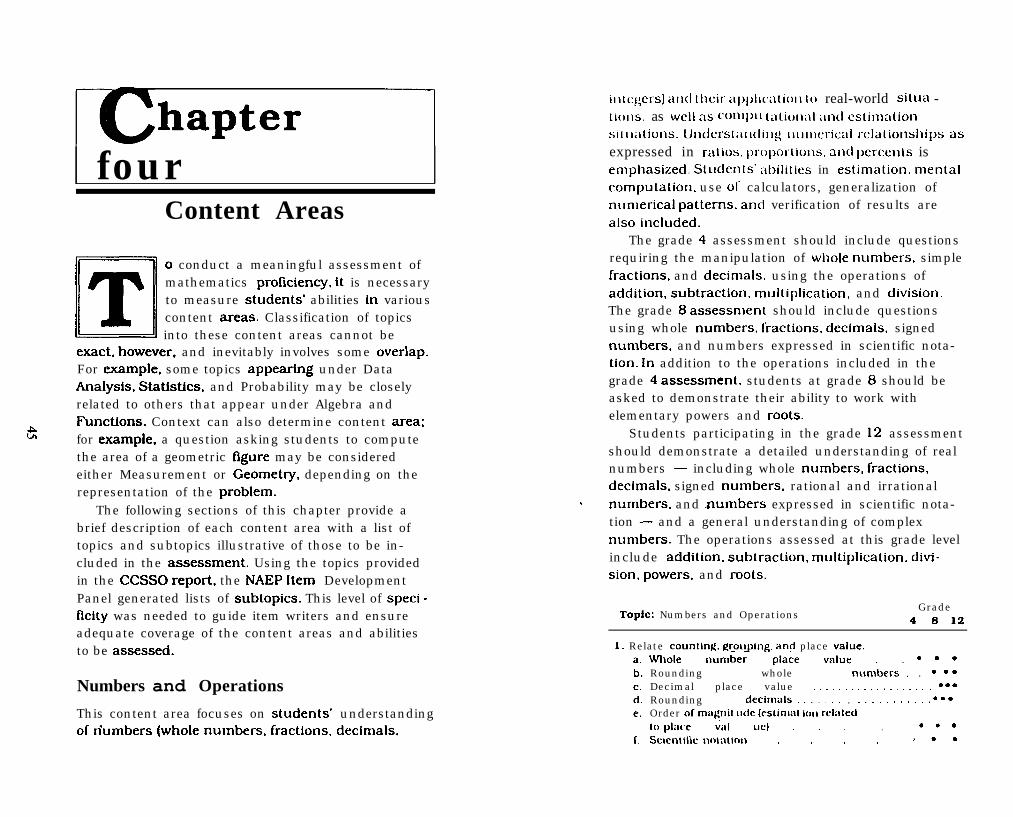
hapter 1four
Content Areas
m o conduct a meaningful assessment ofmathematics proficiency, it is necessaryto measure students’ abilities in variouscontent areas. Classification of topics
~ into these content areas cannot beexact, however, and inevitably involves some overlap.For example, some topics appeiu-ing under DataAnalysis, Statistics, and Probability may be closelyrelated to others that appear under Algebra andFunctions. Context can also determine content area;gfor example, a question asking students to computethe area of a geometric figure may be consideredeither Measurement or Geometry, depending on therepresentation of the problem.
The following sections of this chapter provide abrief description of each content area with a list oftopics and subtopics illustrative of those to be in-cluded in the assessment. Using the topics providedin the CCSSO report, the NAEP Item DevelopmentPanel generated lists of subtopics. This level of speci -ficity was needed to guide item writers and ensureadequate coverage of the content areas and abilitiesto be assessed.
Numbers and Operations
This content area focuses on students- understandingof n“umbers (whole numbers, fractions, decimals.
illlc~crs) iltl(i (Ilcir il[)l)ll(’iitioll 10 real-world Silua -ti(}l]s. as WCII aS Colll})ll( illiollill” it]ld cslima(ionSll(liltiollS. U[ldC131illl(lil]~ Il(llllcrical rcla(ionships aS
expressed in r:itios. proportions. and percenls isemphasized. StLIcleI][s” abilities in estimation, mentalcompilation, use of calculators, generalization ofnumerical patterns. and verification of results arealso included.
The grade 4 assessment should include questionsrequiring the manipulation of whole numbers, simplefractions, and decimals, using the operations ofaddition. subtraction. multiplication, and division.The grade 8 assessment should include questionsusing whole numbers. fractions, decimals, signednumbers, and numbers expressed in scientific nota-tion. In addition to the operations included in thegrade 4 assessment. students at grade 8 should beasked to demonstrate their ability to work withelementary powers and roots.
Students participating in the grade 12 assessmentshould demonstrate a detailed understanding of realnumbers — including whole numbers, fractions,decimals, signed numbers, rational and irrational
. numbers, and numbers expressed in scientific nota-tion — and a general understanding of complexnumbers. The operations assessed at this grade levelinclude addition, subtraction, multiplication, divt-sion, powers, and roots.
Topic: Numbers and OperationsGrade
4812
1. Relate counting, grouping. and place value.a.b.c.d.e.
r.
Whole numbe; place ;alue . . ● ● ●
Rounding whole numbers . . ● Q ●
Decimal place value . . . . . . . . . . . . . . . . . . . ● ● ●
Rounding decimirls . . . . . . . . . . . . . . . . . . . ● ● ●
Order O( :rmgnit II(IC (estiniilt iort rclakd(()~lilCC Vill LIC) . . . . ● ● ●
Scicnliliclll)l;lllnl) . . . . J ● ●
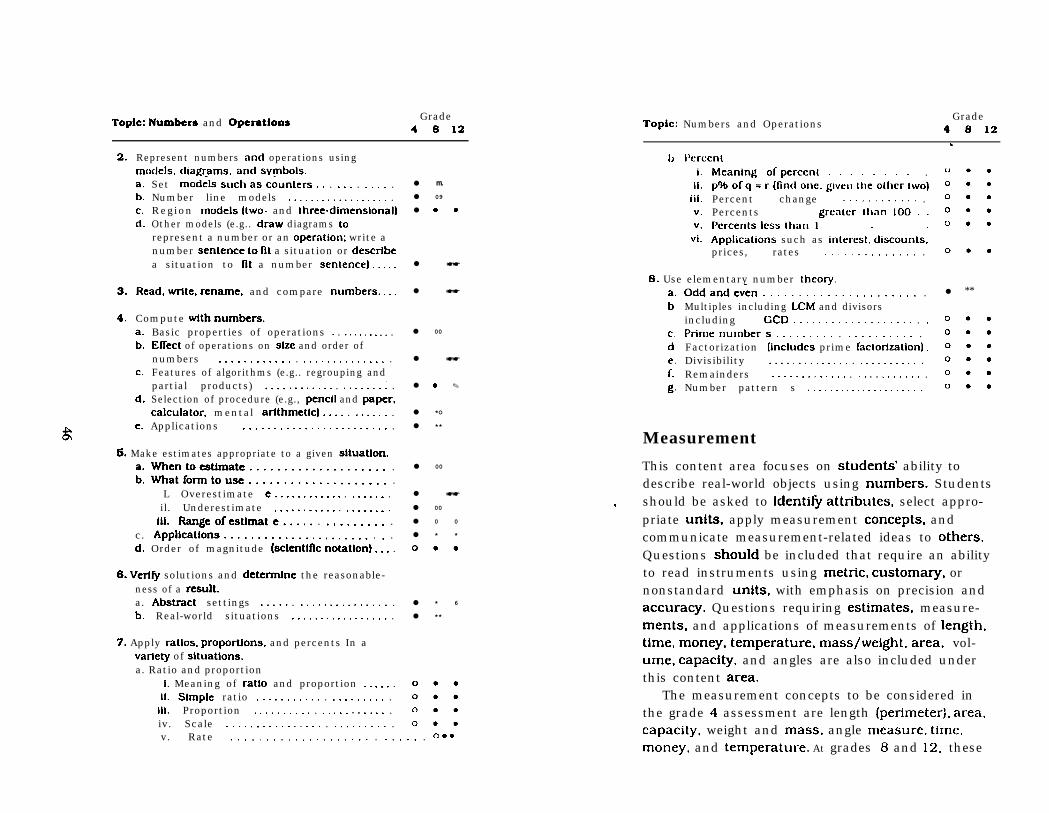
Topic: Numbers and OperationGrade
4812
2.
3.
4.
Represent numbers and operations usingmodels. diagrams. and symbols.a.b.c.d.
Set mod;ls such asc&nlers . . . . . . . . . . . .Number line models . . . . . . . . . . . . . . . . . . .Region models [two- and three-dimensional)Other models (e.g.. draw diagrams torepresent a number or an operation: write anumber sentence 10 fit a situation or descrtbea situation to nt a number sentence) . . . . .
Read. wtte, rename, and compare numbers. . . .
Compute wtth numbers.a.b.
c.
d.
e.
Basic properties of operations . . . . . . . . . . . .EfTect of operations on stze and order ofnumbers . . . . . . . . . . . . . . . . . . . . . . . . . . . .Features of algorithms (e.g.. regrouping andpartial products) . . . . . . . . . . . . . . . . . . . . . .Selection of procedure (e.g., pencil and paper.calculator. mental artthmetlc) . . . . . . . . . . . .Applications . . . . . . . . . . . . . . . . . . . . . . . . .
5. Make estimates appropriate to a given sltuatton.a.whentoesttmate . . . . . . . . . . . . . . . . . . . . .b.whatformtouae . . . . . . . . . . . . . . . . . . . . .
L Overestimate . . . . . . . . . . . . . . . . . . . . .il. Underestimate . . . . . . . . . . . . . . . . . . . .iiLRange ofesthnate . . . . . . . . . . . . . . . . .
c. Appllcritlons . . . . . . . . . . . . . . . . . . . . . . . . .d. Order of magnitude (scientific notation) . . . .
6. VertQ solutions and determtne the reasonable-ness of a result.a. Abstmct settings . . . . . . . . . . . . . . . . . . . . . .b. Real-world situations . . . . . . . . . . . . . . . . . .
7. Apply ratios. proportions. and percents In avartety of situations.a. Ratio and proportion
1. Meaning of ratio and proportion . . . . . .iLSlmple ratio . . . . . . . . . . . . . . . . . . . . . .
iii. Proportion . . . . . . . . . . . . . . . . . . . . . . .iv. Scale . . . . . . . . . . . . . . . . . . . . . . . . . . .
● m.
● 09
● OO
● ☛☛
● ☛☛
● 00
● ☛☛
● ✎ ✎
● *O
● **
● 00
● ☛☛
● 00
● 0 0
● * *
000
● * 6
● **
O**O*OO**
O*Ov. Rate . . . . . . . . . . . . . . . . . . . . . . . . . . . ~ ● ●
Topic: Numbers and OperationsGrade
4812.
b I’crcenli.
ii.iii.v.v.
vi.
Meaning ofpercenl . . . . . . . . .p% ofq = r (find one. given the olher Iwo)Percent change . . . . . . . . . . . . .Percents grcirter [lIan 100 . .Pcrcenlslcsslhanl . .Applications such as interest. discounts.prices, rates . . . . . . . . . . . . . . .
S. Use elementary number theory.a.b.
c,de.f.
g
Oddandev& . . . . . . . . . . . . . . . . . . . . . . .Multiples including LCM and divisorsincluding GCD . . . . . . . . . . . . . . . . . . . . .Pnmenumbers . . . . . . . . . . . . . . . . . . . . . .Factorization [includes prime factorization) .Divisibility . . . . . . . . . . . . . . . . . . . . . . . . . .Remainders . . . . . . . . . . . . . . . . . . . . . . . . . .Number pattern s . . . . . . . . . . . . . . . . . . . . .
Measurement
()**
00.
O*O
000
000
000
● **
000O*O000O*4O**
o**
This content area focuses on students’ ability todescribe real-world objects using numbers. Students
, should be asked to identi~ attributes, select appro-priate units, apply measurement concepts, andcommunicate measurement-related ideas to others.Questions should be included that require an abilityto read instruments using metric, customary, ornonstandard units, with emphasis on precision andaccuracy. Questions requiring estimates, measure-ments, and applications of measurements of length,time, money. temperature, mass/weight, area, vol-ume, capacity, and angles are also included underthis content area.
The measurement concepts to be considered inthe grade 4 assessment are length (perimeter], area.capacity, weight and mass, angle measure, time,money. and temperature. At grades 8 and 12, these
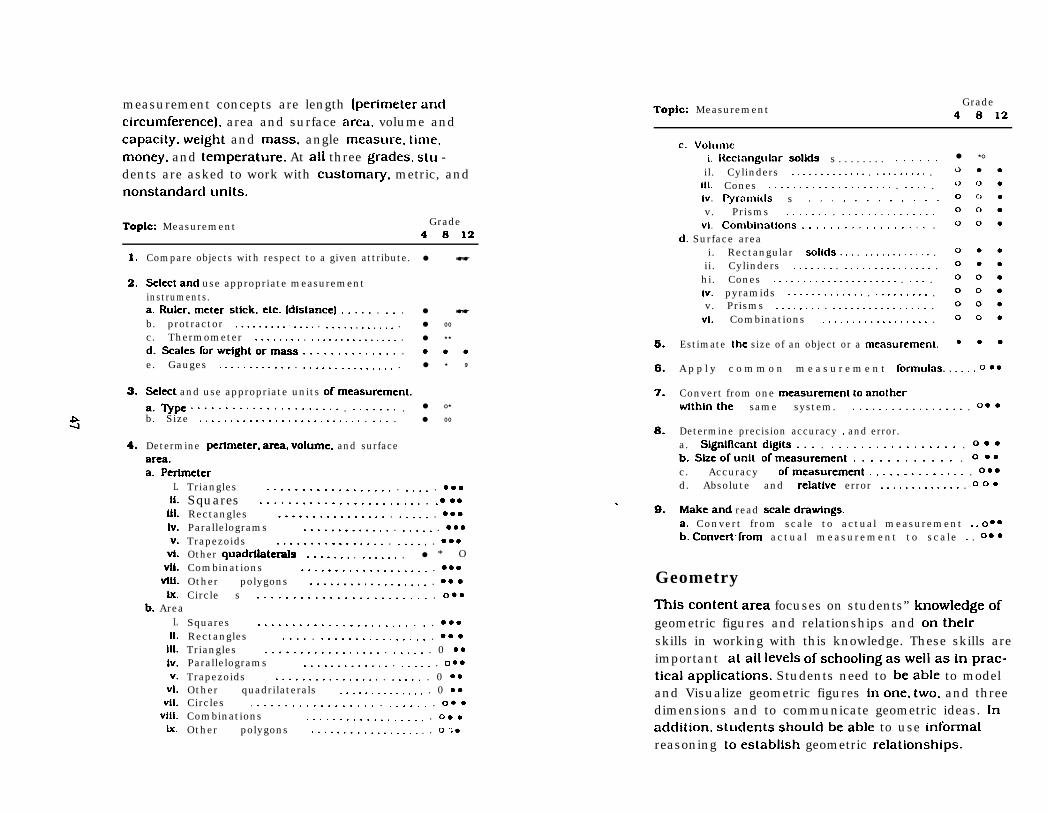
measurement concepts are length (perimeter andcircumference), area and surface area, volume andcapacity. weighl and mass. angle measure. time.money, and temperature. At all three grades, s(u -dents are asked to work with customary, metric, andnonstandard units.
Topic: Measurement Grade4812
1.
2,
3.
4.
Compare objects with respect to a given attribute.
select and use appropriate measurementinstruments.a. Ruler. meter stick. etc. (distance) . . . . . . . . .b. protractor . . . . . . . . . . . . . . . . . . . . . . . . . . . .c. Thermometer . . . . . . . . . . . . . . . . . . . . . . . . .d.scales [orweightormaaa . . . . . . . . . . . . . . .e. Gauges . . . . . . . . . . . . . . . . . . . . . . . . . . . . .
Selecl and use appropriate units O( measurement.
a.’VF . . . . . . . . . . . . . . . . . . . . . . . . . . . . . . .b. Size . . . . . . . . . . . . . . . . . . . . . . . . . . . . . . .
Determine pertmeter. area. volume. and surfacearea.a. Pertmeter
LIl.Ill.hr.v.
Vt.Vii.
VW.tx.
b. AreaL
ii.Ill.Iv.v.
vi.vii.
viii.lx.
● ☛☛
● ☛☛
● 00
● **
9**
● * 9
● O*
● 00
Triangles . . . . . . . . . . . . . . . . . . . . . . . . ● ● ●
Squares . . . . . . . . . . . . . . . . . . . . . . . . . ● . ●
Rectangles . . . . . . . . . . . . . . . . . . . . . . . ● ● ●
Parallelograms . . . . . . . . . . . . . . . . . . . . ● ● ●
Trapezoids . . . . . . . . . . . . . . . . . . . . . . . ● ● ●
Other quadrtlaterais . . . . . . . . . . . . . . . ● * OCombinations . . . . . . . . . . . . . . . . . . . . ● ● ●
Other polygons . . . . . . . . . . . . . . . . . . . ● ● .Circle s . . . . . . . . . . . . . . . . . . . . . . . . . 0 ● ●
Squares . . . . . . . . . . . . . . . . . . . . . . . . . ● ● ●
Rectangles . . . . . . . . . . . . . . . . . . . . . . ● ● .Triangles . . . . . . . . . . . . . . . . . . . . . . . . 0 ● ●
Parallelograms . . . . . . . . . . . . . . . . . . . . 0 ● ●
Trapezoids . . . . . . . . . . . . . . . . . . . . . . . 0 ● ●
Other quadrilaterals . . . . . . . . . . . . . . . 0 . ●
Circles . . . . . . . . . . . . . . . . . . . . . . . . . . 0 ● .Combinations . . . . . . . . . . . . . . . . . . . 0 ● .Other polygons . . . . . . . . . . . . . . . . . . . 0 ; ●
Topic: MeasurementGrade
4812
c. Volumei. Rectangula rsolid s . . . . . . . . . . . . . .il. Cylinders . . . . . . . . . . . . . . . . . . . . . . . .
IiI. Cones . . . . . . . . . . . . . . . . . . . . . . . . . .lv. Pyranlid s . . . . . . . . . . . .v. Prisms . . . . . . . . . . . . . . . . . . . . . . .vl.Combinations . . . . . . . . . . . . . . . . . . .
d. Surface areai. Rectangular solicts . . . . . . . . . . . . . . . . .ii. Cylinders . . . . . . . . . . . . . . . . . . . . . . . .hi. Cones . . . . . . . . . . . . . . . . . . . . . . . . . .Iv. pyramids . . . . . . . . . . . . . . . . . . . . . . . .v. Prisms . . . . . . . . . . . . . . . . . . . . . . . . . .
vl. Combinations . . . . . . . . . . . . . . . . . . .
5. Estimate the size of an object or a measurement.
● *O
O**
000000000000
O*900000000000000*
9*m
6. App ly common measurement formulas. . . . . . 0 . ●
7. Convert from one measurement Io anotherwtthinthe same system. . . . . . . . . . . . . . . . . . . 0 ● c
8. Determine precision accuracy . and error.a. Slgnlftcant dlglts . . . . . . . . . . . . . . . . . . . . . . 0 c cb. Stzeofunit ofmeasurement . . . . . . . . . . . . . 0 . ●
c. Accuracy ofmeasurement . . . . . . . . . . . . . . . 0 ● ●
d. Absolute and relatlve error . . . . . . . . . . . . . . 0 0 .
.9. Makeand read scaledrawtngs.
a. Convert from scale to actual measurement . . 0 ● ●
b. Convert”from actual measurement to scale . . 0 ● s
Geometry
‘l%isconten tarea focuses on students” knowledgeofgeometric figures and relationships and ontheirskills in working with this knowledge. These skills areimportant atali leveis ofschooling asweiiasinprac-ticalappiications. Students need to beable to modeland Visualize geometric figures inone, two, and threedimensions and to communicate geometric ideas. Inaddition. slucients shouidbeabie to use informalreasoning toestabiish geometric relationships.
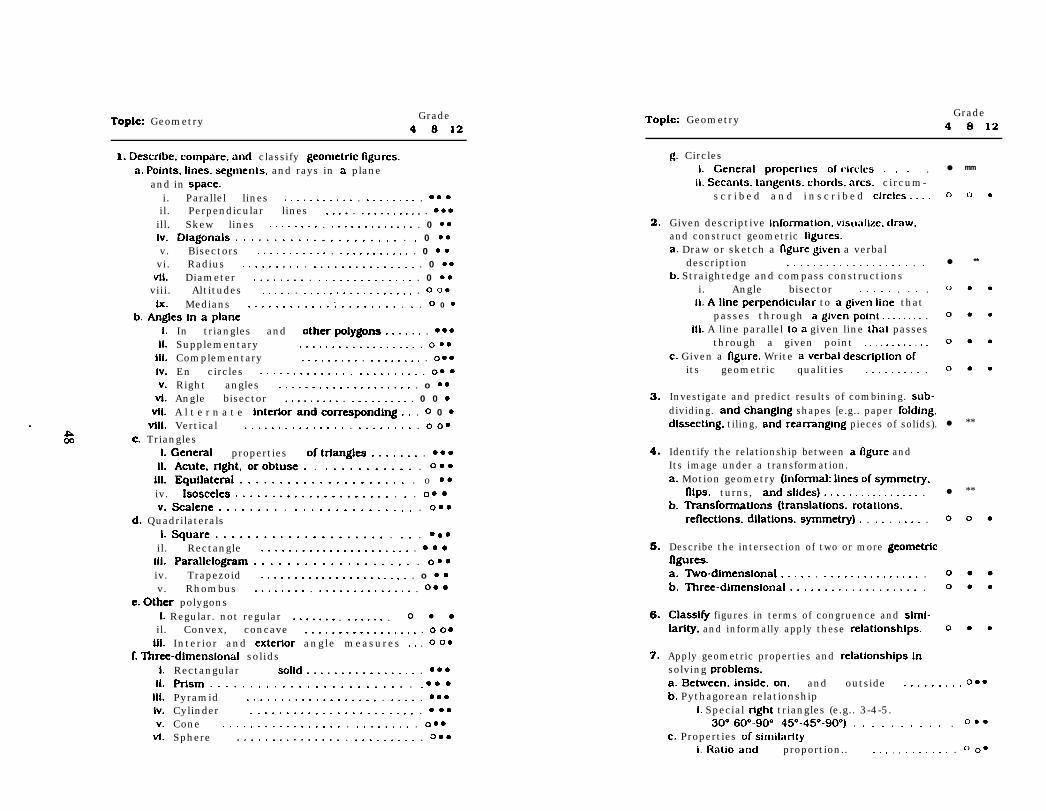
Topic: Geometry Grade4812
1. Describe. compare. and classify geometric Ilgurcs.a. Points. lines. segments. and rays in a plane
and in space.i. Parallel lines . . . . . . . . . . . . . . . . . . . . . ● ● .il. Perpendicular lines . . . . . . . . . . . . . . . . ● ● ●
ill. Skew lines . . . . . . . . . . . . . . . . . . . . . . . 0 ● ●
iv.Diagonals . . . . . . . . . . . . . . . . . . . . . . . 0 ● ●
v. Bisectors . . . . . . . . . . . . . . . . . . . . . . . . 0 ● .vi. Radius . . . . . . . . . . . . . . . . . . . . . . . . . . 0 ● ●
vti. Diameter . . . . . . . . . . . . . . . . . . . . . . . . 0 ● ●
viii. Altitudes . . . . . . . . . . . . . . . . . . . . . . . . 0 0 ●
tx. Medians . ., . . . . . . . . . . . . . . . . . . . . . 0 0 ●
b. Angles ln a plane1.
ii.iii.iv.v.
vi.vii.
Vtil.
In triangles and otherprdygons . . . . . . . . ● ●
Supplementary . . . . . . . . . . . . . . . . . . . 0 . ●
Complementary . . . . . . . . . . . . . . . . . . . 0 ● ●
En circles . . . . . . . . . . . . . . . . . . . . . . . . 0 ● cRight angles . . . . . . . . . . . . . . . . . . . . . o ● ●
Angle bisector . . . . . . . . . . . . . . . . . . . . 0 0 .A l t e r n a t e intertor andcomesponding . . . 0 0 ●
Vertical . . . . . . . . . . . . . . . . . . . . . . . . . 0 0 ●
c. Triangles1. Generai properties oftrtangles . . . . . . . . ● ● ●
iLAcute, rtght, orobtuse. . . . . . . . . . . . . . 0 ● ●
ill.Equilateral . . . . . . . . . . . . . . . . . . . . . . o ● ●
iv. lsosceles . . . . . . . . . . . . . . . . . . . . . . . . 0 ● Qv. scalene . . . . . . . . . . . . . . . . . . . . . . . . . 0 ● ●
d. Quadrilateralsi. square . . . . . . . . . . . . . . . . . . . . . . . . . ● ● ●
il. Rectangle . . . . . . . . . . . . . . . . . . . . . . . ● . .iii.Parallelogram . . . . . . . . . . . . . . . . . . . . o ● ●
iv. Trapezoid . . . . . . . . . . . . . . . . . . . . . . . o . .v. Rhombus . . . . . . . . . . . . . . . . . . . . . . . . 0 ● .
e. Other polygons1. Regular. not regular . . . . . . . . . . . . . . . O**il. Convex, concave . . . . . . . . . . . . . . . . . . 0 0 ●
iii. Interior and extertor angle measures . . . 0 0 ●
f. ‘lliree-dimensional solids1.
Ii.iii.iv.v.
vi.
Rectangular solld . . . . . . . . . . . . . . . . . ● ● ●
Prtsm . . . . . . . . . . . . . . . . . . . . . . . . . . ● ● .Pyramid . . . . . . . . . . . . . . . . . . . . . . . . . ● ● ●
Cylinder . . . . . . . . . . . . . . . . . . . . . . . . ● . ●
Cone . . . . . . . . . . . . . . . . . . . . . . . . . . . 0 ● ●
Sphere . . . . . . . . . . . . . . . . . . . . . . . . . . CI ● ●
Topic: GeometryGrade
4812
2<
3.
4.
6.
6.
7.
g. Circles1. General properties ofcirclcs . . . .
ii. Secants. tangenis. chords. arcs. circum-scribed and inscribed circics . . . .
Given descriptive information. visuillize. draw,and construct geometric figures.a. Draw or sketch a figure given a verbal
description . . . . . . . . . . . . . . . . . . . . .b. Straightedge and compass constructions
i. Angle bisector . . . . . . . . .Il. Alineperpendlcular to agiven Iine that
passes through agivenpoini . . . . . . . . .iii. A line parallel toa given line lhat passes
through a given point . . . . . . . . . . . .c. Given a figure. Write averbal descrtptiono(
its geometric qualities . . . . . . . . . .
Investigate and predict results of combining. sub-dividing. andchanging shapes [e.g.. paper foiding.dissecting. tiling, andrearranglng pieces of solids).
Identify the relationship between afigure andIts image under a transformation.a. Motion geometry (lnfonmd: Ilnes ofsymmetry.
Ilips. turns, andslldes) . . . . . . . . . . . . . . . . .b. lYa.nsforrn@lons (translations. rotations.
reflections. dilations, symmetry) . . . . . . . . . .
Describe the intersection of two or more geometrtcfigures.a.~o-dimensional . . . . . . . . . . . . . . . . . . . . . .b.llwee-dimensional . . . . . . . . . . . . . . . . . . . .
Classi& figures in terms of congruence and slmi-Iartty. and informally apply these relationships.
Apply geometric properties and relationshipsinsolving problems.
● mm
000
● **
000
O**
00=
00=
● **
● **
000
O*9O**
O**
a. Between. inside, on. and outside . . . . . . . . . 0 ● ●
b. Pythagorean relationshipL Special rtght triangles (e.g.. 3-4-5.
30°600-900 45°-450-900) . . . . . . . . . . . 0 ● ●
c. Properties ofsimiiarityi. Ratio and proportion.. . . . . . . . . . . . . . ~ 0 ●
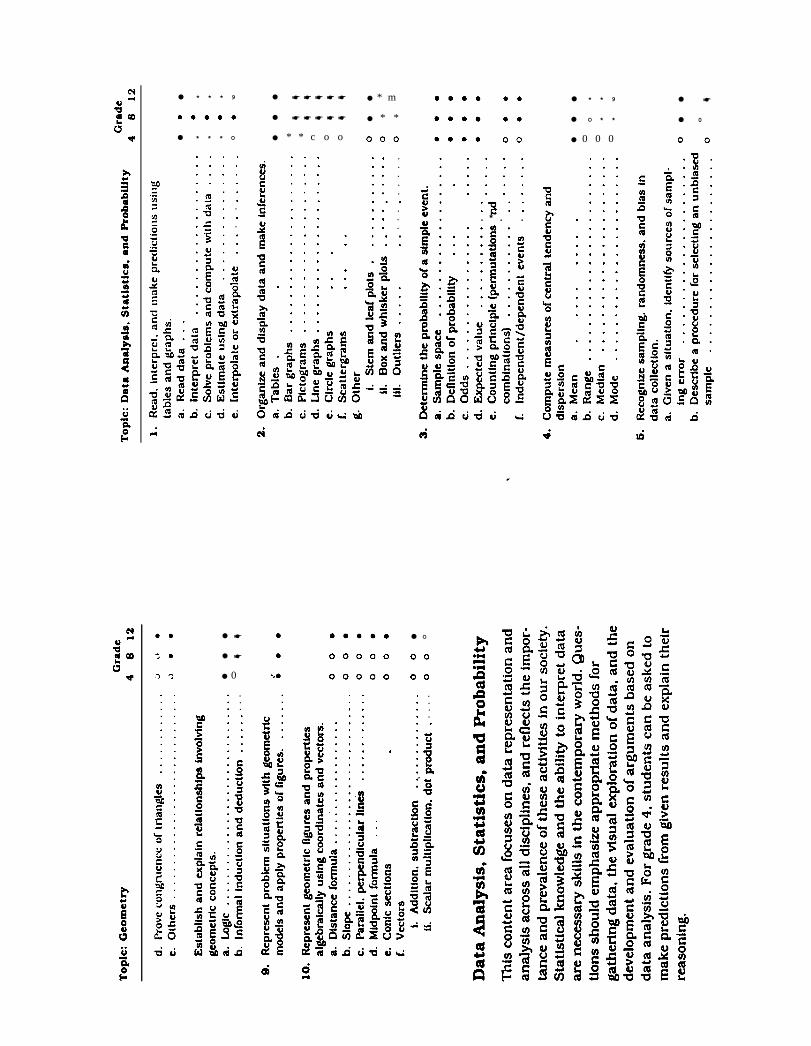
● * * * 9
9****
● * * * O
● ☛ ☛ ☛ ☛ ☛
● ☛ ☛ ☛ ☛ ☛
● * * c o o
● * m
● * *
000. . .. . .. . .. . .. . .,.,. . .. . .. . ..,,,..
● * * 9
● O * *
● 0 0 0
● ☛
● 0
00.,, .. . . .. . . .. . . .
.
. . .
.,.
. . .,... . .,... . .. . .. . ..,.. . .. . .. . .. . .. . .. . .. . .. . .. . .. . .
.
.
.
.
.
.
.
.
. . . .
. . . .
. . . .
. . . .
. . . .“u””*C... * . .
. . .
. . .
. . .
. . .
. . .
. . .
. . .
. . .
. . .
. . .
. . .
. . .
. . .
. . .
. . .
. . .
. . .
. . .
. . .
. . .
. . .
. . .
. . .
. .
.
.
.
.
.
.
.
.
.
.
.
.
.
.
:(TI::.=. .out..s. .:s::
Ci
● ☛
● ☛
● 0
. .
. .
. .
4****
00000
00000
● O
00
00
. .
. .
. .
. .
.,:*
:;.nl.’ -.0=
. .. .. ..,.,. ..,. .. .. .. .. .. .
.
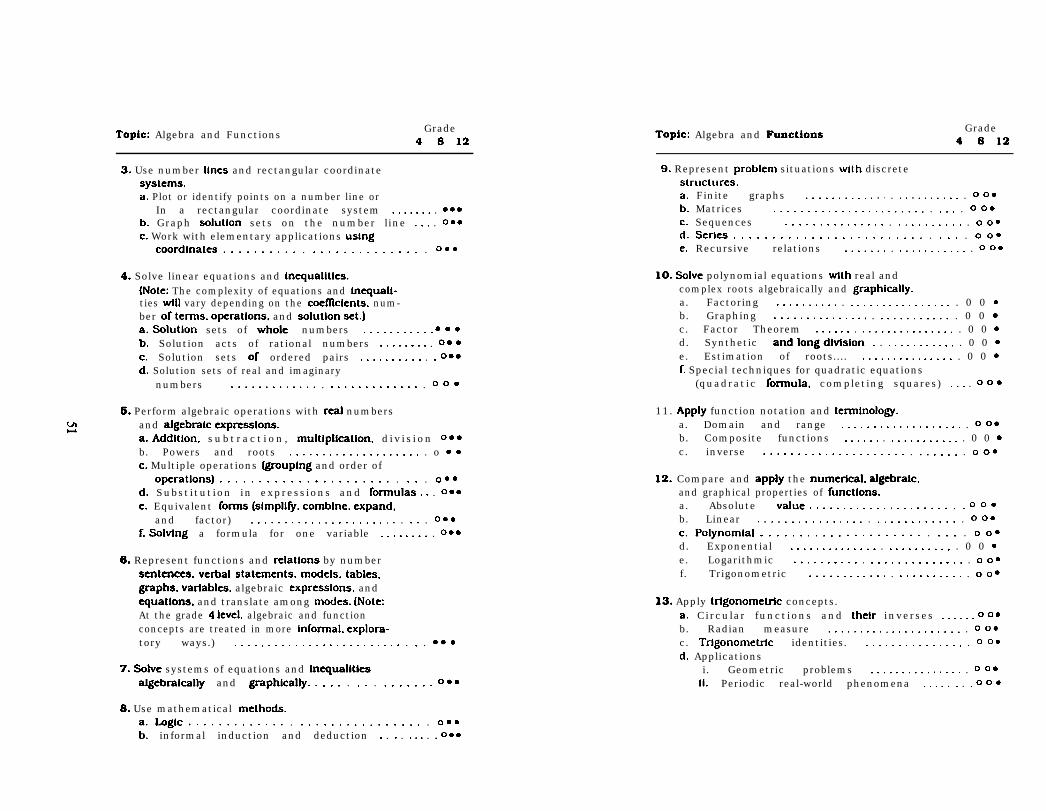
Topic: Algebra and FunctionsGrade
4812
3. Use number Ilnes and rectangular coordinatesystems.a. Plot or identify points on a number line or
In a rectangular coordinate system . . . . . . . . ● ● ●
b. Graph solutlon sets on the number line . . . . 0 ● ●
c. Work with elementary applications usingcoordlnatea . . . . . . . . . . . . . . . . . . . . . . . . . . 0 ● ●
4. Solve linear equations and Inquailties.(Note: The complexity of equations and inequali-ties wtil vary depending on the coefllcients. num-ber of terms. operations. and soiutlon set.)a. Soiution sets of whoie numbers . . . . . . . . . . . ● . .b. Solution acts of rational numbers . . . . . . . . . 0 ● .c. Solution sets of ordered pairs . . . . . . . . . . . . 0 ● ●
d. Solution sets of real and imaginarynumbers . . . . . . . . . . . . . . . . . . . . . . . . . . . . 0 0 .
6. Perform algebraic operations with reai numbersand aigebraic expressions.a. Addition. subtraction, multiplication. division o ● ●
b. Powers and roots . . . . . . . . . . . . . . . . . . . . . o ● .c. Multiple operations (grouping and order of
operations) . . . . . . . . . . . . . . . . . . . . . . . . . . 0 ● ●
d. Substitution in expressions and formuias . . . 0 ● ●
e. Equivalent forms (simplify, combine. expand.and factor) . . . . . . . . . . . . . . . . . . . . . . . . . . 0 ● ●
f. Soivtng a formula for one variable . . . . . . . . . 0 ● ●
6. Represent functions and rciations by numbersentences, verbai statements. models, tabies.graphs, variables. algebraic expressions. andquations, and translate among modes. (Note:At the grade 4 icvel, algebraic and functionconcepts are treated in more tnformal. explora-tory ways.) . . . . . . . . . . . . . . . . . . . . . . . . . . . . ● ● .
7. Soive systems of equations and inquaiitiesaigebraicaiiy and graphically. . . . . . . . . . . . . . . . 0 ● ●
Topic: Algebra and IhmctionsGrade
4812
9. Represent problem situations wilh discretestructures.
::c.d.e.
Finite graphs . . . . . . . . . . . . . . . . . . . . . . . . . 0 0 ●
Matrices . . . . . . . . . . . . . . . . . . . . . . . . . . . . 0 0 ●
Sequences . . . . . . . . . . . . . . . . . . . . . . . . . . . 0 0 ●
Sertes . . . . . . . . . . . . . . . . . . . . . . . . . . . . . . 0 0 ●
Recursive relations . . . . . . . . . . . . . . . . . . . . 0 0 ●
10. Soive polynomial equations wtth real andcomplex roots algebraically and graphically.a. Factoring . . . . . . . . . . . . . . . . . . . . . . . . . . . . 0 0 ●
b. Graphing . . . . . . . . . . . . . . . . . . . . . . . . . . . . 0 0 ●
c. Factor Theorem . . . . . . . . . . . . . . . . . . . . . . . 0 0 ●
d. Synthetic andlongdivlsion. . . . . . . . . . . . . . 0 0 ●
e. Estimation of roots.... . . . . . . . . . . . . . . . . 0 0 ●
f. Special techniques for quadratic equations(quadratic formuia. completing squares) . . . . 0 0 .
11. Appiy function notation and terminology.a. Domain and range . . . . . . . . . . . . . . . . . . . . o 0 ●
b. Composite functions . . . . . . . . . . . . . . . . . . . 0 0 ●
c. inverse . . . . . . . . . . . . . . . . . . . . . . . . . . . . . 0 0 ●
12. Compare and appiy the numertcai, aigebraic,and graphical properties of functions.a. Absolute vaiue . . . . . . . . . . . . . . . . . . . . . . . 0 0 Qb. Linear . . . . . . . . . . . . . . . . . . . . . . . . . . . . . . 0 0 ●
c.Polynomial . . . . . . . . . . . . . . . . . . . . . . . . . . 0 0 ●
d. Exponential . . . . . . . . . . . . . . . . . . . . . . . . . . 0 0 .e. Logarithmic . . . . . . . . . . . . . . . . . . . . . . . . . . 0 0 ●
f. Trigonometric . . . . . . . . . . . . . . . . . . . . . . . . 0 0 ●
13. Apply trtgonometrtc concepts.a. Circular functions and thetr inverses . . . . . . 0 0 ●
b. Radian measure . . . . . . . . . . . . . . . . . . . . . . o 0 ●
c. Trtgonometrtc identities. . . . . . . . . . . . . . . . . 0 0 ●
d. Applicationsi. Geometric problems . . . . . . . . . . . . . . . . 0 0 ●
ii. Periodic real-world phenomena . . . . . . . . 0 0 .
8. Use mathematical methods.a.imgic . . . . . . . . . . . . . . . . . . . . . . . . . . . . . . . 0 ● ●
b. informal induction and deduction . . . . . . . . . 0 ● ●
Appendix B:
Mathematical Abilities for the
1992 NAEP Mathematics Assessment
Taken from:
National Assessment of Educational Progress. (1988). Mathematics objectives:1990 assessment. Princeton, NJ: Educational Testing Sewice.
Note: These ability definitions were also used in the 1992 assessment.
53
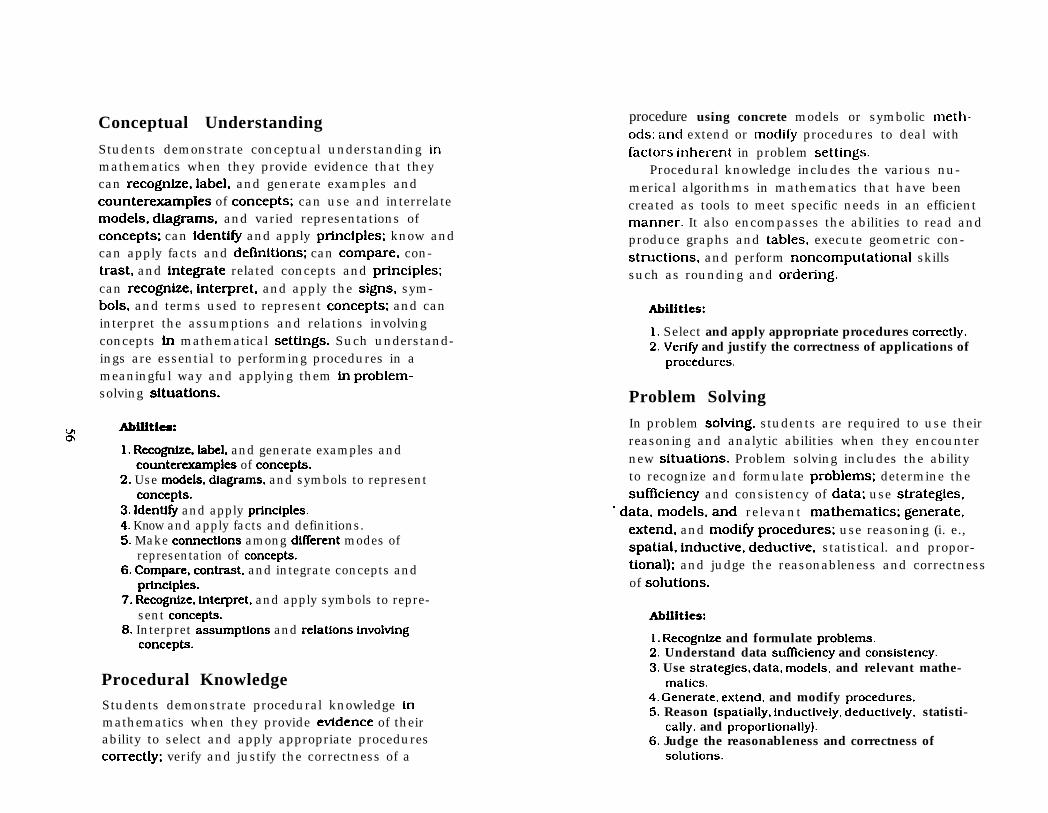
u!a
Conceptual Understanding
Students demonstrate conceptual understanding inmathematics when they provide evidence that theycan recogntze. label, and generate examples andcounterexamples of concepts; can use and interrelatemodels. diagrams, and varied representations ofconcepts; can Identi& and apply principles; know andcan apply facts and definitions; can compare, con-trast, and integrate related concepts and principles;can recognize, interpret, and apply the signs, sym-bols, and terms used to represent concepts; and caninterpret the assumptions and relations involvingconcepts tn mathematical settings. Such understand-ings are essential to performing procedures in ameaningful way and applying them tn problem-solving situations.
Abilities:
1. Recogntze, label. and generate examples andcounterexamples of concepts.
2. Use models, diagrams, and symbols to representconcepts.
3. Identt& and apply principles.4. Know and apply facts and definitions.5. Make connecUons among dffferent modes of
representation of concepts.6. Compare, contrast, and integrate concepts and
principles.7. Recognize, Interpret, and apply symbols to repre-
sent concepts.8. Interpret assumpUons and relaUons involvtng
concepts.
Procedural KnowledgeStudents demonstrate procedural knowledge inmathematics when they provide evtdence of theirability to select and apply appropriate procedurescorrectly; verify and justify the correctness of a
procedure using concrete models or symbolic meth-ods; and extend or modify procedures to deal withfaclors inherent in problem settings.
Procedural knowledge includes the various nu-merical algorithms in mathematics that have beencreated as tools to meet specific needs in an efficientmanner. It also encompasses the abilities to read andproduce graphs and tables, execute geometric con-structions, and perform noncomputational skillssuch as rounding and ordering.
Abilities:
1. Select and apply appropriate procedures correctly.2. Vertfy and justify the correctness of applications of
procedures.
Problem Solving
In problem solving, students are required to use theirreasoning and analytic abilities when they encounternew situations. Problem solving includes the abilityto recognize and formulate problems; determine thesuf’flciency and consistency of data; use strategies,
- data. models, and relevant mathematics; generate,extend, and modi~ procedures; use reasoning (i. e.,spatial. inductive, deductive, statistical. and propor-tional); and judge the reasonableness and correctnessof solutions.
Abilities:
1. RecognLze and formulate problems.2. Understand data sufllciency and consistency.3. Use strategies, data, models, and relevant mathe-
matics.4. Generate. extend, and modify procedures,5. Reason (spatially, inductively, deductively, statisti-
cally, and proportionally).6. Judge the reasonableness and correctness of
solutions.
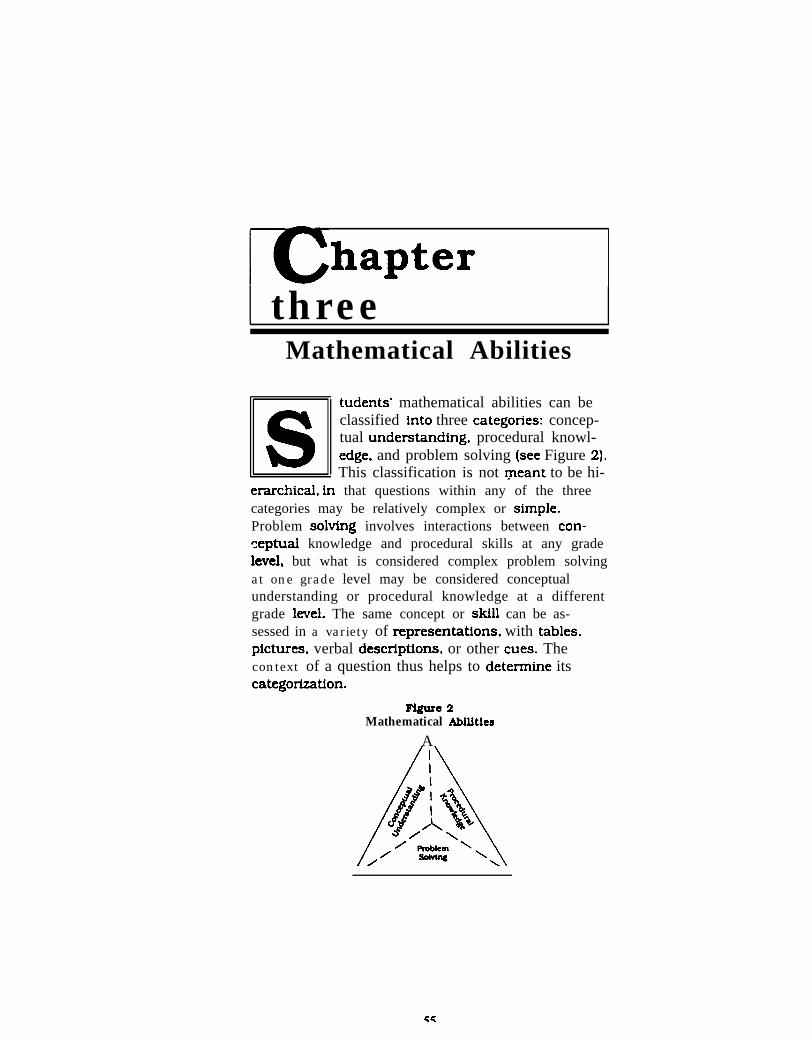
hapterthree
Mathematical Abilities
s tudents’ mathematical abilities can beclassified into three categories: concep-tual understanding, procedural knowl-edge, and problem solving (see Figure 2).This classification is not meant to be hi-
erarchical, in that questions within any of the threecategories may be relatively complex or simple.Problem solvlng involves interactions between con-ceptual knowledge and procedural skills at any gradelevel, but what is considered complex problem solvingat one grade level may be considered conceptualunderstanding or procedural knowledge at a differentgrade level. The same concept or skill can be as-sessed in a variety of representations, with tables.pictures. verbal descriptions, or other cues. Thecontext of a question thus helps to determine itscategorization.
Figure 2Mathematical AhllIties
A
55
Appendix C:
Framework for the Japanese
Essential Mathematics Assessment
Taken from:
National Institute of Educational Research. (1992). Special Study on “EssentialSkills” Statistical Report No. 1:1990 data. (Translated by Takahira, S.). Tokyo,Japan: Japanese National Institute of Educational Research.
57
The following materials provide NIER’s (1992) translation of the Japanese National Institute ofEducational Research framework for the essential mathematics assessment.
The First Dimension: Behavior Types.
It is a general misinterpretation that the acquisition of mathematical knowledge and skills are [sic] themost important objectives [sic] of education, and that mathematical ways of thinking or creative thinking areat levels somewhat higher than the essential mathematical achievement level. Rather, in the present study,we emphasize the importance of both acquisition of knowledge and skills and the acquisition of mathematicalways of thinking. In order to make this point clear, we looked at the behavioral components of the purposeof education and identified five behavior types.
A) Knowledge:
Knowledge is the contents of memory wherein one is able to understand meaning and is able toadapt and apply those meanings as they are needed. Examples include declarative knowledge(symbols and terms), procedural knowledge (how to do things) and so on.
B) Understanding:
Understanding is a state of mind in which one is able to see underlying relationships amongvariables, such as the relationships between a part and a whole, or subordinate relationshipsbetween variables. For example, one understands meanings, concepts, principles, and laws.
C) Thoughts:
In a new problem situation, one has the ability to be able to interpret and solve new problems byusing knowledge and principles that were already known. For example, thought is the ability todiscover or interpret the characteristics of problems.
D) Skills:
Skills are the behavior styles that are formalized in order to accomplish certain goals utilizing one’sknowledge and understanding. For example, there are computational skills and drawing skills.
E) Attitudes:
Attitudes are the tendencies to think and to view things. Also, attitude has emotional and cognitiveaspects that direct a person’s own behavior (e.g. tendency to view things uniform ly) . . . .
The Second Dimension: Contents of Mathematics
In order to be consistent with the entire school system (from elementary school to high school),mathematical content for essential mathematical achievement was divided into three types: numerical content,geometrical content, and relational content. The details of each content follow.
P) Numerical content:
number, computation, formulas, and algebra
Q) Geometrical content:
figure, figure and measurement, analytical geometry, and trigonometric ratio
R) Relational content:
set, measurement, ratio and proportion, function, probability, and statistics
59
The Third Dimension: Mathematical Processes
In mathematics classes, the materials for mathematical learning are often limited to artificial logicalcontent which is not practical and totally separated from the students’ everyday i ives. On the other hand, it isknown that understanding the importance of applicability of mathematics to real life more effectively improvesthe mathematical activity of students. We emphasized not only the static aspect of mathematical activity butalso the dynamic aspect (processes) of mathematical activity. The mathematical processes are divided intothree areas: mathematicalization, mathematical transaction, and mathematical verification.
X) Mathematicalization:
mathematicalization is the process in which a phenomenon is translated into mathematicalstructures (e.g. designing hypotheses, designing functions, expressing phenomena by symbols, andapplying mathematical expressions to real-life situations)
Y) Mathematical transaction:
mathematical transaction is the process in which a mathematical operation is carried out based ona mathematical structure. (e.g. carrying out calculation and operation, logical inference, andselection of an axiom)
Z) Mathematical verification:
Mathematical verification is the process which confirms whether or not the mathematical operationwas right. (e.g. confirmation of results of computations, solutions, and data)
There are two processes within each of these three processes. The first process in mathematical izationis to mathematicalize the phenomenon in real life. The second process is the process that modifies the problemin order to make it easier to solve it.
The first process in mathematical transaction is the process in which each computation is carried outand propositions are proven. Generally, almost all mathematics classes are spent on this activity. The secondsituation in mathematical transaction is the process in which the propositions are being synthesized intomathematical theory and systematized.
The first process of the mathematical verification is the process which confirms whether or not the resultsof the mathematical transaction fits [sic] into a real life situation. The second process is the process whichverifies whether or not the process of mathematical operation is right. The confirmation of whether or not theresu its or proof processes are right is an example of the second process (pp. 12-14).
60