Embed Size (px)
Citation preview

ESSENTIALMEDIA.COM.AU
The Essential Report 18 December 2018

ESSENTIALMEDIA.COM.AU
Page 2 / 20
The Essential Report
Date: 18/12/2018
Prepared By: Essential Research
Data Supplied by:
Our researchers are members of the Australian Market and Social Research Society.

ESSENTIALMEDIA.COM.AU
Page 3 / 20
About this poll This report summarises the results of a weekly omnibus conducted by Essential Research with data provided by Your Source. The survey was conducted online from 13th to 16th December 2018 and is based on 1,026 respondents.
Aside from the standard question on voting intention, this week’s report includes questions on perceptions of this year and last year, attributes of party leaders, an early election and Christmas. The methodology used to carry out this research is described in the appendix on page 20. Note that due to rounding, not all tables necessarily total 100% and subtotals may also vary.
ESSENTIALMEDIA.COM.AU
Page 4 / 20
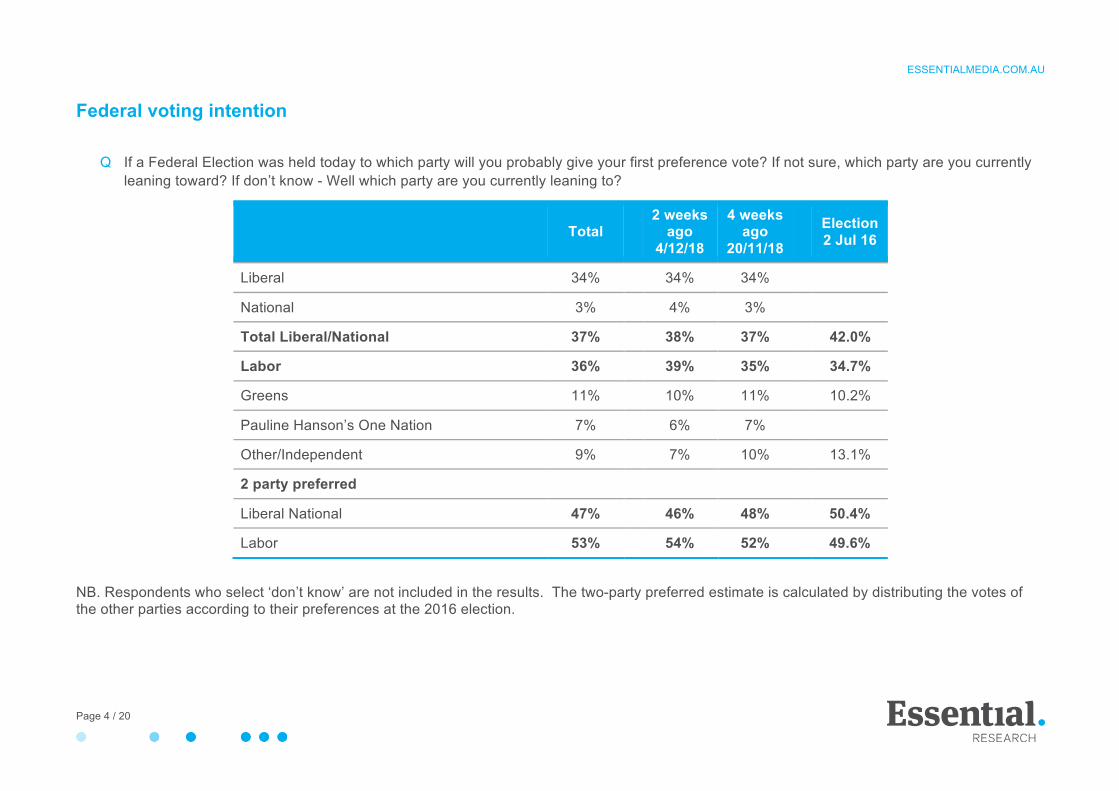
Federal voting intention
Q If a Federal Election was held today to which party will you probably give your first preference vote? If not sure, which party are you currently leaning toward? If don’t know - Well which party are you currently leaning to?
Q Total 2 weeks
ago 4/12/18
4 weeks ago
20/11/18 Election
2 Jul 16
Liberal 34% 34% 34%
National 3% 4% 3%
Total Liberal/National 37% 38% 37% 42.0%
Labor 36% 39% 35% 34.7%
Greens 11% 10% 11% 10.2%
Pauline Hanson’s One Nation 7% 6% 7%
Other/Independent 9% 7% 10% 13.1%
2 party preferred
Liberal National 47% 46% 48% 50.4%
Labor 53% 54% 52% 49.6%
NB. Respondents who select ‘don’t know’ are not included in the results. The two-party preferred estimate is calculated by distributing the votes of the other parties according to their preferences at the 2016 election.

ESSENTIALMEDIA.COM.AU
Page 5 / 20
Last 12 months
Q Thinking about the last 12 months, has it been a good or bad year for each of the following?
Total good
Total bad NET
Very good
Good Neither good
nor bad
Bad Very bad
Don’t know 2017
NET
The Australian economy 32% 26% +6 6% 26% 36% 21% 5% 6% +11
Australian politics in general 15% 65% -50 3% 12% 16% 32% 33% 4% -36
The Australian Government 16% 57% -41 4% 12% 22% 30% 27% 5% na
Large companies and corporations 31% 22% +9 6% 25% 37% 16% 6% 11% +22
Small business 29% 23% +6 4% 25% 39% 18% 5% 9% -2
Trade unions 21% 23% -2 3% 18% 39% 14% 9% 17% -7
The average Australian 28% 29% -1 4% 24% 37% 23% 6% 6% -6
Your personal financial situation 30% 30% - 5% 25% 36% 18% 12% 4% +1
Your workplace (workers) 46% 18% +28 9% 37% 32% 12% 6% 4% +34
You and your family overall 46% 18% +28 11% 35% 33% 13% 5% 3% +27
The planet 19% 38% -19 4% 15% 38% 27% 11% 6% -22
The Australian cricket team 30% 28% +2 5% 25% 33% 21% 7% 10% na

ESSENTIALMEDIA.COM.AU
Page 6 / 20
Respondents believed that 2018 has been a relatively good year for your workplace (+28) and you and your family overall (+28). It was considered a particularly bad year for Australian politics in general (-50) and the Australian Government (-41).
Relative to 2017 (as measured in December last year), this year was considered somewhat worse in terms of – Australian politics in general (down 14) and large companies (down 13). However, it was considered a little better for small business (up 8).

ESSENTIALMEDIA.COM.AU
Page 7 / 20
Expectations for 2019
Q Thinking about the next 12 months, do you think 2019 will be a good or bad year for each of the following?
Total good
Total bad NET
Very good
Good Neither good nor bad
Bad Very bad
Don’t know 2017
NET
The Australian economy 30% 28% +2 5% 25% 33% 21% 7% 10% +12
Australian politics in general 20% 41% -21 5% 15% 29% 26% 15% 11% -21
The Australian Government 18% 46% -28 3% 15% 25% 29% 17% 12% na
Large companies and corporations 30% 19% +11 6% 24% 37% 15% 4% 14% +27
Small business 32% 18% +14 4% 28% 36% 14% 4% 13% +5
Trade unions 23% 20% +3 5% 18% 39% 13% 7% 20% -2
The average Australian 32% 22% +10 5% 27% 37% 17% 5% 10% +2
Your personal financial situation 36% 23% +13 6% 30% 34% 15% 8% 7% +12
Your workplace (workers) 47% 15% +32 11% 36% 31% 11% 4% 7% +37
You and your family overall 48% 14% +34 11% 37% 31% 10% 4% 8% +31
The planet 25% 33% -8 5% 20% 32% 22% 11% 10% -15
The Australian cricket team 20% 24% -4 4% 16% 31% 16% 8% 25% na

ESSENTIALMEDIA.COM.AU
Page 8 / 20
Overall, there was a very positive outlook for your workplace (+37) and you and your family overall (+31). Expectations were also quite positive for large companies (+11), small business (+14), the average Australian (+10) and personal financial situation (+13).
Compared to last year, respondents were less optimistic about the economy and large companies but more optimistic about small business and the average Australian.

ESSENTIALMEDIA.COM.AU
Page 9 / 20
Early election
Q Do you think the Coalition Government should run its full term until around May 2019 when the next Federal election is due or do you think they should call an early election?
Total Vote Labor
Vote LNP
Vote Greens
Vote other
Should run full term 52% 40% 78% 30% 57%
Should call an early election 27% 43% 12% 45% 27%
Don’t know 21% 17% 11% 26% 15%
About half think the Government should run its full term while 27% think they should call an early election. 76% of LNP voters think they should serve the full term while Labor voters are split with 43% favouring an early election and 40% wanting the Government to run its full term.

ESSENTIALMEDIA.COM.AU
Page 10 / 20
Party expect to win next election
Q Which party do you think will win the next Federal election?
Total Vote Labor
Vote LNP
Vote Greens
Vote other
The Labor Party 52% 89% 30% 57% 40%
The Liberal National coalition 21% 1% 53% 6% 19%
Don’t know 27% 9% 17% 37% 41%
About half think that the Labor Party will win the next Federal election and 21% think the coalition will win. 89% of Labor voters think Labor will win compared to 53% of LNP voters who think the coalition will win.

ESSENTIALMEDIA.COM.AU
Page 11 / 20
Attributes of Scott Morrison Q Which of the following describe your opinion of the Prime Minister, Scott Morrison?
Total Sep 2018 Change
Intelligent 61% 66% -5
Hard-working 60% 60% -
Out of touch with ordinary people 54% 51% +3
A capable leader 49% 54% -5
Understands the problems facing Australia 46% 51% -5
Narrow-minded 46% 41% +5
Superficial 45% 43% +2
Arrogant 43% 38% +5
Good in a crisis 41% 44% -3
Trustworthy 39% 41% -2
More honest than most politicians 39% 38% +1
Visionary 38% 39% -1
Intolerant 37% 36% +1
Erratic 36% 29% +7
Aggressive 34% 34% -
ESSENTIALMEDIA.COM.AU
Page 12 / 20
Scott Morrison’s key attributes were intelligent (61%, down 5% since September), hard working (60%, no change), out of touch with ordinary people (54%, up 3%) and a capable leader (49%, down 5%).
Main changes since September are for erratic (up 7%), intelligent, a capable leader, understands the problems facing Australia (all down 5%) and narrow-minded and arrogant (both up 5%).

ESSENTIALMEDIA.COM.AU
Page 13 / 20
Leader attributes – Bill Shorten Q Which of the following describe your opinion of the Opposition Leader, Bill Shorten?
Total Sep 2018 Change
Hard working 57% 58% -1
Intelligent 56% 55% +1
Out of touch with ordinary people 50% 50% -
Superficial 47% 50% -3
Arrogant 46% 50% -4
Understands the problems facing Australia 45% 48% -3
Narrow-minded 44% 44% -
A capable leader 43% 43% -
Erratic 40% 41% -1
Intolerant 39% 39% -
Aggressive 37% 38% -1
Good in a crisis 36% 39% -3
Trustworthy 34% 33% +1
Visionary 32% 34% -2
More honest than most politicians 31% 29% +2

ESSENTIALMEDIA.COM.AU
Page 14 / 20
Bill Shorten’s key attributes were hard working (57%, down 1% since September), intelligent (56%, up 1%), out of touch with ordinary people (50%, no change), superficial (47%, down 3%) and arrogant (46%, down 4%).
The main change since September have been for arrogant (down 4%).

ESSENTIALMEDIA.COM.AU
Page 15 / 20
Leader attributes – comparisons
Scott Morrison
Bill Shorten
Difference
More honest than most politicians 39% 31% +8
A capable leader 49% 43% +6
Visionary 38% 32% +6
Intelligent 61% 56% +5
Trustworthy 39% 34% +5
Good in a crisis 41% 36% +5
Out of touch with ordinary people 54% 50% +4
Hard-working 60% 57% +3
Narrow-minded 46% 44% +2
Understands the problems facing Australia 46% 45% +1
Intolerant 37% 39% -2
Superficial 45% 47% -2
Aggressive 34% 37% -3
Arrogant 43% 46% -3
Erratic 36% 40% -4

ESSENTIALMEDIA.COM.AU
Page 16 / 20
Compared to Bill Shorten, Scott Morrison is more likely to be considered more honest than most politicians (+8), a capable leader (+6) and visionary (+6).
Bill Shorten is a little more likely to be considered erratic (+4), arrogant (+3) and superficial (+3). However, on most attributes the gap between the two leaders has narrowed since these questions were last asked in September.

ESSENTIALMEDIA.COM.AU
Page 17 / 20
Feelings about Christmas
Q Which of the following best describes how you feel about Christmas?
Total Vote Labor
Vote Lib/Nat
Vote Greens
Vote other
Men Women Aged 18-34
Aged 35-54
Aged 55+
2015 2016
I enjoy Christmas a lot 41% 43% 45% 36% 35% 35% 46% 48% 44% 31% 36% 34%
I enjoy some things about Christmas 39% 35% 41% 45% 42% 42% 35% 37% 35% 45% 44% 46%
I don’t enjoy Christmas at all 6% 8% 3% 8% 7% 6% 6% 6% 7% 5% 6% 7%
I don’t really care one way or the other about Christmas 13% 13% 10% 10% 15% 15% 11% 8% 12% 18% 12% 11%
Don’t know 2% 1% 2% 1% 1% 2% 1% 1% 3% 1% 1% 2%
41% say they enjoy Christmas a lot and 39% enjoy some things about Christmas. These results represent more enjoyment of Christmas to when this question was asked 12 months ago.
Women were more likely to say they enjoy it a lot (46%) as were younger respondents (48% of aged 18-34).
37% of those on incomes under $1,000 pw say they enjoy it a lot compared to 49% of those earning over $2,000 pw.
54% of those with children say they enjoy it a lot compared to 34% of those without children.

ESSENTIALMEDIA.COM.AU
Page 18 / 20
Christmas activities
Q Which of the following things will you be doing this Christmas?
Total Vote Labor
Vote Lib/Nat
Vote Greens
Vote other
Men Women Aged 18-34
Aged 35-54
Aged 55+
Hosting or attending a Christmas lunch 62% 62% 67% 68% 61% 59% 66% 66% 59% 63%
Putting up Christmas decorations or tree at your home 61% 60% 67% 65% 57% 55% 66% 64% 61% 58%
Sending Christmas cards by post 43% 39% 48% 29% 53% 39% 46% 36% 38% 54%
Attending a work Christmas function 36% 35% 38% 43% 32% 36% 36% 46% 42% 18%
Donating to a charity 36% 35% 39% 43% 35% 33% 38% 41% 32% 34%
Hanging out stockings on Christmas Eve 29% 29% 33% 36% 22% 27% 32% 40% 33% 15%
Attending church 27% 26% 32% 22% 24% 27% 26% 35% 23% 21%
Participating in secret Santa (Kris Kringle) at work 25% 28% 28% 30% 21% 25% 26% 39% 28% 8%
62% say they will be hosting or attending a Christmas lunch and 61% say they put up Christmas decorations. 43% send out Christmas cards but just 27% will be attending church. Women were more likely to put up decorations and attend a Christmas lunch. Younger people were more likely to participate in most Christmas activities except for send out Christmas cards.

ESSENTIALMEDIA.COM.AU
Page 19 / 20
Spending on Christmas presents
Q Approximately how much will you spend this year on Christmas presents for friends and family?
Total Vote Labor
Vote Lib/Nat
Vote Greens
Vote other
Men Women Aged 18-34
Aged 35-54
Aged 55+
Nothing 9% 9% 6% 8% 10% 11% 7% 9% 9% 8%
Less than $100 17% 19% 15% 23% 14% 18% 17% 18% 17% 17%
$100 to $250 21% 22% 23% 18% 17% 22% 19% 28% 15% 20%
$250 to $500 21% 23% 22% 20% 22% 21% 22% 18% 23% 24%
$500 to $1000 16% 16% 16% 18% 18% 15% 18% 14% 16% 19%
More than $1000 9% 8% 12% 6% 12% 7% 11% 7% 13% 6%
Don’t know 6% 3% 6% 8% 7% 7% 6% 5% 7% 7%
Average $386 $367 $419 $350 $434 $345 $426 $346 $435 $370
On average, respondents said they were planning to spend a little less than $400 on Christmas presents. Women tended to spend more than men and those aged 35-54 spent more than the older and the younger groups.

ESSENTIALMEDIA.COM.AU
Page 20 / 20
Appendix: Methodology, margin of error and professional standards
The data gathered for this report is gathered from a fortnightly online omnibus conducted by Your Source. Essential Research has been utilizing the Your Source online panel to conduct opinion polling since November 2007. Every two weeks, the team at Essential considers issues that are topical and a series of questions are devised to put to the Australian public. Some questions are repeated regularly (such as political preference and leadership approval), while others are unique to each week and reflect current media and social issues. Your Source has a self-managed consumer online panel of over 100,000 members. The majority of panel members have been recruited using off line methodologies, effectively ruling out concerns associated with online self-selection. Your Source has validation methods in place that prevent panellist over use and ensure member authenticity. Your Source randomly selects 18+ males and females (with the aim of targeting 50/50 males/females) from its Australia wide panel. An invitation is sent out to approximately 7000 – 8000 of their panel members. The response rate varies each week, but usually delivers 1000+ interviews. In theory, with a sample of this size, there is 95 per cent certainty that the results are within 3 percentage points of what they would be if the entire population had been polled. However, this assumes random sampling, which, because of non-response and less than 100% population coverage cannot be achieved in practice. Furthermore, there are other possible sources of error in all polls including question wording and question order, interviewer bias (for telephone and face-to-face polls), response errors and weighting. The best guide to a poll’s accuracy is to look at the record of the polling company - how have they performed at previous elections or other occasions where their estimates can be compared with known population figures. In the last poll before the 2016 election, the Essential Report estimates of first preference votes averaged less than 1% difference from the election results and the two-party preferred difference was only 0.1%. The Your Source online omnibus is live from the Wednesday night and closed on the following Sunday. Incentives are offered to participants in the form of points. Essential Research uses the Statistical Package for the Social Sciences (SPSS) software to analyse the data. The data is weighted against Australian Bureau of Statistics (ABS) data. All Essential Research and senior Your Source staff hold Australian Market and Social Research Society (AMSRS) membership and are bound by professional codes of behaviour. Your Source is an Australian social and market research company specializing in recruitment, field research, data gathering and data analysis. Your Source holds Interviewer Quality Control Australia (IQCA) accreditation, Association Market and Social Research Organisations (AMSRO) membership and World Association of Opinion and Marketing Research Professionals (ESOMAR) membership.