Embed Size (px)
Citation preview

Information Services
ITwww.york.ac.uk/it-services/training
Essential AccessBook 2

Information Services
Essential Access
Book 2: Parts 5-8
ITwww.york.ac.uk/it-services

Microsoft Access is a component of Microsoft Office, available on all IT Services managed computers at the University.
This material has been written to be used with Access 2016 on a University of York PC. Every attempt has been made to ensure the accuracy of the information provided, however you may find some minor differences when working with personalised systems or other versions.
Last Updated: October 2018

~Contents~
Part 5: Database Design..................................................................................................1
1 ~ Design..............................................................................................................................21.1 - Identify tasks ............................................................................................................. 21.2 - Identifying the data structure .................................................................................... 2
1.3 - Identifying relationships ............................................................................................ 3
1.4 - Common mistakes ..................................................................................................... 41.5 - Preliminary design and testing................................................................................... 5
1.6 - Four-table solutions ................................................................................................... 5
1.7 - Construction .............................................................................................................. 7
Part 6: On Report ...............................................................................................................8
2 ~ Reports............................................................................................................................82.1 - The Report Wizard ..................................................................................................... 82.2 - Report views.............................................................................................................. 9
3 ~ Editing reports.......................................................................................................... 113.1 - Design view – no grouping ....................................................................................... 11
3.2 - Manipulating controls.............................................................................................. 12
3.3 - Design view - grouped reports ................................................................................. 133.4 - Group & Total configuration .................................................................................... 14
3.5 - Section properties.................................................................................................... 15
4 ~ Calculated fields ....................................................................................................... 164.1 - Number functions and arithmetic ............................................................................ 164.2 - Text manipulation.................................................................................................... 17
4.3 - Other expressions .................................................................................................... 17
Part 7: Forms .................................................................................................................... 18
5 ~ Access Forms.............................................................................................................. 185.1 - Form Views .............................................................................................................. 19
5.2 - The Form Wizard...................................................................................................... 19
6 ~ Editing Forms ............................................................................................................ 206.1 - Design view – single and continuous records ........................................................... 206.2 - Form and Field Properties ........................................................................................ 21

7 ~ Subforms ..................................................................................................................... 227.1 - Creating with the Wizard ......................................................................................... 227.2 - Wizard-free subforms .............................................................................................. 23
7.3 - Subform calculations................................................................................................ 23
8 ~ Look-up fields ............................................................................................................ 248.1 - Configuring a Lookup ............................................................................................... 25
9 ~ Combining and automating................................................................................. 269.1 - Action buttons ......................................................................................................... 269.2 - Combining forms, queries and reports ..................................................................... 27
Part 8: Appendix .............................................................................................................. 28
10 ~ Alternative User Views........................................................................................ 28
11 ~ Macros ....................................................................................................................... 28
12 ~ Split Front-end/Back-end .................................................................................. 30
13 ~ Compact and Repair............................................................................................. 31

Part 5: Database Design
1
Part 5: Database Design
Databases are never used simply to store information; they are always created in order to dosomething. Understanding the purpose of a database, the tasks you want to carry out, is therefore essential when considering its design.
You will generally want to ask questions of the information in the database and this will determine what you need to enter and store.
Being human-friendlyBoth the input and output involve the system interacting with people – on-screen data entry or viewing, printed output – and should be designed with this in mind.
To help make a database system more accessible to normal human beings, Access includes two types of object where the visual appearance can be controlled with far more sophistication than is possible with table and query datasheets:
Reports Once you have retrieved information using a query it can be presented on-screen or printed using a report.
Forms Whenever you need to interact with data – choose parameters for a query, enter or view data – you can use an on-screen form.
Neither of these will function correctly, however, if you don’t get the data structure right; this must be the first priority.
Store dataProcess data
input output

Essential Access Book 2
2
1 ~ DesignTake a systematic approach to design. Use pencil and paper in the early stages to help develop your ideas. Identify tasks and use this to inform data structure design.
1.1 - Identify tasksStart by asking what information you want to get out of the system; this can help identify what input will be required. Ask yourself what tasks will need to be done, and try to be as specific as you can:
I will want to be able to enter a surname and year to see modules and results for a particular student
I need to locate all students taking a particular module and enter their results
Each term I will need to export the previous term’s marks into Spreadsheet format to produce graphs for the BoS
New Student data needs adding at the start of each year – imported from an existing source rather than re-keyed
Once a month I will produce a printed list of formative assessment results, one for each module tutor
Identifying these key tasks should suggest the data you need to store – it has to be sufficient to enable you generate the required output. Bear in mind that to comply with Data Protection requirements you should not include any information that is not necessary for the purpose of your database.
1.2 - Identifying the data structureHaving identified the tasks you need to do:
1 List all the data items you think you will need.
2 Group together data items which are attributes of the same subject; these groups will become your data tables, and the attributes will be fields.
3 Identify a primary key for each group of fields. If there is no obvious choice you may need to ‘invent’ an ID or look for a composite key (a combination of fields).
Remember one important aim is to avoid duplication or repetition – data should be stored only once. Where duplication occurs this usually indicates you need to create at least one extra table. The exception is where the value in a primary key in one table is used as a foreign key in another table in order to create a link.
4 Draw out a diagram showing the tables and information content, as in this example:

Part 5: Database Design
3
By now you will be able to specify the precise fields you need in each table.
Some tips:
Always use separate fields for forename and surname (or family name) otherwise sorting in alphabetical order will be very difficult. You may also need a title field (Ms, Mr, Dr etc)
Also use multiple fields for a postal address, but create dedicated fields for Town/City and Postcode rather than generic Address 1, Address 2… This will make querying on these attributes simpler
Choose fields that will not age too quickly – use Date of Birth, which is fixed, rather than Age, which changes very day but can be calculated from Date of Birth
Never store a value that can be calculated from other data
1.3 - Identifying relationshipsMost relationships are one-to-many. If, when designing, two groups of attributes appear to exhibit a one-to-many relationship in both directions, this is a many-to-many relationship and indicates a linking table is needed. For example:
Can one student take many modules? Yes
Can one module be taken by many students? Yes
This is a many-to-many relationship and therefore the Module Choices table was needed, which exhibits one-to-many with both Students and Modules.
Referential integrityRemember to consider where it is vital to maintain the integrity of your data, ensuring values in a foreign keys always match an existing value in a primary key.
Where this is critical, decide to enforce referential integrity.
Module choices
StudentsModules
Name*
D of B
Postal address*
Email address
Student ID Module title
Module ID
DeptCredits
Student ID Module IDMark*Use multiple fields

Essential Access Book 2
4
1.4 - Common mistakesOnce you have come up with a preliminary design, examine your idea for common problems. Here are several common pitfalls to avoid:
Repeating attributesStudents choose which modules they want to take, in order of preference. The following table fields are chosen:
Student ID Choice 1 Choice 2 Choice 3 Choice 4
1079884 Module 2 Module 5 Module 1 Module 6
1086551 Module 1 Module 4 Module 2 Module 3
Why is this ‘wrong’?
This data cannot be queried very easily. In order to identify who would like to take Module 2 you must look in 4 fields. The order of preference is not recorded as data – it is only implied by the field names – and so is not discoverable by querying. What if, in the future, 5 choices were allowed? This table works for people looking at it, but not for computers.
Better Solution
Student ID Module Preference
1079884 Module 2 1
1079884 Module 5 2
1079884 Module 1 3
1079884 Module 6 4
1086551 Module 1 1
1086551 Module 4 2
1086551 Module 2 3
1086551 Module 3 4
This solution allows you to query on the basis of both module choice and preference.
Multiple values in a fieldStudents are making appointments to see a tutor following an assessment:
Student ID Appointment Tutor ID
1079884 21 Nov, 3pm, D/X/157 S2054
1086551 18 Nov, 4pm, V/W/005 S2933
Why is this ‘wrong’?
Technically, both date and time can be stored as a single value (though you may find queries simpler if you separate them), but when combined with a room number it must be a text field, and you won’t be able to work with the dates at all.

Part 5: Database Design
5
Better Solution
Student ID ApptDate ApptTime ApptRoom Tutor ID
1079884 21/11/2016 15:00 D/X/157 S2054
1086551 18/11/2016 16:00 V/W/005 S2933
This solution makes it much easier to construct queries based on date and time.
Redundant valuesThe solution above could be taken one step further and the day added as a separate field:
Student ID ApptDate ApptDay ApptTime ApptRoom Tutor ID
1079884 21/11/2016 Tuesday 15:00 D/X/157 S2054
1086551 18/11/2016 Friday 16:00 V/W/005 S2933
Why is this ‘wrong’?
If ApptDate is correctly defined as a date field, adding Day is redundant as the information is also contained in the date; the day can be displayed by formatting the output. Using a separate field also introduces the possibility of errors (as in this example – 21 November was a Monday!).
Better Solution
As previous, before adding Day field.
1.5 - Preliminary design and testingThe best way to see if your design will work is to create the tables and add some sample data. Do this anticipating it will not be the final version, but a test version to check your design. Don’t use real data or you may be tempted to keep it.
Test dataOne of the best ways to see if your design works is to add some values.
Enter both normal and extreme data in your tables. Include true values (eg the longest name you anticipate) and values that could be entered in error (eg a figure with a missing decimal point or a date of birth after the current date).
This helps establish data types and field sizes, and identify where you may need validation, default or required values.
Look for any opportunity to enter duplicate data – including possibilities such as two people having the same name or making the same choices.
Develop some example queries to see if the results are what you would expect. Try to base these around the questions you are likely to want answering. Can you extract the information you need?
1.6 - Four-table solutionsWhen testing your design it may be that you notice some duplication of data, something we try to avoid. This may arise when records in the ‘linking’ table have some degree of natural grouping.

Essential Access Book 2
6
ExampleImagine constructing a database to manage the loan of equipment at a sports club. A typical three-table solution would link items of equipment to the clients:
On entering example data, however, you will notice that when a client borrows several items,details such as the date and time borrowed and length of loan must be repeated for each item borrowed – data duplication.
An alternative solution is to use four tables:
In this approach, the Loans table would contain one record holding any data common to a group of items being borrowed (with a unique Loan ID). The Loaned items table would then include one record for each item in the group (all with the same Loan ID).
Which is best?Both solutions have advantages and disadvantages. The three-table solution requires some repetition of data, but allows for the return of items individually; the four-table solution will eliminate some duplication but would require the return of all items simultaneously.
The choice will depend on how you want to be able to use the system, rather than simply the nature of the data being stored.
Clients Equipment
Loans
Clients Equipment
Loans
Loaned items

Part 5: Database Design
7
1.7 - ConstructionHaving created a design for data structure, you can begin to build the real thing. Start a new database and begin constructing the tables and defining relationships.
This is a good time to check consistency, particularly with naming conventions. Most people develop their own systems, though there are some pointers:
Use CamelCase for compound names – spaces make things more difficult when you have to enter expressions (eg ‘Student Choices’ is better as ‘StudentChoices’)Note: if you want field labels to look sensible, set the Caption property
Begin object names with the object type – this makes it easier, for example, to distinguish between tables and queries (eg ‘tblStudents’, ‘qryStudentList’), and helps avoid using reserved words for object names (these are key words that already mean something to Access)
QueriesYou will want to ask questions of your data. Refer back to your defined tasks and construct queries for those that involve extracting data from the tables. At this stage the main thing is to make sure they produce the results you expect.
OutputHaving ensured your queries produce the correct results, you need to give some thought to how any output from the system is to be presented.
Options include:
The data sheet produced by running the query
User-friendly on-screen display
User-friendly printed pages
In Access, user-friendly on-screen display can be generated by either a report or form, though reports are primarily used for printed output.
Input and interactionTables and queries are not very user-friendly as a means to enter, edit and interact with data. Forms provide a means of working with data using familiar controls such as text boxes, check boxes, combo boxes and action buttons.
Their strength lies in being able to create a means for other users to interact with the data and carry out the necessary tasks without the need to understand anything about the underlying data tables or queries.

Essential Access Book 2
8
Part 6: On Report
2 ~ ReportsA report is a summary of data retrieved from the database, usually presented in a more user-friendly format than the simple datasheet generated by a query. Reports can group information, perform additional calculations and generate attractive printed output; they cannot be used for data entry or editing.
Reports are always based on a table or (more usually) a query, which means they are always compiled using current data and if the underlying query changes, so does the report. Some examples are shown below:
2.1 - The Report WizardThe Wizard enables a report to be constructed from simple choices. This means you can ensure only relevant data are presented in the most useful format.
The sequence for constructing a report:
Decide which fields of data are needed and identify the relevant tables
Create and save a query based on these tables, including the appropriate table fields, plus any calculated or concatenated fields if these are needed
Launch the Report Wizard by selecting Create > Reports > Report Wizard
A tabular report
A grouped report

Part 6: On Report
9
The Wizard steps will depend in part on your data so may not match exactly the sequence shown here (see also the example screen-shots below):
1 Step 1: Select the query (or table) on which the report is to be based and add the required fields to the Selected Fields list from the list of Available Fields. If you will need to group data make sure to include the relevant key fields. Select Next>
2 Step 2: You may be asked how you want to view your data. Although you can group records at this point, Access may not select the correct field. It’s often better to choose the option that does not group records at this point. Select Next>
3 Step 3: If appropriate for your data, you will be asked to define grouping levels. This step allows you to choose the correct field, usually a primary key. Select Next>
4 Step 4: At this point you can define a sort order for records. This does not affect grouping, only the records within a group. Select Next>
5 Step 5: Select the style of layout required. The options here will depend on whether or not you have defined grouping – tabular (table-style) layout is only available if no grouping is used. Select Next>
6 Final Step: Provide a report title – this will also be used as the object name, but both can be changed later to match any naming convention you are using. Select Finish to preview the report (don’t choose the modify the design until you’ve seen what it looks like)
The report will be generated based on your choices, but it is unlikely to look exactly how you want and will require further editing.
2.2 - Report viewsThere are four views available for reports:
Report The compiled and formatted report intended for on-screen viewing, but not for printing
Print Preview A preview showing how the report would appear when printed using the current settings for paper and margins; you can adjust page and paper settings and print from this view
Layout The compiled and formatted report with the ability to adjust the width, height and position of the data fields
Design Full control of the structure, content and functionality of the report is only available from the more complex Design view
When creating and editing reports you will use mostly the Design and Layout views, choosing Report and Print Preview to check the on-screen and printed views.

Essential Access Book 2
10
Try to set grouping using the grouping dialogue
First step: choosing the data source and fields
Sorting
Report title
Layout
Grouping

Part 6: On Report
11
3 ~ Editing reportsIn order to edit a report you must understand the design view. The report design is divided into sections, each corresponding to a portion of the compiled report.
3.1 - Design view – no groupingAn un-grouped report creative with the Wizard will have 5 sections, though the Report Footer may be set to zero height. The sections are:
Report Header content is shown once only at the top of the first page
Page Header content is shown at the top of every page
Detail this section displays data and is repeated for each record found in the underlying query or table
Page Footer content is shown once at the foot of every page
Report Footer content is shown once only at the end of the report, at the end of data (before the page footer)
Report controlsEvery item (‘object’) on a report is referred to as a control. Most data from the underlying query will be presented using a pair of controls:
A Text Box, containing the name of the underlying field, which will display the retrieved data – you must not edit this name
A Label containing the name of the field or the caption if one is defined – you can edit the content of the label without affecting data display
Note it is not always easy to tell which is which; use layout view to see which one contains data (this is the Text Box)

Essential Access Book 2
12
3.2 - Manipulating controlsAll controls are rectangular in shape and have a collection of properties that define size, appearance and behaviour. Many of these can be configured from the ribbon (Home > Text Formatting) and the size adjusted using the sizing handles.
If the text box and label for a field are in the same report section they can be moved together
Other control typesIf a Yes/No field is included in the underlying data, the Wizard will render this as a check box. When the intention is to print the report, this is the only other control type that is likely to be used.
A report may also include graphic elements; for example lines may be added to enhance readability or other images may be included. These are inserted ion the appropriate section via Report Design Tools > Design tab > Controls .
Default footer controlsThe Wizard automatically places two Text Box controls in the Page Footer section containing functions to display system information on printing:
=Now() Displays the current date and time
="Page " & [Page] & " of " & [Pages] Concatenation including the current page number [Page] and total number of pages [Pages]Displays in format: Page 2 of 6
Move controlRe-size control
Modify font (Home tab)
To move both controls together drag on the border of the selected control
The top left handle moves controls individually
Part 6: On Report
13
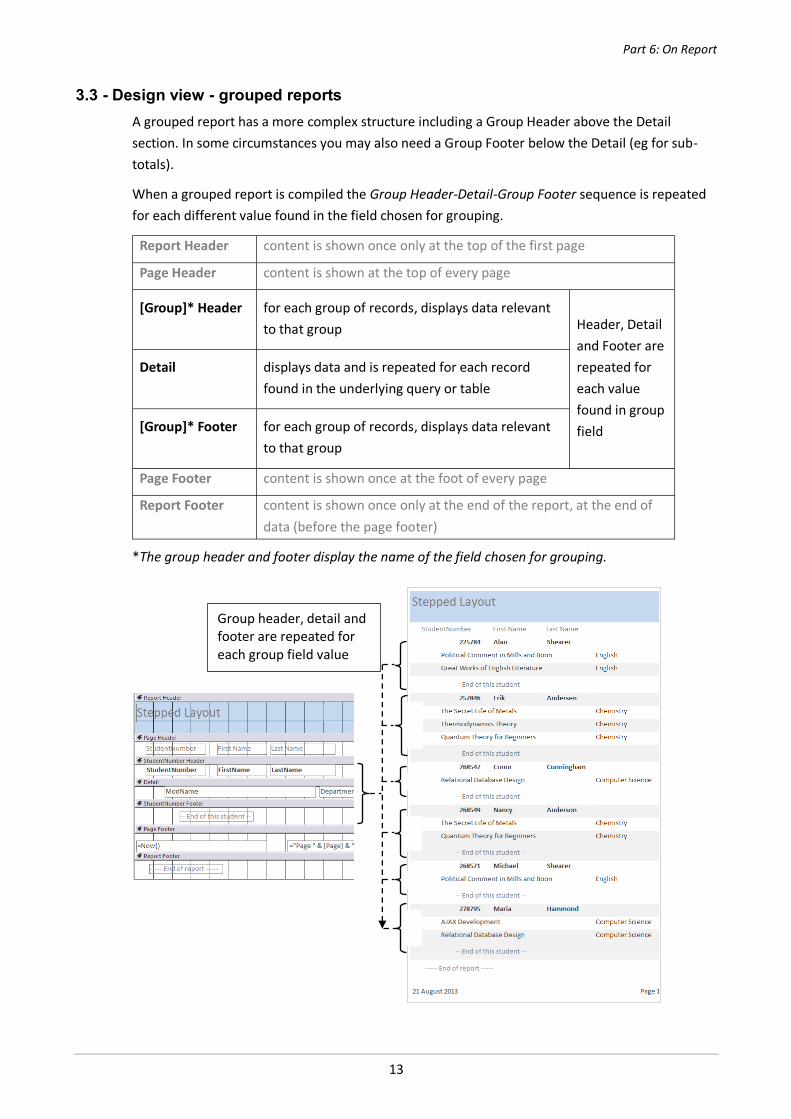
3.3 - Design view - grouped reportsA grouped report has a more complex structure including a Group Header above the Detail section. In some circumstances you may also need a Group Footer below the Detail (eg for sub-totals).
When a grouped report is compiled the Group Header-Detail-Group Footer sequence is repeated for each different value found in the field chosen for grouping.
Report Header content is shown once only at the top of the first page
Page Header content is shown at the top of every page
[Group]* Header for each group of records, displays data relevant to that group Header, Detail
and Footer are repeated for each value found in group field
Detail displays data and is repeated for each record found in the underlying query or table
[Group]* Footer for each group of records, displays data relevant to that group
Page Footer content is shown once at the foot of every page
Report Footer content is shown once only at the end of the report, at the end of data (before the page footer)
*The group header and footer display the name of the field chosen for grouping.
Group header, detail and footer are repeated for each group field value

Essential Access Book 2
14
Field propertiesThe Hide Duplicates property is particularly useful as it will prevent the display of repeated values in the detail section. To modify a field property:
1 In Design view, select the text box for the relevant field and view the properties list – either Report Design Tools > Design > Tools > Property Sheet or Right-click > Properties
2 On the Property sheet Format tab locate the Hide Duplicates property and set it to Yesusing the drop-down control
3.4 - Group & Total configurationGrouping and sorting have their own set of controls that can be used even if you did not initially choose grouping in the Wizard. This allows you to:
add multi-level grouping
refine sort orders
choose which sections to include
add totals to header or footer sections
control how a group splits on a page
To use these additional controls:
1 In Design view select Report Design Tools > Grouping & Totals > Group & Sort – an extra pane will appear at the bottom.
2 If grouping is already set, choose More to expand the controls; if no grouping is set, choose Add a group first.
3 Configure the grouping as appropriate.
4 Other options in the expanded controls allow you to change the visibility of the group header and footer.
Hide Duplicates = No
Hide Duplicates = Yes

Part 6: On Report
15
3.5 - Section propertiesThe layout of a completed report can be further controlled by modifying the properties for each section. To view and modify properties for a section:
1 View the property sheet (Report Design Tools > Design > Tools > Property Sheet ).
2 Choose the section – either click on the labelled bar or in an ‘empty’ area of the section.
Of particular interest are the properties that allow you to:
Allow a region to grow/shrink with the amount of content
Ensure all content in a section is kept together on the same page
Force the start of a new page before/after the section
Page sizeWhen designing for printed output, bear in mind you will be limited to paper width. Use the controls on the Report Design Tools > Page Setup tab and ruler to adjust as needed.
The report width (report properties or ruler) plus page margins must not exceed 21cm (A4 portrait) or 29.7cm (A4 landscape). Access will warn if the report width is too great for the defined paper and margin sizes.
Some useful report section properties

Essential Access Book 2
16
4 ~ Calculated fieldsTotals and sub-totals can be added to a grouped report using the Group and Total configuration controls (see above), but may also be added using an unbound Text Box control – one that is not tied to a specific field in the underlying data. An expression is then entered that references field names using appropriate syntax.
Inserting an unbound text box1 View the report in design view and from Report Design Tools > Design > Controls select
the Text Box control
2 Position the pointer over the relevant section and click to placeThe unbound Text Box will be inserted with an accompanying Label
Note
Placing the control in the Group Header or Footer will perform the calculation for the records in each group
Placing the control in the Report Footer will perform the calculation for all records in the report
4.1 - Number functions and arithmeticExpressions can be constructed using functions, field names, text and numbers.
Note Excel users: Access and Excel functions are similar but may have different names.
Some simple rules:
You must always start with an equals sign =
Function names are followed by a pair of brackets enclosing any parameters
Field names must be enclosed in square brackets
The usual mathematical operators can be used (+ - * /)
Additional text, including spaces, must be enclosed in double quotes
Multiple elements must be joined using ampersand &
Sum (total) = Sum([FieldName])
Average = Avg([FieldName])
Count = Count([FieldName])
Max, Min(highest, lowest values)
= Max([FieldName])= Min([FieldName])
Arithmetic = [Cost] * [Quantity] * 10%
Combined calculations = Avg([Cost] * [Quantity])
Including text = "Average is: " & Avg([FieldName])

Part 6: On Report
17
Number displayTo control the display of numerical data you must modify the Text Box properties:
1 In Design view, select the relevant text box and view the properties list – either Report Design Tools > Design > Tools > Property Sheet or Right-click > Properties
2 On the Property sheet Format tab set the Format property from the drop-down list. If you choose Fixed also set the property for the number of Decimal Places.
4.2 - Text manipulationText data can be concatenated (using ampersand &) in an expression and can be manipulated with some text functions. Additional text, including spaces, must be enclosed in double quotes.
Simple concatenation with space between
= [Forename] & " " & [Surname]
Fields combined with text = "First name is: " & " " & [Forename]
Initial letter from Forename field
= Left([Forename],1)
Surname, Initial = [Surname] &", " & Left([Forename],1)
4.3 - Other expressions
= Now() Current date and time *
= Date() Current date *
=If([Price]>25,"too big",[Price]) Immediate IF – works like Excel’s IF
= [Page] Current page number
= [Pages] Number of pages in report
= [Name] Name of report object (not the report title)
* Configure the display format using the Format property, as for number display.
Set decimal places by choosing Fixed format and setting Decimal Places

Essential Access Book 2
18
Part 7: Forms
5 ~ Access FormsIn Access, Forms are used to provide more user-friendly on-screen interaction with data than is possible with tables and queries. Forms can include familiar controls such as drop-down lists and buttons. They interact with the underlying tables, but do not themselves store data. Ideally they need:
a task focus; they should be designed around a specific task to be undertaken
a user focus; no knowledge of the underlying data structure should be needed in order to carry out the required task
They can be designed to display one record at a time, a continuous list of records or one main record (on the main form) together with continuous records of related data (on a sub-form). Examples are shown below:
Form designed to show one record at a time
Main form with a sub-form
Form designed to list continuous records (tabular design)

Part 7: Forms
19
5.1 - Form ViewsAs with other objects, there are several views, some dependent on your data structure:
Form The on-screen form with which users will enter, view and edit data
Datasheet Data presented in the format of a datasheet – looks the same as a table/query datasheet
Layout The on-screen form with the ability to adjust the width, height and position of the data fields – use for editing layout
Design Full control of the structure, content and functionality of the forms is only available from the more complex Design view
Note Forms based on a simple data structure may also offer you:
Pivot Table View – creates a pivot table based on your data
Pivot Chart View – creates a chart based on your data
5.2 - The Form WizardWhen you choose a query to create a form, the Wizard analyses your data relationships and offers various ways of displaying the data. Some choices will generate a main form-sub form combination, some a single form. If the end result does not meet your needs, simply delete and re-run the Wizard.
When constructing a form:
Decide what the user will need to do with the form
Determine which fields of data will need to be edited or entered
Decide if the user also needs to be able to view other fields too
Unless this data is present in only one table, construct a suitable query
Launch the Form Wizard by selecting Create > Forms > Form Wizard.
The Wizard process will depend in part on your data. Read the questions posed at each step in the wizard and respond as you think appropriate to define the form.
Choose the data source and fields, then complete the remaining steps.

Essential Access Book 2
20
6 ~ Editing FormsDetailed editing of forms is carried out in Design view, but layout can also be adjusted using the Layout view. Editing form design is very similar to editing report design.
Form design view has three sections: Header, Detail and Footer. The content of the Header and Footer generally remain fixed, and record data displays in the Detail section.
Every item (‘object’) on a form is referred to as a control. Data from the underlying table or query is usually presented as a pair of controls:
A Text Box, containing the name of the underlying field, to display the retrieved data –you must not edit this name
A Label containing the name of the field or the caption if one is defined – you can edit the content of the label without affecting data display
Note it is not always easy to tell which is which; use layout view to see which one contains data (this will be the Text Box)
6.1 - Design view – single and continuous recordsSingle record view always presents one record at a time, whereas when choosing continuous records the detail section is repeated for each available record in the underlying data, filling the available space between form header and footer.
Form controls may be edited using the same methods as for reports – refer back to the reports section for further details.
Header
Detail
Footer
Header
Detail
Footer
Single from design
Continuous forms design
Single Form view
Continuous Forms view

Part 7: Forms
21
Adding other controlsAny field from the underlying table/query can be added to the form design.
1 View the field list: Form Design Tools > Design > Tools > Add Existing field.
2 Select the type of control to use (text box, check box etc).
3 Drag the field from the field list onto the form.
Note To add text to the form, choose the Label control and click where you want the text to be positioned – don’t use a Text Box control as this expects data.
6.2 - Form and Field PropertiesSeveral form features are controlled using the form properties. To view form properties:
In Design view, ensure no controls or regions are selected and view the properties list –Form Design Tools > Design > Tools > Property Sheet
Some useful properties are summarised below:
property tab use
Default view Format Switch between single record and continuous records. There are other option here too
Record selectors Format Turn off/on the grey box to the left of the detail section that allows you to select a record
Record source Data indicates the table/query on which the form is based
Pop up Other Form will always remain on top, even when not active
Field propertiesWith the properties pane visible, select a region or field to see its properties.
Format Format Use in conjunction with Decimal Places property to control display for numerical data
Show date picker Format When set to For Dates (default) date fields displays a small calendar to choose the date
As you develop confidence in using MS Access you may find other useful properties.
Some of the Form design controls
labeltext box
combo box check box
radio button field list
properties

Essential Access Book 2
22
7 ~ SubformsOne feature of a relational database is that a single record in one table is frequently related to several records in a related table or tables. A subform enables you to view both at the same time and is configured so the subform keeps in-step with the main form; it is an extremely useful user interface.
In order for the main and subform to synchronise, both must share a common field, usually the primary key of the data on which the main form is based.
A main form-sub form combination can be developed:
In one step using the Wizard
By creating the main and sub-forms separately and then combining
Whichever approach you use, two new forms will be present in the forms object list.
7.1 - Creating with the WizardBoth the main and subform can be constructed at the same time using the Wizard:
1 First create and save a query that contains all the fields you will need on both the main and subforms.
2 Using the Form Wizard, build a form based on this query.
3 At the step that asks ‘How do you want to view your data?’ choose the option that places the appropriate fields in the main form (top) and subform (bottom) regions. Also check the option Form with subform(s) is selected.
4 Continue with the remaining wizard steps.
Main formSingle-record view
Subformcontinuous-records view

Part 7: Forms
23
7.2 - Wizard-free subformsFirst decide which fields will be required on the main form and which on the subform, making sure a common field is available to synchronise records – this will generally be the primary key for the main form data.
Create any queries on which the forms will be based and then construct the main form and sub form. Note that:
The main form must be in single record view
The sub form must display either continuous records or datasheet view
Combining the main- and sub-formsMake sure the main form design allows space for the sub form and then:
1 Open the main form in design view. Locate the subform in the Object list and drag it onto the main form.
2 In design view, select the subform and view the properties. On the data tab configure the synchronisation:
Link Master Fields: The key field on the main formLink Child Fields: The corresponding field on the subform
Note Selecting the ellipsis (…) will open a dialogue to configure these
You can also add the sub form to the main form using the Subform/Subreport item in the Controls gallery.
Final tweaksWith the main form in design view, adjust the layout as appropriate.
Any other subform settings must be configured by opening the subform directly in design view. One change you may want to make is to remove the subform navigation controls: you can edit these and scroll bars etc from the subform format properties.
7.3 - Subform calculationsAs the subform is synchronised with the main form it is in effect filtered so it is possible to perform additional summary calculations just on these records. These are usually placed in the footer region of the subform using an unbound text box. Expressions are constructed using functions, field names, text and numbers. Unbound controls are inserted from the controls gallery using the same method as for reports.
Note Excel users: Access and Excel functions are similar but may have different names.
Example functions include Sum, Avg (average), Count, Max and Min
Text can be included in expressions, eg:
= "Average is: " & Avg([FieldName])

Essential Access Book 2
24
8 ~ Lookup fieldsSimple display or entry into underlying tables may not always be the most useful approach from a user-perspective. Access provides a Lookup feature to improve usability.
Note: The Lookup feature can be used with table fields; in this case it is inherited by subsequent queries, reports and form. This sounds useful, but can introduce confusion (particularly in queries) as the value displayed in the field is not the value stored in the field; query criteria must still work with stored values.
Here we focus on their use with forms.
LookupConsider a form that requires the entry of a Department Code. Many users would prefer to choose from a list of department names rather than remember the codes.
Using a Lookup, the field would obtain its value by ‘looking it up’ in a list, and this would be presented to the user. In Access the list can be:
Hard-coded into the field properties – you enter a list of options into the control properties (simplest but least flexible)
The field names from a table or query (not common, so not included here)
Values already stored in another table or query (most flexible)
There are wizards available, though manual configuration is not difficult.
If you are replacing an existing Label/Text box control with a lookup, you must first delete these from the form.
Adding a lookup fieldYou need to be able to see the list of existing fields and the gallery of controls (both on the Form Design Tools > Design tab). Also check the control wizard is enabled to use the wizard, or disabled to use manual configuration (found in the More option for the controls gallery).
1 Select the Combo Box control, and then drag the field from the list onto the form.
2 Complete your selections via the wizard or for manual configuration switch to the Property Sheet (see below).
A Lookup presents limited options, reducing input errors by users

Part 7: Forms
25
8.1 - Configuring a LookupThe property settings depend on whether you want to hard-code the list or look up a value in a table/query.
Property(Tab)
Hard-coded value list Lookup in another table/query
Row Source Type (Data)
must be Value List must be Table/Query
Control Source(Data)
the name of the field in the underlying table/query (should be already set if you’ve dragged the field onto the form)
the name of the field in the underlying table/query (should be already set if you’ve dragged the field onto the form)
Row Source(Data)
a list of the possible values with each value in quotes separated by semi-colonsEnter the values in here, separated by semi-colons
the name of the table or query in which values will be looked upSelect the table/query from the drop-down
Bound column(Data)
Always 1 Usually 1This is the column in the Lookup that shares the value used in the original form field
Column Count (Format)
Always 1 The number of columns from the Lookup table/query that will be needed
Column widths (Format)
N/A To hide the coded value in the drop-down, enter 0cm to set the first column width to zeroOther widths can be set if necessary, separated by semi-colons
Limit to listAllow Value List Edits(Data)
These properties determine whether the user can use values not in the list, and whether new values can also be added for future use
Queries for LookupsUsing a query rather than a table for a lookup is particularly powerful as it allows you to:
Generate a list using concatenated fields (eg Forename & Surname)
Apply filters to the list
Define the sort order of the list (so values are presented in alphabetical order)
Use selected fields from an existing larger table

Essential Access Book 2
26
9 ~ Combining and automatingWhen designing a database to be user by others, the ability to run queries and present the information in a user-friendly format should be included on the forms. Ideally they should not need to work directly with tables, queries and reports.
9.1 - Action buttonsThe form controls gallery includes the Button control, which can be configured (via a wizard) to carry out a range of actions including opening other objects – for example a report. To add a button to view a report:
1 Open the form in design view, making sure you can see the controls gallery; ensure the wizard is enabled.
2 Select the Button control and click or drag on the form to place the button. The wizard is launched.
3 There are several options, but to preview a report choose from the Report Operations.
4 Continue through the wizard to choose the report and name the button. If you choose a button icon add a separate Label control to label the button.
The resulting control will now allow the user to view (and print) a report without needing to know anything about the underlying data or queries.
Choose the type of operation you want the button to perform
LabelButton

Part 7: Forms
27
9.2 - Combining forms, queries and reportsThe functionality of a button can be taken further by combining some of the features covered in previous sections.
Include a parameter queryIf the underlying query on which the report is based includes a parameter query, when the report is launched by the button a pop-up dialogue will open to request further information – the Department ID, for example.
Reference a form controlRather than rely on the entry of parameter data by the user, the other option is to refer to a control on the form. This is also configured in the query, but must use the correct Access syntax to work, referring to the object type, object name and control name:
[ObjectType]![ObjectName]![ControlName]
Now when the button is selected, the current Department ID is used as the parameter value in the underlying query, so the report includes modules only from that department.
Query with DeptID parameter:[Forms]![Modules]![departmentid]
Button opens report
Query references form data
Query provides filtered data for report

Essential Access Book 2
28
Part 8: Appendix
The information provided in Parts 1-7 has been chosen to include the essentials of working with MS Access, but there are many other features available, and many other things to consider if, for example, you want to create a database that will be used by several people over an extended time. This part outlines some areas you may wish to explore further.
10 ~ Alternative User ViewsWhen designing multi-user databases, unless you want to invest a lot of time in Access training,you will almost certainly want to hide underlying objects from view. The last thing you want is well-meaning users modifying critical table or query design.
Front End formsA useful approach is to create one form as a front-end menu, from which all other forms are opened, and use only these forms to enter/edit data and launch reports (remember to include a close button on forms other than the front-end).
Some options that help with this approach can be configured in database options:
Choose File > Options > Current database
Make the front-end form open automatically when the database is opened
In the Application Options section, select the form to display on open from Display Form
Hide the object browser panel from users
In the Navigation section, remove the tick from Display Navigation Pane
Configure tabbed view* so each object opens with a tab at the top so you can easily switch between them
In the Application Options section, select Tabbed Documents instead of Overlapping Windows
* Access objects normally open as separate windows, but if you configure a database to use a tabbed view you can switch between currently open objects using a series of tabs above them. To make it even easier for users, open one form when the database is launched (as above), and attach a macro (see below) that opens other forms to the On Load event property of the first form.
11 ~ MacrosIf a sequence of actions must be performed in one particular order, the best way to ensure this happens is to put it under the control of code. If you’re not familiar with VBA (Visual Basic for Applications), macros will allow you to develop routines using a form of pseudo-code. They allow you to introduce conditional logic and can be run by attaching to a range of common actions (‘events’), often to the ‘click’ action of a form button.

Part 8: Appendix
29
You could typically use a macro:
To archive data to a dedicated table (when an append query must be run before a delete query)
To open a form/report and apply a filter (eg based on a value in another form)
To run a series of update queries where a specific order is essential
To open a form and maximise the view
Constructing a macro1 Select Create > Macros & Code > Macro
2 If you are not familiar with the available actions, show the Action Catalog (Macro Tools Design > Show/Hide > Action Catalog). You can then add actions from the drop-down list or Action Catalog.
3 After choosing and adding an action, you will usually need to enter data or expressions manually or by choosing from a list. Options that must be completed are shown as Required.
4 Save the macro with a suitable name. You will also need to attach it to an event.
Attaching a macroA macro is attached to an event property, so when the event occurs the macro is run – events are generated when the user does something like clicking the mouse, or pressing a key.
1 Select the object to which you wish to attach the macro and view its properties.
2 Locate the event you want to use and attach themacro by selecting it from the drop-down for the event.
This macro contains two actions:OpenReportMaximizeWindow
The Report Name is Required for this action

Essential Access Book 2
30
12 ~ Split Front-end/Back-endAn Access database can be split into two parts:
tables in one database (the ‘back-end’)
everything else in another (the ‘front-end’)
This makes it possible to continue developing the front-end with test data rather than live data and also makes it that bit more difficult for users to change table design as only a limited range of properties can be edited in a linked table.
You can either choose to make a split database when you start development, or split an existing database (the more common approach).
Splitting a database1 First make a back-up copy of the database before splitting.
2 Select Database Tools > Move Data > Access Database . This starts the Splitter wizard.
3 Choose Split Database and select the location required for the back-end – this does not need to be in the same folder as the front-end.
4 Select Split to complete the action
You will receive confirmation of success, but to confirm this yourself, check the Object browser (the tables should now be shown as linked tables) and check the Back-end database is where you chose; this can be opened as normal and should contain only the tables.
Managing linked tablesIf the location of the back-end changes, you will need to refresh the links.
1 Open the Front-end database
2 Choose External Data > Import & Link > Linked Table Manager
3 Select all linked tables to be updated and OK
4 In the dialogue that opens, locate the database that contains the selected tables (the back-end for a split database) and Open to restore the links – you will receive confirmation.
Note If the back-end is on a mapped, shared drive, the links will be made using the letter the drive is mapped to. This may not be the same for all users, so you should instead use the server path for the linked tables.
Select the linked tables requiring updating

Part 8: Appendix
31
13 ~ Compact and RepairA newly-created Access database appropriates a portion of disk space in which to store and manage the data tables and other objects, and extends this as necessary. Unfortunately if data and/objects are deleted the excess space is not released and as a result, when developing a database the file size on disk can become unnecessarily large.
To keep databases to a reasonable file size, run the Compact and Repair utility periodically.
Choose Database Tools > Tools > Compact and Repair Database
Any open objects will be closed and the database re-opened
Note: Access Options allow you to choose to compact the database each time it closes:
1 Choose File > Options > Current Database
2 In the Application Options tick Compact on Close

Essential Access Book 2
32
Notes: