Embed Size (px)
Citation preview

Essel Propack LimitedAnnual Report 2015-16Essel Propack LimitedAnnual Report 2015-16
Delighting Customers Unveiling Horizons

Sunrise is a delightful spectacle for mankind, unveiling
the horizon in hue after hue of vibrant and energetic colours. The cover of this
annual report is inspired by this magic in the heavens that the world witnesses day after day
ever since the formation of earth.
Contents01 Delighting Customers Unveiling Horizons 02 Chairman’s Message 04 Vice-Chairman & Managing Director’s Message
06 Delighting Customers 08 Unveiling Horizons 10 Board of Directors 11 Leadership Team
12 Accolades and Financial Highlights 13 Corporate Information 14 Board’s Report
22 Management Discussion and Analysis 29 Corporate Governance Report 63 Financial Statements - Standalone
102 Financial Statements - Consolidated

Delighting Customers Unveiling HorizonsCustomer-centricity is a mind-set and a culture that continually evolves through deep insights into and pragmatic understanding of the changing customer needs that in turn are shaped by changes in consumer behaviour, technology and innovations. It involves strategic thinking and commitment at the highest level in an organisation, and manifests as innovative products, effi cacious solutions and elevated customer experience.
Customer-centricity has been the hallmark of Essel Propack over the three decades of its existence. By putting our customers at the centre of our business, we have been innovating products and solutions that guarantee long-term value to our customers. Our success in the recent years with the best in class laminated tubes which we are pioneering for the Cosmetics/ Beauty care, Food and Pharma brands, gives us confi dence that we have a lot more to off er in this continuing Journey of...
...with innovative Packaging solutions, Unmatched quality, Unparalleled service and Long-term Partnering.
that guarantee long-term value to our customers. Our success in the recent years with the best in class laminated tubes which we are pioneering for the Cosmetics/ Beauty care, Food and Pharma brands, gives us confi dence that we have a lot more to off er in this continuing Journey of...
that guarantee long-term value to our customers. Our success in the recent years with the best in class laminated tubes which we are pioneering for the Cosmetics/ Beauty care, Food and Pharma brands, gives us confi dence that we have a lot more to off er in this continuing Journey of...
consumer behaviour, technology and innovations. It involves strategic thinking and commitment at the highest level in an organisation, and manifests as innovative products,
to our customers. Our success in the recent years with the best in class laminated tubes which we are pioneering for the Cosmetics/ Beauty care, Food and Pharma brands, gives us confi dence that we have a lot more to off er in this continuing Journey of...
Packaging solutions,
Unparalleled service and
...with innovative Packaging solutions, Unmatched quality, Unparalleled service and Long-term Partnering.
...with innovative Packaging solutions, Unmatched quality, Unparalleled service and Long-term Partnering.
DelightingCustomersUnveiling Horizons
1

Chairman’s Message
Dear Shareholders,
It is that time of the year again for me to fulfi ll the pleasant duty of appraising you of your Company’s performance during FY 15-16 and how I see it going forward.
The Expanded Playfi eld available to us in the form of growth opportunity in the non-oral care categories, combined with the Renewed Energy
with which we have embarked to derive 50% of our revenue from non-oral care, has started yielding results. We are growing in the non-oral care categories. Our revenue outside of India continues to grow double digit on underlying basis. Our performance would have been even better but for the sluggish Indian FMCG sector which constrained the revenue growth
Clearly such strong performance is never an accident. It is born out of strategic thinking, clarity of vision and a powerful mission. And I see several forces unleashed as a result – Innovation, Customer Engagement, Quality, Service to mention just a few.
Our revenueoutside of India continues to grow double digit on underlying basis.
2

in India. However, there is a silver lining – spate of measures from the Government together with expected good monsoon should catapult growth in India in the near future. Our Net profi t helped by improved margin, has grown by 29.5% to a record ` 1.8 billion this year. Clearly such strong performance is never an accident. It is born out of strategic thinking, clarity of vision and a powerful mission. And I see several forces unleashed as a result – Innovation, Customer Engagement, Quality, Service to mention just a few.
Innovation is enormously important – both in product and processes. It is the only insurance against irrelevance; the only guarantee of long-term Customer loyalty and the only strategy for out-performing a sluggish economy. Your Company understands this perfectly. Our R&D department in India has been given recognition by the Government of India, on strength of the pioneering work done in the area of Laminated Plastic Tubes. The R&D teams have been strengthened globally and are working on laminate and decoration formats that reduce carbon footprints, are eco-friendly and easily recyclable.
We are engaging with Customers across a wide range of brands – both global and local. Steve Jobs said “Get closer than ever to your Customers. So close that you tell them what they need well before they realize it themselves.’ Our Minus 5 initiative in India does
exactly this – going back 5 steps with the Customer, understanding details of their products and giving them complete packaging solutions. In other geographies too, road shows, branding and business development initiatives are yielding some great results. More and more Customers have started looking at packaging as ‘value’ and not as ‘cost’. This is but just the beginning. Packaging is gaining more and more importance. The innovations that we bring to the look, feel and decoration of the laminates is making our packaging a powerful marketing tool. In emerging markets with their long and complex distribution chains, non-availability of climate conditioning in the distribution outlets, the role of packaging becomes all the more important.
As we are engaging more and more with Customers, we are fi nding other areas in which we can delight them – Quality and Service for example. “Quality is remembered long after the price is forgotten. As Tony Allesandra said “Being on par in terms of price and quality only gets you into the game. Service wins the game.”
Our commitment to Delighting Customers through our product quality and service will require utmost care and focus. We have to be effi cient on the shop fl oor, fl exible in meeting ever changing customer requirements and optimise our resources. A satisfi ed Customer is the most valuable asset for a business.
And we are confi dent of unveiling new Horizons in driving Customer delight.
I would like to take this opportunity to thank our valued Customers, our bankers and all stakeholders for their consistent support, the Board of Directors for their conscientious guidance, the Company’s Leadership Team and the Esselites across the globe for their enthusiasm and eff orts, all of which have contributed to your Company’s growth.
With best wishes,
Subhash Chandra
ChairmanAs we are engaging more and more with Customers, we are fi nding other areas in which we can delight them – Quality and Service for example. “Quality is remembered long after the price is forgotten. As Tony Allesandra said “Being on par in terms of price and quality only gets you into the
Our commitment to Delighting Customers through our product quality and service will require utmost care and focus. We have to be effi cient on the shop fl oor, fl exible in meeting ever changing customer requirements and optimise our
most valuable asset for a business.
Chairman
a record ` 1.8 billion
Net Profi t has grown by 29.5% to
3

Vice-Chairman & Managing Director’sMessage
We believe quality is never an accident, it is always the result of intelligent work, relentless focus on simplifi cation – of design, manufacturing, technology, layout, processes and procedures.
Dear Shareholders,
As you are aware, the Company has embarked on a Mission to grow the non oral care share of revenue to 50% and to grow net profi t at a CAGR of 20% over next 5 years. With a view to achieving this, we have internally launched Mission 20:20:20 – targeting 20% CAGR in Net Profi t, 20% Return on Equity (ROE) and 20% Return on Capital Employed (ROCE) within the next couple of years. It gives me pleasure to report that your Company is on track with this Mission 20:20:20. In the year under review, Net Profi t grew at 29.5%; ROE and ROCE have improved to 20.7% and 18.5% respectively.
The Company’s performance is driven by strong growth in our overseas markets led by Europe. Our thrust into non oral care categories is seeing notable customer wins in China, USA, Europe and Egypt. Our innovative packaging solutions with our new laminate structures combined with high decoration, are gaining traction with several reputed cosmetic brands.
In China, our i-Shine, i-Cloud and Bon Appetit projects, backed by the state-of-the-art capability on ground including the greenfi eld unit in South East China, have established our credentials as a Packaging specialist in the non- oral care categories; we are no longer considered just an oral care company.
We have re-organised our plastic tube operations by consolidating the manufacturing in Poland and India
4

by shifting out the manufacturing assets from USA which will now focus on providing new laminate based tube solutions for Beauty & Cosmetics category. The business pipeline build-up in Europe gives us fair comfort of realising the benefi ts of this re-organisation.
We continue to deepen and broaden our presence in the Pharma category in India. Although the India market was disappointing in terms of growth on account of sluggish FMCG sector, we have used the opportunity to expand our customer base and the range of off erings. Some big, growing brands have reposed faith in us and awarded large contracts for supply of both laminated and plastic tubes. With our larger operations growing in strength and contributing to the bottom line, we are in the process of scaling up some of our smaller operations such as Colombia and Mexico in order to seize the market opportunity in Latin America and the Andean Region.
The robust progress with our strategy in recent years, gives us confi dence that we will unveil, in the future, several exciting initiatives, aimed to delight Customers and create value for our Stakeholders. These initiatives centre around Product, Quality and Service with prime focus on Innovation in every thing we do.
For New Product Development, we work with Customers, helping them transition from their existing packaging formats to laminated tubes. As Damon Richards said “the Customer does not care how much
you know until they know how much you care.” Our eff orts in New Product Development have been to be a “one stop shop” for all the packaging needs of the Customer – be it the laminate structure, the Dispensing and Anti-counterfeit features or Decoration. We are committed to create and provide Packaging which will present to the consumer “the fi rst moment of truth”.
As Peter Drucker rightly said “Quality in a product or service is not what you put into it; it is what the Customer gets out of it.” The entire organisation is primed to raise the bar here, leveraging technology and processes; we believe quality is never an accident, it is always the result of intelligent work, relentless focus on simplifi cation – of design, manufacturing, technology, layout, processes and procedures. With the increase in the number of Customers that we serve in the non-oral care category, smaller run sizes and multiple variants, it is imperative that we “Do it fi rst time right”. Quality & Process and Technology functions today are represented at the Corporate Leadership Level, with responsibility to ensure that Customers are assured of on-time, quality products; the ultimate aim - to be the most preferred supplier of innovative packaging solutions.
Handling multiple Customers with multiple requirements and priorities, requires an agile and effi cient supply chain. With the use of Information Technology and eff ective employee engagement
practices, your Company is working towards creating a paradigm shift in this area. We have successfully partnered many of our Customers for their global product launches and in tiding over their supply chain emergencies. All our regions have received Customer Service Awards.
It is a matter of satisfaction that the entire organisation is behind this strategy. Ultimately, it is the people who make the diff erence. We continue investing to develop our human resources, equip them with facts and fi gures, and empower them with information to lead and deliver promises to customers and stake holders. The continuously improving Employee engagement scores, with some of the subsidiaries already at country / industry best engagement scores, is a source of pride for us.
Without doubt, we are well poised to Delight Customers and Unveil Horizons.
With best wishes,
Ashok GoelVice Chairman & Managing Director
20.7% and 18.5%ROE and ROCE have improved to
Mission 20:20:20Your Company ison track with this
20:20:20
practices, your Company is working towards creating a paradigm shift in this area. We have successfully partnered many of our Customers
you care.” Our eff orts in New Product Development have been to be a “one stop shop” for all the packaging needs
practices, your Company is working towards creating a paradigm shift in this area. We have successfully partnered many of our Customers
Your Company is
Mission 20:20:20on track with this
5

Delighting CustomersAt Essel Propack, we take pride in being a customer-centric business, and see ourselves as a packaging solution provider to FMCG and Pharma customers, and not just a product supplier. Our role does not stop with sales. Our products are designed for elevated experience by billions of FMCG end consumers across the globe, in terms of aesthetics, feel , ease of use, protection of the contents in time and space.
Businesses that are truly customer-centric have one thing in common – they redefi ne their industries and sectors. Organisations that have customers deeply ensconced in their strategic thinking have always endured and overcome challenges, out-growing their peers consistently over time.
Packaging indeed is the fi rst moment of truth for consumers. It is verily an ambassador for the FMCG brands, connecting with the consumer right from the super-market shelf and through each day the product is used.
Customer-centric businesses have redefi ned not only customer experiences but also customer expectations. Such businesses are shining examples of the possibilities and potential of a customer-centric mindset and approach, and today lead
What Essel is doing for the Cosmetics and Pharma categories is no less disruptive. Our new laminated tube solutions for these categories very much re-defi ne customer experience because what we are off ering today is very diff erent from the traditional plastic and aluminium tubes, with features and benefi ts that are straight out of a wish list.
The iPhone was not the fi rst smartphone. Far from it, when the iPhone was launched in 2007, there were many mobile phones with touch screens and off ering access to the Internet, email, music, games or apps. But Apple off ered all of these in a fantastically diff erent way than had ever been done before.
Apple changed what people did with their phones, transforming a communication tool into an integral part of their life and life style.
The iPhone forever redefi ned the customer expectations and experience of what a smart device could be.
Redefi ning Customer Experience
We therefore work closely with our customers throughout the entire product life-cycle. From proto-type to production to fi nal usage and disposal, we seek to understand and analyse every aspect of the product and packaging, thereby driving packaging innovations to redefi ne customer experience and expand customer base.
6
What Essel is doing for the Cosmetics and Pharma categories is no less disruptive. Our new laminated tube solutions for these categories very much re-defi ne customer experience because what we are off ering today is very diff erent from the traditional plastic and aluminium tubes, with plastic and aluminium tubes, with features and benefi ts that are straight out of a wish list.
the pack as the top value creators. The path we at Essel Propack tread is not very diff erent.

Customer-focussed organisations have not only redefi ned customer experience, but have gone on to create a new set of customers out of their innovations and to open new growth opportunities.
At Essel, we are excited that our new laminated tube solutions are evoking interest even of customers who today patronise other packaging formats such as bottles and tottles. They are beginning to see our new laminated tube solutions as more effi cacious and relevant for their brands.
Expanding the Customer base
FMCG growth globally and the shifting trend towards tubes as preferred packaging format holds immense potential for growth; further, driven by technology and innovation, new FMCG products and categories are emerging and re-shaping consumer behaviour and lifestyles, attracting new customers and creating newer opportunities for Essel to re-double its eff orts in its mission of Delighting Customers by
Unveiling horizons…
Expanding the Customer baseCustomer-focussed organisations have not only redefi ned customer experience, but have gone on to create a new set of customers out of their innovations and to open new growth opportunities.
At Essel, we are excited that our new laminated tube solutions are evoking interest even of customers who today patronise other packaging formats such
Expanding the Customer base
experience, but have gone on to create
innovations and to open new growth
At Essel, we are excited that our new laminated tube solutions are evoking interest even of customers who today patronise other packaging formats such
7

UnveilingHorizonsWe are steadily expanding the range of our packaging solutions to new product categories where we seek to re-defi ne the way product is preserved and presented.
At Essel Propack, DELIGHTING CUSTOMERS goes beyond the Product to First-time-right quality, Just-in-time service and Speed-to-market.
We continually UNVEIL HORIZONS for them...
Going beyond the conventional, we now off er in all our markets across the globe:
Breakthrough Products & Solutions
Sustainability and Environment
superior alternative to the Plastic tubes for packing Cosmetics, with our high barrier, super look & feel, enhanced décor Laminated tubes
laminated tubes with safe and easy-dispensing for pharmaceutical products
specialised large diameter laminated tubes with rich look, feel and stability, for replacing bottles, tottles, plastic and aluminium tubes in cosmetics/ food brands
laminated tubes with special features such as thermal timers, product authentication, child protection, aroma sensory etc.
As a Company, we are committed to pro-actively preserving environment by focusing on sustainable tube design, with our
Source reduced laminate structures such as Titanium
Plastic barrier laminated tubes as alternative to aluminium barrier laminated tubes for easy recyclability
Mono-material high barrier Green Maple leaf tubes, recyclable as code 2 (HDPE)
Structures incorporating Post Consumer Regrind polymers to the extent of 40%, such as Etain
Bio-degradable laminate structures
8

Customer Engagement World class operations / Processes
Value to stakeholdersOur ethos is one of partnering our customers long term in manifold ways, as a
Global supplier, servicing global customers at multiple locations around the world
Innovation partner, helping choose from the best in class alternatives of laminate, decoration, dispensers & closures
Solution provider, helping develop laminated tube as alternative packaging format for bottles, tottles, plastic and aluminium tubes
One stop shop, off ering customers entire range of tubes for all product categories, oral and non oral care
Supply chain enhancer, manufacturing in proximity to customers or at the back of their factory or under COCO model
Growth enabler, supporting expansion and greenfi eld projects of customers by seamlessly ramping up supply capability
We recognize that our Operations and Processes can be a key diff erentiator in creating superior product experience for our customers by
Moving towards Zero Quality Defects using advanced inspection systems and automated controls
Providing, high impact graphics aided by computer-to-plate technologies, i-shineTM and innovative ink recipes
Assuring highest levels of SHE norms by meeting class 100000 clean room standards and CGMP
Shorter lead-times through quick changeover tooling and high throughput equipment
Flexible servicing driven by advance planning optimizer based IT systems and processes
Articulated strategy to sustain profi table growth through
Mission
CAGR 31%
A fi ve year earnings growth at
19% and 21%Expansion in ROCE and ROE to
respectively
3.2 timesover fi ve years
Market capitalization growing by
20:20:20
World class operations / ProcessesWe recognize that our Operations and
Value to stakeholders
We recognize that our Operations and Processes can be a key diff erentiator in creating superior product experience
Value to stakeholders
Moving towards Zero Quality Defects using advanced inspection systems and automated controls
Providing, high impact graphics aided by computer-to-plate
A fi ve year earnings growth
And our Stakeholders are our valued Customers too, whom we seek to delight through strong and sustained improvement in the fi nancial performance and the value of the Company.
9

Board of Directors
10
DirectorsBoard of DirectorsBoard of Directors
Subhash ChandraChairman
Boman MoradianIndependent Director
Radhika PereiraIndependent Director
Tapan MitraIndependent Director(Retired 25.02.2016)
Mukund M. ChitaleIndependent Director
Atul GoelDirector
Ashok GoelVice Chairman & Managing Director

Leadership Team
Standing Left to Right:
Suresh Savaliya– Head Legal & Company Secretary
Alan Conner– Regional Vice President - Europe
Dileep Joshi– Director - Human Capital
Edward Luo– Regional Vice President - EAP
Ted Sojourner– Regional Vice President - AMERICAS
M. K. Banerjee– Director - Creativity & Innovation
Sitting Left to Right:
M. R. Ramasamy– Chief Operating Offi cer
Mukund Chitale– Independent Director
Ashok Goel– Vice Chairman & Managing Director
Dr. Subhash Chandra– Chairman
Radhika Pereira– Independent Director
Boman Moradian– Independent Director
Atul Goel– Director
A. V. Ganapathy– Chief Financial Offi cer
Parag Chaturvedi– Head - Global Quality & Process Improvement
Alex Cheng– Global Supply Chain Head
Prakash Dharmani– Chief Information Offi cer
Vinay Mokashi– Financial Controller - Corporate
Roy Joseph– Regional Vice President - AMESA
Rajiv Verma– Technical Head - Corporate
11

Financial Highlights
11-12
12-13
13-14
14-15
15-16
16,034
18,573
21,490
23,439
22,084
Total Revenue ` Million
11-12
12-13
13-14
14-15
15-16
514
810
1,078
1,406
1,821
Profi t After Tax ` Million
%
11-12
12-13
13-14
14-15
15-16
10
12
14
16
19
Return on Capital Employed %
11-12
12-13
13-14
14-15
15-16
6
9
13
19
21
Return on Equity %
12
Go Extreme Cranberry TubeEssel Propack, USA
Bronze Award, Best FoodThe Tube Council, USA
Dove Absolute Quench TubeEssel Propack, USA
Silver Award, Best Personal CareThe Tube Council, USA
Essel Propack, GoaIMC Ramkrishna Bajaj National Quality Award for Performance Excellence
Accolades

13
Corporate InformationBOARD OF DIRECTORS
Subhash Chandra Chairman & Non Executive Director
Tapan Mitra* Independent Director
Boman Moradian Independent Director
Mukund M. Chitale Independent Director
Radhika Pereira Independent Director
Atul Goel Non Executive Director
Ashok Goel Vice Chairman & Managing Director
*Resigned as Director w.e.f. February 25, 2016
A.V. Ganapathy Chief Financial Officer
Suresh Savaliya Head – Legal & Company Secretary
AUDITORSMGB & Co. LLPChartered Accountants
BANKERSAxis Bank LimitedKotak Mahindra Bank LimitedYes Bank LimitedDBS Bank LimitedState Bank of IndiaICICI Bank LimitedThe Ratnakar Bank Limited
DEBENTURE TRUSTEEAxis Trustee Services Limited
REGISTRAR & SHARE TRANSFER AGENTBigshare Services Private Limited, E-2/3, Ansa Industrial Estate,Sakivihar Road, Saki Naka, Andheri (E), Mumbai 400072. MaharashtraTel No. 022 4043 0200, 28470652, Fax: 022 [email protected]
REGISTERED OFFICEP.O. Vasind, Taluka: Shahapur, District: Thane,Maharashtra - 421 604, India.Tel: +91 9673333971
CORPORATE OFFICETop Floor, Times Tower, Kamala City,Senapati Bapat Marg, Lower Parel,Mumbai - 400 013, Maharashtra, India.Tel: 022-24819000 Fax: 022-24963137Email: [email protected]:L74950MH1982PLC028947
UNITS - INDIAVasind, Murbad, Wada, Chakan, Goa, Silvassa and Nalagarh

14
Annual Report 2015-16
Board’s Report
ToThe Members,Essel Propack Limited
Your Directors are pleased to present their Report on your Company’s business operations along with the Audited financial statements for the financial year ended on March 31, 2016.
Your Company has posted yet another year of good performance, both in India and in Global operations. The highlights of the financial results are set out below.
CONSOLIDATED GLOBAL RESULTSIt may be noted that in July 2015 your Company had divested its entire shareholding in Packaging India Pvt Ltd (PIPL), its wholly owned Indian subsidiary. Accordingly, the current year’s results include the revenue and profits of the divested business only for three months ending June 2015. The summary results are set out below:
(` in million)
Year ended 31.03.2016
Year ended 31 .03.2015
Total Revenue (excluding excise duty)
22084 23439
Profit Before Depreciation, Finance and Tax (PBDIT) inclusive of other income
4409 4117
PBDIT exclusive of other income 4172 3908
Finance cost (623) (793)
Depreciation (1270) (1318)
Profit before Tax and exceptional items
2516 2006
Exceptional items net (loss)/gain 24 55
Tax (716) (611)
Share of profits from associates 27 3
Minority interest (30) (47)
Net profit 1821 1406
The reported consolidated Total revenue for the year is lower by 5.8%, reflecting the impact of the said divestment. On a comparable basis however, the Total revenue actually grew by 3%. The growth would have been higher but for the deflation in the selling prices consequent to the pass through to customers of the sharp reduction in the raw material prices during the year. While Europe delivered another year of strong growth, the sluggish economic conditions in India and reduced off-take from key customers in China have impacted the overall sales growth this year. Improved product mix, stable raw material prices and operational efficiencies however enabled the operating margin to expand by 220 bps over the previous year. Further helped by 21.4% reduction in the finance cost and lower effective tax rate, your Company’s consolidated Net profit expanded 29.5% over the previous year, to post an all-time high of ` 1821mio. The Net profit includes net exceptional gain of ` 24 mio, including gain on account of divestment of PIPL. Excluding the exceptional items, the consolidated Net profit for the year has grown 33% over the previous year on comparable basis. The healthy increase in the Net Profit witnessed in the recent years is indicative of a sustained profitable growth in your Company’s business operations.
INDIA STANDALONE RESULTSThe summary results are set out below:
(` in million)Year ended 31.03.2016
Year ended 31.03.2015
Total Revenue (excluding excise duty)
7631 7755
Total expenditure (5847) (6135)Profit Before Depreciation, Interest and Tax (PBDIT) inclusive of other income
1784 1620
PBDIT exclusive of other income
1582 1411
Finance cost (259) (409)Depreciation (506) (457)Profit before Tax and exceptional items
1019 753

15
(` in million)Year ended 31.03.2016
Year ended 31.03.2015
Exceptional items net (loss)/gain
453 0
Tax (315) (188)Profit after Tax 1157 565Appropriations:Dividend recommended (inclusive of tax thereon)
417 302
Transfer to Debenture Redemption Reserve
75 75
Transfer to General Reserve 0 0
Your Company’s Standalone revenue is lower compared to the previous year by 1.6% on account of the deflation in selling prices consequent to pass through to customers of the sharp reduction in the raw material prices during the year. On underlying basis however, the business grew during the year, albeit in single digit, impacted by the sluggish Indian economy and reduced FMCG off-take especially in the Cosmetic and Pharma categories. Your Company continued to develop new customers in order to mitigate the impact. Operating margin however expanded by 180 bps, helped by stable raw material prices and operational efficiencies. Further helped by 36.8% reduction in the Finance cost and the exceptional gain ̀ 453 mio arising from divestment of PIPL, your Company posted a Net profit of ` 1157 mio compared to ` 565 mio during the previous year. Exclusive of the exceptional item, the Standalone Net profit for the year is ` 704 mio, representing a healthy growth of 24.6% over the previous year despite higher effective tax rate on account of your Company’s unit in Nalagarh, Himachal Pradesh getting out of the tax benefit period.
REVIEW OF MARKET, BUSINESS AND OPERATIONSYour Company is a leading manufacturer globally of Laminated Plastic Tubes and laminates. Its products are extensively used in packaging of products across categories such as Beauty & Cosmetics, Pharma & Health, Foods, Home and Oral care. The FMCG and Pharma industry which consume the Company’s products has been a high growth industry and is expected to sustain growth in future. In the mature markets of Europe, USA and Japan, the FMCG sector is witnessing introduction of new Beauty care products such as Anti-Ageing, Beauty Balms, Complexion Correction creams, Hair colorants, cosmetic and therapeutic toothpastes etc. which brings new growth
opportunity for your Company. In the emerging markets such as India, China and Far East, the FMCG usage is expanding helped by increasing disposable income, growing youth population, expansion of modern retail/e-tail and increasing aspiration to look and feel good. The Pharma demand too is buoyed by increasing life expectancy, growth of generics and “health for all” policies pursued globally by governments and the NGOs. Your Company as an established player providing innovative packaging solutions for products in paste/cream/gel forms, is in a sense firmly entrenched in the FMCG / Pharma space with its scale, global reach and innovation/ technology capability. In addition to benefitting from growth in brands traditionally packed in tubes, the Company is also actively involved in seeking to replace packaging forms such as bottles and tottles in case of a number of brands with the technological edge that the Company has been able to bring about in the laminated tubes.
India StandaloneIndia Standalone accounted for 34% of the Company’s Consolidated Sales during the year. The Company enjoys a massive franchise in India, having pioneered the laminated tubes over the last three decades. The Customer portfolio encompassing reputed FMCG and Pharma brands - Indian and MNC, mass and niche, established and new, continues to expand. The sluggish macro-economic conditions in India impacted off-take of the Company’s products during the year specially in the non-oral care categories of Beauty and Cosmetics. In the pharma category, some of the customers’ off-take was affected by issues they faced in the export markets. Your Company continued to develop new customers as a means to mitigate the impact of the off-take reduction. With the various initiatives launched by the Government, your Directors are hopeful the economy and hence the India business will be back to days of robust growth. Green shoots of growth seem to be appearing since the last quarter of the year, and your Company is evaluating capacity expansion backed by customer contracts. Meantime, your Company has been pursuing efficiency and productivity improvement programs at its various units and seeking to drive product /process quality as a key competitive strength. Further to upgrading the laminate manufacturing facility in the previous year, your Company has upgraded the blown film facility and created new capability for decoration this year. Research and Development is core to your Company’s business, helping create new laminate structures and packaging

16
Annual Report 2015-16
solutions to address the complex packaging needs of different products. During the year, the Department of Scientific and Industrial Research, New Delhi (DSIR) accorded recognition to your Company’s R&D facilities. Besides the honor it confers on the Company’s Research capability passionately built over the three decades of its existence, it also entitles your Company to claim the tax deduction in respect of the R&D spend. Exports to markets in South Asia, Middle East and Africa continue to be pursued as a strategy to gain presence in the smaller markets which are not viable for a full-fledged manufacturing set up. Your Board is of view that India growth story remains intact, notwithstanding the recent economic sluggishness, and your Company is well positioned to seize the opportunity that the Indian market will present in the months and years to come.
Subsidiaries, Joint Ventures and AssociatesBeing a global player in the laminated and plastic tubes, your Company has manufacturing and trading presence in eleven other countries through its direct and step down subsidiaries, joint venture and associate. All these subsidiaries / joint venture / associate continue to work closely with the customers and grow their business with product offerings relevant to their respective markets. During the year, all of the operating subsidiaries posted profits, except the subsidiaries in Mexico and Russia which suffered on account of adverse currency movement during the first half of the year. However, helped by improved volumes and pro-active pricing, these subsidiaries have turned profitable in the later part of the year. In alignment with your Company’s strategy to grow in the high value non-oral care categories by offering specialty laminated tubes in place of the plastic /aluminum tubes and bottles, all these entities have set up manufacturing and marketing capability and intensified customer engagement. Your Directors are pleased to inform that the regions like East Asia Pacific and Americas which historically had oral care category accounting for 90% or more of their sales, are deriving close to 30% of their sales from the non-oral care category. Considering the huge size of the non oral care category market in these geographies and the disruptive nature of the packaging solutions that your Company has introduced, the Board expects these subsidiaries to post sustained profitable growth. It may be recalled that your Company’s Poland operations turned profitable during the previous year, and today heads the pack in terms of growth. Company’s joint venture in Germany and associate company
in Indonesia continued to be profitable during the year. The development at these entities and the markets they operate in are further discussed in the Management Discussion and Analysis (MDA) forming part of this report. The salient features of the financial statements of these subsidiaries, associate and joint venture in the prescribed form is attached as part of your Company’s audited financial statements.
During the year under review, your Company divested its wholly owned Indian subsidiary, Packaging India Private Limited which was engaged in flexible laminate operations targeting the Indian market. Your Directors believe this will free your Company to focus on and pursue growth opportunities in its tubing operations which shows great promise across the globe in the Beauty & Cosmetics, Pharma & Health and Food categories. Consequent to the said divestment, Packaging India Private Limited ceased to be your Company’s subsidiary with effect from July 13, 2015. Further, as part of reducing the tiers in the holding structure, Packtech Limited, Mauritius, a step down subsidiary was amalgamated with your Company’s direct subsidiary Lamitube Technologies Limited, Mauritius in January 2016, and consequently ceased to exist. With a view to driving export led growth in Latin America, a new step down subsidiary by name Essel Colombia S.A.S was incorporated during January 2016 to set up operations from a new factory. The prescribed particulars of the subsidiaries, Joint venture and Associate are set out in Form MGT9 forming part of this Report as Annexure 5.
The consolidated financial statements presented by the Company include the financial results of all its subsidiaries, joint venture, and Associate. The Audited financial statements of these entities have been reviewed by the Audit Committee and the Board.
CONSOLIDATED FINANCIAL STATEMENTSIn compliance with the SEBI (Listing Obligation and Disclosure Requirements) Regulations 2015 (the Listing Obligation or Listing Agreements), Consolidated financial statements of the Company and its subsidiaries, associates and joint venture, has been prepared as per the applicable accounting standards. The audited Consolidated financial statements along with the auditors' report thereon form part of the Annual report.

17
MANAGEMENT DISCUSSION AND ANALYSISThe Management discussion and analysis (MDA) report for the year under review, of the operations of your Company and all of its subsidiaries, associate and joint venture is given in a separate section of this Annual Report and forms part of the Directors’ Report.
CORPORATE GOVERNANCEThe Company is committed to maintaining highest standards of corporate governance aligned with the best practices. Pursuant to applicable provisions of the SEBI (Listing Obligation and Disclosure Requirements) Regulation 2015 (the Listing Regulations or Listing Agreements), a detailed report on Corporate Governance forms part of this Annual Report. The Company is in compliance with the various requirements and disclosures that have to be made in this regard. A certificate from the Auditors confirming compliance of the conditions of Corporate Governance as stipulated under the Listing Regulations forms part of the Annual Report for this year.
DIVIDENDYour Directors are satisfied that with various initiatives undertaken over the last few years, your Company continues to be on the path of profitable growth. The debt servicing capability has improved too as has the Company’s credit rating in respect of debt.
Considering the cash requirement for business growth and debt servicing, the Board advocate a policy of steady dividend payout within a band of 20-25% of the consolidated Net profit subject to statutory provisions, applicable dividend tax and unforeseen exigencies. The Board believes this will serve the interests of the shareholders especially those dependent on regular income. Accordingly, your Directors recommend a dividend of ` 2.20 per equity share of face value of ` 2 each, for the financial year ending on March 31, 2016 (previous financial year: `1.60 per share of face value of ` 2 each).
TRANSFER TO RESERVESPursuant to the guidelines requiring creation of Debenture Redemption Reserve (DRR) to the extent of 25% of the value of listed debt securities issued, your Company has during the year under review transferred a sum of ` 75 mio to DRR in relation
to the listed debt securities issued and outstanding of ` 900 mio. There is no specific statutory requirement to transfer any sum to General reserve in relation to the payment of dividend.
FINANCE AND ACCOUNTSYour Company continued to reduce financial leverage and the finance cost by enhancing capital productivity and improving cash generation. Working capital continued to be a focus area. Receivables, inventories and other working capital parameters were kept under strict check through continuous monitoring. The proceeds received from divestment of flexible packaging operations were used to pre-pay high cost loans and further improve liquidity. Reflecting the improved financial strength during the year under reporting, the Credit Analysis & Research Limited “CARE” has upgraded the credit rating assigned to the Company’s Long term facilities from CARE A to CARE AA- and the Short term Bank facilities from CARE A2+ to CARE A1+. India Ratings & Research (A Fitch Group Company) has issued Long Term Issuer Rating of IND AA and Commercial Paper Rating of IND A1+.
Forex exposures continued to be closely reviewed and appropriately hedged in order to minimize risk to the results during a year when the currency volatility was very high.
The divestment of PIPL and re-organisation in subsidiaries have been given effect in the Standalone and Consolidated financial statements as per applicable Accounting standards and approvals.
As regards the matter reported under clause (iii) of the Annexure to the Independent Auditors’ report on the India Standalone accounts, the Company is in discussion with the borrower and has taken reasonable steps for recovery.
STATUTORY AUDITORSThe members at the 31st Annual General meeting held on July 09, 2014 had appointed M/s. MGB & Co. Chartered Accountants (subsequently converted into Limited liability partnership under the name and title M/s MGB & Co. LLP) as Statutory Auditors of the Company to audit financial accounts for the financial years 2014-15, 2015-16, and 2016-17 subject to ratification by the members annually.
M/s. MGB & Co. LLP, Chartered Accountants have confirmed their eligibility under section 141 of the Companies Act 2013 and the related Rules to continue as the statutory auditor of the Company for the financial year 2016-17.

18
Annual Report 2015-16
Your Directors propose ratification of appointment of M/s. MGB & Co. LLP, Chartered Accountants as the Statutory Auditors of the Company to audit accounts for the financial year 2016-17.
SECRETARIAL AUDITPursuant to the provisions of section 204 of the Companies Act, 2013 (the Act), M/s. D. M. Zaveri & Co., Practicing Company Secretary (CP No. 4363), have been appointed to undertake the secretarial audit of the Company for the year ended on March 31, 2016. The secretarial audit report forms part of this Report as Annexure 1. The said report does not contain any qualification, adverse remarks or disclaimer.
COST AUDITORSPursuant to section 148 and applicable provisions of the Companies Act 2013 and the Companies (Cost Records and Audit) Rules 2014, the Company is required to appoint cost auditor for audit of cost records maintained by the Company in respect of the year ending March 2017. Your Directors have on the recommendation of the Audit committee, appointed M/s. R Nanabhoy & Co., Cost Accountants, as the Cost Auditor to audit the cost records for the financial year ending March 31, 2017. Remuneration payable to the Cost Auditor is subject to approval by the members of the Company. Accordingly, a resolution seeking members’ approval for the remuneration payable to M/s R. Nanabhoy & Co, Cost Accountants, is included in the Notice convening the Annual General Meeting, along with relevant details, including the proposed remuneration.
DIRECTORS AND KEY MANAGERIAL PERSONNELIn accordance with the provisions of section 152(6) of the Act and the Articles of Association of the Company, Mr. Atul Goel, Director is liable to retire by rotation at the ensuing Annual General Meeting (AGM), and being eligible, offers himself for re-appointment. The Board recommends his re-appointment.
All the Independent Directors have given declarations that they meet the criteria of independence as laid down under Section 149 of the Companies Act 2013 and the Listing Regulations.
Further details on the Directors including remuneration, remuneration policy, criteria for qualification, independence, etc. are given in the Corporate Governance Report, which forms part of this Annual Report.
Mr. Tapan Mitra, Independent Director resigned from the Board with effect from February 25, 2016 for health reasons. The Board of Directors place on record their deep appreciation for the valuable contribution made by Mr. Mitra during his tenure as Director.
During the year, Mr. Ajay Thakkar, Head–Legal and Company Secretary, resigned to pursue a career outside of the Company. The Board appointed Mr. Suresh Savaliya in his place as Head – Legal and Company Secretary.
DIRECTORS’ RESPONSIBILITY STATEMENTTo the best of their knowledge and belief and according to the information and explanations obtained by them, your Directors make the following statements in terms of Section 134(3)(c) of the Companies Act, 2013:
a) that in the preparation of the annual financial statements for the year ended March 31, 2016, the applicable accounting standards have been followed along with proper explanation relating to material departures, if any;
b) that such accounting policies as mentioned in note 2 of the Notes to the Financial Statements have been selected and applied consistently and judgment and estimates have been made that are reasonable and prudent so as to give a true and fair view of the state of affairs of the Company as at March 31, 2016 and of the profit of the Company for the year ended on that date;
c) that proper and sufficient care has been taken for the maintenance of adequate accounting records in accordance with the provisions of the Companies Act, 2013 for safeguarding the assets of the Company and for preventing and detecting fraud and other irregularities;
d) that the annual financial statements have been prepared on a going concern basis;
e) that proper internal financial controls were in place and that the financial controls were adequate and were operating effectively;
f) that systems to ensure compliance with the provisions of all applicable laws were in place and were adequate and operating effectively.

19
AUDIT COMMITTEEAudit Committee of the Board has been constituted in terms of Listing Regulations and section 177 of the Companies Act 2013. Constitution and other details of the Audit Committee are given in Corporate Governance Report.
PERFORMANCE EVALUATIONThe Board has carried out the annual evaluation of its own performance, and of each of the directors individually, including the independent directors, as well of the working of its committees. The manner in which the evaluation has been carried out has been explained in detail in the Corporate Governance Report, which forms part of this Annual Report.
FAMILIARIZATION PROGRAMMESThe Company’s policy on programmes and measures to familiarize Independent Directors about the Company, its business, updates and development includes various measures viz. issue of appointment letters containing terms, duties etc., management information reports, presentation and other programmes as may be appropriate from time to time. The Policy and programme aims to provide insights into the Company to enable independent directors to understand the business, functionaries, business model and others matters. The said Policy and details in this respect is displayed on the Company’s website.
CORPORATE SOCIAL RESPONSIBILITYAs a part of its Corporate Social Responsibility (CSR) initiative, the Company has undertaken CSR projects and programs. Thrust areas for CSR include care and empowerment of the underprivileged or differently abled persons, education, health and environment and sanitation. These activities are in accordance with CSR activities as defined under the Act. The Company has a CSR Committee of Directors. Details about the Committee, the CSR activities and the amounts spent during the year, as required under section 135 of the Act and the related Rules are given in the CSR Annual Report as Annexure 2 forming part of this Report.
The Company has framed a CSR Policy in compliance with the provisions of the Act and the same is placed on the Company’s website www.esselpropack.com. The CSR Policy lays down areas of activities, thrust area, types of projects, programs, modes of undertaking projects/programs, resources etc.
Your directors are pleased to report that the Company’s subsidiaries overseas also actively give back to the society in their respective geographies through various initiatives on the health, education and other fronts.
LOANS, GUARANTEES AND INVESTMENTSDetails of loans, guarantees and investments covered under applicable provisions of section 186 of the Act are given in the note 36 to the Standalone financial statements.
RELATED PARTY TRANSACTIONSAll contracts/ arrangements/transactions entered by the Company during the financial year with related parties were on an arm’s length basis and in the ordinary course of business. All related party transactions are placed for approval before the Audit Committee and also before the Board wherever necessary in compliance with the provisions of the Act and Listing Regulations. During the year, the Company has not entered into any contracts /arrangements/transactions with related parties which could be considered material in accordance with the policy of the Company on material related party transactions or under section 188(1) of the Act. Accordingly, there are no particulars to report in form AOC 2.
Details of the related party transactions during the year as required under Listing Regulations and Accounting standards are given in note 35 to the Standalone Financial statements.
The policy on dealing with the Related Party Transactions including determining material subsidiaries is posted in investors / corporate governance section on the Company’s website or link, http://www.esselpropack.com/wp-content/uploads/2015/03/Related-Party-Transaction-Policy.pdf
HUMAN CAPITALRelations with employees across all the offices and units continued to be cordial. HR policies of the Company are focused on the developing the potential of each employee. With this premise, a comprehensive set of HR policies are in place, aimed at attracting, retaining and motivating employees at all levels. Your Company had 1093 employees as of March 31, 2016.
The statement containing particulars of employees as required under Section 197(12) of the Companies Act, 2013 read along with Rules 5(2) and 5(3) of the Companies (Appointment and

20
Annual Report 2015-16
Remuneration of Managerial Personnel) Rules, 2014 is annexed herewith as Annexure 3(a) and forms part of this Report.
The ratio of the remuneration of each Director to the median employee’s remuneration and other details in terms of Section 197(12) of the Companies Act, 2013 read along with Rule 5(1) of the Companies (Appointment and Remuneration of Managerial Personnel) Rules, 2014, is annexed herewith as Annexure 3(b) and forms part of this Report.
EMPLOYEE STOCK OPTIONSThe Nomination and Remuneration Committee of the Board of Directors (“the Committee”) of the Company, inter alia, administers and monitors the Employee Stock Option Scheme 2014 (“ESOS 2014” or ”Scheme”) of the Company in accordance with applicable SEBI regulations.
The disclosure relating to the Scheme and other relevant details are posted in investors>corporate governance section on the Company’s website or link, http://www.esselpropack.com/corporate-governance/
During the year under review, the Nomination & Remuneration Committee at its meeting held on October 29, 2015, granted 1,76,535 stock options to eligible employees of the Company and its Subsidiaries. These options when vested as per the terms and conditions of the Scheme entitle the option holder to apply for and be allotted equal number of equity shares of face value of ` 2/- each at an exercise price of ` 161 per share being the closing market price of the equity shares of the Company on the National Stock Exchange of India Limited as on October 28, 2015. Since the Options have been granted at the market price, the intrinsic value at grant is Nil and hence there is no charge to the Profit and Loss account. These options will vest in a phased manner over a period of 2 years beginning 2017, and may be exercised within maximum of four years from the date of vesting, subject to terms and conditions of the said Scheme and the grant letter. Your Directors believe this Scheme will help create long term value for shareholders and operate as long term incentive to attract and retain senior managerial talent. For the sake of clarity, this Scheme does not extend to any of the Directors and Promoters of the Company.
ENERGY, TECHNOLOGY & FOREIGN EXCHANGEThe information on conservation of energy, technology absorption and foreign exchange earnings and outgo stipulated under Section 134(3) of the Companies Act, 2013 read with Rule
8 of the Companies (Accounts) Rules, 2014, is annexed herewith as Annexure 4 and forms part of this Report.
OTHER INFORMATION / DISCLOSURESThere are no significant material orders passed by the regulator, courts or tribunal which would impact the going concern status of the Company and its future operation.
There have been no material changes and commitments affecting the financial position of the Company, occurred between end of financial year and date of this Report.
In accordance with section 134(3)(a) and section 92(3) of the Act, an extract of the annual return as at March 31, 2016 in form MGT 9 forms part of this Report as Annexure 5.
The Company has in place a policy against sexual harassment at work place in line with the requirements of the concerned statute. Internal complaint committees are set up in this respect. There was no complaint received from any employee during the year, nor any complaint remains outstanding for redressal as on March 31, 2016.
VIGIL MECHANISM / WHISTLE BLOWER POLICYThe Company has a whistle blower policy laying down a vigil mechanism to deal with instances of unethical behavior, fraud or mismanagement. The said policy has been explained in the Corporate Governance Report and also displayed on the Company’s website www.esselpropack.com
INTERNAL FINANCIAL CONTROLThe Company has a proper and adequate Internal Financial Control System, to ensure that all assets are safeguarded and protected against loss from unauthorized use or disposition and the transactions are authorized, recorded and reported correctly.
The Internal Financial control is exercised through documented policies, guidelines and procedures. It is supplemented by an extensive program of internal audit conducted by in house trained personnel and external firms of Chartered Accountants appointed by the Audit Committee and the Board. The audit observations and corrective action, if any, taken thereon are periodically reviewed by the Audit committee to ensure effectiveness of the Internal Financial Control System. The

21
internal financial control is designed to ensure that the financial and other records are reliable for preparing financial statements and other data, and for maintaining accountability of persons.
During the year as part of control assurance process, the financial controls were comprehensively reviewed by an independent agency using the COSO framework, and reported to be satisfactory in design and operational effectiveness.
RISK MANAGEMENTThe Company has laid down a well-defined risk management mechanism covering the risk mapping and analysis, risk exposure, potential impact and risk mitigation measures. A detailed exercise is carried out every year to identify, evaluate, manage and monitor the principal risks that can impact the Company’s ability to achieve its strategic and financial objectives. The Board periodically reviews the risks and suggests steps to be taken to control and mitigate the same through a properly defined framework. Details on the risk elements which the Company is exposed to are covered in the Management Discussion and Analysis which forms part of this Report. The Company has formally framed a Risk Management Policy to identify and assess the key risk areas, monitor and report compliance and effectiveness of the policy and procedure. The Risk management committee under the chairmanship of an independent director oversees the risk management process.
AMALGAMATIONThe Audit Committee and the Board of the Company at a meeting held on October 29, 2015, have approved the Scheme of Amalgamation of the Company with its holding company Whitehills Advisory Services Private Limited (Whitehills) as per the Draft Scheme of Amalgamation placed before them.
Pursuant to the proposed amalgamation of Whitehills with the Company, the shareholders of Whitehills would directly hold shares in your Company. This would help in simplification of the holding structure and reduction of shareholding tiers. There would be neither any change in the capital structure nor any change in the promoter shareholding of the Company and there will be no dilution for any public shareholders.
The aforesaid Scheme of Amalgamation shall be subject to requisite approvals of the Shareholders, the Hon’ble High Court of Bombay and other statutory / regulatory authorities, as may be applicable. A Court convened meeting of the members is being scheduled in this regard as per direction from the Bombay High Court. The Company has received observation letter from National Stock Exchange of India Limited and BSE Limited. Necessary details and documents including the scheme, observation letters received from stock exchanges etc are posted on website of the Company.
PUBLIC DEPOSITSYour Company has not accepted any fixed deposits from the public and there are no outstanding fixed deposits from the public as on March 31, 2016.
CAUTIONARY STATEMENTStatements in this Report and the Management Discussion and Analysis may be forward looking within the meaning of the applicable securities laws and regulations. Actual results may differ materially from those expressed in the statement. Certain factors that could affect the Company’s operations include increase in price of inputs, availability of raw materials, changes in government regulations, tax laws, economic conditions and other factors.
APPRECIATIONYour directors wish to place on record their sincere thanks and appreciation to all our customers, suppliers, banks, authorities, members and associates for their co-operation and support at all times, and to all our employees for their unstinted contribution to the growth and profitability of your Company’s business, and look forward to continued support.
For and on behalf of the BoardEssel Propack Limited
Sd/-Subhash Chandra
Chairman
28 April 2016. Mumbai

22
Annual Report 2015-16
Management Discussion and AnalysisYour Directors are pleased to present the Management Discussion and Analysis for the year ended March 31, 2016.
BUSINESS OVERVIEWYour Company’s business is an integral part of the FMCG and Pharma space, packaging being one of the four key marketing mix that drives the growth of a brand. The FMCG business across categories of Beauty and Personal care, Foods, Home care, Oral care constitute globally a multi-trillion dollar market and continues to grow in many different ways. In the developing economies, the growth is powered by increasing young population, growing disposable income, life-style changes etc. In developed economies where penetration and usage are already high, new products addressing even more needs are emerging to expand and/or change the face of the market, as for e.g. applications like Anti-ageing creams, Beauty balms, Complexion creams, Hair grooming range etc. are driving consumption. Besides, there is also a strong trend among brands to improve the efficacy of products by incorporating newer and more potent actives, herbal ingredients etc. which often demands different and more effective barrier properties of the packaging. Such Customised barrier properties are offered by your Company to suit different products that get filled in the tubes. The increasing competition in FMCG space and the rapid growth of organized retail trade means the consumer gets the ‘First Moment of Truth’ at the point of sale viz. the shop shelf. Packaging therefore is not anymore a vehicle to merely hold the product - a cost that has to be managed; it is a key brand property that represents value to brand owner.
That is where your company fits snugly in the scheme of things. A range of FMCG and pharma products in viscous form such as pastes, gels and creams use tube as a packaging format. The world market for tubes is huge, about 36 billion in the markets your Company operates. Of this, oral care tubes account for 14 billion, Beauty & Cosmetics account for 12 billion and Pharma & others account for 10 billion. Tubes for Beauty & Cosmetics applications are pre-dominantly extruded Plastic tubes and bottles, and those for Pharma are pre-
dominantly Aluminum tubes. The non oral care tube market
represents much higher, thrice or more in value as compared
to oral care tube. Having established global leadership with its
laminated tubes for the oral care category, your Company is
now pursuing a considerably bigger growth opportunity in the
non oral care category by leveraging customer insight, polymer
and decoration technology, global presence and state of art
equipment capability to offer a superior packaging solution
in the form of its new generation laminated tubes in place of
the plastic/aluminum tubes and bottles. It is thus not just the
sheer size and growth in the FMCG sector that is powering
your Company’s growth potential, but also the larger trend of
the packaging format migrating from plastic/aluminum tubes
and bottles to the new generation laminated tubes, that your
Company has heralded. The FMCG sector is looking for tubes
which can resonate the product functionality in their own look
and feel, which can provide barrier for long term efficacy and
freshness, provide speed to market, and help the cause of
reducing carbon footprint; in short a dependable ambassador
for their product, a medium to connect with Consumer right
from the retail shelf. And your Company is positioned right
there with its products.
In the case of pharmaceuticals, use of aluminum tubes for
packaging is going out of favour for reasons of concerns on
product safety. High barrier, safe laminated tubes with features
such as tamper evidence, anti-counterfeit and innovative
dispensing, now offered by your Company is finding wide
acceptance as a superior packaging format.
Categories such as Foods and Home care, for a range of products
such as condensed milk, Wasabi sauce, Cheese spread, glue /
adhesives etc., are now seeing tubes as an attractive packaging
format and a value enhancer as compared to bottles etc.
OPERATIONAL PERFORMANCE REVIEWDuring FY 16, your Company’s consolidated revenue was ` 21.8 bio. The operating margin expanded by 220 bps to 13.6%

23
and the Operating profit grew by 12.3% to ` 3 bio. Key factors contributing to this are:
l A strong performance by Europe with an underlying sales growth of 24.8%.
l Strong value growth in the Americas , led by US laminated tube and the Colombian operations.
l A robust 24.3% growth in the non oral care sales in the EAP.
l Expansion of sales to non-oral care category, which accounted for 41.8% of sales during the year.
l Improvement in asset productivity and sharply lower finance cost driven by strong cash flows.
l Strong customer engagement leading to new business with existing and new customers.
The operating performance has been analysed by business segments below.
SEGMENT PERFORMANCE REVIEWYour Company’s business is in plastic packaging materials. The business is managed by four geographical segments viz.
1. Americas (with operations in the USA, Mexico and Colombia)
2. Europe (with operations in the UK, Germany, Poland and Russia)
3. AMESA - Africa, Middle East & South Asia (with operations in Egypt and India )
4. EAP - East Asia Pacific (with operations in China, Philippines & Indonesia)
Segment Financial HighlightsThe table below sets out the segment financial highlights for the year:
(` in million)
Particulars FY ended March 31, 2016
FY ended March 31, 2015
Growth
Revenue:
Americas 4719 4782 -1.3%
Europe 4046 3585 12.9%
AMESA 8842 10974 -19.4%
AMESA excl divested business
8342 8459 -1.4%
EAP 5459 5338 2.3%
(` in million)
Particulars FY ended March 31, 2016
FY ended March 31, 2015
Growth
PBIT:
Americas 594 486 22.2%
Europe 228 186 22.6%
AMESA 1337 1333 0.3%
AMESA excl divested business
1319 1212 9%
EAP 867 688 26.1%
Developments in each of the regions are set out below:
AMERICASYour Company has a strong market presence in both North and South America. Laminated tubes constitute the main stay in all these markets. It has manufacturing presence in USA, Mexico and Colombia through wholly owned subsidiaries. During the year, the region as a whole grew the top-line on underlying basis after adjusting for sale price deflation on account of pass through of the raw material price reduction, and sharp devaluation in the Latin American currencies. Operating profit grew strongly helped by a 240 bps margin expansion.
The laminated tube unit in the USA continued to actively market your Company’s new generation laminated tubes to non oral care customers leveraging the new capability established during the previous year. Consequently the non oral-care share of its revenue improved by 212 bps over the previous year. The improved sales mix together with higher operating efficiency has helped the Unit .
With the capability on ground for cosmetic tubes using laminated technology, the operations of extruded plastic tube unit in USA were phased out through 2015 as part of strategy to drive growth in non-oral care through the new generation laminated tubes. Some of the existing plastic tube customers were migrated to the laminated tube solution and some are in the process. The equipments were re-deployed in Europe to meet the growth opportunity there. This to an extent impacted the revenue growth for the year.
The Mexico unit continued to be impacted by off-take issues at a key customer. Sharp currency devaluation during the first half year further impacted the pharma. During the year, the Unit has been ramping up the new non oral care contract for a prestigious MNC brand. This together with pro-active

24
Annual Report 2015-16
cost and efficiency management has helped the Unit to make the operations profitable in the second half. Overall, the Unit reduced its losses by 14% compared to previous year. Scaling up is the way forward and efforts are on to develop new customers and to expand volume share with existing customers.
The Colombian subsidiary sales grew strongly by 29% on underlying basis, helped by additional line commissioned during the year. The market in Colombia and the surrounding Andean region continues to be promising and is mainly in the high value non-oral care category. With a view to seizing the export market opportunity, further capacity expansion in the form of a new unit is under way. The unit grew its profit in double digit on underlying basis, although the sharp devaluation in currency has adversely impacted the reported profit figures.
EUROPEYour Company offers both laminated tubes and plastic extruded tubes in Europe. It has manufacturing presence in Poland and Russia through wholly owned subsidiaries and in Germany through a Joint venture. The Region as a whole delivered a high underlying growth in sales of close to 25% (after adjusting for Euro depreciation) and similar growth in EBIT.
The Polish unit continued to grow strongly, with both the laminated and extruded plastic tubes posting high double digit growth in sales. Investment was made during the year to augment capability for non-oral-care both in the laminated and the plastic tube format, the later was done through re-deployment of existing assets from the Americas. Strong customer engagement is opening further avenues for growth in both the oral and the non oral care categories. Strong operational performance has driven a robust growth in the profit. The unit now is flagship of your Company’s Europe operations.
The Russian operation is still relatively small. From a foreign exchange crisis impacted previous year, the Unit has bounced back with strong double digit growth in Sales and operating profit. Pro-active pricing, active management of customer portfolio and operational efficiencies have further helped the unit to break even from a situation of loss during the previous year.
Operational issues continue to hold back the German joint venture unit from delivering to its potential in terms of sales and profits. The recent investments not having been ramped
up have caused the profit to decline during the year. Your Company is extending help to the extent possible in terms of new customer wins and guidance on equipment productivity.
AMESA (Africa, Middle East & South Asia)During the year, the Company divested PIPL, the Indian subsidiary engaged in flexible laminate based products. Hence, the performance numbers exclusive of divested business have been provided in the table in order to make the comparison between years meaningful. During the year, the region as a whole grew the top-line on underlying basis after adjusting for sale price deflation on account of pass through of the raw material price reduction, and the operating profit, albeit in single digit.
As explained in the Director’s report, growth in the India tubing operation was adversely impacted by a sluggish economy, mainly in the non oral care category with reduced number of activities in the Beauty and Cosmetics, and export market related issues faced by Pharma. The unit has intensified new customer development, and is hopeful to see the demand pick up as the macro-economic conditions see a turnaround helped by government initiatives and good monsoons. The COCO model initiated couple of years ago is performing well and growing strongly.
Your Company’s unit in Egypt has seen a good growth in the non oral care category leveraging the new capability set up there. However, off-take issues at a key oral care customer have muted the topline growth to single digit. This together with the expiry of tax holiday has depressed the profit compared to the previous year.
AMESA will remain a key region where diverse opportunities will continue to be thrown up by the economic growth, and as a first mover your Company is fully geared to invest and benefit from it.
EAP (East Asia Pacific)Strong customer partnering and high quality servicing have helped the region to gain a high market share and build a large business in the Oral care category. But since last three years, this category especially has declined due to off-take issues at the key customers, although the Region has not lost the wallet share. The deflation in sale price as a result of pass through of raw material price reduction further impacted the reported

25
sales growth. However, the continued momentum in the growth of the non oral care category as well as the forays into niche oral care brands have helped the Region to post a modest single digit growth in sales. The non oral care share in revenue during the year increased by 500 bps to 27.1%, driven by a 24.3% of growth in sales over the previous year. Consequently the operating margin and the net profit improved strongly compared to the previous year. The new manufacturing unit set up in the East of China is steadily ramping up, and a number of prestigious cosmetic and niche toothpaste brands are actively engaged with the unit for potential sourcing.
The Philippine unit continued to contribute to your Company’s profits, with a large part of sales and profits arising from non-oral care category where the Unit has a long term contract.
The Indonesian unit is an Associate of your Company.
The region has a track record of operational excellence and a strong balance sheet. With the non oral care strategy gaining traction, the region should be back to growth path.
CONSOLIDATED FINANCIAL PERFORMANCE OVERVIEW
(` in million)
Particulars FY ended March 31,
2016
FY ended March 31,
2015
Increase/(Decrease)
%Net Sales/Income from operations
21847 23230 -6%
Net Sales/ Income from operations excluding divested business
21346 20715 3%
Profit from Operations before Other Income, Interest and Exceptional items
2969 2645 12.3%
Finance Cost (623) (794) -21.4%Profit before tax and exceptional item
2516 2006 25.4%
Net Profit for the year 1821 1406 29.5%EPS - Basic and Diluted 11.59 8.95 29.5%
As mentioned earlier, the reported sales growth is adversely impacted by the sale price deflation on account of pass through of raw material price reduction and sharp depreciation in euro and Latin American currencies compared to last year. Helped by stable raw material prices during the year, improved efficiencies and reduced finance costs, the net profit has grown by 29.5%
CREATIVITY AND INNOVATION (C&I)The Research and Development (R&D) function (a.k.a. Creativity and Innovation within the Company) has been one of the key drivers of your Company’s growth as a leading global player. Your Company’s C&I function has successfully amalgamated the evolving needs in the market place with its deep knowledge of the science and engineering to create tubes with special features, aesthetics and functionality. Your Company works to develop new packaging solutions for reputed brands, and partner the customers in rolling out globally. The C&I function continues to work on environment-friendly tubes, and new structures with customize barrier properties. A cross section of the latest innovated products of your Company are presented in the features section of the Annual Report. A structured C&I process ensures that the innovation pipe-line of the Company at all times is full and contributes to in good amount to the sales and profitability of your Company. The recognition by the Department of Scientific and Industrial Research of the Company’s R&D facilities in India is a key milestone achievement.
Your Company continues to protect the enormous intellectual property which its C&I function is creating. In this regard, your Company has filed till date as many as 130 patent applications in the different geographies in respect of the various inventions through its R&D activities, and has already been granted quite a few.
Your Company’s research and development efforts continue to win accolades in several forums and among customers across the globe.
FINANCECapital productivity continued to be the driving mantra, with new capex levels carefully managed across the operations so as to generate positive free cash flow. This together with the strategic divestment of the India flexible packaging business has paved way for a strong balance sheet and high financial flexibility. The resultant saving in the Finance cost has been substantial at ` 170 mio or 21.4% lower compared to the previous year. Prudent exchange risk management contained the exchange losses at ` 61 mio in a period of high currency volatility, large part of it being the premium paid on forward exchange contracts. Consequently, the consolidated net debt as at end of FY16 was ` 6441 mio and the standalone net debt ` 194 mio. With debt equity ratio less than one and high DSCR your Company’s term debt is rated in the AA bracket. The ROCE and ROE improved to 20.7% and 18.5% respectively.

26
Annual Report 2015-16
HUMAN CAPITALYour company strongly believes that ‘our people are our greatest assets’, they give your company its unique competitive edge. As a global organization, your company comprises of a diverse mix of people from different educational, cultural and geographic backgrounds who bring their unique inherent strengths to the organization.
Your company recognizes and nurtures their strengths through a structured Talent Management process focussed on capability building through customised Classroom Trainings, E Learning, Executive Coaching and Cross functional/cross geographical action learning projects. The process also ensures continuous talent availability, through Job rotations, Job enlargements, Cadre building programs, leveraging talent in various geographies for global roles. Case in point is the Global Quality and Processes lead based out of the Company’s US unit.
Your company is committed to continuously engaging its employees as key drivers for shareholder value creation. Customised Unit level and Manager level Employee engagement action plans have enabled your company to take positive steps in this journey. These actions helped the company to significantly improve the global Employee Engagement score from 61% of 66%, higher than the global average for the manufacturing sector with 14 out of 23 participating units scoring 65% and above, which is in the High Performance range and in the zone of best employers across the industry.
The year saw events specially designed to encourage employee participation in projects like “All Ideas Matter” to encourage widespread participation in generating and implementing improvement ideas on costs, efficiency, productivity, safety and work place areas. Employee morale was fostered through encouraging “appreciation sharing”. Employee Communication through Town halls, Leadership interactions and messages, focused Goal Setting, newsletters and interesting competitions continued to ensure consistent alignment with Company’s Vision and Mission. In particular, Mission 20-20-20 was widely cascaded. The alignment to this Mission is now total and this has been one of the key drivers of this year’s strong performance.
INFORMATION TECHNOLOGY (IT)Your company strongly believes in the power of IT and it continues to invest in best of breed infrastructure equipment and applications which enables seamless connectivity across
sites and thereby enabling effective and efficient collaboration across all of its global manufacturing sites. Keeping in pace with next wave of IT i.e. Social, Mobile, Analytics and Cloud (SMAC) technologies, which are redefining the IT landscape, your company has implemented various mobile based solutions like SAP Fiori, Dashboards & Analytics which allows users to do transactions and consume the information anytime & anywhere thereby reducing business cycle times. Currently under implementation is another cloud based solution Success Factors for Human Resource Management, which will enable the monitoring of complete life cycle of an employee from Hire to Retire much more efficiently. A Steering Committee comprising of the Corporate Leadership Team supervises the IT initiatives and IT effectiveness through regular monthly reviews.
INTERNAL CONTROL SYSTEMS AND ITS ADEQUACYYour Company has in place internal control systems and a structured internal audit process charged with the task of safeguarding the assets of your Company and ensuring reliability and accuracy of the accounting and other operational data. The internal audit department reports to the Audit Committee of the Board of Directors.
Your Company has a system of monthly review of business as a key operational control wherein the performance of units is reviewed against budgets and corrective action is initiated.
Your Company has in place a capital expenditure control system for authorizing spend on new assets and projects. Accountability is established for implementing the projects on time and within approved budget. This is overseen by the Investment Committee of the Corporate Leadership team.
The Audit Committee, the Statutory Auditors and the top management are regularly apprised of the internal audit findings, and regular updates provided at the Audit committee meetings of the Action taken on the internal audit reports. The Audit Committee of the Board consisting of non- executive independent Directors reviews the quarterly, half yearly and the annual financial statements of your Company. A detailed note on the functioning of the Audit Committee and of the other Committees of the Board forms part of the section on corporate governance in the Annual Report.
During the year, your Company carried out a detailed review of internal financial controls in the India unit using independent

27
experts. The findings were satisfactory and suggestions for improvement have been taken up for implementation.. Policy guidelines and SOPs continued to be updated where required to keep pace with business needs.
RISK MANAGEMENTThe Board of Directors and the Audit Committee of the Board review the business risks to which your Company is exposed and the mitigation plans. The senior management team led by Vice Chairman & Managing Director is responsible to manage risks pro-actively with appropriate mitigation measures and implementation thereof.
Key risks to which your Company is exposed include:
a) Escalation in raw material prices and impact for long term contracts
- Your Company has raw material cost escalation pass through clauses in its customer contracts which enables the prices to be revised periodically to reflect the variation in the material costs.
- Where possible, your Company continues to identify and establish alternate sources and equivalent materials in order to effectively manage the material costs as well as supply continuity.
b) Single Product dependency
- Being an essential consumer product and an item of daily use, tooth paste as a category still dominates your Company’s product range albeit to a much lesser extent than before. However, it also tends to have a stable demand in an adverse economic environment. Your Company’s engagement with all global majors in this category further fortifies its position.
- All the same, your Company is rapidly developing products / customers in the cosmetics, food and pharma categories with a view to maximizing value and tapping the benefits of a diversified portfolio. The share of non-oral care in your Company’s consolidated revenue today is 41.8% up from 41.1% in FY15. In India, this share of non oral care revenue is even higher at 49.2%.
- Laminated Tubes as a packaging form is being increasingly sought after by FMCG brands, and stands to benefit from replacement of plastic and aluminum tubes and bottles in the course of time.
- Scale, technology, integrated manufacturing process, innovation capability, operational efficiencies are other factors which further strengthen your Company’s competitiveness in the tubes space, as well as the ability to work as global partners for large multi-national customers.
c) Attracting and retaining talent
As with any other business, high demand for talent globally impacts employee turnover.
- Your Company addresses this to the best possible extent by being an empowering organization with professional management culture and maintaining a lean structure. Contemporary HR practices such as career planning, competitive remuneration, performance management system, performance linked variable pay, performance incentives, stock options, skills and competency training linked to Individual Development Plan are now well established in the business globally. Top talent is given the opportunity to move across functions and geographies. Employee engagement survey is carried out annually and the findings are used to further improve the work place and employee satisfaction.
d) Currency volatility
The global nature of operations exposes the Company to multiple currencies; fluctuations in exchange rates could affect your Company’s performance.
- Appropriate pass through clauses have been built into long term customer contracts in order to offset the impact on material cost due to exchange rate fluctuations. Prices get reviewed and revised in the event of significant currency movements. Your Company also has the policy of systematically hedging its trade and capital exposures using forward contracts. Wherever possible transactional currencies are aligned to the reporting currency in order to obviate exchange fluctuation impact.
e) Economic downturn
This could impact your Company’s markets, suppliers, customers and finances leading to business slow down, disruptions etc.
- Your Company’s products are linked to daily necessities of the consumers and their demand is not much impacted by the downturn.

28
Annual Report 2015-16
- Your Company pro-actively monitors the emerging trends in consumption and offers relevant solutions to its customers so as to stay ahead of the curve.
- Your Company also is focused on containing costs and improving efficiencies as a means to stay competitive.
- Proactive supplier and customer engagement is another way your Company seeks to minimize risk to business continuity.
f) Competition
This could put pressure on volume growth and pricing.
- Your Company focuses on superior quality, shorter lead time and high service level to keep the customer satisfaction high. Besides, its ability to be a one-stop shop for all customer needs, ability to support the customer across the globe and focus on efficiency and cost management help to sustain its position as a world-class provider of packaging solution.
g) Wage increases in the developing markets
This could impact costs and margins.
- Your Company is pro-actively using automation and asset productivity improvement as a means to contain the headcount and manage the employee costs.
OUTLOOKThe performance in the recent years of your Company’s business has been very encouraging. The strategy for growth is clear. The non-oral care category globally offers immense potential for your Company to sustain a profitable growth for next few years, and the track record of last few years gives us confidence. Your Company has been fast re-shaping its processes and aligning its people to this Vision and Mission of creating long term shareholder value. Global customers are seen to consolidate their sourcing and partner with global suppliers like your Company. Even more exciting is the long term growth opportunity presented by the cosmetics, hair and personal care FMCG brands moving from other packaging forms into laminated tubes. With its large scale, global presence, innovation capability and a motivated Human capital, your Company is well set to take on the task of delighting all its stakeholders.
CAUTIONARY STATEMENTStatements in this Annual report, particularly those which relate to management discussion and analysis, describing your Company’s objectives, projections, estimates and expectations may constitute “forward looking statements” within the meaning of applicable laws and regulations. Actual results may materially differ from those expressed or implied.
Revenue 2015
Europe
15%
Amer
icas
21
%
Amesa
46%
EAP 18%
Europe
18%
Amer
icas
22
%
EAP 21%
Amesa
39%
Revenue 2016

29
Corporate Governance Report
ESSEL’s PHILOSOPHY ON CORPORATE GOVERNANCECorporate Governance pertains to system, by which companies are directed and controlled, keeping in mind long-term interests of stakeholders. It refers to blend of law, regulations and voluntary practices, which enable the company to attract financial and human capital, perform efficiently and thereby perpetuate it into generating long-term economic value for its shareholders, while respecting and balancing the interests of other stakeholders and the society at large.
It aims to align interest of the Company with its shareholders and other stakeholders. The incentive for companies, and those who own and manage them, to adopt global governance standards, is that these standards will help them to achieve a long-term partnership with its stakeholders and achieve its corporate objectives efficiently. The principal characteristics of corporate governance are transparency, independence, accountability, responsibility, fairness and social responsibility.
A good governance process provides transparency of corporate policies and the decision making process and also strengthens internal systems and helps in building relationship with all stakeholders. We at Essel Propack believe in being transparent and we commit ourselves to adherence of good corporate governance practices at all times as we believe that good governance generates goodwill among business partners, customers and investors and helps the Company to grow.
Corporate Ethics
The Company adheres to the highest standards of business ethics, compliance with statutory and legal requirements and commitment to transparency in business dealings.
Code of Conduct for Board Members and Senior Management
The Code of Conduct highlights Corporate Governance as the cornerstone for sustained management performance, for serving all the stakeholders and for instilling pride of association.
The Code is applicable to all directors and senior management executives. The Code impresses upon directors and senior management to uphold the interest of the Company and its stakeholders and to endeavor to fulfill all the fiduciary obligations towards them. The Code is available on the Company’s website.
Company has received a declaration of compliance with the Code of Conduct from Directors and Senior Management Personnel. The declaration by the Managing Director affirming compliance of the Board of Directors and Senior Management Personnel to the Code of Conduct is appended to this Report.
Code of Conduct for Prevention of Insider Trading
The Company has adopted a ‘Code of conduct to regulate, monitor and report Trading by Insiders’ (the Code) pursuant to SEBI (Prohibition of Insider Trading) Regulations, 2015. The Code is applicable to all Directors and such Designated Persons as defined in the Code.
The detailed report on Corporate Governance for the year ended on 31 March 2016, under applicable provisions of the SEBI (Listing Obligations and Disclosure Requirements) Regulations 2015 (the Listing Regulations or Listing Agreements) is set out below.
1. BOARD OF DIRECTORS 1.1 Directors’ profile
The Board of Directors of the Company comprises highly renowned professionals drawn from diverse fields. They bring with them wide range of skills and experience to the Board which enhance the quality of the Board’s decision making process. Profile of the Directors are posted on website of the Company.
1.2 Board Procedure: With a view to follow transparency, the Board follows procedure of advance planning for the matters requiring discussion / decisions by the Board. The Board is

30
Annual Report 2015-16
given presentation covering finance, sales, major business segments and operations of the Company and other matters as members want. Agenda papers for the Board and committee meetings are finalized in consultation with concerned persons. The minutes of proceeding of each board meetings are maintained in terms of statutory provisions. Meetings of various committee meetings are held properly. The minutes of committee meetings are placed regularly before the Board.
The Agenda and notes to agenda for the meetings of the Board and Committees, together with relevant details, resolutions and documents are circulated in advance of the meeting. The Company follows practice to schedule dates of meetings for coming year or as possible. Meetings are largely held in attendance of
Chief Operating Officer, CFO and Company Secretary and other executives are also invited wherever necessary for discussion or inputs.
1.3 Composition of the Board, category, directorship etc.
The Board of the Company consists of 6 Directors as on 31 March 2016, of which 3 are Independent Directors, 2 are Non-executive and 1 Vice Chairman and Managing Director. Independent Directors are professional with specialization in their respective fields, having varied skills and expertise and not related to promoters of the Company. The Company is in compliance of the Listing Regulations and the Companies Act 2013 (the Act). The compositions of the Board and other details as on 31 March 2016 are as below.
Name of the Director CategoryNo. of
Directorship in other companies(1)
Position in outside Committees(2)
Chairman Member
Dr. Subhash Chandra Chairman, Non-executive 7 0 1
Mr. Mukund Chitale Independent Director 10 1 1
Mr. Boman Moradian Independent Director 1 1 1
Ms. Radhika Pereira Independent Director 5 1 3
Mr. Ashok Goel Vice Chairman & Managing Director 13 0 2
Mr. Atul Goel Non-executive 10 0 0
(1) Including private companies but excluding foreign companies, companies registered under section 8 of the Companies Act 2013, and alternate directorship.
(2) Represents Chairmanship / Membership of Audit Committee and Stakeholders Relationship Committees of other listed companies.
Dr. Subhash Chandra, Mr. Ashok Goel and Mr. Atul
Goel are related to each other. None of the other
Directors are related to any other Director on the
Board.
Mr. Ashok Goel held 3,20,760 equity shares and
Dr. Subhash Chandra held 89,305 equity shares in the
Company. Other directors are not holding any shares
in the Company.
No director of the Company held any options or
instrument convertible into shares of the Company.
1.4 Board Meetings and attendance
During the year under review, Board of Directors of the Company met seven times i.e. on April 28, 2015, July 13, 2015, July 30, 2015, October 29, 2015, January 07, 2016, January 21, 2016 and February 25, 2016. The agenda papers along with notes and other supporting were circulated in advance of the Board Meeting with sufficient information.
Directors’ attendance in Board Meetings held during the financial year and last Annual General Meeting are as under.

31
Name of Director No. of Board Meetings held /attended
Attendance at Last Annual General Meeting
Dr. Subhash Chandra 7/3 No
Mr. Mukund Chitale 7/7 No
Mr. Boman Moradian 7/6 Yes
Ms. Radhika Pereira 7/6 No
Mr. Ashok Goel 7/7 Yes
Mr. Atul Goel 7/5 Yes
Mr. Tapan Mitra * 7/1 No
* Resigned w.e.f. 25 February 2016 because of health reason.
1.5 Familiarization Programme
The Company’s policy on programmes and measures to familiarize Independent Directors about the Company, its business, updates and development includes various measures viz issue of appointment letters containing terms, duties etc, presentation and other programmes as may be appropriate from time to time. Periodic presentations are made at the Board and Committee meetings on business, performance updates of the Company, global business environment, business strategy and risk involved. The Policy and programme aims to provide insights into the Company to enable independent directors to understand the business, functionaries, business model and others matters. The Company’s Policy and other details in this respect is posted in investors section on the Company’s website or link, http://www.esselpropack.com
2. PERFORMANCE EVALUATION During the year, the Board conducted a formal annual
evaluation mechanism for evaluating its performance as well as that of its Committees and individual Directors, including the Chairman of the Board. The performance of the Committees was evaluated by the Board seeking inputs from the Committee members. The criteria to evaluate the performance of the Board, committees, independent Directors and non – independent directors were; a) Board Composition, size, mix of skill, experience, and role; b) attendance and deliberation in the meetings; c) contribution/suggestions for effective functioning, development of strategy, board process, policies and others. The Directors were satisfied with the evaluation results, which reflected the overall engagement of the Board and its Committees with the Company.
3. POLICY ON APPOINTMENT OF DIRECTOR, QUALIFICATION AND ATTRIBUTES
The Company’s policy on appointment of directors provides, inter alia, for criteria of qualification, experience and skills in relation to appointment for the position of director.
4. AUDIT COMMITTEE Audit Committee of the Board has been constituted
in terms of Listing Regulations and section 177 of the Companies Act, 2013.
The Audit Committee comprises of 3 members. All members of the Audit Committee are independent directors. The Committee met six times during the year on April 28, 2015, July 30, 2015, October 29, 2015, January 07, 2016, January 21, 2016 and March 28, 2016.
The Composition of the Audit Committee and attendance are as under.
Name of Member
CategoryNo. of Meetings
Held Attended
Mr. Mukund Chitale, Chairman
Independent Director
6 6
Mr. Boman Moradian
Independent Director
6 6
Mr. Tapan Mitra * Independent Director
6 1
Ms. Radhika Pereira @
Independent Director
1 1
* Mr Tapan Mitra was member of the Committee upto February 25, 2016.
@ Appointed as member w.e.f. February 25, 2016.

32
Annual Report 2015-16
Company Secretary of the Company acts as secretary to the Committee.
Audit Committee meetings are also attended by Chief Financial Officer, COO, representatives of the Statutory Auditor and Internal Auditor and other executives as required. The Committee also invites senior executives, where it considers appropriate, to attend meetings of the Audit Committee.
Terms of Reference and role of the audit committee includes the matters specified under the Companies Act, 2013 and SEBI (Listing Obligations and Disclosure Requirements) Regulations, 2015. Broad terms of reference includes: oversights of financial reporting process, review financial results and related information, approval of related party transactions, review internal financial controls and risk management, evaluate performance of statutory and internal auditors, audit process, relevant compliances, appointment and payments to statutory auditors.
5. NOMINATION AND REMUNERATION COMMITTEE
Nomination and Remuneration Committee of the Board (NRC) has been constituted in terms of the Listing Regulations and Section 178 of the Companies Act, 2013.
The Nomination and remuneration Committee comprises of 3 members. All the members of the Nomination and remuneration committee are independent directors. During the year under review, the Nomination and remuneration Committee met three times i.e. on April 28, 2015, July 30, 2015 and October 29, 2015. The Company Secretary acts as the Secretary to the Committee.
The Composition of the NRC and the attendance are as under.
Name of Member
CategoryNo. of Meetings
Held AttendedMr. Boman Moradian, Chairman $
Independent Director
3 3
Mr. Mukund M. Chitale
Independent Director
3 3
Mr. Tapan Mitra* Independent Director
3 1*
Ms. Radhika Pereira**
Independent Director
N.A. N.A.
$ Mr Boman Moradian was appointed as Chairman of the Committee w.e.f. February 25, 2016.
* Mr Tapan Mitra was member and chairman up to February 25, 2016. He could not travel to attend meetings because of health reason.
** Member w.e.f. February 25, 2016.
Terms of reference of the NRC includes the matters specified under the Companies Act, 2013 and the Listing Regulations. Broad terms of reference includes; formulation of remuneration policy, set criteria for determining qualifications, positive attributes and independence of a director, formulation of criteria for evaluation of independent directors and the Board and criteria for appointment of directors and senior management.
5.1 Remuneration of Directors
Details of remuneration, perquisites etc and sitting fees of Directors for the financial year ended on March 31, 2016 are as under.
Name of Director Category
` in lakhs
Commission or annual
remunerationSiting fees Total
Dr. Subhash Chandra Chairman, Non-executive Nil Nil Nil
Mr. Mukund Chitale Independent Director 15.00 3.40 18.40
Mr. Boman Moradian Independent Director 15.00 4.00 19.00
Ms. Radhika Pereira Independent Director 15.00 1.40 16.40
Mr. Tapan Mitra Independent Director 15.00 0.80 15.80
Mr. Atul Goel Non-executive Nil Nil Nil

33
Name of Director
CategoryRemuneration components, ` in lakhs
SalaryAllowance/ perquisites
Contribution to PF
Performance bonus
Total
Mr. Ashok Goel Vice Chairman & Managing Director
290.40 144.79 34.85 241.70 711.74
Period of appointment of Mr. Ashok Goel, Vice Chairman & Managing Director is for the period of five years w.e.f. October 21, 2013 and it can be terminated by either party giving three months’ notice to other.
Remuneration to Mr. Ashok Goel, Vice Chairman & Managing Director of the Company comprises of fixed pay, perquisites and variable pay as mentioned above. Performance bonus/variable pay is based on criteria including achievement of performance standards as per Remuneration policy of the Company.
Performance bonus of the vice chairman and managing director is as may be approved by the Nomination & Remuneration Committee and based on criteria including achievement of performance standards as mutually set out from time to time and as per Remuneration policy of the Company.
Commission as mentioned above payable to Directors is provided for the financial year 2015-16 and will be paid subsequently to the approval of financial statements.
5.2 Remuneration policy
The Board on the recommendation of Nomination and Remuneration Committee approved Remuneration Policy for Directors, KMP and senior management employees.
The policy describes various aspects and guiding factors while determining the remuneration to Directors, KMP and senior managerial personnel of the Company with intent to maintain level and composition of remuneration reasonable and sufficient to retain, motivate and promote talent and to ensure long term sustainability of talented managerial persons and also create competitive advantage. Broad provisions of the Remuneration Policy are summarized hereunder.
a) Nomination and Remuneration committee (NRC) has important role in monitoring the policy.
b) The Board, on the recommendation of NRC approves the remuneration payable to the Managing Director of the Company. The remuneration payable to the Managing Director shall be in accordance with the applicable provisions of the Companies Act, 2013, and the rules framed thereunder.
c) The Board, on the recommendation of the NRC approves the remuneration payable to the Key Managerial Personnel and Senior Management Personnel. The structure of remuneration payable to Key Managerial Personnel and Senior Management Personnel will be in accordance with the compensation framework adopted for employees generally by the Human Resource department of the Company.
d) The commission to the Non-Executive/Independent Directors is paid as per the Companies Act, 2013 and the rules framed thereunder.
e) The Commission will be distributed among non-executive independent directors as per criteria mentioned in this Report.
5.3 Criteria for payment to Non-executive / Independent Directors
Independent Directors are paid sitting fee of ̀ 20,000/– for each meeting of the Board or committee thereof. The Company also reimburses expenses incurred by the Directors for attending the meetings.
The remuneration by way of commission to the Non-Executive and independent Directors is decided, keeping in view the recommendations by NRC, based on number of factors including number of meetings attended by the Director during the year, contribution to the Board and Committees and involvement in the decision making.

34
Annual Report 2015-16
6. STAKEHOLDERS RELATIONSHIP COMMITTEE
The Stakeholder relationship Committee comprises of 2 members. The Chairperson of the committee is an Independent Director. During the year under review, the Stakeholders’ Relationship Committee met four times on April 28, 2015, July 30, 2015, October 29, 2015 and January 21, 2016.
The Composition of the above Committee and the attendance are as under.
Name of Member CategoryNo. of Meetings
Held Attended
Mr. Boman Moradian, Chairman
Independent Director
4 4
Mr. Ashok GoelVice Chairman
& Managing Director
4 4
Mr. Tapan Mitra*Independent
Director4 1
* Mr Tapan Mitra was member up to February 25, 2016.
During the year, two investor complaints were received and all the complaints have been resolved. No investors’ complaints were pending as on March 31, 2016.
Terms of Reference and role of the Stakeholders Relationship Committee includes the matters specified under the Companies Act, 2013 and SEBI (Listing Obligations and Disclosure Requirements) Regulations, 2015. Broad terms of reference includes; to consider and resolve the grievances of security holders of the Company, to redress the shareholders’ and investors’ complaints such as those relating to transfer of shares, non-receipt of annual reports, etc.
Mr. Suresh Savaliya, Head – Legal and Company Secretary has been appointed as compliance officer pursuant to the Listing Regulations. The designated e-mail for investor service and correspondence is [email protected]
7. OTHER COMMITTEES In addition to the above referred committees, the Board
has constituted committees of Directors and executives
to look into various business matters. These Committees includes corporate social responsibility committee and risk management committee. Details relating to corporate social responsibility committee are given in the Board’s report.
8 GENERAL BODY MEETINGS Detail of last three Annual General Meetings (AGM) are
given here below.
Year Date Time Venue
2012-13 09.07.2013 11.00 a.m. Registered office at P.O. Vasind,
Taluka: Shahapur, District: Thane, Maharashtra – 421604, India
2013-14 09.07.2014 11.00 a.m.
2014-15 30.06.2015 11.00 a.m.
The following are the special resolutions passed at the last three AGM.
Date of AGM Summary of special resolution passed
09.07.2013 Re-appointment and payment of remuneration to Mr. Ashok Goel as Vice Chairman & Managing Director w.e.f. October 21, 2013.
Resolutions passed through postal ballot
Following resolution was passed through postal ballot as provided under Section 110 of the Companies Act, 2013.
Special resolution under section 197, 198 and other applicable provisions of the Companies Act, 2013 for payment of Managerial Remuneration to Mr. Ashok Goel, Vice Chairman and Managing Director, through postal ballot notice dated October 29, 2015
a) The Board of Directors of the Company had appointed Mr. Dharmesh Zaveri of D M Zaveri & Co., Practicing Company Secretary, as the scrutinizer for conducting the postal ballot voting process in a fair and transparent manner.
b) The Company had completed the dispatch of the Postal Ballot Notice dated October 29, 2015 together with the explanatory statement on Wednesday, December 09, 2015, along with forms and postage prepaid business reply envelopes to all the shareholders whose

35
name(s) appeared on the Register of Members/list of beneficiaries as on Friday, December 04, 2015.
c) The voting under the postal ballot was kept open from 9.00 a.m. on Thursday, December 10, 2015 to 5.00 p.m. on Friday, January 08, 2016 (either physically or through electronic mode).
d) All postal ballots forms received/receivable on or before of close of working hours of January 08, 2016, the last date and time fixed by the Company for receipt of the forms, had been considered for scrutiny or voting purpose.
e) On Wednesday, January 13, 2016, the results of the postal ballot as per the Scrutinizer’s Report was announced and declared that the above special resolution was passed with requisite majority. 109,692,572 equity shares of ` 2 each/votes (99.95% of total votes polled) were in favour to the resolution and 55,936 equity shares of ` 2 each/votes (0.05% of total votes polled) were against the resolution.
9. DISCLOSURES a) During the year, there were no materially significant
transactions with related parties that may have potential conflict with the interests of the Company at large. Related Party transactions have been disclosed in the notes to financial statements and in Board’s Report. Policy on dealing with related party transactions is posted in section ‘Investors>corporate governance’ on the Company’s website or link www.esselpropack.com
b) The Company has complied with all applicable provisions of the SEBI (Listing Obligations and Disclosure Requirements) Regulations 2015 and other SEBI Regulations wherever applicable. No penalties have been imposed or stricture issued by SEBI, Stock Exchanges or any statutory authorities on matters relating to capital markets during the last three years.
c) The Company has a Whistle-Blower Policy for establishing a vigil mechanism to report genuine concerns regarding unethical behaviour and mismanagement, if any. No employee of the Company was denied access to the Audit Committee. Details relating to vigil mechanism are also mentioned in the Board’s Report.
d) The Company has complied with the mandatory requirements of the Corporate Governance of the Listing Regulations and also followed non-mandatory requirements relating to separate post of Chairman and CEO or Managing Director, sending of quarterly financial results to shareholders through emails and financial statements with unmodified audit opinion / without qualification.
e) The Company is in compliance with the provisions in relation to material subsidiary wherever applicable. Policy for determining ‘material’ subsidiary is posted in section of ‘Investors>corporate governance’ in the Company’s website or link www.esselpropack.com
f) There were no pecuniary relationships or transactions of non-executive directors vis-à-vis the Company during the year under review, except payment of sitting fees and remuneration.
g) Disclosure of commodity price risks and commodity hedging activities: The Company has price review mechanism to protect against material movement in price of raw materials.
10. MEANS OF COMMUNICATION a) Newspapers: The quarterly, half-yearly and annual
financial results of the Company are published in leading newspapers in India viz. Economics Times, DNA and Maharashtra Times.
b) News Release and Presentation: The Company also regularly releases press release to enable the stakeholders to appreciate the important developments and updates about the Company. News releases, presentations made to media, analysts, institutional investors, etc. are displayed on the company’s website www.esselpropack.com.
c) Website: The Company’s website www. esselpropack.com contains a separate dedicated section “Investors” and “Press Release” where shareholders information is available. Quarterly and annual financial results, annual report are also available on the website. Press releases made by the Company from time to time are also displayed on the website.
d) Annual Report: Annual Report containing, inter alia, Board’s report, auditors’ report, audited financial statements and other important information is

36
Annual Report 2015-16
circulated to members and others entitled thereto. The Annual Report is also available on website of the Company. Verbatim copy of financial statements, reports etc are circulated in this Report and the same shall be deemed as signed copy.
e) Website of the Stock Exchanges: Disclosures and filing with the BSE Limited (BSE) and National Stock Exchange of India Limited (NSE) by the Company are also hosted on website of the said stock exchanges.
f) Disclosures: The Company also informs by way of intimation to the Stock Exchanges all price sensitive matters or such other matters which in its opinion are material and have relevance to the shareholders.
11. GENERAL SHAREHOLDERS’ INFORMATION
a) Annual General Meeting is scheduled to be held on Friday, 17 June 2016 at 11:00 a.m. at the Company’s registered office at P.O.Vasind, Taluka Shahapur, Thane 421604.
b) Financial Year: The Company follows April to March as its financial year. The results for every quarter beginning from April are declared tentatively in the month following the quarter or within the time line as per Listing Regulations.
c) Record Date: Record date for the purpose including payment of dividend is given in Notes to Notice convening above mentioned Annual General Meeting.
d) Dividend Payment Date: Dividend will be paid within the stipulated period, after its declaration by the members at the AGM.
Dividend on Equity Shares when declared will be made payable after the AGM to those Shareholders whose names stand in the Company’s Register of Members on relevant dates of record date/book closure. In respect of shares held in electronic form/demat, the dividend will be paid on the basis of beneficial ownership as per details furnished by the depositories for this purpose.
e) Listing on Stock Exchanges: The Company’s equity shares are listed on the following Stock Exchanges.
National Stock Exchange of India Limited (NSE), Exchange Plaza, 5th Floor, Plot No. C/1, G Block, Bandra Kurla Complex, Bandra (East), Mumbai 400051.
BSE Limited (BSE), P. J. Towers, Dalal Street, Fort, Mumbai 400001.
Stock Code/Symbol: BSE – 500135. NSE – ESSELPACK. ISIN – INE 255A01020
Debt Securities: Listed on Wholesale Debt Market (WDM) Segment of BSE.
Series A: Scrip Code: 951429, ISIN: INE255A07514. Series B: Scrip Code: 951430, ISIN: INE255A07522
Debenture Trustees: Axis Trustee Services Limited, Axis House, 2nd Floor, Bombay Dyeing Mills Compound, Pandurang Budhkar Marg, Worli, Mumbai 400 025. Tel: +91 22 43255231 [email protected]
f) Payment of Listing Fees: the Company has paid annual listing fee for the year 2016-17 to BSE and NSE within time.
g) Market Price Data: The monthly high and low price of shares traded on the National Stock Exchange of India Limited (NSE) and the BSE Limited (BSE) are as follows:
Month & YearBSE (In `) NSE (In `)
High Low High Low
April 2015 137.60 119.00 137.70 118.35
May 2015 144.50 123.50 145.05 121.65
June 2015 134.00 121.00 133.95 121.05
July 2015 164.70 128.00 161.25 128.65
August 2015 168.30 135.00 168.40 133.10
September 2015 161.80 145.00 164.80 141.95
October 2015 167.00 151.70 168.30 152.00
November 2015 164.50 152.50 164.80 150.25
December 2015 162.50 150.00 172.00 148.45
January 2016 170.10 132.50 170.50 132.00
February 2016 164.90 135.55 165.00 133.00
March 2016 162.10 135.30 162.00 134.60

37
h) Performance of the Company’s stock price vis-a-vis Sensex / Index
i) Share Transfer System
Applications for transfer of shares in physical form are minimal and processed through the Company’s Registrar & Transfer Agent. The Share Transfer Committee constituted for transfer / transmission of shares, issue of duplicate shares and allied matters. The transfers of shares in physical form as and when received are normally processed within 15 days from the date of receipt of documents complete in all respects.
j) Distribution of Shareholding as on March 31, 2016
No. of equity shares No. of share holders % of share holders No. of Shares held* % of share holding
1 to 500 27399 80.82 2694711 1.72
501 – 1000 2979 8.79 2367874 1.51
1001 – 5000 2865 8.45 6062139 3.86
5001 – 10000 355 1.05 2553696 1.63
10001 and above 303 0.89 143422865 91.29
Total 33901 100.00 157101285 100.00
* Including 57,120 shares forfeited yet to be canceled / reissued and kept in separate folio.
0.0020 .0040 .0060 .0080 .00100 .00120 .00140 .00160 .00180 .00
0100020003000400050006000700080009000
Apr
2015
May
201
5
June
20
15
July
20
15
Aug
2015
Sept
20
15
Oct
201
5
Nov
201
5
Dec
201
5
Jan
2016
Feb
2016
Mar
201
6
Shar
e Pr
ice
NSE
Nif
ty
NSE Nifty v/s Share price
NSE Nifty Closing price Essel Propack Closing price
`
0.0020 .0040 .0060 .0080 .00100 .00120 .00140 .00160 .00180 .00
0
5000
10000
15000
20000
25000
30000
April
201
5
May
201
5
June
20
15
July
20
15
Aug
2015
Sept
20
15
Oct
201
5
Nov
201
5
Dec
201
5
Jan
2016
Feb
2016
Mar
201
6
Shar
e Pr
ice
BSE
Sens
ex
BSE Sensex v/s Share price
BSE Sensex Closing price Essel Propack Closing price
k) Dematerialization of equity shares and liquidity
As on 31 March 2016, 98.77% of the Equity Shares have been dematerialized.
Equity Shares of the Company are under compulsory demat trading by all investors. Considering the advantages of scripless / demat trading, shareholders are requested to consider dematerialization of their shares so as to avoid inconvenience in future.
l) Commodity price risk or foreign exchange risk and hedging activities.
Risks are associated with various forex exposures like translation, transaction, economic etc. the Company would have on risk on net import side. Import
Exposure includes Trade Payables, Trade Buyer’s Credit, Interest Payable, CAPEX Buyer’s Credit etc. and export exposure includes trade receivable, royalty receivable etc.
There are various financial instruments for hedging are available to mitigate these risks like Forward Cover, Options, and Derivative etc. Based on the risks involved in the hedging instrument, the Company is normally using Forward Cover as measure for mitigating the Forex Volatility.
m) Plant Locations: The Company has plants/units at
Vasind, Murbad, Wada, Chakan, Silvassa, Goa and
Nalagarh.

38
Annual Report 2015-16
n) Registrar & Transfer Agent and Address for
Communication
Registrar & Share Transfer Agent:
Bigshare Services Private Limited
E-2/3, Ansa Industrial Estate, Sakivihar Road, Saki Naka, Andheri (E), Mumbai – 400072. Maharashtra India. Tel No. 022 4043 0200, 28470652, Fax: 022 284 75207.
Appointment of said transfer agent is in process. View the Company’s website www.esselpropack.com for further detail or update.
Registered Office:
P.O. Vasind, Taluka Shahapur, Thane 421604, Maharashtra, Tel: +91 967 333 3971/9882 CIN: L74950MH1982PLC028947.
Corporate Office: Top Floor, Times Tower,
Kamala City, Senapati Bapat Marg, Lower Parel, Mumbai 400013. Tel: +91 22 2481 9000/9200. Fax: +91 22 24963137 [email protected], www.esselpropack.com
Investors Service and contact: Mr. Surje Singh, Sr. Manager – Legal & Secretarial at
corporate office as mentioned above.
In order to facilitate investor servicing, the Company has a designated email id: [email protected] for registering queries by investors.
o) Shares in suspense account
The Company during the year transferred 4 shares of 2 shareholders in the name of “Unclaimed Suspense Account”. The details of unclaimed equity shares and shareholders of the Company in unclaimed suspense account as on March 31, 2016 is mentioned below.
Aggregate number of Shareholders and the
outstanding shares in the suspense account as on
April 01, 2015
Number of shareholders who approached Company for transfer of shares from
suspense account
Number of shareholders to whom shares were
transferred from suspense account
Aggregate number of shareholders and the
Outstanding shares in the suspense account as on
March 31, 2016
3164 unclaimed shares 2 shareholder for 4 shares 2 shareholder for 4 shares 3160 unclaimed shares
The voting rights on the shares outstanding in the suspense account shall remain frozen till the rightful owner of such shares claims the shares or as per statutory provisions.
p) Corporate benefits
Details of corporate benefits issued by the Company are given below.
Dividend
Year % Year % Year %
1990-91 10% 1998-99 (Final) 34% 2005 (Special) 120%
1991-92 15% 1999-00 (Special) 150% 2006 (Interim)* 100%
1992-93 20% 1999-00 (Interim) 54% 2007 60%
1993-94 27% 2000-01 54% 2008 15%
1994-95 27% 2001 55% 2009-10 20%
1995-96 32% 2002 65% 2010-11 30%
1996-97 (Interim) 15% 2003 (Interim) 70% 2011-12 32.50%
1996-97 (Final) 30% 2003 (Final) 10% 2012-13 37.50%

39
DECLARATION IN RESPECT OF CODE OF CONDUCT In accordance with the SEBI (Listing Obligation and Disclosure Requirements) Regulation 2015, I hereby confirm and declare
that, all the Directors and the Senior Management personnel of the Company have affirmed compliance with the Code of Conduct of the Company laid down for them, for the financial year ended 31 March 2016.
28 April 2016. Mumbai
For Essel Propack Limited
Sd/Ashok Goel
Vice Chairman & Managing Director
Year % Year % Year %
1997-98 (Interim) 20% 2004 (Interim) 80% 2013-14 62.50%
1997-98 (Final) 32% 2004 (Final) 10% 2014-15 80.00%
1998-99 (Interim) 20% 2005 (Interim) 100%
* The face value of equity shares was subdivided from `10 to ` 2 with effect from 15th June, 2006.
Rights Shares (Price inclusive of premium)
YearFace
Value (`)Ratio Price (`)
1990 10 1:2 10
1992 10 1:4 50
1995 10 1:3 225
Bonus shares
Year Face Value (`) Ratio
1994 10 1:2
2000 10 3:5
28 April 2016. Mumbai
For and on behalf of the Board Essel Propack Limited
Sd/Subhash Chandra
Chairman

40
Annual Report 2015-16
Auditors’ Certificate on Corporate GovernanceToThe Members of Essel Propack Limited
We have examined the compliance of conditions of Corporate Governance by Essel Propack Limited (‘the Company’) for the year ended 31 March 2016 as stipulated in chapter IV of Securities and Exchange Board of India (Listing Obligations and Disclosure Requirements) Regulations, 2015 pursuant to the Listing Agreement of the said Company with stock exchanges.
The Compliance of conditions of Corporate Governance is the responsibility of the management. Our examination has been limited to procedures and implementation thereof, adopted by the Company for ensuring the compliance of the conditions of the Corporate Governance. It is neither an audit nor an expression of opinion on the financial statements of the Company.
In our opinion and to the best of our information and according to the explanations given to us and based on the representations made by the Management, we certify that the Company has complied with the conditions of Corporate Governance as stipulated in chapter IV of Securities and Exchange Board of India (Listing Obligations and Disclosure Requirements) Regulations, 2015 pursuant to Listing Agreement of the said Company with stock exchanges.
We further state that such compliance is neither an assurance as to the future viability of the Company nor the efficiency or effectiveness with which the management has conducted the affairs of the Company.
For MGB & Co. LLPChartered Accountants
Firm Registration Number 101169W/W-100035
Hitendra BhandariPartner
Membership Number 107832
Mumbai, 28 April 2016

41
To,The Members,Essel Propack Limited
I have conducted the secretarial audit of the compliance of applicable statutory provisions and the adherence to good corporate practices by Essel Propack Limited (hereinafter called ‘the Company’). Secretarial audit was conducted in a manner that provided me a reasonable basis for evaluating the corporate conducts/statutory compliances and expressing my opinion thereon.
Based on my verification of the Essel Propack Limited’s books, papers, minute books, forms and returns filed and other records maintained by the Company and also the information provided by the Company, its officers, agents and authorized representatives during the conduct of secretarial audit, I hereby report that in my opinion, the Company has, during the audit period covering the Financial year ended on 31st March, 2016, complied with the statutory provisions listed hereunder and also that the Company has proper Board-processes and compliance-mechanism in place to the extent, in the manner and subject to the reporting made hereinafter:
I have examined the books, papers, minute books, forms and returns filed and other records maintained by the Company for the financial year ended on 31st March, 2016 according to the provisions of:
(i) The Companies Act, 2013 (the Act) and the rules made thereunder;
(ii) The Securities Contracts (Regulation) Act, 1956 (‘SCRA’) and the rules made thereunder;
(iii) The Depositories Act, 1996 and the Regulations and the Bye-laws framed thereunder;
(iv) Foreign Exchange Management Act, 1999 and the rules and regulations made thereunder to the extent of Foreign Direct Investment, Overseas Direct Investment and External Commercial Borrowings;
(v) The following Regulations and Guidelines prescribed
under the Securities and Exchange Board of India Act, 1992
(‘The SEBI’):-
(a) The Securities and Exchange Board of India
(Substantial Acquisition of Shares and Takeovers)
Regulations, 2011;
(b) The Securities and Exchange Board of India
(Prohibition of Insider Trading) Regulations, 1992;
(c) The Securities and Exchange Board of India (Issue of
Capital and Disclosure Requirements) Regulations,
2009;
(d) The Securities and Exchange Board of India (Share
Based Employee Benefits) Regulations, 2014;
(e) The Securities and Exchange Board of India (Issue and
Listing of Debt Securities) Regulations, 2008;
(f) The Securities and Exchange Board of India (Registrars
to an Issue and Share Transfer Agents) Regulations,
1993 regarding the Companies Act and dealing with
client;
(g) The Securities and Exchange Board of India (Delisting
of Equity Shares) Regulations, 2009; (Not relevant /
applicable, since there is no delisting of equity shares
during the year)
(h) The Securities and Exchange Board of India (Buyback
of Securities) Regulations, 1998; (Not relevant /
applicable, since there is no buyback of securities
during the year)
(i) The Securities and Exchange Board of India
(Listing Obligations and Disclosure Requirements)
Regulations, 2015.
Annexure 1 - Secretarial Audit ReportForm No. MR-3
For the Financial year ended 31st March, 2016[Pursuant to Section 204(1) of the Companies Act, 2013 and rule No. 9 of the Companies (Appointment and Remuneration of
Managerial Personnel) Rules, 2014]

42
Annual Report 2015-16
(vi) Factories Act 1948
(vii) Contract Labour (Regulation and Abolition) Act, 1970
I have also examined compliance with the applicable clauses to the following:
(i) Secretarial Standards issued by The Institute of Company Secretaries of India and approved by the Government of India, as applicable under the Companies Act 2013;
(ii) The Listing Agreements entered into by the Company with BSE Limited and National Stock Exchange of India Limited and SEBI (Listing Obligations and Disclosure Requirements) Regulations 2015.
During the period under review the Company has complied with the provisions of the Act, Rules, Regulations, Guidelines, Standards, etc. mentioned above.
I further report that, the Board of Directors of the Company is duly constituted with proper balance of Executive, Non – Executive Directors and Independent Directors. The changes in the composition of the Board of Directors that took place during the period under review were carried out in compliance with the provisions of the Act.
Adequate notice is given to all the directors to schedule the Board Meeting, agenda and detailed notes on agenda were sent at least seven days in advance, and a system exists for seeking and obtaining further information and clarifications on the agenda items before the meeting and for meaningful participation at the meeting.
All decisions at Board Meetings and Committee Meetings are carried out unanimously as recorded in the minutes of the meetings of the Board of Directors or Committee of the Board, as the case may be.
I further report that there are adequate systems and processes in the company commensurate with the size and operations of the company to monitor and ensure compliance with applicable laws, rules, regulations and guidelines. The management has installed IT enabled software called “Legatrix” to manage legal and regulatory compliance. The Legatrix system has been implemented by legal professional and expert service provider Legasis Services Private Limited. We have reviewed the functioning of said system implemented at all plants, registered and corporate office of the Company and the said systems inter alia checks, alters, provide reports, updates and overview compliance management of various laws including laws specifically applicable to the Company viz Factories Act 1948, the Contract Labour (Regulation and Abolition) Act, 1970.
I further report that during the period under review the:-
1. The Company has disinvested its wholly-owned subsidiary Packaging India Private Limited.
2. Board has approved scheme of amalgamation of Whitehills Advisory Services Private Limited with the Company in its meeting held on 29th October, 2015.
3. The members have approved Special resolution for payment of remuneration to Mr. Ashok Goel, Vice Chairman and Managing Director for the financial years 2014-15 & 2015-16 through Postal Ballot notice dated 29th October, 2015.
For D. M. Zaveri & Co.Company Secretaries
Dharmesh Zaveri(Proprietor)
FCS. No.: 5418CP No.: 4363
Place: MumbaiDate: 28th April, 2016

43
Annexure 2 – CSR Report
ANNUAL REPORT ON CORPORATE SOCIAL RESPONSIBILITY (CSR) ACTIVITIES1. A brief outline of the company’s CSR policy,
including overview of projects or programs proposed to be undertaken and a reference to the web-link to the CSR Policy and projects and programs.
Pursuant to Section 135(1) of the Companies Act, 2013 read with Companies (Corporate Social Responsibility) Rules, 2014, the Board of Directors have constituted a CSR Committee. The Board also framed a CSR Policy in compliance with the provisions of Section 135 of the Companies Act, 2013. The said policy is placed on the website and is available on the following weblink
http://www.esselpropack.com/wp-content/uploads/2015/02/Corporate-Social-Responsibility-Policy.pdf
In line with CSR Policy and in accordance with Schedule VII to the Act, the Company has undertaken the following CSR projects:
a) Promoting Education
b) Providing Sanitation facilities
c) Promoting healthcare including preventive healthcare
d) Ensuring Environment Sustainability
e) Rural Development
The Company has undertaken the above CSR activities directly and also through registered trust or registered society and other permissible entities having an established track record of more than 3 years.
2. The Composition of the CSR Committee Mr. Ashok Goel (Vice Chairman & Managing Director)
Mr. Boman Moradian (Independent Director)
Mr. Mukund Chitale (Independent Director)
3. Average net profit of the Company (India –Standalone) for preceding three financial years.
` 70,35,69,932
4. Prescribed CSR Expenditure spent (two percent of the amount as in item 3 above).
` 1,40,71,399
5. Details of CSR spent during the financial year:
a) Total amount spent for the financial year; ` 62,53,467
b) Amount unspent, if any; ` 78,17,932
c) Manner in which the amount spent during the financial year:
Manner in which the amount is spent is detailed in the Annexure A.

44
Annual Report 2015-16
ANNEXURE A TO REPORT ON CSR ACTIVITIES(1) (2) (3) (4) (5) (6) (7) (8)Sr No.
CSR project or activity identified
Sector in which the project is covered
Projects or programs
(1) Local area or other
(2) Specify the State and district where projects or Programs were undertaken.
Amount outlay (budget) project or programs wise
Amount spent on the projects or programs Sub-heads:
(1) Direct expenditure on projects or programs
(2) Overheads:
Cumulative expenditure up to the reporting period
Amount spent Direct or through imple-mentation agency
1. Promoting education by providing benches and improving sanitation facilities by providing toilets made out of factory waste to various schools in the vicinity of the plants of the Company
Education & Healthcare
State: MaharashtraDistrict: Thane
25,03,467 25,03,467 25,03,467 Direct
2. Promoting healthcare by providing modern electronic artificial Limbs to the needy victims
Healthcare All across India 3,00,000 3,00,000 3,00,000 Implementing Agency - Yuvak Pratishthan
3. Improve public policy issues such as education, rural development, e-governance, urban governance, developmental studies, etc.
Education & Rural Development
States: Andhra Pradesh Madhya PradeshKarnatakaMaharashtraDelhi
5,00,000 5,00,000 5,00,000 Implementing Agency - Vision India Foundation
4. Conservation of environment by adopting sustainable energy practices & educate students about issues like carbon foot print, greenhouse gases, etc.
Education & Environment Sustainability
State: MaharashtraDistrict: Thane
3,00,000 3,00,000 3,00,000 Implementing Agency - Keshav Srushti
5. Promoting Healthcare by reducing the incidence of blindness through promotion of better healthcare, prevention and treatment of eye conditions and provision of eye care services.
Healthcare State: Andhra Pradesh District: Vizianagaram
6,00,000 6,00,000 6,00,000 Implementing agency – Sankar Foundation Eye Hospital
6. Promoting preventive Healthcare by providing capital equipment.
Healthcare State: Maharashtra 7,00,000 7,00,000 7,00,000 Implementing agency – Rotary Club of Bombay
7. Promoting education and Rural Development
Education & Rural Development
State: West Bengal District: South 24 Parganas
2,50,000 2,50,000 2,50,000 Implementing Agency – PADAKSHEP
8. Promoting & providing education to children who are mentally challenged
Education State: Maharashtra District: Thane
11,00,000 11,00,000 11,00,000 Implementing Agency – The Indian Council for Mental Health
Total 62,53,467 62,53,467 62,53,467
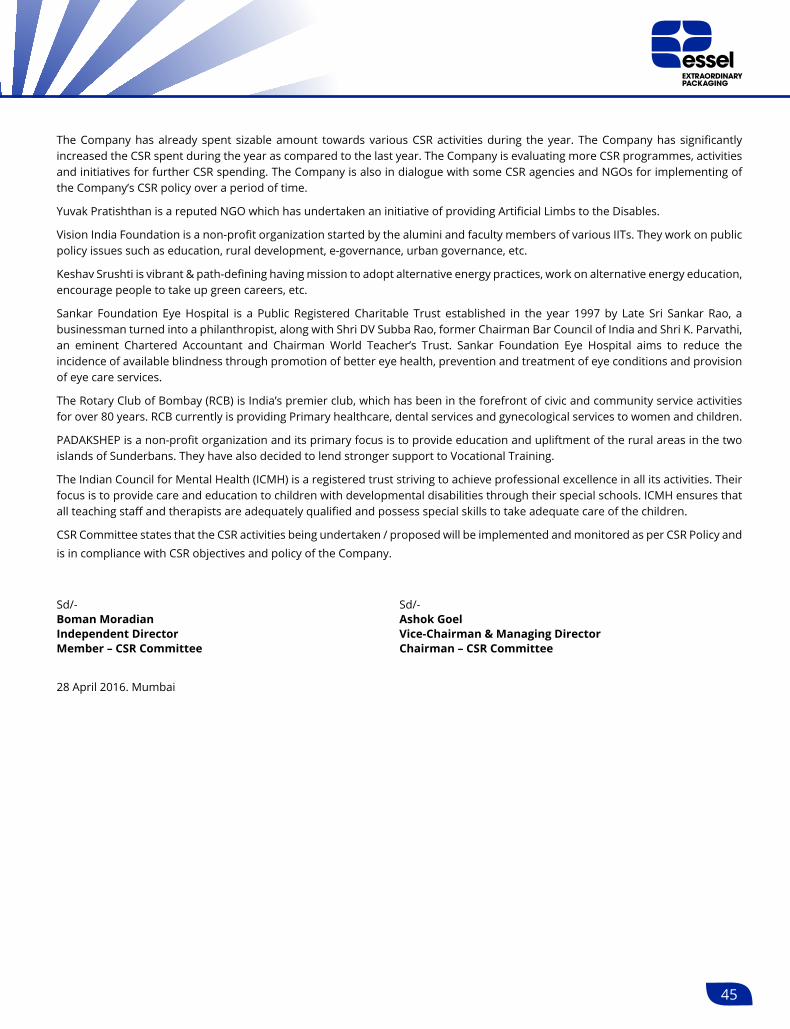
45
The Company has already spent sizable amount towards various CSR activities during the year. The Company has significantly increased the CSR spent during the year as compared to the last year. The Company is evaluating more CSR programmes, activities and initiatives for further CSR spending. The Company is also in dialogue with some CSR agencies and NGOs for implementing of the Company’s CSR policy over a period of time.
Yuvak Pratishthan is a reputed NGO which has undertaken an initiative of providing Artificial Limbs to the Disables.
Vision India Foundation is a non-profit organization started by the alumini and faculty members of various IITs. They work on public policy issues such as education, rural development, e-governance, urban governance, etc.
Keshav Srushti is vibrant & path-defining having mission to adopt alternative energy practices, work on alternative energy education, encourage people to take up green careers, etc.
Sankar Foundation Eye Hospital is a Public Registered Charitable Trust established in the year 1997 by Late Sri Sankar Rao, a businessman turned into a philanthropist, along with Shri DV Subba Rao, former Chairman Bar Council of India and Shri K. Parvathi, an eminent Chartered Accountant and Chairman World Teacher’s Trust. Sankar Foundation Eye Hospital aims to reduce the incidence of available blindness through promotion of better eye health, prevention and treatment of eye conditions and provision of eye care services.
The Rotary Club of Bombay (RCB) is India’s premier club, which has been in the forefront of civic and community service activities for over 80 years. RCB currently is providing Primary healthcare, dental services and gynecological services to women and children.
PADAKSHEP is a non-profit organization and its primary focus is to provide education and upliftment of the rural areas in the two islands of Sunderbans. They have also decided to lend stronger support to Vocational Training.
The Indian Council for Mental Health (ICMH) is a registered trust striving to achieve professional excellence in all its activities. Their focus is to provide care and education to children with developmental disabilities through their special schools. ICMH ensures that all teaching staff and therapists are adequately qualified and possess special skills to take adequate care of the children.
CSR Committee states that the CSR activities being undertaken / proposed will be implemented and monitored as per CSR Policy and is in compliance with CSR objectives and policy of the Company.
Sd/- Boman Moradian Independent Director Member – CSR Committee
Sd/- Ashok Goel Vice-Chairman & Managing Director Chairman – CSR Committee
28 April 2016. Mumbai

46
Annual Report 2015-16A
nnex
ure
3(a
)Pa
rtic
ular
s of
Em
ploy
ees
as p
er S
ectio
n 19
7(12
) of t
he C
ompa
nies
Act
, 201
3 re
ad w
ith th
e Ru
les
rela
ting
ther
eto
for
the
year
end
ed o
n 31
st M
arch
, 201
6.
Em
ploy
ed t
hrou
ghou
t th
e ye
ar a
nd w
ere
in r
ecei
pt o
f rem
uner
atio
n in
the
agg
rega
te o
f not
less
tha
n `
60 L
acs
per
annu
m.
Sr.
No.
Nam
eD
esig
nati
on/N
atur
e of
Dut
ies
Qua
lifica
tion
Age
Dat
e of
Jo
inin
gRe
mun
erat
ion
Rece
ived
(Rs.
)Ex
peri
ence
(in
yea
rs)
Part
icul
ars
of la
st
empl
oym
ent
held
- O
rgan
isat
ion
&
Des
igna
tion
1.As
hok
Goe
lV.
C.&
M.D
.B.
Com
.54
1/7/
1988
6,76
,89,
200
34-
2.M
R R
amas
amy
Chie
f Ope
ratin
g O
ffice
rBE
, Exe
cutiv
e M
BA58
9/3/
1985
1,66
,70,
493
34Ve
nlon
Pol
yste
r Lt
d.,
Proj
ect E
ngin
eer
3.A
V G
anap
athy
Chie
f Fin
anci
al O
ffice
rAC
A, A
CS &
AIC
WA
5711
/6/2
007
1,47
,76,
650
33U
nile
ver
Srila
nka
Ltd.
, Co
mm
erci
al D
irec
tor
4.M
K B
aner
jee
Dir
ecto
r-Cr
eativ
ity &
In
nova
tion
BE E
lect
rica
l60
6/6/
1985
1,09
,00,
706
36G
uard
ian
Plas
ticot
e Lt
d.,
Mai
nten
ance
Offi
cer
- Pr
ojec
t Exe
cutiv
e5.
Dile
ep Jo
shi
Dir
ecto
r - H
uman
Ca
pita
lPo
st-G
radu
atio
n in
M
anag
emen
t (H
R)51
12/1
0/20
091,
02,7
5,05
227
Essa
r Sh
ippi
ng P
orts
&
Logi
stic
s Lt
d., H
ead
HR
- ES
PL B
usin
ess
Gro
up6.
Roy
Jose
phRe
gion
al V
ice
Pres
iden
t-AM
ESA
Regi
on
Mas
ters
in
Man
agem
ent,
BE47
2/11
/201
186
,01,
820
28Av
ery
Den
niso
n In
dia
Ltd;
Cou
ntry
Gen
eral
M
anag
er In
dia
7.Pr
akas
h D
harm
ani
Chie
f Inf
orm
atio
n O
ffice
rBE
(Che
mic
al),
Exec
utiv
e M
BA45
24/0
9/20
1272
,64,
368
24Es
sar
Pow
er L
td.,
VP C
IO
N
one
of th
e em
ploy
ees
wer
e em
ploy
ed fo
r pa
rt o
f yea
r an
d w
ere
in r
ecei
pt o
f rem
uner
atio
n in
the
aggr
egat
e of
not
less
than
` 5
,00,
000
p.m
.
N
otes
:
1.
Re
mun
erat
ion
cons
ists
of s
alar
y, v
aria
ble
pay,
allo
wan
ces
and
perq
uisi
tes
as c
ompu
ted
unde
r th
e In
com
e Ta
x Ac
t, 19
61.
2.
Al
l app
oint
men
ts a
re t
erm
inab
le b
y no
tice
on e
ither
sid
e an
d ar
e go
vern
ed a
s pe
r th
e te
rms
of r
espe
ctiv
e ap
poin
tmen
t an
d/or
rul
es/p
olic
ies
of t
he
Com
pany
.
3.
Ex
cept
for
Mr.
Ash
ok G
oel,
none
of t
he e
mpl
oyee
s m
entio
ned
abov
e is
rel
ated
to a
ny D
irec
tor
of th
e Co
mpa
ny.
For
and
on b
ehal
f of t
he B
oard
Es
sel P
ropa
ck L
imit
ed Sd/-
Subh
ash
Chan
dra
Chai
rman
28 A
pril
2016
. Mum
bai


48
Annual Report 2015-16Sr
. no
.Re
quir
emen
tsD
iscl
osur
e
5.Co
mpa
riso
n of
th
e re
mun
erat
ion
of
the
Key
Man
ager
ial
Pers
onne
l ag
ains
t th
e pe
rfor
man
ce o
f th
e Co
mpa
ny
Key
Man
ager
ial P
erso
nnel
wer
e pa
id r
emun
erat
ion
of a
ppro
xim
atel
y 6.
00%
of
the
Profi
t be
fore
ta
x of
the
Com
pany
.
6.Th
e ke
y pa
ram
eter
s fo
r an
y va
riab
le c
ompo
nent
of
rem
uner
atio
n av
aile
d by
the
dire
ctor
sVa
riab
le c
ompo
nent
of
rem
uner
atio
n is
app
licab
le o
nly
in c
ase
of t
he M
anag
ing
Dir
ecto
r. T
he
para
met
ers
are
sam
e as
for
oth
er e
mpl
oyee
s, v
iz.
achi
evem
ent
of C
ompa
ny p
erfo
rman
ce
targ
ets
(ref
er s
r. n
o. 3
) & d
eliv
ery
agai
nst
indi
vidu
al K
RA g
oals
agr
eed
with
the
Nom
inat
ion
and
Rem
uner
atio
n Co
mm
ittee
.7.
The
ratio
of
the
rem
uner
atio
n of
the
hig
hest
pai
d di
rect
or t
o th
at o
f th
e em
ploy
ees
who
are
not
di
rect
ors
but r
ecei
ve r
emun
erat
ion
in e
xces
s of
the
high
est p
aid
dire
ctor
dur
ing
the
year
.
No
empl
oyee
rec
eive
d re
mun
erat
ion
in e
xces
s of
the
high
est-
paid
dir
ecto
r.
8.Affi
rmat
ion
that
the
rem
uner
atio
n is
as
per
the
rem
uner
atio
n po
licy
of th
e Co
mpa
nyYe
s, th
e re
mun
erat
ion
is a
s pe
r th
e re
mun
erat
ion
polic
y of
the
Com
pany
.
9.31
.03.
2016
31.0
3.20
15Va
riat
ion
in M
arke
t Cap
italis
atio
n`
2507
cro
res
` 19
58 c
rore
sVa
riat
ion
in P
rice
Ear
ning
s Ra
tio21
.66
34.6
4Va
riat
ion
in
Perc
enta
ge
Incr
ease
/dec
reas
e of
m
arke
t quo
tatio
ns o
f the
sha
res
of th
e Co
mpa
ny in
co
mpa
riso
n to
the
rate
at w
hich
the
Com
pany
cam
e ou
t with
last
Pub
lic o
ffer
.
254.
77%
177.
11%
Vari
atio
n in
Net
wor
th o
f th
e Co
mpa
ny a
s pe
r Ba
lanc
e Sh
eet.
` 55
3.88
cro
res
` 47
9.85
cro
res
For
and
on b
ehal
f of t
he B
oard
Es
sel P
ropa
ck L
imit
ed Sd/-
Subh
ash
Chan
dra
Chai
rman
28 A
pril
2016
. Mum
bai

49
CONSERVATION OF ENERGY, TECHNOLOGY ABSORPTION AND FOREIGN EXCHANGE EARNINGS AND OUTGO
The Information under Section 134(3)(m) of the Companies Act, 2013 read with Rule 8(3) of the Companies (Accounts) Rules, 2014 for the year ended March 31, 2016 is given here below and forms part of the Directors’ Report.
A. CONSERVATION OF ENERGY (a) Steps taken or impact on conservation of energy:
Your Company is committed to reduce energy consumption at its various plants. Besides sustaining past initiatives, new measures were implemented during the year. Gist of initiatives taken in this regard is as under:
l Installed energy efficient blown film line at Vasind.
l Installed water cooled chiller for effective & optimized cost of cooling at Vasind.
l Heater jackets are provided at HSL & UHSL lines at Nalagarh.
l Installation and conversion of energy saving LED lights in new work area like printing, tubing, QC, street lights, storage area & shop floor lightings. Use of natural light by transparent sheets on roof.
l Added Capacitor Banks to maintain power factor above 0.99 at Goa, Nalagarh and Murbad.
l Optimized power rating of chiller motor for efficient use at Nalagarh.
l Improve the power reliability through dedicated feeder at Vasind, and improve the reliability of Industrial feeder at Silvassa.
l Modified PID logic for improved performance at ETS machine at Wada.
l Installation of Variable Frequency Drive (VFD) system for the air compressor for reduced energy consumption at Nalagarh and Vasind.
l Optimization of Air pressure of compressed air line for energy saving.
l STP water is used for gardening at Vasind, Wada and Nalagarh.
Annexure 4
(b) The steps taken by the company for utilizing alternate sources of energy:
l Due to feeder line reliability, less energy utilised using Generator which led to less consumption of diesel.
(c) The capital investment on energy conservation equipment:
l Installation of water cooled chillers; investment of approx INR 1.2 Cr.
l Installation of VFD system for the air compressor to reduce energy consumption – INR 5 lakhs.
l Investment of INR 15 Lacs for other improvements like, Heater jackets, LED lights, air compressor optimization, machine programing logic improvement.
B. TECHNOLOGY ABSORPTION (i) The efforts made towards technology absorption:
a) New generation Multilayer Blown film with 800kg/hour output and fully computer controlled thickness and job changeover features was inducted into Company’s manufacturing.
b) Second generation multitasking combination Printing Press have been inducted into Company’s manufacturing system. This new generation press is capable of doing Cold and Hot foil blocking in registration with flexo and screen printed panel with greater accuracy and consistency.
(ii) The benefits derived like product improvement, cost reduction, product development or import substitution:
a) New generation Blown film along with new generation extrusion Laminator (inducted last year) enabled your Company to produce state of art laminates which enables your Company to satisfy customers globally with new products.
b) Green Maple Leaf™ tube with 100% recyclability and designated with code-2 (HDPE) has been through multi customer product compatibility study and is in final stage of commercialization globally.

50
Annual Report 2015-16
c) ‘evelvet’, color PBL laminate with 400 and 350 mic web thickness has been commercialized locally as well as globally.
d) New generation, custom designed Tube for ‘ammonia and peroxide’ based product formulation has been developed and has gone through stringent product stability study. This project will find customer globally and will offer a great export potential for your Company.
(iii) In case of imported technology (imported during the last three years reckoned from the beginning of the financial year) – Nil
(iv) Details of expenditure on Research and Development during the year under review is as under:
(` In milion)
a) Capital 12.50b) Recurring 50.92
Total expenditure 63.42Total expenditure as a % of total turnover
0.83%
C. FOREIGN EXCHANGE EARNINGS AND OUTGO
(` In million)
Particular Year 2015-16 Year 2014-15
Foreign Exchange earned
908.30 942.17
Foreign Exchange used / outgo
2699.51 3700.95
For and on behalf of the Board Essel Propack Limited
Sd/-Subhash Chandra
Chairman
28 April 2016. Mumbai


52
Annual Report 2015-16
Sr. No. Name and Address of the Company CIN/GLN
Holding/Subsidiary/Associate
% of shares
held
Applicable section
3. Arista Tubes Inc.*, USA187 Cane Creek Blvd, Danville, VA – 24540
Foreign Company Wholly owned Subsidiary
100 2(87)
STEP DOWN SUBSIDIARIES1. Essel Propack America LLC, USA, 187 Cane
Creek Blvd, Danville, VA – 24540.Foreign Company Subsidiary 100 2(87)
2. The Egyptian Indian Company for Modern Packaging, S.A.E., Egypt, 10th of Ramadan City, Industrial Zone, A2, PLOT 7/2 AT 61 KMS ISMAILIA ROAD, Egypt
Foreign Company Subsidiary 75 2(87)
3. Essel Packaging (Guangzhou) Limited, ChinaNo. 9, Yongshun Avenue, M., Yonghe Zone, GETDD, Guangzhou P.R.China
Foreign Company Subsidiary 100 2(87)
4. Essel Propack Philippines, Inc., PhilippinesBuilding 11, Phase II, Vita Comp, 108 Marcos Alvarez Avenue, Bo. Talon 1 Las Pinas City, 1747, Philippines
Foreign Company Subsidiary 100 2(87)
5. Essel de Mexico, S.A. de C.V., Mexico, Carretera Tepotzotlan-LA Aurora KM.1, Ex-Hacienda San Miguel Cuautitlan Izcalli Estado De Mexico, Mexico C.P. 54715
Foreign Company Subsidiary 100 2(87)
6. MTL de Panama S.A., PanamaApartado 8629, Panama 5, Republique De Panama
Foreign Company Subsidiary 100 2(87)
7. Arista Tubes LIMITED, United KingdomCastle Court, 41 London Road, Reigate, Surrey, RH2 9RJ
Foreign Company Subsidiary 100 2(87)
8. Essel Propack UK LimitedCastle Court, 41 London Road, Reigate, Surrey, RH2 9RJ
Foreign Company Subsidiary 100 2(87)
9. Tubopack de Colombia S.A., Colombia, Calle 13A No, 100-35 of. 806, Call Planta: Parque ind El Paraiso Bod 4 Mza, B Santander De Quilichao, Colombia
Foreign Company Subsidiary 100 2(87)
10. Lamitube Hong Kong Trading Company LimitedUnit No 1601, 16th Floor, Comweb Plaza, 12 Cheung Yue Street, Lai Chi Kok, Kowloon, Hong Kong
Foreign Company Subsidiary 100 2(87)
11. Essel Propack LLC, RussiaUl., Shosseinaya, 40, Malakhovka – 2, Luberetsky Raion, Moskovskaya Oblast – 140032, Russian Federation
Foreign Company Subsidiary 100 2(87)
12. Essel Packaging (Jiangsu) Limited, ChinaNo.9, Changsheng Road Yang round development zone, Xinzhuang village, Changshu city, Jiangsu province, China
Foreign Company Subsidiary 100 2(87)
13. Essel Propack MISR for Advanced Packaging (S.A.E.), Egypt, Plot No 6 & 7, Block – 12016, 1st Industrial Estate, El Obour City, Egypt
Foreign Company Subsidiary 75 2(87)
14. Essel Propack Polska Sp. Z.O.O., Polandul. Mahatmy Gandhiego 1 66-300 Międzyrzecz, Poland
Foreign Company Subsidiary 100 2(87)

53
Sr. No. Name and Address of the Company CIN/GLN
Holding/Subsidiary/Associate
% of shares
held
Applicable section
15 Essel Colombia S.A.S.Via Cali-Santander de Quilichao, KM 24, Parque Industrial Parque Sur. Villa Rica, Columbia
Foreign Company Subsidiary 100 2(87)
JV/ASSOCIATE COMPANIES1. Essel Deutschland Gmbh & Co. KG,
Dresden, Germany.Manfred-von-Ardenne-Ring 10, 01099 Dresden, Germany Handelsregister: Amtsgericht Dresden, HRA 5605
Foreign Company Joint Venture 24.90 --
2. Essel Deutschland Management GmbH, GermanyManfred-von-Ardenne-Ring 10, 01099 Dresden, Germany Handelsregister: Amtsgericht Dresden, HRA 5605.
Foreign Company Joint Venture 24.90 --
3. P.T Lamipak Primula, IndonesiaJI, Sawunggaling No 26, Gilang, Taman, Sidoarjo, Indonesia.
Foreign Company Associate 30 2(6)
*Balance 7.35% of Arista INC, USA is held by Lamitube Technologies (Cyprus) Limited
IV. SHAREHOLDING PATTERN (Equity Share Capital Breakup as percentage of Total Equity)
i) Category-wise Shareholding
Category of Shareholders
No. of Shares held at the beginning of the year No. of Shares held at the end of the year %
Change during
the yearDemat Physical Total% of Total
sharesDemat Physical Total
% of Total
sharesA. PROMOTERS
(1) Indiana) Individual/HUF 334750 - 334750 0.21 334750 - 334750 0.21 -b) Central Govt. 0 0 0 0.00 0 0 0 0.00 -c) State Govt(s) 0 0 0 0.00 0 0 0 0.00 -d) Bodies Corp. 88593243 - 88593243 56.39 88943243 0 88943243 56.62 0.23e) Banks/Financial Institutions 0 0 0 0.00 0 0 0 0.00 -f) Any Other … 0 0 0 0.00 0 0 0 0.00 - Trust 0 0 0 0.00 310000 0 310000 0.20 0.20Sub-total (A) (1):- 88927993 0 88927993 56.61 89587993 0 89587993 57.03 0.42(2) Foreigna) NRIs Individuals 0 - 0 0.00 0 0 0 0.00 0.00b) Other Individuals 0 0 0 0.00 0 0 0 0.00 -c) Bodies Corp. 0 0 0 0.00 0 0 0 0.00 -d) Banks/ Financial Institutions 0 0 0 0.00 0 0 0 0.00 -e) Any Other ….. 0 0 0 0.00 0 0 0 0.00 -Sub-total (A) (2):- 0 0 0 0.00 0 0 0 0.00 0.00Total shareholding of Promoter (A) = (A) (1) + (A) (2)
88927993 0 88927993 56.61 89587993 0 89587993 57.03 0.42

54
Annual Report 2015-16
Category of Shareholders
No. of Shares held at the beginning of the year No. of Shares held at the end of the year %
Change during
the yearDemat Physical Total% of Total
sharesDemat Physical Total
% of Total
sharesB. PUBLIC SHAREHOLDING(1) Institutionsa) Mutual Funds/UTI 5179322 20770 5200092 3.31 4285205 20770 4305975 2.74 -0.57b) Banks/ Financial Institutions 100675 2802 103477 0.07 82895 2802 85697 0.05 -0.02c) Central Govt. 0 0 0 0.00 0 0 0 0.00 -d) State Govt.(s) 0 0 0 0.00 0 0 0 0.00 -e) Venture Capital Funds 0 0 0 000 0 0 0 0.00 -f) Insurance Companies 1702679 0 1702679 1.08 1655970 0 1655970 1.05 -0.03g) Foreign Portfolio
Investors/FII14529370 2000 14531370 9.25 17638832 2000 17640832 11.23 1.98
h) Foreign Venture Capital Investors
0 0 0 0.00 0 0 0 0.00 -
i) Others 0 0 0 0.00 0 0 0 0.00 -Sub-total (B)(1) 21512046 25572 21537618 13.71 23662902 25572 23688474 15.07 1.362. Non-Institutionsa) Bodies Corporate i) Indian 22565730 8402 22574132 14.37 21568038 136572 21704610 13.82 -0.55 ii) Overseas 0 0 0 0.00 0 0 0 0.00 -b) Individuals i) Individual
shareholders holding nominal share capital upto ` 1 lakh
14551462 1661594 16213056 10.32 13730597 1486215 15216812 9.69 -0.63
ii) Individual shareholders holding nominal share capital in excess of ` 1 lakh.
6582456 57120 6639576 4.23 5550962 57120 5608082 3.57 -0.66
c) Others (specify)i) Overseas Corporate Bodies - 940 940 0.00 - 940 940 0.00 0.00ii) Non Resident Individuals 962309 224603 1186912 0.76 934676 222663 1157339 0.74 -0.02iii) Trusts 21058 0 21058 0.01 21085 0 21085 0.01 0.00iv) NBFCs Registered with RBI 0 0 0 0.00 115950 0 115950 0.07 0.07Sub-Total (B) (2):- 44683015 1952659 46635674 29.69 41921308 1903510 43824818 27.90 -1.79Total Public Shareholding (B) = (B)(1) + B(2)
66195061 1978231 68173292 43.39 65584210 1929082 67513292 42.97 -0.42
Shares held by Custodians for GDRs & ADRs
0 0 0 0.00 0 0 0 0.00 -
*GRAND TOTAL (A)+(B)+ (C) 155123054 1978231 157101285 100.00 155172203 1929082 157101285 100.00 0.00
* Includes 57,120 equity shares of face value ` 2/- each forfeited by the Board of Directors of the Company in its' meeting held on January 29, 2015, and are yet to be canceled / re-issued.

55
ii) Shareholding of Promoters
Sr No. Shareholder’s Name
Shareholding at the beginning of the year Shareholding at the end of the year
% change in share holding
during the year
No. of Shares
% of total Shares of the
company
% of Shares Pledged/
encumbered to total shares
No. of Shares
% of total Shares of the
company
% of Shares Pledged/
encumbered to total shares
PROMOTERS -INDIVIDUALS
1 Goel Ashok Kumar 320760 0.20 0 320760 0.20 0 -2 Kavita Goel 10990 0.01 0 10990 0.01 0 -3 Nand Kishore 3000 0.00 0 3000 0.00 0 -
Total 334750 0.21 0 334750 0.21 0 -PROMOTERS -DOMESTIC COMPANIES1. Whitehills Advisory
Services Private Limited86577843 55.11 1.27 88917843 56.60 0 1.49
2. Ganjam Trading Company Private Limited
1990100 1.27 0 100 0.00 0 -1.27
3. Rupee Finance And Management Private Limited
100 0.00 0 100 0.00 0 -
4. Pan India Paryatan Private Limited
25200 0.02 0 25200 0.02 0 -
Total 88593243 56.40 1.27 88943243 56.62 0 0.22
PROMOTERS – TRUSTS1 Ashok Kumar Goel 0 0.00 0 310000 0.20 0 0.20
Total 0 0.00 0 310000 0.20 0 310000
NON RESIDENT – PROMOTER
0 0 0 0 0 0 0
(iii) Change in Promoters’ Shareholding (please specify if there is no change)
Sr No.
Name of the Shareholder
ShareholdingDate wise Increase/
Decrease in Shareholding during
the year specifying the reasons for increase/
decrease (e.g. allotment /transfer/bonus/ sweat
equity etc.)
No. of Shares Reason
Cumulative Shareholding during
the year
No. Shares at the
beginning of the year (01.04.2015)
% of total
shares of the
company
No. of shares
% of total
shares of the
company1 Whitehills Advisory
Services Pvt. Ltd.86577843 55.11 16.10.2015 2340000 Inter se Transfer 88917843 56.60
31.03.2016 - - 88917843 56.60
2 Ganjam Trading Co. Pvt. Ltd.
1990100 1.27 10.04.2015 350000 Transfer 2340100 1.49
16.10.2015 -2340000 Inter se Transfer 100 0.00
31.03.2016 - - 100 0.00
3 Ashok Kumar Goel (Trustee : Ashok Goel Trust)
- - 18.03.2016 310000 Transfer 310000 0.20
31.03.2016 - - 310000 0.20

56
Annual Report 2015-16
(iv) Shareholding Pattern of top ten Shareholders (other than Directors, Promoters and Holders of GDR and ADRs)
Sr. No. Name of the Shareholder
Shareholding
Date wise Increase/Decrease
in Shareholding during the year specifying the
reasons for increase/decrease
(e.g. allotment/transfer/bonus/
sweat equity etc.)
No. of Shares Reason
Cumulative Shareholding during
the year
No. Shares at the beginning
of the year (01.04.2015)
% of total shares of the
company
No. of shares
% of total shares of the
company
1 WARBURG VALUE FUND 5919464 3.77 17.04.2015 -278100 Transfer 5641364 3.5924.04.2015 -45433 Transfer 5595931 3.5601.05.2015 -84469 Transfer 5511462 3.5108.05.2015 -47821 Transfer 5463641 3.4815.05.2015 -155011 Transfer 5308630 3.3822.05.2015 -91859 Transfer 5216771 3.3229.05.2015 -42911 Transfer 5173860 3.2905.06.2015 -37510 Transfer 5136350 3.2719.06.2015 -176 Transfer 5136174 3.2726.06.2015 -74627 Transfer 5061547 3.2230.06.2015 -10474 Transfer 5051073 3.2210.07.2015 -51073 Transfer 5000000 3.1824.07.2015 -55600 Transfer 4944400 3.1531.07.2015 -117496 Transfer 4826904 3.0707.08.2015 -345135 Transfer 4481769 2.8514.08.2015 -23179 Transfer 4458590 2.8421.08.2015 -116421 Transfer 4342169 2.7628.08.2015 -5052 Transfer 4337117 2.7604.09.2015 -174 Transfer 4336943 2.7611.09.2015 -19428 Transfer 4317515 2.7525.09.2015 -6704 Transfer 4310811 2.7430.09.2015 -4386 Transfer 4306425 2.7409.10.2015 -121138 Transfer 4185287 2.6616.10.2015 -53950 Transfer 4131337 2.6323.10.2015 -29851 Transfer 4101486 2.6130.10.2015 -51881 Transfer 4049605 2.5806.11.2015 -49605 Transfer 4000000 2.5531.12.2015 -67245 Transfer 3932755 2.5008.01.2016 -17617 Transfer 3915138 2.4915.01.2016 -25707 Transfer 3889431 2.4829.01.2016 -24004 Transfer 3865427 2.4605.02.2016 -64516 Transfer 3800911 2.4212.02.2016 -21650 Transfer 3779261 2.4118.03.2016 -279261 Transfer 3500000 2.2331.03.2016 0 3500000 2.23
2 CLAREVILLE CAPITAL OPPORTUNITIES MASTER FUND LIMITED
4786948 3.05 31.03.2016 0 4786948 3.05
3 GAGANDEEP CREDIT CAPITAL PVT LTD
3476686 2.21 31.03.2016 0 3476686 2.21
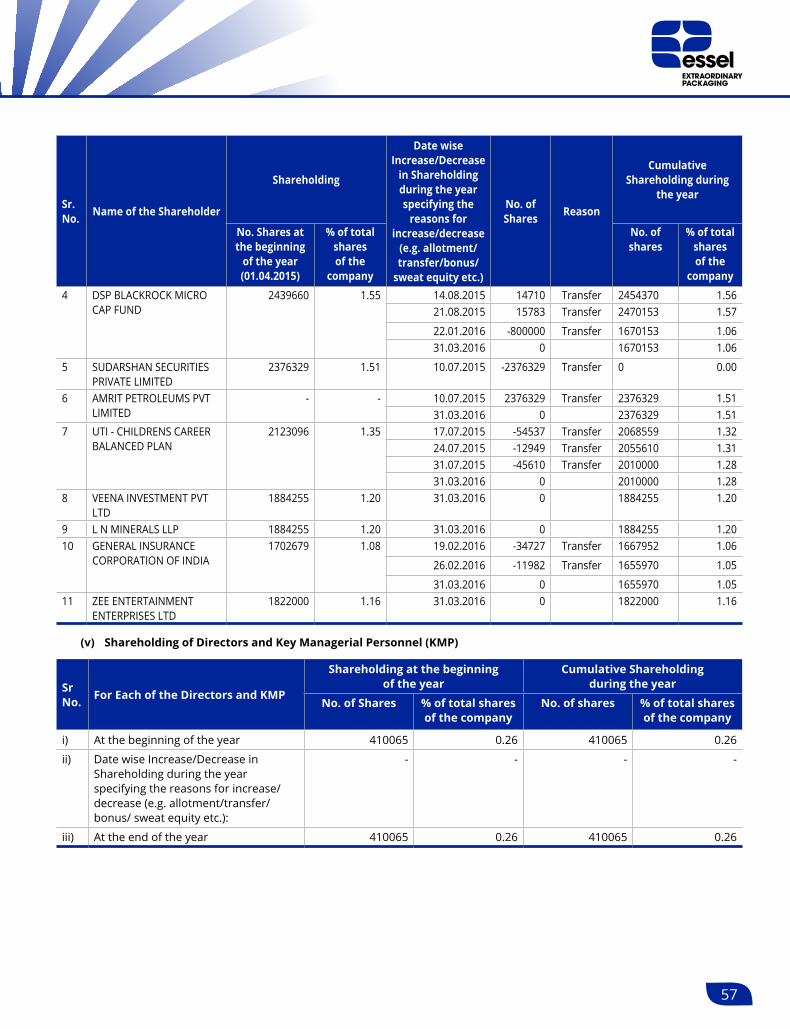
57
Sr. No. Name of the Shareholder
Shareholding
Date wise Increase/Decrease
in Shareholding during the year specifying the
reasons for increase/decrease
(e.g. allotment/transfer/bonus/
sweat equity etc.)
No. of Shares Reason
Cumulative Shareholding during
the year
No. Shares at the beginning
of the year (01.04.2015)
% of total shares of the
company
No. of shares
% of total shares of the
company
4 DSP BLACKROCK MICRO CAP FUND
2439660 1.55 14.08.2015 14710 Transfer 2454370 1.5621.08.2015 15783 Transfer 2470153 1.57
22.01.2016 -800000 Transfer 1670153 1.0631.03.2016 0 1670153 1.06
5 SUDARSHAN SECURITIES PRIVATE LIMITED
2376329 1.51 10.07.2015 -2376329 Transfer 0 0.00
6 AMRIT PETROLEUMS PVT LIMITED
- - 10.07.2015 2376329 Transfer 2376329 1.5131.03.2016 0 2376329 1.51
7 UTI - CHILDRENS CAREER BALANCED PLAN
2123096 1.35 17.07.2015 -54537 Transfer 2068559 1.3224.07.2015 -12949 Transfer 2055610 1.3131.07.2015 -45610 Transfer 2010000 1.2831.03.2016 0 2010000 1.28
8 VEENA INVESTMENT PVT LTD
1884255 1.20 31.03.2016 0 1884255 1.20
9 L N MINERALS LLP 1884255 1.20 31.03.2016 0 1884255 1.2010 GENERAL INSURANCE
CORPORATION OF INDIA1702679 1.08 19.02.2016 -34727 Transfer 1667952 1.06
26.02.2016 -11982 Transfer 1655970 1.05
31.03.2016 0 1655970 1.0511 ZEE ENTERTAINMENT
ENTERPRISES LTD1822000 1.16 31.03.2016 0 1822000 1.16
(v) Shareholding of Directors and Key Managerial Personnel (KMP)
Sr No. For Each of the Directors and KMP
Shareholding at the beginning of the year
Cumulative Shareholding during the year
No. of Shares % of total shares of the company
No. of shares % of total shares of the company
i) At the beginning of the year 410065 0.26 410065 0.26
ii) Date wise Increase/Decrease in Shareholding during the year specifying the reasons for increase/decrease (e.g. allotment/transfer/bonus/ sweat equity etc.):
- - - -
iii) At the end of the year 410065 0.26 410065 0.26

58
Annual Report 2015-16
V. INDEBTEDNESS Indebtedness of the Company including interest outstanding / accrued but not due for payment.
(Amount in `)
Particulars of Indebtedness Secured Loans excluding deposits
Unsecured Loans Deposit Total
Indebtedness
Indebtedness at the beginning of the financial year
i) Principal Amount 3,319,568,386 581,391,602 - 3,900,959,988
ii) Interest due but not paid 4,302,029 - - 4,302,029
iii) Interest accrued but not due 6,703,835 564,342 - 7,268,178
Total (i+ii+iii) 3,330,574,250 581,955,944 - 3,912,530,195
Change in Indebtedness during the financial year
Addition - - - -
Reduction (1,870,486,350) (71,483,564) - (1,941,969,914)
Net Change (1,870,486,350) (71,483,564) - (1,941,969,914)
Indebtedness at the end of the financial year
i) Principal Amount 1,455,804,120 509,704,027 - 1,965,508,147
ii) Interest due but not paid - - - -
iii) Interest accrued but not due 4,283,780 768,353 - 5,052,133
Total (i+ii+iii) 1,460,087,900 510,472,380 - 1,970,560,280
VI. REMUNERATION OF DIRECTORS AND KEY MANAGERIAL PERSONNEL A. Remuneration to Managing Director, Whole-time Directors and / or Manager
(Amount in `)
Sl No. Particulars of Remuneration Name of MD/WTD/
Manager Total
Mr. Ashok Goel Vice Chairman & Managing Director
1 Gross Salary
(a) Salary as per provisions contained in section 17(1) of the Income Tax Act, 1961
4,34,79,600 4,34,79,600
b) Value of perquisites u/s 17(2) of the Income-Tax Act, 1961 39,600 39,600
c) Profits in lieu of salary under section 17(3) of the Income tax Act, 1961
- -
2 Stock Option - -
3 Sweat Equity - -
4 Commission - as a % of profit - others (Variable Pay) 2,41,70,000 2,41,70,000
5 Others, please specify Provident fund, LTA and others 34,84,800 34,84,800
Total 7,11,74,000 7,11,74,000
Ceiling as per the Act: Total managerial remuneration is within the limit of 10% of the net profit of the Company as per section 198 of the Companies Act, 2013.


60
Annual Report 2015-16
VII. PENALTIES / PUNISHMENT / COMPOUNDING OF OFFENCE
Type Section of the Companies Act
Brief Description
Details of Penalty /
Punishment/ Compounding fees imposed
Authority [RD/NCLT/
COURT]
Appeal made if any (give
details)
A. COMPANY
Penalty NIL
Punishment
Compounding
B. DIRECTORS
Penalty NIL
Punishment
Compounding
C. OTHER OFFICERS IN DEFAULT
Penalty NIL
Punishment
Compounding
For and on behalf of the Board Essel Propack Limited
Sd/-Subhash Chandra
Chairman
28 April 2016. Mumbai

61
(` in Million)Particulars 2012 2013 2014 2015 2016Sales and other income 16,034.05 18,572.81 21,489.99 23,439.18 22,083.88 Profit before depreciation, amortisation, finance costs and tax 2,864.17 3,386.29 3,765.07 4,117.22 4,408.93 Depreciation and amortisation expense 1,170.03 1,261.72 1,257.61 1,317.94 1,269.80 Profit before exceptional items and tax 852.75 1,212.47 1,693.74 2,005.72 2,515.71 Profit after tax 513.58 809.57 1,078.33 1,406.32 1,820.70 Dividends 102.12 117.83 196.38 251.27 345.50 Cash Profit 1,683.61 2,071.29 2,335.94 2,724.25 3,090.50 Earnings per share - ` (Basic after extraordinary items) from Total operations 3.27 5.15 6.87 8.95 11.59 Dividend per share - ` 0.65 0.75 1.25 1.60 2.20 ASSETS LESS CURRENT LIABILITIESGoodwill 3,606.94 3,606.94 - - - Fixed assets (net) 8,016.89 8,196.31 9,336.75 9,759.97 9,976.03 Non current investments 446.39 463.69 454.39 457.52 475.93 Other non current assets, loans and advances 600.11 544.55 684.88 651.44 725.69 Current assets 8,264.59 8,892.10 10,450.26 10,230.55 9,410.26
20,934.92 21,703.59 20,926.28 21,099.48 20,587.91 Current liabilities (7,626.71) (6,549.12) (7,184.05) (6,473.05) (4,768.27)Net Assets 13,308.21 15,154.47 13,742.23 14,626.43 15,819.64 FINANCED BYShare capital 314.13 314.13 314.13 314.17 314.17 Reserves 8,522.54 9,132.53 6,744.38 7,515.50 9,443.54 Net Worth 8,836.67 9,446.66 7,058.51 7,829.67 9,757.71 Minority interest 75.40 60.28 75.51 80.75 81.44 Deferred tax balances (85.41) (17.06) 44.45 137.32 116.13
8,826.66 9,489.88 7,178.47 8,047.74 9,955.28 Non current liabilities 4,481.55 5,664.59 6,563.76 6,578.69 5,864.36 Capital employed 13,308.21 15,154.47 13,742.23 14,626.43 15,819.64 FINANCIAL RETURNS AND STATISTICSProfit after tax as a percent of Sales and other income 3% 4% 5% 6% 8%Profit before depreciation, amortisation, finance costs and tax as a percent of Sales and other income 18% 18% 18% 18% 20%Return on Capital Employed (Profit before Finance Costs and Tax/Avg Capital Employed) (With Goodwill) ^ 10% 12% 14% 16% 19%Return on Capital Employed (Profit before Finance Costs and Tax/Avg Capital Employed) (Without Goodwill) ^ 12% 15% 15% 16% 19%Return on Net worth (PAT/Avg Networth) (With Goodwill) 6% 9% 13% 19% 21%Return on Net worth (PAT/Avg Networth) (Without Goodwill) 10% 15% 17% 19% 21%Non current liabilities as a percentage of Shareholders' funds 51% 60% 93% 84% 60%Finance Costs Cover (Times) (Profit before Finance Costs and Taxation/Finance Costs) 2 2 3 4 5 Cash profit to sales and other income 11% 11% 11% 12% 14%
^ Considering shareholder's funds and total loan funds including short-term borrowings and current maturities of long-term borrowings.
Five Years' Summary of Selected Financial Data (Consolidated)
62
Annual Report 2015-16
Five Years' Summary of Selected Financial Data (India)
(` in Millions)As per Schedule VI
Particulars 31.03.2012 31.03.2013 31.03.2014 31.03.2015 31.03.2016Sales and other income 5,418.78 6,136.13 6,922.25 7,754.97 7,631.08 FOB value of exports 336.67 456.78 557.49 703.08 652.25 Profit before depreciation, amortisation, finance costs and tax 1,388.98 1,495.10 1,559.99 1,619.91 1,784.31 Depreciation / Amortisation 286.12 330.85 366.45 457.48 506.34 Profit before tax 515.51 661.66 756.35 753.10 1,472.17 Profit after tax 490.75 498.42 544.89 565.30 1,157.07 Dividends (including dividend tax) 118.68 137.85 229.75 301.51 415.83 Cash profit 776.86 829.27 911.34 1,022.78 1,663.40 Book value per share * 43.09 44.62 46.63 30.56 35.27 Earnings per share* - (Basic after exceptional items) 3.12 3.17 3.47 3.60 7.37 Dividend per share* - ` 0.65 0.75 1.25 1.60 2.20 Closing share price on BSE at year end (` per share) 27.90 30.80 57.80 124.70 161.05 Market capitalisation (As at year end) 4,383.13 4,838.72 9,080.45 19,583.41 25,291.96 ASSETS LESS CURRENT LIABILITIESFixed assets (Net) 2,522.75 2,656.23 3,145.00 3,303.92 3,381.72 Non-current investments 5,635.35 5,635.35 5,699.56 2,907.95 2,169.21 Other Non-current assets, loans and advances 394.21 376.34 461.88 490.69 347.41 Current assets 4,647.12 3,914.21 3,344.04 3,256.65 3,258.60
13,199.43 12,582.13 12,650.49 9,959.21 9,156.94 Current liabilities (4,108.24) (2,884.91) (2,383.86) (2,111.52) (1,647.89)Net Assets 9,091.20 9,697.22 10,266.63 7,847.70 7,509.05 FINANCED BYShare capital * 314.13 314.13 314.13 314.17 314.17 Reserves 6,355.09 6,696.06 7,010.86 4,484.36 5,224.68 Net Worth 6,669.22 7,010.19 7,324.99 4,798.52 5,538.84 Deferred tax balances 165.61 224.23 227.63 223.76 196.41 Non-current liabilities 2,256.37 2,462.80 2,714.01 2,825.41 1,773.80 Capital employed 9,091.20 9,697.22 10,266.63 7,847.70 7,509.05 FINANCIAL RETURNS AND STATISTICS Profit after tax as a percent of sales and other income 9% 8% 8% 7% 15%Profit before depreciation, finance costs and tax as a percent of sales and other income 26% 24% 23% 21% 23%Return on capital employed ^ 9% 10% 10% 12% 15%Return on common stockholders’ equity % (PAT) 7% 7% 7% 12% 21%Non-current liability as a percent of total year end Shareholders’ Fund 34% 35% 37% 59% 32%Financial costs cover (Times) 1.88 2.12 2.65 2.84 4.94 (Profit before financial costs and taxation divided by finance costs)Number of equity shares outstanding (in Million) * 157.07 157.07 157.07 157.04 157.04 Cash profit to sales and other income 14% 14% 13% 13% 22%
* Refer Note 3 (a) ^ Considering shareholder’s fund and total loan funds including short-term borrowings and current maturities of long-term
borrowings.

63
Annual Report 2015-16
Independent Auditors’ ReportToThe Members ofEssel Propack Limited
1. Report on the Standalone Financial Statements
We have audited the accompanying Standalone Financial Statements of Essel Propack Limited (“the Company”), which comprise the Balance Sheet as at 31 March 2016, the Statement of Profit and Loss, the Cash Flow Statement for the year then ended, and a summary of the significant accounting policies and other explanatory information.
2. Management’s Responsibility for the Standalone Financial Statements
The Company’s Board of Directors is responsible for the matters stated in Section 134(5) of the Companies Act, 2013 (“the Act”) with respect to the preparation and presentation of these standalone financial statements that give a true and fair view of the financial position, financial performance and cash flows of the Company in accordance with the accounting principles generally accepted in India, including the Accounting Standards specified under Section 133 of the Act, read with Rule 7 of the Companies (Accounts) Rules, 2014. This responsibility also includes maintenance of adequate accounting records in accordance with the provisions of the Act for safeguarding the assets of the Company and for preventing and detecting frauds and other irregularities; selection and application of appropriate accounting policies; making judgments and estimates that are reasonable and prudent; and design, implementation and maintenance of adequate internal financial controls, that were operating effectively for ensuring the accuracy and completeness of the accounting records, relevant to the preparation and presentation of the financial statements that give a true and fair view and are free from material misstatement, whether due to fraud or error.
3. Auditor’s Responsibility
Our responsibility is to express an opinion on these standalone financial statements based on our audit.
We have taken into account the provisions of the Act, the accounting and auditing standards and matters which are required to be included in the audit report under the provisions of the Act and the Rules made thereunder.
We conducted our audit in accordance with the Standards on Auditing specified under Section 143(10) of the Act. Those Standards require that we comply with ethical requirements and plan and perform the audit to obtain reasonable assurance about whether the financial statements are free from material misstatement.
An audit involves performing procedures to obtain audit evidence about the amounts and the disclosures in the
financial statements. The procedures selected depend on the auditor’s judgment, including the assessment of the risks of material misstatement of the financial statements, whether due to fraud or error. In making those risk assessments, the auditor considers internal financial control relevant to the Company’s preparation of the financial statements that give a true and fair view in order to design audit procedures that are appropriate in the circumstances. An audit also includes evaluating the appropriateness of the accounting policies used and the reasonableness of the accounting estimates made by the Company’s Directors, as well as evaluating the overall presentation of the financial statements.
We believe that the audit evidence we have obtained is sufficient and appropriate to provide a basis for our audit opinion on the standalone financial statements.
4. Opinion
In our opinion and to the best of our information and according to the explanations given to us, the aforesaid standalone financial statements give the information required by the Act in the manner so required and give a true and fair view in conformity with the accounting principles generally accepted in India, of the state of affairs of the Company as at 31 March 2016 and its profit and its cash flows for the year ended on that date.
5. Report on Other Legal and Regulatory Requirements
I. As required by the Companies (Auditor’s Report) Order, 2016 issued by the Central Government of India in terms of Section 143(11) of the Act (hereinafter referred to as the “Order”) and on the basis of such checks of the books and records of the Company as we considered appropriate and according to the information and explanations given to us, we give in the “Annexure A”, a Statement on the matters specified in paragraphs 3 and 4 of the Order.
II. As required by Section 143 (3) of the Act, we report that:
a) We have sought and obtained all the information and explanations which to the best of our knowledge and belief were necessary for the purposes of our audit;
b) In our opinion, proper books of account as required by law have been kept by the Company so far as it appears from our examination of those books;
c) The Balance Sheet, the Statement of Profit and Loss, and the Cash Flow Statement dealt with by this Report are in agreement with the books of account;
d) In our opinion, the aforesaid standalone financial statements comply with the Accounting Standards

64
Annual Report 2015-16
specified under Section 133 of the Act, read with Rule 7 of the Companies (Accounts) Rules, 2014;
e) On the basis of the written representations received from the directors and taken on record by the Board of Directors, none of the directors is disqualified as on 31 March 2016 from being appointed as a director in terms of Section 164(2) of the Act;
f) With respect to the adequacy of the internal financial controls over financial reporting of the Company and the operating effectiveness of such controls, refer to our separate Report in “Annexure B”; and
g) With respect to the other matters to be included in the Auditor’s Report in accordance with Rule 11 of the Companies (Audit and Auditors) Rules, 2014, in our opinion and to the best of our information and according to the explanations given to us:
i. The Company has disclosed the impact of pending litigations on its financial position in its financial statements – Refer Note 26 and 26A to the standalone financial statements;
ii. The Company did not have any long-term contracts including derivative contracts having any material foreseeable losses; and
iii. There has been no delay in transferring amounts, required to be transferred, to the Investor Education and Protection Fund by the Company.
For MGB & Co. LLPChartered Accountants
Firm Registration Number 101169W/W-100035
Hitendra BhandariPartner
Membership Number 107832
Mumbai, 28 April 2016
Annexure referred to in Paragraph 5(I) under the heading of “Report on Other Legal and Regulatory Requirements” of our report of even date to the members of Essel Propack Limited on the standalone financial statements for the year ended 31 March 2016, we report that:
i. (a) The Company has maintained proper records showing full particulars, including quantitative details and situation of fixed assets.
(b) The fixed assets have been physically verified by the management during the year as per the phased program designed to cover all the fixed assets over a period, which in our opinion is reasonable having regard to the size of the Company and nature of its assets. As informed to us, no discrepancies were noticed on such verification.
(c) According to the information and explanations given to us and on the basis of our examination of the records of the Company, the title deeds of immovable properties are held in the name of the Company.
ii. The physical verification of inventory excluding stocks lying with third parties and stocks in transit have been conducted by the Management at reasonable intervals during the year. In respect of inventory lying with third parties, these have been confirmed by them. The discrepancies noticed on physical verification of inventory as compared to book records were not material.
iii. The Company has granted unsecured loan of ` 960,666,940 to a company covered in the register maintained under Section 189 of the Act;
Annexure - A to the Independent Auditor’s Report a) In our opinion, the rate of interest and other terms
and conditions on which the loan had been granted to the company listed in the register maintained under Section 189 of the Act is not, prima facie, prejudicial to the interest of the Company.
b) The aforesaid loan granted is repayable on demand. The borrower is not regular in the payment of interest as stipulated.
c) The amount of interest overdue for more than 90 days as at 31 March 2016 is ` 129,690,037 and the Company has taken reasonable steps for recovery of such interest.
iv. In our opinion and according to the information and explanations given to us, the Company has complied with the provisions of section 185 and 186 of the Act, with respect to the loans/guarantees given, investments made and securities provided.
v. The Company has not accepted any deposits from the public within the meaning of Sections 73 to 76 of the Act and the rules framed thereunder.
vi. We have broadly reviewed the cost records maintained by the Company prescribed by the Central Government under Section 148(1) of the Act and are of the opinion that prima facie the prescribed accounts and records have been made and maintained. We have however not made a detailed examination of such records with a view to determine whether they are accurate or complete.

65
Annual Report 2015-16
vii. According to the records of the Company, examined by us and information and explanations given to us:
a) Undisputed statutory dues including provident fund, employees’ state insurance, income tax, sales tax, service tax, duty of customs, duty of excise, value added tax, cess and others as applicable have generally been regularly deposited with the appropriate authorities except delay in few cases. There are no undisputed
amounts payable in respect of aforesaid dues outstanding as at 31 March 2016 for a period of more than six months from the date they became payable.
b) There are no dues of service tax and duty of customs which have not been deposited on account of any dispute. The disputed dues of income tax, sales tax, duty of excise and value added tax which have not been deposited are as under:
Name of the Statute Nature of the Dues
Amount in (`) Period to which the amount relate
Forum where dispute is pending
Central Excise Act, 1944 Duty of Excise 115,428,779 FY 1996-1997 to FY 2000-2001 Supreme Court12,801,733 FY 2001-2002 to FY 2005-2006 Tribunal CESTAT
205,666 FY 2011-2012 Commissioner of Central Excise (Appeals)
Maharashtra Value Added Tax Act, 2002
Value added tax 5,374,953 FY 2005-2006 Maharashtra Sales Tax Tribunal
24,254,997 FY 2005-2006 and FY 2006-2007 Joint Commissioner of Sales Tax (Appeals)
Himachal Pradesh Value Added Tax Act, 2005
Value added tax 340,626 FY 2008-2009 Additional Excise and Taxation Commissioner
Central Sales Tax Act, 1956
Central sales tax 12,002,023 FY 2002-2003 and FY 2005-2006 Maharashtra Sales Tax Tribunal
22,808,521 FY 2002-2003 to FY 2004-2005 Commissioner of VAT-Dadra and Nagar Haveli
11,449,069 FY 2002-2003, FY 2007-2008 and FY 2008-2009
Deputy Commissioner of Sales Tax (Appeals)
33,756,434 FY 2001-2002, FY 2003-2004 to FY 2005-2006 and FY 2008-2009
Joint Commissioner of Sales Tax (Appeals)
1,241,962 FY 2009-2010 and FY 2011-2012 Assistant Commissioner of Commercial Taxes
The Income Tax Act, 1961 Income tax– Penalty
5,495,518 FY 2006-2007 Income Tax Appellate Tribunal
6,103,595 FY 2007-2008 Commissioner of Income Tax (Appeals)
Income tax 59,207,953 FY 2009-2010 and FY 2010-2011 Income Tax Appellate Tribunal
20,002,237 FY 2006-2007 Commissioner of Income Tax (Appeals)
27,860,016 FY 2011-2012 Commissioner of Income Tax (Appeals) *
* Time limit for filing appeal is not yet expired
viii. According to the records of the Company examined by us and the information and explanations given to us, the Company has not defaulted in repayment of loans or borrowings to financial institutions, banks or dues to debenture holders. The Company does not have any loans from Government.
ix. In our opinion and according to the information and explanations given to us, the Company has not raised any money by way of initial public offer or further public offer
(including debt instruments) and moneys raised by way of term loans during the year have been applied for the purposes for which they were raised.
x. During the course of our examination of the books and records of the Company, carried out in accordance with the generally accepted auditing practices in India, and according to the information and explanations given to us, we have neither come across any instance of material fraud by the Company or on the Company by its officers or employees, noticed or reported during the year, nor have been informed of any such case by the Management.

66
Annual Report 2015-16
xi. According to the records of the Company examined by us, and information and explanations given to us, the Company has paid/provided for managerial remuneration in accordance with the requisite approvals mandated by the provisions of Section 197 read with Schedule V to the Act.
xii. In our opinion and according to the information and explanations given to us, the Company is not a Nidhi company and the Nidhi Rules, 2014 are not applicable to it.
xiii. According to the information and explanations given to us and based on our examination of the records of the Company, transactions with the related parties are in compliance with Sections 177 and 188 of the Act and details of such transactions have been disclosed in the financial statements as required by the applicable accounting standards.
xiv. According to the records of the Company examined by us, and information and explanations given to us, the
Company has not made any preferential allotment or private placement of shares or fully or partly convertible debentures during the year.
xv. According to the records of the Company examined by us, and information and explanations given to us, the Company has not entered into non-cash transactions with directors or persons connected with him.
xvi. The Company is not required to be registered under Section 45-IA of the Reserve Bank of India Act 1934.
For MGB & Co. LLPChartered Accountants
Firm Registration Number 101169W/W-100035
Hitendra BhandariPartner
Membership Number 107832
Mumbai, 28 April 2016
Report on the Internal Financial Controls under Clause (i) of Sub-section 3 of Section 143 of the Companies Act, 2013 (“the Act”)
We have audited the internal financial controls over financial reporting of Essel Propack Limited (“the Company”) as of 31 March 2016 in conjunction with our audit of the standalone financial statements of the Company for the year ended on that date.
Management’s Responsibility for Internal Financial Controls
The Company’s management is responsible for establishing and maintaining internal financial controls based on the internal control over financial reporting criteria established by the Company considering the essential components of internal control stated in the Guidance Note on Audit of Internal Financial Controls Over Financial Reporting (the “Guidance Note”) issued by the Institute of Chartered Accountants of India (ICAI). These responsibilities include the design, implementation and maintenance of adequate internal financial controls that were operating effectively for ensuring the orderly and efficient conduct of its business, including adherence to company’s policies, the safeguarding of its assets, the prevention and detection of frauds and errors, the accuracy and completeness of the accounting records, and the timely preparation of reliable financial information, as required under the Act.
Auditor’s Responsibility
Our responsibility is to express an opinion on the Company's internal financial controls over financial reporting based on our audit. We conducted our audit in accordance with the Guidance Note and the Standards on Auditing, issued by ICAI
Annexure - B to the Independent Auditor’s Reportand deemed to be prescribed under Section 143(10) of the Act, to the extent applicable to an audit of internal financial controls, both applicable to an audit of Internal Financial Controls and, both issued by the ICAI. Those Standards and the Guidance Note require that we comply with ethical requirements and plan and perform the audit to obtain reasonable assurance about whether adequate internal financial controls over financial reporting was established and maintained and if such controls operated effectively in all material respects.
Our audit involves performing procedures to obtain audit evidence about the adequacy of the internal financial controls system over financial reporting and their operating effectiveness. Our audit of internal financial controls over financial reporting included obtaining an understanding of internal financial controls over financial reporting, assessing the risk that a material weakness exists, and testing and evaluating the design and operating effectiveness of internal control based on the assessed risk. The procedures selected depend on the auditor’s judgment, including the assessment of the risks of material misstatement of the financial statements, whether due to fraud or error.
We believe that the audit evidence we have obtained is sufficient and appropriate to provide a basis for our audit opinion on the Company’s internal financial controls system over financial reporting.
Meaning of Internal Financial Controls Over Financial Reporting
A company's internal financial control over financial reporting is a process designed to provide reasonable assurance regarding

67
Annual Report 2015-16
the reliability of financial reporting and the preparation of financial statements for external purposes in accordance with generally accepted accounting principles. A company's internal financial control over financial reporting includes those policies and procedures that (1) pertain to the maintenance of records that, in reasonable detail, accurately and fairly reflect the transactions and dispositions of the assets of the company; (2) provide reasonable assurance that transactions are recorded as necessary to permit preparation of financial statements in accordance with generally accepted accounting principles, and that receipts and expenditures of the company are being made only in accordance with authorisations of management and directors of the company; and (3) provide reasonable assurance regarding prevention or timely detection of unauthorised acquisition, use, or disposition of the company's assets that could have a material effect on the financial statements.
Inherent Limitations of Internal Financial Controls Over Financial Reporting
Because of the inherent limitations of internal financial controls over financial reporting, including the possibility of collusion or improper management override of controls, material misstatements due to error or fraud may occur and not be detected. Also, projections of any evaluation of the internal
financial controls over financial reporting to future periods are subject to the risk that the internal financial control over financial reporting may become inadequate because of changes in conditions, or that the degree of compliance with the policies or procedures may deteriorate.
Opinion
In our opinion, the Company has, in all material respects, an adequate internal financial controls system over financial reporting and such internal financial controls over financial reporting were operating effectively as at 31 March 2016, based on the internal control over financial reporting criteria established by the Company considering the essential components of internal control stated in the Guidance Note issued by the ICAI.
For MGB & Co. LLPChartered Accountants
Firm Registration Number 101169W/W-100035
Hitendra BhandariPartner
Membership Number 107832
Mumbai, 28 April 2016

68
Annual Report 2015-16
Balance Sheet as at 31 March 2016
(Amount in ` ) Notes 2016 2015
EQUITY AND LIABILITIESSHAREHOLDERS’ FUNDSShare capital 3 314,166,845 314,166,845 Reserves and surplus 4 5,224,677,238 4,484,356,602
5,538,844,083 4,798,523,447 NON-CURRENT LIABILITIESLong-term borrowings 5 1,622,369,337 2,749,675,775 Deferred tax liabilities (net) 6 196,412,117 223,764,290 Long-term provisions 7 151,428,523 75,731,791
1,970,209,977 3,049,171,856 CURRENT LIABILITIESShort-term borrowings 8 124,361,557 409,645,729 Trade payables 9 450,662,546 330,347,438 Other current liabilities 10 617,351,819 1,050,330,378 Short-term provisions 7 455,512,947 335,524,535
1,647,888,869 2,125,848,080 Total 9,156,942,929 9,973,543,383 ASSETSNON-CURRENT ASSETSFixed assets 11- Tangible assets 3,162,626,383 3,172,243,113 - Intangible assets 46,156,952 58,994,743 - Capital work-in-progress 113,679,063 34,210,464 - Intangible assets under development 59,260,742 38,475,704
3,381,723,140 3,303,924,024 Non-current investments 12 2,169,207,708 2,907,948,346 Long-term loans and advances 13 337,588,812 467,705,802 Other non-current assets 14 9,824,760 22,984,825
5,898,344,420 6,702,562,997 CURRENT ASSETSInventories 15 653,271,254 673,220,631 Trade receivables 16 1,004,456,535 1,093,298,058 Cash and bank balances 17 29,853,530 14,921,216 Short-term loans and advances 13 1,245,231,442 1,311,838,014 Other current assets 14 325,785,748 177,702,467
3,258,598,509 3,270,980,386 Total 9,156,942,929 9,973,543,383 Notes forming part of the financial statements 1-48
As per our attached report of even date For and on behalf of the BoardFor MGB & Co LLPChartered Accountants Subhash Chandra Ashok GoelFirm Registration Number 101169W/W-100035 Chairman Vice Chairman & Managing Director
Boman MoradianHitendra Bhandari Mukund M. Chitale A.V. GanapathyPartner Radhika Pereira Directors Chief Financial OfficerMembership Number 107832 Atul Goel
Place: Mumbai Suresh SavaliyaDate: 28 April 2016 Head - Legal & Company Secretary

69
Annual Report 2015-16
Statement of Profit and Loss for the year ended 31 March 2016
(Amount in ` )
Notes 2016 2015
REVENUE
Revenue from operations (gross) 18 8,174,477,236 8,093,432,692
Less: Excise duty (745,356,605) (547,297,915)
Revenue from operations (net) 7,429,120,631 7,546,134,777
Other income 19 201,964,218 208,839,663
Total 7,631,084,849 7,754,974,440
ExPENSES
Cost of materials consumed 20 3,380,616,412 3,791,094,267
Changes in inventories of finished goods and goods-in-process 21 (17,262,075) 27,637,357
Employee benefits expense 22 769,940,534 640,187,677
Other expenses 23 1,713,479,309 1,676,148,851
Total 5,846,774,180 6,135,068,152
Profit before depreciation, amortisation, finance costs and tax 1,784,310,669 1,619,906,288
Less:
Depreciation and amortisation expense 11 506,335,295 457,484,575
Finance costs 24 258,713,199 409,323,322
Profit before exceptional items and tax 1,019,262,175 753,098,391
Less: Exceptional items (net) 30 (452,906,039) -
Profit before tax 1,472,168,214 753,098,391
Less: Tax expense
Current tax 342,454,023 174,925,267
Deferred tax (27,352,172) 12,874,733
Profit after tax 1,157,066,363 565,298,391
Earnings per equity share of ` 2 each fully paid up 39
Basic 7.37 3.60
Diluted 7.37 3.60
Notes forming part of the financial statements 1-48
As per our attached report of even date For and on behalf of the BoardFor MGB & Co LLPChartered Accountants Subhash Chandra Ashok GoelFirm Registration Number 101169W/W-100035 Chairman Vice Chairman & Managing Director
Boman MoradianHitendra Bhandari Mukund M. Chitale A.V. GanapathyPartner Radhika Pereira Directors Chief Financial Officer Membership Number 107832 Atul Goel
Place: Mumbai Suresh SavaliyaDate: 28 April 2016 Head - Legal & Company Secretary

70
Notes forming part of the financial statements
Annual Report 2015-16
1. Corporate Information
Essel Propack Limited (hereinafter referred to as ‘EPL’ or ‘the Company’) is a producer of plastic packaging material in the form of multilayer collapsible tubes and laminates used primarily for packaging of toothpaste, personal care, cosmetics, pharmaceuticals, household and industrial products.
2. Significant Accounting Policies
i. Basis of preparation
The financial statements are prepared on going concern basis in accordance with Generally Accepted Accounting Principles in India (Indian GAAP) and comply in all material respects with the Accounting Standards specified under Section 133 of the Companies Act, 2013, read with Rule 7 of the Companies (Accounts) Rules, 2014 and the relevant provisions of the Companies Act, 2013 and guidelines issued by the Securities and Exchange Board of India (SEBI). The financial statements have been prepared on accrual basis and under the historical cost convention. The accounting policies adopted in the preparation of these financial statements are consistent with those of previous year. The financial statements have been prepared without giving effect of the notification issued by The Ministry of Corporate Affairs dated 30 March 2016 amending Companies (Accounting Standards) rules 2006, in line with the guideline issued on 26 April 2016 by ICAI.
ii. Use of estimates
The preparation of financial statements requires the management to make estimates and assumptions that affect the reported amount of assets and liabilities, disclosure of contingent liabilities as at the date of financial statements and the reported amount of revenue and expenses for the year. Actual results could differ from these estimates. Any revision to such accounting estimate is recognised prospectively in current and future periods.
iii. Tangible and Intangible fixed assets
a) Tangible fixed assets (excluding freehold land which is carried at cost) are stated at original cost of acquisition / installation (net of cenvat credit availed) and includes amounts added on revaluation less accumulated depreciation and impairment loss, if any. Cost includes cost of acquisition, construction and installation, taxes, duties, freight, other incidental expenses related to the acquisition, trial run expenses (net of income) and borrowing costs incurred during pre-operational period.
b) Capital work-in-progress comprises cost of tangible fixed assets and related expenses that are not yet ready for their intended use at the reporting date.
c) Intangible assets acquired are measured on initial recognition at cost and stated at cost less accumulated amortization and impairment loss, if any.
iv. Borrowing costs
a) Borrowing costs attributable to the acquisition or construction of qualifying assets till the time such assets are ready for intended use, are capitalised as part of the cost of the assets. All other borrowing costs are expensed in the period they occur.
b) Ancillary costs incurred in connection with the arrangement of borrowings are amortised over the tenure of such borrowings.
v. Impairment of tangible and intangible assets
At each Balance Sheet date, the Company reviews the carrying amount of assets to determine whether there is an indication that those assets have suffered impairment loss. If any such indication exists, the recoverable amount of the assets is estimated in order to determine the extent of impairment loss. The recoverable amount is higher of the net selling price and value in use, determined by discounting the estimated future cash flows expected from the continuing use of the asset to their present value.
vi. Depreciation/Amortisation on tangible and intangible assets
a) Depreciation on tangible fixed assets (including on assets acquired under finance lease) is provided on straight line method based on the useful lives specified in Schedule II of the Companies Act, 2013. Based on the management

71
Notes forming part of the financial statements
Annual Report 2015-16
estimate, the depreciation on the following assets is provided at lower useful life as compared to Schedule II useful life.
Assets Useful Life
Tooling, Moulds, Dyes 7 Years
Hydraulic Works, Pipelines and Slucies (HWPS) 10 Years
b) Premium on Leasehold Land and Leasehold Improvements are amortised over the normal / extendable period of lease.
c) In case of revalued tangible fixed assets, the incremental depreciation attributable to the revaluation is recouped out of revaluation reserve.
d) Intangible assets are amortized on a straight-line basis over the economic useful life estimated by the management.
vii Government grants/subsidies
Grants and subsidies from Government are recognised when there is reasonable assurance that the Company will comply with the conditions attached to them and the grant or subsidy will be received. Government grants in the nature of promoter’s contribution are credited to capital reserve and treated as part of the Shareholder’s funds.
viii. Investments
a) Investments, which are readily realisable and intended to be held for not more than one year from the date on which such investments are made, are classified as current investments. All other investments including investment property are classified as long-term investments.
b) Current investments are stated at lower of cost and fair market value determined on an individual investment basis. Long-term investments are stated at cost less provision for diminution other than temporary in the value of such investments.
ix. Foreign currency transactions
a) Foreign currency transactions are recorded at the exchange rate prevailing on the date of such transaction. Foreign currency monetary assets and liabilities are translated using the exchange rate prevailing at the reporting date. Non-monetary foreign currency items are carried at cost.
b) Gains or losses arising on settlement / translation of foreign currency monetary assets and liabilities at the year-end rates are recognised in the Statement of Profit and Loss except treatment as per amendment to AS-11 effective till 31 March 2020 (Refer note 31).
c) In case of foreign currency monetary assets and liabilities covered by forward contracts, the difference between the year-end rate and rate on the date of the contract is recognised as exchange difference and the premium paid on forward contract is recognised over the life of the contract. Profit or loss on settlement / cancellation of forward contract is recognised as an income or expense for the year in which they arise except treatment as per amendment to AS-11 effective till 31 March 2020 (Refer note 31).
x. Revenue recognition
a) Revenue from sale of goods is recognised on transfer of significant risks and rewards of ownership to the customers. Gross sales include excise duty and is net of sales return, discount, value added tax / sales tax. Export sales are accounted for on the basis of date of bill of lading.
b) Income from royalty and service charges is recognised as per the agreed terms / completion of the service.
c) Export incentives / benefits are accounted on accrual basis.
d) Dividend income is recognised when the right to receive the dividend is established.
e) Interest income is recognised on a time proportion basis taking into consideration the amount outstanding and the applicable interest rate.

72
Notes forming part of the financial statements
Annual Report 2015-16
xi. Inventories
a) Inventories are valued at lower of cost or estimated net realisable value.
b) Cost of raw materials, packing materials and store and spares are determined on moving average cost method.
c) Cost of finished goods and goods-in-process includes cost of direct materials, labour and other manufacturing overheads.
d) Excise liability is included in the valuation of inventory of finished goods.
xii. Retirement and other employee benefits
a) Short-term employee benefits are recognised as an expense at the undiscounted amount in the Statement of Profit and Loss of the year in which the employee renders the service.
b) Post-employment and other long-term benefits are recognised as an expense in the Statement of Profit and Loss at the present value of the amounts payable determined using actuarial valuation techniques in the year the employee renders the service. Actuarial gains and losses are charged to the Statement of Profit and Loss.
c) Payments to defined contribution retirement benefit schemes are expensed as they fall due.
xiii. Accounting for taxes on income
a) Current tax is determined as the amount of tax payable in respect of taxable income for the year as per the provisions of the Income Tax Act, 1961.
b) Deferred tax is recognised, subject to consideration of prudence, on timing differences, being the difference between taxable income and accounting income that originate in one period and are capable of reversal in one or more subsequent periods and measured using relevant enacted tax rates.
c) Minimum Alternate Tax (MAT) paid in accordance with tax laws, which give rise to future economic benefits in the form of adjustment of future tax liability, is recognized as an asset only when, based on convincing evidence, it is probable that the future economic benefits associated with it will flow to the Company and the assets can be measured reliably.
xiv. Lease
a) Finance Lease
Assets acquired on long-term leases, which in economic terms constitute investments financed on a long-term basis i.e. finance lease, are capitalised and the corresponding lease liability is recorded at an amount equal to the fair value of the leased asset at the inception of the lease. Initial costs directly attributable to the lease are recognised with the asset under the lease.
b) Operating Lease
Lease of assets under which all the risks and rewards of ownership are effectively retained by the lessor are classified as operating leases. Lease payments under operating leases are recognised as an expense on accrual basis in accordance with the respective lease agreements.
xv. Earnings per share
Basic earnings per share is computed and disclosed using the weighted average number of equity shares outstanding during the year. Dilutive earnings per share is computed and disclosed using the weighted average number of equity and dilutive equity equivalent shares outstanding during the year, except when the results would be anti-dilutive.
xvi. Provisions, contingent liabilities and contingent assets
Provisions involving substantial degree of estimation in measurement are recognised when there is present obligation as a result of past events and it is probable that there will be an outflow of resources. These estimates are reviewed at each reporting date and adjusted to reflect the current best estimates. Contingent liabilities are not recognised but are disclosed in the financial statements. Contingent assets are neither recognised nor disclosed in the financial statements.

73
Notes forming part of the financial statements
Annual Report 2015-16
(Amount in `)
2016 2015
3. Share capital
Authorised
200,000,000 (200,000,000) equity shares of ` 2 each 400,000,000 400,000,000
Issued
157,101,285 (157,101,285) equity shares of ` 2 each 314,202,570 314,202,570
Subscribed and paid up
157,044,165 (157,044,165) equity shares of ` 2 each (Refer note (a) below) 314,088,330 314,088,330
Add: 57,120 equity shares of ` 2 each Forfeited (Refer note (h) below) 78,515 78,515
Total 314,166,845 314,166,845
a) Reconciliation of number of shares outstanding
2016 2015
Number of equity shares
Amount in ` (at par value)
Number of equity shares
Amount in ` (at par value)
At the beginning of the year 157,044,165 314,088,330 157,101,285 314,202,570
Less: Shares forfeited during the year - - 57,120 114,240
Outstanding at the end of the year 157,044,165 314,088,330 157,044,165 314,088,330
b) Terms / rights attached to equity shares
The Company has only one class of equity shares having a par value of ` 2 per share. Each holder of equity shares is entitled to one vote per share. The Company declares and pays dividend in Indian rupees. The final dividend proposed by the Board of Directors is subject to the approval of the shareholders in the ensuing Annual General Meeting.
In the event of liquidation of the Company, the holders of the equity shares will be entitled to receive remaining assets of the Company, after distribution of preferential amount. The distribution will be in proportion to the number of equity shares held by the shareholders.
c) Details of shares held by holding company and ultimate holding company
Name of Shareholder2016 2015
Number of equity shares
Percentage of holding
Number of equity shares
Percentage of holding
Whitehills Advisory Services Private Limited (Holding company) 88,917,843 56.60% 86,577,843 55.11%
Rupee Finance and Management Private Limited (Ultimate holding company) 100 0.00% 100 0.00%
d) Details of shareholder holding more than 5% equity shares
Name of Shareholder2016 2015
Number of equity shares
Percentage of holding
Number of equity shares
Percentage of holding
Whitehills Advisory Services Private Limited 88,917,843 56.60% 86,577,843 55.11%

74
Notes forming part of the financial statements
Annual Report 2015-16
e) Employees Stock Option Scheme (ESOPS):
During the previous year, the Company had instituted an Essel Employee Stock Option Scheme 2014 (“the Scheme”) as approved by the Board of Directors for issuance of stock options to the eligible employees of the Company and of its subsidiaries, other than directors, promoters or person belonging to promoter group.
Pursuant to the said Scheme, stock options convertible into 176,535 (Previous year 2,953,000) equity shares of ` 2 each were granted to eligible employees at an exercise price of ` 161 (Previous year ` 121.65 per share), being the market price as defined in the Securities and Exchange Board of India (Share Based Employee Benefits) Regulation, 2014 (SEBI Regulation). In view of there being no intrinsic value on the date of the grant (being the excess of market price of share under the Scheme over the exercise price of the option), the Company is not required to account for the value of options as per the SEBI Regulations. Had the Company followed ‘fair value’ method of accounting of employee benefit expense, the reported profit after tax on proforma basis would be lower by ` 40,122,355; and the basic and diluted earnings per share for the year ended 31 March 2016 on proforma basis would have been ` 7.11.
Subject to terms and conditions of the Scheme, the said options will vest on each of 1 July 2016, 1 July 2017 and 1 July 2018 to the extent mentioned in the letter of grant and can be exercised within a maximum period of four years from the date of vesting.
f) No bonus shares have been issued and no shares bought back during five years preceding 31 March 2016.
g) 500,155 equity shares of ̀ 2 each fully paid up were allotted on 14 September 2012 for consideration other than cash, pursuant to the Scheme of Merger of Ras Propack Lamipack Limited and Ras Extrusions Limited with the Company.
h) Forfeited shares consist of 35,725 partly paid up equity shares and 21,395 fully paid up bonus shares forfeited during the previous year. The amount of ` 78,515 in relation to the forfeiture will be transferred to reserves upon cancellation of these shares.
(Amount in `)
2016 2015
4. Reserves and surplus
Capital reserve
As per last balance sheet 398,287,882 398,287,882
Securities premium
As per last balance sheet 1,089,327,000 3,842,983,298
Add/(less): Received during the year - Calls in arrears - 1,041,825
Taken over pursuant to the Scheme of Amalgamation - 903,908,360
Deficit adjusted pursuant to the Scheme of Amalgamation (Refer note 47) - (3,652,605,000)
Expenses adjusted pursuant to the Scheme of Amalgamation - (6,001,483)
1,089,327,000 1,089,327,000
Debenture redemption reserve
As per last balance sheet 75,000,000 -
Add: Transfer from the Statement of Profit and Loss 75,000,000 75,000,000
150,000,000 75,000,000
Revaluation reserve
As per last balance sheet 13,286,208 13,709,420
Less: Transfer to the Statement of Profit and Loss - (423,212)
13,286,208 13,286,208
General reserve
As per last balance sheet 1,254,057,039 1,254,057,039

75
Notes forming part of the financial statements
Annual Report 2015-16
(Amount in `)
2016 2015
Surplus in the Statement of Profit and Loss
As per last balance sheet 1,654,398,473 1,501,818,248
Add: Profit for the year 1,157,066,363 565,298,391
Less: Taken over pursuant to the Scheme of Amalgamation - (275,081)
Less: Appropriations
Adjustment as per transitional provisions of Schedule II to the Companies Act 2013 (net of tax)
- (31,213,063)
Corporate Social Responsibility (CSR) expenditure (Refer note 42) - (4,720,000)
Debenture redemption reserve (75,000,000) (75,000,000)
Proposed equity dividend (345,497,163) (251,270,664)
Tax on proposed equity dividend (including ` 913,461 of earlier year) (71,248,564) (50,239,358)
General reserve - -
2,319,719,109 1,654,398,473
Total 5,224,677,238 4,484,356,602
(Amount in `)
Non-current Current
2016 2015 2016 2015
5. Long-term borrowings
Secured
900 (900) units of redeemable non-convertible debentures of face value of ` 1,000,000 each (Refer note (a) below) 900,000,000 900,000,000 - -
Term loan from banks (Refer note (b), (c), (d) below) - 369,995,102 - 298,492,309
Term loan from others (Refer note (c) and (e) below) - 517,361,111 - 236,111,111
Buyers credit from banks (Refer note (f) and (g) below) 265,246,163 557,542,711 133,345,238 62,292,788
Finance Lease Obligations (Refer note (h) below ) 52,630,608 82,832,607 30,202,001 24,572,559
1,217,876,771 2,427,731,531 163,547,239 621,468,767
Unsecured
Buyers credit from banks (Refer note (i) below) 290,573,871 164,381,762 11,586,226 65,000,000
Term loan from Others (Refer note (j) below) - 8,137,601 8,137,601 7,213,433
Deferred sales tax loan (Refer note (k) below) 113,918,695 149,424,881 35,506,187 47,956,284
404,492,566 321,944,244 55,230,014 120,169,717
Current maturities disclosed under Other current liabilities (Refer note 10) (218,777,253) (741,638,484)
Total 1,622,369,337 2,749,675,775 - -

76
Notes forming part of the financial statements
Annual Report 2015-16
Nature of security and terms of repayments for long-term borrowings
a) Listed redeemable non-convertible debentures Series (A) of ` 500,000,000 (` 500,000,000) and Series (B) of ` 400,000,000 (` 400,000,000) are secured by pari-passu first charge on all fixed assets of the company (except all fixed assets situated at chakan and land and building situated at Goa and Murbad). These debentures are further secured by way of security provided by other related party*.
These debentures carry interest rate at SBI Base Rate + 145 bps p.a. and are redeemable at par in 3 annual installments commencing from 25 April 2019 in the ratio of 30:30:40 with an put/call option at the end of 3 years from date of issue in case of Series A and 3 1/2 years from the date of issue in case of series B, and on each anniversary thereafter untill redemption, and put option in the event of downgrade of credit rating to BBB+/ below.
b) Term loan from banks of ` Nil (` 103,636,366 ) are secured by pari-passu first charge on all fixed assets of the company (except all fixed assets situated at chakan). These loans are further secured by way of security provided and guarantee issued by other related party*.
Term loan from banks and others are fully prepaid during the year.
c) Term loan from banks of ` Nil (` 355,754,545) and Term loan from others ` Nil (` 472,222,222) are secured by pari-passu first charge on all fixed assets of the company (except all fixed assets situated at chakan). These loans are further secured by way of security provided by other related party*.
d) Term loan from bank of ` Nil (` 209,096,500) is secured by pari-passu first charge on all fixed assets of the company (except all fixed assets situated at chakan) and pari-passu second charge on current assets of the company. The loan is further secured by way of security provided by other related party*.
e) Term loan from others ` Nil (` 281,250,000) is secured by pari-passu first charge on all fixed assets of the company (except all fixed assets situated at chakan) and pari-passu second charge on current assets of the company. The loan is further secured by way of security provided and corporate guarantee issued by other related party*.
f) Buyers credit from bank of ` Nil (` 249,171,151) is secured by pari- passu first charge on all fixed assets of the company (except all fixed assets situated at chakan) and pari-passu second charge on current assets of the company. This loan is further secured by way of security provided by other related party*.
Buyers credit from banks carry interest rate ranging from 0.50% to 1.20% p.a. and are repayable in maximum period of three years from the date of transaction. g) Buyers credit from bank of ` 398,591,401 (` 370,664,348) is secured by
pari-passu first charge on all fixed assets of the company (except all fixed assets situated at chakan). This loan is further secured by way of security provided by other related party*.
h) Finance lease obligations are secured by related leased assets. Leases carry interest rate ranging from 12.36% to 13.50% p.a. and are repayable in monthly installments.
i) Buyers credit from banks ` 150,083,925 (` 42,350,874) are against security provided and guarantee issued by other related partly and ` 152,076,172 (` 187,030,888) are against security provided by other related party*.
Buyers credit from banks carry interest rate ranging from 0.50% to 1.31% p.a. and are repayable in maximum period of three years from the date of transaction.
j) Term loan from others ` 8,137,601 (` 15,351,034) are unsecured. Term loan from others carry interest rate 12.24% p.a. and is repayable in quarterly installments by 2016-17.
k) Deferred sales tax interest free loans are repayable after a period of 10 to 14 years from the date of loan upto 2024-25.
*Other related party i.e. Aqualand (India) Limited

77
Notes forming part of the financial statements
Annual Report 2015-16
(Amount in `)2016 2015
6. Deferred tax liabilities (net) Deferred tax liabilitiesDepreciation on fixed assets 259,107,431 274,701,330 Unamortised ancillary borrowing costs 4,216,659 10,859,196
263,324,090 285,560,526 Deferred tax assetsEmployee benefits / expenses allowable on payment basis 46,725,164 37,492,779 Provision for doubtful debts 18,700,808 20,231,325 Others 1,486,001 4,072,132
66,911,973 61,796,236 Total 196,412,117 223,764,290
Long-term Short-term2016 2015 2016 2015
7. ProvisionsEmployee benefits 91,603,733 75,731,791 36,260,549 34,014,513 OthersProvision for direct tax (net of advance tax) - - 3,420,132 - Provision for Contingency 59,824,790 - - - Proposed equity dividend - - 345,497,163 251,270,664 Tax on proposed equity dividend - - 70,335,103 50,239,358 Total 151,428,523 75,731,791 455,512,947 335,524,535
(Amount in `)2016 2015
8. Short-term borrowingsSecured (Refer note (a) and (b) below) Working capital loan from banks 12,666,775 89,052,947 Buyers credit from banks 61,713,335 181,315,141
74,380,110 270,368,088 UnsecuredWorking capital loan from banks - 28,111,157 Buyers credit from banks 49,981,447 111,166,484
49,981,447 139,277,641 Total 124,361,557 409,645,729
Of the total secured short-term borrowingsa) ` 73,101,115 (` 262,154,005) are secured by first pari-passu charge on current assets and second pari-passu charge on all
fixed assets of the Company (except all fixed assets situated at chakan).b) ` 1,278,995 (` 8,214,083) is secured by first pari-passu charge on current assets of the Company.
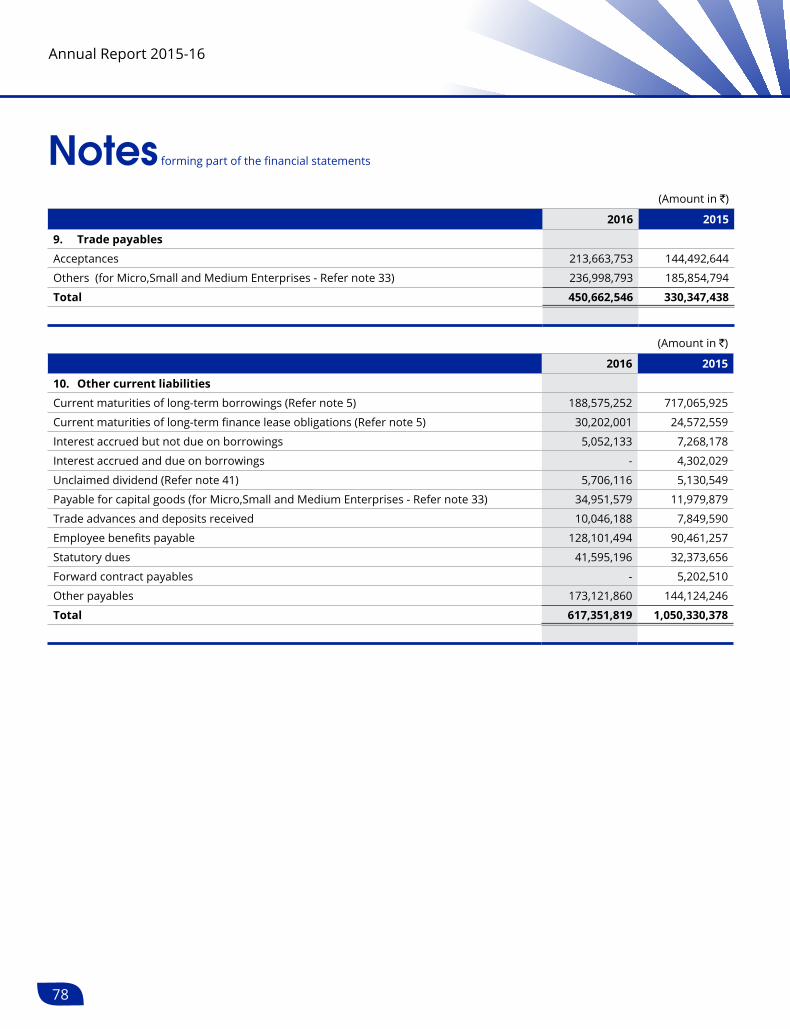
78
Notes forming part of the financial statements
Annual Report 2015-16
(Amount in `)
2016 2015
9. Trade payables
Acceptances 213,663,753 144,492,644
Others (for Micro,Small and Medium Enterprises - Refer note 33) 236,998,793 185,854,794
Total 450,662,546 330,347,438
(Amount in `)
2016 2015
10. Other current liabilities
Current maturities of long-term borrowings (Refer note 5) 188,575,252 717,065,925
Current maturities of long-term finance lease obligations (Refer note 5) 30,202,001 24,572,559
Interest accrued but not due on borrowings 5,052,133 7,268,178
Interest accrued and due on borrowings - 4,302,029
Unclaimed dividend (Refer note 41) 5,706,116 5,130,549
Payable for capital goods (for Micro,Small and Medium Enterprises - Refer note 33) 34,951,579 11,979,879
Trade advances and deposits received 10,046,188 7,849,590
Employee benefits payable 128,101,494 90,461,257
Statutory dues 41,595,196 32,373,656
Forward contract payables - 5,202,510
Other payables 173,121,860 144,124,246
Total 617,351,819 1,050,330,378

79
Annual Report 2015-16 N
ote
11 F
ixed
Ass
ets
(Am
ount
in `
)
Des
crip
tion
of A
sset
s G
ross
Blo
ck
Dep
reci
atio
n/A
mor
tisa
tion
N
et B
lock
A
s at
1
Apr
il 20
15
Add
itio
ns D
educ
tion
s A
s at
31
Mar
ch 2
016
Upt
o 31
M
arch
201
5 F
or t
he y
ear
Ded
ucti
ons
Upt
o 31
M
arch
201
6 A
s at
31
Mar
ch 2
016
As
at 3
1 M
arch
201
5 A
. Ta
ngib
le a
sset
s Fr
eeho
ld L
and
51,
641,
838
- -
51,
641,
838
- 5
1,64
1,83
8 5
1,64
1,83
8 Le
aseh
old
Land
2
,076
,595
-
- 2
,076
,595
5
45,1
80
- -
545
,180
1
,531
,415
1
,531
,415
Le
aseh
old
Impr
ovem
ents
7
,669
,460
-
- 7
,669
,460
7
,565
,008
-
- 7
,565
,008
1
04,4
52
104
,452
Build
ings
5
37,3
82,5
37
69,
336,
372
- 6
06,7
18,9
09
206
,456
,822
2
2,40
6,24
3 -
228
,863
,065
3
77,8
55,8
44
330
,925
,715
Pl
ant
and
Mac
hine
ry
-
Ow
ned
7,3
53,0
67,0
65
368,
410,
823
22,
932,
366
7,6
98,5
45,5
22
4,8
42,4
56,5
78
409
,687
,006
3
,616
,854
5,
248,
526,
730
2,4
50,0
18,7
92
2,5
10,6
10,4
87
-
Leas
ed
227
,026
,743
-
- 2
27,0
26,7
43
35,
621,
473
28,
393,
346
- 6
4,01
4,81
9 1
63,0
11,9
24
191
,405
,270
Eq
uipm
ents
- O
wne
d 1
72,3
98,2
38
43,
455,
110
- 2
15,8
53,3
48
126
,510
,790
1
7,55
4,97
4 -
144
,065
,764
7
1,78
7,58
4 4
5,88
7,44
8
- Le
ased
1
3,71
9,51
3 -
- 1
3,71
9,51
3 3
,411
,802
2
,266
,324
-
5,6
78,1
26
8,0
41,3
87
10,
307,
711
Furn
iture
and
Fix
ture
s 6
4,13
3,58
5 1
4,86
0,50
8 -
78,
994,
093
34,
320,
024
6,0
56,1
38
- 4
0,37
6,16
2 3
8,61
7,93
1 2
9,81
3,56
1 Ve
hicl
es
600
,803
-
- 6
00,8
03
585
,587
-
- 5
85,5
87
15,
216
15,
216
TOTA
L (A
) 8,
429,
716,
377
496
,062
,813
22
,932
,366
8
,902
,846
,824
5
,257
,473
,264
4
86,3
64,0
31
3,6
16,8
54
5,74
0,22
0,44
1 3
,162
,626
,383
3,
172,
243,
113
Pre
viou
s Ye
ar (A
) 7
,782
,691
,204
67
4,06
4,36
3 2
7,03
9,19
0 8
,429
,716
,377
4
,798
,878
,460
4
37,0
31,3
30
25,
708,
656
5,2
57,4
73,2
64
3,17
2,24
3,11
3
B.
Inta
ngib
le a
sset
s So
ftw
are
158
,356
,305
2
,948
,355
-
161
,304
,660
9
9,36
1,56
2 1
9,71
3,29
7 -
119
,074
,859
4
2,22
9,80
1 5
8,99
4,74
3 Pa
tent
s -
4,1
85,1
18
4,1
85,1
18
- 2
57,9
67
- 2
57,9
67
3,9
27,1
51
- TO
TAL
(B)
158
,356
,305
7
,133
,473
-
165
,489
,778
9
9,36
1,56
2 1
9,97
1,26
4 -
119
,332
,826
4
6,15
6,95
2 5
8,99
4,74
3
Prev
ious
Yea
r (B
) 1
51,8
66,0
47
6,4
90,2
58
- 1
58,3
56,3
05
77,
798,
778
20,
876,
456
- 9
9,36
1,56
2 5
8,99
4,74
3
TOTA
L (A
+B)
8,58
8,07
2,68
2 5
03,1
96,2
86
22,9
32,3
66
9,0
68,3
36,6
02
5,3
56,8
34,8
26
506
,335
,295
3
,616
,854
5,
859,
553,
267
3,2
08,7
83,3
35
3,23
1,23
7,85
6
Prev
ious
Yea
r (A
+B)
7,9
34,5
57,2
51
680,
554,
621
27,
039,
190
8,5
88,0
72,6
82
4,8
76,6
77,2
38
457
,907
,786
2
5,70
8,65
6 5
,356
,834
,826
3,
231,
237,
856
C.
Capi
tal w
ork-
in-
prog
ress
1
13,6
79,0
63
34,
210,
464
D.
Inta
ngib
le a
sset
s un
der
deve
lopm
ent
59,
260,
742
38,
475,
704
Not
es:
1Bu
ildin
gs in
clud
e ro
ads,
res
iden
tial fl
ats,
tube
wel
l, w
ater
tank
s an
d sh
are
in c
o-op
erat
ive
soci
ety.
2Fr
eeho
ld la
nd a
nd b
uild
ing
incl
udes
ass
ets
acqu
ired
pur
suan
t to
Sche
me
of M
erge
r of
Ras
Pro
pack
Lam
ipac
k Li
mite
d (“R
PLL”
) and
Ras
Ext
rusi
ons
Lim
ited
(“REL
”) on
the
appo
inte
d da
te 1
Apr
il 20
11. T
he s
aid
asse
ts w
ere
reva
lued
on
30 Ju
ne 1
996
by `
3,2
7,86
,717
on
the
basi
s of
val
uatio
n re
port
of C
hart
ered
Eng
inee
rs d
ated
13
Augu
st 1
996.
3Ad
ditio
ns to
pla
nt a
nd m
achi
nery
and
cap
ital w
ork
in p
rogr
ess
incl
udes
bor
row
ing
cost
s of
` N
il (`
64,0
8,81
4) a
nd e
xcha
nge
diff
eren
ce o
f `6,
05,2
0.35
0 (`
3,7
2,44
,325
) ca
pita
lised
dur
ing
the
year
as
per
Acco
untin
g St
anda
rds.
4D
epre
ciat
ion
for
the
year
of `
Nil
(` 4
23,2
12) i
s re
coup
ed o
ut o
f rev
alua
tion
rese
rve.
5Al
l fixe
d as
sets
of t
he C
ompa
ny (e
xcep
t all
fixed
ass
ets
situ
ated
at C
haka
n an
d la
nd a
t Mur
bad)
are
sub
ject
to fu
rthe
r pa
ri-p
assu
firs
t cha
rge
to s
ecur
e lo
an o
f USD
Nil
(USD
9,
000,
000)
ava
iled
by a
sub
sidi
ary.

80
Notes forming part of the financial statements
Annual Report 2015-16
(Amount in `)
2016 2015
12. Non-current investments
(valued at cost unless stated otherwise)
Trade investments - Unquoted
(A) Equity shares in wholly owned subsidiary companies
830,000 (830,000) of US$ 10 each of Lamitube Technologies Limited, Mauritius @ 899,388,708 899,388,708
1,261 (1,261) of no par value of Arista Tubes Inc., USA * @ 744,341,250 744,341,250
1,600 (1,600) of US$ 1000 each of Lamitube Technologies (Cyprus) Limited, Cyprus @ 71,991,500 71,991,500
Nil (416,150) of ` 100 each of Packaging India Private Limited - 636,240,638
1,715,721,458 2,351,962,096
(B) Preference Shares in wholly owned subsidiary companies
10,400 (10,400) Non-cumulative, Optionally Convertible Redeemable Preference Shares of US$ 1000 each of Lamitube Technologies (Cyprus) Limited, Cyprus with fixed rate of dividend of US$ 110 per share 453,486,250 453,486,250
Nil (1,025,000) 7% Cumulative Redeemable Preference Shares of ̀ 100 each of Packaging India Private Limited - 102,500,000
453,486,250 555,986,250
Total 2,169,207,708 2,907,948,346
Aggregate book value of unquoted investments 2,169,207,708 2,907,948,346
Aggregate provision for diminution in value of investments - -
(All the above securities are fully paid up)
* 7.35% (7.35%) is held through Lamitube Technologies (Cyprus) Limited.
@ The Company has given an undertaking that it will continue to hold / control at least 51% of equity share capital and preference share capital during the tenure of credit facility availed by the subsidiaries from the banks.
(Amount in `)
Long-term Short-term
2016 2015 2016 2015
13. Loans and advances
(unsecured considered good, unless otherwise stated)
Capital advances 31,994,845 63,289,668 - -
Deposits
Related parties 155,010,000 155,010,000 - -
Others 59,117,847 50,184,228 386,000 524,320
214,127,847 205,194,228 386,000 524,320
Loans and advances to related parties
Subsidiary - 130,000,000 - -
Others - - 960,666,940 960,666,940
- 130,000,000 960,666,940 960,666,940

81
Notes forming part of the financial statements
Annual Report 2015-16
(Amount in `)
Long-term Short-term
2016 2015 2016 2015
Other loans and advances
Advances (recoverable in cash or kind) - - 11,995,600 26,309,125
Prepaid expenses 1,359,886 296,595 21,130,008 16,943,898
Loans and advances to employees 848,154 872,328 1,857,118 1,323,179
MAT credit entitlement - - 41,051,865 57,052,168
Balances with government authorities
- Direct tax (net of provisions) 44,627,124 33,805,978 15,126,581 15,126,581
- Indirect tax 44,630,956 34,247,005 193,017,330 233,891,803
91,466,120 69,221,906 284,178,502 350,646,754
Total 337,588,812 467,705,802 1,245,231,442 1,311,838,014
(Amount in `)
Non-current Current
2016 2015 2016 2015
14. Other assets
Deposits with banks having original maturity period of more than twelve months* (Refer note 17)
238,858 2,906,600 - -
Interest receivable from
- Other related parties (Refer note 35) - - 259,735,389 129,690,037
- Others - - 1,549,331 1,195,995
- - 261,284,720 130,886,032
Other receivables from
- Subsidiaries (Refer note 35) - - 36,062,148 21,970,579
- Other related parties (Refer note 35) - - 47,612 -
- Others - - 1,337,769 760,835
- - 37,447,529 22,731,414
Insurance claim receivable (Refer note 26A) - - 19,286,723 -
Export benefits receivable - - 5,000,492 12,785,541
Mark to market gain on foreign exchange forward contracts
- - 168,126 -
Unamortised ancillary borrowing costs 9,585,902 20,078,225 2,598,158 11,299,480
Total 9,824,760 22,984,825 325,785,748 177,702,467
* Deposited with / lien in favour of various Government authorities / banks.

82
Notes forming part of the financial statements
Annual Report 2015-16
(Amount in `)2016 2015
15. InventoriesRaw material (Including goods-in-transit of ` 13,384,338 (` 16,743,209) 215,095,662 207,763,859 Goods-in-process 286,846,305 258,690,102 Finished goods (Including goods-in-transit of ` 3,073,853 (` 1,506,175) 3,073,853 13,967,981 Stores and spares 142,203,385 186,785,712 Packing materials 6,052,049 6,012,977 Total 653,271,254 673,220,631
Details of raw materialsGranules 132,442,470 114,589,322 Foils 24,752,443 35,467,036 Caps 31,672,356 20,246,867 Others 26,228,393 37,460,634 Total 215,095,662 207,763,859
Details of goods-in-processLaminates 215,695,636 204,362,421 Film 35,317,217 20,187,360 Tubes 18,716,945 21,296,311 Others 17,116,507 12,844,010 Total 286,846,305 258,690,102
Details of finished goodsTubes 784,234 13,748,362 Laminates 2,289,619 219,619 Total 3,073,853 13,967,981
(Amount in `)
2016 2015
16. Trade receivables (Unsecured)
Over six months
Considered good 8,816,504 19,671,056
Considered doubtful 54,036,083 58,458,520
62,852,587 78,129,576
Less: Provision for doubtful debts (54,036,083) (58,458,520)
8,816,504 19,671,056
Others* 995,640,031 1,073,627,002
Total 1,004,456,535 1,093,298,058
* Include ` 113,838,032 ( 121,303,766) due from subsidiary/ joint venture companies.

83
Notes forming part of the financial statements
Annual Report 2015-16
(Amount in `)
Non-current Current
2016 2015 2016 2015
17. Cash and bank balances
Cash and cash equivalents
Balance with banks in
Current accounts - - 11,325,885 8,999,943
Cheques on hand / Remittances in transit - - 9,918,257 525,358
Cash on hand - - - 30,486
- - 21,244,142 9,555,787
Other bank balances
Unclaimed dividend accounts - - 5,706,116 5,130,549
Deposits with bank having original maturity period of upto twelve months*
- 234,880
Deposits with bank having original maturity period of more than twelve months*
238,858 2,906,600 2,903,272 -
Disclosed under Other non-current assets (Refer note 14)
(238,858) (2,906,600) - -
- - 8,609,388 5,365,429
Total - - 29,853,530 14,921,216
* Deposited with / lien in favour of various Government authorities / banks.
(Amount in `)
2016 2015
18. Revenue from operations
Sales of product 7,857,331,589 7,818,214,870
Other operating revenues
Royalty/Service charges 245,290,546 23,706,406
Sale of scrap 36,497,157 33,209,820
Export and other incentives 17,357,944 18,301,596
Revenue from operations (gross) 8,174,477,236 8,093,432,692
Less: Excise duty (745,356,605) (547,297,915)
Revenue from operations (net) 7,429,120,631 7,546,134,777
Details of sales by products (net of excise duty)
Tubes 6,294,779,993 6,577,482,713
Laminates 783,944,980 660,051,007
Others (includes sale of scrap) 89,240,994 67,710,882
Total 7,167,965,967 7,305,244,602

84
Notes forming part of the financial statements
Annual Report 2015-16
(Amount in `)
2016 201519. Other incomeInterest from
- Subsidiaries 4,893,698 16,899,996
- Others * 149,343,271 148,035,897
Profit on sale / discard of fixed assets (net) 1,413,904 -
Miscellaneous income 46,313,345 43,903,770
Total 201,964,218 208,839,663
* Includes interest on loans, bank deposits, etc.
(Amount in `)
2016 2015
20. Cost of materials consumed
Inventory at the beginning of the year 207,763,859 249,050,631
Add: Purchases (net) 3,387,948,215 3,749,807,495
3,595,712,074 3,998,858,126
Less: Inventory at the end of the year 215,095,662 207,763,859
Total 3,380,616,412 3,791,094,267
Details of materials consumed
Granules 1,972,286,994 2,208,489,800
Foils 286,278,276 287,009,620
Caps 670,331,689 755,442,188
Others 451,719,453 540,152,659
Total 3,380,616,412 3,791,094,267
(Amount in `)
2016 201521. Changes in inventories of finished goods and goods-in-processInventory at the end of the year Finished goods 3,073,853 13,967,981
Goods-in-process 286,846,305 258,690,102
289,920,158 272,658,083 Inventory at the beginning of the year Finished goods 13,967,981 26,489,819
Goods-in-process 258,690,102 273,805,621
272,658,083 300,295,440 Total (17,262,075) 27,637,357

85
Notes forming part of the financial statements
Annual Report 2015-16
(Amount in `)
2016 2015
22. Employee benefits expense
Salaries, wages and bonus 648,537,794 544,030,194
Contribution to provident and other funds 34,037,951 30,050,037
Gratuity 20,945,908 12,911,891
Staff welfare expenses 66,418,881 53,195,555
Total 769,940,534 640,187,677
(Amount in `)
2016 2015
23. Other expenses
Stores and spares 233,879,630 204,630,685
Packing materials 203,672,518 217,773,642
Power and fuel 336,853,415 329,264,049
Job work / labour charges 277,671,199 261,584,144
Lease rental – Plant, Machinery and equipments 63,212,455 69,043,319
Other manufacturing expenses 18,474,112 16,104,895
Factory rent 22,049,315 19,478,904
Repairs and maintenance
- Buildings 6,807,284 10,608,556
- Plant and machinery 40,635,589 31,776,402
- Others 10,103,916 4,914,109
Rent 43,374,252 41,216,248
Rates and taxes 13,589,197 23,859,848
Insurance 6,796,518 6,294,807
Directors' sitting fees 961,600 1,065,000
Travelling and conveyance expenses 24,908,717 22,805,997
Professional and consultancy charges 47,871,348 54,848,752
Communication charges 10,959,042 10,607,608
Miscellaneous expenses 156,331,884 145,908,556
Loss on sale/discard of fixed assets (net) - 1,329,234
Donation 23,000 10,650
Exchange differences (net) 17,015,322 24,629,202
Payment to auditors (Refer details below) 7,379,103 6,009,185
Freight and forwarding expenses 144,596,089 161,033,393
Corporate social responsibility (Refer note 42) 6,253,467 -
Bad and doubtful debts (net of provision) 20,060,337 11,351,666
Total 1,713,479,309 1,676,148,851

86
Notes forming part of the financial statements
Annual Report 2015-16
(Amount in `)
2016 2015Payment to auditors for:
Audit fees 2,671,680 2,671,680
Tax audit 367,356 367,356
Tax representations and others 2,327,331 1,296,955
Certifications (including fees for limited review) 1,848,189 1,370,832
Reimbursement of expenses 164,547 302,362
Total 7,379,103 6,009,185
(Amount in `)
2016 201524. Finance costsInterest expenses
- Borrowings 198,894,747 346,241,687
- Others 7,257,631 756,086
Other financial charges 34,675,212 39,462,744
(includes amortisation of ancillary borrowing costs of ` 6,346,443 (` 19,919,595)
Exchange difference on borrowings (net) 17,885,609 22,862,805
Total 258,713,199 409,323,322
25. Capital and other commitments(Amount in `)
2016 2015Estimated amount of contracts remaining to be executed on capital account, not provided for (net of advances)
208,231,012 252,713,655
26. Contingent liabilities not provided for(Amount in `)
2016 2015i. Unexpired letters of credit (net of liability provided) - 122,511,606
ii. Guarantees and counter guarantees given by the Company for loans taken by subsidiaries. Loans outstanding against these guarantees are ` 4,104,412,562 ( ` 4,015,510,115)
5,606,599,234 5,997,576,115
iii. Disputed indirect taxes * 246,347,688 225,335,118
iv. Disputed direct taxes ^ 207,004,250 114,043,068
v. Claims not acknowledged as debts 4,996,550 4,996,550
vi. Deferred sales tax liability assigned 60,836,967 68,605,087
vii. Duty benefit availed under EPCG scheme, pending export obligations 237,683,555 263,739,439

87
Notes forming part of the financial statements
Annual Report 2015-16
* Does not include disputed excise duty of ̀ 115,428,779 (` 115,428,779) for alleged undervaluation in inter unit transfer of web, for captive consumption as it does not have significant impact on profits of the Company since excise duty paid by one unit is admissible as Cenvat credit at other unit. Further, the appeal filed by Excise Department against the decision (in Company’s favour) of High Court is pending before the Hon’ble Supreme Court.
^ Without considering relief granted by the Appellate Authorities in favour of the Company, tax effect ̀ 37,078,269 (` 33,422,849) (approx.), which is pending with relevant authority.
26 A. This claim is in respect of transit damage to the plant equipment, which is under litigation before National Consumer Dispute Redressal Commission, New Delhi (Refer Note 14).
27. Managerial remuneration
a. Details of remuneration paid / payable to the managing director included in Employee benefits expense are as under:
(Amount in `)
2016 2015
i. Salaries, allowances and perquisites ^ 43,519,200 40,440,000
ii. Contribution to provident and other funds 3,484,800 3,240,000
iii. Performance bonus * 24,170,000 20,000,000
Total 71,174,000 63,680,000
^ Excludes leave encashment and gratuity provided on the basis of actuarial valuation on an overall Company basis.
* The performance bonus for the current year has been provided in the accounts as recommended by the nomination and remuneration committee and approved by the Board of Directors. The total remuneration to Managing Director on this basis as computed as per the Companies Act, 2013 is within limits prescribed u/s 197 of the Companies Act, 2013 and approval of shareholders as required therein.
b. Professional and consultancy charges include commission payable to Non-executive independent directors ` 6,000,000 for the year ended 31 March 2016 (Previous year included ` 4,474,521 provided for and ` 3,600,000 paid for the year ended 31 March 2015 and 31 March 2014 respectively).
28. Leases
a. Finance Lease
The Company has acquired plant and machinery and equipments under finance lease which are capitalized under tangible fixed assets. The minimum lease payments required under this finance lease that have initial or remaining non-cancelable lease terms in excess of one year as at 31 March 2016 and its present value are as follows:
(Amount in `)
2016 2015
Minimum lease payment as at
Not later than one year 39,524,457 36,536,980
Later than one year but not later than five years 58,368,003 97,892,460
97,892,460 134,429,440
Less: Amount representing interest 15,059,851 27,024,274
Present value of Minimum lease payments 82,832,609 107,405,166
Not later than one year 30,202,001 24,572,559
Later than one year but not later than five years 52,630,608 82,832,607

88
Notes forming part of the financial statements
Annual Report 2015-16
b. Operating Lease
The Company has taken premises, residential facilities, plant and machinery (including equipment) and vehicles under cancellable/ non-cancellable operating lease agreements that are renewable on a periodic basis at the option of both the lessor and the lessee. The initial tenure of the leases varies from eleven to one hundred and eight months. The rental obligations are as follows:
(Amount in `)
2016 2015
Lease rental charges for the year 139,493,672 145,283,384
Future lease rental obligation payable (under non-cancellable leases)
Not later than one year 217,016,256 112,342,865
Later than one year but not later than five years 467,589,698 218,345,292
Later than five years 278,500,108 14,319,000
Total 963,106,062 345,007,157
29. Divestment of Packaging India private Limited
On 13 July 2015, the Company has divested its wholly owned subsidiary, Packaging India Private Limited for full cash consideration as part of its strategy to pursue growth opportunity in its tube packaging business which has great potential across the globe in the Beauty & Cosmetics, Pharma & Health and Food categories. Gain on divestment of ` 468,913,916 credited to the Statement of Profit and Loss for the year net off transaction costs and contingencies for any possible indemnity/claim.
30. Exceptional items (net) for the year include
(a) Gain of ` 468,913,916 on divestment of its wholly owned subsidiary (Refer Note 29) and (b) ` 16,007,877 write off of ancillary borrowing costs on account of pre-payment of long-term borrowings and related charges thereof.
31. Foreign exchange difference
The Companies (Accounting Standards) Amendment Rules, 2011 has amended provisions of AS-11 relating to “The Effect of Changes in Foreign Exchanges Rates” vide notification dated 11 May 2011 (as amended on 29 December 2011 and further clarification dated 9 August 2012) issued by The Ministry of Corporate Affairs (MCA). In terms of these amendments, exchange difference loss (net) of ` 60,520,350 (` 37,244,325) is capitalised to cost of fixed assets/capital work-in-progress.
32. Derivative instruments and unhedged foreign currency exposure
a. Derivative contracts (being foreign exchange forward contracts for hedging purposes) entered into by the Company and outstanding as at 31 March :
i. For payments to be received against exports and other receivables
Forward Contracts
2016 2015
Amount in Foreign Currency
Equivalent Indian `
Amount in Foreign Currency
Equivalent Indian `
USD / INR USD 900,000 59,629,500 USD 1,000,000 62,500,000

89
Notes forming part of the financial statements
Annual Report 2015-16
ii. For payments to be made against imports and other payables
Forward Contracts
2016 2015Amount
in Foreign Currency
Equivalent Indian `
Amount in Foreign Currency
Equivalent Indian `
USD / INR USD 5,015,934 332,330,705 USD7,329,706 458,106,625
EUR / INR EUR 467,062 35,214,139 Nil Nil
CHF / INR CHF 4,276,825 295,015,389 CHF 1,933,100 124,221,006
iii. Cross currency hedges
Forward Contracts
2016 2015Amount
in Foreign Currency
Amount in Foreign Currency
In respect of payables
CHF / USD CHF 3,923,205 CHF 5,844,551
b. Outstanding foreign currency exposures not hedged by derivative instruments
(Amount in `)
2016 2015Foreign currency payables 415,624,039 699,493,130
Foreign currency receivables 110,006,545 136,086,236
33. Micro, Small and Medium Enterprises
Disclosure required under the Micro, Small and Medium Enterprises Development Act, 2006 (“The Act”) are given as follows:
(Amount in `)
2016 2015i. Principal amount payable to suppliers under the Act
- For capital goods 2,387,809 158,335
- For Others 19,493,627 9,123,812
ii. Principal amount due to suppliers under the Act - -
iii. Interest accrued and due to suppliers under the Act, on the above amount - -
iv. Payment made to suppliers (Other than interest) beyond the appointed day, during the year
81,156,441 38,902,409
v. Interest paid to suppliers under the Act - -
vi. Interest due and payable to suppliers under the Act, for payments already made 376,263 229,491
vii. Interest accrued and remaining unpaid at the end of the year under the Act 1,785,344 1,409,081
Note: The information has been given in respect of such vendors to the extent they could be identified as “Micro and Small“ enterprises on the basis of information available with the Company.

90
Notes forming part of the financial statements
Annual Report 2015-16
34. Gratuity and other post employment benefit plans
As per Accounting Standard – 15 “Employee Benefits”, the disclosures of employee benefits as defined in the Accounting Standard are given below:
a. The Company makes annual contributions to the employees’ gratuity fund scheme, a funded defined benefit plan which is managed by LIC of India. The present value of obligation is determined based on actuarial valuation using the projected unit credit method, which recognizes each period of service as giving rise to additional unit of employee benefit entitlement and measures each unit separately to build up the final obligation.
b. Leave encashment is a non-funded defined benefit scheme. The obligation for leave encashment is recognized in the same manner as gratuity.
c. Details of post retirement gratuity plan are as follows:-
i. Expenses recognised during the year
(Amount in `)
2016 2015
Current service cost 5,680,392 5,585,232
Interest cost 7,786,624 8,072,136
Expected return on plan assets (3,108,270) (2,863,602)
Actuarial (gain) / loss 7,669,785 2,118,125
Benefits paid by employer 2,917,377 -
Net expenses 20,945,908 12,911,891
ii. Net liability recognised in the balance sheet
(Amount in `)
2016 2015
Fair value of plan assets 35,301,225 38,708,216
Present value of obligation 110,519,975 99,563,860
Liability recognized in balance sheet 75,218,750 60,855,644
iii. Reconciliation of opening and closing balances of defined benefit obligation
(Amount in `)
2016 2015Defined benefit obligation as at the beginning 99,563,860 86,771,004
Current service cost 5,680,392 5,585,232
Interest cost 7,786,624 8,072,136
Actuarial (gain) / loss on obligation 6,939,762 2,141,496
Liability transferred in 1,234,767 -
Benefits paid (10,685,430) (3,006,008)
Defined benefit obligation at the closing 110,519,975 99,563,860
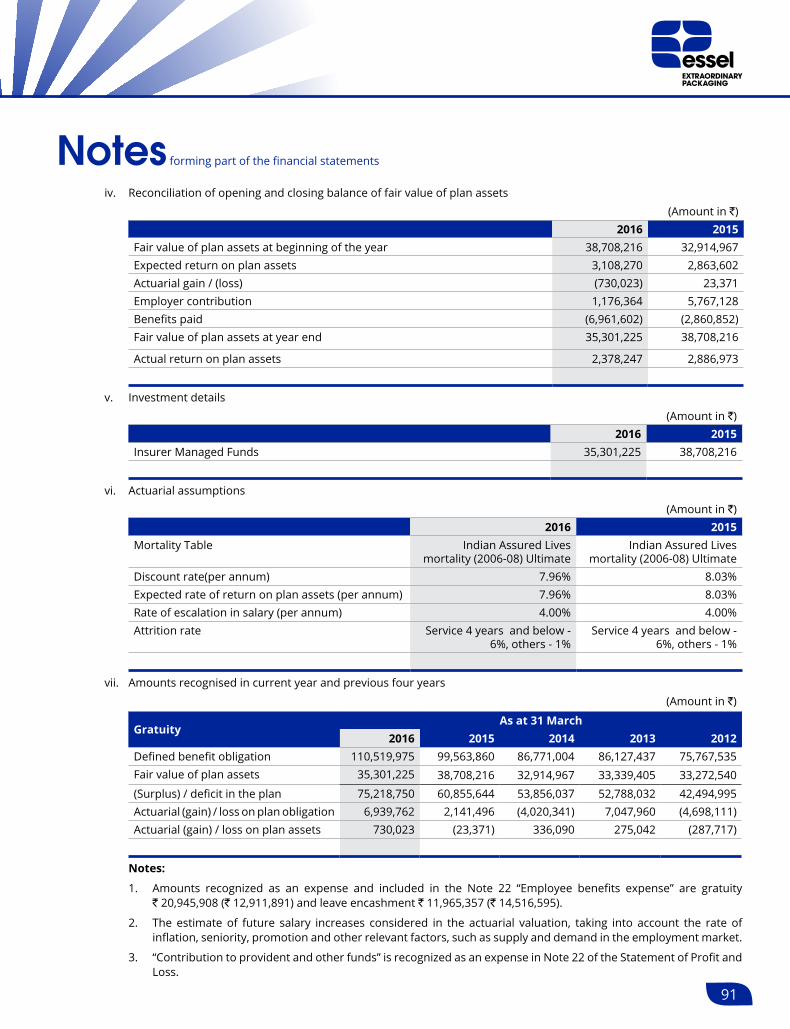
91
Notes forming part of the financial statements
Annual Report 2015-16
iv. Reconciliation of opening and closing balance of fair value of plan assets(Amount in `)
2016 2015Fair value of plan assets at beginning of the year 38,708,216 32,914,967 Expected return on plan assets 3,108,270 2,863,602 Actuarial gain / (loss) (730,023) 23,371 Employer contribution 1,176,364 5,767,128 Benefits paid (6,961,602) (2,860,852)Fair value of plan assets at year end 35,301,225 38,708,216
Actual return on plan assets 2,378,247 2,886,973
v. Investment details(Amount in `)
2016 2015Insurer Managed Funds 35,301,225 38,708,216
vi. Actuarial assumptions(Amount in `)
2016 2015Mortality Table Indian Assured Lives
mortality (2006-08) Ultimate Indian Assured Lives
mortality (2006-08) Ultimate Discount rate(per annum) 7.96% 8.03%Expected rate of return on plan assets (per annum) 7.96% 8.03%Rate of escalation in salary (per annum) 4.00% 4.00%Attrition rate Service 4 years and below -
6%, others - 1%Service 4 years and below -
6%, others - 1%
vii. Amounts recognised in current year and previous four years(Amount in `)
GratuityAs at 31 March
2016 2015 2014 2013 2012Defined benefit obligation 110,519,975 99,563,860 86,771,004 86,127,437 75,767,535Fair value of plan assets 35,301,225 38,708,216 32,914,967 33,339,405 33,272,540(Surplus) / deficit in the plan 75,218,750 60,855,644 53,856,037 52,788,032 42,494,995Actuarial (gain) / loss on plan obligation 6,939,762 2,141,496 (4,020,341) 7,047,960 (4,698,111)Actuarial (gain) / loss on plan assets 730,023 (23,371) 336,090 275,042 (287,717)
Notes:
1. Amounts recognized as an expense and included in the Note 22 “Employee benefits expense” are gratuity ` 20,945,908 (` 12,911,891) and leave encashment ` 11,965,357 (` 14,516,595).
2. The estimate of future salary increases considered in the actuarial valuation, taking into account the rate of inflation, seniority, promotion and other relevant factors, such as supply and demand in the employment market.
3. “Contribution to provident and other funds” is recognized as an expense in Note 22 of the Statement of Profit and Loss.

92
Notes forming part of the financial statements
Annual Report 2015-16
35. a. Related party disclosures
List of parties where control exists
i. Ultimate holding company
Rupee Finance and Management Private Limited
ii. Holding company
Whitehills Advisory Services Private Limited (Refer note 44)
iii. Subsidiary companies
Name of the subsidiary
Proportion of interest (including beneficial
interest) / voting power (either directly
/ indirectly through subsidiaries)
Country of Incorporation
Direct subsidiary
Arista Tubes Inc. * 100% (100%) USA
Lamitube Technologies (Cyprus) Limited 100% (100%) Cyprus
Packaging India Private Limited ^^ -- (100%) India
Lamitube Technologies Limited 100% (100%) Mauritius
Step down subsidiary
The Egyptian Indian Company for Modern Packaging S.A.E.^ 75% (75%) Egypt
Essel Propack MISR for Advanced Packaging S.A.E. 75% (75%) Egypt
Lamitube Hong Kong Trading Company Limited 100% (100%) Hong Kong
Essel Packaging (Guangzhou) Limited 100% (100%) China
Essel Packaging (Jiangsu) Limited 100% (100%) China
Essel Propack Philippines, Inc 100% (100%) Philippines
MTL de Panama S.A. 100% (100%) Panama
Packtech Limited ^^^ 100% (100%) Mauritius
Arista Tubes Limited 100% (100%) United Kingdom
Essel Propack UK Limited 100% (100%) United Kingdom
Essel de Mexico, S.A. de C.V. 100% (100%) Mexico
Tubo pack de Colombia S.A. 100% (100%) Colombia
Essel Propack LLC 100% (100%) Russia
Essel de Colombia S.A.S. # 100% (--) Colombia
Essel Propack Polska Sp. Z.O.O. 100% (100%) Poland
Essel Propack America, LLC 100% (100%) USA
* 7.35% (7.35%) is held through Lamitube Technologies (Cyprus) Limited
^^ Divested on 13 July 2015 (Refer note 29)
^^^ Merged with Lamitube Technologies Limited during the year
^ Subsidiary has discontinued its operations and is under liquidation
# Incorporated during the year


94
Notes forming part of the financial statements
Annual Report 2015-16
(Amount in `)
2016 2015
Total Amount
Amount for Major Parties
Total Amount
Amount for Major Parties
Joint venture 22,681,426 24,159,468 Essel Deutschland GmbH & Co., KG Dresden 22,681,426 24,159,468
c) Guarantee commission received or receivable Subsidiaries 42,282,356 42,852,541 Lamitube Technologies Limited 28,162,224 25,011,176 Lamitube Technologies (Cyprus) Limited 3,057,094 6,360,982 Essel Propack Polska Sp.Z.O.O. 9,862,842 9,016,014
d) Purchase of goods and services Subsidiaries 2,993,678 1,384,191 Essel Propack America, LLC 1,761,463 742,378 Packaging India Private Limited - 299,611 Essel Propack Polska Sp. Z.O.O. 522,067 16,372 Essel Packaging (Guangzhou) Limited 231,100 194,148 Other related parties 2,369,109 4,145,705 ITZ Cash Card Limited 1,708,148 2,528,376 Shrotra Enterprises Private Limited 267,430 1,379,387
e) Purchase of fixed assets Subsidiaries 21,627,893 2,530,105 Essel Propack Russia, LLC 21,627,893 - Arista Tubes, Inc. - 484,270 Essel Propack Polska Sp. Z.O.O. - 2,045,835
f) Balance written offJoint venture - 1,768,364Essel Deutschland GmbH & Co., KG Dresden - 1,768,364
g) Rent expenses Subsidiaries - 5,256,454 Essel Propack Polska Sp. Z.O.O. - 5,256,454 Other related parties 41,749,405 39,140,398 Ayepee Lamitubes Limited 3,945,243 3,940,318 Ganjam Trading Company Private Limited 37,804,163 35,100,000
h) Guarantee commission paid Other related parties 13,695,459 - Aqualand (India) Limited 13,695,459 -
i) Repayment of Loans / advances / deposits taken Other related parties - 300,000 Ayepee Lamitubes Limited - 300,000
j) Interest income on Loans /advances / deposits /given
Subsidiaries 4,893,698 16,899,996 Packaging India Private Limited 4,893,698 16,899,996 Other related parties 144,494,836 144,100,041 Sprit Textiles Private Limited 144,494,836 144,100,041
k) Remuneration paid/provided 71,174,000 63,680,000Key management personnel Managing Director # 71,174,000 63,680,000 # Refer note 27

95
Notes forming part of the financial statements
Annual Report 2015-16
(Amount in `)
2016 2015
Total Amount
Amount for Major Parties
Total Amount
Amount for Major Parties
(II) Balances outstanding as at 31 March 2016 a) Trade receivables
Subsidiaries 101,510,764 105,032,321 Essel Propack America, LLC 9,911,545 21,392,618 Essel Packaging (Guangzhou) Limited 41,384,409 41,601,840 Essel Propack MISR for Advanced Packaging S.A.E. 34,518,120 22,569,835 Essel Propack Polska Sp. Z.O.O. 4,903,112 10,543,011 Joint venture 12,327,268 16,271,445 Essel Deutschland Gmbh & Co., KG Dresden 12,327,268 16,271,445 Other related parties 74,495 2,352,623 Shrotra Enterprises Private Limited 74,495 2,246,612
b) Loans / advances / deposits given Subsidiaries - 130,000,000 Packaging India Private Limited - 130,000,000 Other related parties 1,115,676,940 1,115,676,940 Ayepee Lamitubes Limited 125,000,000 125,000,000 Sprit Textiles Private Limited 960,666,940 960,666,940
c) Other receivables Subsidiaries 36,062,147 21,970,579 Essel Propack America, LLC 6,284,971 3,090,081 Essel Propack MISR for Advanced Packaging S.A.E. 2,214,941 1,426,384 Essel Packaging (Guangzhou) Limited 13,031,532 8,205,649 Essel Propack Polska Sp.Z.O.O. 6,328,731 4,827,852 Other related parties 47,612 - Ayepee Lamitubes Limited 47,612 -
d) Interest receivable Other related parties 259,735,389 129,690,037 Sprit Textiles Private Limited 259,735,389 129,690,037
e) Trade and other payables Subsidiaries 23,121,195 22,951 Essel Propack America, LLC 22,603,375 22,951 Other related parties 938,213 121,756 Ganjam Trading Company Private Limited 938,213 - Ayepee Lamitubes Limited - 121,756
f) Investments in shares / debentures Subsidiaries 2,169,207,708 2,907,948,346 Lamitube Technologies Limited 899,388,708 899,388,708 Lamitube Technologies (Cyprus) Limited 525,477,750 525,477,750
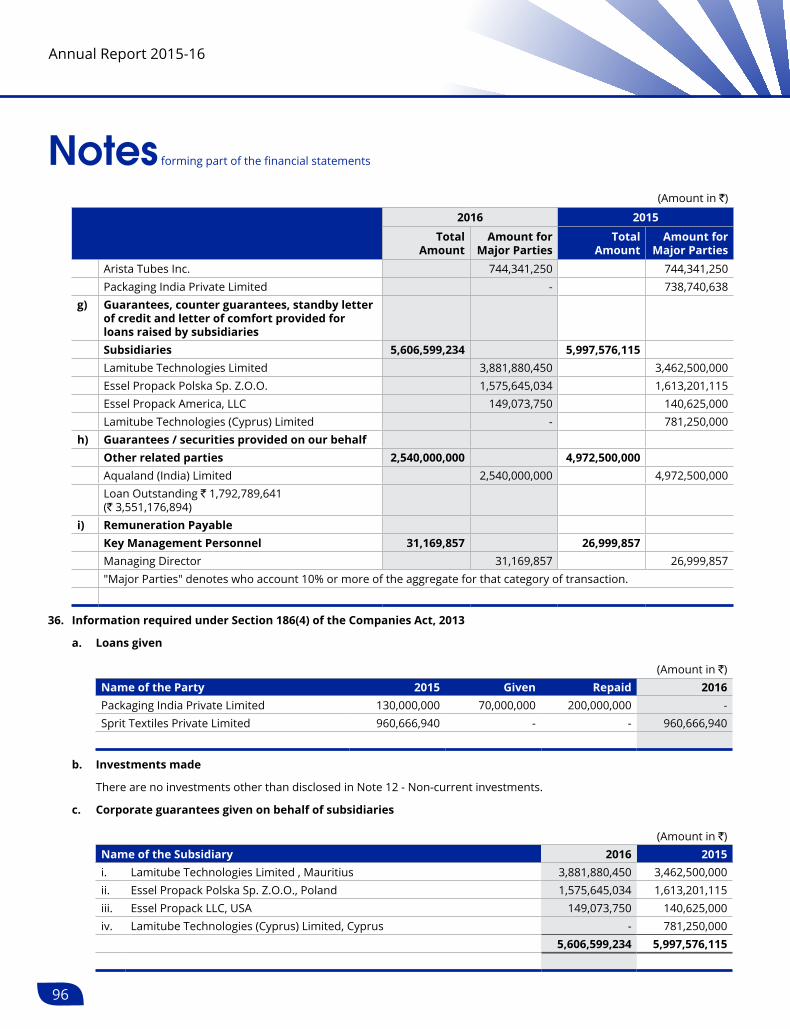
96
Notes forming part of the financial statements
Annual Report 2015-16
(Amount in `)
2016 2015
Total Amount
Amount for Major Parties
Total Amount
Amount for Major Parties
Arista Tubes Inc. 744,341,250 744,341,250 Packaging India Private Limited - 738,740,638
g) Guarantees, counter guarantees, standby letter of credit and letter of comfort provided for loans raised by subsidiaries Subsidiaries 5,606,599,234 5,997,576,115 Lamitube Technologies Limited 3,881,880,450 3,462,500,000 Essel Propack Polska Sp. Z.O.O. 1,575,645,034 1,613,201,115 Essel Propack America, LLC 149,073,750 140,625,000 Lamitube Technologies (Cyprus) Limited - 781,250,000
h) Guarantees / securities provided on our behalf Other related parties 2,540,000,000 4,972,500,000 Aqualand (India) Limited 2,540,000,000 4,972,500,000 Loan Outstanding ` 1,792,789,641 (` 3,551,176,894)
i) Remuneration Payable Key Management Personnel 31,169,857 26,999,857 Managing Director 31,169,857 26,999,857 "Major Parties" denotes who account 10% or more of the aggregate for that category of transaction.
36. Information required under Section 186(4) of the Companies Act, 2013
a. Loans given
(Amount in `)Name of the Party 2015 Given Repaid 2016Packaging India Private Limited 130,000,000 70,000,000 200,000,000 - Sprit Textiles Private Limited 960,666,940 - - 960,666,940
b. Investments made
There are no investments other than disclosed in Note 12 - Non-current investments.
c. Corporate guarantees given on behalf of subsidiaries
(Amount in `)Name of the Subsidiary 2016 2015i. Lamitube Technologies Limited , Mauritius 3,881,880,450 3,462,500,000 ii. Essel Propack Polska Sp. Z.O.O., Poland 1,575,645,034 1,613,201,115 iii. Essel Propack LLC, USA 149,073,750 140,625,000 iv. Lamitube Technologies (Cyprus) Limited, Cyprus - 781,250,000
5,606,599,234 5,997,576,115

97
Notes forming part of the financial statements
Annual Report 2015-16
d. Security provided for loan availed by the subsidiary
(Amount in `)
Name of the Subsidiary
Sanctioned loan Amount
as at 31 March 2016
Sanctioned loan Amount
as at 31 March 2015
Lamitube Technologies Limited, Mauritius - 750,000,000
Notes
i. All the loans/guarantees and security given are for general business purposes.
ii. The loans are interest bearing and at arm’s length.
iii. Loans given to Sprit Textiles Private Limited is repayable on demand.
iv. The outstanding loan amount availed by the subsidiaries against the corporate guarantees/security given by the Company as at 31 March 2016 is ` 4,104,412,562 ( ` 4,015,510,115).
v. Amounts disclosed in (c) and (d) are translated at respective year-end foreign exchange rates.
37. a. Disclosure as required by Schedule V (A)(2) of the SEBI (Listing Obligations and Disclosure Requirements) Regulations, 2015
Loans to Subsidiary/Associate companies:
(Amount in `)
LoaneeBalances as at
Maximum amount outstanding during the year
2016 2015 2016 2015
Packaging India Private Limited - 130,000,000 200,000,000 130,000,000
Note: Loans to others are repayable on demand and hence not considered in the above disclosure requirements. However, interest is charged on terms not prejudicial to the interests of the company.
b. Investments by Loanee in the equity shares of the Company as at 31 March 2016
LoaneeNumber of fully paid up equity
shares
2016 2015
Sprit Textiles Private Limited 784,025 784,025

98
Notes forming part of the financial statements
Annual Report 2015-16
38. Value of imported and indigenous raw materials, stores and spares and packing materials consumed and percentage of each to the total consumption
2016 2015Percentage
(%)Amount
(`)Percentage
(%)Amount
(`)a. Raw materials
i. Imported 59 1,992,731,899 58 2,209,474,548 ii Indigenous 41 1,387,884,513 42 1,581,619,719
b. Stores and sparesi. Imported 26 61,342,205 33 68,510,997 ii Indigenous 74 172,537,425 67 136,119,688
c. Packing materialsi. Indigenous 100 203,672,518 100 217,773,642
39. Earnings per share
(Amount in `)
2016 2015
Profit after tax 1,157,066,363 565,298,391
Weighted average number of Basic and diluted Equity Shares (Nos.) 157,044,165 157,044,165
Nominal value of equity shares 2.00 2.00
Basic and diluted earnings per share 7.37 3.60
40. Other information (Amount in `)
2016 2015C.I.F. value of importsRaw materials 1,844,278,539 2,012,651,723 Stores and spares 43,922,993 76,289,014 Capital goods 318,217,787 453,791,070
Expenditure in foreign currency (on accrual basis) Financial charges (Gross) 15,019,255 25,546,809 Travelling expenses 195,989 1,168,434 Others (Gross) 1,836,182 8,109,484
FOB value of exportsSales including deemed exports 973,710,219 997,508,887
Income in foreign currency (on accrual basis)Royalty / service charges 164,289,184 159,065,907 Miscellaneous income 42,282,356 42,852,541
41. Dividend of ̀ 747,569 (` Nil) unclaimed for a period of more than seven years is transferred to Investor Education and Protection Fund during the year. There is no amount due and outstanding to be credited to Investor Education and Protection Fund as at 31 March 2016.

99
Notes forming part of the financial statements
Annual Report 2015-16
42. Corporate Social Responsibility (CSR)
The Company has towards various CSR initiatives spent ` 6,253,467 (` 4,720,000) as against `14,071,399 (` 13,100,454) as required by Section 135 read with Schedule VII of the Companies Act 2013. CSR spend during the year has been charged to the Statement of Profit and Loss under “Other Expenses” in line with ICAI guidance note issued in May 2015. In the previous year, the CSR spend had been appropriated out of Reserves and Surplus as permitted under then prevailing ICAI guidelines.
43. Research & Development Expenditure
During the year, the Company has received recognition for In-house Research & Development (R&D) unit from the Department of Scientific and Industrial Research (DSIR) w.e.f. 30 September 2015. The Company has incurred total R&D expenditure of ` 63,419,077 (` 95,086,135) including Capital expenditure of ` 12,500,839 (` 13,440,000), out of which the Company has considered weighted tax deduction on eligible R&D expenditure of ` 37,302,989 (` Nil) including Capital expenditure of ` 12,500,839 (` Nil) under Section 35 (2AB) of the Income Tax Act 1961.
44. Amalgamation of Whitehills Advisory Services Private Limited (Whitehills) with the Company
The Board Directors of the Company at its meeting held on October 29, 2015, have approved the Scheme of Amalgamation of Whitehills Advisory Services Private Limited (Whitehills), its holding company, with the Company. There would be neither any change in the capital structure nor any change in the promoter shareholding of the Company and there will be no dilution for any public shareholders. The Company is in the process of obtaining requisite approvals of Statutory / Regulatory authorities. A court convened meeting in this respect is being scheduled on 11 May 2016, as directed by the Hon’ble High Court of Judicature at Mumbai.
45. Segment information
The financial statements of the Company contain both the consolidated financial statements as well as the separate financial statements of the parent Company. Hence, the Company has presented segment information on the basis of the Consolidated Financial Statements as permitted by Accounting Standard -17.
46. Taxation
Provision for tax has been computed considering the impact of prescribed Income Computation and Disclosure Standards (ICDS).
47. The Scheme of Amalgamation (“the Scheme”) of EP Lamitubes Limited (“Transferor company”) with the Company w.e.f. 1 April 2014, was sanctioned by the Hon’ble High Court of Judicature at Mumbai and accounted for as per “Pooling of Interest” method prescribed under Accounting Standard 14 “Accounting for Amalgamations”, in the financial statements for the year ended 31 March 2015, the difference of ` 3,652,605,000 between net assets taken over, extinguishment of Company’s investments in transferor company and other reserves taken over being adjusted to Securities Premium in terms of the Scheme.
48. Prior period comparatives
Previous year’s figures have been regrouped / reclassified wherever necessary to correspond with current year’s classifications / disclosures. Figures in brackets pertain to previous year.
As per our attached report of even date For and on behalf of the BoardFor MGB & Co LLPChartered Accountants Subhash Chandra Ashok GoelFirm Registration Number 101169W/W-100035 Chairman Vice Chairman & Managing Director
Boman MoradianHitendra Bhandari Mukund M. Chitale A.V. GanapathyPartner Radhika Pereira Directors Chief Financial Officer Membership Number 107832 Atul Goel
Place: Mumbai Suresh SavaliyaDate: 28 April 2016 Head - Legal & Company Secretary

100
Annual Report 2015-16
Cash flow statement for the year ended 31 March 2016
(Amount in ` )
2016 2015
A Cash flow from operating activities
Profit before tax 1,472,168,214 753,098,391
Adjustments for:
Depreciation and amortisation expense 506,335,295 457,484,575
Interest expense 206,152,378 346,997,773
Interest Income (154,236,969) (164,935,893)
Excess receipt over book value of investment - (214,230)
Loss/ (gain) on sale of fixed assets (net) (1,421,211) 1,329,234
Gain on divestment of subsidiary (net off provision for contingencies) (475,651,104) -
Provision for doubtful debts written back (net) (4,422,438) (9,283,997)
Amortisation of ancillary borrowing costs 19,631,144 19,919,595
Exchange adjustments (net) (5,856,481) (35,792,181)
Operating profit before working capital changes 1,562,698,828 1,368,603,266
Adjustments for:
(Increase) / decrease in trade and other receivables 129,037,159 (174,274,053)
(Increase) / decrease in inventories 19,949,377 54,585,431
Increase / (decrease) in trade and other payables 216,489,076 (131,598,830)
Cash generated from operations 1,928,174,440 1,117,315,814
Corporate social responsibility expenditure incurred (refer note 42) - (4,720,000)
Direct taxes paid (net of refunds) (333,854,734) (166,239,681)
Net cash from operating activities (A) 1,594,319,706 946,356,133
B Cash flow from investing activities
Purchase of fixed assets (including capital work-in-progress) (507,365,850) (725,915,990)
Sale of fixed assets 1,450,000 1,300
Decrease in other bank balances (576,217) (2,421,037)
Loans given to subsidiaries (70,000,000) -
Repayment of loan given to subsidiary 200,000,000 -
Sale of investments in subsidiary 1,274,216,532 1,217,608
(Increase)/decrease in other receivables of subsidiaries (net) (14,139,181) 23,684,955
Expenses incurred pursuant to the scheme of amalgamation - (6,001,483)
Interest received 23,838,281 292,847,488
Net cash from/(used in) investing activities (B) 907,423,565 (416,587,159)
C Cash flow from financing activities
Proceeds from calls in arrears (including securities premium) - 1,077,750
Proceeds from issue of non-convertible debentures - 900,000,000
Proceeds from long-term borrowings 456,503,954 867,650,352
Repayment of long-term borrowings (2,123,916,614) (1,895,297,098)
Repayment of short-term borrowings (25,940,813) (12,428,524)

101
Annual Report 2015-16
Cash flow statement for the year ended 31 March 2016
(Amount in ` )
2016 2015
Increase / (decrease) in other borrowings (net) (257,173,015) 148,514,572
Principal payment under finance lease (24,572,559) (25,014,349)
Interest paid (212,670,452) (347,456,244)
Dividend paid (including tax) (301,847,917) (228,264,653)
Ancillary borrowing costs incurred (437,500) (23,822,350)
Net cash used in financing activities (C) (2,490,054,916) (615,040,544)
Net changes in cash and cash equivalents (A+B+C) 11,688,355 (85,271,570)
Cash and cash equivalents received pursuant to the Scheme of Amalgamation - 43,478,419
Cash and cash equivalents at the beginning of the year 9,555,787 51,348,938
Cash and cash equivalents at the end of the year 21,244,142 9,555,787
Earmarked balances with banks 8,609,388 5,365,429
Cash and bank balances at the end of the year 29,853,530 14,921,216
Notes: Previous year figures are regrouped / reclassified wherever necessary.
As per our attached report of even date For and on behalf of the BoardFor MGB & Co LLPChartered Accountants Subhash Chandra Ashok GoelFirm Registration Number 101169W/W-100035 Chairman Vice Chairman & Managing Director
Boman MoradianHitendra Bhandari Mukund M. Chitale A.V. GanapathyPartner Radhika Pereira Directors Chief Financial Officer Membership Number 107832 Atul Goel
Place: Mumbai Suresh SavaliyaDate: 28 April 2016 Head - Legal & Company Secretary

102
Annual Report 2015-16Annual Report 2015-16
Independent Auditors’ ReportTo,The Members of Essel Propack Limited
Report on the Consolidated Financial Statements
1. Wehaveauditedtheaccompanyingconsolidatedfinancialstatements of Essel Propack Limited (“the Holding Company”), its subsidiaries, associate and jointly controlled entities (collectively referred to as “the Group”) comprising of the consolidated balance sheet as at 31 March 2016, the consolidatedstatementofprofitandloss,theconsolidatedcashflowstatementfortheyearthenended,andasummaryofthesignificantaccountingpoliciesandotherexplanatoryinformation (hereinafter referred to as “the consolidated financialstatements”).
Management’s Responsibility for the Consolidated Financial Statements
2. The Holding Company’s Board of Directors is responsible forthepreparationoftheconsolidatedfinancialstatementsin terms of the requirements of the Companies Act, 2013 (“theAct”)thatgiveatrueandfairviewoftheconsolidatedfinancial position, consolidated financial performanceand consolidated cash flows of the Group in accordancewith theaccountingprinciplesgenerallyaccepted in IndiaincludingtheAccountingStandardsspecifiedunderSection133oftheActreadwithRule7oftheCompanies(Accounts)Rules, 2014. The Holding Company’s Board of Directors is also responsible for ensuring accuracy of records including financial information considered necessary forthe preparation of Consolidated Financial Statements. The respective Board of Directors of the Companies included in the Group are responsible for maintenance of adequate accounting records in accordance with the provisions ofthe Act for safeguarding the assets of the Group and for preventing and detecting frauds and other irregularities; the selection and application of appropriate accounting policies; making judgments and estimates that are reasonable and prudent; and the design, implementation and maintenance ofadequateinternalfinancialcontrols,thatwereoperatingeffectively forensuringtheaccuracyandcompletenessofthe accounting records, relevant to the preparation and presentationofthefinancialstatementsthatgiveatrueandfairviewandarefreefrommaterialmisstatement,whetherduetofraudorerror,whichhasbeenusedforthepurposeofpreparationoftheconsolidatedfinancialstatementsbythe Directors of the Holding Company, as aforesaid.
Auditor’s Responsibility
3. Our responsibility is to express an opinion on theseconsolidatedfinancialstatementsbasedonouraudit.
We have taken into account the provisions of the Act, the accounting and auditing standards and matters which
are required to be included in the audit report under the provisions of the Act and the Rules made thereunder.
WeconductedourauditinaccordancewiththeStandardson Auditing specified under section 143(10) of the Act.Those standards require that we comply with ethicalrequirements and plan and perform the audit to obtain reasonable assurance about whether the consolidatedfinancialstatementsarefreefrommaterialmisstatement.
An audit involves performing procedures to obtain audit evidence about the amounts and the disclosures in the consolidatedfinancialstatements.Theproceduresselecteddepend on the auditor’s judgment, including the assessment of the risks of material misstatement of the consolidated financial statements, whether due to fraud or error. Inmaking those risk assessments, the auditor considers internalfinancialcontrolrelevanttotheHoldingCompany’spreparation of the consolidated financial statements thatgiveatrueandfairview,inordertodesignauditproceduresthat are appropriate in the circumstances. An audit also includes evaluating the appropriateness of the accounting policies used and the reasonableness of the accounting estimates made by the Holding Company’s Board of Directors,aswellasevaluatingtheoverallpresentationoftheconsolidatedfinancialstatements.
We believe that the audit evidence obtained by us and the audit evidence obtained by the other auditors in terms of their reports referred to in sub-paragraph 5 of the Other Matter paragraph below is sufficient and appropriate toprovide a basis for our audit opinion on the consolidated financialstatements.
Opinion
4. In our opinion and to the best of our information andaccording to the explanations given to us, the aforesaidconsolidated financial statements give the informationrequired by the Act in the manner so required and give a true and fair view in conformity with the accountingprinciplesgenerallyaccepted in India,of theconsolidatedstateofaffairsof theCompanyasat31March2016,andtheirconsolidatedprofitandtheirconsolidatedcashflowsfor the year ended on that date.
Other Matters
5. a) We did not audit the financial statements ofsubsidiaries and jointly controlled entities of the Group,whosefinancialstatements reflect revenueof` 14,436,536,301, total assets of `13,893,987,657andnetcashoutflowsamountingto`328,663,756fortheyear then ended, as considered in the consolidated financialstatements.Thesefinancialstatementshavebeen audited by other auditors whose reports havebeen furnished to us, and our opinion in so far as it

103
Annual Report 2015-16Annual Report 2015-16
relates to the amounts and disclosures included in respect of these subsidiaries and jointly controlled entities is based solely on the reports of the other auditors.
b) Theconsolidatedfinancialstatementsincluderevenueof ` 500,329,854, total assets of ` 1,142,782,754 andnet cash inflows amounting to ` 1,216,789 for threemonths ended 30 June 2015, in respect of a subsidiary divestedduring the year,whosefinancial statementsare approved by the Board of Directors of the subsidiaryandhavebeen reviewedbyotherauditor,whosereporthasbeenfurnishedtous,andourreportin so far as it relates to the amounts and disclosures included in respect of the said subsidiary is based solely onsuchreviewedunauditedfinancialstatements.
c) The consolidated financial statements also includethe Group’s share of profit of ` 27,449,023 for theyear ended 31 March, 2016, in respect of an associate, whose financial statements have not been auditedby us. These financial statements are unaudited andhave been presented to us by the Management and our opinion, in so far as it relates to the amounts and disclosures included in respect of the aforesaid associate, isbasedsolelyonsuchunauditedfinancialstatements. In our opinion and according to theinformation and explanations given to us, thesefinancialstatementsarenotmaterialtotheGroup.
Our opinion on the consolidated financial statements isnotmodified in respectof theabovematterswithregardto our reliance on thework done and the reports of theotherauditorsandthefinancialstatementscertifiedbytheManagement.
Report on Other Legal and Regulatory Requirements
6. AsrequiredbySection143(3)oftheAct,wereport,totheextentapplicable,that:
a) We have sought and obtained all the information and explanationswhichtothebestofourknowledgeandbeliefwerenecessaryforthepurposesofourauditoftheaforesaidconsolidatedfinancialstatements;
b) In our opinion, proper books of account as requiredby law relating to preparation of the aforesaidconsolidated financial statements have been kept sofarasitappearsfromourexaminationofthosebooksand the reports of the other auditors;
c) The consolidated balance sheet, the consolidated Statement of profit and loss, and the consolidatedcash flow statement dealt with by this Report are inagreement with the relevant books of account andrecords maintained for the purpose of preparation of theconsolidatedfinancialstatements;
d) In our opinion, the aforesaid consolidated financialstatements comply with the Accounting StandardsspecifiedunderSection133oftheAct,readwithRule7of the Companies (Accounts) Rules, 2014;
e) On the basis of thewritten representations receivedfrom the directors of the Holding Company and taken on record by the Board of Directors of the Holding Company,noneofthedirectorsisdisqualifiedason31March 2016 from being appointed as a director of the Holding Company in terms of Section 164(2) of the Act;
f) With respect to the other matters to be included in the Auditor’s Report in accordance with Rule 11 ofthe Companies (Audit and Auditors) Rules, 2014, in our opinion and to the best of our information and accordingtotheexplanationsgiventous:
i. The Group has disclosed the impact of pending litigations on its financial position in itsconsolidatedfinancialstatements-ReferNote29totheconsolidatedfinancialstatements;
ii. The Group did not have any long-term contracts including derivative contracts having any material foreseeable losses; and
iii. There has been no delay in transferring amounts, required to be transferred, to the InvestorEducation and Protection Fund by the Holding Company.
For MGB & Co. LLPChartered Accountants
FirmRegistrationNumber101169W/W-100035
Hitendra BhandariPartner
MembershipNumber107832
Mumbai, 28 April 2016

104
Annual Report 2015-16
Consolidated Balance Sheet as at 31 March 2016
(Amount in ` ) Notes 2016 2015
EQUITY AND LIABILITIESSHAREHOLDERS’ FUNDSShare capital 3 314,166,845 314,166,845 Reserves and surplus 4 9,443,536,456 7,515,498,947
9,757,703,301 7,829,665,792
Minority interests 81,438,162 80,753,898
NON-CURRENT LIABILITIESLong-termborrowings 5 5,668,963,715 6,434,274,035Deferredtaxliabilites(net) 12 (a) 269,291,991 313,079,953Other long-term liabilities 6 - 11,719,082Long-term provisions 7 195,401,601 132,710,976
6,133,657,307 6,891,784,046 CURRENT LIABILITIESShort-termborrowings 8 697,445,481 1,414,140,120 Trade payables 9 1,306,239,329 1,611,210,911 Other current liabilities 6 2,209,121,808 2,946,175,183Short-term provisions 7 555,472,778 501,502,213
4,768,279,396 6,473,028,427 Total 20,741,078,166 21,275,232,163 ASSETSNON-CURRENT ASSETSFixedassets - Tangible assets 10 9,280,701,572 8,703,835,823 -Intangibleassets 10 124,256,169 168,492,184 -Capitalworkinprogress 10 511,491,981 843,440,202 -Intangibleassetsunderdevelopment 10 59,582,263 44,197,970
9,976,031,985 9,759,966,179 Non-currentinvestments 11 475,933,863 457,523,864Deferredtaxassets(net) 12 (b) 153,160,286 175,758,502Long-term loans and advances 13 626,794,373 565,939,918 Other non-current assets 14 98,900,273 85,497,179
11,330,820,780 11,044,685,642 CURRENT ASSETSInventories 15 2,070,396,519 2,317,570,192Trade receivables 16 3,354,721,491 3,757,552,256Cash and bank balances 17 850,410,349 1,164,141,791Short-term loans and advances 13 2,791,695,255 2,782,848,826Other current assets 14 343,033,772 208,433,456
9,410,257,386 10,230,546,521 Total 20,741,078,166 21,275,232,163 NotesformingpartoftheConsolidatedFinancialStatements 1-42
As per our attached report of even date For and on behalf of the BoardFor MGB & Co LLPChartered Accountants Subhash Chandra Ashok GoelFirmRegistrationNumber101169W/W-100035 Chairman Vice Chairman & Managing Director
Boman MoradianHitendra Bhandari Mukund M. Chitale A.V. GanapathyPartner Radhika Pereira Directors ChiefFinancialOfficerMembershipNumber107832 Atul Goel
Place:Mumbai Suresh SavaliyaDate:28April2016 Head - Legal & Company Secretary

105
Annual Report 2015-16
Statement of Consolidated Profit and Loss for the year ended 31 March 2016
(Amount in `) Notes 2016 2015
REVENUERevenue from operations (gross) 18 22,627,675,388 23,946,271,756Less:Exciseduty (781,210,431) (716,706,184)Revenue from operations (net) 21,846,464,957 23,229,565,572Other income 19 237,411,263 209,615,616 Total 22,083,876,220 23,439,181,188
ExPENSESCost of materials consumed 20 9,621,055,453 11,368,329,779Changesininventoriesoffinishedgoodsandgoods-in-process 21 (64,256,738) (6,075,329)Employeebenefitsexpense 22 3,788,033,783 3,628,305,077Otherexpenses 23 4,330,111,126 4,331,399,189 Total 17,674,943,624 19,321,958,716
Profit before depreciation, amortisation, finance costs and tax 4,408,932,596 4,117,222,472 Less:Depreciationandamortisationexpense 10 1,269,798,329 1,317,938,471Finance costs 24 623,422,088 793,565,210Profit before exceptional items and tax 2,515,712,179 2,005,718,791
Less:Exceptionalitems(net) 32 (23,455,336) (55,191,644)Profit before tax 2,539,167,515 2,060,910,435
Less: Tax expenseCurrentTax -Currentyear 712,844,425 475,252,719 - Earlier years 6,270,350 38,453,953 Deferredtax (3,368,096) 96,826,316 Profit after tax before minority interest and share of profit of associate
1,823,420,836 1,450,377,447
Add:Shareofprofitfromassociate 27,449,023 3,154,063 Less:Minorityinterests 30,171,329 47,215,353Profit for the year 1,820,698,530 1,406,316,157
Earnings per equity share of ` 2 each fully paid up 34Basic and Diluted 11.59 8.95 NotesformingpartoftheConsolidatedFinancialStatements 1-42
As per our attached report of even date For and on behalf of the BoardFor MGB & Co LLPChartered Accountants Subhash Chandra Ashok GoelFirmRegistrationNumber101169W/W-100035 Chairman Vice Chairman & Managing Director
Boman MoradianHitendra Bhandari Mukund M. Chitale A.V. GanapathyPartner Radhika Pereira Directors ChiefFinancialOfficerMembershipNumber107832 Atul Goel
Place:Mumbai Suresh SavaliyaDate:28April2016 Head - Legal & Company Secretary

106
Notes forming part of the Consolidated financial statements
Annual Report 2015-16
1. Basis of preparation of Consolidated financial statements
These consolidatedfinancial statements havebeenpreparedunder thehistorical cost conventionon going concernbasisinaccordancewiththeGenerallyAcceptedAccountingPrinciplesinIndia(IndianGAAP),includingtheAccountingStandardsnotifiedundertherelevantprovisionsoftheCompaniesAct,2013.
2. Principles of Consolidation
i) The Consolidated Financial Statements (CFS) relate to Essel Propack Limited and its subsidiary Companies, associate and jointly controlled entities.
ii) Thefinancialstatementsof theparentcompanyand itssubsidiarieshavebeenconsolidatedona line-by-linebasisbyadding together thebookvaluesof like itemsofassets, liabilities, incomeandexpensesaftereliminating Intra-groupbalances, intra-group transactionsand theunrealisedprofits.Minority interest in subsidiaries represents theminorityshareholders’ proportionate share of the net assets and net income.
iii) Thefinancialstatementsoftheparentcompanyanditssubsidiarieshavebeenconsolidatedusinguniformaccountingpolicies.
iv) The CFS include the financial statements of the parent company and the subsidiaries (as listed in the table below).Subsidiariesare consolidated from thedateonwhicheffective control isacquiredandareexcluded from thedateoftransfer/disposal.
Name of the Subsidiary Proportion of interest (including beneficial interest) / voting power (either directly / indirectly through
subsidiaries)
Country of Incorporation
Direct Subsidiary
AristaTubesInc.* 100% (100%) USA
Lamitube Technologies (Cyprus) Limited 100% (100%) Cyprus
PackagingIndiaPrivateLimited** --- (100%) India
Lamitube Technologies Limited 100% (100%) Mauritius
Step down Subsidiary
TheEgyptianIndianCompanyforModernPackagingS.A.E.# 75%(75%) Egypt
EsselPropackMISRforAdvancedPackagingS.A.E. 75%(75%) Egypt
Lamitube Hongkong Trading Company Limited 100% (100%) Hong Kong
Essel Packaging (Guangzhou) Limited 100% (100%) China
Essel Packaging (Jiangsu) Limited 100% (100%) China
EsselPropackPhilippines,Inc 100% (100%) Philippines
MTL de Panama S.A. 100% (100%) Panama
Packtech Limited ^ --- (100%) Mauritius
Arista Tubes Limited 100% (100%) United Kingdom
Essel Propack UK Limited 100% (100%) United Kingdom
EsseldeMexico,S.A.deC.V. 100% (100%) Mexico
Tubo pack de Colombia S.A. 100% (100%) Colombia
Essel de Colombia S.A.S.^^ 100% (---) Colombia

107
Notes forming part of the Consolidated financial statements
Annual Report 2015-16
Name of the Subsidiary Proportion of interest (including beneficial interest) / voting power (either directly / indirectly through
subsidiaries)
Country of Incorporation
Essel Propack LLC 100% (100%) Russia
Essel Propack Polska Sp. Z.O.O. 100% (100%) Poland
Essel Propack America, LLC 100% (100%) USA
*7.35%(7.35%)isheldthroughLamitubeTechnologies(Cyprus)Limited
**Divestedon13July,2015
#Subsidiaryhasdiscontinueditsoperationsandisunderliquidation
^MergedwithLamitubeTechnologiesLimitedduringtheyear
^^Incorporatedduringtheyear
v) Associate
TheGrouphasadoptedandaccountedforInvestmentinAssociateusingthe“EquityMethod”asperAS-23.
Name of the Associate Extent of holding Country of Incorporation
P.T. Lamipak Primula ^ 30% (30%) Indonesia
^NoadjustmentismadefordifferenceinaccountingpolicyofinventoriesvaluedonFirstInFirstOut(FIFO)basis.
vi) Jointly controlled entities
The Group has adopted and accounted for interest in the Jointly controlled entities using the “Proportionate Consolidation Method”asperAS-27.
Name of the Joint Venture Extent of holding Country of Incorporation
Essel Deutschland Management GmbH 24.90% (24.90%) Germany
Essel Deutschland GmbH & Co. KG, Dresden 24.90% (24.90%) Germany
2.1. Significant Accounting Policies
a. Use of estimates
Thepreparationoffinancialstatementsrequires themanagement tomakeestimatesandassumptionsthataffect thereportedamountofassetsandliabilities,disclosureofcontingentliabilitiesasatthedateoffinancialstatementsandthereportedamountofrevenueandexpensesfortheyear.Actualresultscoulddifferfromtheseestimates.Anyrevisiontosuch accounting estimate is recognised prospectively in current and future periods.
b. Tangible and Intangible fixed assets
i) Goodwill / Capital Reserve on Consolidation
Goodwillrepresentsthedifferencebetweenthegroup’sshareinthenetworthofthesubsidiary/associateandthecostofacquisitionatthedateonwhichtheinvestmentinthesubsidiary/associateismade/acquired.Capitalreserverepresentsnegativegoodwillarisingonconsolidation.

108
Notes forming part of the Consolidated financial statements
Annual Report 2015-16
ii) Tangible and intangible assets
a) Tangiblefixedassets(excludingfreeholdlandwhichiscarriedatcost)arestatedatoriginalcostofacquisition/installation (net of cenvat credit availed) and includes amounts added on revaluation less accumulated depreciation andimpairmentloss,ifany.Costincludescostofacquisition,constructionandinstallation,taxes,duties,freight,other incidental expenses related to the acquisition, trial run expenses (net of income) and borrowing costsincurred during pre-operational period.
b) Capitalwork-in-progresscomprisescostoftangiblefixedassetsandrelatedexpensesthatarenotyetreadyfortheir intended use at the reporting date.
c) Intangible assets acquired are measured on initial recognition at cost and stated at cost less accumulatedamortization and impairment loss, if any.
c. Depreciation / amortisation on tangible and intangible assets
i) In case of Parent Company -
Depreciationontangiblefixedassets(includingonassetsacquiredunderfinancelease)isprovidedonstraightlinemethodbasedontheuseful livesspecified inSchedule IIof theCompaniesAct,2013.Depreciation ischargedon pro-ratabasisforassetpurchased/soldduringtheyear.Basedonthemanagementestimate,thedepreciationonthefollowingassetsisprovidedatlowerusefullifeascomparedtoScheduleIIusefullife.
Assets Useful Life
Tooling, Moulds, Dyes 7Years
Hydraulic Works, Pipelines and Slucies (HWPS) 10Years
ii) In case of Subsidiaries, Associate and Jointly controlled entities -
Depreciationontangibleassets(includinganassetacquiredunderfinancelease)isprovidedattheratesadoptedintheaccountsofrespectivesubsidiaries,associateandjointlycontrolledentitiesaspermissibleunder local lawsonstraightlinebasisfromthetimetheyareavailableforuse,soastowriteofftheircostovertheestimatedusefullifeofthe assets.
iii) PremiumonLeaseholdLandandLeasehold improvementsareamortisedover thenormal /extendableperiodoflease.
iv) Intangibleassetsareamortisedonastraight-linebasisovertheeconomicusefullifeestimatedbythemanagement.
v) Nopartofgoodwillarisingonconsolidationisamortized.
d. Impairment of tangible and intangible assets
AteachBalanceSheetdate,theGroupreviewsthecarryingamountofassetstodeterminewhetherthereisanindicationthatthoseassetshavesuffered impairment loss. Ifanysuch indicationexists, therecoverableamountof theassets isestimatedinordertodeterminetheextentofimpairmentloss.Therecoverableamountishigherofthenetsellingpriceandvalueinuse,determinedbydiscountingtheestimatedfuturecashflowsexpectedfromthecontinuinguseoftheassetto their present value.
e. Borrowing costs
i) Borrowingcostsattributabletotheacquisitionorconstructionofqualifyingassetstillthetimesuchassetsarereadyforintendeduse,arecapitalisedaspartofthecostoftheassets.Allotherborrowingcostsareexpensedintheperiodthey occur.
ii) Ancillarycosts incurred inconnectionwith thearrangementofborrowingsareamortisedover the tenureofsuchborrowings.

109
Notes forming part of the Consolidated financial statements
Annual Report 2015-16
f. Investments
Investments intendedtobeheldformorethanoneyear, fromthedateofacquisition,areclassifiedas long-termandare carried at cost. Provision for diminution in value of long-term investments is made to recognise a decline other than temporary.Currentinvestmentsarecarriedatcostorfairvalue,whicheverislower.
g. Retirement and other employee benefits
i) Short-termemployeebenefitsarerecognisedasanexpenseattheundiscountedamountintheStatementofProfitandLossfortheyearinwhichtheemployeerenderstheservice.
ii) Post-employmentandotherlong-termbenefitsarerecognisedasanexpenseintheStatementofProfitandLossatthe present value of the amounts payable determined using actuarial valuation techniques in the year the employee renderstheservice.ActuarialgainsandlossesarechargedtotheStatementofProfitandLoss.
iii) Paymentstodefinedcontributionretirementbenefitschemesareexpensedastheyfalldue.
h. Revenue Recognition
i) Revenuefromsaleofgoodsisrecognisedontransferofsignificantrisksandrewardsofownershiptothecustomers.Gross sales includeexciseduty and isnetof sales return, discount, valueadded tax / sales tax. Export sales areaccounted for on the basis of date of bill of lading.
ii) Incomefromroyaltyandservicechargesisrecognisedaspertheagreedterms/completionoftheservice.
iii) Exportincentives/benefitsareaccountedonaccrualbasis.
iv) Dividendincomeisrecognisedwhentherighttoreceivethedividendisestablished.
v) Interestincomeisrecognisedonatimeproportionbasistakingintoconsiderationtheamountoutstandingandtheapplicable interest rate.
i. Government grants / subsidies
Grants and subsidies fromGovernment are recognisedwhen all the conditions relating to the grants / subsidies arecompliedandthereisareasonableassurancethatthegrant/subsidywillbereceived.Grant/subsidyiscreditedtocapitalreserve.RevenuegrantsarerecognisedinStatementofProfitandLossuponcomplyingwithconditionsattachedtosuchgrants.
j. Inventories
i) Inventoriesarevaluedatlowerofcostorestimatednetrealisablevalue.
ii) Costofrawmaterials,packingmaterialsandstoresandsparesaredeterminedonmovingaveragecostmethod.
iii) Cost of finished goods and goods-in-process includes cost of direct materials, labour and other manufacturingoverheads.
iv) Exciseliabilityisincludedinthevaluationofinventoryoffinishedgoods.
k. Foreign currency transactions
i) Accounting of Transactions
a) Foreign currency transactions are recorded at the exchange rate prevailing on the date of such transaction.Foreigncurrencymonetaryassetsandliabilitiesaretranslatedusingtheexchangerateprevailingatthereportingdate.Non-monetaryforeigncurrencyitemsarecarriedatcost.
b) Gains or losses arising on settlement / translation of foreign currencymonetary assets and liabilities at theyear-endratesarerecognisedintheStatementofProfitandLossexcepttreatmentasperamendmenttoAS-11effectivetill31March2020.(Refernote25)
c) Incaseofforeigncurrencymonetaryassetsandliabilitiescoveredbyforwardcontracts,thedifferencebetweentheyear-endrateandrateonthedateofthecontractisrecognisedasexchangedifferenceandthepremium

110
Notes forming part of the Consolidated financial statements
Annual Report 2015-16
paidonforwardcontractisrecognisedoverthelifeofthecontract.Profitorlossonsettlement/cancellationofforwardcontractisrecognisedasanincomeorexpensefortheyearinwhichtheyariseexcepttreatmentasperamendmenttoAS-11effectivetill31March2020.(Refernote25).
ii) Translation and exchange rates
Financialstatementsofoverseasnon-integraloperationsaretranslatedasunder:
a) Assets and Liabilities at the rate prevailing at the end of the year. Depreciation is accounted at the same rate at whichassetsareconverted.
b) Revenueandexpensesataverageratesprevailingduringtheyear.OffBalanceSheetitemsaretranslatedintoIndianRupeesatyear-endrates.
c) ExchangedifferencesarisingontranslationareaccumulatedintheForeignCurrencyTranslationReserveuntilthedisposal of such operations.
l. Accounting for taxes on income
i) Currentincometaxiscalculatedontheincomeofindividualcompaniesinaccordancewithlocaltaxregulations.
ii) Deferred tax is recognised, subject to the consideration of prudence, on timing differences, being the differencebetweentaxableincomeandaccountingincomethatoriginateinoneperiodandarecapableofreversalinoneormoresubsequentperiodsandmeasuredusingrelevantenactedtaxrates.
iii) MinimumAlternateTax(MAT)paidinaccordancewithtaxlaws,whichgiverisetofutureeconomicbenefitsintheformofadjustmentoffuturetaxliability,isrecognizedasanassetonlywhen,basedonconvincingevidence,itisprobablethatthefutureeconomicbenefitsassociatedwithitwillflowtotheCompanyandtheassetscanbemeasuredreliably.
m. Leases
i) Finance Lease
Assetsacquiredonlong-termleases,whichineconomictermsconstituteInvestmentsfinancedonalongtermbasisi.e.financelease,arecapitalisedandthecorrespondingleaseliabilityisrecordedatanamountequaltothefairvalueoftheleasedassetattheinceptionofthelease.Initialcostsdirectlyattributabletotheleasearerecognisedwiththeasset under the lease.
ii) Operating Lease
Leaseofassetsunderwhichalltherisksandrewardsofownershipareeffectivelyretainedbythelessorareclassifiedas operating leases. Lease payments under operating leases are recognised as an expense on accrual basis inaccordancewiththerespectiveleaseagreements.
n. Earnings per share
Basicearningspershare iscomputedanddisclosedusingtheweightedaveragenumberofequitysharesoutstandingduringtheyear.Dilutiveearningspershareiscomputedanddisclosedusingtheweightedaveragenumberofequityanddilutiveequityequivalentsharesoutstandingduringtheyear,exceptwhentheresultswouldbeanti-dilutive.
o. Provisions, contingent liabilities and contingent assets
Provisionsinvolvingsubstantialdegreeofestimationinmeasurementarerecognisedwhenthereispresentobligationasaresultofpasteventsanditisprobablethattherewillbeanoutflowofresources.Theseestimatesarereviewedateachreportingdateandadjustedtoreflectthecurrentbestestimates.Contingentliabilitiesarenotrecognisedbutaredisclosedinthenotes.Contingentassetsareneitherrecognisednordisclosedinthefinancialstatements.
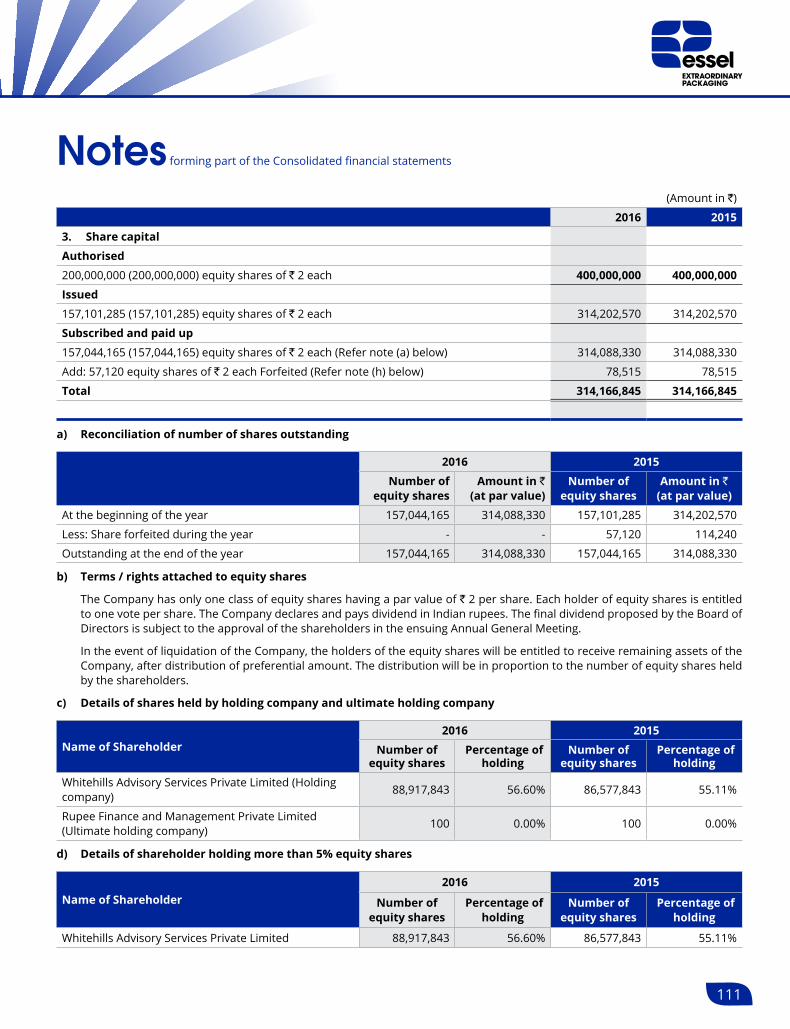
111
Notes forming part of the Consolidated financial statements
Annual Report 2015-16
(Amount in `)
2016 2015
3. Share capital
Authorised
200,000,000 (200,000,000) equity shares of ` 2 each 400,000,000 400,000,000
Issued
157,101,285(157,101,285)equitysharesof` 2 each 314,202,570 314,202,570
Subscribed and paid up
157,044,165(157,044,165)equitysharesof`2each(Refernote(a)below) 314,088,330 314,088,330
Add:57,120equitysharesof`2eachForfeited(Refernote(h)below) 78,515 78,515
Total 314,166,845 314,166,845
a) Reconciliation of number of shares outstanding
2016 2015
Number of equity shares
Amount in ` (at par value)
Number of equity shares
Amount in ` (at par value)
At the beginning of the year 157,044,165 314,088,330 157,101,285 314,202,570
Less:Shareforfeitedduringtheyear - - 57,120 114,240
Outstanding at the end of the year 157,044,165 314,088,330 157,044,165 314,088,330
b) Terms / rights attached to equity shares
The Company has only one class of equity shares having a par value of ` 2 per share. Each holder of equity shares is entitled toonevotepershare.TheCompanydeclaresandpaysdividendinIndianrupees.ThefinaldividendproposedbytheBoardofDirectors is subject to the approval of the shareholders in the ensuing Annual General Meeting.
IntheeventofliquidationoftheCompany,theholdersoftheequityshareswillbeentitledtoreceiveremainingassetsoftheCompany,afterdistributionofpreferentialamount.Thedistributionwillbeinproportiontothenumberofequitysharesheldby the shareholders.
c) Details of shares held by holding company and ultimate holding company
Name of Shareholder2016 2015
Number of equity shares
Percentage of holding
Number of equity shares
Percentage of holding
Whitehills Advisory Services Private Limited (Holding company) 88,917,843 56.60% 86,577,843 55.11%
Rupee Finance and Management Private Limited (Ultimate holding company) 100 0.00% 100 0.00%
d) Details of shareholder holding more than 5% equity shares
Name of Shareholder2016 2015
Number of equity shares
Percentage of holding
Number of equity shares
Percentage of holding
Whitehills Advisory Services Private Limited 88,917,843 56.60% 86,577,843 55.11%

112
Notes forming part of the Consolidated financial statements
Annual Report 2015-16
e) Employees Stock Option Scheme (ESOS):
During the previous year, the Company had instituted an Essel Employee Stock Option Scheme 2014 (“the Scheme”) as approved by the Board of Directors for issuance of stock options to the eligible employees of the Company and of its subsidiaries, other than directors, promoters or person belonging to promoter group.
PursuanttothesaidScheme,stockoptionsconvertibleinto176,535(Previousyear2,953,000)equitysharesof`2eachweregrantedtoeligibleemployeesatanexercisepriceof` 161 (Previous year `121.65pershare),beingthemarketpriceasdefinedintheSecuritiesandExchangeBoardofIndia(ShareBasedEmployeeBenefits)Regulation,2014(SEBIRegulation).Inviewoftherebeingnointrinsicvalueonthedateofthegrant(beingtheexcessofmarketpriceofshareundertheSchemeovertheexercisepriceoftheoption),theCompanyisnotrequiredtoaccountforthevalueofoptionsaspertheSEBIRegulations.HadtheCompanyfollowed‘fairvalue’methodofaccountingofemployeebenefitexpense,thereportedprofitaftertaxonproformabasiswouldbe lowerby`72,458,362;andthebasicanddilutedearningspershare for theyearended31March2016onproformabasiswouldhavebeen` 11.13
SubjecttotermsandconditionsoftheScheme,thesaidoptionswillvestoneachof1July2016,1July2017and1July2018totheextentmentionedintheletterofgrantandcanbeexercisedwithinamaximumperiodoffouryearsfromthedateofvesting.
f) Nobonusshareshavebeenissuedandnosharesboughtbackduringfiveyearspreceding31March2016.
g) 500,155 equity shares of `2eachfullypaidupwereallottedon14September2012forconsiderationotherthancash,pursuanttotheSchemeofMergerofRasPropackLamipackLimitedandRasExtrusionsLimitedwiththeCompany.
h) Forfeitedsharesconsistof35,725partlypaidupequitysharesand21,395fullypaidupbonussharesforfeitedduringthepreviousyear. The amount of `78,515inrelationtotheforfeiturewillbetransferredtoreservesuponcancellationoftheseshares.
(Amount in `)2016 2015
4. Reserves and surplusCapital reserveAs per last balance sheet 401,219,702 401,219,702
Capital reserve on Consolidation As per last balance sheet 5,829,238,216 3,080,541,576Add:AdjustmentasperSchemeofAmalgamation(Refernote40) - 2,748,696,640
5,829,238,216 5,829,238,216 Less:GoodwillonConsolidation (297,801,347) (859,980,976)
5,531,436,869 4,969,257,240 Securities premiumAs per last balance sheet 1,089,327,000 3,842,983,298 Less:AdjustmentasperSchemeofAmalgamation(Refernote40) - (2,748,696,640)Less:ExpensesadjustedpursuanttotheSchemeofAmalgamation - (6,001,483)Add:Receivedduringtheyear-Callsinarrears - 1,041,825
1,089,327,000 1,089,327,000 Debenture redemption reserveAs per last balance sheet 75,000,000 - Add:TransferredfromStatementofProfitandLoss 75,000,000 75,000,000
150,000,000 75,000,000 Revaluation reserveAs per last balance sheet 13,286,208 13,709,420Less:TransfertotheStatementofProfitandLoss - (423,212)
13,286,208 13,286,208 Legal reserveAs per last balance sheet 99,331,239 31,378,283Add:Appropriatedduringtheyear 60,464,292 67,952,956
159,795,531 99,331,239

113
Notes forming part of the Consolidated financial statements
Annual Report 2015-16
(Amount in `)2016 2015
Deferred Government GrantAs per last balance sheet 7,112,071 24,759,535Add:Receivedduringtheyear 22,433,454 - Add/(Less):Transfertothetranslationadjustment 4,353,022 (7,464,527)Less:TransfertotheStatementofProfitandLoss (22,641,126) (10,182,937)
11,257,421 7,112,071 Foreign currency translation reserveAs per last balance sheet (1,065,625,118) (866,410,712)Add:Additionduringtheyear 12,547,426 (199,214,406)
(1,053,077,692) (1,065,625,118)General reserveAs per last balance sheet 54,489,270 54,489,270
Surplus in the Statement of Profit and LossAs per last balance sheet 1,872,101,335 1,021,691,104 Add:Profitfortheyear 1,820,698,530 1,406,316,157Less: AppropriationsAdjustmentaspertransitionalprovisionsofScheduleIItotheCompaniesAct,2013 (netoftax)
- (38,616,271)
CorporateSocialResponsibility(CSR)expenditure(Refernote38) - (4,720,000)Proposed equity dividend (345,497,163) (251,270,664)Taxonproposedequitydividend (126,036,263) (118,346,035)Debenture Redemption Reserve (75,000,000) (75,000,000)Legal reserve (60,464,292) (67,952,956)
3,085,802,147 1,872,101,335 Total 9,443,536,456 7,515,498,947
(Amount in `)
Non-current Current
2016 2015 2016 20155. Long-term borrowingsSecured 900(900)unitsofRedeemableNon-convertibledebentures of ` 1,000,000 each (Refer note [a (i)] below) 900,000,000 900,000,000 - - Term loan from banks {Refer note [a (ii),(iii),(iv)] and [b(i)]below} 3,539,716,152 3,543,593,963 582,660,929 1,266,266,360 Termloanfromothers{Refernote[a(iii)and(v)]} - 517,361,111 - 236,111,111 Buyers credit from banks (Refer note [(a) (vi) and (vii)] and[b(i)]below) 265,246,163 568,603,615 133,345,238 62,292,788Finance lease obligations [Refer note [a (viii)] and [b (ii)] below] 498,984,024 541,456,183 70,617,045 60,931,768
5,203,946,339 6,071,014,872 786,623,212 1,625,602,027

114
Notes forming part of the Consolidated financial statements
Annual Report 2015-16
(Amount in `)
Non-current Current
2016 2015 2016 2015Unsecured Termloanfrombanks(Refernote[b(iii)]below) 60,524,810 41,314,919 83,272,019 24,400,000 TermloanfromOthers(Refernote[a(x)]below) - 8,137,601 8,137,601 7,213,433Buyerscreditfrombanks(Refernote[a(ix)]below) 290,573,871 164,381,762 11,586,226 65,000,000 Deferredsalestaxloan(Refernote[a(xi)]below) 113,918,695 149,424,881 35,506,187 47,956,284
465,017,376 363,259,163 138,502,033 144,569,717 5,668,963,715 6,434,274,035 925,125,245 1,770,171,744
Current maturities disclosed under "Other liabilities" (Refer note 6) - - (925,125,245) (1,770,171,744)Total 5,668,963,715 6,434,274,035 - -
Nature of security and terms of repayments for long-term borrowings
a) In Parent Companyi) Listed redeemable non-convertible debentures Series (A) of
` 500,000,000 (` 500,000,000) and Series (B) of ` 400,000,000 (` 400,000,000) are secured by pari-passu first charge on all fixedassetsofthecompany(exceptallfixedassetsatChakanandlandandbuilding situated at Goa and Murbad). These debentures are further securedbywayofsecurityprovidedbyotherrelatedparty*.
ThesedebenturescarryinterestrateatSBIBaseRate+ 145 bps p.a. and are redeemable at par in 3 annual installments commencing from 25 April 2019 in the ratioof30:30:40withanput/calloptionat theendof 3 years from date of issue in case of Series A and 31/2yearsfromthedateofissueincaseofseriesB,and on each anniversary thereafter until redemption, andputoption intheeventofdowngradeofcreditratingtoBBB+/below.
ii) Term loan from banks of `Nil (` 103,636,366 ) are secured by pari- passufirstchargeonallfixedassetsofthecompany(exceptallfixedassetsatChakan).Theseloansarefurthersecuredbywayofsecurityprovidedandguaranteeissuedbyotherrelatedparty*.
Term loan from banks and others are fully prepaid during the year.
iii) Term loan from banks of `Nil (` 355,754,545)andTerm loan fromothers `Nil(`472,222,222)aresecuredbypari-passufirstchargeonall fixed assets of the company (except all fixed assets at Chakan).Theseloansarefurthersecuredbywayofsecurityprovidedbyotherrelatedparty*.
iv) Term loan from bank of `Nil(` 209,096,500) is secured by pari-passu firstchargeonallfixedassetsofthecompany(exceptallfixedassetssituated at Chakan) and pari-passu second charge on current assets of thecompany.Theloanisfurthersecuredbywayofsecurityprovidedbyotherrelatedparty*.
v) Term loan from others `Nil(` 281,250,000) is secured by pari-passu firstchargeonallfixedassetsofthecompany(exceptallfixedassetsat Chakan) and pari-passu second charge on current assets of the company.Theloanisfurthersecuredbywayofsecurityprovidedandcorporateguaranteeissuedbyotherrelatedparty*.
vi) Buyers credit from bank of `Nil (`249,171,151) issecuredbypari-passufirstchargeonallfixedassetsofthecompany(exceptallfixedassets at Chakan) and pari-passu second charge on current assets of thecompany.Thisloanisfurthersecuredbywayofsecurityprovidedbyotherrelatedparty*.
Buyers credit from banks carry interest rate ranging from 0.50% to 1.20% p.a. and are repayable in maximum period of three years from the date oftransaction. vii) Buyers credit from bank of ̀ 398,591,401 (`370,664,348)issecuredby
pari-passufirstchargeonallfixedassetsofthecompany(exceptallfixedassetsatChakan).Thisloanisfurthersecuredbywayofsecurityprovidedbyotherrelatedparty*.

115
Notes forming part of the Consolidated financial statements
Annual Report 2015-16
viii) Finance lease obligations of ` 82,832,609 (`107,405,166)aresecuredby related leased assets.
Leases carry interest rate ranging from 12.36% to 13.50% p.a and are repayable in monthly installments.
ix) Buyer’screditfrombankof` 150,083,925 (`42,350,874)areagainstsecurity provided and guarantee issued by other related party and `152,076,172(`187,030,888)areagainstsecurityprovidedbyotherrelatedparty*.
Buyers credit from banks carry interest rate ranging from 0.50% to 1.31% p.a. and are repayable in maximum period of three years from the date oftransaction.
x) Termloanfromothers`8,137,601(` 15,351,034) are unsecured. Term loan from others carry interest rate 12.24% p.a. and is repayable in quarterly installments by 2016-17.
xi) Deferredsalestaxinterestfreeloansarerepayableafteraperiodof10to14yearsfromthedateofloanupto2024-25.
*Otherrelatedpartyi.e.Aqualand(India)Limited
b) In Subsidiaries and Joint Ventures
i) Term loans from Banks of ` 4,122,377,081 (` 4,141,372,912) andBuyers credit from Banks of `Nil(`11,060,904)indifferentcurrenciesare variously securedbyway of charge over fixed assets excludingleased assets, inventory, book debts and other current assets of the respectivesubsidiarycompany, dividendescrowaccount,pledgeofshares of the overseas subsidiaries, corporate guarantee/ letter ofcomfort of the parent Company.
Repayable in specified installment (Monthly,Quarterly,HalfyearlyandYearly)repayableby2021-22.Interestraterangingfrom1.55%to11.25%p.a.
ii) Finance lease obligations of `486,768,460(`494,982,785)aresecuredby related leased assets.
Leases carry interest rate ranging from 4.48% to 6.00% and are repayable in monthly installments.
iii) Term loan from banks `143,796,829(`65,714,919)areunsecured. Term loan from banks carry interest rate 1.40% to 10.41%p.a.andisrepayableinquarterly/halfyearlyinstallments by 2020-21.
(Amount in `)
Long-term Short-term
2016 2015 2016 2015
6. Other liabilities
Currentmaturitiesoflong-termborrowings (Refer note 5)
- - 854,508,200 1,709,239,976
Currentmaturitiesoflongtermfinanceleaseobligations (Refer note 5)
- - 70,617,045 60,931,768
Interestaccruedbutnotdueonborrowings - - 28,246,675 56,636,562
Interestaccruedanddueonborrowings - - 1,573,097 4,302,029
Unclaimeddividend(Refernote37) - - 5,706,115 5,130,549
Payable for capital goods - - 22,048,774 18,896,312
Trade advances and deposits received - 11,719,082 23,563,690 45,754,189
Employeebenefitspayable - - 245,081,988 118,420,116
Statutory dues - - 119,688,774 83,595,646
Forwardcontractpayable - - - 5,877,621
Other payables - - 838,087,450 837,390,415
Total - 11,719,082 2,209,121,808 2,946,175,183

116
Notes forming part of the Consolidated financial statements
Annual Report 2015-16
Long-term Short-term2016 2015 2016 2015
7. ProvisionsEmployeebenefits 95,576,811 92,710,976 62,712,481 62,784,517OthersProvisionfordirecttax(netofadvances) - - 76,928,031 137,207,674Provision for Contingencies 99,824,790 40,000,000 - - Proposed equity dividend - - 345,497,163 251,270,664Taxonproposedequitydividend - - 70,335,103 50,239,358 Total 195,401,601 132,710,976 555,472,778 501,502,213
(Amount in `)2016 2015
8. Short-term borrowingsSecured {Refer note [(a) and (b) below} Short-term loan from banks - 141,984,720Working capital loan from banks 305,124,588 721,433,571Buyers credit from banks 61,713,335 218,638,464
366,837,923 1,082,056,755 UnsecuredShort-termloanfrombanks{Refernote(b)below} 261,913,437 192,526,304 Working capital loan from banks 18,712,674 28,390,577Buyers credit from banks 49,981,447 111,166,484
330,607,558 332,083,365
Total 697,445,481 1,414,140,120
Nature of security:a) In Parent Company Of the total secured short-term borrowings `73,101,115(`262,154,005)aresecuredbyfirstpari-passuchargeoncurrentassetsandsecondpari-passuchargeonall
fixedassetsoftheCompany(exceptallfixedassetssituatedatChakan). `1,278,995(`8,214,083)issecuredbyfirstpari-passuchargeoncurrentassetsofthecompany.b) In Subsidiaries and Joint Ventures Short term loans from Banks of `Nil(`141,984,720),WorkingcapitalloanfromBanksof`292,457,813(` 632,380,624 ) and
Buyers credit from Banks of `Nil(`37,323,323)aresecuredvariouslybywayofchargeovercurrentassetsofthecompanies,corporateguarantee/letterofcomfortoftheparentCompany,FixedAssets(excludingleasedasset)andsecurityprovidedandguaranteeissuedbyotherrelatedparty*.
*Otherrelatedpartyi.e.Aqualand(India)Limited
(Amount in `)2016 2015
9. Trade payables
Acceptances 225,468,782 170,022,843
Others 1,080,770,547 1,441,188,068
Total 1,306,239,329 1,611,210,911
(Amount in `)

117
Notes forming part of the Consolidated financial statements
Annual Report 2015-1610
. Fi
xed
asse
ts
(Am
ount
in `
)
Desc
riptio
n of
ass
ets
Gros
s Blo
ckDe
prec
iatio
n / A
mor
tisat
ion
/ Im
pairm
ent
Net B
lock
As a
t 1 A
pril
2015
Addi
tions
Dedu
ctio
nsTr
ansla
tion
adju
stm
ent
As a
t 31
Mar
ch 20
16Up
to
31 M
arch
2015
For t
he ye
arDe
duct
ions
Tran
slatio
n ad
just
men
tUp
to
31 M
arch
2016
As a
t 31
Mar
ch 20
16As
at
31 M
arch
2015
a)
Tang
ible
ass
ets
Fr
eeho
ld la
nd 1
05,22
0,131
-
4,12
3,950
3
,699,6
43
104
,795,8
24
- -
- -
- 104
,795,8
24
105
,220,1
31
Le
aseh
old
land
76,4
64,37
1 -
32,8
86,24
5 2
12,98
5 43,7
91,11
121,7
53,33
5 1
,328,2
63
8,60
7,206
1
13,35
2 14,5
87,74
429,2
03,36
754,7
11,03
6
Le
aseh
old
impr
ovem
ents
83,8
33,02
5 94,0
53,67
3 -
242
,747
178
,129,4
45
51,3
26,72
427,1
28,71
6 -
(51,5
29)
78,4
03,91
199,7
25,53
4 3
2,506
,301
Bu
ildin
gs
Owne
d 1
,926,4
04,66
9 8
0,205
,894
262
,334,1
11
52,7
44,42
81,79
7,020
,880
689
,152,3
91
64,1
22,44
2 79,0
93,57
517,5
07,54
2 6
91,68
8,800
1
,105,3
32,08
0 1,23
7,252
,278
Take
n on
leas
e468
,750,0
00
- -
28,1
62,50
0 4
96,91
2,500
45,0
90,47
5 1
2,588
,658
- 2
,862,4
09
60,5
41,54
2 436
,370,9
58
423
,659,5
25
Pl
ant a
nd M
achi
nery
Owne
d21,5
67,24
5,008
1,95
0,849
,702
1,40
2,389
,004
262
,143,5
24
22,3
77,84
9,230
15,1
15,48
1,417
1
,018,8
56,03
6 1
,055,4
20,29
1 1
89,48
0,399
15,2
68,39
7,561
7,10
9,451
,669
6,45
1,763
,591
Take
n on
leas
e344
,479,0
68
- -
7,05
6,536
3
51,53
5,604
103
,473,7
09
52,9
95,38
0 -
4,37
6,304
1
60,84
5,393
1
90,69
0,211
2
41,00
5,359
Eq
uipm
ents
Owne
d397
,193,1
30
77,1
92,88
9 3
1,135
,552
6,18
8,207
449
,438,6
74
296
,202,0
89
34,7
25,28
927,5
76,14
44,03
4,375
307
,385,6
09
142
,053,0
65
100
,991,0
41
Take
n on
leas
e13,7
19,51
3 -
- -
13,7
19,51
3 3
,411,8
03
2,26
6,324
-
- 5,67
8,127
8
,041,3
86
10,3
07,71
0
Furnitu
rean
dfixtures
143
,839,2
02
24,9
83,64
8 17,6
63,09
5 2
,081,5
39
153
,241,2
94
98,4
85,93
6 10,4
93,70
5 1
2,250
,016
1,92
9,778
9
8,659
,403
54,5
81,89
1 4
5,353
,266
Ve
hicle
s6,20
5,867
-
2,10
0,553
(2
29,90
1)3,87
5,413
5
,140,2
82
547
,363
2,09
0,170
(177
,649)
3,41
9,826
455
,587
1,06
5,585
Tota
l (A)
25,1
33,3
53,9
84
2,22
7,28
5,80
6 1,
752,
632,
510
362,
302,
208
25,9
70,3
09,4
88
16,4
29,5
18,1
61
1,22
5,05
2,17
6 1,
185,
037,
402
220,
074,
981
16,6
89,6
07,9
16
9,28
0,70
1,57
2 8,
703,
835,
823
Prev
ious
year
24,0
20,0
09,8
50
1,56
7,40
0,13
8 26
6,65
2,78
9 (1
87,4
03,2
15)
25,1
33,3
53,9
84
15,2
76,8
44,0
28
1,27
5,45
1,44
1 12
0,99
6,26
9 (1
,781
,039
) 16
,429
,518
,161
8,
703,
835,
823
b)
Inta
ngib
le a
sset
s
So
ftware
390
,768,7
92
16,4
36,96
8 30,2
01,70
84,74
6,177
381
,750,2
29
222
,277,0
74
44,4
87,77
2 8
,531,9
66
3,18
8,367
261
,421,2
47
120
,328,9
82
168
,491,7
18
Pa
tent
s 3
,041,2
99
4,18
5,117
-
320
,354
7,54
6,770
3
,040,8
33
258
,381
- 3
20,36
9 3
,619,5
83
3,92
7,187
4
66
Tota
l (B)
393,
810,
091
20,6
22,0
85
30,2
01,7
08
5,06
6,53
1 38
9,29
6,99
9 22
5,31
7,90
7 44
,746
,153
8,
531,
966
3,50
8,73
6 26
5,04
0,83
0 12
4,25
6,16
9 16
8,49
2,18
4
Prev
ious
year
364,
763,
457
34,0
17,8
21
407,
919
(4,5
63,2
68)
393,
810,
091
185,
354,
748
42,9
10,2
42
407,
918
(2,5
39,1
65)
225,
317,
907
168,
492,
184
Gran
d To
tal (
A+B)
25,5
27,1
64,0
75
2,24
7,90
7,89
1 1,
782,
834,
218
367,
368,
739
26,3
59,6
06,4
87
16,6
54,8
36,0
68
1,26
9,79
8,32
9 1,
193,
569,
368
223,
583,
717
16,9
54,6
48,7
46
9,40
4,95
7,74
1 8,
872,
328,
007
Prev
ious
year
24,3
84,7
73,3
07
1,60
1,41
7,95
9 26
7,06
0,70
8 (1
91,9
66,4
83)
25,5
27,1
64,0
75
15,4
62,1
98,7
76
1,31
8,36
1,68
3 12
1,40
4,18
7 (4
,320
,204
) 16
,654
,836
,068
8,
872,
328,
007
c)
Capi
tal w
ork
in
prog
ress
511
,491,9
81
843
,440,2
02
d)
Inta
ngib
le a
sset
s un
der d
evel
opm
ent
59,5
82,26
3 44,1
97,97
0
Not
es:
(i)
Buildingsinclud
eroad
s,residen
tialflats,tu
bewell,waterta
nksan
dshareinco-op
erativesociety.
(ii)
Freeho
ldland
and
buildinginclud
esassetsacqu
ired
pursuan
ttoSche
meofMergero
fRasPropa
ckLam
ipackLimite
d(“R
PLL”)and
RasExtrusion
sLimite
d(“R
EL”)on
theap
pointed
date1April20
11.The
saidassetswererevalued
on30
June
199
6by`3,27,86
,717
ontheba
sisofvalua
tionrepo
rtofC
hartered
Eng
ineersdated
13Au
gust199
6.
(iii)Ad
ditio
nsto
Plantand
Machine
ryand
Cap
italw
orkinprogressinclud
esborrowingcostsof`Nil(`6,408
,814
)and
excha
ngedifferen
ceof`
54,
680,
424
(`37,98
5,58
0)capitalised
du
ring
the
year
as
per
Acco
untin
g St
anda
rds.
(iv)
D
epre
ciat
ion
for
the
year
of `Nil(`
423
,212
) is
reco
uped
out
of r
eval
uatio
n re
serv
e.
(v)
Ded
uctio
ns fo
r th
e ye
ar in
clud
e `
1,44
8,60
4,86
0 in
Gro
ss B
lock
and
`912
,090
,877
inaccum
ulated
dep
reciation,resultin
gfrom
thedivestmen
tofa
Sub
sidiarycompa
ny.

118
Notes forming part of the Consolidated financial statements
Annual Report 2015-16
(Amount in `)2016 2015
11. Non-current investments(A) Trade investments i) In Associate Company - Unquoted 2100 (2100) Equity Shares of USD 350 each of PTLamipakPrimulaIndonesia(Extentofholding30%) 50,812,215 50,812,215 Add:Unamortisedgoodwill 320,009,310 320,009,310 Add:Shareofaccumulatedprofits 85,966,594 82,812,531 Add:Shareofprofitfortheyear 27,449,023 3,154,063 Less:Dividendreceived (8,303,279) -
475,933,863 456,788,119 ii) In Others - Quoted Nil(200)EquitySharesof` 10 each in Cosmo Films Limited - 1,760 Nil(100)EquitySharesof` 10 each in Orient Press Limited - 1,360 (B) Other investments i) Quoted Nil(700)EquitySharesof` 10 each in State Bank of Travancore - 42,000
- 45,120 ii) Unquoted Obligatory investments in Government securities
(All the above securities are fully paid up) - 690,625
Total 475,933,863 457,523,864 Aggregate book value of quoted investments - 45,120 Aggregate book value of unquoted investments 475,933,863 457,478,744Aggregate market value of quoted investments - 329,220
(Amount in `)2016 2015
12 a) Deferred tax liabilities (net) Deferred tax liabilities Depreciationonfixedassets 280,778,415 379,109,195 Others 78,349,778 10,859,197 Less: Deferred tax assets Disallowancesundertaxlaws 54,881,221 45,631,866 Provision for doubtful debts 19,081,111 20,102,387 Others 15,873,870 11,154,186 Total (A) 269,291,991 313,079,953
b) Deferred tax liabilities (net) Deferred tax assets Disallowancesundertaxlaws 115,900,687 124,512,347 Provision for doubtful debts 3,137,146 1,777,600 Unabsorbedtaxlosses 35,634,499 58,383,396 Less: Deferred tax liabilities Depreciationonfixedassets 132,510 7,435,063 Others 1,379,536 1,479,778 Total (B) 153,160,286 175,758,502 Total (A-B) 116,131,705 137,321,451

119
Notes forming part of the Consolidated financial statements
Annual Report 2015-16
(Amount in `)
Long-term Short-term
2016 2015 2016 2015
13. Loans and advances
(Unsecured,consideredgood,unlessotherwisestated)
Capital advances 191,375,050 147,074,661 - -
Deposits
- Related Parties (Refer note 36) 155,010,000 155,010,000 - -
- Others 137,756,567 129,987,804 6,374,537 10,959,383
292,766,567 284,997,804 6,374,537 10,959,383
Loans and advances to related parties (Refer note 36) - - 960,666,940 960,666,940
Other loans and advances
Advances (recoverable in cash or kind) 22,307,079 25,355,376 1,390,468,183 1,303,315,864
Prepaidexpenses 1,359,886 296,595 66,622,532 56,715,590
Loans and advances to employees 848,154 872,328 4,699,224 5,097,613
MAT Credit entitlement - - 41,051,865 57,052,168
Balanceswithgovernmentauthorities
-Directtax(netofprovision) 73,506,681 73,096,150 16,656,575 15,140,453
-Indirecttax 44,630,956 34,247,004 305,155,399 373,900,815
Total 626,794,373 565,939,918 2,791,695,255 2,782,848,826
(Amount in `)
Non-current Current
2016 2015 2016 2015
14. Other assets
Depositswithbankshavingoriginalmaturityperiodofmorethantwelvemonths*(Refernote17)
238,858 2,906,600 - -
Interestreceivablefrom
- Related parties (Refer note 36) - - 259,735,389 129,690,037
- Others - - 1,549,331 1,195,995
Other receivables from
- Related party (Refer note 36) - - 47,612 -
- Others - - 1,337,769 1,656,249
Exportbenefitsreceivable - - 8,804,954 22,034,257
Insuranceclaimreceivable(Refernote29(b)) - - 38,543,777 746,347
Unamortisedancillaryborrowingcosts 98,661,415 82,590,579 33,014,940 53,110,571
Total 98,900,273 85,497,179 343,033,772 208,433,456
*Depositedwith/lieninfavourofvariousGovernmentauthorities/banks.

120
Notes forming part of the Consolidated financial statements
Annual Report 2015-16
(Amount in `)2016 2015
15. InventoriesRawmaterial 801,318,793 1,078,498,924Goods-in-process 524,518,163 462,288,024 Finished goods 265,472,264 263,445,665 Stores and spares 449,069,129 486,887,266Packing materials 30,018,170 26,450,313 Total 2,070,396,519 2,317,570,192
(Amount in `)
2016 2015
16. Trade receivables (Unsecured)
Oversixmonths
Considered good 32,004,116 32,263,356
Considered doubtful 70,905,115 64,006,374
102,909,231 96,269,730
Less:Provisionfordoubtfuldebts 70,905,115 64,006,374
32,004,116 32,263,356
Others 3,322,717,375 3,725,288,900
Total 3,354,721,491 3,757,552,256
(Amount in `)Non-current Current2016 2015 2016 2015
17. Cash and bank balancesCash and cash equivalentsBalancewithbanksinCurrentaccounts - - 656,318,818 650,772,997Cheques/draftsonhand - - 14,850,925 43,480,130 Deposits with bank having original maturity period upto three months
- - 23,342,170 49,959,008
Cash on hand - - 1,852,130 4,397,680 - - 696,364,043 748,609,815
Other bank balancesUnclaimed dividend accounts - - 5,706,116 5,130,549 Depositswithbankshavingoriginalmaturityperiodofmorethantwelvemonths*
238,858 2,906,600 148,340,190 410,401,427
238,858 2,906,600 154,046,306 415,531,976 Disclosed under "Other non-current assets" (Refer note 14)
(238,858) (2,906,600) - -
Total - - 850,410,349 1,164,141,791
*Depositedwith/lieninfavourofvariousGovernmentauthorities/banks.

121
Notes forming part of the Consolidated financial statements
Annual Report 2015-16
(Amount in `)2016 2015
18. Revenue from operationsSales of products 22,321,363,950 23,642,302,657Other operating revenues Royalty/Servicecharges 151,642,259 120,440,081 Sale of scrap 133,160,890 155,030,705 Exportandotherincentives 21,508,289 28,498,313 Revenue from operations (gross) 22,627,675,388 23,946,271,756 Less:Exciseduty (781,210,431) (716,706,184)Revenue from operations (net) 21,846,464,957 23,229,565,572
(Amount in `)2016 2015
19. Other incomeInterestincome* 154,442,802 162,699,557Liabilitywrittenback 20,553,523 700,610Miscellaneous income 62,414,938 46,215,449 Total 237,411,263 209,615,616
*includesinterestonloans,bankdeposits,incometaxrefundsetc.
(Amount in `)2016 2015
20. Cost of materials consumed Raw materials consumedInventoryatthebeginningoftheyear 1,078,498,924 1,041,684,817Add:Purchases(net) 9,343,875,322 11,405,143,886
10,422,374,246 12,446,828,703 Less:Inventoryattheendoftheyear 801,318,793 1,078,498,924Total 9,621,055,453 11,368,329,779
(Amount in `)2016 2015
21. Changes in inventories of finished goods and goods-in-processInventory at the end of the year Finished goods 265,472,264 263,445,665 Goods-in-process 524,518,163 462,288,024
789,990,427 725,733,689 Inventory at the beginning of the year Finished goods 263,445,665 248,654,425 Goods-in-process 462,288,024 471,003,935
725,733,689 719,658,360Total (64,256,738) (6,075,329)

122
Notes forming part of the Consolidated financial statements
Annual Report 2015-16
(Amount in `)
2016 2015
22. Employee benefits expense
Salaries,wagesandbonus 3,143,061,140 3,014,215,302
Contribution to provident and other funds 292,560,363 292,280,903
Gratuity 20,945,908 15,991,343
Staffwelfareexpenses 331,466,372 305,817,529
Total 3,788,033,783 3,628,305,077
(Amount in `)
2016 2015
23. Other expenses
Stores and spares 526,127,467 506,662,123
Packing materials 702,007,239 685,906,102
Powerandfuel 645,431,985 691,626,342
Jobwork/Labourcharges 369,452,289 369,895,724
Lease rent
- Buildings 91,049,675 86,641,259
- Plant, machinery and equipment 66,875,840 63,532,525
Othermanufacturingexpenses 138,881,817 142,403,862
Repairs and maintenance
- Buildings 25,041,388 25,926,920
- Plant and machinery 188,213,055 184,436,479
- Others 86,743,226 73,213,847
Rent 85,434,536 84,004,561
Ratesandtaxes 89,277,712 106,185,736
Insurance 32,847,826 31,632,634
Directors' sitting fees 961,600 1,315,000
Travellingandconveyanceexpenses 129,048,515 123,380,651
Advertisementexpenses 2,910,866 5,345,980
Professional and consultancy charges 116,276,540 113,336,081
Communication charges 44,076,875 45,249,495
Miscellaneousexpenses 217,391,770 221,800,716
Lossonsale/discardoffixedassets(net) 5,013,067 8,455,319
Donation 2,176,552 377,230
Exchangedifference(net) 60,807,821 54,836,069
Paymentstoauditors:
- Audit fees 2,671,680 2,671,680
-Taxauditfees 367,356 367,356
-Taxrepresentationsandothers 2,327,331 1,296,955

123
Notes forming part of the Consolidated financial statements
Annual Report 2015-16
(Amount in `)
2016 2015
-Certifications(includingfeesforlimitedreview) 1,848,189 1,370,832
-Reimbursementofexpenses 164,546 302,362
Freightandforwardingexpenses 652,746,527 649,971,208
Discount and rebate - 20,376,851
Commission 14,561,796 16,547,425
Bad and doubtful debts (net of provision) 23,122,573 12,329,865
Corporatesocialresponsibilityexpense(Refernote38) 6,253,467 -
Total 4,330,111,126 4,331,399,189
(Amount in `)
2016 201524. Finance costsInterestexpenses
-Borrowings 480,723,649 656,291,304
- Others 7,257,631 756,086
-Otherfinancialcharges {includesamortisationofancillaryborrowingcosts`59,579,109(`69,807,837)}
117,555,199 113,655,015
Exchangedifferenceonborrowings(net) 17,885,609 22,862,805
Total 623,422,088 793,565,210
25. Foreign exchange difference
TheCompanies(AccountingStandards)AmendmentRules,2011hasamendedprovisionsofAS-11relatingto“TheEffectofChanges in ForeignExchangeRates” videnotificationdated11May2011 (as amendedon29December2011and furtherclarificationdated9August2012)issuedbyTheMinistryofCorporateAffairs(MCA).Intermsoftheseamendments,exchangedifferenceloss(net)of` 54,680,424 (`37,985,580)iscapitalisedtocostoffixedassets/capitalworkinprogress.
26. Derivative instruments and unhedged foreign currency exposure
a. Derivative contracts (being foreign exchange forward contracts for hedging purposes) entered into by the Group and outstanding as at 31 March :
i. For payments to be received against exports and other receivables
Forward Contracts 2016 2015
Amount in Foreign Currency
Equivalent Indian ` Amount in
Foreign CurrencyEquivalent
Indian `
USD/CNY - - USD1,700,000 106,250,000
MXN/USD MXN12,165,626 46,674,641 MXN10,196,280 41,892,435
USD/INR USD 900,000 59,629,500 USD 1,000,000 62,500,000

124
Notes forming part of the Consolidated financial statements
Annual Report 2015-16
ii. For payments to be made against imports and other payables
Forward Contracts 2016 2015Amount
in Foreign Currency
Equivalent Indian `
Amount in Foreign Currency
Equivalent Indian `
USD/INR USD 5,015,934 332,330,705 USD7,926,016 495,429,948 EUR/INR EUR467,062 35,214,139 - - CHF/INR CHF4,276,825 295,015,389 CHF 1,933,100 124,221,006 CNY/PHP CNY1,138,925 11,686,627 - - USD/COP USD 600,000 39,753,000 - - MXN/USD MXN1,487,002 5,705,033 - -
iii. Cross currency hedges
Forward Contracts 2016 2015Amount
in Foreign Currency
Amount in Foreign Currency
InrespectofpayablesCHF/USD CHF 3,923,205 CHF 5,844,551
b. Outstanding foreign currency exposures not hedged by derivative instruments
(Amount in `)
2016 2015Foreign currency payables 1,221,329,243 1,111,357,582
Foreign currency receivables 1,146,981,330 1,681,614,118
27. Finance Lease
TheCompanyhasacquiredplantandmachineryandequipmentsunderfinance leasewhicharecapitalizedundertangiblefixedassets.Theminimumleasepaymentsrequiredunderthisfinanceleasethathave initialorremainingnon-cancellableleasetermsinexcessofoneyearasat31March2016anditspresentvalueareasfollows:
(Amount in `)2016 2015
Minimum lease payment as atNotlaterthanoneyear 107,482,043 100,809,910 Laterthanoneyearbutnotlaterthanfiveyears 217,114,775 275,485,369Laterthanfiveyears 595,568,603 598,056,687
920,165,421 974,351,966 Less:Amountrepresentinginterest 350,564,352 371,964,015Present value of Minimum Lease Payments 569,601,069 602,387,951 Notlaterthanoneyear 70,617,044 60,931,829 Laterthanoneyearbutnotlaterthanfiveyears 112,143,848 162,941,245 Laterthanfiveyears 386,840,177 378,514,877

125
Notes forming part of the Consolidated financial statements
Annual Report 2015-16
28. Operating Lease
TheGrouphastakenpremises,residentialfacilities,plantandmachinery(includingequipments)andvehiclesundercancellable/non-cancellableoperatingleaseagreementsthatarerenewableonaperiodicbasisattheoptionofboththelessorandthelessee. The initial tenure of the leases varies from eleven to one hundred and eight months. The rental obligations are as follows:
(Amount in `)2016 2015
Leaserentalchargesfortheyear(Including` 1,455,456 ( `1,561,171)ofJointVentures) 157,268,584 248,990,143Future lease rental obligation payable (under non-cancellable leases)
Notlaterthanoneyear(Including` 1,369,505 (`872,714)ofJointVentures) 222,478,643 115,841,103Laterthanoneyearbutnotlaterthanfiveyears(Including` 2,028,495 (`782,235)ofJoint Ventures)
472,901,745 219,127,527
Laterthanfiveyears 278,500,108 14,319,000Total 973,880,496 349,287,630
29. a) Contingent liabilities not provided for
(Amount in `)2016 2015
i. Unexpiredlettersofcredit(netofliabilityprovided) - 123,559,606ii. Disputedindirecttaxes* 246,347,688 237,534,835iii. Disputeddirecttaxes^ 207,004,250 114,043,068iv. Claimsnotacknowledgedasdebts 4,996,550 4,996,550v. Deferredsalestaxliabilityassigned 60,836,967 68,605,087vi. DutybenefitavailedunderEPCGscheme,pendingexportobligations 237,683,555 263,739,439
*Doesnotincludedisputedexcisedutyof`115,428,779(`115,428,779)forallegedundervaluationininterunittransferofweb,forcaptiveconsumptionasitdoesnothavesignificantimpactonprofitsoftheGroup,sinceexcisedutypaidbyoneunitisadmissibleasCenvatcreditatotherunit.Further,theappealfiledbyExciseDepartmentagainstthedecision(inGroup’s favour) of High Court is pending before the Hon’ble Supreme Court.
^ Without considering relief granted by the Appellate Authorities in favour of the Company, tax effect ` 37,078,269 (`33,422,849)(approx.),whichispendingwithrelevantauthority.
b) Insurance claimof` 19,286,723 (`Nil) in respectof transitdamage to theplantequipment, isunder litigationbeforeNationalConsumerDisputeRedressalCommission,NewDelhi(ReferNote14).
c) Commitments
(i) Capital commitments
Estimated amount of contracts remaining to be executed on capital account, not provided for (net of advances) `500,667,084(`675,820,408).
(ii) Other commitments #
Estimatedamountof contracts remaining tobeexecutedonother than capital account, notprovided for (netofadvances) ` 45,561,308 (`60,270,174).
#includesShareinJointVentureCompanies(ReferNote33)

126
Notes forming part of the Consolidated financial statements
Annual Report 2015-16
30. Managerial remuneration
a. Detailsofremunerationpaid/payabletothemanagingdirectorincludedin“Employeebenefitsexpense”areasunder:
(Amount in `)
2016 2015
i. Salaries,allowancesandperquisites^ 43,519,200 40,440,000
ii. Contribution to provident and other funds 3,484,800 3,240,000
iii. Performancebonus* 24,170,000 20,000,000
Total 71,174,000 63,680,000
^ExcludesleaveencashmentandgratuityprovidedonthebasisofactuarialvaluationonanoverallCompanybasis.
*Theperformancebonusforthecurrentyearhasbeenprovidedintheaccountsasrecommendedbythenominationand remuneration committee and approved by the board of directors. The total remuneration to Managing Director on thisbasisascomputedaspertheCompaniesAct,2013iswithinlimitsprescribedu/s197oftheCompaniesAct,2013andapproval of shareholders as required therein.
b. ProfessionalandconsultancychargesincludecommissiontoNon-executiveindependentdirectors̀ 6,000,000 (` 4,474,521)for the year ended 31 March 2016.
31. Amalgamation of Whitehills Advisory Services Private Limited (Whitehills) with the Company
The Board of Directors of the Company at its meeting held on October 29, 2015, have approved the Scheme of Amalgamation ofWhitehillsAdvisoryServicesPrivateLimited(Whitehills),itsholdingcompanywiththeCompany.TherewouldbeneitheranychangeinthecapitalstructurenoranychangeinthepromotershareholdingoftheCompanyandtherewillbenodilutionforanypublicshareholders.TheCompanyisintheprocessofobtainingrequisiteapprovalsofStatutory/Regulatoryauthorities.Acourt convened meeting in this respect is being scheduled on 11 May 2016, as directed by the Hon’ble High Court of Judicature at Mumbai.
32. Exceptional items
Exceptional item includes:
I) Foryearended31March2016,
a) `51,915,613gainondivestmentofwhollyownedsubsidiary,PackagingIndiaPrivateLimited
b) Writeoffof`16,007,868beingamortisedancillaryborrowingcostsuponpre-paymentoflongtermborrowingsandrelated charges thereof
c) Writeoffof` 12,452,409 relating to closure of Plastic Tubes manufacturing operations in USA.
II) Foryearended31March2015,
Gainonsaleoffixedassetsamountingto` 55,191,644.
33. Disclosure in respect of Joint Venture Companies
InCompliancewithAccountingStandard27on“FinancialReportingofInterestinJointVentures”,theGroup’sshareofeachoftheassets,liabilities,incomeandexpenses,etc.inrespectofjointlycontrolledentitiesareasfollows:
Name of the Joint Ventures Country of Incorporation Ownership Interest
Essel Deutschland Management GmbH Germany 24.90% (24.90%)
Essel Deutschland GmbH & Co. KG, Dresden Germany 24.90% (24.90%)

127
Notes forming part of the Consolidated financial statements
Annual Report 2015-16
Group’s Share of Interest in Joint Ventures
(Amount in `)
2016 2015
Assets 353,136,992 330,681,260
Liabilities 353,136,992 330,681,260
Income 631,672,774 638,555,114
Expenses 609,624,707 607,251,087
Other commitments 45,561,308 60,270,174
34. Earnings per share
(Amount in `)
2016 2015Profitfortheyear(`) 1,820,698,530 1,406,316,157
WeightedaveragenumberofBasicandDilutedEquityShares(Nos.) 157,044,165 157,044,165
Nominalvalueofequityshares(`) 2.00 2.00
Earnings per shareBasic and Diluted 11.59 8.95
35. Additional Information pursuant to Para 2 of General instructions for the preparation of Consolidated Financial Statements
(Amount in `)
Sr. No.
Name of the entity Net Assets, i.e., total assets minus total liabilities Share in Profit or loss
% of consolidated
net assets
Amount % of consolidated
ProfitAmount
(I) Parent -Essel Propack Limited 57% 5,538,844,083 64% 1,157,066,363
(II) Subsidiaries -b) Foreign 1 Essel Propack America, LLC. 27% 2,611,586,586 22% 406,993,330 2 Lamitube Technologies Ltd 53% 5,139,233,454 19% 351,528,507 3 Lamitube Technologies Cyprus Ltd 2% 228,135,842 -27% (487,783,595) 4 Essel Packaging (Guangzhou) Ltd 41% 4,029,154,165 32% 578,021,899 5 EsselPropackPhilippines,Inc 1% 143,570,996 2% 44,119,587 6 MTL de Panama S.A 2% 200,066,049 -1% (12,438,300) 7 AristaTubesLimited -2% -229,936,387 0% 5,838,873 8 Essel Propack UK Limited 0% 40,191,680 0% 6,082,800 9 EsseldeMexico,S.A.deC.V. 2% 164,615,134 -1% (21,412,304) 10 Tubopack de Columbia S.A. 2% 206,899,103 2% 34,572,612 11 Essel De Colombia, S.A.S. 0% 1,130,503 0% (1,075,032) 12 Essel Propack LLC (Russia) 1% 102,099,394 0% (2,426,049)

128
Notes forming part of the Consolidated financial statements
Annual Report 2015-16
(Amount in `)
Sr. No.
Name of the entity Net Assets, i.e., total assets minus total liabilities Share in Profit or loss
% of consolidated
net assets
Amount % of consolidated
ProfitAmount
13 Essel Propack Polska 12% 1,190,100,173 9% 155,214,039 14 AristaTubesInc 16% 1,525,058,981 22% 399,052,157 15 Essel Packaging (Jiangsu) Ltd 7% 654,055,056 2% 29,529,655 16 Lamitube Hongkong Trading Company
Limited 0% 7,510 0% (1,265)
17 TheEgyptianIndianCompanyforModernPackagingS.A.E(75%)
1% 65,253,436 0% (1,756,844)
18 Essel Propack Misr for Advanced Packaging S.A.E(75%)
2% 218,565,785 6% 116,842,611
(III) Minority Interests1 TheEgyptianIndianCompanyforModern
Packaging S.A.E (25%)0% 21,751,145 0% (585,615)
2 Essel Propack Misr for Advanced Packaging S.A.E (25%)
1% 72,855,262 2% 38,947,537
(IV) AssociateForeign PT Lamipack Primula (30%) 2% 243,904,909 2% 27,449,023
(V) Joint VenturesForeign1 Essel Deutschland Management Gmbh (24.9%) 1% 138,623,190 1% 21,885,7872 Essel Deutschland Gmbh & Co. KG, Dresden
(24.9%)0% 1,204,012 0% 11,845
Note:Netassets/ShareofProfitorLossofsubsidiaries,associateandjointventuresareconsideredbasedontherespectiveauditedstandalonefinancialstatementswithoutconsideringelimination/consolidationadjustments.
36. Related Party Disclosures
a. List of parties where control exists
i. Ultimate holding company
Rupee Finance and Management Private Limited.
ii. Holding company
Whitehills Advisory Services Private Limited (Refer note 31)
iii. Joint venture/Associate companies
Essel Deutschland GmbH & Co. KG (Dresden), Essel Deutschland Management GmbH, P.T. Lamipak Primula.
iv. Other Related Parties with whom transactions have taken place during the year and balances outstanding at the year-end.
Aqualand(India)Limited,AyepeeLamitubesLimited,RamaAssociates,GanjamTradingCompanyPrivateLimited,ZeeEntertainmentEnterprisesLimited,SpritTextilesPrivateLimited,ShrotraEnterprisesPrivateLimited,ITZCashCardLimited,PanIndiaParyatanPrivateLimited.


130
Notes forming part of the Consolidated financial statements
Annual Report 2015-16
(B) Balance Outstanding as at 31 March
(Amount in `)2016 2015
Total Amount
Amount for Major Parties
Total Amount
Amount for Major Parties
a. Trade Receivables Joint Venture / Associates 27,864,997 29,118,641 Essel Deutschland Gmbh & Co., KG Dresden 27,864,997 29,118,641 Other Related Parties 74,495 2,352,623 Shrotra Enterprises Private Limited 74,495 2,246,612
b. Loans / Advances / Deposits givenOther Related Parties 1,115,676,940 1,115,676,940 Ayepee Lamitubes Limited 125,000,000 125,000,000 SpritTextilesPrivateLimited 960,666,940 960,666,940
c. Other ReceivablesJoint Venture / Associates 20,826 - Essel Deutschland Gmbh & Co., KG Dresden 20,826 - Other Related Parties 47,612 - Ayepee Lamitubes Limited 47,612 -
d. Interest ReceivableOther Related Parties 259,735,389 129,690,037 SpritTextilesPrivateLimited 259,735,389 129,690,037
e. Trade Payables / Other LiabilitiesJoint Venture / Associates - 309,224 Essel Deutschland Gmbh & Co., KG Dresden - 309,224 Other Related Parties 938,213 121,755 Ayepee Lamitubes Limited - 121,755Ganjam Trading Company Private Limited 938,213 -
f. Guarantees / security provided on our behalfOther Related Party 2,540,000,000 4,972,500,000Aqualand(India)Limited 2,540,000,000 4,972,500,000Loan Outstanding `1,792,789,641(`3,551,176,894)
g. Remuneration PayableKey Management Personnel 31,169,857 26,999,857 Managing Director 31,169,857 26,999,857
TransactionswithJointVenturehasbeenreportedatproportionatevalue.
“Major Parties” denotesentrieswhoaccount10%ormoreoftheaggregateforthatcategoryoftransaction.37. Dividend of ̀ 747,569(`Nil)unclaimedforaperiodofmorethansevenyearsistransferredtoInvestorEducationandProtection
Fundduringtheyear.ThereisnoamountdueandoutstandingtobecreditedtoInvestorEducationandProtectionFundasat31 March 2016.
38. Corporate Social Responsibility (CSR) TheCompanyhas towardsvariousCSR initiatives spend` 6,253,467 (` 4,720,000)asagainst`14,071,399 (` 13,100,454) as
requiredbySection135readwithScheduleVIIoftheCompaniesAct2013.CSRspendduringtheyearhasbeenchargedtotheStatementofProfitandLossunder“OtherExpenses”inlinewithICAIguidancenoteissuedinMay2015.Inthepreviousyear,theCSRspendhadbeenappropriatedoutofReservesandSurplusaspermittedunderthenprevailingICAIguidelines.

131
Notes forming part of the Consolidated financial statements
Annual Report 2015-16
39. Research & Development Expenditure
Duringtheyear,theCompanyhasreceivedrecognitionforIn-houseResearch&Development(R&D)unitfromtheDepartmentofScientificand IndustrialResearch (DSIR)w.e.f.30September2015.TheCompanyhas incurredtotalR&Dexpenditureof `63,419,077(`95,086,135)includingCapitalexpenditureof`12,500,839 (` 13,440,000).
40. The Scheme of Amalgamation (“the Scheme”) of EP Lamitubes Limited (“Transferor company”) with the Parent Companyw.e.f.1April2014,wassanctionedbytheHon’bleHighCourtofJudicatureatMumbaiandaccountedforasper“PoolingofInterest”methodprescribedunderAccountingStandard14“AccountingforAmalgamations”, inthefinancialstatementsfortheyearended31March2015,thedifferenceof`3,652,605,000betweennetassetstakenover,extinguishmentofCompany’sinvestments in transferor company and other reserves taken over being adjusted to Securities Premium of Parent company in termsoftheScheme.Further,asaconsequenceofimplementingthescheme,thegrouphasre-classified`2,748,696,640fromsecurities premium account to capital reserve on consolidation.
41. Prior period comparatives
Previousyear’sfigureshavebeenregrouped/reclassifiedwherevernecessarytocorrespondwithcurrentyear’sclassifications/disclosures. Figures in brackets pertain to previous year.
42. Segment Information
TheGroupconsidersgeographicalsegmentastheprimarysegmentinthecontextofAS-17.Thegeographicalsegmentshavebeenidentifiedandreportedtaking intoaccount, thedifferingriskandreturns, theorganizationstructureandthe internalfinancial reporting systems. TheGroupoperates only in one Segment viz. ‘Plastic PackagingMaterial’ and hence businesssegmentdisclosuresasperAS-17arenotapplicable.
Geographical segmentation:
(a) Africa,MiddleEastandSouthAsia(AMESA)includeoperationsinIndiaandEgypt.
(b) EastAsiaPacific(EAP)includesoperationsinChina,PhilippinesandHongKong.
(c) AmericasincludesoperationsinUnitedStatesofAmerica,MexicoandColombia.
(d) Europe includes operations in Germany, United Kingdom, Poland and Russia.
Segment reporting for the year ended 31 March 2016 Primary segment disclosure - Geographical segment
(Amount in `) AMESA EAP Americas Europe Unallocated Eliminations Total
Revenue ExternalSalesandServices 8,515,044,494 4,599,069,153 4,719,039,245 4,013,312,065 - - 21,846,464,957Inter-segmentSalesandServices 326,947,448 860,180,529 - 32,355,129 7,702,948 (1,227,186,054)Total Revenue 8,841,991,942 5,459,249,682 4,719,039,245 4,045,667,194 7,702,948 (1,227,186,054) 21,846,464,957Segment Result 1,337,081,350 867,195,805 593,975,738 227,799,887 (44,192,282) (13,076,206) 2,968,784,292Add:Otherincome(netofforeignexchangegainorloss) 176,603,442Less:Financecosts 623,422,088 Less:Corporatesocialresponsibilityexpense 6,253,467Profit before tax and exceptional items 2,515,712,179
Less:Exceptionalitems (23,455,336)Profit before tax 2,539,167,515 Less: Tax expense CurrentTax -Currentyear 712,844,425 - Earlier years 6,270,350DeferredTax (3,368,096)Profit after tax before minority interest and share of profit of associate 1,823,420,836 Add:Shareofprofitfromassociate 27,449,023Less:MinorityInterests 30,171,329Profit for the year 1,820,698,530

Annual Report 2015-16
132
Notes forming part of the Consolidated financial statements
Annual Report 2015-16
Other Segment Information:
AMESA EAP Americas Europe Unallocated Eliminations Total 1. Segment Assets 8,242,397,368 5,037,085,089 3,254,304,903 3,334,777,575 1,410,541,487 (446,680,008) 20,832,426,414 2. Segment Liabilities 1,638,474,022 798,285,256 584,368,059 531,745,609 7,751,992,835 (230,142,668) 11,074,723,113 3. Capital Expenditure 694,305,067 492,796,412 389,490,188 553,273,164 - (157,372,939) 1,972,491,892 4. Depreciation and
amortisation expense579,081,074 306,443,879 200,546,878 189,735,665 - (6,009,165) 1,269,798,331
Segment reporting for the year ended 31 March 2015 Primary segment disclosure - Geographical segment
(Amount in `) AMESA EAP Americas Europe Unallocated Eliminations Total
Revenue ExternalSalesandServices 10,606,109,862 4,259,874,280 4,781,169,250 3,582,412,180 - - 23,229,565,572Inter-segmentSalesandServices 367,425,593 1,078,325,057 286,893 2,592,488 6,943,378 (1,455,573,409)Total Revenue 10,973,535,455 5,338,199,337 4,781,456,143 3,585,004,668 6,943,378 (1,455,573,409) 23,229,565,572Segment Result 1,332,958,081 687,539,081 486,060,095 185,818,213 (41,098,305) (6,772,711) 2,644,504,454 Add:Otherincome(netofforeignexchangegainorloss) 154,779,547Less:Financecosts 793,565,210Profit before tax and exceptional items 2,005,718,791 Less:Exceptionalitems (55,191,644)Profit before tax 2,060,910,435 Less: Tax expense CurrentTax -Currentyear 475,252,719 - Earlier years 38,453,953 DeferredTax 96,826,316 Profit after tax before minority interest and share of profit of associate 1,450,377,447 Add:Shareofprofitfromassociate 3,154,063 Less:MinorityInterests 47,215,353Profit for the year 1,406,316,157
Other Segment Information:
AMESA EAP Americas Europe Unallocated Eliminations Total 1. Segment Assets 7,871,284,972 4,966,964,934 3,311,711,678 2,838,719,165 2,964,296,319 (591,999,531) 21,360,977,5372. Segment Liabilities 1,637,532,397 882,964,190 741,612,877 460,357,299 10,223,657,400 (414,812,418) 13,531,311,745
3. CapitalExpenditure 869,430,576 640,162,159 521,227,696 143,967,952 - (2,413,828) 2,172,374,5554. Depreciation and
amortisationexpense575,620,386 287,482,653 262,129,235 207,204,614 - (14,498,417) 1,317,938,471
As per our attached report of even date For and on behalf of the BoardFor MGB & Co LLPChartered Accountants Subhash Chandra Ashok GoelFirmRegistrationNumber101169W/W-100035 Chairman Vice Chairman & Managing Director
Boman MoradianHitendra Bhandari Mukund M. Chitale A.V. GanapathyPartner Radhika Pereira Directors ChiefFinancialOfficerMembershipNumber107832 Atul Goel
Place:Mumbai Suresh SavaliyaDate:28April2016 Head - Legal & Company Secretary

133
Annual Report 2015-16Annual Report 2015-16
Consolidated Cash flow statement for the year ended 31 March 2016
(Amount in ` )
2016 2015A Cash flow from operating activities
Profit before tax 2,539,167,515 2,060,910,435
Adjustments for:
Depreciationandamortisationexpense 1,269,798,329 1,317,938,471
Interestexpense 487,981,280 657,047,390
Interestincome (154,442,802) (162,699,557)
Exceptionalitems(net) - (55,191,644)
Gainondivestmentofsubsidiary(netoffprovisionforcontingencies) (51,915,613) -
Lossonsale/discardoffixedassets(net) 5,013,067 8,455,319
Lossonsale/disposalofInvestments 690,625 -
Provision for doubtful debts (net) 6,898,741 (8,716,100)
Amortisationofancillaryborrowingcosts 59,579,109 69,807,837
CapitalsubsidytransferredtoStatementofProfitandLoss (22,641,126) (10,182,937)
Exchangeadjustments(net) (161,520,687) (49,011,123)
Operating profit before working capital changes 3,978,608,438 3,828,358,091
Adjustments for:
Decrease/(Increase)intradeandotherreceivables 377,217,265 (93,469,105)
Decrease/(Increase)ininventories 247,173,673 (68,613,941)
Increaseintradeandotherpayables (165,356,337) (171,416,331)
Cash generated from operations 4,437,643,039 3,494,858,714
Corporatesocialresponsibilityexpenditureincurred(Refernote38) - (4,720,000)
Directtaxespaid(netofrefunds) (783,142,418) (360,649,070)
Net cash from operating activities (A) 3,654,500,621 3,129,489,644
B. Cash flow from investing activities
Purchaseoffixedassets(includingcapitalwork-in-progress) (1,943,196,802) (2,185,757,440)
Saleoffixedassets 28,451,077 192,392,846
Sale of long-term investments - 24,679
Divestment of subsidiary 1,171,716,532 -
Decrease in other bank balances 264,153,412 254,020,016
Interestreceived 24,044,114 290,611,152
Dividend received from associate 8,303,279 -
Government grant and capital subsidies received 22,433,454 -
Net cash used in investing activities (B) (424,094,934) (1,448,708,747)
C. Cash flow from financing activities
Proceeds from calls in arrears (including securities premium) - 1,077,750
Proceeds from issue of non-convertible debentures - 900,000,000
Proceedsfromlong-termborrowings 3,651,755,832 2,001,566,397
Repaymentoflong-termborrowings (5,229,325,768) (2,328,782,869)

134
Annual Report 2015-16Annual Report 2015-16
Consolidated Cash flow statement for the year ended 31 March 2016
(Amount in ` )
2016 2015
Proceedsfromshorttermborrowings 81,217,215 29,649,616
Repaymentofshorttermborrowings (153,814,802) (401,712,935)
Decreaseinotherborrowings(net) (644,097,053) (715,236,426)
Principalpaymentunderfinancelease (32,786,882) (111,107,852)
Interestpaid (519,100,099) (653,037,000)
Dividendpaid(includingtax) (356,635,615) (296,371,328)
ContributionfromMinorityInterests 14,905,600 -
DividendpaidtoMinorityInterests (39,215,573) (36,421,980)
Ancillaryborrowingcostsincurred (55,554,314) (67,780,479)
Net cash used in financing activities (C) (3,282,651,459) (1,678,157,106)
Net changes in cash and cash equivalents (A+B+C) (52,245,772) 2,623,791
Cash and cash equivalents at the beginning of the year 748,609,815 745,986,024
Cash and cash equivalents at the end of the year 696,364,043 748,609,815
Earmarkedbalanceswithbanks 154,046,306 415,531,976
Cash and bank balances at the end of the year 850,410,349 1,164,141,791
Note: Previousyearfiguresareregrouped/reclassifiedwherevernecessary.
As per our attached report of even date For and on behalf of the BoardFor MGB & Co LLPChartered Accountants Subhash Chandra Ashok GoelFirmRegistrationNumber101169W/W-100035 Chairman Vice Chairman & Managing Director
Boman MoradianHitendra Bhandari Mukund M. Chitale A.V. GanapathyPartner Radhika Pereira Directors ChiefFinancialOfficerMembershipNumber107832 Atul Goel
Place:Mumbai Suresh SavaliyaDate:28April2016 Head - Legal & Company Secretary

Annual Report 2015-16Annual Report 2015-16
Notes

Annual Report 2015-16
Notes

Annual Report 2015-16
Notes

Annual Report 2015-16
Notes

Annual Report 2015-16
Notes

Annual Report 2015-16
Notes

A customer is the most important visitor on our premises.He is not dependent on us.We are dependent on him.He is not an interruption on work.He is the purpose of it.He is not an outsider to our business.He is part of it.We are not doing him a favor by serving him.He is doing us a favor by giving us the opportunity to serve him.
“
“- MAHATMA GANDHI
A customer is the most important A customer is the most important visitor on our premises.He is not dependent on us.We are dependent on him.He is not an interruption on work.He is the purpose of it.He is not an outsider to our

www.esselpropack.com