Embed Size (px)
Citation preview
i
Essays on Women’s Empowerment in Developing Countries
Dissertation
In order to acquire the doctoral degree
from the Faculty of Economic Science,
at the Georg-August-Universität Göttingen
Submitted by
Debosree Banerjee
Born in 23.04.1981
Göttingen, July 2014
Thesis committee
Prof. Stephan Klasen
Prof. Marcela Ibanez
Prof. Matin Qaim
ii
Table of Contents
List of Tables ............................................................................................................................................ iv
Acknowledgement .................................................................................................................................... v
1. Introduction and overview of the thesis ......................................................................................... 1
1.1. Understanding empowerment of women............................................................................... 1
1.2. Market discrimination, market participation and control over revenue: A gendered analysis
of Cameroon’s cocoa producers .......................................................................................................... 2
1.3. Running for leadership: evidence from an artefactual field experiment in matrilineal and
patriarchic societies in india ................................................................................................................ 3
1.4. Ethnicity and gender differences in risk and ambiguity attitude ............................................ 6
2. Market discrimination, market participation and control over revenue: A gendered analysis
of Cameroon’s cocoa producers .............................................................................................................. 9
2.1. Introduction ........................................................................................................................... 10
2.2. Study context ......................................................................................................................... 13
2.2.1. The cocoa market in Cameroon .................................................................................... 13
2.2.2. Empirical data and descriptive statistics ....................................................................... 14
2.3. Estimation strategy................................................................................................................ 18
2.3.1. Identification ................................................................................................................. 18
2.3.2. Exogeneity of instrument .............................................................................................. 20
2.4. Results ................................................................................................................................... 21
2.4.1. Market participation...................................................................................................... 21
2.4.2. Control over revenue .................................................................................................... 23
2.5. Conclusion ............................................................................................................................. 26
3. Running for leadership: evidence from an artefactual field experiment in matrilineal and
patriarchic societies in India .................................................................................................................. 28
3.1. Introduction ........................................................................................................................... 29
3.2. Societal background .............................................................................................................. 33
3.3. Experimental design .............................................................................................................. 35
3.3.1. Treatment ...................................................................................................................... 37
3.3.2. Experimental procedures .............................................................................................. 40
3.4. Results ................................................................................................................................... 40
3.4.1. Descriptive statistics ...................................................................................................... 40
3.4.2. Self-selection into the role of third-party ...................................................................... 40
3.4.3. Regressions analysis ...................................................................................................... 46
iii
3.4.4. Characteristics of participants who self-select in the role of third party ...................... 49
3.5. Conclusion ............................................................................................................................. 52
4. Ethnicity and gender differences in risk and ambiguity attitude .................................................. 54
4.1. Introduction ........................................................................................................................... 55
4.2. Ethnicity background ............................................................................................................. 57
4.2.1. Matrilineal Khasi ............................................................................................................ 58
4.2.2. Patriarchal Santal ........................................................................................................... 59
4.3. Hypotheses ............................................................................................................................ 60
4.3.1. Within ethnicity difference............................................................................................ 60
4.3.2. Between ethnicity differences ...................................................................................... 61
4.4. Experimental design .............................................................................................................. 61
4.5. Payoffs ................................................................................................................................... 63
4.6. Attitude measurement .......................................................................................................... 63
4.7. Data and descriptive statistics ............................................................................................... 64
4.8. Results and interpretations ................................................................................................... 66
4.9. Summary and conclusion ...................................................................................................... 70
Biblography............................................................................................................................................ 71
APPENDIX .............................................................................................................................................. 81
Curricula Vitae ....................................................................................................................................... 91
iv
List of Tables Table 2.1: Descriptive statistics of individual characteristics by gender ............................................. 16
Table 2.2: Share of revenue controlled by market participation and gender ....................................... 17
Table 2.3: Prices received by gender .................................................................................................... 17
Table 2.4: Market participation in villages with and without male farmers selling through CIGs ...... 20
Table 2.5: Determinants of market participation .................................................................................. 22
Table 2.6: Instrumental variable analysis of control over cocoa revenue ............................................ 25
Table 3.1: Experimental schedule ......................................................................................................... 37
Table 3.2: Treatment Description ......................................................................................................... 39
Table 3.3: Number of subjects by treatment .......................................................................................... 40
Table 3.4: Socio-economic characteristics and randomization check .................................................. 42
Table 3.5: Proportion of subjects applying for punisher by society and gender .................................. 44
Table 3.6: Proportion of subjects applying for punisher by society, gender and wage ........................ 46
Table 3.7:Marginal effects of choice of leadership application from a linear probability model ........ 47
Table 3.8: Random effect regression on application by gender and society depending on wage ......... 49
Table 3.9: Characteristics of Applicants vs. Not Applicants ................................................................. 51
Table 4.1: Number of subjects by gender and society ........................................................................... 64
Table 4.2: Demographic characteristics of the subjects by society and gender ................................... 66
Table 4.3: risk and ambiguity aversion by gender and ethnicity .......................................................... 67
Table 4.4: Within ethnicity gender differences (male-female) in risk and ambiguity attitude .............. 68
Table 4.5: Ethnicity (matrilineal –patriarchal) differences in risk and ambiguity attitude .................. 69
Table A.1: Testing for the exogeneity of % of male farmers selling collectively in village .................. 81
Table A.2: First stage regression results of IV models presented in Table 2.6 ..................................... 82
Table A.3: Comparisons of Covariates by Treatments.......................................................................... 83
Table A.4: OLS estimation of risk and ambiguity attitude with socioeconomic controls ...................... 88

v
Acknowledgement
I am deeply indebted to my advisors: Prof. Stephan Klasen, Prof. Marcela Ibanez and Prof.
Meike Wollni for their valuable suggestions and supervision. Without their support and
constructive criticisms this work would not have been succeeded. My utmost gratitude goes to
my main advisor, Prof Stephan Klasen for allowing me to work with him, his time, patience,
and most importantly for his kindness. Meeting Prof. Klasen for supervision not only helped
me in my thesis but constantly made me confident about my capabilities. This is truly a
unique experience for me.
I would like to thank Prof. Marcela Ibanez, Prof. Gerhard Reiner and Prof. Meike Wollni for
making me understand the true rigor behind good quality research, in terms of why
researching an issue, how to carry on the research, writing and finally defending the research.
I would also like to thank the Research Training Group of GlobalFood at the University of
Göttingen, especially the chairperson, Prof. Matin Qaim and the head of coordination office,
Dr. Melanie Grosse for facilitating the research atmosphere; organizing the time frame and
the courses and providing guidance in all official issues.
Finally, I am thankful to my family and friends, Maa, Baba, Jhuma, Debasis, Arunasis,
Ramona, Amjad for constantly encouraging me in my research.
1
1. Introduction and overview of the thesis
1.1. Understanding empowerment of women
There has been a spur of studies attempting to define the concept of women’s empowerment.
But the meanings and terminologies associated with this concept still vary. For example, it is
not always clear whether terms such as “women’s empowerment,” “gender equality,” “female
autonomy,” or “women’s status” are referring to same or different concepts. Nonetheless, the
concept of women’s empowerment can be distinguished from others by two defining features.
The first is process (Kabeer, 2001; Oxaal and Baden, 1997; Rowlands, 1995) of change
towards greater equality and increased ability and freedom to make choices. The second is
agency in which women themselves are the actors in the process of bringing changes
(Malhotra and Schuler, 2005). Lately the agency issue has started to receive more attention
and women no longer remain as passive recipient of welfare enhancing help. Instead they are
being seen as active agents of economic and social changes altering lives of both men and
women. The focus of agency role of women has direct bearing on women’s welfare in terms
of ability to make strategic life choices, but its reach goes beyond that in areas such child
survival, decreasing fertility etc. (Sen, 1999).
Empowerment of women has been widely acknowledged as an important target in
international development. There are two main rationales supporting active policies on
women empowerment (Duflo, 2011). First, women are currently worse off than men in
dimensions of wellbeing in most developing countries and such inequality is not desirable.
This was pointed out by Kofi Annan, the Secretary General of the United Nations in the
United Nation’s 2005 report on the Millennium Development Goals (MDG): “The full
participation of women to all levels of decision-making is a basic human right.” Second, from
the point of view of the policy making, women play a crucial role in development. Studies
suggest that putting earnings in women’s hands is desirable to speed up development as
women usually reinvest a much higher portion in their families and communities than men,
spreading wealth beyond themselves (Gertler, 2004; Janvry and Sadoulet, 2006). Thus
women’s empowerment is a prerequisite to achieving the other MDGs (World Bank, 2001,
2011).
A large number studies in economics have attempted to empirically measure various aspect of
women’s empowerment. A majority of them seem to develop a common consensus on certain
factors promoting women’s empowerment, such as, education, labor force participation,
microcredit etc. (Sadik, 1993; Bradley and Khor, 1993; Mason, 1986; Malhotra and Mather,
2
1997; Hashemi et al., 1996). Malhotra and Schuler (2005) in their study have provided a
comprehensive overview of factors playing positive role in empowering women
economically. They segregated these factors at three different unit of observation levels: (1)
household level factors, such as, control over income; ownership of assets, land and family
resources and contribution to family support (2) community level factors, such as, access to
employment, credit, market; representation in local level organizations and finally (3) at
broader areas, such as, representative at the high paying jobs; representation of women’s
interest in macro level policies and budgets.
In our study, we attempt to discuss some of these elements in three different essays. In the
first essay, we discuss how access to agriculture market by female farmers in Cameroon could
improve their own control over the proceeds of their agricultural output. Scope of this
research falls in the general category of household and community level factors affecting
women’s empowerment. In the second and third essay discuss aspects of participatory
development in India in areas ranging from community development to hierarchical institutes
and politics. We concentrate on two aspects of participatory development: One is under-
representation of women in leadership; and second is gender differences in leadership style
with respect to their risk and ambiguity attitude. For the purpose of the thesis we restrict
ourselves only to developing countries where gender differences are more pronounced.
Next three sections of the introduction provide a comprehensive discussion on the specific
research objectives, contributions and findings of these essays.
1.2. Market discrimination, market participation and control over
revenue: A gendered analysis of Cameroon’s cocoa producers
During the last few decades, important changes have been taking place in agro-food system
(Bouis & Haddad 1990; Dorsey, 1999) in terms of processing, wholesale and retail. Such
transformation in global food system has been increasingly integrating domestic farmers to
the local as well as international markets. However, while a large number of studies have
confirmed the welfare role played by agri-food transformation, relatively lesser number of
studies analyzed the issue of underrepresentation of women in agricultural markets. Female
farmers suffer from serious disadvantages when it comes to the opportunities to participate in
markets due to factors, such as, lower adoption of new technologies, lower access to extension
service, lower integration with marketing channels etc. which then reduces their access to
income(Blackden & Bhanu, 1999; Blackden et al. 2007; Kumase et al., 2008).
3
In our study, we investigate the impact of market participation on women empowerment
measured as increased control over agricultural proceeds. Unlike other studies which discuss
unequal access to resources as a critical factor lowering intrahousehold status for women, we
investigate lower market participation as another factor contributing to intrahousehold
inequality which potentially hurts women. Previous studies have identified the welfare effect
of market participation in terms of increased income. Yet it has not been explained what
determines the control over income. Our study fills this gap using micro level data for 911
male and female cocoa farmers from Cameroon. We test for two specific hypotheses (1)
collective marketing fosters market participation in agricultural markets and helps to reduce
price discrimination in output markets; (2) market participation affects control over cocoa
revenue positively, where control over revenue is measured by the proportion of revenue
controlled by the farmers individually. Methodologically, our study has to contend with the
possibility that unobserved factors that affect female participation in marketing also affect
female control over the resources which could lead to bias in the estimations. We address this
problem by exploring exogenous variation in collective marketing activities at the regional
level.
Our findings show that market participation renders higher control over cocoa proceeds.
However, female market participation is hindered by price discrimination in cocoa market of
Cameroon. Female farmers receive significantly lower price than their male counterparts in
cocoa markets and in order to obtain higher prices they handover the task to another family
member, preferably a man. As a result the individual carrying out marketing could have a
share in revenue which then reduces farmers’ own control over the proceeds. On the other
hand, control over the revenue is significantly higher for farmers who take up marketing on
their own. Collective marketing reduces the gender gap in prices as price received by farmers
under collective sell does not vary across gender. This leads to increased female participation
in marketing and higher control over agricultural proceeds. We therefore conclude that the
development of collective marketing plays a critical role in improving female intrahousehold
bargaining power calling for the attention of policy makers towards strengthening of
collective actions.
1.3. Running for leadership: evidence from an artefactual field
experiment in matrilineal and patriarchic societies in india
Empirical evidence suggests that participation of women in leadership positions is associated
with increased provision of public goods which in turn can have important consequences for
4
subsequent growth and equity (Chattopadhyay & Duflo 2004; Chen, 2010). Nonetheless,
women remain under-represented in leadership positions. For example, among the largest 500
publicly-listed companies in the US, men account for 86% of the executive positions, 84% of
the boards of directors and 96% of the Chief Executive Officers. In other regions of the world,
such disparities are even larger. For example, in India, among 100 companies on the Bombay
Stock Exchange only 5.3% of total directorships were held by women, less than 50% of the
companies had women on their boards, while 54 companies had no female representation at
all (Banerji et al., 2010).
Explanation of the sparse representation of women in elite leadership roles has been
traditionally ascribed to causes, such as, gender discrimination. Discrimination occurs because
women are often thought to have less leadership abilities than men with similar achievements
(Duflo and Topalova, 2004; Eagly and Krau, 2002). Alternatively, it has been considered that
gender differences in personality traits, such as, competitiveness (Niederle and Vesterlund,
2007; Gneezy et al., 2003), risk taking behavior (Eckle and Grossman, 2002, 2008; Croson &
Gneezy, 2009), bargaining power (Kray et al., 2001,2002), confidence and competence
(Eagly and Karau, 2002), could explain these differences.
In this essay we consider an alternative view and investigate, whether women are absent in
leadership positions due of the lack of intrinsic motivation to assume such role. There is
substantial evidence on self-segregation by women into low paid occupations. For instance
Cepeda & Baron (2012) find that that 40% of the wage gap against women in Colombia can
be explained by differences in selection of degree of studies. Similar evidence is established
for UK, Germany (Machin and Puhani, 2003) and Taiwan (Lin, 2010). Hence, it is plausible
that women also self-segregate out from top leadership positions.
Our research contributes to the understanding of self-segregation in leadership roles by
investigating the role of social norms and intrinsic motivation. Our experimental approach is
based on a linear public good game with endogenous third party punishment. Hence,
participants can decide whether they want to play the role of contributors or the role of third
party, which would replicate a leadership position. As third parties do not benefit from
contributions to the public good, the motivation to sanction contributors can be associated
with willingness to become social regulator.
To investigate whether gender differences in willingness to assume positions of leadership is
innate or is given by social norms, we compare societies that vary in terms of the
empowerment of women. In particular, we conducted the experiment in two different states of
5
India, namely Meghalaya and West Bengal, with the local tribes known as Khasi and Santal.
These two tribes differ from each other with respect to their intra-society power structure. In
the patriarchal Santal society men are the major decision-makers, while in matrilineal Khasi,
women are the dominant gender.
Our experimental design explores the presence of two different motivations that affect the
leadership choice by women: conformity with the social norms and aversion to feedback. The
first motivation relates to situations where there are concerns on social perception on the
appropriateness of roles assumed by men and women in the society. To assess the effect of
conformity with social norms, we compare scenarios in which the degree of anonymity varies
exogenously. In the experimental set this is achieved by comparing public leadership versus
anonymous leadership. The second motivation that we address is aversion to feedback or
aversion to retaliation.
Finally, we examine the effectiveness of two different policy instruments to promote women
to take leadership roles: 1) Affirmative action and 2) increase in leadership wage. Affirmative
action has been utilized by policy makers as an effective tool to promote women’s
participation in leadership. It has been found to be effective as affirmative action could bring
change in perception about women in leadership role and also encourage women participation
in leadership roles (Duflo and Topalova, 2004; Ibanez, Riener, Rai, 2014). By examining
affirmative action we could additional establish effectiveness of such instruments across
societies that are culturally different. Similarly, we examine impact of higher pecuniary
incentive on leadership inclination of subjects and its effectiveness in attracting women to the
leading role. We find positive impact of affirmative action in patriarchal society and a
detrimental effect in matrilineal society. Finally, we find that pecuniary incentives promote
females and males to opt in to the power position, however, our evidence also suggest that
higher remuneration crowds out voluntary motivation to take the power role and is less
effective than affirmative action incentives.
Our study supports three major findings. First while women in patriarchal society are
significantly leadership averse in matrilineal society they show higher inclination towards
leadership. However, once we introduce anonymous leaders and make the social norms silent
we find a convergence in female preferences with respect to leadership choice in these two
societies. Finally, we find that affirmative action is an effective policy to promote female
leaders in patriarchal society, while it discourages female leadership in matrilineal societies.
6
Therefore, we conclude in a country like India with societal diversities policies, such as
affirmative action, instead of central level, should be taken up at the state level.
1.4. Ethnicity and gender differences in risk and ambiguity attitude
Economic studies on participatory development and gender so far have followed a two-stage
approach. At the initial stage, a large number of studies were conducted to understand
inclusion of women in leadership role and its welfare implications for women’s empowerment
(Adhikari and Lovett, 2006; Agarwal, 2001; Kabeer, 1994; Moser, 1993). These studies
concluded that participation, in general, is welfare improving, and in particular, has generated
higher socio-economic status for women. Very recently, further attempts were carried out to
analyze the dilemma of participation and effective participation (Agarwal, 2001) which
relates more to the decision making style of women in leading role. The third essay of the
thesis investigates particular aspects of effective participation in terms of gender differences
in leadership style with regard to risk and ambiguity attitude.
The main idea we pose in this essay is that being a leader in a group often involves taking
decision on behalf of a group that affects payoff of others. The outcomes of these decisions
are not certain and depend on the probability of success. Examples of such decisions might be
making investment decisions on behalf of group; or introducing new machines in a factory
whose probability of success depends on the unobserved ability of workers to adapt to the
technical changes. While the first example relates to the risk attitude of the leader, second
depends on the ambiguity attitude. The difference between risk and ambiguity, as defined in
experimental economics is that, in the first the probability of success is known; while in the
second probabilities are unknown.
In experimental economics a stylized findings is women are more risk averse than men (for
survey see Charness and Gneezy, 2012; Croson and Gneezy, 2009; Eckel and Grossman,
2008). On ambiguity attitude, some studies also found similar evidence of gender difference
(Jianakoplos and Bernasek, 1996, Barsky et.al., 1997, Powell and Ansic, 1997). In our
research we attempt to understand the gender difference in leadership style with respect to
risky and ambiguous choice. In other words, we explore whether the gender difference that is
found in the individual context prevails when men and women are in a leadership role.
In order to achieve our research objective, we use the framework of Ellsberg’s (1961) two
color game on risk and ambiguity attitude. In the game participants are faced with a choice
between a gamble and a certain amount. We use a simple gamble of drawing a ball from a bag
7
containing pink and yellow balls, but guessing the color before the draw. In case of correct
guess subjects received the gamble prize, otherwise nothing. Alternatively, they might decide
not to opt for gambling and take the certain amount indicating their aversion toward risky or
ambiguous decisions. In the risk game subjects are aware of the exact proportion of colors in
the bag in the ambiguity game they remain unaware of the proportion.
The specific contributions of this experiment relates to how we analyze leadership. We
introduce leadership in an experimental induced treatment and then compare the risky and
ambiguous choices of the subjects from two different cultural backgrounds. In the first case,
each individual plays two variants of the same game; first they play for themselves, in which
payoff is received individually and then for their groups, determining the payoff of all group
members. Outcomes are then compared in four cases: individual risk, group risk, individual
ambiguity and group ambiguity. Second, we tested whether the gender differences in risk and
ambiguity attitude could be attributed to nature or nurture. For our purpose, we implemented
the same experiment with 604 subjects from two different ethnic groups in India. One of these
ethnicities is a matrilineal tribe known as Khasi and the other is a patriarchal tribe known as
Santal. These tribes differ from each other with respect to their intra-cultural gender norms
with women being the social head in Khasi and men being in main gender in Santal.
We expect gender difference in risk and ambiguity attitude to exist in both societies, however,
the direction of difference should be opposite. In other words, we hypothesized that
matrilineal women will have a higher risk and ambiguity taking attitude than men; but
patriarchal women will have higher risk and ambiguity aversion. We conjecture such
outcomes because matrilineal women and patriarchal men hold similar social status in their
respective societies. We also hypothesized that between these tribes matrilineal women will
be significantly more risk and ambiguity taking than the patriarchal women because of the
former plays a more critical role in the society in terms of decision making than the later.
Finally we hypothesize that subjects will be significantly more risk and ambiguity averse in
group decision making than in individual decision making.
Our finding shows that women, in both ethnicities, are more risk averse than men in
individual choices as well as in group choices. Therefore, first conclusion we draw from our
study is that gender difference in risk aversion is a common phenomenon and does not depend
on the cultural background of the subjects. Also, since such difference persists not only in
individual choices but also in group choices we argue that women are more risk averse than
their male counter parts even when they are in leading positions. Second, on ethnicity
8
difference we find that matrilineal male and female are more risk averse than patriarchal male
and female respectively. Therefore, we find that there is an ethnicity difference in risk taking
attitude with matrilineal subjects being more risk averse than the patriarchal subjects. This
goes against our hypotheses on risk attitude of the leading gender in the society (we thought
that matrilineal women and patriarchal men will be more inclined toward risky choices than
the patriarchal female and matrilineal men respectively). We then conclude that such ethnicity
difference in risk attitude might occur due to the differences in the economic and climatic
conditions faced by the subjects. Khasi subjects are located in regions that are economically
more backward than that of Santals’ and they are often exposed to adverse climatic conditions
or shocks. These might have caused the higher risk aversion by the Khasi subjects in the
experiment.
9
2. Market discrimination, market participation and control over
revenue: A gendered analysis of Cameroon’s cocoa producers1
Abstract
Using micro level data from Cameroon this paper applies the theories of
intrahousehold bargaining to models in which female farmers decide whether to take
up cocoa marketing on their own or to rely on others to sell the product. We analyze
the effect of marketing on control over the proceeds. We find that controlling both
production and marketing provides higher bargaining power over proceeds compared
to a situation in which the farmer participates only in production and delegate the task
of marketing to another family member. Our data also indicate that in the cocoa sector
of Cameroon, female farmers’ market participation is hindered by existing price
discrimination, which in turn reduces their intrahousehold bargaining power. In other
words, participating female farmers receive much lower prices for their produce than
participating males. To generate higher revenue, female farmers hand over the
marketing responsibility to a male in the family. Such non-participation results in
lower control over the proceeds by the female farmer, as the individual doing the
marketing can now claim a higher share in the revenue. Additionally we find that
collective marketing contributes to eliminating price discrimination and promoting
female market participation and thus their control over proceeds.
Keywords: Agricultural market participation, Gender, Control over income, Price discrimination
JEL Code: D10, D19, D81, J16
1 This paper is a joint work with Stephan Klasen, and Meike Wollni. Klasen: Department of Development
Economics, University of Göttingen, Germany; Wollni: Department of Agricultural Economics and Rural
Development, University of Göttingen, Germany. We would like to thank Wokia Kumase for providing us the
data and all the background information on cocoa producing farmers in Cameroon. We also thank Marcela
Ibanez and all participants of GlobalFood symposium, 2014 for valuable discussion and comments. Finally, we
thank the DFG for funding this research as a part of GlobalFood Research.
10
2.1. Introduction A fundamental issue in microeconomics with particular relevance to developing countries is
how to model household behavior when systematic differences in preferences exist.
Undoubtedly household decisions, such as who works for how many hours, how to generate
income, and who receives how much of the household resources, are the outcome of
intrahousehold decision making and have crucial implications for individual welfare. It has
been shown that household members with higher bargaining power have more influence on
decision making than members with less bargaining power (e.g. Sen, 1990; Thomas 1997,
World Bank 2001, Klasen, 1998). Therefore, intrahousehold bargaining2 and associated
intrahousehold outcomes have generated great interest among researchers and policy-makers
concerned about the well-being of women and children, which is largely dependent on the
outcome of this intrahousehold bargaining.
The empirical literature has confirmed that women with lower bargaining power tend to have
less access to household resources, such as resources allocated to health, education and access
to land, than their male counterparts (Thorsten, 2002; Udry etal, 1995; Chiappori, 1988, 1992;
Browning & Chiappori, 1998; Klasen, 1998). Second, causal association between bargaining
and household decision-making in the allocation of resources flows both ways. Unequal
access to resources affects bargaining and then lower bargaining power causes lesser access to
household resources (Basu, 2006). Therefore, persistence of a gender gap in intrahousehold
bargaining could be attributed to gender gaps in access to any income generating activities or
access to assets and unearned incomes (Rocheleau & Edmunds 1997; Rose & Hartmann 2004,
Thomas, 1997). Furthermore, such differences tend to be even stronger in rural economies
where family and community norms regarding the accumulation and transmission of wealth
are important to determine the within-household wealth allocation, which in turn affects the
bargaining power of male and female household members. Under these customary norms in
many rural settings in developing countries, production systems favor male over their female
counterparts in terms of access to productive resources, such as land, which then translates
2Intrahousehold bargaining models are typically modeled within a cooperative bargaining framework. A typical cooperative
bargaining model of marriage starts with a family consisting of only two members: a husband and a wife. Individual agents,
whose utility depends on their consumption of a private good, bargain with each other and depending on their relative
bargaining strength, family demand is determined. If agreement is not reached between spouses, then the payoff received is
represented by the utilities associated with divorce or a non-cooperative equilibrium within marriage, which are often known
‘threat points’; as a result, bargaining outcomes within marriage depend on this threat point as this circumscribes the
bargaining solution (Manser-Brown, 1980 and McElroy-Horney, 1980, 1990, Chiappori, 1992 and Browning &Chiappori,
1998). Recent empirical tests of predictions of household models have strongly supported the role of bargaining power for
household decisions, while debates continue whether the outcome of bargaining is pareto efficient or not (e.g. Browning and
Chiappori, 1998; Haddad, Hoddinott, and Alderman, 1997).
11
into lower productivity and income levels for female-headed farm units (FAO, 2011; IFAD,
2011; Quisumbing & Pandolfelli, 2010; World Bank, FAO, & IFAD, 2009).
While unequal access to productive resources has well been discussed in the literature to
address the gender gap in agricultural productivity and income (Udry, 1996; Fletschner, 2009,
Zwarteveen, 1996), research on inequalities arising in the post-harvest period is relatively
rare. Factors, such as information asymmetry (Fletschner & Mesbah, 2011, Chowdury, 2006;
Ngimwa et al., 1997), incomplete integration of farmers in high-value production and
marketing chains could potentially affect farmers’ intrahousehold bargaining by reducing the
opportunities of better market access and higher income. So even if women have access to
assets and control production, if they do not control the marketing of output, they may still
have little control over the proceeds and thus lower household bargaining power. This could
be particularly true for female farmers, who are typically less involved in commercialized
farming due to lower adoption of new technologies, lower access to extension service, lower
integration with marketing channels etc., which results in unequal market participation by
them (e.g. Blackden & Bhanu, 1999; Blackden et al. 2007; Kumase et al., 2008).
In our study we investigate female participation in commercialization of agricultural product
and examine its impact on intrahousehold bargaining. The contribution of the study is
threefold. Based on a survey with 911 male and female cocoa farmers in Cameroon, we first
attempt to investigate the causes of unequal market participation by male and female farmers;
second, we estimate the impact of market participation on intrahousehold bargaining; and
third, we also explore the role of collective marketing in improving female market
participation. Specific hypotheses that we examine are (1) market participation by female
farmers is positively associated with collective marketing but negatively influenced by
gender-based price discrimination in output markets (2) market participation affects control
over cocoa revenue positively, where control over revenue is measured by the proportion of
revenue controlled by the farmers individually.
Given that unobserved factors that explain female participation in marketing activities can be
correlated with control over proceeds, simple OLS estimations would lead to biased results.
We address this problem by linking the hypotheses above. In particular, our estimation uses
the presence of collective marketing institutions (and male participation in these channels) as
instruments for female market participation.
Cameroon’s cocoa production provides us with a unique platform to address the research
objective as, unlike in Asia, in many Sub-Saharan African countries, such as in Cameroon,
12
agricultural production is often managed and controlled by male and female farmers
separately. Decision-making authority with respect to the cultivation on these plots rests with
individual household members; cultivation expenses are paid by the individual; and output
from the plot is attributed to that individual (Duflo and Udry 2004, Bisseleua, Klasen, and
Kumase, 2005). This enables us to investigate marketing activities and resulting income
inequalities by gender of the farmer.
Our data shows that although female farmers manage cultivation individually, marketing of
cocoa mostly rests in the hands of the men. In contrast, male farmers usually control both the
production as well as the marketing of cocoa. An important point to note here is that for
(mostly female) farmers who do not participate in marketing, our data show that the task is
then mainly carried out by another (typically male) family member. We also find that one of
the plausible factors that could explain the lower market participation by female farmers is
price discrimination. In particular, female farmers who market their cocoa receive
significantly lower prices than their male counterparts. Consequently, revenue received by
participating women is much lower than by participating men indicating that income
opportunities are higher if a man takes over the marketing task. In our research area, we
therefore find a large number of women relying on male members of the family for marketing
their produce. While this strategy leads to higher revenues for the household, we find that it
lowers the share of resources controlled by women compared to the situation where female
farmers carry out the marketing themselves. Finally, our estimation shows that villages with
better access to collective marketing could bring down the gender disparity in market
participation by lowering the existing price discrimination. In particular, if male farmers
increase their participation in collective marketing, the price received is uniform across all
group members, thus removing the gender gap in prices, which in turn encourages female
farmers to take part in the marketing and improves their control over proceeds.
The paper is organized as follows. Section 2.2 provides a brief description of the study
context and discusses the data; section 2.3 provides a description of the estimation strategy;
section 2.4 discusses the results; and section 2.5 concludes the paper.
13
2.2. Study context
2.2.1. The cocoa market in Cameroon
The organization of cocoa marketing in Cameroon is characterized by the interactions
between licensed buyers, buying agents3, Common Initiative Groups (CIGs)
4 (who often
present themselves as producers’ organizations) and producers’ organizations (PO)5. Activity
wise the POs and CIGs do not differ much from each other. They are different to some extent
with respect to their funding sources. Licensed buyers are mostly based in the cities and buy
cocoa in large quantities. They purchase either directly from farmers or rely on buying agents,
who collect cocoa from large numbers of smallholder farmers. Buying agents often have long-
standing relationships with farmers and offer them pre-harvest financing for input purchases.
At harvest, they collect cocoa at the farmgate and then resell it to the licensed buyers.
Licensed buyers transport the cocoa in large quantities to the buying centers, where it is sold
to the exporters. Producers can market their cocoa either individually or collectively through
POs and CIGs. Cocoa cultivation in Cameroon is a small-scale business with plantations
ranging between two to five hectares. Most farmers are members of CIGs or POs, even if they
market their cocoa individually. As members of such groups they can leverage the benefits of
collective action, in terms of easier access to fertilizers and pesticides, regular contacts to
government extension officers and exchange of knowledge, and better marketing
opportunities and prices.
In case of collective marketing, these groups sign contracts with buyers, identify those
members who have cocoa for sale, and then sell the total amount of cocoa collectively to the
buyer. Thus, in the case of collective sales, CIGs and POs act as procurement organizations
for buyers (Folefack & Gockowski, 2004; Gockowski, 2008). However, cocoa sales do not
figure high on the priority list of all CIGs. Many CIGs instead focus on the protection of
farmers’ rights, on the organization of extension visits to obtain information on new farming
3 Buying agents work for a licensed buyer and are paid on commission.
4After liberalization in 1994, the government withdrew all financial support and farmers found it difficult to procure
fungicides and pesticides from private suppliers and as a result many of them started to look for alternative agricultural
activities. Under such a scenario, the government and many non-governmental-organizations (NGOs) started to encourage
cocoa farmers and traders to organize themselves in ‘common initiative groups’ (CIGs) to promote welfare through bulk
marketing. The formation of CIGs helped to reduce transaction costs and as a result the prices paid to producers increased. In
1997, world cocoa prices started to recover from previous lows, thus bringing back many farmers to cocoa production
(Duguma et al. 2001).
5After liberalization, in the Centre region the former state cooperatives disappeared. POs primarily grew up with the support
from development projects such as the Sustainable Tree Crop Program based at the IITA. According to Folefack &
Gockowski (2004), 40% of the cocoa producers in the Centre are members of a PO. In the Southwest, the former
cooperatives (such as the Southwest Farmer Cooperative Union based in Kumba) were placed in the hands of CIGs. In the
absence of projects supporting producers’ initiatives, no POs have been able to emerge in the Southwest.
14
techniques, and on the promotion of farmer-to-farmer assistance through the creation of
farmers’ networks. However, most of the smallholders living in remote villages are not well
connected with the market and lack sufficient knowledge about market prices. As a result,
farmers can be exploited by buying agents who tend to behave opportunistically by offering
lower prices than the market price. In addition, farmers often obtain input credit from buyers
to purchase fertilizers and pesticides during the production phase, which is then deducted
from their cocoa deliveries at harvest. Due to their repayment obligations, farmers also face a
lower bargaining position vis-à-vis the buyer in such a situation. In this context, collective
sales organized through CIGs can improve the farmers bargaining situation vis-à-vis buying
agents and thus protect them from opportunistic behavior.
Hence, collective sell through the reduction of transaction costs not only facilitates better
access to marketing channels, but it also secures access to new technologies, and allows
farmers to tap into high value markets (Stockbridge et al., 2003). Additionally, there is
evidence that collective action can help smallholders to reduce barriers to entry into markets
by improving their bargaining power with buyers and intermediaries (Thorp et al., 2005;
Kherallah et al., 2002).
2.2.2. Empirical data and descriptive statistics
The empirical analysis is based on primary data, which was collected in six major cocoa
producing subdivisions in Southwest and Center Cameroon, namely Ngomedzap, Boumyebel,
Obala, Mbangassina, Bokito and Kumba (Kumase et al., 2008)6. The survey was conducted in
October and November 2007 using a multi-stage random sampling approach. In the first
stage, twelve communities were randomly selected within the six sub-divisions. Subsequently,
within these twelve communities, 53 villages and 911 respondents were selected randomly. In
total, 181 female farmers and 770 male farmers participated in the survey. All survey
participants are members of Common Initiative Groups (CIGs). The villages are small (500 -
5000 inhabitants), yet, differ regarding their ethnic background and market orientation.
Villages in Kumba and Mbangassina are mainly composed of migrants, who are more market-
oriented and less concerned with land accumulation than their indigenous counterparts.
Women in these communities are more engaged in commercial activities that require them to
leave their homesteads. Villages in Bokito, Boumyebel, Ngomedzap and Obala are mainly
composed of local people who are less market-oriented. Women in these communities are
involved in small income-generating activities, but unlike the women in Kumba and
6 The survey in Kumase et al. (2008) was generated with support from BMZ via GIZ.
15
Mbangassina, they generally carry out their activities at home and generate considerably
lower earnings.
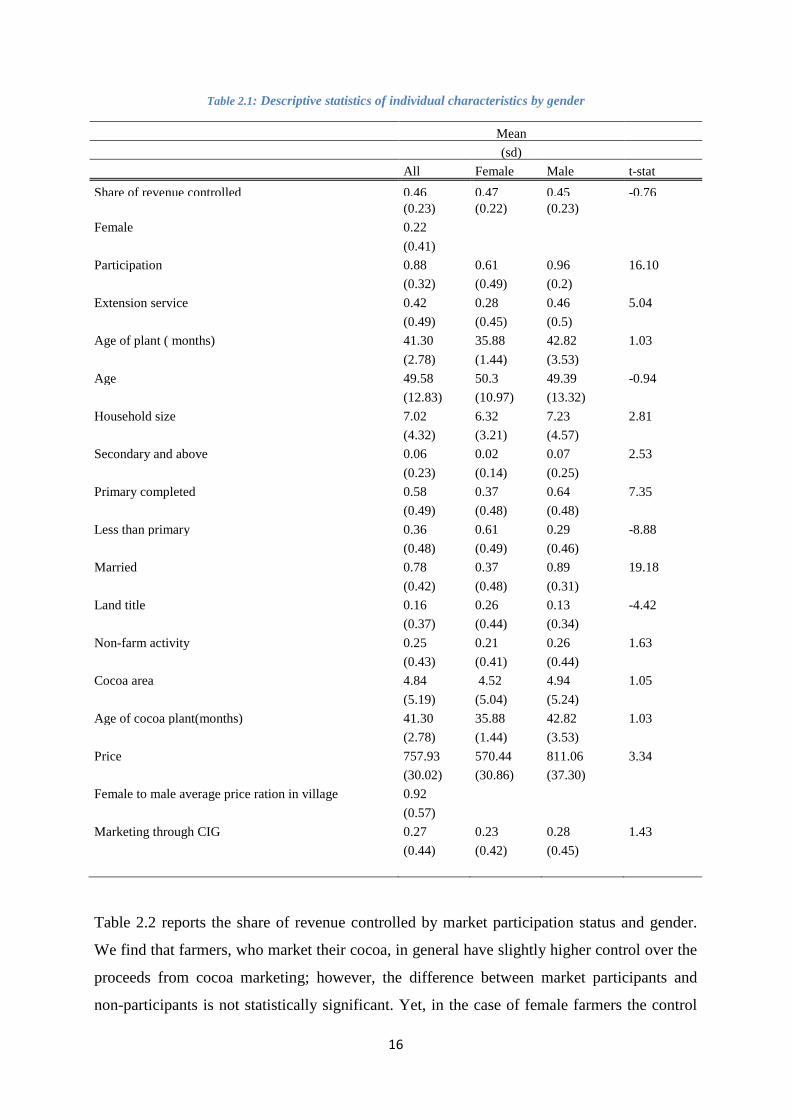
Table 2.1 presents descriptive statistics of individual characteristics by gender. Results show
that while overall 78% of the farmers in our sample are married, marriage rates are
significantly higher for male farmers. This is due to the fact that many female farmers are
either widowed or single women, which is part of the reason that they control cocoa
production. Nonetheless, a considerable share of female farmers in our sample is married
(37%) and still controls cocoa production. Our data further suggest that female farmers are
significantly less educated than male farmers: while 64% of men have completed primary
education only 37% of women have done so. Moreover, our data confirm results found in
other studies that women have substantially lower access to extension services. Interestingly,
although significantly fewer women inherited the land they use, they hold more land titles
than men. For many women in our sample, access to land has come as a result of land
purchases, where titles are commonly awarded (Bisseleua, Klasen, and Kumase, 2008).
With respect to cocoa marketing, we find that 40% of female farmers in our sample are not
marketing their cocoa themselves, whereas only 4% of the male farmers delegate the
marketing to somebody else. Similarly, the average price received by cocoa producers varies
significantly across gender. On average, male farmers receive 811 CFA7 per kilogram of
cocoa, whereas female farmers receive only 570 CFA. This provides some evidence that
gender-related price discrimination exists in the Cameroonian cocoa market. Finally, control
over income is measured as the share of the cocoa revenue controlled by the individual
farmer. In the questionnaire, farmers were asked what proportion of the revenue they could
dispose of. Results of a t-test on gender differences show that the average share of income
controlled does not differ significantly between male and female farmers in our sample.
7 CFA is the currency of central and west Africa, which has been firmly linked to the French franc since 1948.
16
Table 2.1: Descriptive statistics of individual characteristics by gender
Mean
(sd)
All Female Male t-stat
Share of revenue controlled 0.46 0.47 0.45 -0.76
(0.23) (0.22) (0.23)
Female 0.22
(0.41)
Participation 0.88 0.61 0.96 16.10
(0.32) (0.49) (0.2)
Extension service 0.42 0.28 0.46 5.04
(0.49) (0.45) (0.5)
Age of plant ( months) 41.30 35.88 42.82 1.03
(2.78) (1.44) (3.53)
Age 49.58 50.3 49.39 -0.94
(12.83) (10.97) (13.32)
Household size 7.02 6.32 7.23 2.81
(4.32) (3.21) (4.57)
Secondary and above 0.06 0.02 0.07 2.53
(0.23) (0.14) (0.25)
Primary completed 0.58 0.37 0.64 7.35
(0.49) (0.48) (0.48)
Less than primary 0.36 0.61 0.29 -8.88
(0.48) (0.49) (0.46)
Married 0.78 0.37 0.89 19.18
(0.42) (0.48) (0.31)
Land title 0.16 0.26 0.13 -4.42
(0.37) (0.44) (0.34)
Non-farm activity 0.25 0.21 0.26 1.63
(0.43) (0.41) (0.44)
Cocoa area 4.84 4.52 4.94 1.05
(5.19) (5.04) (5.24)
Age of cocoa plant(months) 41.30 35.88 42.82 1.03
(2.78) (1.44) (3.53)
Price 757.93 570.44 811.06 3.34
(30.02) (30.86) (37.30)
Female to male average price ration in village 0.92
(0.57)
Marketing through CIG 0.27 0.23 0.28 1.43
(0.44) (0.42) (0.45)
Table 2.2 reports the share of revenue controlled by market participation status and gender.
We find that farmers, who market their cocoa, in general have slightly higher control over the
proceeds from cocoa marketing; however, the difference between market participants and
non-participants is not statistically significant. Yet, in the case of female farmers the control
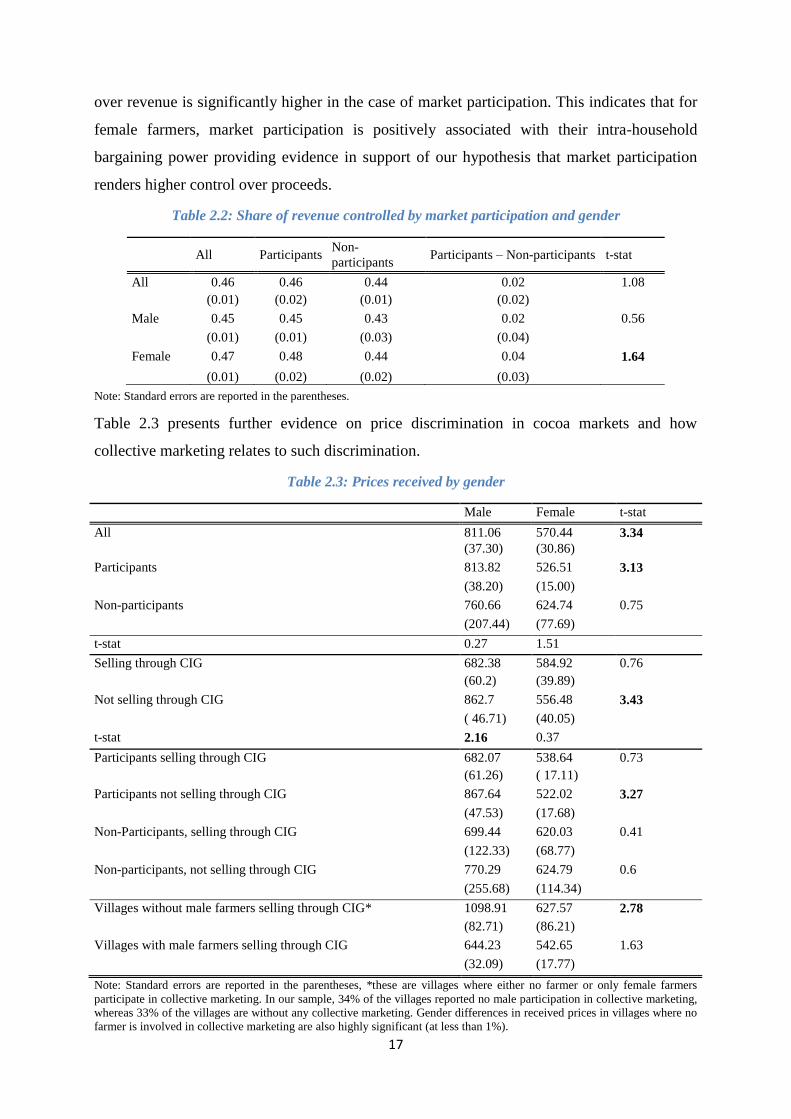
17
over revenue is significantly higher in the case of market participation. This indicates that for
female farmers, market participation is positively associated with their intra-household
bargaining power providing evidence in support of our hypothesis that market participation
renders higher control over proceeds.
Table 2.2: Share of revenue controlled by market participation and gender
All Participants Non-
participants Participants – Non-participants t-stat
All 0.46 0.46 0.44 0.02 1.08
(0.01) (0.02) (0.01) (0.02)
Male 0.45 0.45 0.43 0.02 0.56
(0.01) (0.01) (0.03) (0.04)
Female 0.47 0.48 0.44 0.04 1.64
(0.01) (0.02) (0.02) (0.03)
Note: Standard errors are reported in the parentheses.
Table 2.3 presents further evidence on price discrimination in cocoa markets and how
collective marketing relates to such discrimination.
Table 2.3: Prices received by gender
Male Female t-stat
All 811.06 570.44 3.34
(37.30) (30.86)
Participants 813.82 526.51 3.13
(38.20) (15.00)
Non-participants 760.66 624.74 0.75
(207.44) (77.69)
t-stat 0.27 1.51
Selling through CIG 682.38 584.92 0.76
(60.2) (39.89)
Not selling through CIG 862.7 556.48 3.43
( 46.71) (40.05)
t-stat 2.16 0.37
Participants selling through CIG 682.07 538.64 0.73
(61.26) ( 17.11)
Participants not selling through CIG 867.64 522.02 3.27
(47.53) (17.68)
Non-Participants, selling through CIG 699.44 620.03 0.41
(122.33) (68.77)
Non-participants, not selling through CIG 770.29 624.79 0.6
(255.68) (114.34)
Villages without male farmers selling through CIG* 1098.91 627.57 2.78
(82.71) (86.21)
Villages with male farmers selling through CIG 644.23 542.65 1.63
(32.09) (17.77)
Note: Standard errors are reported in the parentheses, *these are villages where either no farmer or only female farmers
participate in collective marketing. In our sample, 34% of the villages reported no male participation in collective marketing,
whereas 33% of the villages are without any collective marketing. Gender differences in received prices in villages where no
farmer is involved in collective marketing are also highly significant (at less than 1%).
18
The results allow us to make four distinct observations. First, irrespective of the marketing
channel and farmers’ market participation status, female farmers receive significantly lower
prices than male farmers on average. Second, price discrimination occurs when female
farmers are doing their own marketing; if they rely on others to do the marketing; they receive
better prices, but still not the prices that are as high as those of male participants. Compared
to the few male non-participants, however, the price differences are insignificant. Third, such
discrimination is absent in collective sales, even if the female farmer is choosing to participate
in marketing; conversely, gender-specific price discrimination is largest in the case of
individual marketing. Fourth, in regions where males do not participate in collective
marketing, the gender gap in prices is significant whereas in regions where male do take part,
this gap becomes insignificant.
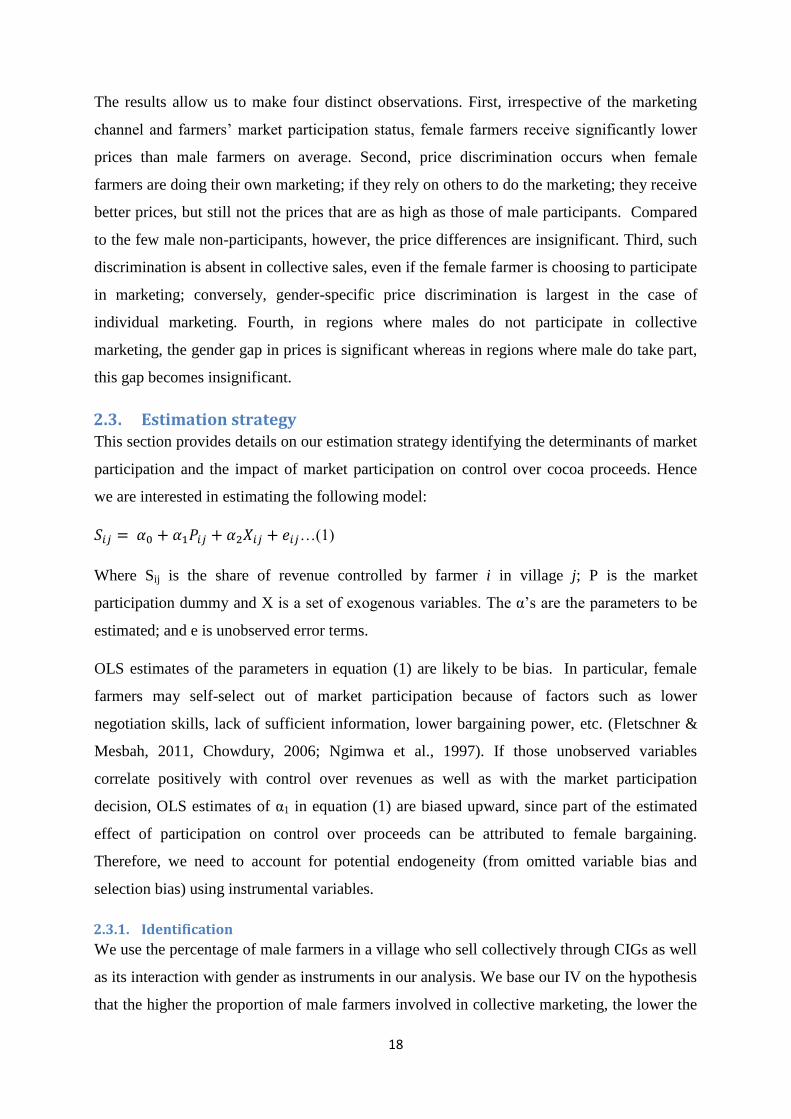
2.3. Estimation strategy This section provides details on our estimation strategy identifying the determinants of market
participation and the impact of market participation on control over cocoa proceeds. Hence
we are interested in estimating the following model:
…(1)
Where Sij is the share of revenue controlled by farmer i in village j; P is the market
participation dummy and X is a set of exogenous variables. The α’s are the parameters to be
estimated; and e is unobserved error terms.
OLS estimates of the parameters in equation (1) are likely to be bias. In particular, female
farmers may self-select out of market participation because of factors such as lower
negotiation skills, lack of sufficient information, lower bargaining power, etc. (Fletschner &
Mesbah, 2011, Chowdury, 2006; Ngimwa et al., 1997). If those unobserved variables
correlate positively with control over revenues as well as with the market participation
decision, OLS estimates of α1 in equation (1) are biased upward, since part of the estimated
effect of participation on control over proceeds can be attributed to female bargaining.
Therefore, we need to account for potential endogeneity (from omitted variable bias and
selection bias) using instrumental variables.
2.3.1. Identification
We use the percentage of male farmers in a village who sell collectively through CIGs as well
as its interaction with gender as instruments in our analysis. We base our IV on the hypothesis
that the higher the proportion of male farmers involved in collective marketing, the lower the
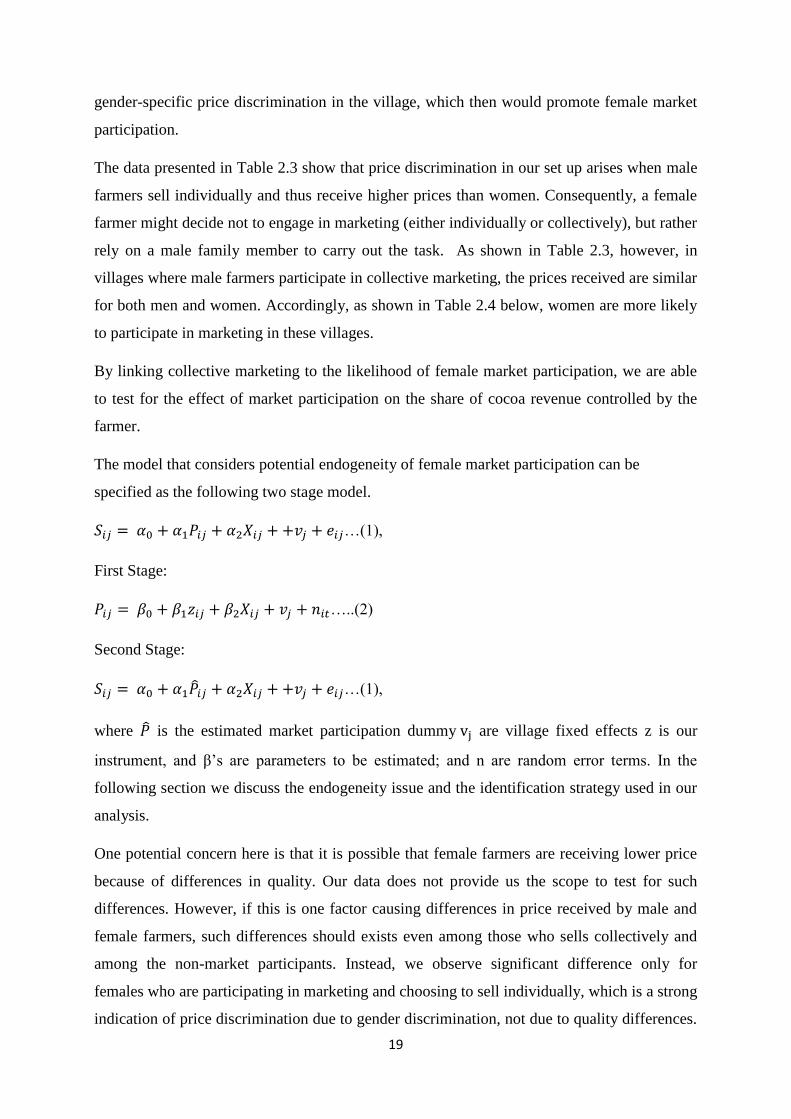
19
gender-specific price discrimination in the village, which then would promote female market
participation.
The data presented in Table 2.3 show that price discrimination in our set up arises when male
farmers sell individually and thus receive higher prices than women. Consequently, a female
farmer might decide not to engage in marketing (either individually or collectively), but rather
rely on a male family member to carry out the task. As shown in Table 2.3, however, in
villages where male farmers participate in collective marketing, the prices received are similar
for both men and women. Accordingly, as shown in Table 2.4 below, women are more likely
to participate in marketing in these villages.
By linking collective marketing to the likelihood of female market participation, we are able
to test for the effect of market participation on the share of cocoa revenue controlled by the
farmer.
The model that considers potential endogeneity of female market participation can be
specified as the following two stage model.
…(1),
First Stage:
…..(2)
Second Stage:
…(1),
where is the estimated market participation dummy are village fixed effects z is our
instrument, and β’s are parameters to be estimated; and n are random error terms. In the
following section we discuss the endogeneity issue and the identification strategy used in our
analysis.
One potential concern here is that it is possible that female farmers are receiving lower price
because of differences in quality. Our data does not provide us the scope to test for such
differences. However, if this is one factor causing differences in price received by male and
female farmers, such differences should exists even among those who sells collectively and
among the non-market participants. Instead, we observe significant difference only for
females who are participating in marketing and choosing to sell individually, which is a strong
indication of price discrimination due to gender discrimination, not due to quality differences.
20
However, to control for cocoa quality we use age of cocoa plant (in moths) to control for
quality of cocoa (Dada, 2007).
Another issue is that it appears that men are losing out by choosing to market their produce
collectively; as shown in Table 2.3, they receive lower prices when selling through CIGs. So
why are they still choosing to participate in collective marketing? Two factors may play a
role. One is that participation in collective marketing generates other benefits of a more active
CIG that makes it attractive for male farmers to participate. This could include more stable
prices, better access to inputs and credit, access to subsidized services, and the like. Second,
there might be self-selection issues with more assertive males choosing to market
individually, while others rely on collective marketing. It is beyond the scope of this paper to
investigate these interesting issues in more detail. Nonetheless, neither of these factors would
adversely affect the relevance of this variable as an instrument for female participation, the
focus of our study.
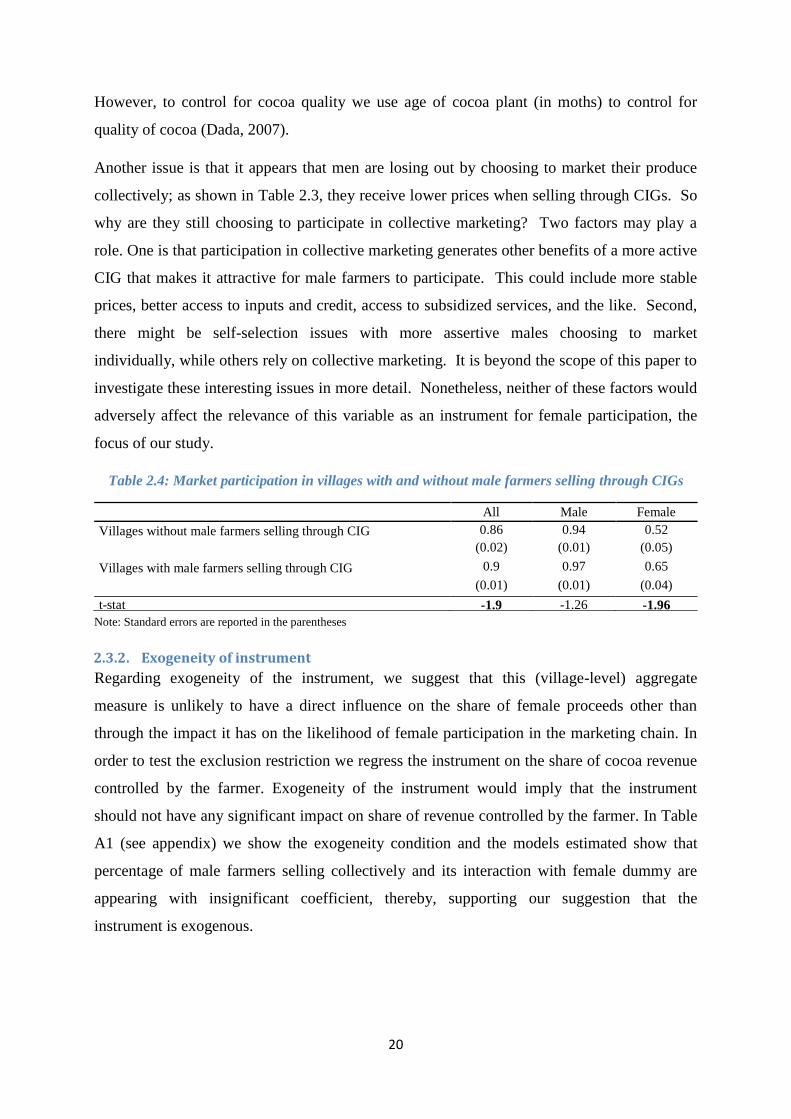
Table 2.4: Market participation in villages with and without male farmers selling through CIGs
All Male Female
Villages without male farmers selling through CIG 0.86 0.94 0.52
(0.02) (0.01) (0.05)
Villages with male farmers selling through CIG 0.9 0.97 0.65
(0.01) (0.01) (0.04)
t-stat -1.9 -1.26 -1.96
Note: Standard errors are reported in the parentheses
2.3.2. Exogeneity of instrument
Regarding exogeneity of the instrument, we suggest that this (village-level) aggregate
measure is unlikely to have a direct influence on the share of female proceeds other than
through the impact it has on the likelihood of female participation in the marketing chain. In
order to test the exclusion restriction we regress the instrument on the share of cocoa revenue
controlled by the farmer. Exogeneity of the instrument would imply that the instrument
should not have any significant impact on share of revenue controlled by the farmer. In Table
A1 (see appendix) we show the exogeneity condition and the models estimated show that
percentage of male farmers selling collectively and its interaction with female dummy are
appearing with insignificant coefficient, thereby, supporting our suggestion that the
instrument is exogenous.
21
2.4. Results
2.4.1. Market participation
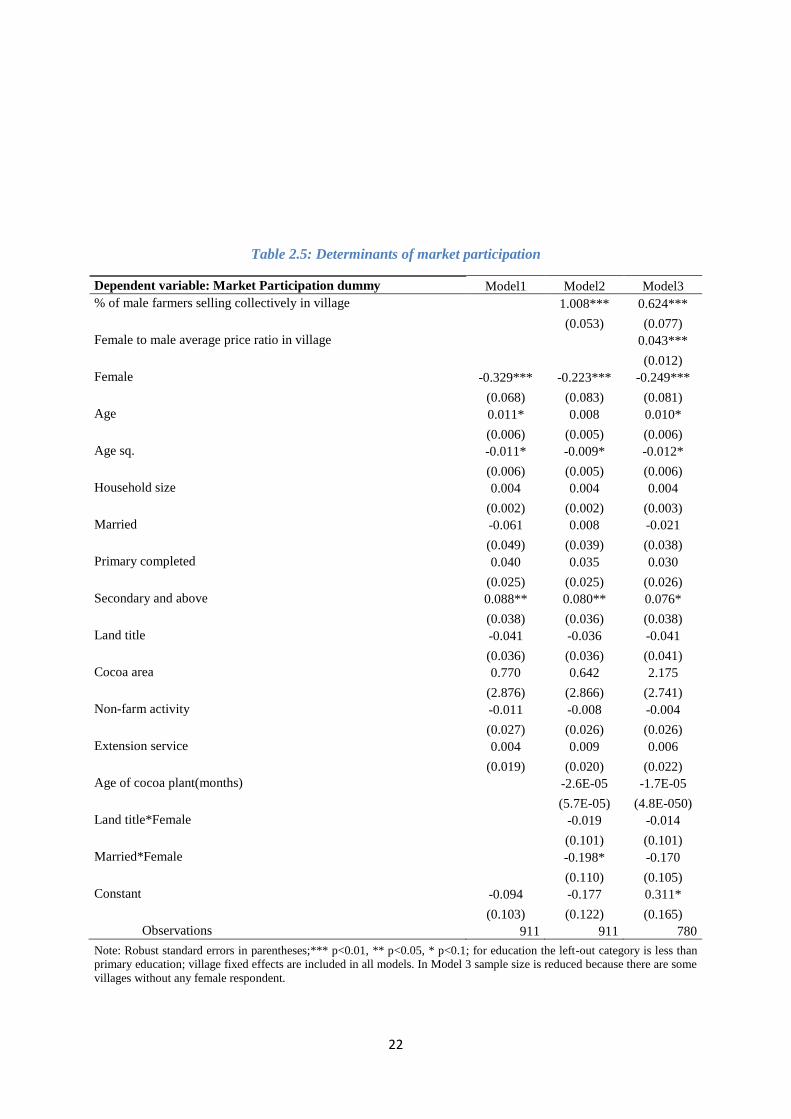
Table 2.5 Regressing market participation on a set of exogenous controls, we find that female
farmers are significantly less likely to participate in cocoa marketing (see Model1). Compared
to male farmers, female farmers have a 32% lower probability to participate in markets.
Furthermore, the coefficients on age and age squared are statistically significant indicating
that participation increases with age, albeit at a decreasing rate. We also find evidence that
higher education is critical for market participation. Compared to farmers with lower
education (less than primary or no education at all is the left-out category), farmers who
completed secondary education have 8% higher probability to participate in the market.
In Model 2, we include our main identification variable percentage of male farmers selling
through CIGs in village along with additional controls: age of cocoa plant in months and
interactions of female dummy with land title and marriage dummy. As per our expectation the
identification variables appears with a significant and positive coefficient. Age variable loses
its significance, but age square still has a negative impact and higher education still exerts
similar impact on participation. Additionally we find that married women are likely to
participate less than the unmarried women.
In Model 3 includes all the controls in Model 2 and additionally it controls for female to male
average price ratio in village. When including these additional variables, results on female
dummy, higher education and age remain robust across all the three model specifications.
However, we find that after including price ratio as additional regressor, our identification
variable, percentage of male farmers selling through CIG, again appears with a significant and
positive coefficient, but compared with Model 2 size of its coefficient decreases significantly
(at less than 5% level). On the other hand, price ratio influences participation significantly and
positively with its impact being 4%. Thus, as the prices received by female farmers increase
relative to that received by men (and thus price discrimination against female farmers
decreases) female market participation is promoted.
22
Table 2.5: Determinants of market participation
Dependent variable: Market Participation dummy Model1 Model2 Model3
% of male farmers selling collectively in village
1.008*** 0.624***
(0.053) (0.077)
Female to male average price ratio in village
0.043***
(0.012)
Female -0.329*** -0.223*** -0.249***
(0.068) (0.083) (0.081)
Age 0.011* 0.008 0.010*
(0.006) (0.005) (0.006)
Age sq. -0.011* -0.009* -0.012*
(0.006) (0.005) (0.006)
Household size 0.004 0.004 0.004
(0.002) (0.002) (0.003)
Married -0.061 0.008 -0.021
(0.049) (0.039) (0.038)
Primary completed 0.040 0.035 0.030
(0.025) (0.025) (0.026)
Secondary and above 0.088** 0.080** 0.076*
(0.038) (0.036) (0.038)
Land title -0.041 -0.036 -0.041
(0.036) (0.036) (0.041)
Cocoa area 0.770 0.642 2.175
(2.876) (2.866) (2.741)
Non-farm activity -0.011 -0.008 -0.004
(0.027) (0.026) (0.026)
Extension service 0.004 0.009 0.006
(0.019) (0.020) (0.022)
Age of cocoa plant(months)
-2.6E-05 -1.7E-05
(5.7E-05) (4.8E-050)
Land title*Female
-0.019 -0.014
(0.101) (0.101)
Married*Female
-0.198* -0.170
(0.110) (0.105)
Constant -0.094 -0.177 0.311*
(0.103) (0.122) (0.165)
Observations 911 911 780
Note: Robust standard errors in parentheses;*** p<0.01, ** p<0.05, * p<0.1; for education the left-out category is less than
primary education; village fixed effects are included in all models. In Model 3 sample size is reduced because there are some
villages without any female respondent.
23
Since, after including price ratio as a regressor, coefficient on the identification variable falls
in magnitude significantly, one could also see this as a transmission channel through which
the identification variable is affecting participation8.
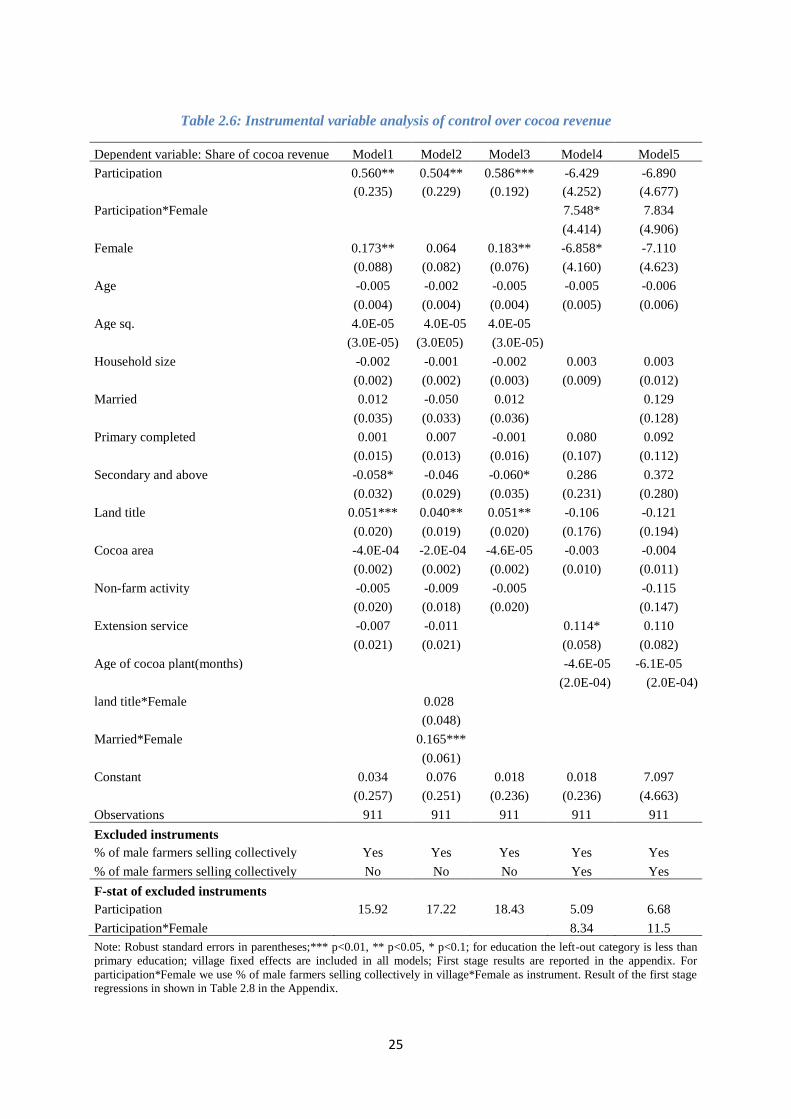
2.4.2. Control over revenue
Table 2.6 provides the estimation results from the instrumental variable analysis of control
over cocoa revenue treating market participation choice as endogenous regressor.
Similar to Table 2.4 and 2.5 the basic model we use for our analysis is Model 1 with
covariates female dummy (which takes the value 1 if the producer is female), age variables,
household size, marriage dummy, primary and higher education dummies, land title dummy,
area of cocoa cultivated, non-farm activity dummy and access to extension service dummy.
To this basic model we added and subtracted other covariates and produce estimation results
for various other model specifications. Model 2 also includes interactions of female dummy
with land title dummy and marriage dummy. Model 3 excludes extension service from Model
1. Model 4 includes interaction between female dummy and participation. In addition it also
includes age of cocoa plant and subtracts age square, marriage dummy and non-farm activity
from Model 1. Finally Model 5 includes all covariates of Model 1 and 4. Hence, the first three
models in Table 2.6 report the estimation results of the impact of market participation on
control over cocoa revenue and last two models additionally estimates differences in impacts
of market participation by gender.
Model 1, 2 and 3 show positive and significant impacts of participation on farmers’ control
over the proceeds and the magnitude of impact varies in a range from 50% to 58%. The
female dummy has a positive and significant coefficient in Model 1 and 3. This suggests that
female producers tend to have a higher control over proceeds, controlling for the all covariates
including participation. However, when the female dummy is interacted with land title and
marriage dummies (see Model 2) the significance of female dummy disappears and
coefficient of female and married dummy appears with significantly positive impact; this
suggests that married female producers can claim a higher share. Quantitatively, it indicates
that marriage provides 16% higher control over revenue to women than to men. The marriage
dummy has no significant coefficient indicating that marital status does not have a significant
impact on control over revenues by men. Furthermore, estimating the impact of marriage for
8 To test for the impact of male participation in collective marketing on village price discrimination we ran a
separate regression with price ratio as a dependent variable and our instrument, percentage of male selling
through collective marketing, as an independent variable along with other controls in Model2. The instrument is
found to improve discrimination significantly (at less than 1% level) by 40%.
24
all farmers (joint effect of marriage and the interaction between female and marriage
dummies) we find that marriage increases the share of revenues controlled by 11 %
(significant at 5%). Additionally, we find that in all three models holding a land title increases
control over revenue by 4% to 5%, indicating that land rights provide higher control over
revenue and thus also provides higher bargaining power.
In Model 4 and 5 we include an interaction term between market participation and gender and
age of the cocoa plant. In Model 4 we find that by female farmers who participate in the
market control significantly higher proportion of the cocoa revenue. In Model 5, the
interaction term has the nearly the identical quantitative magnitude but just misses
significance, presumably doe to correlations with the additionally included covariates. In both
models, the coefficient of participation is positive but insignificant indicating that
participation does not have significant impact on male control over cocoa proceeds.
Considering the joint impact of participation and its interaction with female dummy we find
positive and significant (at 1% and 5% level, respectively) impact of participation on control
over revenue in both models. Additionally in Model 4 extension service exerts a positive and
significant impact by increasing farmers’ control over revenue by 11%.
Looking at the instruments we find that percentage of male farmers selling collectively in
village has strong positive impact on participation (see Table A2 in the appendix in which we
reported the first stage regression results of models estimated in Table 2.6) . In Model 4 and 5,
we additionally included interaction of the instrument and female dummy to control for the
endogeneity of interaction of participation and female dummy. In models where participation
is included as endogenous regressor percentage of male farmers selling through CIGs is
included as IV and models that additionally interacts female dummy with participation
utilizes IV interacted with female dummy as the IV. Therefore, all our models are exactly
identified. The first stage results shows that the interaction of our main instrument and female
dummy has a significant but negative impact on participation in both specifications, implying
that in general the instrument has a positive impact on participation, however its impact on
female farmers participation is less than that on male farmers. However, it does not affect
interactions of participation and female dummy significantly indicating that it is not a strong
instrument for this interaction, so that identification relies largely on the other instrument.
25
Table 2.6: Instrumental variable analysis of control over cocoa revenue
Dependent variable: Share of cocoa revenue
controlled by farmer
Model1 Model2 Model3 Model4 Model5
Participation 0.560** 0.504** 0.586*** -6.429 -6.890
(0.235) (0.229) (0.192) (4.252) (4.677)
Participation*Female
7.548* 7.834
(4.414) (4.906)
Female 0.173** 0.064 0.183** -6.858* -7.110
(0.088) (0.082) (0.076) (4.160) (4.623)
Age -0.005 -0.002 -0.005 -0.005 -0.006
(0.004) (0.004) (0.004) (0.005) (0.006)
Age sq. 4.0E-05 4.0E-05 4.0E-05
(3.0E-05) (3.0E05) (3.0E-05)
Household size -0.002 -0.001 -0.002 0.003 0.003
(0.002) (0.002) (0.003) (0.009) (0.012)
Married 0.012 -0.050 0.012
0.129
(0.035) (0.033) (0.036)
(0.128)
Primary completed 0.001 0.007 -0.001 0.080 0.092
(0.015) (0.013) (0.016) (0.107) (0.112)
Secondary and above -0.058* -0.046 -0.060* 0.286 0.372
(0.032) (0.029) (0.035) (0.231) (0.280)
Land title 0.051*** 0.040** 0.051** -0.106 -0.121
(0.020) (0.019) (0.020) (0.176) (0.194)
Cocoa area -4.0E-04 -2.0E-04 -4.6E-05 -0.003 -0.004
(0.002) (0.002) (0.002) (0.010) (0.011)
Non-farm activity -0.005 -0.009 -0.005
-0.115
(0.020) (0.018) (0.020)
(0.147)
Extension service -0.007 -0.011
0.114* 0.110
(0.021) (0.021)
(0.058) (0.082)
Age of cocoa plant(months)
-4.6E-05 -6.1E-05
(2.0E-04) (2.0E-04)
land title*Female
0.028
(0.048)
Married*Female
0.165***
(0.061)
Constant 0.034 0.076 0.018 0.018 7.097
(0.257) (0.251) (0.236) (0.236) (4.663)
Observations 911 911 911 911 911
Excluded instruments
% of male farmers selling collectively
in village
Yes Yes Yes Yes Yes
% of male farmers selling collectively
in village*Female
No No No Yes Yes
F-stat of excluded instruments
Participation 15.92 17.22 18.43 5.09 6.68
Participation*Female 8.34 11.5
Note: Robust standard errors in parentheses;*** p<0.01, ** p<0.05, * p<0.1; for education the left-out category is less than
primary education; village fixed effects are included in all models; First stage results are reported in the appendix. For
participation*Female we use % of male farmers selling collectively in village*Female as instrument. Result of the first stage
regressions in shown in Table 2.8 in the Appendix.
26
Additionally, in Table A2 we report the test results of endogeneity of participation choices
using Durbin-Wu-Hausman chi-sq test. Under the null hypothesis that participation is
exogenous, these statistics are all significant indicating endogeneity of participation.
2.5. Conclusion This paper examines participation of female farmers in agricultural marketing and its impact
on control over revenues. Using data micro level data from Cameroon’s cocoa producers in
our study we measure commercialization of farmers by their integration with cocoa markets
and argue that by participating in cocoa marketing farmers; especially the female farmers who
generally participate less in marketing; could increase their intrahousehold welfare. Our data
shows that a female farmers, individually, are managing their cocoa production which is a
major cash crop of the country (Duguma and Gockowski, 2001), but very few of them take up
the marketing activities. In other words, while male farmers are producing as well as
marketing their own produce, female farmers participate only in production and not in
marketing. Consequently, family members who help her in marketing could then claim a
share in the revenue, reducing her own control over the sharing decision. Therefore, we argue
that market participation provides higher bargaining power in deciding the sharing decision
and provides higher control over the proceeds.
In our analysis we identify price discrimination against female farmers as a factor explaining
significant gap in male and female market participation in cocoa markets in Cameroon. We
make the argument that lower male participation in collective marketing leads to significant
price discrimination against female farmers which then discourage female market
participation. Essentially, such discrimination occurs because men with better marketing
abilities despite their membership with CIGs decide to sell individually which then creates
significant price gap between farmers selling individually and collectively. We do not find
similar evidence for female farmers: female farmers do not gain significantly by selling
individually. There could be various reasons for such different price attainments, such as,
asymmetric information on market price, lower negotiation skill of female farmers, lower
network opportunities etc. However these factors are all beyond the scope of our study. We
precisely make the argument that our data shows evidence on gender discrimination in price
received by cocoa farmers lowering their market participation.
We further argue that price discrimination is likely to be lower in regions where male
participation in collective marketing is higher than those regions with lower male
participation. As a result lower price discrimination will motivate more women to take up
27
their own marketing. Therefore, in the estimation of impact of market participation on share
of cocoa revenue controlled by farmer herself we use proportion of male farmers selling
collectively in village for instrumenting market participation. This instrument satisfies the
exogeneity condition of instrument as in a household model, extra-household factors, such as,
male participation in collective marketing in any region, is likely to vary exogenously. Our
estimation results confirm that the instrument has a significantly positive impact on market
participation and market participation influences control over revenue positively. Therefore,
our study establishes three major conclusions: price discrimination has been inhibiting female
market participation; second, higher male participation in collective marketing reduces price
discrimination and positively impacts on female market participation and finally, by
participating in marketing female farmers could achieve higher control over cocoa revenue.
28
3. Running for leadership: evidence from an artefactual field
experiment in matrilineal and patriarchic societies in India9
Abstract
This paper investigates the process of gender self-segregation into leadership roles that
imply control over others. We consider how conformity to social norms and aversion to
feedback affect self-selection. Using a public good game with third party punishment
we explore gender differences in willingness to assume the role of third party across
matrilineal and patriarchal societies. Our findings indicate that segregation into
leadership roles is due to conformity to pre-assigned gender roles across cultures. We
find that women in the matrilineal society are more willing to assume power roles than
in the patriarchal society. Moreover, we find that anonymity over the role of third party
results in increase participation of the segregated gender. Affirmative action seems to
be an is effective tool to promoting female leaders in societies where women hold a
lower status; yet in societies where women are powerful the effect can be
counterproductive.
Keywords: Gender and leadership, patriarchal and matrilineal societies, affirmative action,
aversion to feedback, aversion to public roles, public good experiment with punishment JEL Code: C90, C92, C93, C92, D03, D70, D81, J16
9 This paper is a joint work with Marcela Ibanez, Gerhard Reiner and Meike Wollni. Ibanez: CRC Poverty Equity and
Growth, University of Göttingen, Germany; Riener: Düsseldorf Institute for Competition Economics, University of Düssel-
dorf, Germany; Wollni: Department of Agricultural Economics and Rural Development, University of Göttingen, Germany
29
3.1. Introduction The enforcement of social norms is an important factor in the success of mankind (Fehr and
Gächter, 2002; Fehr and Fischbacher, 2004). Social sanctions are used in many societies
around the globe to overcome the problem of free-riding (Henrich et al., 2006). However, it
remains unclear who is willing take up the role of norm enforcer and why. In many societies
these roles are taken mainly by men, while women remain underrepresented in positions that
imply control over others (Chattopadhyay and Duflo, 2004; Pande, 2003; Svaleryd, 2002;
Thomas and Welch, 1991). In the United States, women comprise 29 percent of all lawyers,
but represent only 16 percent of district judges, 17 percent of circuit court judges and 11
percent of Supreme Court posts (ABA, 2003; Federal Judicial Center, 2003). In other regions
of the world female under representation is even larger. In Japan the share of female judges is
below 10% (Ministry of Justice, 2001). This is important from an efficiency perspective as
greater gender diversity in leadership roles has shown to be beneficial in a variety of ways. It
can increase confidence in the legal system (Brown, 1998); it can improve decisions making
for deprived populations (Hurwitz and Lanier, 2008) and it can be vital to provide equal
justice for all (Torres-Spelliscy et al., 2008).
The aim of this study is to investigate mechanisms underlying female under representation in
the role of norm enforcers. In our analysis, we depart from traditional explanations based on
discrimination on the installment process of judges. Instead, we consider that social orders
emerge endogenously and investigate gender differences in willingness to volunteer to take
the role of norm enforcer. Since the enforcement of social norms is one of the most important
roles of a leader our finding can be generalized to the literature on leadership. In our set-up,
norm enforcers act as leaders that have authority over others and can impose sanctions to
discipline members of the society. Yet, norm enforcers have no strategic interest in enforcing
social norms and sanctioning behavior is associated with normative principles.
Using the framework of a one-shot public good game with endogenous third party
punishment, we compare the proportion of male and female participants who are willing to
assume the role of third-party under different environments that vary: (i) the degree of
counter-punishment or retaliation available, (ii) the degree of anonymity of the third-party and
the (iii) societal background. We select these institutions as the psychology literature reports
that women tend to incorporate negative feedback more than men (Roberts and Nolen-
Hoeksema, 1989). Women also tend to fall more often into confidence traps (Dweck, 2000),
viewing negative feedback as indicative of their overall capability rather than simply their
30
one-time performance on a task.10
If this is the case, environments that decrease feedback or
counter punishment would foster female applications to leadership roles. Our second
treatment investigates whether norms that prescribe that certain positions are to be assumed
by a specific gender lead to the persistence of gender inequalities. So we consider whether
reputation concerns versus altruistic concerns affect self-selection into leadership roles. Our
last treatment considers the effect of the cultural background versus the effect of innate
gender differences on the disposition to assume roles of control. We consider whether gender
differences in role selection are due to nature or nurture. We therefore implemented the
experiments in two different societies in India and compare the patriarchal Santal tribe, where
women assume a more submissive role with the matrilineal Khasi tribe where women are in
charge of decision making in and out-side the household.
From a policy perspective it is important to understand how to promote gender diversity in
leadership positions. Therefore, in the experiment we additionally test two alternative policies
that may influence the willingness to run for leadership. We test the effect of policies that
provide economic incentives and give higher remuneration to leadership roles and policies
that use affirmative action by giving preferential treatment to women willing to assume the
leadership role.
We contribute to existing research in several ways. First we consider how leaders can affect
the performance of the organization. In the economic literature, it is considered that leaders
can help to overcome problems of asymmetric information by signaling the advantages of
cooperation (Hermalin, 1998) either by leading by example (Clark and Sefton, 2001;
Meidinger et al., 2003; Moxnes and Van der Heijden, 2003; Potters et al., 2005; 2007) or
leading by sacrifice (De Cremer and van Knippenberg, 2005; Glöckner et al., 2011). Leaders
can also help to overcome coordination problems by taking initiative and setting an example
(Brandts and Cooper, 2006; 2007). Alternatively, leaders can affect the outcome of the
organization and determine the returns that teams obtain by deciding how much risk they take
on behalf of team members (Ertac and Gurdal, 2012) or how much effort they exert to
increase the team outcome (Ibanez and Schaffland, 2013). Most of all, in hierarchical
organizations leaders can use sanctions and rewards to induce higher cooperation. In our
analysis, we focus on leaders that have hierarchical power over others or what in the
leadership literature is referred to as “transactional leader” (Bass, 1985). To the best of our
10 Similar experimental evidence is provided by Mobius et al. (2011).
31
knowledge, this is the first paper that analyzes the endogenous emergence of leaders in
hierarchical organizations and identifies how the leadership environment affects self-selection
into leadership roles. In this way we identify the mechanisms that explain female self-
segregation from the role of norm enforcement.
Empirical evidence supports the view that in hierarchical organizations transactional leaders
can use sanctions and rewards to induce higher cooperation. For instance, in the framework
of a leading by example experiment, Güth et al. (2007) shows that cooperation is higher when
leaders have the power to exclude players from the game. Yet, the effectiveness of exclusion
power seems to be restricted to game with homogeneous endowments (Levati et al., 2007). In
the framework of a public good game, Van der Heijden, et al. (2009) show that leaders
discretionary power to redistribute contributions to the public good game can help to induce
higher cooperation levels. They find that transactional leaders forgo the opportunistic
behavior and do not appropriate the group contributions. Instead leaders use their
discretionary power to reward contributors and exclude free-riders fostering higher
cooperation. Gürerk et al. (2009) show that the decision of the leader with respect to the use
of negative sanctions increases contributions more than positive rewards. Unlike these papers,
that consider second party punishment, in our paper we consider the role of third-party
punishment.
Third party punishment is used to characterize situations in which enforcement of the social
norm comes at a cost and has no direct personal benefits for the third party. Therefore,
sanctions by a third-party can be associated with social reciprocity or preferences for
maintaining normative standards (Carpenter and Matthews et al., 2004; Fehr and Gächter,
2002). Recent experimental evidence documents that a large proportion of people are willing
to incur costs to enforce norms even when they are not directly affected by the actions.
Carpenter and Matthews investigate participant’s willingness to incur into costly punishment
towards members of their group and towards members of an external group in a public good
game. They find substantial degree of punishment towards external group members and a
positive effect on this form of punishment on cooperation. Fehr and Fischbacher (2004) report
similar results in a dictator game and a prisoner dilemma where the third-party is external to
the group and hence have no incentives to build a reputation. We extend this research
considering a public good game with endogenous third party punishment.
Relatively, few papers consider the emergence of voluntary leaders. Arbak and Villeval
(2013), Haigner and Wakolbinger (2010) and Rivas and Sutter (2011) use the set-up of a
32
public good game in which the participants can endogenously determine whether they want to
make the contribution before others (lead by example) or wait to contribute after observing
first-stage contribution. They find that cooperation increase in treatments with endogenous
leaders compared with exogenous leaders. Arbak and Villeval (2013) further explore who is
willing to assume the leadership role. They find that female participants are less willing to
lead than males but that this difference disappears once that uncertainty about contributions of
other group members is removed. Moreover, they find that personality traits, such as
generosity and openness, are found to be positively correlated with willingness to lead.
Pregner et al. (2012) build upon this literature and find that individuals who can be classified
as conditional cooperators are more likely to volunteer to lead than free-riders. Yet, they do
not find significant gender differences and female and male participants are equally likely to
volunteer to lead. In the context of team game in which leaders have to take risk on behalf of
others in the group, Ertac and Gurtel (2012) find that a lower fraction of female participants
willing to take risky decisions for the group compared to male participants. Bruttel and
Fischbacher (2013) look at leader as innovator the one who takes initiative to push peers pay-
off up. They find that the willingness to lead is positive correlated with cognitive skills,
preferences for efficiency, generosity and patience. They also find that males are more willing
to take initiative (lead) in this setting. In a field context Balafoutas and Nikiforakis (2012),
find that men are more willing to use sanctions to enforce commonly accepted social norms of
courtesy by second party punishment. We contribute to this literature understanding the
mechanisms that lead to self-segregation of transactional leaders.
There is a relatively well established literature focusing on gender differences in individual
and social preferences (Niederle and Vesterlund, 2007; Gneezy, Niederle and Rustichini,
2003; Eckel and Grossman, 2002; Croson and Gneezy, 2009; Kray, Thompson and Galinsky,
2001; Barber and Odean, 2001; Eagly and Karau, 2002, Asiedu and Ibanez, 2013; Ibanez, et
al., 2009). We contribute to this research considering how the society shapes these
differences. Gneezy, Leonard and List (2009) use a controlled experiment to explore whether
there are gender differences in selecting into competitive environments across two distinct
societies: the Maasai in Tanzania and the Khasi in India. Andersen et al. (2010) investigate
provision of public good across matrilineal Khasi and patrilineal Kharbi tribes.
We find that gender differences in willingness to take leadership roles are context dependent
and to a large extent depend on conformity to the social norms. In matrilineal societies, men
are less willing to take leadership roles than women, while in patriarchal societies is the
33
opposite. However, this preference seems to be driven by conformity to social norms. Once
the leadership role is anonymous, gender differences in willingness to take leadership roles
disappear. We also find evidence that supports gender differences in aversion to retaliation as
a driving mechanism of segregation in leadership roles. Interestingly, we find heterogeneous
effects of affirmative action across societies. While this policy is effective in promoting
female leaders in patriarchal society, it discourages female leadership in matrilineal societies.
Finally, we find that pecuniary incentives promote females and males to opt in to the power
position, however, our evidence also suggest that higher remuneration crowds out voluntary
motivation to take the power role and is less effective than affirmative action incentives.
In the next section we presents the local background, Section 3.3 gives details of the
experimental design. Section 3.4 presents the results. Section 3.5 concludes.
3.2. Societal background
We conducted the experiment with representatives of local tribes in two different states of
India: the Santal tribe in West Bengal and the Khasi tribe in Meghalaya. Figure 3.1 presents
the location of the tribes where we conducted the experiment. The gray area refers to the
Khasi tribe while the black area presents the location of the Santal tribe.
The Khasi is located in the state of Meghalaya, a northeastern state of India. The tribal rules
are considered to be matrilineal (Leonetti et al., 2004; Van Ham, 2000). Khasi women have
the right to choose their own partner, cohabit and do not require male permission about the
marriage. The institution of dowry does not exist; and it is common practice that the man
moves to his wife’s house after marriage. This stands in sharp contrast to the Indian system of
marriage, in which wives always move to their husbands’ house after marriage and there is an
economically substantial dowry system (Bloch and Rao, 2002; Anderson, 2003). Khasi
families are always organized around the female members (mostly around the grandmother
who acts as the head of household); and a child always takes the mother’s last name. Instead
of the oldest son, the youngest daughter inherits all property establishing women power in the
society. It is also an effective way to ensure that the youngest daughter is always around as a
support to her parents in their old age. Interestingly, property rights for the youngest daughter
and consequential old age support make son preference absent in the society. Incidence of
female feticide and domestic violence against women is rare and intra-household access to
health, education, and nutrition is equal among male and female family members (for more
details see Andersen et al., 2008, 2010 and Gneezy, Leonard and List, 2009). With the Khasi,
farming is the major economic activity and production is generally controlled by female
34
members of the family. In addition to farming, women undertake all other economic activities
and are often involved in trading with men from other societies.
The Santal is the largest tribal group of eastern India and is distributed over the states of
Bihar, Orissa, and Tripura as well as in West Bengal, where our study was conducted. The
Santal society is patriarchal and giving women little decision rights and put them in lower
status than men. Santal customary law does not guarantee women inheritance rights in their
parental property. They however have contingent rights to inheritance depending upon the
circumstances. For instance, a common practice is to endow a married woman with some land
in her natal village as a mean to provide financial support in case of unsuccessful marriage.
However, according to the Santal Pargana Tenancy Act (SPTA), 1949, in absence of
appropriate male heirs, the daughter inherits her father’s land (Rao, 2010). Caring for parents
in their old age is the responsibility of sons not of daughters. Once married, daughters are
expected to spend their life under the supervision of their husbands or other elder men in the
husband’s family. A post experimental survey in our study revealed that female mobility even
within the community is restricted and visiting parents, relatives; friend by women always
requires taking permission from the adult male in the family. Low female mobility has also
resulted in lower labor force participation by women. Similarly, expenditure decisions are
mostly taken by men in the family, which is even triggered by the fact that in most household
men are the major income earning members. Women’s work and work experience differs
significantly from those of men, and in some areas women are completely excluded from
industrial work (Roy and Murry, 2013). The distribution of family resources among male and
female members is unequal and even though women contribute significant amounts of labor
to family farms, income earned mostly remains under the control of men. The Santal social
norms are not an exception to the Hindu norms of favoring boys over girls, and son
preference is prominent.
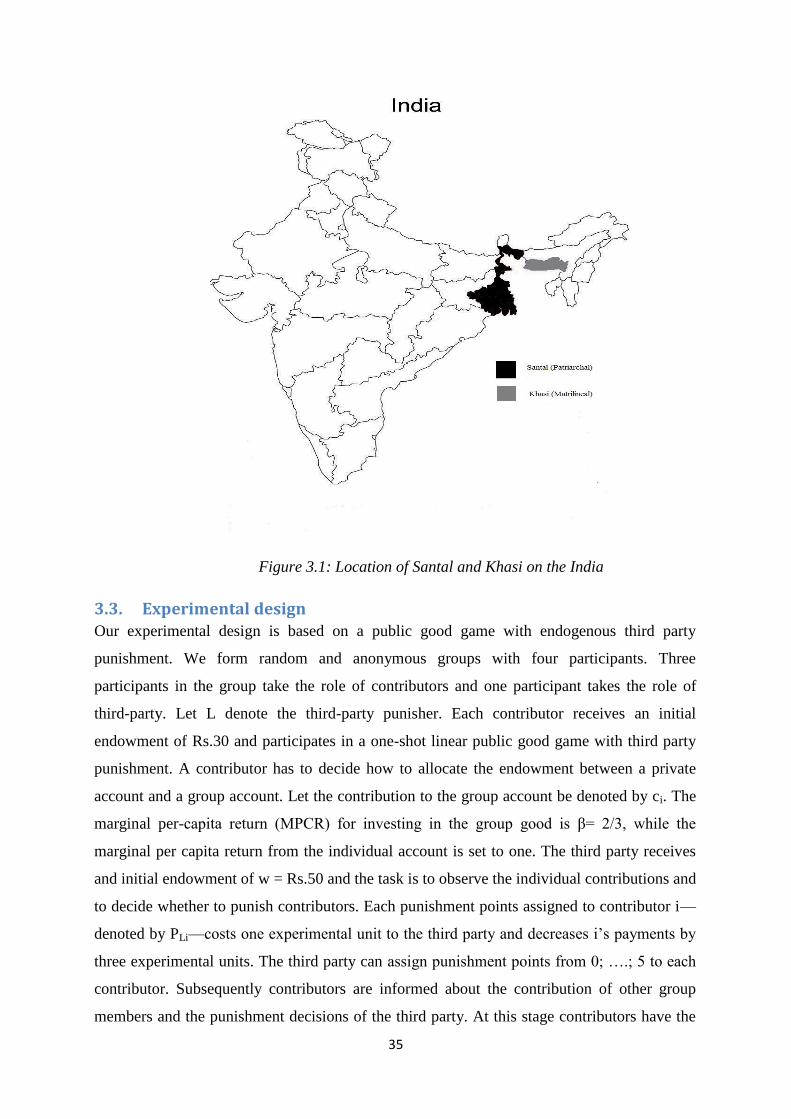
35
Figure 3.1: Location of Santal and Khasi on the India
3.3. Experimental design
Our experimental design is based on a public good game with endogenous third party
punishment. We form random and anonymous groups with four participants. Three
participants in the group take the role of contributors and one participant takes the role of
third-party. Let L denote the third-party punisher. Each contributor receives an initial
endowment of Rs.30 and participates in a one-shot linear public good game with third party
punishment. A contributor has to decide how to allocate the endowment between a private
account and a group account. Let the contribution to the group account be denoted by ci. The
marginal per-capita return (MPCR) for investing in the group good is β= 2/3, while the
marginal per capita return from the individual account is set to one. The third party receives
and initial endowment of w = Rs.50 and the task is to observe the individual contributions and
to decide whether to punish contributors. Each punishment points assigned to contributor i—
denoted by PLi—costs one experimental unit to the third party and decreases i’s payments by
three experimental units. The third party can assign punishment points from 0; ….; 5 to each
contributor. Subsequently contributors are informed about the contribution of other group
members and the punishment decisions of the third party. At this stage contributors have the
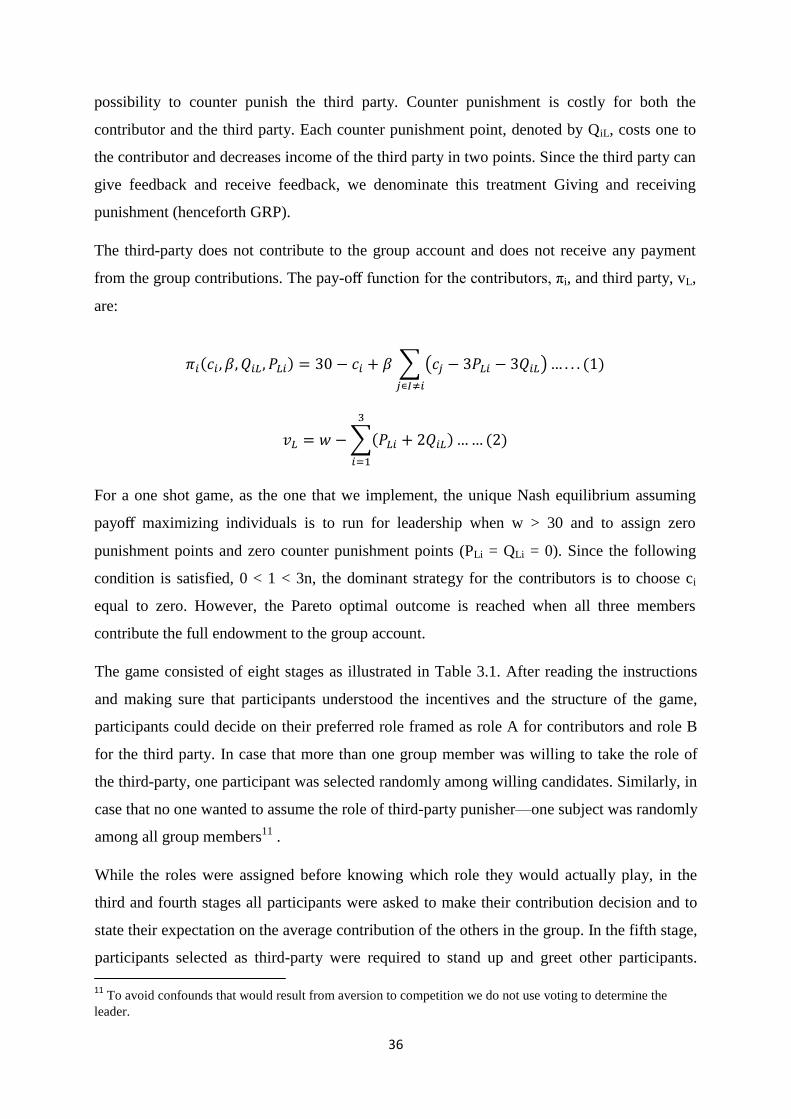
36
possibility to counter punish the third party. Counter punishment is costly for both the
contributor and the third party. Each counter punishment point, denoted by QiL, costs one to
the contributor and decreases income of the third party in two points. Since the third party can
give feedback and receive feedback, we denominate this treatment Giving and receiving
punishment (henceforth GRP).
The third-party does not contribute to the group account and does not receive any payment
from the group contributions. The pay-off function for the contributors, πi, and third party, vL,
are:
( ) ∑ ( )
( )
∑( )
( )
For a one shot game, as the one that we implement, the unique Nash equilibrium assuming
payoff maximizing individuals is to run for leadership when w > 30 and to assign zero
punishment points and zero counter punishment points (PLi = QLi = 0). Since the following
condition is satisfied, 0 < 1 < 3n, the dominant strategy for the contributors is to choose ci
equal to zero. However, the Pareto optimal outcome is reached when all three members
contribute the full endowment to the group account.
The game consisted of eight stages as illustrated in Table 3.1. After reading the instructions
and making sure that participants understood the incentives and the structure of the game,
participants could decide on their preferred role framed as role A for contributors and role B
for the third party. In case that more than one group member was willing to take the role of
the third-party, one participant was selected randomly among willing candidates. Similarly, in
case that no one wanted to assume the role of third-party punisher—one subject was randomly
among all group members11
.
While the roles were assigned before knowing which role they would actually play, in the
third and fourth stages all participants were asked to make their contribution decision and to
state their expectation on the average contribution of the others in the group. In the fifth stage,
participants selected as third-party were required to stand up and greet other participants.
11 To avoid confounds that would result from aversion to competition we do not use voting to determine the
leader.
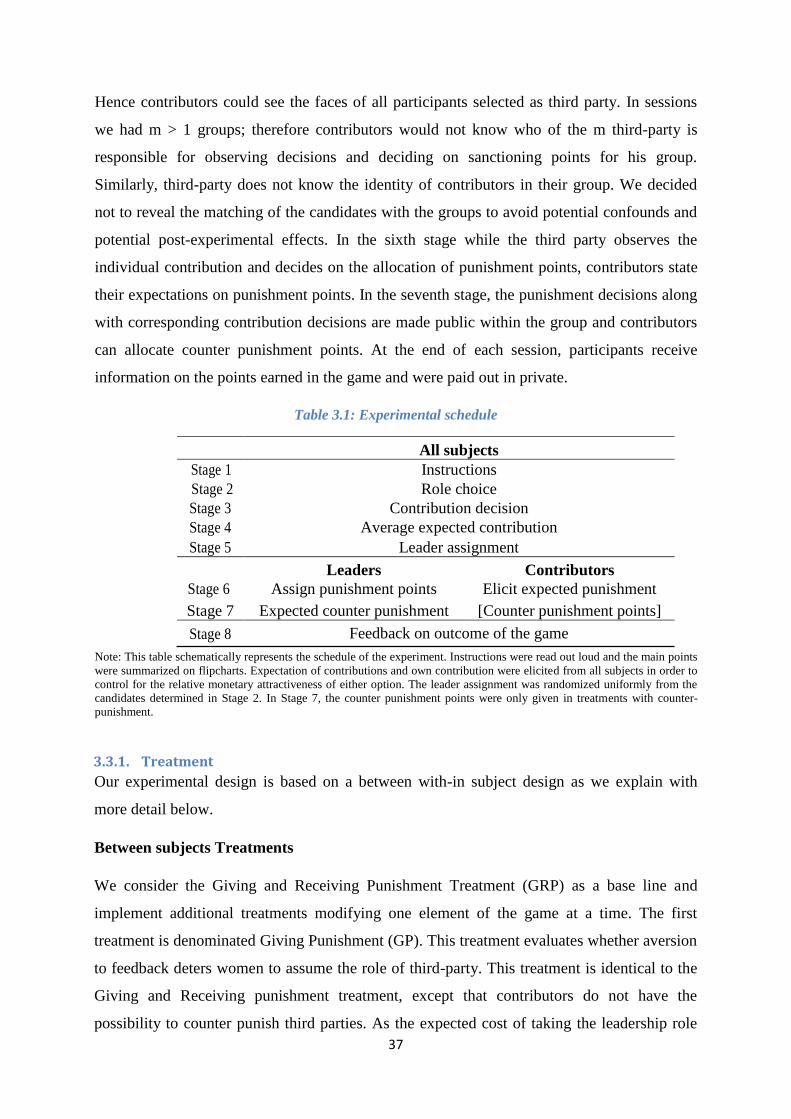
37
Hence contributors could see the faces of all participants selected as third party. In sessions
we had m > 1 groups; therefore contributors would not know who of the m third-party is
responsible for observing decisions and deciding on sanctioning points for his group.
Similarly, third-party does not know the identity of contributors in their group. We decided
not to reveal the matching of the candidates with the groups to avoid potential confounds and
potential post-experimental effects. In the sixth stage while the third party observes the
individual contribution and decides on the allocation of punishment points, contributors state
their expectations on punishment points. In the seventh stage, the punishment decisions along
with corresponding contribution decisions are made public within the group and contributors
can allocate counter punishment points. At the end of each session, participants receive
information on the points earned in the game and were paid out in private.
Table 3.1: Experimental schedule
All subjects
Stage 1 Instructions
Stage 2 Role choice
Stage 3 Contribution decision
Stage 4 Average expected contribution
Stage 5 Leader assignment
Leaders Contributors
Stage 6 Assign punishment points Elicit expected punishment
Stage 7 Expected counter punishment [Counter punishment points]
Stage 8 Feedback on outcome of the game Note: This table schematically represents the schedule of the experiment. Instructions were read out loud and the main points
were summarized on flipcharts. Expectation of contributions and own contribution were elicited from all subjects in order to
control for the relative monetary attractiveness of either option. The leader assignment was randomized uniformly from the
candidates determined in Stage 2. In Stage 7, the counter punishment points were only given in treatments with counter-
punishment.
3.3.1. Treatment
Our experimental design is based on a between with-in subject design as we explain with
more detail below.
Between subjects Treatments
We consider the Giving and Receiving Punishment Treatment (GRP) as a base line and
implement additional treatments modifying one element of the game at a time. The first
treatment is denominated Giving Punishment (GP). This treatment evaluates whether aversion
to feedback deters women to assume the role of third-party. This treatment is identical to the
Giving and Receiving punishment treatment, except that contributors do not have the
possibility to counter punish third parties. As the expected cost of taking the leadership role
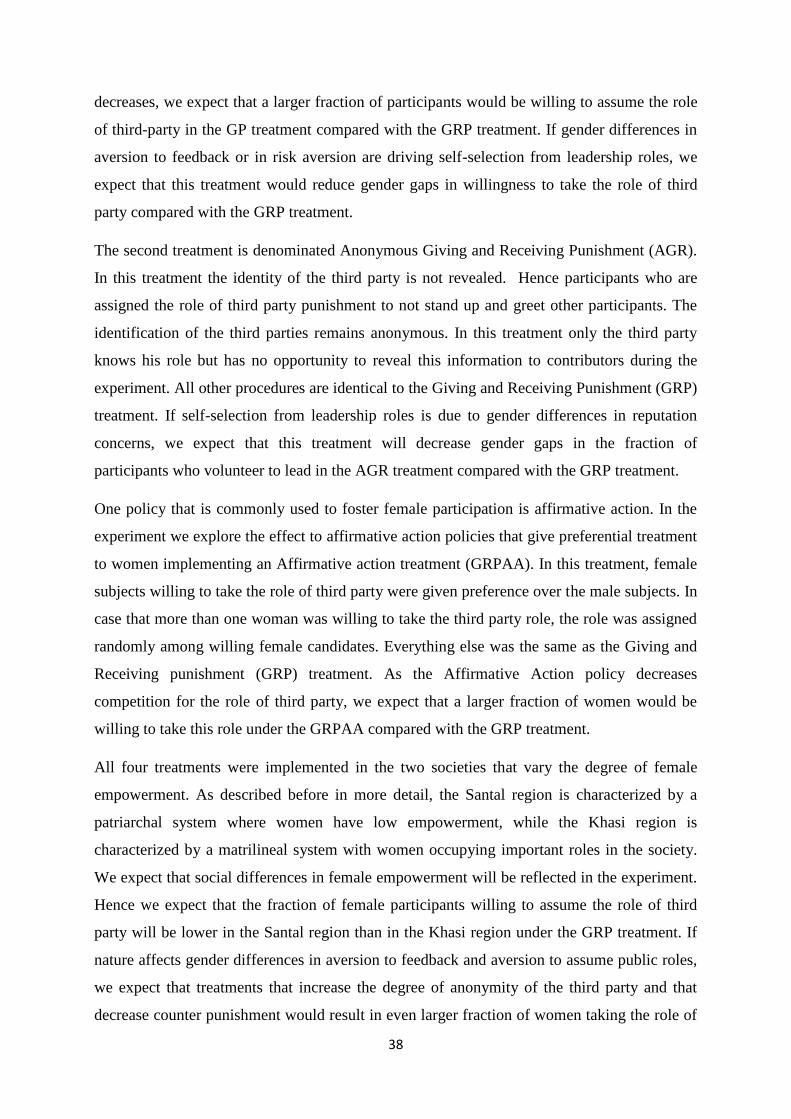
38
decreases, we expect that a larger fraction of participants would be willing to assume the role
of third-party in the GP treatment compared with the GRP treatment. If gender differences in
aversion to feedback or in risk aversion are driving self-selection from leadership roles, we
expect that this treatment would reduce gender gaps in willingness to take the role of third
party compared with the GRP treatment.
The second treatment is denominated Anonymous Giving and Receiving Punishment (AGR).
In this treatment the identity of the third party is not revealed. Hence participants who are
assigned the role of third party punishment to not stand up and greet other participants. The
identification of the third parties remains anonymous. In this treatment only the third party
knows his role but has no opportunity to reveal this information to contributors during the
experiment. All other procedures are identical to the Giving and Receiving Punishment (GRP)
treatment. If self-selection from leadership roles is due to gender differences in reputation
concerns, we expect that this treatment will decrease gender gaps in the fraction of
participants who volunteer to lead in the AGR treatment compared with the GRP treatment.
One policy that is commonly used to foster female participation is affirmative action. In the
experiment we explore the effect to affirmative action policies that give preferential treatment
to women implementing an Affirmative action treatment (GRPAA). In this treatment, female
subjects willing to take the role of third party were given preference over the male subjects. In
case that more than one woman was willing to take the third party role, the role was assigned
randomly among willing female candidates. Everything else was the same as the Giving and
Receiving punishment (GRP) treatment. As the Affirmative Action policy decreases
competition for the role of third party, we expect that a larger fraction of women would be
willing to take this role under the GRPAA compared with the GRP treatment.
All four treatments were implemented in the two societies that vary the degree of female
empowerment. As described before in more detail, the Santal region is characterized by a
patriarchal system where women have low empowerment, while the Khasi region is
characterized by a matrilineal system with women occupying important roles in the society.
We expect that social differences in female empowerment will be reflected in the experiment.
Hence we expect that the fraction of female participants willing to assume the role of third
party will be lower in the Santal region than in the Khasi region under the GRP treatment. If
nature affects gender differences in aversion to feedback and aversion to assume public roles,
we expect that treatments that increase the degree of anonymity of the third party and that
decrease counter punishment would result in even larger fraction of women taking the role of
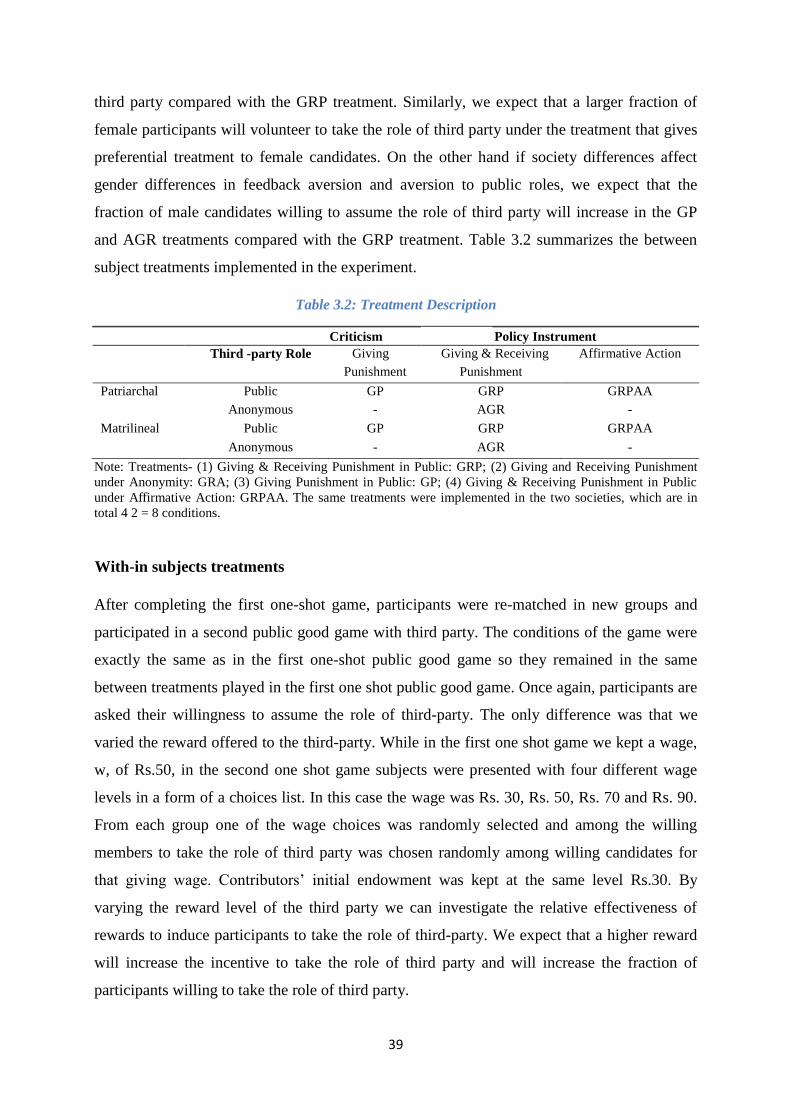
39
third party compared with the GRP treatment. Similarly, we expect that a larger fraction of
female participants will volunteer to take the role of third party under the treatment that gives
preferential treatment to female candidates. On the other hand if society differences affect
gender differences in feedback aversion and aversion to public roles, we expect that the
fraction of male candidates willing to assume the role of third party will increase in the GP
and AGR treatments compared with the GRP treatment. Table 3.2 summarizes the between
subject treatments implemented in the experiment.
Table 3.2: Treatment Description
Criticism Policy Instrument
Third -party Role Giving Giving & Receiving Affirmative Action
Punishment Punishment
Patriarchal Public GP GRP GRPAA
Anonymous - AGR -
Matrilineal Public GP GRP GRPAA
Anonymous - AGR -
Note: Treatments- (1) Giving & Receiving Punishment in Public: GRP; (2) Giving and Receiving Punishment
under Anonymity: GRA; (3) Giving Punishment in Public: GP; (4) Giving & Receiving Punishment in Public
under Affirmative Action: GRPAA. The same treatments were implemented in the two societies, which are in
total 4 2 = 8 conditions.
With-in subjects treatments
After completing the first one-shot game, participants were re-matched in new groups and
participated in a second public good game with third party. The conditions of the game were
exactly the same as in the first one-shot public good game so they remained in the same
between treatments played in the first one shot public good game. Once again, participants are
asked their willingness to assume the role of third-party. The only difference was that we
varied the reward offered to the third-party. While in the first one shot game we kept a wage,
w, of Rs.50, in the second one shot game subjects were presented with four different wage
levels in a form of a choices list. In this case the wage was Rs. 30, Rs. 50, Rs. 70 and Rs. 90.
From each group one of the wage choices was randomly selected and among the willing
members to take the role of third party was chosen randomly among willing candidates for
that giving wage. Contributors’ initial endowment was kept at the same level Rs.30. By
varying the reward level of the third party we can investigate the relative effectiveness of
rewards to induce participants to take the role of third-party. We expect that a higher reward
will increase the incentive to take the role of third party and will increase the fraction of
participants willing to take the role of third party.
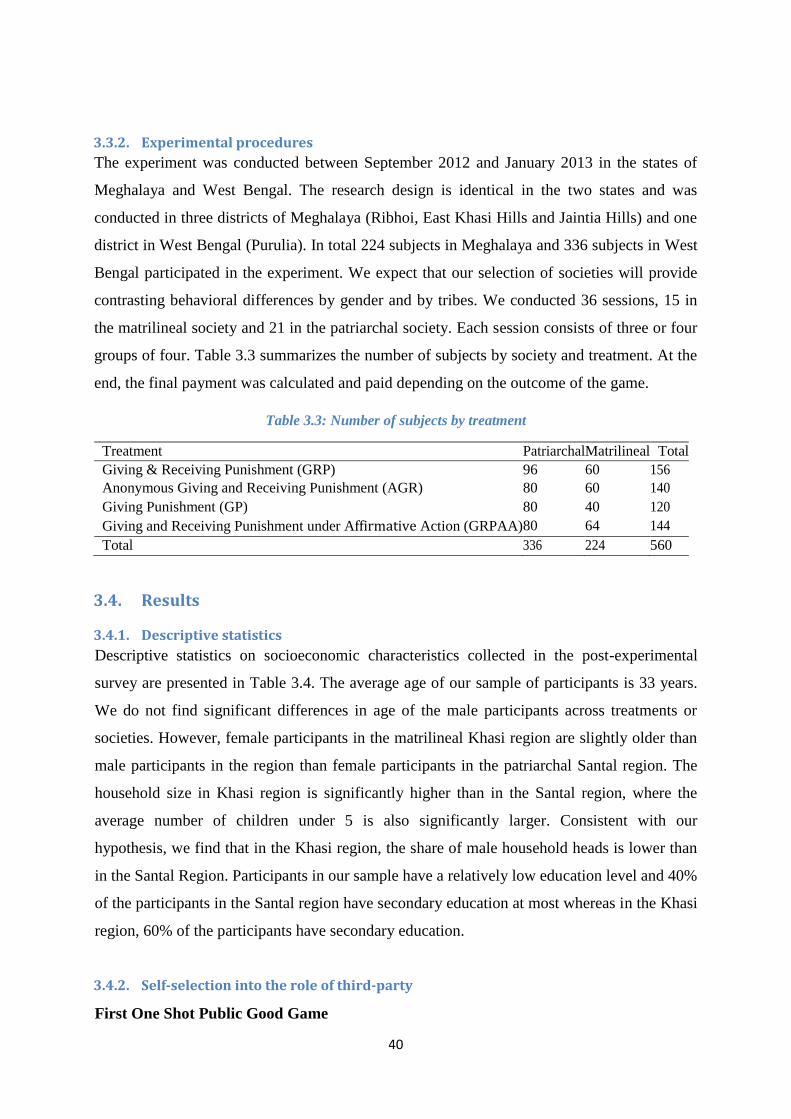
40
3.3.2. Experimental procedures
The experiment was conducted between September 2012 and January 2013 in the states of
Meghalaya and West Bengal. The research design is identical in the two states and was
conducted in three districts of Meghalaya (Ribhoi, East Khasi Hills and Jaintia Hills) and one
district in West Bengal (Purulia). In total 224 subjects in Meghalaya and 336 subjects in West
Bengal participated in the experiment. We expect that our selection of societies will provide
contrasting behavioral differences by gender and by tribes. We conducted 36 sessions, 15 in
the matrilineal society and 21 in the patriarchal society. Each session consists of three or four
groups of four. Table 3.3 summarizes the number of subjects by society and treatment. At the
end, the final payment was calculated and paid depending on the outcome of the game.
Table 3.3: Number of subjects by treatment
Treatment Patriarchal Matrilineal Total
Giving & Receiving Punishment (GRP) 96 60 156
Anonymous Giving and Receiving Punishment (AGR) 80 60 140
Giving Punishment (GP) 80 40 120
Giving and Receiving Punishment under Affirmative Action (GRPAA) 80 64 144
Total 336 224 560
3.4. Results
3.4.1. Descriptive statistics
Descriptive statistics on socioeconomic characteristics collected in the post-experimental
survey are presented in Table 3.4. The average age of our sample of participants is 33 years.
We do not find significant differences in age of the male participants across treatments or
societies. However, female participants in the matrilineal Khasi region are slightly older than
male participants in the region than female participants in the patriarchal Santal region. The
household size in Khasi region is significantly higher than in the Santal region, where the
average number of children under 5 is also significantly larger. Consistent with our
hypothesis, we find that in the Khasi region, the share of male household heads is lower than
in the Santal Region. Participants in our sample have a relatively low education level and 40%
of the participants in the Santal region have secondary education at most whereas in the Khasi
region, 60% of the participants have secondary education.
3.4.2. Self-selection into the role of third-party
First One Shot Public Good Game
41
Descriptive statistics of the proportion of male and female participants who selected the role
of the third-party by treatment and society are presented in Table 3.5. We find that in the
Giving and Receiving treatment (GRP) there are sizable gender differences in the willingness
to take the role of third party. However, these differences vary according to the type of
society. While in the patriarchal society men are more willing to volunteer, in the matrilineal
society is the opposite and women are more likely to be willing to assume this role. This is
consistent with the cultural differences in explaining appropriated gender roles.
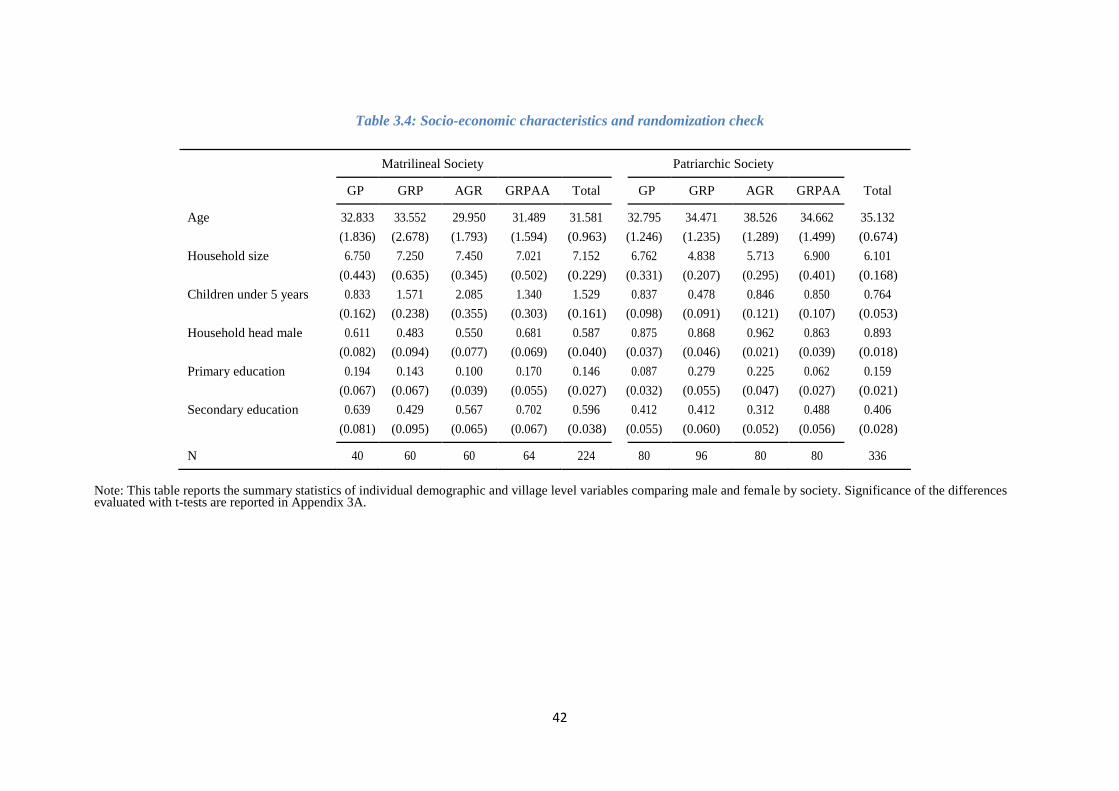
42
Table 3.4: Socio-economic characteristics and randomization check
Matrilineal Society Patriarchic Society
GP GRP AGR GRPAA Total GP GRP AGR GRPAA Total
Age 32.833 33.552 29.950 31.489 31.581 32.795 34.471 38.526 34.662 35.132
(1.836) (2.678) (1.793) (1.594) (0.963) (1.246) (1.235) (1.289) (1.499) (0.674)
Household size 6.750 7.250 7.450 7.021 7.152 6.762 4.838 5.713 6.900 6.101
(0.443) (0.635) (0.345) (0.502) (0.229) (0.331) (0.207) (0.295) (0.401) (0.168)
Children under 5 years 0.833 1.571 2.085 1.340 1.529 0.837 0.478 0.846 0.850 0.764
(0.162) (0.238) (0.355) (0.303) (0.161) (0.098) (0.091) (0.121) (0.107) (0.053)
Household head male 0.611 0.483 0.550 0.681 0.587 0.875 0.868 0.962 0.863 0.893
(0.082) (0.094) (0.077) (0.069) (0.040) (0.037) (0.046) (0.021) (0.039) (0.018)
Primary education 0.194 0.143 0.100 0.170 0.146 0.087 0.279 0.225 0.062 0.159
(0.067) (0.067) (0.039) (0.055) (0.027) (0.032) (0.055) (0.047) (0.027) (0.021)
Secondary education 0.639 0.429 0.567 0.702 0.596 0.412 0.412 0.312 0.488 0.406
(0.081) (0.095) (0.065) (0.067) (0.038) (0.055) (0.060) (0.052) (0.056) (0.028)
N 40 60 60 64 224 80 96 80 80 336
Note: This table reports the summary statistics of individual demographic and village level variables comparing male and female by society. Significance of the differences evaluated with t-tests are reported in Appendix 3A.
43
In the Giving Punishment treatment under which the contributors cannot counter punish the third
party. Motives such as gender differences in risk aversion or aversion to feedback are taken away.
Hence if gender differences in risk aversion or feedback aversion determine gender gaps in the
preference for the role of the third party, we would expect that the gender gap would be reduced in
this treatment. Indeed we find that this treatment is effective in reducing the gender differences in
willingness to select the role of third-party punisher. Compared to the baseline treatment, female
participants in the patriarchal society and male participants in the matrilineal society are
significantly more likely to accept the role of third party punisher. Surprisingly, in the matrilineal
society female participants are less likely to volunteer to the role of third party when counter
punishment is removed. This suggests that in the matrilineal society women have a preference for
being held accountable, as expected in their role. This result indicates that gender differences in
willingness to take the role of third party are due to social norms and are not innate.
The second treatment that we implement aims at testing whether conformity with social roles drives
gender differences in willingness to take the role of the third party. Comparing choices for the role
of third party in the treatment Anonymous Giving and Receiving (AGR) with the Giving and
Receiving Punishment Treatment (GRP), we find that gender differences in the willingness to take
the role of third party disappear once that identity of the third party is removed. This is consistent
with differences in image concern or conformity with social roles. Santal women and Khasi men are
significantly more likely to volunteer to the role of third party. The share of Khasi men volunteering
for the role of third party increases from 25% to 47.4% while the share of Santal women increases
from 23% to 44%. In contrast, in the matrilineal society there is a significant decline in women’s
willingness to assume the role of third party from 53.1% in the GRP to 29.3% under AGR. These
results indicate that fear of exposure and adherence to social norms under public observation play
an important role in women’s self-selection into leadership positions. As the effect of the treatment
differs by society, it seems that cultural norms rather than innate factors affect gender segregation in
leadership roles.
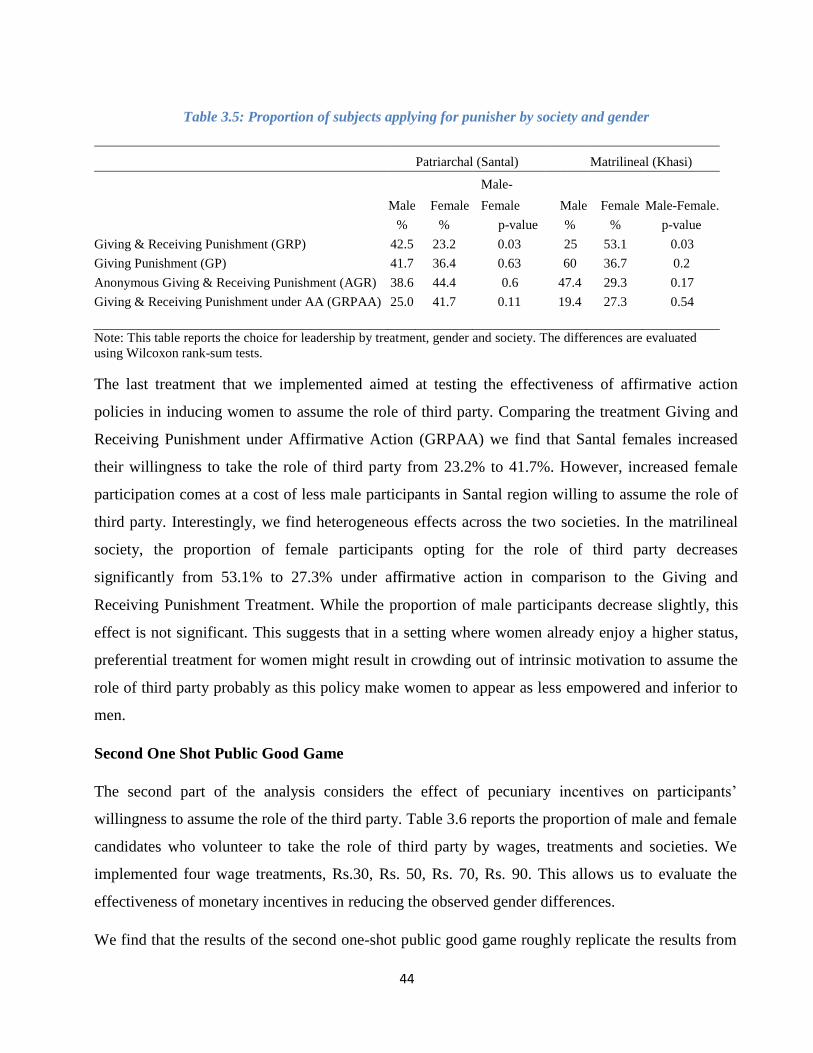
44
Table 3.5: Proportion of subjects applying for punisher by society and gender
Patriarchal (Santal) Matrilineal (Khasi)
Male Female
Male-
Female Male Female Male-Female.
% % p-value % % p-value
Giving & Receiving Punishment (GRP) 42.5 23.2 0.03 25 53.1 0.03
Giving Punishment (GP) 41.7 36.4 0.63 60 36.7 0.2
Anonymous Giving & Receiving Punishment (AGR) 38.6 44.4 0.6 47.4 29.3 0.17
Giving & Receiving Punishment under AA (GRPAA) 25.0 41.7 0.11 19.4 27.3 0.54
Note: This table reports the choice for leadership by treatment, gender and society. The differences are evaluated
using Wilcoxon rank-sum tests. The last treatment that we implemented aimed at testing the effectiveness of affirmative action
policies in inducing women to assume the role of third party. Comparing the treatment Giving and
Receiving Punishment under Affirmative Action (GRPAA) we find that Santal females increased
their willingness to take the role of third party from 23.2% to 41.7%. However, increased female
participation comes at a cost of less male participants in Santal region willing to assume the role of
third party. Interestingly, we find heterogeneous effects across the two societies. In the matrilineal
society, the proportion of female participants opting for the role of third party decreases
significantly from 53.1% to 27.3% under affirmative action in comparison to the Giving and
Receiving Punishment Treatment. While the proportion of male participants decrease slightly, this
effect is not significant. This suggests that in a setting where women already enjoy a higher status,
preferential treatment for women might result in crowding out of intrinsic motivation to assume the
role of third party probably as this policy make women to appear as less empowered and inferior to
men.
Second One Shot Public Good Game
The second part of the analysis considers the effect of pecuniary incentives on participants’
willingness to assume the role of the third party. Table 3.6 reports the proportion of male and female
candidates who volunteer to take the role of third party by wages, treatments and societies. We
implemented four wage treatments, Rs.30, Rs. 50, Rs. 70, Rs. 90. This allows us to evaluate the
effectiveness of monetary incentives in reducing the observed gender differences.
We find that the results of the second one-shot public good game roughly replicate the results from
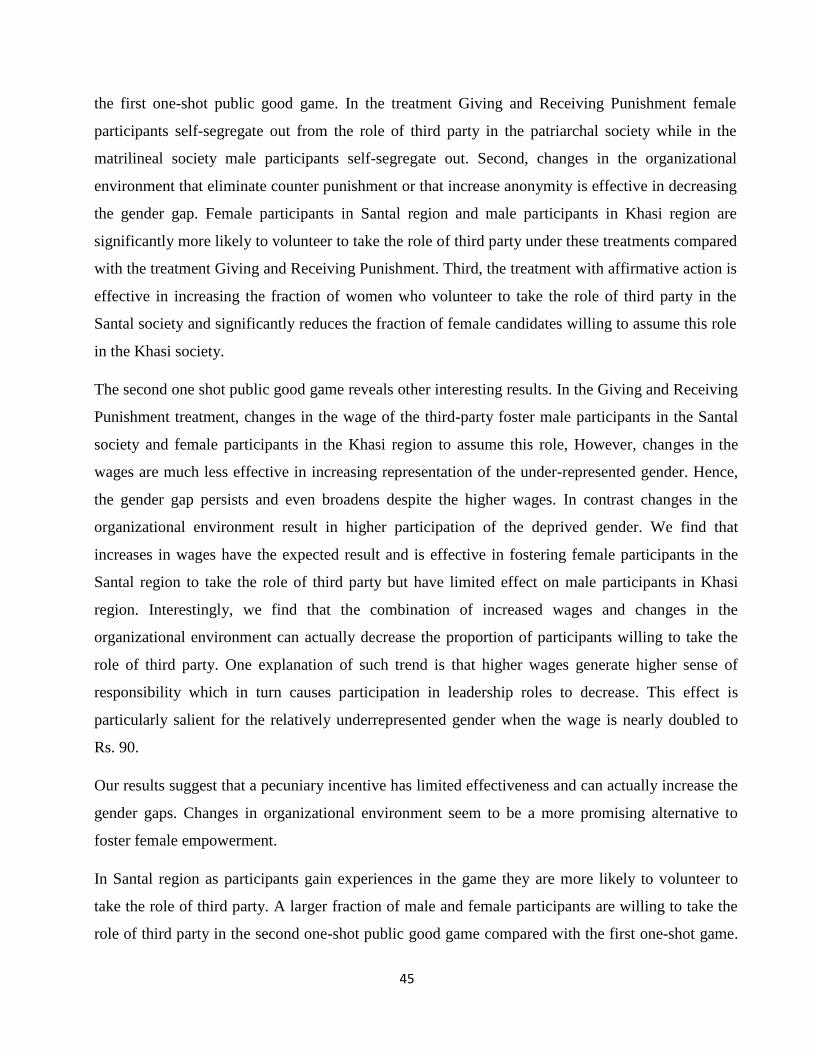
45
the first one-shot public good game. In the treatment Giving and Receiving Punishment female
participants self-segregate out from the role of third party in the patriarchal society while in the
matrilineal society male participants self-segregate out. Second, changes in the organizational
environment that eliminate counter punishment or that increase anonymity is effective in decreasing
the gender gap. Female participants in Santal region and male participants in Khasi region are
significantly more likely to volunteer to take the role of third party under these treatments compared
with the treatment Giving and Receiving Punishment. Third, the treatment with affirmative action is
effective in increasing the fraction of women who volunteer to take the role of third party in the
Santal society and significantly reduces the fraction of female candidates willing to assume this role
in the Khasi society.
The second one shot public good game reveals other interesting results. In the Giving and Receiving
Punishment treatment, changes in the wage of the third-party foster male participants in the Santal
society and female participants in the Khasi region to assume this role, However, changes in the
wages are much less effective in increasing representation of the under-represented gender. Hence,
the gender gap persists and even broadens despite the higher wages. In contrast changes in the
organizational environment result in higher participation of the deprived gender. We find that
increases in wages have the expected result and is effective in fostering female participants in the
Santal region to take the role of third party but have limited effect on male participants in Khasi
region. Interestingly, we find that the combination of increased wages and changes in the
organizational environment can actually decrease the proportion of participants willing to take the
role of third party. One explanation of such trend is that higher wages generate higher sense of
responsibility which in turn causes participation in leadership roles to decrease. This effect is
particularly salient for the relatively underrepresented gender when the wage is nearly doubled to
Rs. 90.
Our results suggest that a pecuniary incentive has limited effectiveness and can actually increase the
gender gaps. Changes in organizational environment seem to be a more promising alternative to
foster female empowerment.
In Santal region as participants gain experiences in the game they are more likely to volunteer to
take the role of third party. A larger fraction of male and female participants are willing to take the
role of third party in the second one-shot public good game compared with the first one-shot game.
46
Hence, gender differences in willingness to take the role of leader disappear in the Giving and
Receiving Punishment treatment when the wage is equal or lower than Rs.50 and reverse in the
treatment Anonymous Giving and Receiving Punishment.
Table 3.6: Proportion of subjects applying for punisher by society, gender and wage
Panel A: Male Patriarchal Matrilineal
W30 W50 W70 W90 W30 W50 W70 W90
GRP 0.48 0.58 0.75 0.78 0.18 0.29 0.64 0.29
AGR 0.45 0.55 0.59 0.45 0.63 0.53 0.53 0.53
GP 0.58 0.67 0.64 0.67 0.60 0.80 0.70 0.5
GRPAA 0.30 0.27 0.39 0.36 0.23 0.39 0.35 0.42
p:(AGR-GRP) 0.85 0.79 0.13 0.00*** 0.00*** 0.10 0.44 0.10
p:(GP-GRP) 0.35 0.42 0.30 0.30 0.01** 0.00*** 0.75 0.23
p:(GRPAA-GRP) 0.09* 0.00*** 0.00*** 0.00*** 0.66 0.42 0.03** 0.29
Panel B: Female Patriarchal Matrilineal
W30 W50 W70 W90 W30 W50 W70 W90
GRP 0.36 0.55 0.46 0.46 0.56 0.50 0.63 0.72
AGR 0.50 0.75 0.81 0.75 0.27 0.29 0.20 0.39
GP 0.36 0.70 0.70 0.75 0.40 0.30 0.40 0.33
GRPAA 0.39 0.61 0.81 0.61 0.18 0.27 0.24 0.27
p:(AGR-GRP) 0.18 0.06* 0.00*** 0.01** 0.01** 0.07* 0.00*** 0.00***
p:(GP-GRP) 0.95 0.12 0.02** 0.00*** 0.21 0.11 0.08* 0.00***
p:(GRPAA-GRP) 0.76 0.59 0.00*** 0.17 0.00*** 0.06** 0.00*** 0.00***
Note: The numbers indicate percentage of subjects opted for leadership; for the treatment comparison GRP is always
taken as baseline treatment; probabilities for are reported for Wilcoxon rank-sum test statistics; *** p<0.01, ** p<0.05,
* p<0.1; 12.8% showed inconsistent preference, however, they are included in the analysis.
3.4.3. Regressions analysis
First one-shot public good game
In previous studies correlations have been reported on how individual characteristics other than
gender are correlated with the willingness to take up power positions (A. H. Eagly and S. J. Karau,
2002; K.Y. Chan and F. Drasgow, 2001). To understand how treatments affect the willingness to
volunteer to the role of third party—L—we integrate socioeconomic controls in a regression frame-
work to obtain a more fine grained understanding of our results. We estimate the following linear
probability model with interactions between the treatments and a dummy for female subjects.
L = β0 + β1female + β 2AGR + β 3GP + β4GRPAA
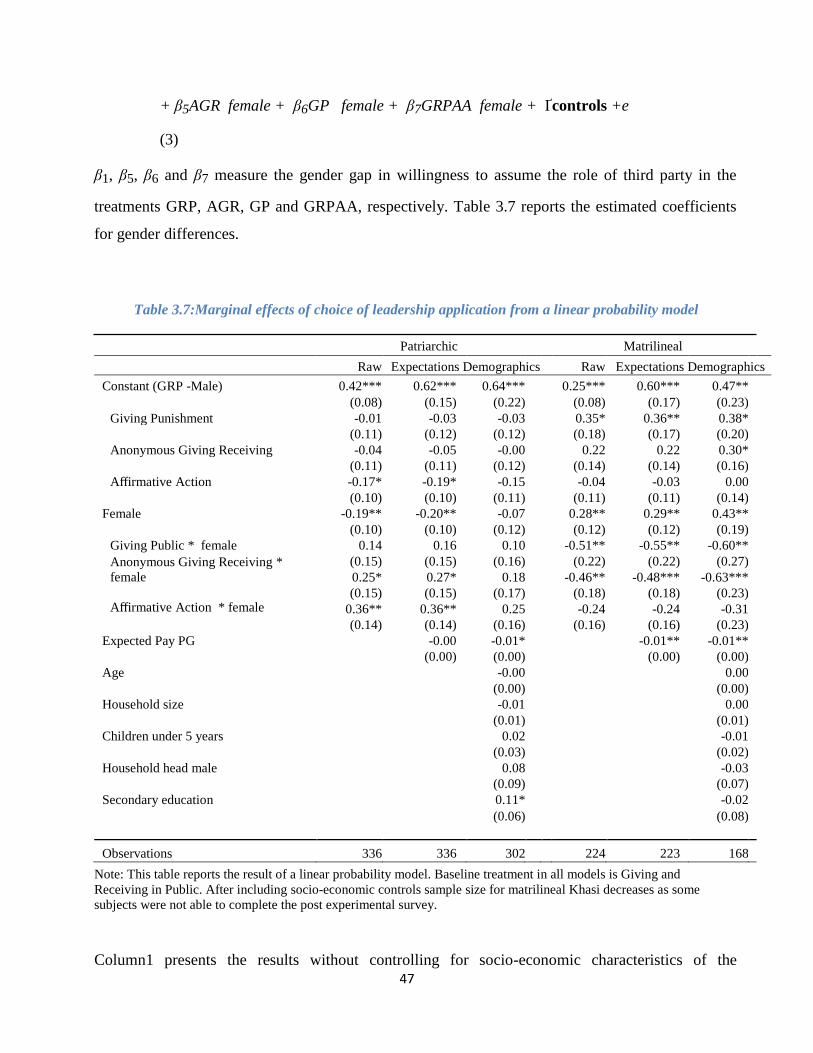
47
+ β5AGR female + β6GP female + β7GRPAA female + Ґcontrols +e (3)
β1, β5, β6 and β7 measure the gender gap in willingness to assume the role of third party in the
treatments GRP, AGR, GP and GRPAA, respectively. Table 3.7 reports the estimated coefficients
for gender differences.
Table 3.7:Marginal effects of choice of leadership application from a linear probability model
Patriarchic Matrilineal
Raw Expectations Demographics Raw Expectations Demographics
Constant (GRP -Male) 0.42*** 0.62*** 0.64*** 0.25*** 0.60*** 0.47**
(0.08) (0.15) (0.22) (0.08) (0.17) (0.23)
Giving Punishment -0.01 -0.03 -0.03 0.35* 0.36** 0.38*
(0.11) (0.12) (0.12) (0.18) (0.17) (0.20)
Anonymous Giving Receiving -0.04 -0.05 -0.00 0.22 0.22 0.30*
(0.11) (0.11) (0.12) (0.14) (0.14) (0.16)
Affirmative Action -0.17* -0.19* -0.15 -0.04 -0.03 0.00
(0.10) (0.10) (0.11) (0.11) (0.11) (0.14)
Female -0.19** -0.20** -0.07 0.28** 0.29** 0.43**
Giving Public * female
(0.10) (0.10) (0.12) (0.12) (0.12) (0.19)
0.14 0.16 0.10 -0.51** -0.55** -0.60**
Anonymous Giving Receiving *
female
(0.15) (0.15) (0.16) (0.22) (0.22) (0.27)
0.25* 0.27* 0.18 -0.46** -0.48*** -0.63***
Affirmative Action * female (0.15) (0.15) (0.17) (0.18) (0.18) (0.23)
0.36** 0.36** 0.25 -0.24 -0.24 -0.31
(0.14) (0.14) (0.16) (0.16) (0.16) (0.23)
Expected Pay PG -0.00 -0.01* -0.01** -0.01**
(0.00) (0.00) (0.00) (0.00)
Age -0.00 0.00
(0.00) (0.00)
Household size -0.01 0.00
(0.01) (0.01)
Children under 5 years 0.02 -0.01
(0.03) (0.02)
Household head male 0.08 -0.03
(0.09) (0.07)
Secondary education 0.11* -0.02
(0.06) (0.08)
Observations 336 336 302 224 223 168 Note: This table reports the result of a linear probability model. Baseline treatment in all models is Giving and Receiving in Public. After including socio-economic controls sample size for matrilineal Khasi decreases as some
subjects were not able to complete the post experimental survey.
Column1 presents the results without controlling for socio-economic characteristics of the
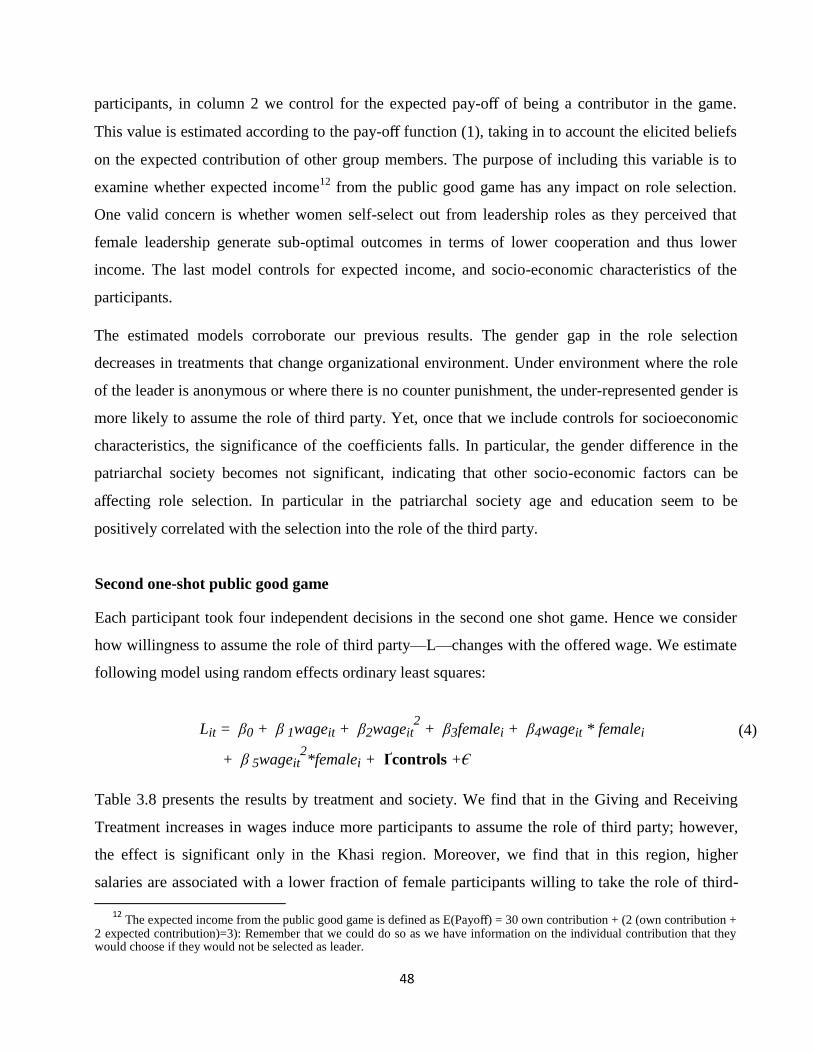
48
participants, in column 2 we control for the expected pay-off of being a contributor in the game.
This value is estimated according to the pay-off function (1), taking in to account the elicited beliefs
on the expected contribution of other group members. The purpose of including this variable is to
examine whether expected income12
from the public good game has any impact on role selection.
One valid concern is whether women self-select out from leadership roles as they perceived that
female leadership generate sub-optimal outcomes in terms of lower cooperation and thus lower
income. The last model controls for expected income, and socio-economic characteristics of the
participants.
The estimated models corroborate our previous results. The gender gap in the role selection
decreases in treatments that change organizational environment. Under environment where the role
of the leader is anonymous or where there is no counter punishment, the under-represented gender is
more likely to assume the role of third party. Yet, once that we include controls for socioeconomic
characteristics, the significance of the coefficients falls. In particular, the gender difference in the
patriarchal society becomes not significant, indicating that other socio-economic factors can be
affecting role selection. In particular in the patriarchal society age and education seem to be
positively correlated with the selection into the role of the third party.
Second one-shot public good game Each participant took four independent decisions in the second one shot game. Hence we consider
how willingness to assume the role of third party—L—changes with the offered wage. We estimate
following model using random effects ordinary least squares:
Lit = β0 + β 1wageit + β2wageit2 + β3femalei + β4wageit * femalei (4)
+ β 5wageit2*femalei + Ґcontrols +€
Table 3.8 presents the results by treatment and society. We find that in the Giving and Receiving
Treatment increases in wages induce more participants to assume the role of third party; however,
the effect is significant only in the Khasi region. Moreover, we find that in this region, higher
salaries are associated with a lower fraction of female participants willing to take the role of third-
12 The expected income from the public good game is defined as E(Payoff) = 30 own contribution + (2 (own contribution +
2 expected contribution)=3): Remember that we could do so as we have information on the individual contribution that they would choose if they would not be selected as leader.
49
party. Increased salaries have a decreasing effect on attracting participants to take the role of third-
party which is consistent with a crowding out effect of intrinsic motivations to lead. The
effectiveness of higher salaries to induce more participants to take the role of the third party is
limited in treatments where there is not counter punishment. Moreover in the treatment where the
role of the third-party is anonymous, higher salaries are effective in inducing more participants to
assume the role of the third-party in the Santal region but have no significant effect on participants
in the Khasi region.
Table 3.8: Random effect regression on application by gender and society depending on wage
Patriarchic Matrilineal
Male Female Male Female
Wage 0.01* 0.02*** 0.02** -0.00 (0.00) (0.00) (0.01) (0.00)
Wage2 -0.00 -0.00*** -0.00** 0.00
(0.00) (0.00) (0.00) (0.00)
Constant 0.21 -0.17 -0.11 0.42***
(0.11) (0.10) (0.17) (0.13)
Obs. 707 811 367 576 Groups 177 203 92 144
3.4.4. Characteristics of participants who self-select in the role of third party
Besides understanding how the organizational environment affects self-selection into the role of third
party, it is interesting to understand who wants to take this role. In this section we compare the
characteristics of the applicants. To consider the effect of our treatments on the decision to take the role
of third party, we apply the following difference-in-differences model:
Yc = β0 + β1AGR + β2GP + β3GRPAA
+ β4AGR apply + β5GP apply + β6GRPAA * apply +€ (5)
Where Yc, refers to outcome of the characteristic c and apply is an indicator variable that takes the
value of one for participants who volunteer to take the role of third party. Estimated coefficients β0
to β3 would capture differences in the characteristics of applicants across treatments or
randomization biases, while the coefficients β4 to β6 give the measure how participants who apply
differ across treatments. The first characteristic that we consider is differences in the level of
50
cooperativeness of participants measured as the propensity to contribute to the public good.
Remember, since participants took the contribution decision before the roles were assigned, this
measure is incentivized.
Furthermore, we compare the age and the level of education of volunteers versus the non-volunteers.
We find that in most of the treatments volunteers do not differ systematically from other
participants. This result holds across genders and societies. The only exception is the treatment
Giving Punishment in which participants who self-select into the role of third party are more
cooperative. The only characteristic in which volunteers differ from non-volunteers is in age. In the
patriarchal society, higher education is associated with a larger fraction of women who volunteer to
take the role of third party under treatments giving punishment and giving and receiving under
affirmative action, but decrease the fraction of female participants willing to assume that role in the
giving and receiving punishment treatment. In contrasts, in the matrilineal society, men with at most
primary education are more likely to take the role of the third party in the Giving and Receiving
treatment but are less likely to do so in the giving punishment treatment and in the giving and
receiving punishment with affirmative action.
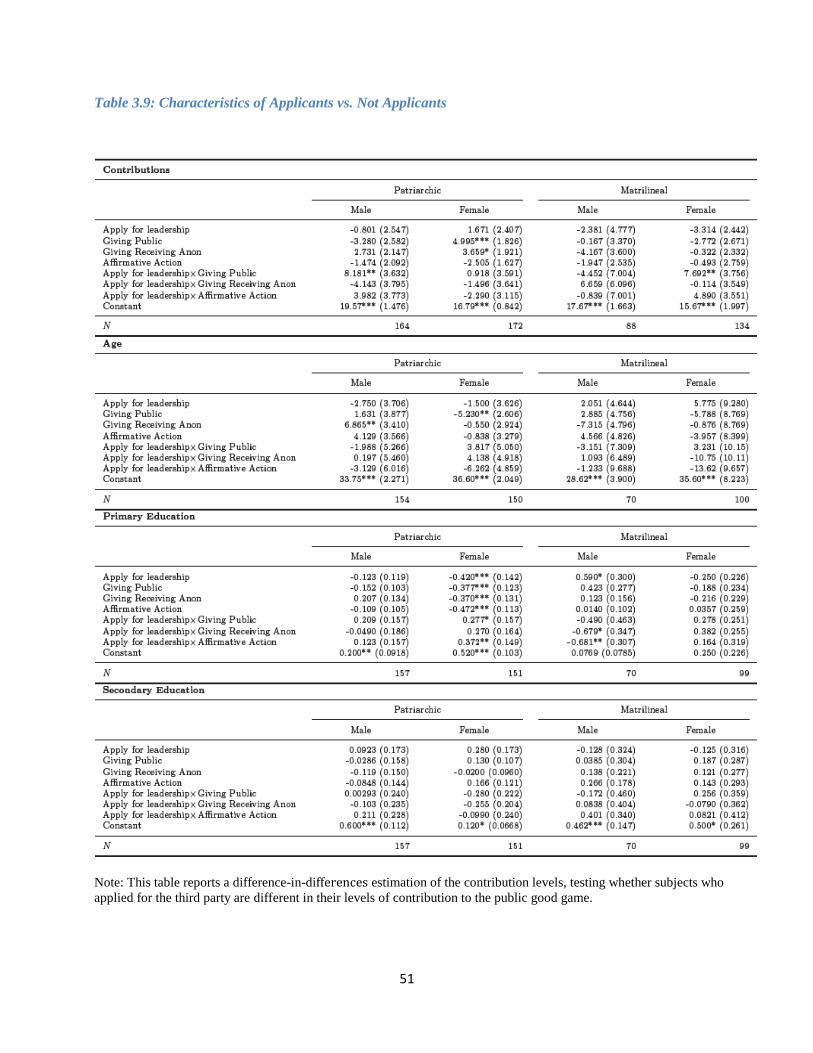
51
Table 3.9: Characteristics of Applicants vs. Not Applicants
Note: This table reports a difference-in-differences estimation of the contribution levels, testing whether subjects who
applied for the third party are different in their levels of contribution to the public good game.
52
3.5. Conclusion The negative association between women and leadership has been well established in the literature.
(see the discussion in Chattopadhyay and Duflo, 2004; Duflo and Topalova, 2004; for statistics see
Catalyst, 2011, 2012 ). Our study contributes to this literature by investigating the role of aversion
to feedback and aversion to public roles in shaping societal differences in leadership choice. In this
context, we also explore the role of affirmative action and wage increases to decrease gender gaps in
leadership roles. Our findings reveal interesting heterogeneity on preferences across the two
societies. In the patriarchal society, women lag significantly behind men in term of leadership self-
selection, whereas the matrilineal society shows an opposite trend with female subjects being more
likely to volunteer for leadership than men. Thus, in public Santal women are leadership averse, but
Khasi women are not. Once we introduce anonymous leaders, Santal women reverse their
preference for the leadership role significantly with more females now opting for leadership, and
thereby eroding the gender gap. On the other hand, Khasi women display a significant decline in
their leadership choice. This is contradictory to their previous choice and we argue that in the
absence of social norms Khasi females feel less obliged to fulfill their leadership role. Under
anonymity, we find no significant difference between Khasi men and women in terms of their self-
selection into leadership. Investigating the role of feedback we do not find significant results, with
the exception of Khasi men, who stand out to be significantly feedback averse. This result is not
surprising, as in a matrilineal society, where the social norm does not force men to take up the
leadership role, men will be more likely to shy away from leadership when they may receive
feedback for their actions. However, we do not find a similar pattern among women in the
patriarchal society.
Furthermore, we can draw important conclusions regarding affirmative action and its welfare
implications. Our results show that affirmative action is an effective policy tool for promoting
female leaders in patriarchal societies. In contrast, it has a detrimental effect on women’s self-
selection into leadership in matrilineal societies. In our experiment, Khasi women opted less often
for leadership in response to affirmative action, which is contrary to policy expectations. We argue
that this behavioral response might arise due to their preference for an equal status. Since they are
already the empowered gender in the society, any preferential treatment may result in crowding out
of women’s willingness to act as leaders in matrilineal societies. Finally, we also looked at impact of
higher monetary incentive on self-selection into leadership and we found that in general, wage
53
increase has a positive impact on leadership choice. However, this relation is rather nonlinear in
nature, i.e. with subsequent wage increase leadership participation increases but at a decreasing rate.
From this finding we draw the conclusion that higher wages attracts more subjects to leadership
role. Gradual wage increases is rather having a crowding out effect for both male and female as it
often generates higher commitments towards the same job and thus higher sense of responsibility
among the subjects resulting in crowding out of leadership motivation. This effect however is not so
prominent for Khasi female who do not react much for small wage changes and only found to have
significant participation increases for a sufficiently higher wage increase. This indicates that in
societies where women shy away from leadership monetary incentive could bring them into the
mainstream, however, higher incentive could infact crowd out female leaders as for same kind of
leadership role they might assume higher remuneration generates higher responsibility. However,
for powerful women, such as Khasi women, leadership participations are purely driven by
leadership motivation and pecuniary motive might not result in higher participation in leadership by
female subjects unless that motive is sufficiently high.
54
4. Ethnicity and gender differences in risk and ambiguity attitude13
Abstract
We analyze gender difference in risk and ambiguity attitude of subjects across two
different ethnicities that differ in the degree of female empowerment. Santal is a
patriarchal tribe and Khasi is a matrilineal tribe with men and women being the social
head in their respective societies. We compare subject’s willingness to take up risk and
ambiguity for themselves and on behalf of others. Besides we analyze the differences in
risk and ambiguity attitude of subjects from these societies. Our findings show that
women in both societies are significantly more risk averse, but not ambiguity averse.
Patriarchal male and female are more risk averse in group risk than in individual risk but
matrilineal subjects are not. Therefore, higher risk aversion in group is an ethnic trait
among Santals. Comparing the between ethnicity differences we find that matrilineal
subjects are more risk averse than patriarchal subjects. Regarding attitudes towards
ambiguity, we did not find any gender or ethnicity differences.
Keyword: Risk attitude, Gender difference, Matrilineal society, Patriarchal society, Field experiment
JEL Code: C93 D81 J15 J16
13
I would like to thank Stephan Klasen, Marcela Ibanez and participants 11th
young economics workshop at
University of Bologna for their valuable suggestions and comments. I would also like to thanks PRADAN and
Voluntary Health Association of India for helping me to carry out the fieldwork.
55
4.1. Introduction
Although women have made progress in attaining leadership roles in the work place, there has
been much less discussion on how they actually lead. Since, leadership style affects welfare
outcomes of institutions, investigating the impact of gender on leadership style could be of
huge importance. Therefore, for a better understanding of these outcomes, gender differences
in leadership style should emerge as a critical item in institutional economics research.
In this study we focus on two aspects of leadership style: in one the group leader makes
decisions under risk and in the other under uncertainty, both affecting payoff of all members
in the group. These types of decisions can range from choosing an investment decision for a
fund subject to joint ownership to implementing new technologies. While the first decision
would depend on the risk attitude of the leader, second one would relate more to the
ambiguity attitude14
.
Regarding gender differences in individual decisions making one of the stylized finding in the
literature is that men and women differ in their propensities to engage in risky activities (for
survey see Charness and Gneezy, 2012; Croson and Gneezy, 2009;Eckel and Grossman,
2008), with men tending to be less risk-averse than women. On the ambiguity front, evidence
is rather mixed. There is some evidence on the existence of such differences (Jianakoplos and
Bernasek, 1996, Barsky et.al., 1997, Powell and Ansic, 1997), but also some evidence against
it (Schubert et.al., 1999).
We use Ellsberg (1961) two color game to investigate gender differences in leadership style
with respect to risk and ambiguity aversion of subjects in individual and group decision
making. In the individual game payoff is received individually; in the group game each
subject’s decision additionally determines the payoff of other group members. Therefore, in a
way in the group game each subject behaves like an exogenously selected leader who decides
on behalf of the group. There are few studies that have considered gender differences in risk
taking behavior for others and in groups. For example, Ertac and Gurdal (2011) found that
women are more risk-averse than men, in both individual and group context. Interestingly risk
attitudes of women have no effect on whether they would like to decide for their group or not.
In other words, women who take more risk and women who take less risk individually are
equally likely to volunteer to be leaders. Daruvala (2007) shows that when subjects make
14
In literature difference between risk and ambiguity is explained as one in which probability of a distribution is known and
another in which there is uncertainty about the probability distribution (Ellsberg, 1961; Heath and Tversky, 1991; Camerer
and Weber, 1992; Tversky and Kahneman; 1992; Fox and Tversky 1995; Fox and Weber, 2000).
56
choices for others, they use combination of their own risk preferences and their predictions
about the risk preferences of the target group. Both genders predict that women exhibit higher
risk-aversion compared to men. Another strand of the literature has considered how groups
make risky decisions through voting, compared to individuals. Harrison et al. (2013) use
majority voting for group decisions and find that social risk, i.e. the risk taken in groups can
be closely approximated by individual decisions. Shupp and Williams (2008) show that group
discussion generates higher risk-aversion during decisions involving relatively higher risk.
However, to the best of our knowledge such studies do not exist for ambiguity aversion.
In order to understand gender differences in leadership style we introduce leadership using an
experimental treatment with subjects from two different social backgrounds. Experimental
treatment refers to the above mentioned group treatment in which each subject acts as the
exogenously selected leader; takes the decisions on behalf of the group; and her choice
determines her group members’ payoff. Any gender difference in the choices would then be
attributable to the gender differences in leadership style in risk and ambiguity taking attitude.
We also analyze if subjects behave differently in making group decisions than in individual
decisions to understand the changes in the attitude while deciding for a group. Finally, we
implemented the individual and group treatment with subjects from two different cultural
background: Matrilineal Khasi and patriarchal Santal. In Khasi socio-economic power flows
more in female line and in patriarchal Santal the cultural norms are similar to that of Hindu
norms of preferring men. We argue that other than genetic factors, men and women could
have different preferences because they are brought up differently. And if this is true,
significant difference in gender and ethnicity differences are likely to occur.
Considering intra-society male-female power relations is not new in experimental economics,
but evidence is still scarce. Gneezy et al., 2009 conducted an experiment with matrilineal
Khasi in India and Patriarchal Massai in Tanzania to analyze gender differences in
competitiveness. The subjects were given a choice to participate in ball-throwing game 10
times, either without competition, with each success yielding one dollar, or with competition
with an anonymous subject from the same village, which yields three dollars in a win and no
money at the loss. Their study found that while men are more inclined to compete among the
Massai, Khasi women are more competitive than men and are even weakly more than Massai
men. They also ran the investment risk experiment as control to their competition game and
found no significant gender differences but significant ethnicity difference, with the
matrilineal Khasi being less risk averse than the Massai. Andersen et al., 2013 choosing their
57
subjects from matrilineal Khasi and patrilineal Kharbi investigate whether women are born
less competitive or they become so through the process of socialization. By comparing the
children from these tribes they found that the differences in competitiveness starts around
puberty and most of the changes takes place only in patriarchal Kharbi where boys starts to
become more competitive than girls. Recently, Gong et al. (2010) in a dictator game also
found a reversed gender difference in the matrilineal Mosuo in China with men behaving
more selflessly than women. Gong and Yang (2012) conducted another experiments on two
different risk tasks with subjects from two ethnic groups, the matrilineal Mosuo and the
patriarchal Yi in China. Their study concluded that women are more risk averse than men at
both tasks within both ethnic groups. However, the gender gap is smaller in the Mosuo.
We find that women are more risk averse than men in both individual and group game within
the two ethnicities. This is consistent with findings in most of the previous studies. Therefore,
gender difference in risk attitude is a common phenomenon and does not depend on cultural
background of the subjects. Additionally our study shows that there is an ethnicity difference
in risk aversion with matrilineal subjects being more risk averse than the patriarchal subjects.
Finally differences in group and individual behavior is found only among patriarchal subjects
who behave more risk aversely in making group choices than in individual choices. On
ambiguity aversion we do not find any evidence of either gender difference or ethnicity
difference.
The rest of the paper is organized as follows: Section 4.2 describes the ethnicity background;
Based on the existing literature, Section 4.3 describes experimental hypotheses; Section 4.4
presents the experimental design and procedure; Section 4.5 describes the data and the
descriptive statistics; Section 4.6 discusses the results and interpretation and finally Section
4.7 concludes the study.
4.2. Ethnicity background
We implemented the same experiment in two different states of India as shown in the map
with two different tribes, the Khasi and the Santal. While the structure of the Khasi is
matrilineal the structure of the Santal is patriarchal. Comparing these societies will enable us
disentangling impact of culture on risk and ambiguity attitude.
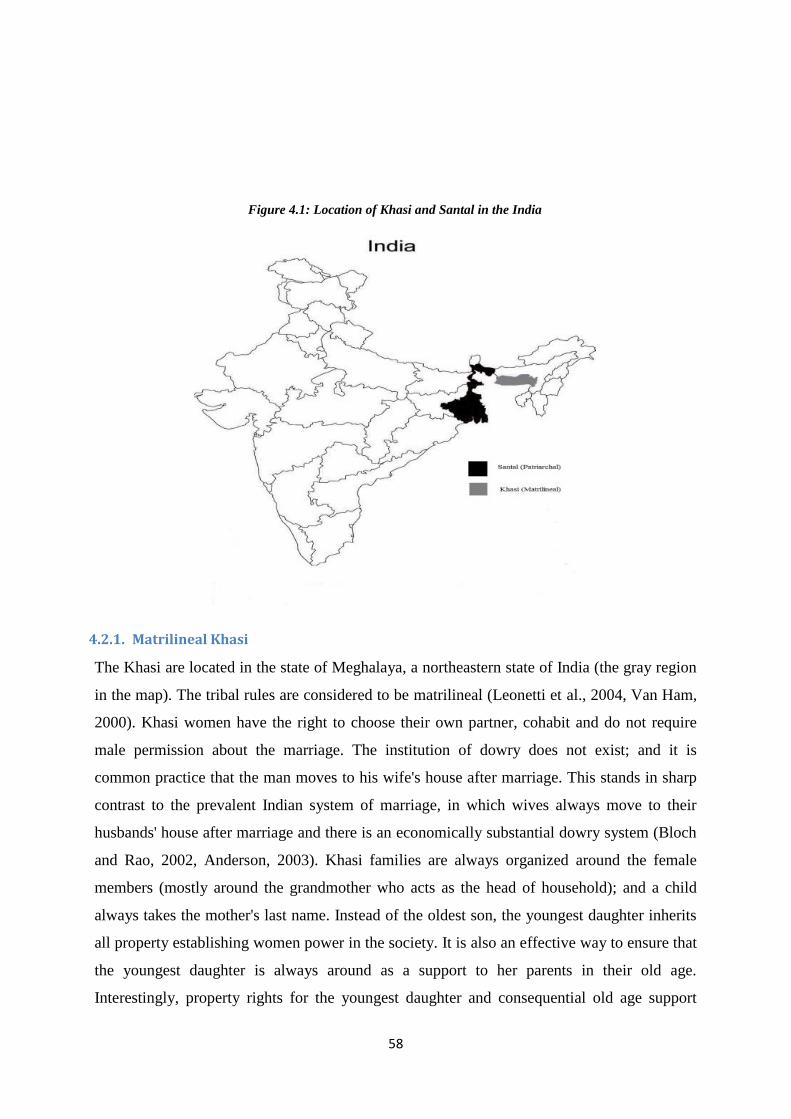
58
Figure 4.1: Location of Khasi and Santal in the India
4.2.1. Matrilineal Khasi
The Khasi are located in the state of Meghalaya, a northeastern state of India (the gray region
in the map). The tribal rules are considered to be matrilineal (Leonetti et al., 2004, Van Ham,
2000). Khasi women have the right to choose their own partner, cohabit and do not require
male permission about the marriage. The institution of dowry does not exist; and it is
common practice that the man moves to his wife's house after marriage. This stands in sharp
contrast to the prevalent Indian system of marriage, in which wives always move to their
husbands' house after marriage and there is an economically substantial dowry system (Bloch
and Rao, 2002, Anderson, 2003). Khasi families are always organized around the female
members (mostly around the grandmother who acts as the head of household); and a child
always takes the mother's last name. Instead of the oldest son, the youngest daughter inherits
all property establishing women power in the society. It is also an effective way to ensure that
the youngest daughter is always around as a support to her parents in their old age.
Interestingly, property rights for the youngest daughter and consequential old age support
59
make son preference absent in the society. Incidence of female feticide and domestic violence
against women is rare and intra-household access to health, education, and nutrition is equal
among male and female family members (for more details see Andersen et al., 2008, 2013
Gneezy et al., 2009). With the Khasi, farming is the major economic activity and production
is generally controlled by female members of the family. In addition to farming, women
undertake all other economic activities and are often involved in trading with men from other
societies.
4.2.2. Patriarchal Santal
The Santal, the largest tribal group of eastern India, are distributed over the states of Bihar,
Orissa, and Tripura as well as in West Bengal, where our study was conducted (which is
indicated by the black region in the map in Figure 1). The Santal society is patriarchal and has
always avoided giving women equal decision rights and status than men. Santal customary
law does not guarantee women inheritance rights in their parental property. They however
have contingent rights to inheritance depending upon the circumstances. For instance, a
common practice is to endow a married woman with some land in her natal village as a mean
to provide financial support in case of unsuccessful marriage. However, according to the
Santal Pargana Tenancy Act (SPTA), 1949, in absence of appropriate male heirs, the daughter
inherits her father's land (Rao, 2005). Caring for parents in their old age is the responsibility
of sons not of daughters. Once married, daughters are expected to spend their life under the
supervision of their husbands or other elder men in the husband's family. A post experimental
survey in our study revealed that female mobility even within the community is restricted and
visiting parents, relatives, and friends by the women always requires taking permission from
the adult male in the family. Low female mobility has also resulted in lower labor force
participation by women. Similarly, expenditure decisions are mostly taken by men in the
family, which is even triggered by the fact that in most household men are the major income
earning members. Women's work and work experience differs significantly from those of
men, and in some areas women are completely excluded from industrial work (Roy and
Murry, 2013). The distribution of family resources among male and female members is
unequal and even though women contribute significant amounts of labor to family farms,
income earned mostly remains under the control of men. The Santal social norms are not an
exception to the Hindu norms of favoring boys over girls, and son preference is prominent.
60
4.3. Hypotheses The previous literature on gender differences in risk and ambiguity aversion gives a direction
regarding expected behavior in the experiment. This section aims at understanding the within
and between society plausible differences and how far these differences differ in individual
decisions making and group decision making. Accordingly we formulate the following
hypotheses.
4.3.1. Within ethnicity difference
The first set of hypotheses we test are on the gender difference in risk and ambiguity aversion.
The hypotheses we study regarding the gender difference pertains to the question why should
women fare higher risk and ambiguity aversion than men? Apart from innate differences
another suggested explanation could be that profit-maximizing behavior for women is to
avoid risky and ambiguous choices because of backlash. For example, directive or
authoritative leadership style is shown to work against women as compared to men leaders
(Eagly, Makhijani and Klonsky, 1992; Eagly and Johnson, 1990). Bowles, Babcock and Lai
(2007) in their study discussed how women are often penalized in job interviews for
exhibiting higher negotiation skill than men. This explanation relates to the cultural
environment in which women who behaves in a less feminine way are faced with social
resistance than a man with similar behavioral traits.
On the other hand, existing studies addressing gender differences in altruism (Gong et al.,
2010) and competition (Gneezy et al., 2009; Andersen et al., 2013) across matrilineal and
patriarchal groups indicate that matrilineal women are more selfish and competitive than men.
Since, women matrilineal society seems to behave substantially differently than the women
from other societies we expect that the direction of gender differences generally observed in
patriarchal set up is likely to reverse in Khasi with women being more risk and ambiguity
loving than men.
Taking into consideration this literature we formulate different hypothesis on gender
difference for our study groups.
Hypothesis1a. Women in the patriarchal tribe are significantly more risk and ambiguity
averse than the men in individual and group decisions.
Hypothesis1b. Women in the matrilineal tribe are significantly less risk and ambiguity averse
than the men in individual and group decisions.
61
Second hypothesis tests for the group versus individual risk and ambiguity attitude. In our set
up, subject’s decision on whether to be more risk and ambiguity averse (or loving) would
depend on subject’s perception about the group as well as her own preference (Daruvala,
2007) and how she holds herself responsible for the outcome (Chakravarty et al., 2011;
Shutter, 2009; Bolton and Ockenfels, 2010). Depending on these variables then individual
behavior might be significantly different when deciding on behalf of others. Since our design
does not provide scope of in-group communication we expect subjects to opt more for the
riskless option to avoid emotional hazards associated with no payoff to the group due to
subjects’ individual choices. Accordingly our hypothesis on group vs. individual decision
making is that:
Hypothesis2. Deciding for the group makes individuals significantly more risk and ambiguity
averse than deciding only for themselves.
4.3.2. Between ethnicity differences
A third set of hypotheses concerns differences between societies. The unique feature of our
experiment is that it examines whether nurture has any observable impact on individuals
personality traits on risk and ambiguity attitude. In contrast to the patriarchal society, since
gender norms in matrilineal society favors women more than men, one might expect that the
gender outcomes on risk and ambiguity aversion established so far in economic experiments
will reverse in matrilineal society. Therefore, we expect women (men) in the matrilineal
society have higher (lower) inclination towards risky and ambiguity choices than them in the
patriarchal society. This is in line with the findings explained by Gong and Yang, 2012. Such
behavioral reversal among matrilineal subjects has also been found by several other studies
(Gneezy et al., 2009 on competitiveness, Gong et al., 2010 on transfers in ultimatum game).
Therefore, we test the following hypotheses on between ethnicity differences.
Hypothesis3a. Matrilineal women will be significantly less risk and ambiguity averse than the
patriarchal women in individual as well as group decisions.
Hypothesis3b. Matrilineal men will be significantly more risk and ambiguity averse than
Patriarchal men in individual as well as group decisions.
4.4. Experimental design We elicited risk and ambiguity attitudes within the framework of the Ellsberg two-color
choice task (Ellsberg, 1961). In the game each subject was asked to choose between a certain
amount and a gamble which pays with equal probabilities either Rs. 50 or nothing. We use a
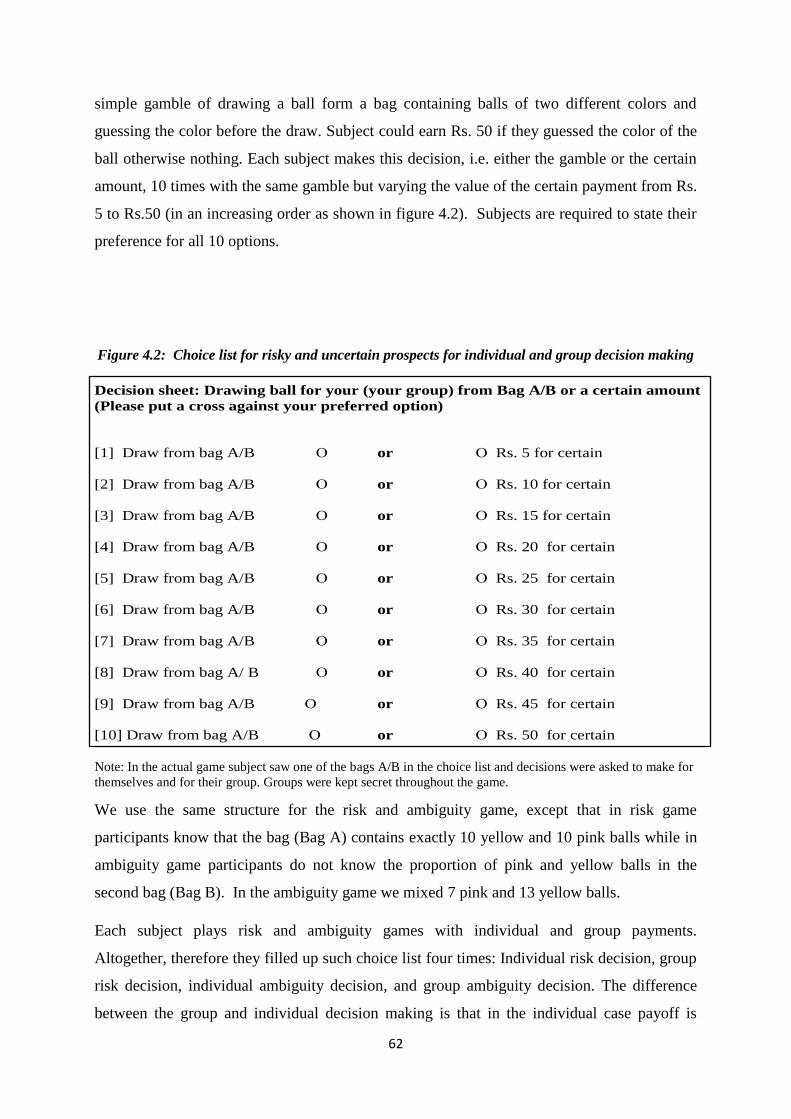
62
simple gamble of drawing a ball form a bag containing balls of two different colors and
guessing the color before the draw. Subject could earn Rs. 50 if they guessed the color of the
ball otherwise nothing. Each subject makes this decision, i.e. either the gamble or the certain
amount, 10 times with the same gamble but varying the value of the certain payment from Rs.
5 to Rs.50 (in an increasing order as shown in figure 4.2). Subjects are required to state their
preference for all 10 options.
Figure 4.2: Choice list for risky and uncertain prospects for individual and group decision making
Note: In the actual game subject saw one of the bags A/B in the choice list and decisions were asked to make for
themselves and for their group. Groups were kept secret throughout the game.
We use the same structure for the risk and ambiguity game, except that in risk game
participants know that the bag (Bag A) contains exactly 10 yellow and 10 pink balls while in
ambiguity game participants do not know the proportion of pink and yellow balls in the
second bag (Bag B). In the ambiguity game we mixed 7 pink and 13 yellow balls.
Each subject plays risk and ambiguity games with individual and group payments.
Altogether, therefore they filled up such choice list four times: Individual risk decision, group
risk decision, individual ambiguity decision, and group ambiguity decision. The difference
between the group and individual decision making is that in the individual case payoff is
Decision sheet: Drawing ball for your (your group) from Bag A/B or a certain amount
(Please put a cross against your preferred option)
[1] Draw from bag A/B Ο or Ο Rs. 5 for certain
[2] Draw from bag A/B Ο or Ο Rs. 10 for certain
[3] Draw from bag A/B Ο or Ο Rs. 15 for certain
[4] Draw from bag A/B Ο or Ο Rs. 20 for certain
[5] Draw from bag A/B Ο or Ο Rs. 25 for certain
[6] Draw from bag A/B Ο or Ο Rs. 30 for certain
[7] Draw from bag A/B Ο or Ο Rs. 35 for certain
[8] Draw from bag A/ B Ο or Ο Rs. 40 for certain
[9] Draw from bag A/B Ο or Ο Rs. 45 for certain
[10] Draw from bag A/B Ο or Ο Rs. 50 for certain
63
determined by subject’s own choice, where as in the group case they remained responsible not
only for their own payoff but also for the payoffs of others in the same group15
. Each group is
formed anonymously with four randomly chosen participants. While implementing the game
each game was explained separately.
To control for the order effect we altered the order of the game. In some sessions subjects
play the risk aversion game first and in others the ambiguity game. The four decisions were
made one after another and only after the decision sheets are all filled up one was randomly
selected for payment (described in details below)Therefore, there is no learning effect arising
from the decision sheet filled up before.
4.5. Payoffs The payment mechanism was clearly explained to the subjects before the game
implementation. For payment, first, one of the bags i.e. risky or ambiguous prospects is
randomly chosen. Second we made a random choice between individual game and group
game. In case individual game is selected we selected one of the ten options randomly. On the
other hand, if group option is chosen, one of the four members of the group is chosen to play
for the whole group. Similarly as the individual game, one of the ten options were selected
randomly for the group representatives. Depending on their decisions they either played the
gamble or received the certain payoff instead.
4.6. Attitude measurement
We define measures of risk and ambiguity attitudes based on certainty equivalents (Wakker
2010, chapter 11; Sutter et al, 2013). As a measure of risk attitude r we use
r=1- CER/π
Where, CER denotes the certainty equivalent of the risky prospect, π is the lottery money.
Values of r smaller (larger) than 0.5 indicate risk loving (risk aversion), with risk neutrality
for r = 0.5. As a measure of ambiguity attitude we employ the value a,
a=(CER –CEA)/ (CER +CEA)
15 Few subjects made inconsistent choice by switching there preference several times. We took the first switching point to
calculate certainty equivalence for them. In Santal inconsistency rates are Individual risk: 19.8%, Group risk: 15.7%,
Individual ambiguity: 11.6%, Group ambiguity: 14.3%. In Khasi these rates are 34.3%, 34.3%, 38.5%, and 39.4%
respectively. These rates are comparable to the inconsistency rates found in other studies. For example Lammers, et al., 2006
find an inconsistency rate of 66.5% in South Africa; Galarza, 2009 finds an inconsistency rate of 52% in Peru; and Doerr et
al., 2011 find an inconsistency rate of 39 % in Ethiopia. For more see Charness and Viceisza, 2012.
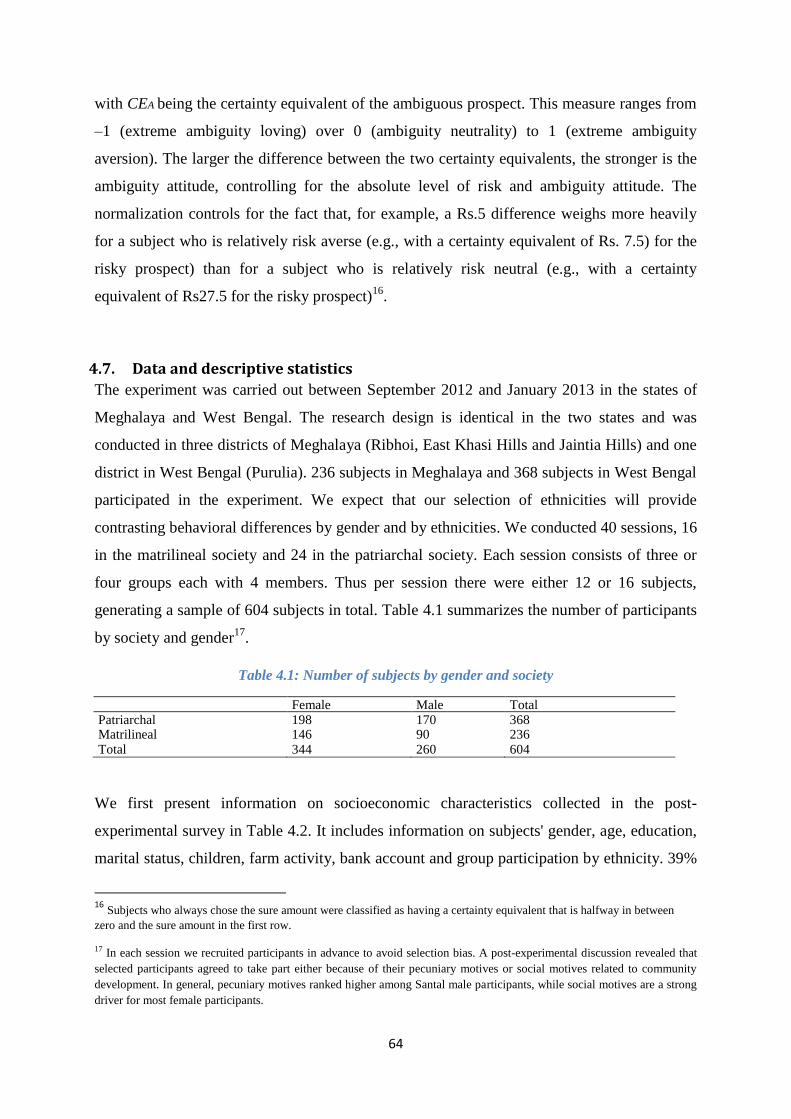
64
with CEA being the certainty equivalent of the ambiguous prospect. This measure ranges from
–1 (extreme ambiguity loving) over 0 (ambiguity neutrality) to 1 (extreme ambiguity
aversion). The larger the difference between the two certainty equivalents, the stronger is the
ambiguity attitude, controlling for the absolute level of risk and ambiguity attitude. The
normalization controls for the fact that, for example, a Rs.5 difference weighs more heavily
for a subject who is relatively risk averse (e.g., with a certainty equivalent of Rs. 7.5) for the
risky prospect) than for a subject who is relatively risk neutral (e.g., with a certainty
equivalent of Rs27.5 for the risky prospect)16
.
4.7. Data and descriptive statistics
The experiment was carried out between September 2012 and January 2013 in the states of
Meghalaya and West Bengal. The research design is identical in the two states and was
conducted in three districts of Meghalaya (Ribhoi, East Khasi Hills and Jaintia Hills) and one
district in West Bengal (Purulia). 236 subjects in Meghalaya and 368 subjects in West Bengal
participated in the experiment. We expect that our selection of ethnicities will provide
contrasting behavioral differences by gender and by ethnicities. We conducted 40 sessions, 16
in the matrilineal society and 24 in the patriarchal society. Each session consists of three or
four groups each with 4 members. Thus per session there were either 12 or 16 subjects,
generating a sample of 604 subjects in total. Table 4.1 summarizes the number of participants
by society and gender17
.
Table 4.1: Number of subjects by gender and society
Female Male Total
Patriarchal 198 170 368 Matrilineal 146 90 236 Total 344 260 604
We first present information on socioeconomic characteristics collected in the post-
experimental survey in Table 4.2. It includes information on subjects' gender, age, education,
marital status, children, farm activity, bank account and group participation by ethnicity. 39%
16 Subjects who always chose the sure amount were classified as having a certainty equivalent that is halfway in between
zero and the sure amount in the first row.
17 In each session we recruited participants in advance to avoid selection bias. A post-experimental discussion revealed that
selected participants agreed to take part either because of their pecuniary motives or social motives related to community
development. In general, pecuniary motives ranked higher among Santal male participants, while social motives are a strong
driver for most female participants.
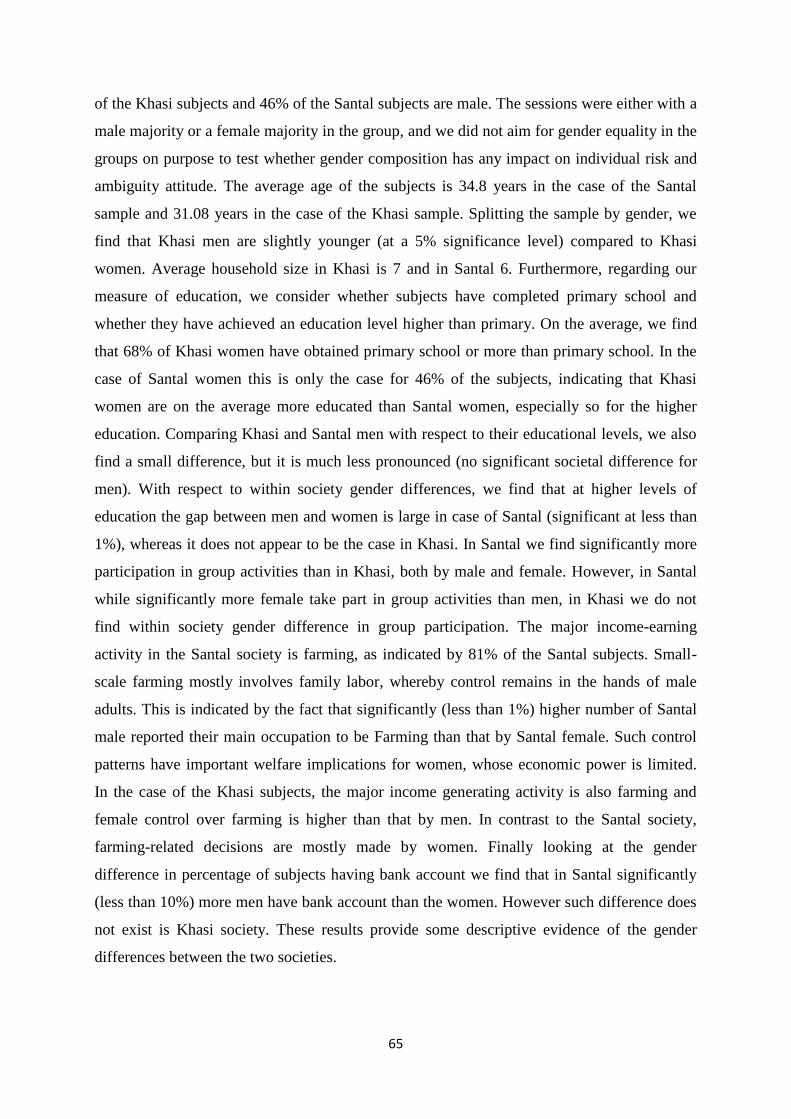
65
of the Khasi subjects and 46% of the Santal subjects are male. The sessions were either with a
male majority or a female majority in the group, and we did not aim for gender equality in the
groups on purpose to test whether gender composition has any impact on individual risk and
ambiguity attitude. The average age of the subjects is 34.8 years in the case of the Santal
sample and 31.08 years in the case of the Khasi sample. Splitting the sample by gender, we
find that Khasi men are slightly younger (at a 5% significance level) compared to Khasi
women. Average household size in Khasi is 7 and in Santal 6. Furthermore, regarding our
measure of education, we consider whether subjects have completed primary school and
whether they have achieved an education level higher than primary. On the average, we find
that 68% of Khasi women have obtained primary school or more than primary school. In the
case of Santal women this is only the case for 46% of the subjects, indicating that Khasi
women are on the average more educated than Santal women, especially so for the higher
education. Comparing Khasi and Santal men with respect to their educational levels, we also
find a small difference, but it is much less pronounced (no significant societal difference for
men). With respect to within society gender differences, we find that at higher levels of
education the gap between men and women is large in case of Santal (significant at less than
1%), whereas it does not appear to be the case in Khasi. In Santal we find significantly more
participation in group activities than in Khasi, both by male and female. However, in Santal
while significantly more female take part in group activities than men, in Khasi we do not
find within society gender difference in group participation. The major income-earning
activity in the Santal society is farming, as indicated by 81% of the Santal subjects. Small-
scale farming mostly involves family labor, whereby control remains in the hands of male
adults. This is indicated by the fact that significantly (less than 1%) higher number of Santal
male reported their main occupation to be Farming than that by Santal female. Such control
patterns have important welfare implications for women, whose economic power is limited.
In the case of the Khasi subjects, the major income generating activity is also farming and
female control over farming is higher than that by men. In contrast to the Santal society,
farming-related decisions are mostly made by women. Finally looking at the gender
difference in percentage of subjects having bank account we find that in Santal significantly
(less than 10%) more men have bank account than the women. However such difference does
not exist is Khasi society. These results provide some descriptive evidence of the gender
differences between the two societies.
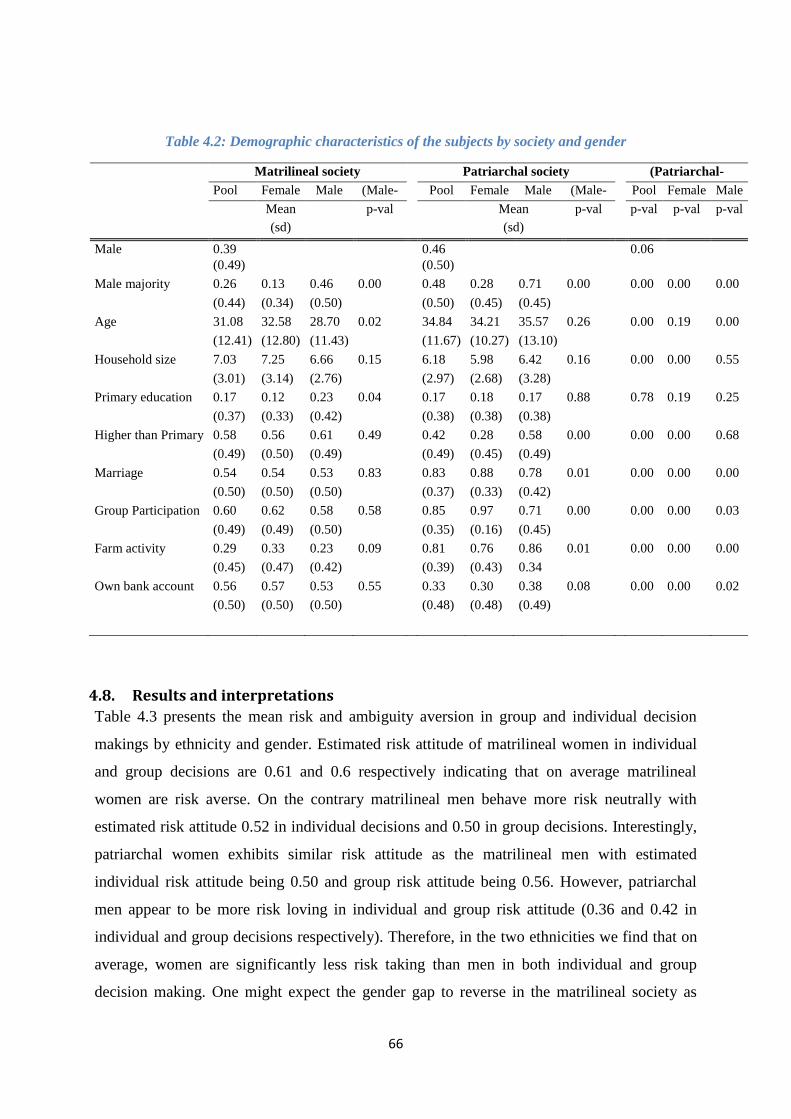
66
Table 4.2: Demographic characteristics of the subjects by society and gender
Matrilineal society
Patriarchal society
(Patriarchal-
Matrilineal) Pool Female Male (Male-
Female)
Pool Female Male (Male-
Female)
Pool Female Male
Mean p-val
Mean p-val
p-val p-val p-val
(sd)
(sd)
Male 0.39
0.46
0.06
(0.49)
(0.50)
Male majority 0.26 0.13 0.46 0.00
0.48 0.28 0.71 0.00
0.00 0.00 0.00
(0.44) (0.34) (0.50)
(0.50) (0.45) (0.45)
Age 31.08 32.58 28.70 0.02
34.84 34.21 35.57 0.26
0.00 0.19 0.00
(12.41) (12.80) (11.43)
(11.67) (10.27) (13.10)
Household size 7.03 7.25 6.66 0.15
6.18 5.98 6.42 0.16
0.00 0.00 0.55
(3.01) (3.14) (2.76)
(2.97) (2.68) (3.28)
Primary education 0.17 0.12 0.23 0.04
0.17 0.18 0.17 0.88
0.78 0.19 0.25
(0.37) (0.33) (0.42)
(0.38) (0.38) (0.38)
Higher than Primary 0.58 0.56 0.61 0.49
0.42 0.28 0.58 0.00
0.00 0.00 0.68
(0.49) (0.50) (0.49)
(0.49) (0.45) (0.49)
Marriage 0.54 0.54 0.53 0.83
0.83 0.88 0.78 0.01
0.00 0.00 0.00
(0.50) (0.50) (0.50)
(0.37) (0.33) (0.42)
Group Participation 0.60 0.62 0.58 0.58
0.85 0.97 0.71 0.00
0.00 0.00 0.03
(0.49) (0.49) (0.50)
(0.35) (0.16) (0.45)
Farm activity 0.29 0.33 0.23 0.09
0.81 0.76 0.86 0.01
0.00 0.00 0.00
(0.45) (0.47) (0.42)
(0.39) (0.43) 0.34
Own bank account 0.56 0.57 0.53 0.55
0.33 0.30 0.38 0.08
0.00 0.00 0.02
(0.50) (0.50) (0.50)
(0.48) (0.48) (0.49)
4.8. Results and interpretations
Table 4.3 presents the mean risk and ambiguity aversion in group and individual decision
makings by ethnicity and gender. Estimated risk attitude of matrilineal women in individual
and group decisions are 0.61 and 0.6 respectively indicating that on average matrilineal
women are risk averse. On the contrary matrilineal men behave more risk neutrally with
estimated risk attitude 0.52 in individual decisions and 0.50 in group decisions. Interestingly,
patriarchal women exhibits similar risk attitude as the matrilineal men with estimated
individual risk attitude being 0.50 and group risk attitude being 0.56. However, patriarchal
men appear to be more risk loving in individual and group risk attitude (0.36 and 0.42 in
individual and group decisions respectively). Therefore, in the two ethnicities we find that on
average, women are significantly less risk taking than men in both individual and group
decision making. One might expect the gender gap to reverse in the matrilineal society as
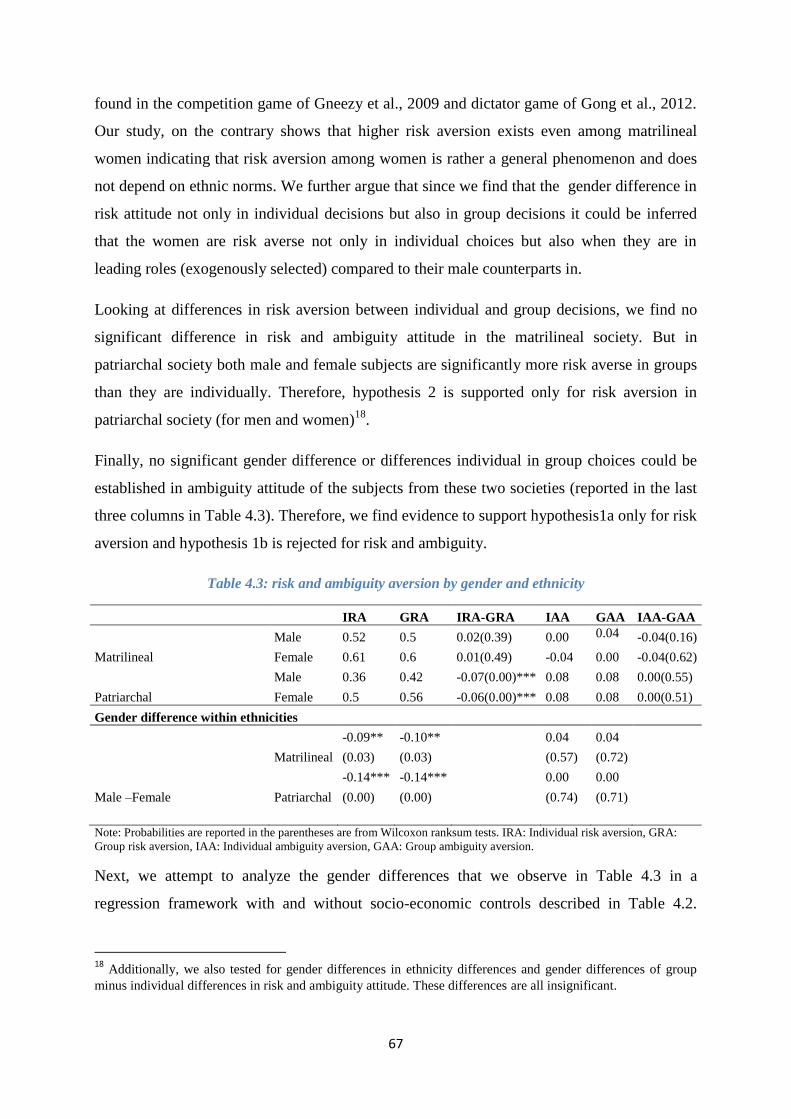
67
found in the competition game of Gneezy et al., 2009 and dictator game of Gong et al., 2012.
Our study, on the contrary shows that higher risk aversion exists even among matrilineal
women indicating that risk aversion among women is rather a general phenomenon and does
not depend on ethnic norms. We further argue that since we find that the gender difference in
risk attitude not only in individual decisions but also in group decisions it could be inferred
that the women are risk averse not only in individual choices but also when they are in
leading roles (exogenously selected) compared to their male counterparts in.
Looking at differences in risk aversion between individual and group decisions, we find no
significant difference in risk and ambiguity attitude in the matrilineal society. But in
patriarchal society both male and female subjects are significantly more risk averse in groups
than they are individually. Therefore, hypothesis 2 is supported only for risk aversion in
patriarchal society (for men and women)18
.
Finally, no significant gender difference or differences individual in group choices could be
established in ambiguity attitude of the subjects from these two societies (reported in the last
three columns in Table 4.3). Therefore, we find evidence to support hypothesis1a only for risk
aversion and hypothesis 1b is rejected for risk and ambiguity.
Table 4.3: risk and ambiguity aversion by gender and ethnicity
IRA GRA IRA-GRA IAA GAA IAA-GAA
Matrilineal
Male 0.52 0.5 0.02(0.39) 0.00 0.04
-0.04(0.16)
Female 0.61 0.6 0.01(0.49) -0.04 0.00 -0.04(0.62)
Patriarchal
Male 0.36 0.42 -0.07(0.00)*** 0.08 0.08 0.00(0.55)
Female 0.5 0.56 -0.06(0.00)*** 0.08 0.08 0.00(0.51)
Gender difference within ethnicities
Male –Female
Matrilineal
-0.09** -0.10**
0.04 0.04
(0.03) (0.03)
(0.57) (0.72)
Patriarchal
-0.14*** -0.14***
0.00 0.00
(0.00) (0.00)
(0.74) (0.71)
Note: Probabilities are reported in the parentheses are from Wilcoxon ranksum tests. IRA: Individual risk aversion, GRA:
Group risk aversion, IAA: Individual ambiguity aversion, GAA: Group ambiguity aversion.
Next, we attempt to analyze the gender differences that we observe in Table 4.3 in a
regression framework with and without socio-economic controls described in Table 4.2.
18 Additionally, we also tested for gender differences in ethnicity differences and gender differences of group
minus individual differences in risk and ambiguity attitude. These differences are all insignificant.
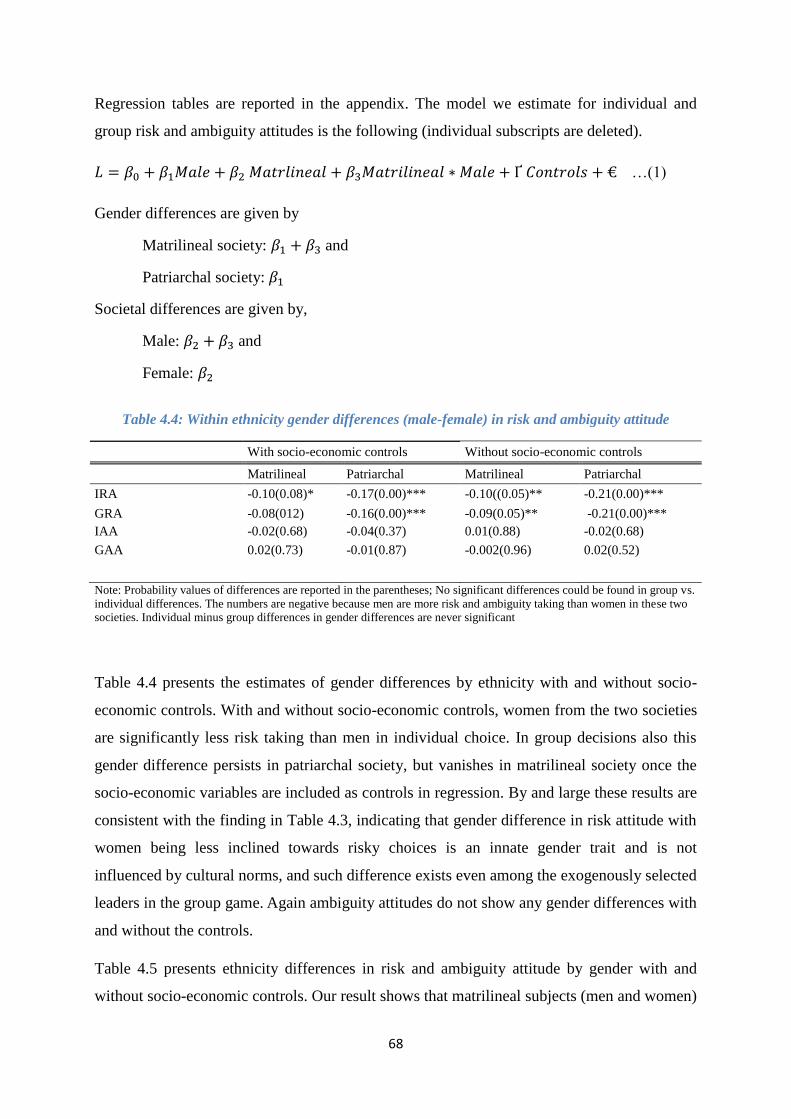
68
Regression tables are reported in the appendix. The model we estimate for individual and
group risk and ambiguity attitudes is the following (individual subscripts are deleted).
…(1)
Gender differences are given by
Matrilineal society: and
Patriarchal society:
Societal differences are given by,
Male: and
Female:
Table 4.4: Within ethnicity gender differences (male-female) in risk and ambiguity attitude
With socio-economic controls Without socio-economic controls
Matrilineal Patriarchal Matrilineal Patriarchal
IRA -0.10(0.08)* -0.17(0.00)*** -0.10((0.05)** -0.21(0.00)***
GRA -0.08(012) -0.16(0.00)*** -0.09(0.05)** -0.21(0.00)***
IAA -0.02(0.68) -0.04(0.37) 0.01(0.88) -0.02(0.68)
GAA 0.02(0.73) -0.01(0.87) -0.002(0.96) 0.02(0.52)
Note: Probability values of differences are reported in the parentheses; No significant differences could be found in group vs.
individual differences. The numbers are negative because men are more risk and ambiguity taking than women in these two societies. Individual minus group differences in gender differences are never significant
Table 4.4 presents the estimates of gender differences by ethnicity with and without socio-
economic controls. With and without socio-economic controls, women from the two societies
are significantly less risk taking than men in individual choice. In group decisions also this
gender difference persists in patriarchal society, but vanishes in matrilineal society once the
socio-economic variables are included as controls in regression. By and large these results are
consistent with the finding in Table 4.3, indicating that gender difference in risk attitude with
women being less inclined towards risky choices is an innate gender trait and is not
influenced by cultural norms, and such difference exists even among the exogenously selected
leaders in the group game. Again ambiguity attitudes do not show any gender differences with
and without the controls.
Table 4.5 presents ethnicity differences in risk and ambiguity attitude by gender with and
without socio-economic controls. Our result shows that matrilineal subjects (men and women)
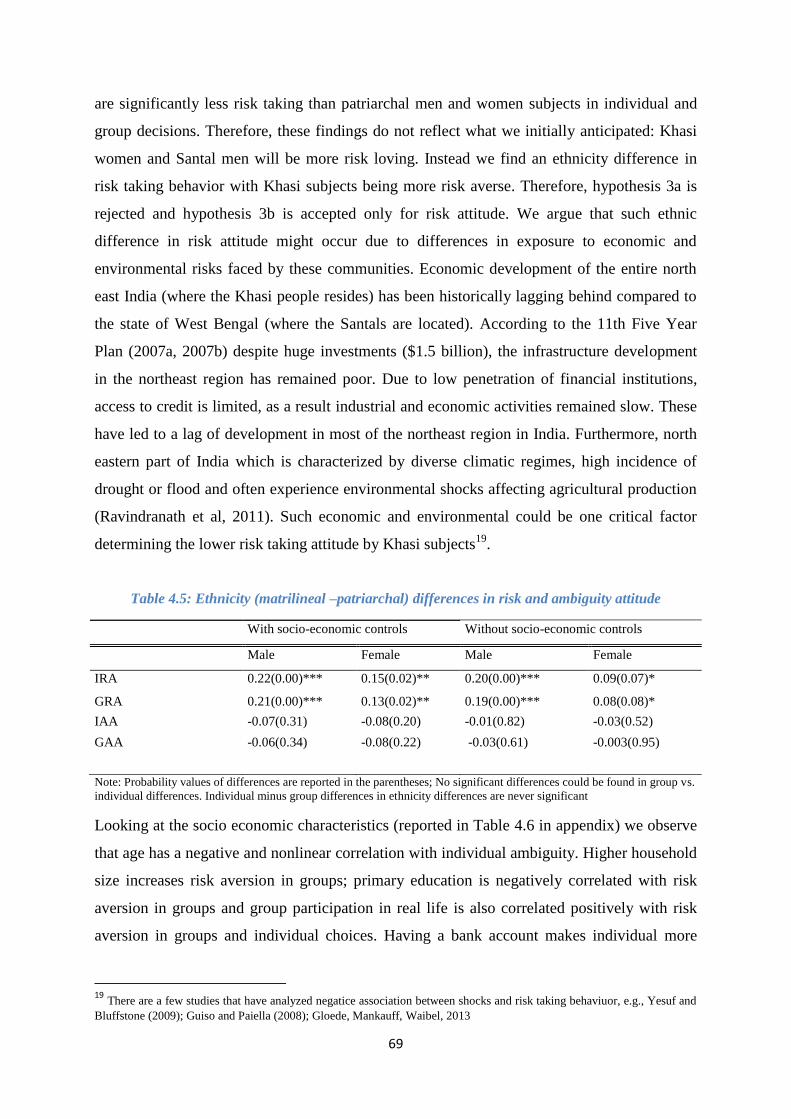
69
are significantly less risk taking than patriarchal men and women subjects in individual and
group decisions. Therefore, these findings do not reflect what we initially anticipated: Khasi
women and Santal men will be more risk loving. Instead we find an ethnicity difference in
risk taking behavior with Khasi subjects being more risk averse. Therefore, hypothesis 3a is
rejected and hypothesis 3b is accepted only for risk attitude. We argue that such ethnic
difference in risk attitude might occur due to differences in exposure to economic and
environmental risks faced by these communities. Economic development of the entire north
east India (where the Khasi people resides) has been historically lagging behind compared to
the state of West Bengal (where the Santals are located). According to the 11th Five Year
Plan (2007a, 2007b) despite huge investments ($1.5 billion), the infrastructure development
in the northeast region has remained poor. Due to low penetration of financial institutions,
access to credit is limited, as a result industrial and economic activities remained slow. These
have led to a lag of development in most of the northeast region in India. Furthermore, north
eastern part of India which is characterized by diverse climatic regimes, high incidence of
drought or flood and often experience environmental shocks affecting agricultural production
(Ravindranath et al, 2011). Such economic and environmental could be one critical factor
determining the lower risk taking attitude by Khasi subjects19
.
Table 4.5: Ethnicity (matrilineal –patriarchal) differences in risk and ambiguity attitude
With socio-economic controls Without socio-economic controls
Male Female Male Female
IRA 0.22(0.00)*** 0.15(0.02)** 0.20(0.00)*** 0.09(0.07)*
GRA 0.21(0.00)*** 0.13(0.02)** 0.19(0.00)*** 0.08(0.08)*
IAA -0.07(0.31) -0.08(0.20) -0.01(0.82) -0.03(0.52)
GAA -0.06(0.34) -0.08(0.22) -0.03(0.61) -0.003(0.95)
Note: Probability values of differences are reported in the parentheses; No significant differences could be found in group vs.
individual differences. Individual minus group differences in ethnicity differences are never significant
Looking at the socio economic characteristics (reported in Table 4.6 in appendix) we observe
that age has a negative and nonlinear correlation with individual ambiguity. Higher household
size increases risk aversion in groups; primary education is negatively correlated with risk
aversion in groups and group participation in real life is also correlated positively with risk
aversion in groups and individual choices. Having a bank account makes individual more
19 There are a few studies that have analyzed negatice association between shocks and risk taking behaviuor, e.g., Yesuf and
Bluffstone (2009); Guiso and Paiella (2008); Gloede, Mankauff, Waibel, 2013
70
ambiguity loving. Finally, higher male presence in the session is found increase group risk
aversion and individual ambiguity aversion.
4.9. Summary and conclusion
Using Ellsberg two color choice experiments we elicit risk and ambiguity attitude of 604
subjects to investigate whether there is any gender difference in leadership style. There are
two specific contributions of this study. First, in our setup each subject is asked to decide for
themselves and then on behalf of their group. In the first case payoff is received individually
and in the second subject’s decision also determined group members’ income. Thus, in the
second scenario we allow each subject to behave as exogenously determined leader, taking
decision on behalf of the group and being responsible also for the outcome. Our objective is
to examine whether risk, ambiguity attitudes vary significantly depending on who bears the
consequences of a particular choice. Second, we attempt to understand if gender and
leadership norms of a society have any impact on risk and ambiguity. To achieve our
objective we implemented the same experiment with subjects from two different ethnicities in
India- one is a matrilineal tribe known as Khasi with women being the leading gender and
another is a patriarchal tribe known as Santal with men being the head of the society. We
believe that such choice of ethnicities with different power balance would help us to
understand the role of norms in shaping risk and ambiguity preference of the subjects.
Our first result suggests a gender difference in risk taking attitude is rather a general trait:
women are more risk averse than men in both the ethnicities i.e. irrespective of cultural
context women are more risk averse in Santal and Khasi. Second, such difference exists even
when subjects are deciding for their group. Therefore, even when subjects are acting as
leaders (exogenously selected) the gender difference persists. This is consistent with the
general finding in the investment decision but different from Gneezy et al.’s (2009)
observation of no gender difference in the individual risk decision in both the matrilineal
Khasi and the patriarchal Maasai. Third, on the difference between individual and group
decisions we find that patriarchal subjects (men and women) are significantly more risk
averse in group choices than they are individually; but similar could not be established for
matrilineal subjects. Finally, we find that an ethnicity difference exists in risk attitude of the
subjects from these two ethnicities with matrilineal subjects being more risk averse than the
patriarchal subjects in group as well as individual choices. We argue this might occur due to
higher exposure of Khasi subjects to economic and environmental shocks.
71
Biblography Adhikari, B., & Lovett, J. C. (2006). Institutions and collective action: does heterogeneity
matter in community-based resource management?. The Journal of Development
Studies, 42(03), 426-445.
Agarwal, B. (2001). Participatory exclusions, community forestry, and gender: An analysis
for South Asia and a conceptual framework. World development,29(10), 1623-1648.
Andersen, S., Bulte, E., Gneezy, U., & List, J. A. (2008). Do women supply more public
goods than men? Preliminary experimental evidence from matrilineal and patriarchal
societies. The American Economic Review, 376-381.
Andersen, S., Ertac, S., Gneezy, U., List, J. A., & Maximiano, S. (2013). Gender,
Competitiveness, and Socialization at a Young Age: Evidence From a Matrilineal and
a Patriarchal Society. Review of Economics and Statistics,95(4), 1438-1443.
Anderson, S. (2003). Why Dowry Payments Declined with Modernization in Europe but Are
Rising in India. Journal of Political Economy, 111(2).
Arbak, E., & Villeval, M. C. (2013). Voluntary leadership: motivation and influence. Social
Choice and Welfare, 40(3), 635-662.
Asiedu, E., & Ibanez, M. (2014). The weaker sex? Gender differences in punishment across
matrilineal and patriarchal socienties (No. 30). GlobalFood Discussion Papers.
Balafoutas, L., & Nikiforakis, N. (2012). Norm enforcement in the city: a natural field
experiment. European Economic Review, 56(8), 1773-1785.
Bamrud, J and Calderon, G., 2012. Latin America: Few Female CEOs. Latin Business
Chronicle (March 8, 2012)
Banerji, A., Mahtani, S., Sealy, R., Vinnicombe, A.; Standard Chartered Bank: Women on
Corporate Boards in India 2010 (UK: Cranfield School of Management, 2010), in
http://www.communitybusiness.org/images/cb/publications/2010/WOB_India.
Barber, B. M., & Odean, T. (2001). Boys will be boys: Gender, overconfidence, and common
stock investment. The Quarterly Journal of Economics, 116(1), 261-292.
Barham, J., & Chitemi, C. (2009). Collective action initiatives to improve marketing
performance: Lessons from farmer groups in Tanzania. Food Policy,34(1), 53-59.
Barsky, R. B., Juster, F. T., Kimball, M. S., & Shapiro, M. D. (1997). Preference parameters
and behavioral heterogeneity: An experimental approach in the health and retirement
study. The Quarterly Journal of Economics, 112(2), 537-579.
Bass, B. M. (1985). Lead ership and performance beyond expectations. New York: Free
Press.
Basu, K. (2006). Gender and Say: a Model of Household Behaviour with Endogenously
Determined Balance of Power. The Economic Journal,116(511), 558-580.
Bernard, T., & Spielman, D. J. (2009). Reaching the rural poor through rural producer
organizations? A study of agricultural marketing cooperatives in Ethiopia. Food
Policy, 34(1), 60-69.
Bianchi, T. (2002). Leaders and intermediaries as economic development agents in producer’s
associations’. Group behavior and development: Is the market destroying cooperation,
105-124.
72
Blackden, C.M. and C. Bhanu (1999). Gender, Growth, and Poverty Reduction: Special
Program of Assistance for Africa, 1998 Status Report on Poverty in Sub-Saharan
Africa’, World Bank Technical Paper, Washington DC: World Bank.
Bloch, F., & Rao, V. (2002). Terror as a bargaining instrument: A case study of dowry
violence in rural India. American Economic Review, 1029-1043.
Bolton, G. E., & Ockenfels, A. (2010). Betrayal aversion: Evidence from brazil, china, oman,
switzerland, turkey, and the united states: Comment. The American Economic
Review, 628-633.
Bosman, R., & Van Winden, F. (2002). EMOTIONAL HAZARD IN A POWER‐TO‐TAKE
EXPERIMENT. The Economic Journal, 112(476), 147-169.
Bowles, H. R., Babcock, L., & Lai, L. (2007). Social incentives for gender differences in the
propensity to initiate negotiations: Sometimes it does hurt to ask. Organizational
Behavior and Human Decision Processes, 103(1), 84-103.
Bradley, K., & Khor, D. (1993). Toward an integration of theory and research on the status of
women. Gender & Society, 7(3), 347-378.
Brandts, J., & Cooper, D. J. (2006). A change would do you good.... An experimental study
on how to overcome coordination failure in organizations.The American Economic
Review, 669-693.
Brandts, J., & Cooper, D. J. (2007). IT'S WHAT YOU SAY, NOT WHAT YOU PAY: AN
EXPERIMENTAL STUDY OF MANAGER‐EMPLOYEE RELATIONSHIPS IN
OVERCOMING COORDINATION FAILURE. Journal of the European Economic
Association, 5(6), 1223-1268.
Browning, M.,& Chiappori, P.-A. (1998). Efficient intra-household allocation: a
characterisation and tests. Econometrica, 66(6), 1241–1278.
Bruttel, L., & Fischbacher, U. (2013). Taking the initiative. What characterizes
leaders?. European Economic Review, 64, 147-168.
Camerer, C. and M. Weber (1992). Recent developments in Modeling Preferences:
Uncertainty and Ambiguity. Journal of Risk and Uncertainty, 5 (4), pp. 325-370.
Carpenter, J. P. (2007). Punishing free-riders: How group size affects mutual monitoring and
the provision of public goods. Games and Economic Behavior,60(1), 31-51.
Catalyst Census, 2011 : FORTUNE 500. Women Board Directors. , pp.2010–2011.
Catalyst. Women on Boards. New York: Catalyst, 2012.
http://www.catalyst.org/publication/433/women-on-boards
Cepeda E. L., & Baron, J. (2012). Educational segregation and the gender wage gap for recent
college graduates in Colombia.
Chakravarty, S., Harrison, G. W., Haruvy, E. E., & Rutström, E. E. (2011). Are You Risk
Averse over Other People's Money?. Southern Economic Journal,77(4), 901-913.
Charness, G., & Gneezy, U. (2012). Strong evidence for gender differences in risk
taking. Journal of Economic Behavior & Organization, 83(1), 50-58.
Charness, G., & Viceisza, A. (2012). Comprehension and risk elicitation in the field:
Evidence from rural Senegal. mimeo.
73
Chattopadhyay, R., & Duflo, E. (2004). Women as policy makers: Evidence from a
randomized policy experiment in India. Econometrica, 72(5), 1409-1443.
Chen, L. J., 2010, ‘Do Gender Quotas Influence Women's Representation and Policies?’, The
European Journal of Comparative Economics, vol. 7, no. 1, pp. 13-60
Chiappori, P. A. (1988). Rational household labor supply. Econometrica: Journal of the
Econometric Society, 63-90.
Chiappori, P. A. (1992). Collective labor supply and welfare. Journal of political
Economy, 100(3), 437.
Chiappori, P. A., Fortin, B., & Lacroix, G. (2002). Marriage market, divorce legislation, and
household labor supply. Journal of political Economy, 110(1), 37-72.
Chowdury, S. (2006). Access to a telephone and factor market participation of rural
households in Bangladesh. Journal of Agricultural Economics, 57(3), 563–576.
Clark, K., & Sefton, M. (2001). Repetition and signalling: experimental evidence from games
with efficient equilibria. Economics Letters, 70(3), 357-362.
Corporae Women Directors International. Women board Directors of the Latin Trade 100
companies: Key findings.
Croson, R., & Gneezy, U. (2009). Gender differences in preferences. Journal of Economic
literature, 448-474.
Dada, L. A.(2007), The African export industry: what happened and how can it be revived?,
Case Study on the Cameroonian cocoa sector. FAO, Agricultural Management,
Marketing and Finance, Working Document 215, Rome: FAO
Daruvala, D.(2007). Gender, risk and stereotypes. Journal of Risk and Uncertainty 35, 265–
283.
De Cremer, D., & van Knippenberg, D. (2005). Cooperation as a function of leader self-
sacrifice, trust, and identification. Leadership & Organization Development
Journal, 26(5), 355-369.
De Janvry, A., & Sadoulet, E. (2006). Making conditional cash transfer programs more
efficient: designing for maximum effect of the conditionality. The World Bank
Economic Review, 20(1), 1-29.
Doerr, U., Toman, O. M., & Schmidt, U. (2011). Overconfidence and risk management of
Ethiopian farmers. Working paper.
Duflo, E. & Udry, C. (2004). Intrahousehold resource allocation in Cote d’Ivoire: Social
norms, separate accounts and consumption choices. NBER working papers no. 10498.
National Bureau of Economic Research, Inc.
Duflo, E. (2011). Women’s empowerment and economic development (No. w17702).
National Bureau of Economic Research.
Duflo, E., & Topalova, P. (2004). Unappreciated Service: Performance, Perceptions, and
Women: Leaders in India. Massachusetts institute of technology (MIT). Department of
economics.
Duguma, B., Gockowski, J., Bakala, J.(2001). Smallholder cacao (Theobroma cacao Linn.)
cultivation in agroforestry systems of west and central Africa: challenges and
opportunities. Agroforest. Syst. 51, 177–188.
74
Dweck, C. S. (2000). Self-theories: Their role in motivation, personality, and development.
Psychology Press.
Eagly, A. H., & Johnson, B. T. (1990). Gender and leadership style: A meta-
analysis. Psychological bulletin, 108(2), 233.
Eagly, A. H., & Karau, S. J. (2002). Role congruity theory of prejudice toward female
leaders. Psychological Review, 109, 573–598.
Eagly, A. H., Makhijani, M. G., & Klonsky, B. G. (1992). Gender and the evaluation of
leaders: A meta-analysis. Psychological bulletin, 111(1), 3.
Eckel, C. C., & Grossman, P. J. (2002). Sex differences and statistical stereotyping in
attitudes toward financial risk. Evolution and Human Behavior,23(4), 281-295.
Eckel, C. C., & Grossman, P. J. (2008). Men, women and risk aversion: Experimental
evidence. Handbook of experimental economics results, 1(7), 1061-73.
Eckel, Catherine C. and and Philip J. Grossman, 2002, “Sex differences and statistical
stereotyping in attitudes towards financial risk,” Evolution and Human Behavior 23:281-
295.
Ellsberg, D. (1961). Risk, Ambiguity and the Savage Axioms,’ Quarterly Journal of
Economics, 75, pp. 643-669.
Ertac, S., & Gurdal, M. Y. (2012). Deciding to decide: Gender, leadership and risk-taking in
groups. Journal of Economic Behavior & Organization, 83(1), 24-30.
Fafchamps, M., & Quisumbing, A. R. (2002). Control and ownership of assets within rural
Ethiopian households. Journal of Development Studies, 38(6), 47-82.
FAO. (2011). Women in agriculture: Closing the gender gap for development. Rome: Food
and Agriculture Organization.
Fehr, E., & Fischbacher, U. (2004). Third-party punishment and social norms.Evolution and
human behavior, 25(2), 63-87.
Fehr, E., & Gächter, S. (2002). Altruistic punishment in humans. Nature,415(6868), 137-140.
Fletschner, D. (2009). Rural women’s access to credit: market imperfections and
intrahousehold dynamics. World Development, 37(3), 618-631.
Fletschner, D., & Mesbah, D. (2011). Gender Disparity in Access to Information: Do Spouses
Share What They Know?. World Development, 39(8), 1422-1433.
Fox, C. R., & Tversky, A. (1995). Ambiguity aversion and comparative ignorance. The
quarterly journal of economics, 110(3), 585-603..
Fox, C. R., & Weber, M. (2002). Ambiguity aversion, comparative ignorance, and decision
context. Organizational Behavior and Human Decision Processes,88(1), 476-498.
Galarza, F. (2009). Choices under risk in rural Peru. Munich Personal RePec Archive
Working Paper 17708, Munich.
Gertler, P. (2004). Do conditional cash transfers improve child health? Evidence from
PROGRESA's control randomized experiment. American economic review, 336-341.
Glöckner, A., Irlenbusch, B., Kube, S., Nicklisch, A., & Normann, H. T. (2011). Leading
With (Out) Sacrifice? A Public‐Goods Experiment With A Privileged
Player. Economic Inquiry, 49(2), 591-597.
75
Gloede, O., Menkhoff, L., & Waibel, H. (2013). Shocks, individual risk attitude, and
vulnerability to poverty among rural households in Thailand and Vietnam.World
Development.
Gneezy, U., Leonard, K. L., & List, J. A. (2009). Gender differences in competition: Evidence
from a matrilineal and a patriarchal society.Econometrica, 77(5), 1637-1664.
Gneezy, U., Niederle, M., & Rustichini, A. (2003). Performance in competitive environments:
Gender differences. The Quarterly Journal of Economics, 118(3), 1049-1074.
Gockowski, J, Mva, J, Oduwole, S & Nyemeck, BJ, (2008). Institutional Innovation in the
credit, input, and cocoa markets of West Africa. STCP (Sustainable Tree Crop
Program) Working Paper Series, Issue 8, International Institute of Tropical
Agriculture, Accra, Ghana.
Gockowski, J. (2008). Post-liberalization interlinkage in the credit and cocoa markets of West
Africa. Draft in progress. STCP-IITA. (Sustainable Tree Crop Program – International
Institute of Tropical Agriculture), Accra, Ghana.
Gong, B., & Yang, C. L. (2012). Gender differences in risk attitudes: Field experiments on
the matrilineal Mosuo and the patriarchal Yi. Journal of Economic Behavior &
Organization, 83(1), 59-65.
Gong, B., Yan, H., & Yang, C. L. (2010). Gender Differences in the Dictator Experiment:
Evidence from the Matrilineal Mosuo and the Patriarchal Yi.Available at SSRN
1655689.
Guiso, L., & Paiella, M. (2008). Risk aversion, wealth, and background risk.Journal of the
European Economic association, 6(6), 1109-1150.
Gurerk, O., Irlenbusch, B., Rockenbach, B., (2006). The competitive advantage of sanctioning
institutions. Science 312, 108–111.
Güth, W., Levati, M. V., Sutter, M., & Van Der Heijden, E. (2007). Leading by example with
and without exclusion power in voluntary contribution experiments. Journal of Public
Economics, 91(5), 1023-1042.
Haigner, S. D., & Wakolbinger, F. (2010). To lead or not to lead: Endogenous sequencing in
public goods games. Economics Letters, 108(1), 93-95.
Harrison, G. W., Lau, M. I., Rutström, E. E., & Tarazona-Gómez, M. (2013). Preferences
over social risk. Oxford Economic Papers, 65(1), 25-46.
Hashemi, S. M., Schuler, S. R., & Riley, A. P. (1996). Rural credit programs and women's
empowerment in Bangladesh. World development, 24(4), 635-653.
Heath, C., & Tversky, A. (1991). Preference and belief: Ambiguity and competence in choice
under uncertainty. Journal of risk and uncertainty, 4(1), 5-28.
Henrich, J., R. McElreath, A. Barr, J. Ensminger, C. Barrett, A. Bolyanatz, J. C.,Cardenas, M.
Gurven, E. Gwako, N. Henrich, et al. 2006. “Costly punishment across human
societies.” Science, 312(5781): 1767–1770.
Hermalin, B. E. (1998). Toward an economic theory of leadership: Leading by
example. American Economic Review, 1188-1206.
Hurwitz, M. S., & Lanier, D. N. (2008). Diversity in state and federal appellate courts:
Change and continuity across 20 years. Justice System Journal, 29(1), 47-70.
76
Ibanez, M., & Schaffland, E. (2013). The Effect of Outside Leaders on the Performance of the
Organization: An Experiment (No. 149). Courant Research Centre: Poverty, Equity
and Growth-Discussion Papers.
Ibanez, M., Czermak, S., & Sutter, M. (2009). Searching for a better deal–On the influence of
group decision making, time pressure and gender on search behavior. Journal of
Economic Psychology, 30(1), 1-10.
Jianakoplos, N. A., & Bernasek, A. (1998). Are women more risk averse?.Economic
inquiry, 36(4), 620-630.
Jones, C. (1983). The mobilization of women's labor for cash crop production: A game
theoretic approach. American Journal of Agricultural Economics, 65(5), 1049-1054.
Kabeer, N. (2001). Resources, Agency, Achievements: Reflections on the Measurement of
Women's Empowerment. in Discussing Women's Empowerment - Theory and
Practice, ed. A. Sisask, Sida Studies No. 3, Swedish International Development
Agency, Stockholm, pp. 17-59.
Kabeer, N., 1994. Reversed Realities: Gender Hierarchies in Development Thought. Verso,
London.
Kenworthy, L. (1997). Civic engagement, social capital, and economic
cooperation. American Behavioral Scientist, 40(5), 645-656.
Kherallah, M., Delgado, C. L., Gabre-Madhin, E. Z., Minot, N., & Johnson, M.
(2002). Reforming agricultural markets in Africa (No. 38). International Food Policy
Research Institute (IFPRI).
Klasen, S. (1998). Marriage, bargaining, and intrahousehold resource allocation: Excess
female mortality among adults during early German development, 1740–1860. The
Journal of Economic History, 58(02), 432-467.
Kodama, Y. (2007). New role of cooperatives in Ethiopia: the case of Ethiopian coffee
farmers cooperatives. African study monographs. Supplementary issue.,35, 87-108.
Kray, L. J., Galinsky, A.,& Thompson, L. (2002). Reversing the gender gap in negotiations:
An exploration of stereotype regeneration. Organizational Behavior and Human
Decision Processes, 87, 386-410.
Kray, L. J., Thompson, L., & Galinsky, A. (2001). Battle of the sexes: Gender stereotype
confirmation and reactance in negotiations. Journal of Personality and Social
Psychology, 80, 942-958.
Kumase, W. A. N., Bisseleua, H., & Klasen, S. (2010). Opportunities and constraints in
agriculture: A gendered analysis of cocoa production in Southern Cameroon (No. 27).
Courant Research Centre: Poverty, Equity and Growth-Discussion Papers.
Lammers, J., Lau, M., & Verbon, H. (2006, June). Perceived HIV-contamination risk, risk
aversion and time preferences (A Laboratory Experiment in South Africa).
In Conference paper.
Leonetti, D. L., Nath, D. C., Hemam, N.S., Neill, D. B., (2004), ‘Do women really need
marital partners for support of their reproductive success? the case of the matrilineal
khasi of n. e. india, in Michael Alvard (ed.) Socioeconomic Aspects of Human
Behavioral Ecology (Research in Economic Anthropology, Volume 23), Emerald
Group Publishing Limited, pp.151-174.
77
Levati, M. V., Sutter, M., & Van der Heijden, E. (2007). Leading by example in a public
goods experiment with heterogeneity and incomplete information.Journal of Conflict
Resolution, 51(5), 793-818.
Lin, E. S. (2010). Gender wage gaps by college major in Taiwan: Empirical evidence from
the 1997-2003 Manpower Utilization Survey. Economics of Education Review 29, 156-
164.
Machin, S. and P. A. Puhani (2003). Subject of degree and the gender wage gap differential:
Evidence from the UK and Germany. Economic Letters 79, 393-400.
Malhotra, A., & Mather, M. (1997, December). Do schooling and work empower women in
developing countries? Gender and domestic decisions in Sri Lanka. InSociological
Forum (Vol. 12, No. 4, pp. 599-630). Kluwer Academic Publishers-Plenum
Publishers.
Malhotra, A., & Schuler, S. R. (2005). Women’s empowerment as a variable in international
development. Measuring empowerment: Cross-disciplinary perspectives, 71-88.
Manser, M., & Brown, M. (1980). Marriage and household decision making: A bargaining
Analysis. International Economic Review, 21(1), 31–44.
Mason, K. O. (1986, March). The status of women: Conceptual and methodological issues in
demographic studies. In Sociological Forum (Vol. 1, No. 2, pp. 284-300). Kluwer
Academic Publishers.
McElroy, M. B. (1990). The empirical content of Nash bargained household behavior. Journal
of Human Resources, 25(4), 559–583.
McElroy, M., & Horney M. (1981). Nash-bargained decisions: Towards a generalization of
the theory of demand. International Economic Review, 22, 333–349.
Meidinger, C., Rullière, J. L., & Villeval, M. C. (2003). Does team-based compensation give
rise to problems when agents vary in their ability?.Experimental Economics, 6(3),
253-272.
Mobius, M. M., M. Niederle, P. Niehaus, and T. S. Rosenblat. (2011). Managing self-
confidence: Theory and experimental evidence. National Bureau of Economic
Research.
Moser, C. (2012). Gender planning and development: Theory, practice and training.
Routledge.
Moxnes, E., & Van der Heijden, E. (2003). The effect of leadership in a public bad
experiment. Journal of Conflict Resolution, 47(6), 773-795.
Narrod, C., Roy, D., Okello, J., Avendaño, B., & Rich, K. (2007). The role of public-private
partnerships and collective action in ensuring smallholder participation in high value
fruit and vegetable supply chains (No. 70). International Food Policy Research
Institute (IFPRI).
Ngimwa, P., Ocholla, D. N., & Ojiambo, J. (1997). Media accessibility and utilization by
Kenyan rural women. The International Information & Library Review, 29(1), 45-66.
Niederle, M., & Vesterlund, L. (2007). Do women shy away from competition? Do men
compete too much? The Quarterly Journal of Economics, 122, 1067–1101.
Oxaal, Z., & Baden, S. (1997). Gender and empowerment: definitions, approaches and
implications for policy (No. 40). Bridge, Institute of Development Studies.
78
Pande, R. P. (2003). Selective gender differences in childhood nutrition and immunization in
rural India: the role of siblings. Demography, 40(3), 395-418.
Planning Commission of India. (2007a). Spatial development and regional imbalances. The
Eleventh Five Year Plan of India, pp. 137–151.
Planning Commission of India. (2007b). Environment and climate change, The Eleventh Five
Year Plan of India, pp. 191–207.
Potters, J., Sefton, M., & Vesterlund, L. (2005). After you—endogenous sequencing in
voluntary contribution games. Journal of Public Economics,89(8), 1399-1419.
Potters, J., Sefton, M., & Vesterlund, L. (2007). Leading-by-example and signaling in
voluntary contribution games: an experimental study. Economic Theory, 33(1), 169-
182.
Powell, M., & Ansic, D. (1997). Gender differences in risk behaviour in financial decision-
making: An experimental analysis. Journal of economic psychology,18(6), 605-628.
Quisumbing, A. R., & Pandolfelli, L. (2010). Promising approaches to address the needs of
poor female farmers: Resources, constraints, and interventions.World
Development, 38(4), 581-592.
Rao, N. (2005). Questioning Women's Solidarity: The Case of Land Rights, Santal Parganas,
Jharkhand, India. The Journal of Development Studies, 41(3), 353-375.
Ravindranath, N. H., Rao, S., Sharma, N., Nair, M., Gopalakrishnan, R., Rao, A. S., ... &
Bala, G. (2011). Climate change vulnerability profiles for North East India. Current
Science (Bangalore), 101(3), 384-394.
Rivas, M. F., & Sutter, M. (2011). The benefits of voluntary leadership in experimental public
goods games. Economics Letters, 112(2), 176-178.
Roberts, T. A., & Nolen-Hoeksema, S. (1989). Sex differences in reactions to evaluative
feedback. Sex Roles, 21(11-12), 725-747.
Rocheleau, Dianne and David Edmunds. 1997. ‘‘Women, Men, and Trees: Gender, Power,
and Property in Forest and Agrarian Landscapes.’’ World Development 25(8): 1351 –
71.
Rose, S., & Hartmann, H. I. (2004). Still a man's labor market: The long-term earnings gap.
Institute for Women's Policy Research.
Rowlands, J. (1995). Empowerment examined. Development in practice, 5(2), 101-107.
Roy, A., Murry, B. (2013). Gender disparity in Socio Demographic variables among the
Tribals of Eastern India: a case study of the Santals. International Journal of Human
Sciences. 10(1), 343-355.
Sadik, N. (1993). Education of girls. Integration (Tokyo, Japan), (36), 20.
Schubert, R., M. Brown, M. Gysler & H. W. Brachinger (1999) ‘Financial Decision-Making:
Are Women Really More Risk-Averse?,’ American Economic Review (Papers and
Proceedings) 89 (2), 381-385.
Sen, A. (1990). Gender and Cooperative Conflicts, in Tinker, I.(ed.), Persistent Inequalities:
Women and World Development, Oxford University Press.
Sen, A. (1999). Development as freedom. New York. Sen, G. and Batliwala,
S.(2000)‘Empowering women for reproductive rights’, in.
79
Shupp, R. S., & Williams, A. W. (2008). Risk preference differentials of small groups and
individuals. The Economic Journal, 118(525), 258-283.
Sinja, J., L. Njoroge, H. Mbaya, H. Magara, E. Mwangi, I. Baltenweck, D. Romney, and A.
Omore. (2006). Milk Market Access for Smallholders: A Case of Informal Milk
Trader Groups in Kenya. CGIAR systemwide program on collective action and
property rights (CAPRi).
Stockbridge, M., Dorward, A., Kydd, J. (2003). Farmer Organizations for Market Access:
Learning from Success. Briefing Paper. Wye College, University of London, UK.
Sutter, M. (2009). Individual behavior and group membership: Comment. The American
Economic Review, 2247-2257.
Sutter, M., Kocher, M. G., Glatzle-Rutzler, D., & Trautmann, S. T. (2013). Impatience and
uncertainty: Experimental decisions predict adolescents' field behavior. The American
Economic Review, 103(1), 510-531.
Svaleryd, H. (2002). Female representation: Is it important for policy decisions?. Department
of Economics, Stockholm University.
Tefft, J. (2004). Mali’s white revolution: smallholder cotton from 1960 to 2003. 2020 Vision
Focus Brief, vol. 12. International Food Policy Research Institute, Washington, DC.
Thomas, D. (1997). Incomes, expenditures, and health outcomes: Evidence on intrahousehold
resource allocation. In L. Haddad, J. Hoddinott, & H. Alderman, Intrahousehold
resource allocation in developing countries (pp. 142–164). Baltimore: Johns Hopkins
University Press.
Thomas, S., & Welch, S. (1991). The impact of gender on activities and priorities of state
legislators. The Western Political Quarterly, 445-456.
Thorp, R., Stewart, F., & Heyer, A. (2005). When and how far is group formation a route out
of chronic poverty?. World Development, 33(6), 907-920.
Thorsen, D. (2002). ‘We Help our Husbands!’Negotiating the Household Budget in Rural
Burkina Faso. Development and Change, 33(1), 129-146.
Torres-Spelliscy, C., Chase, M., & Greenman, E. (2008). Improving judicial diversity.
Brennan Center for Justice, New York University School of Law.
Tversky, A., D. Kahneman (1992). Advances in Prospect Theory: Cumulative
Representations of Uncertainty. Journal of Risk and Uncertainty, Vol. 5 (4), pp. 297-
323.
Udry, C. (1996). Gender, agricultural production, and the theory of the household. Journal of
political Economy, 1010-1046.
Udry, C., Hoddinott, J., Alderman, H., & Haddad, L. (1995). Gender differentials in farm
productivity: Implications for household efficiency and agricultural policy. Food
Policy, 20(5), 407–423.
Van der Heijden, K., Bradfield, R., Burt, G., Cairns, G., & Wright, G. (2009).The sixth sense:
Accelerating organizational learning with scenarios. John Wiley & Sons.
VAN HAM, P. (2000): The Seven Sisters of India: Tribal Worlds Between Tibet and Burma.
Munich, London, and New York: Prestel Publishers.
Wakker, P. P. (2010). Prospect theory: For risk and ambiguity (Vol. 44). Cambridge:
Cambridge University Press.
80
World Bank (2011). Gender equality and development. World development report 2012.
Washington, DC: World Bank.
World Bank, FAO, and IFAD. (2009). Gender in agriculture sourcebook. Agriculture and
rural development series. Washington, DC: World Bank.
World Bank, FAO, and IFAD.(2009). Gender in agriculture sourcebook. Agriculture and rural
development series. Washington, DC: World Bank.
World Bank. (2001). Engendering development; through gender equality in rights, resources
and voice. World Bank policy research report. Washington, DC: World Bank.
Yesuf, M., & Bluffstone, R. A. (2009). Poverty, risk aversion, and path dependence in low-
income countries: Experimental evidence from Ethiopia. American Journal of
Agricultural Economics, 91(4), 1022-1037.
Zwarteveen, M. (1996). A plot of one’s own: Gender relations and irrigated land allocation
policies in Burkina Faso. Research report no. 10. Colombo, Sri Lanka: International
Irrigation Management Institute.
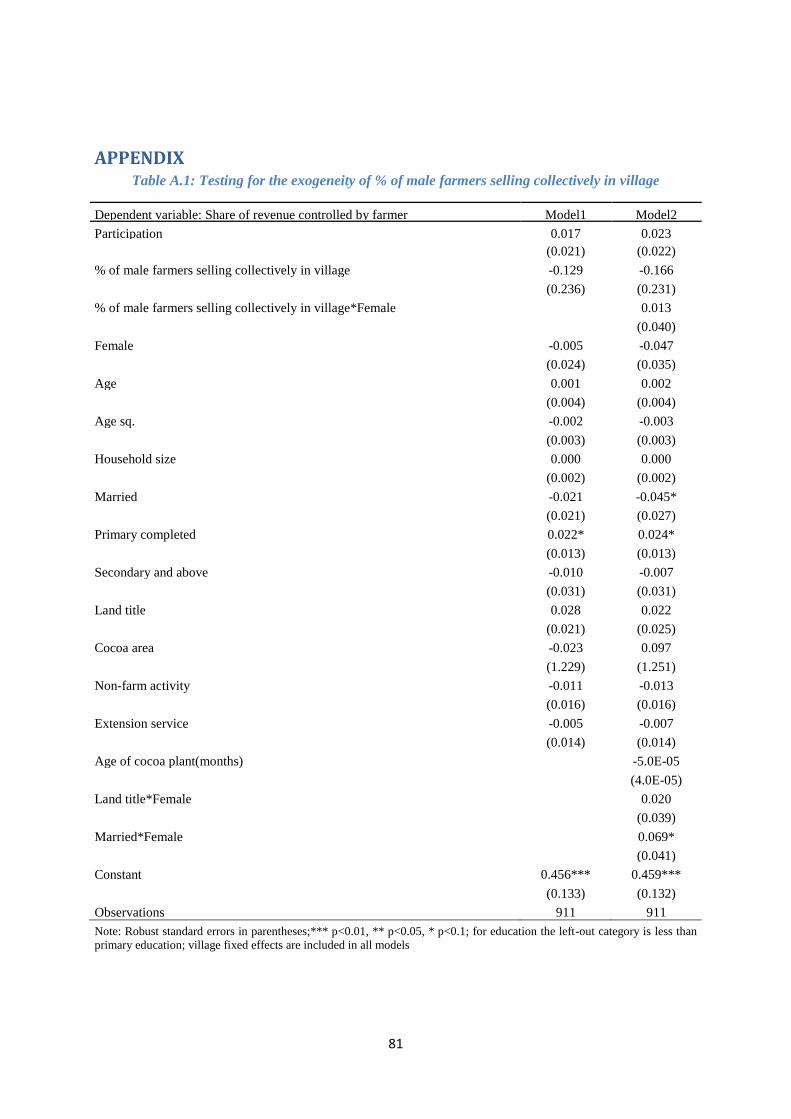
81
APPENDIX Table A.1: Testing for the exogeneity of % of male farmers selling collectively in village
Dependent variable: Share of revenue controlled by farmer Model1 Model2
Participation 0.017 0.023
(0.021) (0.022)
% of male farmers selling collectively in village -0.129 -0.166
(0.236) (0.231)
% of male farmers selling collectively in village*Female
0.013
(0.040)
Female -0.005 -0.047
(0.024) (0.035)
Age 0.001 0.002
(0.004) (0.004)
Age sq. -0.002 -0.003
(0.003) (0.003)
Household size 0.000 0.000
(0.002) (0.002)
Married -0.021 -0.045*
(0.021) (0.027)
Primary completed 0.022* 0.024*
(0.013) (0.013)
Secondary and above -0.010 -0.007
(0.031) (0.031)
Land title 0.028 0.022
(0.021) (0.025)
Cocoa area -0.023 0.097
(1.229) (1.251)
Non-farm activity -0.011 -0.013
(0.016) (0.016)
Extension service -0.005 -0.007
(0.014) (0.014)
Age of cocoa plant(months)
-5.0E-05
(4.0E-05)
Land title*Female
0.020
(0.039)
Married*Female
0.069*
(0.041)
Constant 0.456*** 0.459***
(0.133) (0.132)
Observations 911 911
Note: Robust standard errors in parentheses;*** p<0.01, ** p<0.05, * p<0.1; for education the left-out category is less than
primary education; village fixed effects are included in all models
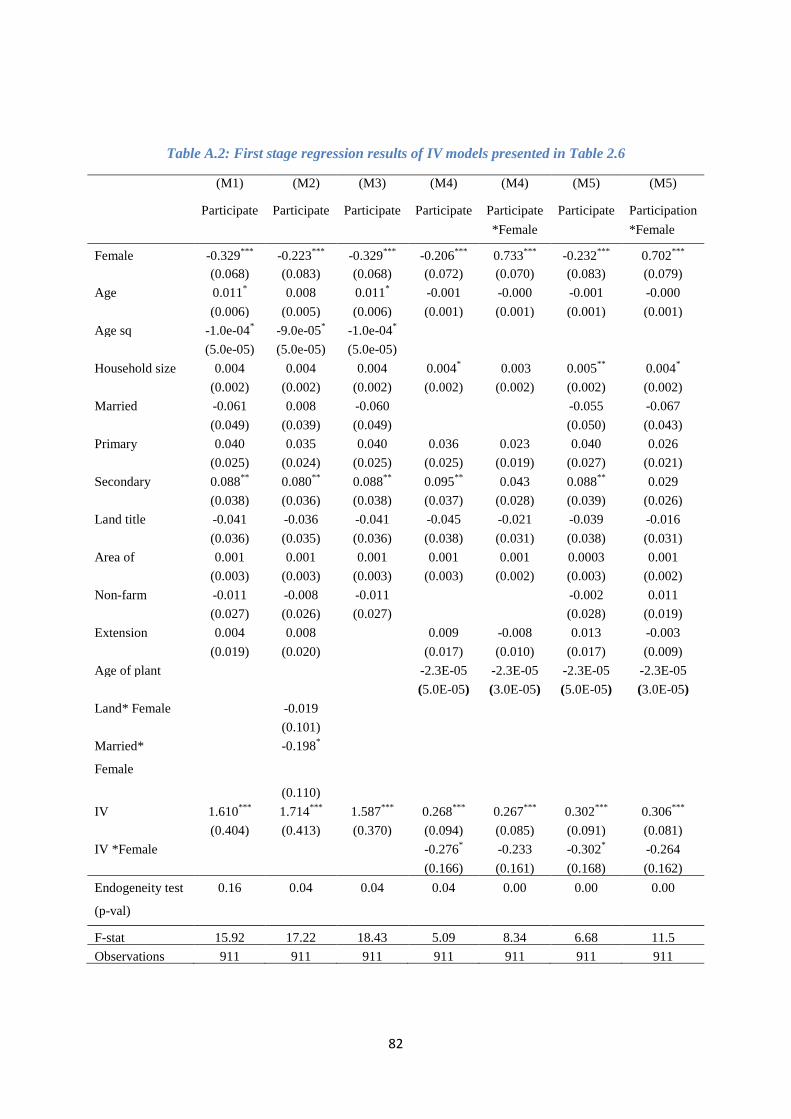
82
Table A.2: First stage regression results of IV models presented in Table 2.6
(M1) (M2) (M3) (M4) (M4) (M5) (M5)
Participate Participate Participate Participate Participate
*Female
Participate Participation
*Female
Female -0.329***
-0.223***
-0.329***
-0.206***
0.733***
-0.232***
0.702***
(0.068) (0.083) (0.068) (0.072) (0.070) (0.083) (0.079)
Age 0.011* 0.008 0.011
* -0.001 -0.000 -0.001 -0.000
(0.006) (0.005) (0.006) (0.001) (0.001) (0.001) (0.001)
Age sq -1.0e-04* -9.0e-05
* -1.0e-04
*
(5.0e-05) (5.0e-05) (5.0e-05)
Household size 0.004 0.004 0.004 0.004* 0.003 0.005
** 0.004
*
(0.002) (0.002) (0.002) (0.002) (0.002) (0.002) (0.002)
Married -0.061 0.008 -0.060 -0.055 -0.067
(0.049) (0.039) (0.049) (0.050) (0.043)
Primary
completed
0.040 0.035 0.040 0.036 0.023 0.040 0.026
(0.025) (0.024) (0.025) (0.025) (0.019) (0.027) (0.021)
Secondary
and above
0.088**
0.080**
0.088**
0.095**
0.043 0.088**
0.029
(0.038) (0.036) (0.038) (0.037) (0.028) (0.039) (0.026)
Land title -0.041 -0.036 -0.041 -0.045 -0.021 -0.039 -0.016
(0.036) (0.035) (0.036) (0.038) (0.031) (0.038) (0.031)
Area of
cocoa
0.001 0.001 0.001 0.001 0.001 0.0003 0.001
(0.003) (0.003) (0.003) (0.003) (0.002) (0.003) (0.002)
Non-farm
activity
-0.011 -0.008 -0.011 -0.002 0.011
(0.027) (0.026) (0.027) (0.028) (0.019)
Extension
service
0.004 0.008 0.009 -0.008 0.013 -0.003
(0.019) (0.020) (0.017) (0.010) (0.017) (0.009)
Age of plant
(months)
-2.3E-05 -2.3E-05 -2.3E-05 -2.3E-05
(5.0E-05) (3.0E-05) (5.0E-05) (3.0E-05)
Land* Female -0.019
(0.101)
Married*
Female
-0.198*
(0.110)
IV 1.610***
1.714***
1.587***
0.268***
0.267***
0.302***
0.306***
(0.404) (0.413) (0.370) (0.094) (0.085) (0.091) (0.081)
IV *Female -0.276* -0.233 -0.302
* -0.264
(0.166) (0.161) (0.168) (0.162)
Endogeneity test
(p-val)
0.16 0.04 0.04 0.04 0.00 0.00 0.00
F-stat 15.92 17.22 18.43 5.09 8.34 6.68 11.5
Observations 911 911 911 911 911 911 911
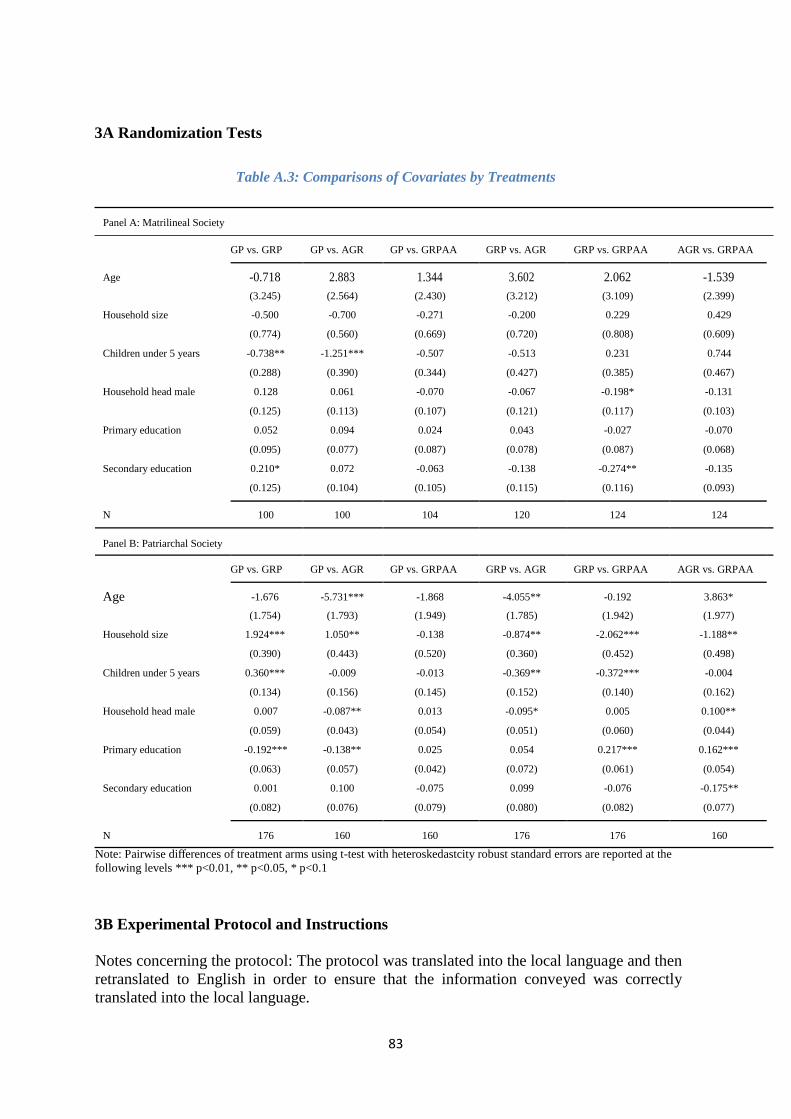
83
3A Randomization Tests
Table A.3: Comparisons of Covariates by Treatments
Panel A: Matrilineal Society
GP vs. GRP GP vs. AGR GP vs. GRPAA GRP vs. AGR GRP vs. GRPAA AGR vs. GRPAA
Age -0.718 2.883 1.344 3.602 2.062 -1.539
(3.245) (2.564) (2.430) (3.212) (3.109) (2.399)
Household size -0.500 -0.700 -0.271 -0.200 0.229 0.429
(0.774) (0.560) (0.669) (0.720) (0.808) (0.609)
Children under 5 years -0.738** -1.251*** -0.507 -0.513 0.231 0.744
(0.288) (0.390) (0.344) (0.427) (0.385) (0.467)
Household head male 0.128 0.061 -0.070 -0.067 -0.198* -0.131
(0.125) (0.113) (0.107) (0.121) (0.117) (0.103)
Primary education 0.052 0.094 0.024 0.043 -0.027 -0.070
(0.095) (0.077) (0.087) (0.078) (0.087) (0.068)
Secondary education 0.210* 0.072 -0.063 -0.138 -0.274** -0.135
(0.125) (0.104) (0.105) (0.115) (0.116) (0.093)
N 100 100 104 120 124 124
Panel B: Patriarchal Society
GP vs. GRP GP vs. AGR GP vs. GRPAA GRP vs. AGR GRP vs. GRPAA AGR vs. GRPAA
Age
-1.676 -5.731*** -1.868 -4.055** -0.192 3.863*
(1.754) (1.793) (1.949) (1.785) (1.942) (1.977)
Household size 1.924*** 1.050** -0.138 -0.874** -2.062*** -1.188**
(0.390) (0.443) (0.520) (0.360) (0.452) (0.498)
Children under 5 years 0.360*** -0.009 -0.013 -0.369** -0.372*** -0.004
(0.134) (0.156) (0.145) (0.152) (0.140) (0.162)
Household head male 0.007 -0.087** 0.013 -0.095* 0.005 0.100**
(0.059) (0.043) (0.054) (0.051) (0.060) (0.044)
Primary education -0.192*** -0.138** 0.025 0.054 0.217*** 0.162***
(0.063) (0.057) (0.042) (0.072) (0.061) (0.054)
Secondary education 0.001 0.100 -0.075 0.099 -0.076 -0.175**
(0.082) (0.076) (0.079) (0.080) (0.082) (0.077)
N 176 160 160 176 176 160
Note: Pairwise differences of treatment arms using t-test with heteroskedastcity robust standard errors are reported at the
following levels *** p<0.01, ** p<0.05, * p<0.1
3B Experimental Protocol and Instructions
Notes concerning the protocol: The protocol was translated into the local language and then
retranslated to English in order to ensure that the information conveyed was correctly
translated into the local language.
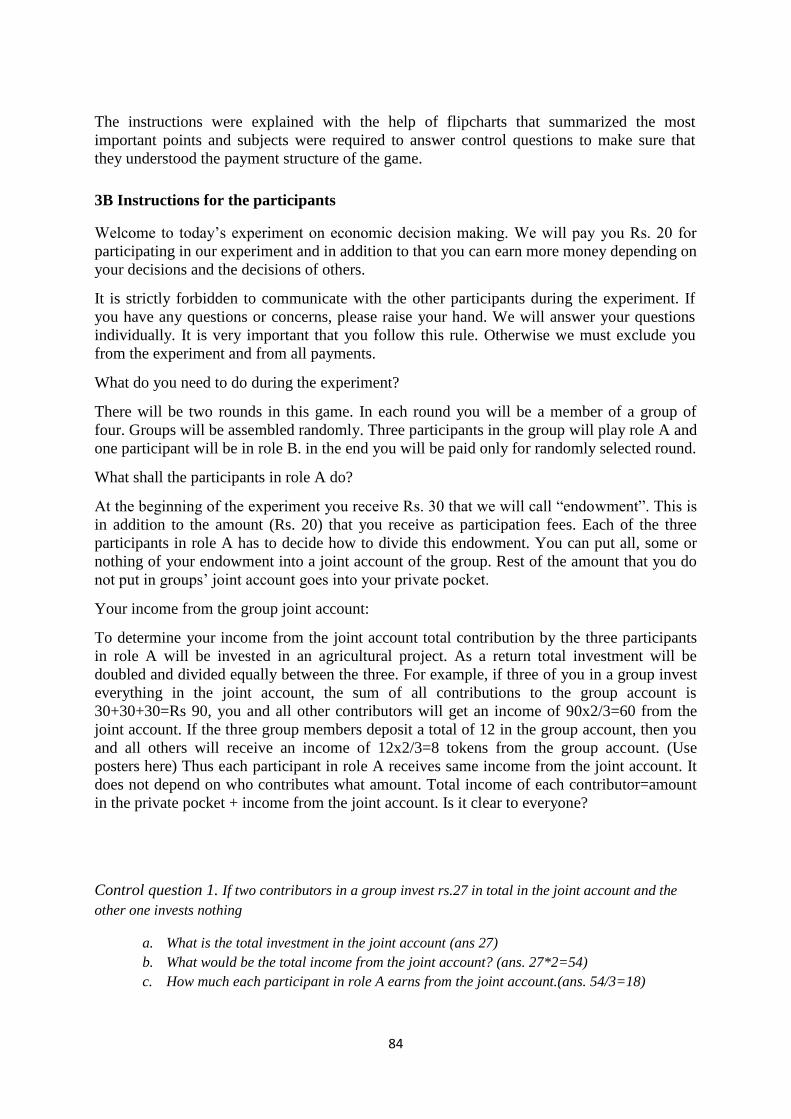
84
The instructions were explained with the help of flipcharts that summarized the most
important points and subjects were required to answer control questions to make sure that
they understood the payment structure of the game.
3B Instructions for the participants Welcome to today’s experiment on economic decision making. We will pay you Rs. 20 for
participating in our experiment and in addition to that you can earn more money depending on
your decisions and the decisions of others.
It is strictly forbidden to communicate with the other participants during the experiment. If
you have any questions or concerns, please raise your hand. We will answer your questions
individually. It is very important that you follow this rule. Otherwise we must exclude you
from the experiment and from all payments.
What do you need to do during the experiment?
There will be two rounds in this game. In each round you will be a member of a group of
four. Groups will be assembled randomly. Three participants in the group will play role A and
one participant will be in role B. in the end you will be paid only for randomly selected round.
What shall the participants in role A do?
At the beginning of the experiment you receive Rs. 30 that we will call “endowment”. This is
in addition to the amount (Rs. 20) that you receive as participation fees. Each of the three
participants in role A has to decide how to divide this endowment. You can put all, some or
nothing of your endowment into a joint account of the group. Rest of the amount that you do
not put in groups’ joint account goes into your private pocket.
Your income from the group joint account:
To determine your income from the joint account total contribution by the three participants
in role A will be invested in an agricultural project. As a return total investment will be
doubled and divided equally between the three. For example, if three of you in a group invest
everything in the joint account, the sum of all contributions to the group account is
30+30+30=Rs 90, you and all other contributors will get an income of 90x2/3=60 from the
joint account. If the three group members deposit a total of 12 in the group account, then you
and all others will receive an income of 12x2/3=8 tokens from the group account. (Use
posters here) Thus each participant in role A receives same income from the joint account. It
does not depend on who contributes what amount. Total income of each contributor=amount
in the private pocket + income from the joint account. Is it clear to everyone?
Control question 1. If two contributors in a group invest rs.27 in total in the joint account and the
other one invests nothing
a. What is the total investment in the joint account (ans 27)
b. What would be the total income from the joint account? (ans. 27*2=54)
c. How much each participant in role A earns from the joint account.(ans. 54/3=18)
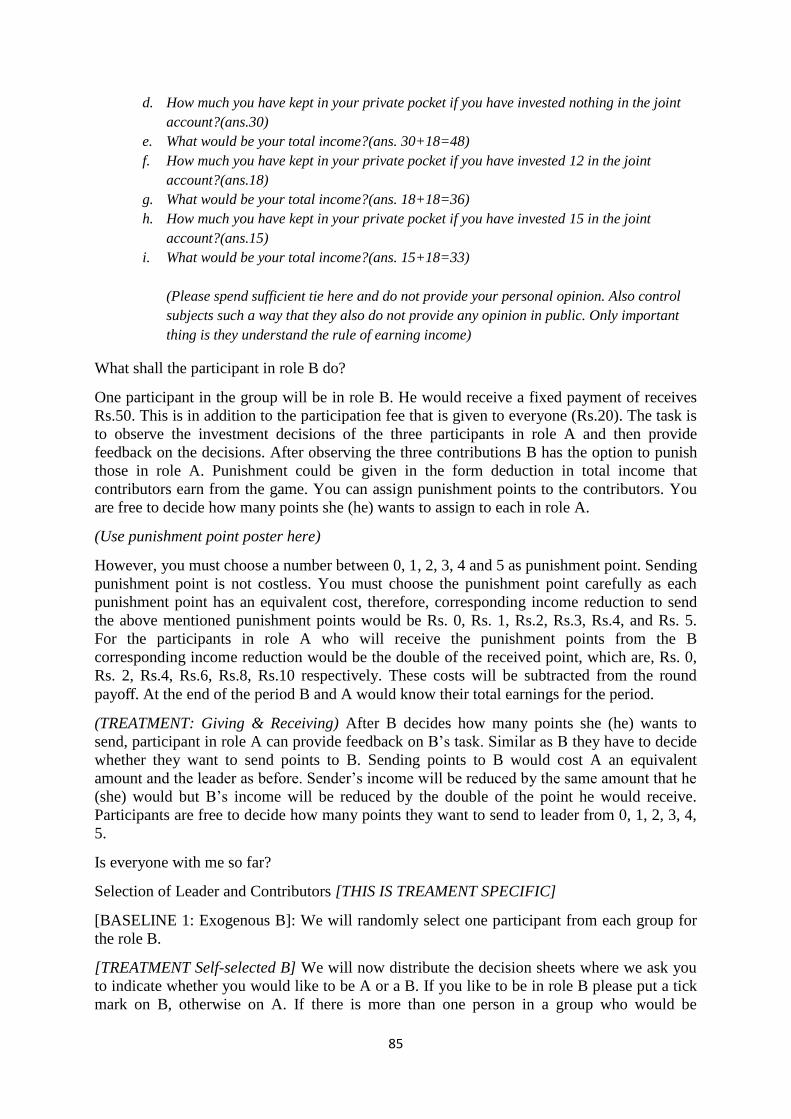
85
d. How much you have kept in your private pocket if you have invested nothing in the joint
account?(ans.30)
e. What would be your total income?(ans. 30+18=48)
f. How much you have kept in your private pocket if you have invested 12 in the joint
account?(ans.18)
g. What would be your total income?(ans. 18+18=36)
h. How much you have kept in your private pocket if you have invested 15 in the joint
account?(ans.15)
i. What would be your total income?(ans. 15+18=33)
(Please spend sufficient tie here and do not provide your personal opinion. Also control
subjects such a way that they also do not provide any opinion in public. Only important
thing is they understand the rule of earning income)
What shall the participant in role B do?
One participant in the group will be in role B. He would receive a fixed payment of receives
Rs.50. This is in addition to the participation fee that is given to everyone (Rs.20). The task is
to observe the investment decisions of the three participants in role A and then provide
feedback on the decisions. After observing the three contributions B has the option to punish
those in role A. Punishment could be given in the form deduction in total income that
contributors earn from the game. You can assign punishment points to the contributors. You
are free to decide how many points she (he) wants to assign to each in role A.
(Use punishment point poster here)
However, you must choose a number between 0, 1, 2, 3, 4 and 5 as punishment point. Sending
punishment point is not costless. You must choose the punishment point carefully as each
punishment point has an equivalent cost, therefore, corresponding income reduction to send
the above mentioned punishment points would be Rs. 0, Rs. 1, Rs.2, Rs.3, Rs.4, and Rs. 5.
For the participants in role A who will receive the punishment points from the B
corresponding income reduction would be the double of the received point, which are, Rs. 0,
Rs. 2, Rs.4, Rs.6, Rs.8, Rs.10 respectively. These costs will be subtracted from the round
payoff. At the end of the period B and A would know their total earnings for the period.
(TREATMENT: Giving & Receiving) After B decides how many points she (he) wants to
send, participant in role A can provide feedback on B’s task. Similar as B they have to decide
whether they want to send points to B. Sending points to B would cost A an equivalent
amount and the leader as before. Sender’s income will be reduced by the same amount that he
(she) would but B’s income will be reduced by the double of the point he would receive.
Participants are free to decide how many points they want to send to leader from 0, 1, 2, 3, 4,
5.
Is everyone with me so far?
Selection of Leader and Contributors [THIS IS TREAMENT SPECIFIC]
[BASELINE 1: Exogenous B]: We will randomly select one participant from each group for
the role B.
[TREATMENT Self-selected B] We will now distribute the decision sheets where we ask you
to indicate whether you would like to be A or a B. If you like to be in role B please put a tick
mark on B, otherwise on A. If there is more than one person in a group who would be

86
interested in playing the role B, one would be randomly selected into this role, while the
others will be assigned in the role B. If no one is interested in role B we will select one
participant from the group randomly for the role.
[TREATMENT Preferential treatment for female in role B]: Please indicate whether you
would like to take role A or role B. If there is a female participant in the group who is willing
to take up role B, she will be selected for the role. If there is more than one female candidate,
who volunteers for the role, we will select one randomly. If no female candidates volunteers
we select one of the willing male candidates randomly; while the others will be assigned in
role A. If no one is interested in role B we will select one participant from the group
randomly.
(TREATMENT: Public): Once the candidates in role B are selected they will be introduced to
you all.
(Distribute Role Sheet1)
[IMPLEMENTATION] [Be Slow Here]
While it is decided who is selected as in role B, we would like to ask all of you to decide how
much you would like to contribute to the group joint account in case you are in role A. In
other words I am asking all of you to make your contribution decisions. Decisions of those
who will be selected I in role A will be taken into account. You will have 1 minute to take
your decisions after I ask you to start.
(Distribute Contribution Sheet2)
Your decisions are being registered; soon you will receive information on the decisions of
others in your group. While the information is being processed, we want to ask you to guess
how much the other three members would contribute on average to the group account. If your
guessed amount falls within a range of +/- Rs 5 of the actual contributions, for each such
guess you will receive Rs 5 as reward. Outside this range, however, there will be no reward.
You will have one minute to guess.
(Distribute the expectation sheet 3)
The paper that you will receive next explains if you have been selected in role A or B. Those
who will be selected as B will have the information on the contributions from the three A.
(Show the point poster again)
For A, the task is to guess how many points B would send. If you guess it correctly you will
receive Rs 5 as reward. For B the task is to provide the punishment pints for all A.
(Distribute Feedback Sheet 4&5)
You may now see your role.
[TREATMENT: Public]Participants in role B are now asked to raise their hands so that
everyone can see them.
While your decisions are being registered, let me explain the information that you will receive
next. Soon you will receive a paper like this one (show example), the paper summarizes the
results of the game so far. In the table it explains how much three A contributed individually
to the group account, and summarizes the punishment points from B to three A. For A, the
task is to observe the contributions in the game and corresponding points given by B. Then
each A has to decide how many punishment points he/she wants to send to B. Cost of

87
punishment given and received remains the same. You can send as many points to B as you
wish, but you should not exceed the range. Please register your decision in your decision
sheet. The task of B is to guess how many points he (she) will receive from the three as in the
group. If you guess it correctly you will receive Rs 5 as reward for each correct guess. 6&
(Distribute decision Sheet 7)
Thank you for participating in this round. You will receive information on total earning in the
game at the end of the experiment. Second Round Now we would like to repeat the game.
However, the conditions of the game will change slightly. So please listen carefully.
First we will form new groups with four participants. Similarly as before, within each group,
three participants will play role A and one participant will play role B.
A s will do exactly the same as in the previous round. Each A will receive Rs. 30 as
“endowment” and have to decide how to divide this endowment. You can put all, some or
none of your endowment into a joint account. The amount you do not deposit in the joint
account will automatically be transferred to your private pocket. The amount that you put in
the joint account gives a payment to you and to other persons in the group. Everybody
receives the same income from group account, independent of the amount invested. Similarly,
you will also earn an income from the tokens that the other group members put into the group
account. After making the contribution, participants in role B will observe and provide
feedback by sending points to each A. Cost of sending and receiving punishment points is
similar as it was in the first round. After B decides how many points he wants to send, A can
decide whether they want to send points to B. Thus the game remains the same and you play
the same game again in new group. We will now distribute the decision sheet. Please indicate
whether you would like to be in role A or B in four following alternative scenarios. In the first
scenario, participants in role B receive Rs. 30: In the second scenario, participants in role B
receive Rs. 50 In the third scenario, participants in role B receive Rs. 70 In the third scenario,
and participants in role B receive Rs. 90
If there is more than one person interested in role B, one would be randomly selected for this
role and we will implement the scenario which he/she would opt for role B. Others will be
assigned in role A. If no one is interested in role B we will select one participant from the
group and one scenario randomly. All other procedures are the same as in the previous round.
Please indicate your preferred role for the three scenarios.
(Distribute scenario sheet 8)
Continue with [IMPLEMENTATION]
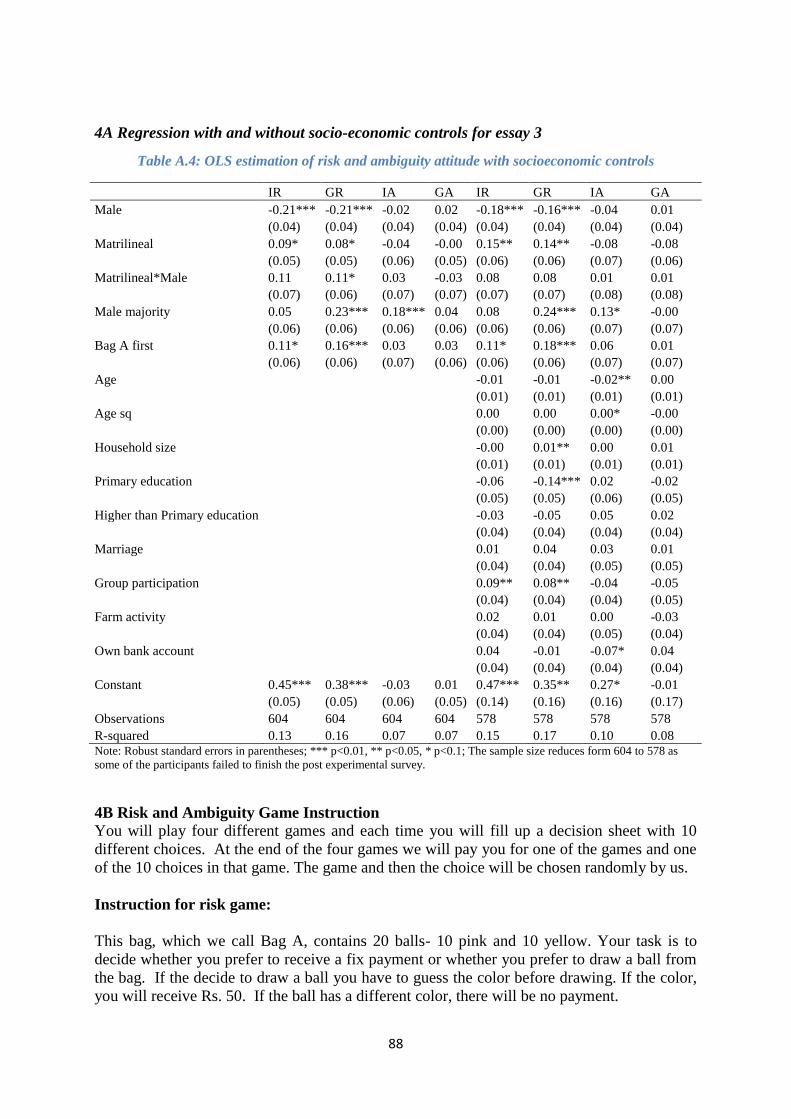
88
4A Regression with and without socio-economic controls for essay 3
Table A.4: OLS estimation of risk and ambiguity attitude with socioeconomic controls
IR GR IA GA IR GR IA GA
Male -0.21*** -0.21*** -0.02 0.02 -0.18*** -0.16*** -0.04 0.01
(0.04) (0.04) (0.04) (0.04) (0.04) (0.04) (0.04) (0.04)
Matrilineal 0.09* 0.08* -0.04 -0.00 0.15** 0.14** -0.08 -0.08
(0.05) (0.05) (0.06) (0.05) (0.06) (0.06) (0.07) (0.06)
Matrilineal*Male 0.11 0.11* 0.03 -0.03 0.08 0.08 0.01 0.01
(0.07) (0.06) (0.07) (0.07) (0.07) (0.07) (0.08) (0.08)
Male majority 0.05 0.23*** 0.18*** 0.04 0.08 0.24*** 0.13* -0.00
(0.06) (0.06) (0.06) (0.06) (0.06) (0.06) (0.07) (0.07)
Bag A first 0.11* 0.16*** 0.03 0.03 0.11* 0.18*** 0.06 0.01
(0.06) (0.06) (0.07) (0.06) (0.06) (0.06) (0.07) (0.07)
Age
-0.01 -0.01 -0.02** 0.00
(0.01) (0.01) (0.01) (0.01)
Age sq
0.00 0.00 0.00* -0.00
(0.00) (0.00) (0.00) (0.00)
Household size
-0.00 0.01** 0.00 0.01
(0.01) (0.01) (0.01) (0.01)
Primary education
-0.06 -0.14*** 0.02 -0.02
(0.05) (0.05) (0.06) (0.05)
Higher than Primary education
-0.03 -0.05 0.05 0.02
(0.04) (0.04) (0.04) (0.04)
Marriage
0.01 0.04 0.03 0.01
(0.04) (0.04) (0.05) (0.05)
Group participation
0.09** 0.08** -0.04 -0.05
(0.04) (0.04) (0.04) (0.05)
Farm activity
0.02 0.01 0.00 -0.03
(0.04) (0.04) (0.05) (0.04)
Own bank account
0.04 -0.01 -0.07* 0.04
(0.04) (0.04) (0.04) (0.04)
Constant 0.45*** 0.38*** -0.03 0.01 0.47*** 0.35** 0.27* -0.01
(0.05) (0.05) (0.06) (0.05) (0.14) (0.16) (0.16) (0.17)
Observations 604 604 604 604 578 578 578 578
R-squared 0.13 0.16 0.07 0.07 0.15 0.17 0.10 0.08 Note: Robust standard errors in parentheses; *** p<0.01, ** p<0.05, * p<0.1; The sample size reduces form 604 to 578 as
some of the participants failed to finish the post experimental survey.
4B Risk and Ambiguity Game Instruction
You will play four different games and each time you will fill up a decision sheet with 10
different choices. At the end of the four games we will pay you for one of the games and one
of the 10 choices in that game. The game and then the choice will be chosen randomly by us.
Instruction for risk game:
This bag, which we call Bag A, contains 20 balls- 10 pink and 10 yellow. Your task is to
decide whether you prefer to receive a fix payment or whether you prefer to draw a ball from
the bag. If the decide to draw a ball you have to guess the color before drawing. If the color,
you will receive Rs. 50. If the ball has a different color, there will be no payment.
89
You will be asked to take this decision for different value of the fix payment 10 times. So
please pay attention while you are taking different decisions. If this game is chosen for
payment we will pay you for only one of them.
You would need to register your decision using a sheet like this one. If you prefer to receive
a fix payment, please mark the box on the right. If you prefer to draw a ball, please select the
box in the left. When you make the draw we will ask the color before the draw. If you say
pink and the ball you draw is also pink, you will gain the Rs. 50. However if the ball is yellow
I do not receive any payment.
Let´s look at the first decision. You can either choose to take Rs. 5 or to draw a ball from the
bag. If you prefer to draw a ball, please mark the box in the left. If you want the fix amount
mark the box in the right.
In the second decision you can either choose to take Rs. 10 or to draw a ball from the bag. If
you prefer to draw a ball, please mark the box in the left. If you want the fix amount mark the
box in right.
In the third decision you can either choose to take Rs. 15 or to draw a ball from the bag. If
you prefer to draw a ball, please mark the box in the left. If you want the fix amount mark the
box in the right.
In the fourth decision you can either choose to take Rs. 20 or to draw a ball from the bag. If
you prefer to draw a ball, please mark the box in the left. If you want the fix amount mark the
box in the right.
In the fifth decision you can either choose to take Rs. 25 or to draw a ball from the bag. If
you prefer to draw a ball, please mark the box in the left. If you want the fix amount mark the
box in the right.
In the sixth decision you can either choose to take Rs. 30 or to draw a ball from the bag If you
prefer to draw a ball, please mark the box in the left. If you want the fix amount mark the box
in the right.
In the seventh decision you can either choose to take Rs. 35 or to draw a ball from the bag. If
you prefer to draw a ball, please mark the box in the left. If you want the fix amount mark the
box in the right.
In the eighth decision you can either choose to take Rs. 40 or to draw a ball from the bag. If
you prefer to draw a ball, please mark the box in the left. If you want the fix amount mark the
box in the right.
In the ninth decision you can either choose to take Rs. 45 or to draw a ball from the bag. If
you prefer to draw a ball, please mark the box in the left. If you want the fix amount mark the
box in the right.
In the tenth decision you can either choose to take Rs. 50 or to draw a ball from the bag. If
you prefer to draw a ball, please mark the box in the left. If you want the fix amount mark the
box in the right.

90
Now we would distribute the decision sheet. Please pay attention while making your
decisions. Please indicate your choice for each of the 10 options. If you need assistance raise
your hand we will come to you.
Now you will carry out the same task but this time you make the decision for your group. You
have to decide whether you prefer to a fix payment for each person in your group or drawing
of a ball from the bag that contains 10 pink balls and 10 yellow balls. If the ball that you
draw has the same color as the color you guessed before drawing, each person in the group
will receive Rs. 50. If the ball is yellow nobody will receive payment.
If this game is chosen for payment, we will select one member from each group and select
one of the 10 choices randomly for payment. All persons in the group will receive same the
payment.
Similarly, as before you need to mark your decision using this decision sheet. If you prefer
the fix payment for all persons in your group please mark the right box. If you prefer to draw
a ball, please market in the right box.
Instruction for ambiguity game:
Consider this bag which we call bag B. In bag B there 20 balls- pink and yellow balls,
however, you will not know how many pink and how many yellow balls are there in the bag.
Only information you have now is that there are 20 balls. We again ask you to make your
choice between a fix amount and drawing of a ball. As before first you will make the decision
for yourself then on behalf of the group. Each time you will fill up a decision sheet with 10
options.
Repeat the individual game and then the group game
Thank you for participating in the game.
91
Curricula Vitae Debosree Banerjee
September, 2014
University of Göttingen,
GlobalFood Research Training Group
Heninrich-Düker-Weg 12, Room 0.224
37073, Germany
email: [email protected]
goettingen.de
Office Phone: +49-551-3920210
Mobile Phone: +49-176-30426545
RESEARCH FIELD: Development Economics, Experimental Economics.
PHD THESIS: Essays on Women’s Empowerment in Developing Countries
EDUCATION:
2011-2014: PhD in Economics, University of Göttingen, Germany.
2009-2011: MA in Economics, University of Tsukuba, Japan.
2005-2007: MPhil in Economics, Jawaharlal Nehru University New Delhi, India.
2003-2005: MA in Economics, Jawaharlal Nehru University New Delhi, India.
2000-2003: BSc in Economics, Calcutta University, Calcutta, India.
RESEARCH EXPERIENCE:
University of Tsukuba, Japan (M.A. Thesis): Investigating the Role of Women in Children’s
Human Capital Development: Evidence from India.
Jawaharlal Nehru University, India. (M.Phil. Thesis): Health Inputs, Health Outcomes and
Economic Performance: Evidence from Indian States.
WORKING PAPERS:
Banerjee, D., Klasen, S., Wollni, M (2014). Market Discrimination, Market Participation and
Control over Revenue: A Gendered Analysis of Cameroon's Cocoa Producers. GlobalFood
Discussion Paper Series No. 43. University of Göttingen.
Banerjee, D (2014). Ethnicity and Gender Differences in Risk, Ambiguity Attitude
GlobalFood Discussion Paper Series.No. 42. University of Göttingen.
WORK IN PROGRESS:
Banerjee, D., Ibanez, M., Reiner, G., Wollni, M (2014). Running for Leadership: Evidence
from an artefactual field experiment in matrilineal and patriarchal societies in India.
92
FIELD EXPERIENCE:
August, 2012-March, 2013: Conducted field experiments in West Bengal and Meghalaya,
India.
Collected primary data for the PhD projects: (1) Running for Leadership: Evidence
from an artefactual field experiment in matrilineal and patriarchal societies in India,
using public good game with 616 people (2) Ethnicity and Gender Differences in Risk,
Ambiguity Attitude, using Ellsberg game with 604 people.
April, 2006: Conducted field survey in Odissa, India for Voluntary Health Association, of
India (VHAI), New Delhi, India.
Collected primary data from PHCs and SSCs on various aspects of health financing
issue in Odissa for the project: Health expenditure and Health output.
SCHOLARSHIPS/ FUNDINGS
December, 2012-March, 2013: Field experiment fund and travel grant received from
University of Göttingen, GlobalFood Research Training Group.
August, 2012-November, 2012: Field experiment fund received from University of Göttingen,
GlobalFood Research Training Group.
August, 2012-November, 2012: Travel grand received from University of Göttingen,
International office for research stay in India.
April2009-March, 2011:Scholarship received from Joint Japan/World Bank Graduate
Scholarship Program for MA in Economics, University of Tsukuba, Japan.
2005-2007: Fellowship received from University Grant Commission for MPhil in Economics,
Jawaharlal Nehru University, India
CONFERENCE/PRESENTATION
2014: The 11th
Workshop on Social Economy for Young Economists, University of Bologna,
Italy. Paper presented: Ethnicity and Gender Differences in Risk, Ambiguity Attitude.
2014: GlobalFood Symposium, University of Göttingen, Germany, Paper presented: Market
discrimination, Market Participation and Control over Revenue: A Gendered Analysis of
Cameroon's Cocoa Producers.
2013: SEEDEC Conference, NHH Norwegian School of Economics, Norway, Paper
presented: Running for Leadership: Evidence from an artefactual field experiment in
matrilineal and patriarchal societies in India.
2013: IAFFE Conference, Stanford University, USA, Paper presented: Running for
Leadership: Evidence from an artefactual field experiment in matrilineal and patriarchal
societies in India.
2011: Knowledge Sharing Forum organized by World Bank Institute and World Bank Tokyo,
Ritsumeikan University, Tokyo, Japan. Paper presented: Investigating the Role of Women in
Children’s Human Capital Development: Evidence from India.
93
WORK EXPERIENCE
2011-onwardrs: Research Associate, GlobalFood Research Training Group, University of
Göttingen, Germany.
2008-2009: Research Associate, Indian Council for Research on International Economic
Relations (ICRIER), New Delhi, India.
2007: Research Associate, Voluntary Health Association of India, New Delhi, India.
2005-2006: Research Assistant, Rajeev Gandhi Foundation, New Delhi, India.
TECHNICAL SKILLS: STATA; Eviews