Embed Size (px)
Citation preview

Essays on Uniform Pricing and Vertical Contracts in Two-SidedMarkets
by
Andre Boik
A thesis submitted in conformity with the requirementsfor the degree of Doctor of PhilosophyGraduate Department of Economics
University of Toronto
Copyright c© 2014 by Andre Boik
Abstract
Essays on Uniform Pricing and Vertical Contracts in Two-Sided Markets
Andre Boik
Doctor of Philosophy
Graduate Department of Economics
University of Toronto
2014
This thesis is comprised of three chapters linked together by their economic analysis of
uniform pricing and vertical contracts in two-sided markets. Various forms of uniform pricing
and vertical contracts are present in the United States cable television market (Chapter 1),
markets involving online purchasing platforms (Chapter 2), and in markets for health insurance
(Chapter 3). These markets are common examples of two-sided markets since, for example,
local television stations connect advertisers and viewers, online platforms connect buyers and
sellers of various goods, and health insurers connect patients with medical providers. This thesis
studies the economic consequences of vertical contracts and uniform pricing practices, which can
arise through private contract or government regulation, in two-sided markets.
Chapter 1 examines how local television stations have responded to a regulation of the 1992
Cable Act mandating cable distributors offer consumers local content in the form of a bundle
with a single price. In this chapter, I show that this form of government-mandated uniform
pricing results in television stations setting their prices for content higher than they would
absent this regulation.
In collaboration with Kenneth Corts, Chapter 2 examines the pricing incentives of sellers
who reach potential buyers through platforms that may restrict sellers to offering a uniform price
across all platforms. This contractual restriction is commonly referred to as a “most-favored-
nation” clause. In this chapter, we show that platforms may find it privately profitable to adopt
such a contractual restriction, and that the result is higher fees charged by platforms to sellers.
ii

Chapter 3 studies the use of most-favored-nation clauses in markets for health insurance.
A health insurer may find it privately profitable to restrict its participating medical providers
from discounting their medical services to rival insurers, which amounts to uniform pricing of
medical services to insurers. In this chapter, I show that such uniform pricing may lead to lower
prices for health insurance as any discounts offered to one insurer must also be extended to all
other insurers.
iii

Acknowledgements
I am greatly indebted to my advisor Professor Kenneth Corts for his direction, encouragement,
and mentorship. His remarkable ability to isolate the core economics of difficult problems allowed
me to focus on what mattered and to stay on course throughout the production of this thesis.
I am also very grateful to Professor Mara Lederman who generously gave her time to steer
me through my first empirical project. I could not have had a better example to follow and the
lessons learned will serve me very well in the future.
I would also like to thank Joshua Gans, Avi Goldfarb, Philip Kornitzky, Robert McMillan,
Matthew Mitchell, Lisa Stockley, Junichi Suzuki, Hidenori Takahashi, and seminar participants
at the University of Toronto for many helpful comments and suggestions. I especially thank
Professor Rahul Deb for very constructive comments on all three chapters of this thesis, especially
Chapter 3.
Finally, I thank Professor Frank Mathewson for countless discussions which served as helpful
distractions from this thesis and which maintained my general interest in economics.
iv

Contents
1 Intermediaries in Two-Sided Markets: an Empirical Analysis of the U.S. Ca-
ble Television Industry 1
1.1 Introduction . . . . . . . . . . . . . . . . . . . . . . . . . . . . . . . . . . . . . . 1
1.2 Existing literature . . . . . . . . . . . . . . . . . . . . . . . . . . . . . . . . . . . 7
1.3 Industry background . . . . . . . . . . . . . . . . . . . . . . . . . . . . . . . . . 10
1.4 Theoretical predictions . . . . . . . . . . . . . . . . . . . . . . . . . . . . . . . . 14
1.4.1 Local ad market . . . . . . . . . . . . . . . . . . . . . . . . . . . . . . . . 15
1.4.2 Distributor market structure . . . . . . . . . . . . . . . . . . . . . . . . . 16
1.4.3 Retransmission fee setting . . . . . . . . . . . . . . . . . . . . . . . . . . 17
1.5 Empirical approach . . . . . . . . . . . . . . . . . . . . . . . . . . . . . . . . . . 23
1.5.1 The subscription market . . . . . . . . . . . . . . . . . . . . . . . . . . . 24
1.5.2 The advertising market . . . . . . . . . . . . . . . . . . . . . . . . . . . . 27
1.6 Data . . . . . . . . . . . . . . . . . . . . . . . . . . . . . . . . . . . . . . . . . . 28
1.6.1 Sources of data . . . . . . . . . . . . . . . . . . . . . . . . . . . . . . . . 28
1.6.2 Construction of the sample . . . . . . . . . . . . . . . . . . . . . . . . . . 28
1.6.3 Variables and descriptive statistics . . . . . . . . . . . . . . . . . . . . . 29
1.7 Results . . . . . . . . . . . . . . . . . . . . . . . . . . . . . . . . . . . . . . . . . 31
1.7.1 The estimated effects of distributor market structure on retransmission
fees . . . . . . . . . . . . . . . . . . . . . . . . . . . . . . . . . . . . . . 31
1.7.2 The estimated effect of advertising rates on retransmission fees . . . . . . 34
v

1.7.3 The estimated effect of station mergers on retransmission fees . . . . . . 35
1.7.4 The effect of station mergers on advertising rates . . . . . . . . . . . . . 36
1.8 Distributors as platforms . . . . . . . . . . . . . . . . . . . . . . . . . . . . . . . 38
1.9 Conclusion . . . . . . . . . . . . . . . . . . . . . . . . . . . . . . . . . . . . . . . 40
2 The Effects of Platform MFNs on Competition and Entry (with Kenneth S.
Corts) 55
2.1 Introduction . . . . . . . . . . . . . . . . . . . . . . . . . . . . . . . . . . . . . . 55
2.2 Model . . . . . . . . . . . . . . . . . . . . . . . . . . . . . . . . . . . . . . . . . 58
2.2.1 General Demand . . . . . . . . . . . . . . . . . . . . . . . . . . . . . . . 59
2.2.2 Linear Demand . . . . . . . . . . . . . . . . . . . . . . . . . . . . . . . . 61
2.3 Competitive effects of platform MFNs . . . . . . . . . . . . . . . . . . . . . . . . 61
2.3.1 General Demand . . . . . . . . . . . . . . . . . . . . . . . . . . . . . . . 62
2.3.2 Linear demand . . . . . . . . . . . . . . . . . . . . . . . . . . . . . . . . 65
2.4 Endogenous adoption of PMFN policies . . . . . . . . . . . . . . . . . . . . . . . 67
2.4.1 General Demand . . . . . . . . . . . . . . . . . . . . . . . . . . . . . . . 67
2.4.2 Linear Demand . . . . . . . . . . . . . . . . . . . . . . . . . . . . . . . . 70
2.5 The effects of PMFNs on entry incentives . . . . . . . . . . . . . . . . . . . . . . 72
2.5.1 The effects on implied demand . . . . . . . . . . . . . . . . . . . . . . . . 73
2.5.2 The effects on profits . . . . . . . . . . . . . . . . . . . . . . . . . . . . . 74
2.5.3 The effects on entry when entrant’s quality is exogenous . . . . . . . . . 75
2.5.4 The effects on entry when entrant’s quality is endogenous . . . . . . . . . 76
2.6 Conclusion . . . . . . . . . . . . . . . . . . . . . . . . . . . . . . . . . . . . . . . 79
2.7 Appendix . . . . . . . . . . . . . . . . . . . . . . . . . . . . . . . . . . . . . . . 80
3 MFN Clauses in Health Care Provider Contracts 85
3.1 Introduction . . . . . . . . . . . . . . . . . . . . . . . . . . . . . . . . . . . . . . 85
3.2 Literature Review . . . . . . . . . . . . . . . . . . . . . . . . . . . . . . . . . . . 88
vi

3.2.1 Economic . . . . . . . . . . . . . . . . . . . . . . . . . . . . . . . . . . . 88
3.2.2 Legal . . . . . . . . . . . . . . . . . . . . . . . . . . . . . . . . . . . . . . 90
3.2.3 Case history and empirical facts . . . . . . . . . . . . . . . . . . . . . . . 92
3.3 Model . . . . . . . . . . . . . . . . . . . . . . . . . . . . . . . . . . . . . . . . . 94
3.3.1 Setup . . . . . . . . . . . . . . . . . . . . . . . . . . . . . . . . . . . . . 94
3.3.2 Solution without an MFN . . . . . . . . . . . . . . . . . . . . . . . . . . 96
3.3.3 Solution with an MFN . . . . . . . . . . . . . . . . . . . . . . . . . . . . 97
3.3.4 Consumer welfare . . . . . . . . . . . . . . . . . . . . . . . . . . . . . . . 98
3.3.5 Cournot example . . . . . . . . . . . . . . . . . . . . . . . . . . . . . . . 101
3.3.6 Differentiated Bertrand example . . . . . . . . . . . . . . . . . . . . . . . 102
3.4 Incumbent as a provider-controlled cartel manager . . . . . . . . . . . . . . . . . 104
3.4.1 Single provider’s welfare cannot be increased via an MFN . . . . . . . . . 105
3.4.2 The MFN increases provider welfare with two providers . . . . . . . . . . 106
3.4.3 The MFN solves the coordination problem . . . . . . . . . . . . . . . . . 107
3.5 Conclusion . . . . . . . . . . . . . . . . . . . . . . . . . . . . . . . . . . . . . . . 111
Bibliography 116
vii

Chapter 1
Intermediaries in Two-Sided Markets:
an Empirical Analysis of the U.S. Cable
Television Industry
1.1 Introduction
Two-sided markets consist of two distinct groups of users who interact with each other via a
platform and whose utility depends on the number of users in the other group. Frequently cited
examples of platforms that connect two such groups of users are credit cards (card holders and
merchants), video game consoles (game players and game publishers), and newspapers and mag-
azines (readers and advertisers). Two-sided markets have attracted significant attention from
researchers in industrial organization economics in recent years. Theoretical and empirical work
has demonstrated that pricing behavior, strategies and policy prescriptions can diverge consid-
erably from those that prevail in a traditional one-sided market. This is because, in two-sided
markets, platforms face a choice about which side of the market to charge higher prices to and
which side of the market to subsidize in an effort to grow the number of transactions and value
of the platform.
1

Chapter 1. Intermediaries in Two-Sided Markets: U.S. Cable TV 2
One thing this research has yet to consider is the potentially important role played by in-
termediaries in two-sided markets. Intermediaries exist anytime a platform does not interact
directly with one or both sides of the market. Though the existing two-sided models typically
assume that the platform interacts directly with both sides, it is clear that in some scenarios
they interact via intermediaries (or a more complicated vertical structure) and the existence of
such intermediaries may alter the behavior of a two-sided platform just as it would a traditional
one-sided firm.
In this paper, I offer the first empirical study of two-sided markets in which the role of
intermediaries is explicitly addressed. I study television stations, which are among the most
frequently cited examples of platforms, connecting television viewers and advertisers.1 Though
this was not always the case, today such stations charge prices to both sides of the market:
ad rates to advertisers and retransmission fees to the cable, satellite and telephone distributors
who rebroadcast (and effectively resell) stations’ content to their subscribers. These distributors
are important intermediaries (today, over 90% of viewers watch television through one of these
three types of distributors) and their pricing, bundling, and other strategic decisions may have
an impact on the nature of the optimal two-sided pricing strategy for the television station.
Furthermore, in this particular setting, the intermediaries play a second role as well. Cable and
telephone distributors themselves sell local advertising slots. Thus, in addition to being the
downstream reseller of stations’ content, they also compete with these stations in the local ad-
vertising market. This additional competition through the advertising market means that there
are multiple channels through which these intermediaries may affect station behavior. Not only
are such channels not explicitly considered in the existing literature but they were likely not
foreseen when regulations affecting this industry were put into place in 1992 (at a time when
roughly half of all television viewers accessed local content using an over-the-air antenna).
Currently in the United States, there are nearly 2,500 local broadcast channels (or “sta-
1See, for example: Ambrus et. al (2013), Anderson and Gabszewicz (2005), Anderson and Coate (2005),Armstrong (2006), Kind et. al (2011), Wilbur (2008), and Wright (2004).

Chapter 1. Intermediaries in Two-Sided Markets: U.S. Cable TV 3
tions”) that reach 115 million U.S. households. Historically, stations provided their content
for free over-the-air as they lacked the technological capability to exclude viewers. As a re-
sult, stations derived revenues exclusively from advertising. The growth of content distribution
through cable companies offered stations the option to monetize viewership since cable compa-
nies do have the ability to exclude viewers. The rise of cable distributors as monopolies drew
the attention of regulators who introduced the 1992 Cable Television Consumer Protection and
Competition Act. The 1992 Act introduced three main regulations: (i) “must carry” provisions
which offered stations the option to force cable distributors to carry their content (but then
forfeiting the right to charge for that content), (ii) mandatory bundling of local channels, and
(iii) restrictions on joint ownership of stations within a market. At the outset, cable channel
capacities were limited and so for cable companies, carrying local stations came with the high
opportunity cost of foregone specialty programming. Realizing their limited ability to charge
cable companies for content, stations elected “must carry” status and provided their content to
cable companies free of charge. With stations choosing “must carry” status, the local television
market was essentially segmented into an advertising market and a viewing market: prices on
the viewer side of the market were determined simply by monopoly cable pricing (or regulated
prices), and advertising rates were determined by competition among stations.
A number of technological changes have occurred since the implementation of the 1992 Act,
one of which is the growth of cable channel capacity. It is now standard for capacity to reach up
to 1,000 channels so that carrying local stations has a low opportunity cost. Beginning in 2005,
stations ceased electing must carry status and began to seek payment from distributors for their
content in the form of per-subscriber “retransmission fees”. Today, these fees amount to roughly
$2.5 billion in revenues for broadcast television stations. The second significant change that has
occurred is a move away from the free over-the-air model of television; today over 90% of view-
ers access the content of local stations through one of three distribution methods: cable (eg.
Comcast, Time Warner), telephone or “telco” (eg. Verizon, AT&T), and satellite (eg. DirecTV,
DISH). The growth of competition among such “distributors” has not only increased competi-

Chapter 1. Intermediaries in Two-Sided Markets: U.S. Cable TV 4
tion for paying viewers, but it has also increased competition in the local advertising market:
along with stations, cable and telephone distributors also sell local advertisements which air on
specialty channels (eg. ESPN, CNN). Satellite distributors also sell advertisements on specialty
channels, however, they cannot feasibly target local audiences and so do not compete in the
local advertising market. In light of these changes, we no longer observe segmented advertising
and viewing markets. Instead, we observe an integrated two-sided market, illustrated in Figure
1, where retransmission fees affect final subscription prices, and subscription prices affect view-
ership which in turn determines advertising rates, and retransmission fees.
As a result of these two major changes in the industry since 1992, it is clear that the presence
of distributors acting as intermediaries between stations and viewers may cause the stations to
price in ways that are different from how stations would price if they interacted directly with
viewers. My empirical analysis investigates the extent to which this is the case. To do so,
there are two empirical challenges that need to be overcome. The first is that it is not possible
to identify how intermediaries affect stations’ behavior by simply comparing stations operat-
ing with and without intermediaries (as all stations in all markets reach viewers through some
form of distributor). Therefore, I develop an empirical strategy that identifies the effects of
distributors on station behavior by exploiting variation in distributor market structure. While
the variation I exploit is cross-sectional, my empirical approach takes advantage of the fact that
institutional features of the industry mean that many of the characteristics that might otherwise
vary across markets and might be problematic for a cross-sectional analysis are, by design, held
constant here. The second empirical challenge is that retransmission fees (the fees that stations
charge the distributors per subscriber) are not publicly disclosed. However, final prices charged
to consumers are observed and thus the empirical strategy must be able to infer changes in
retransmission fees from changes in final prices. To do this, I exploit a novel dataset including
over 5,000 manually collected zipcode-level distributor prices that I have paired with additional
zipcode and market-level data obtained from multiple media research firms. Since distributor
competition varies at the zipcode but retransmission fees are set at the market level, I am able

Chapter 1. Intermediaries in Two-Sided Markets: U.S. Cable TV 5
to estimate the indirect effect of distributor competition on the negotiation of retransmission
fees while still controlling for the direct effect of distributor competition on final prices.
Several key findings emerge. First, I find evidence that retransmission fees are lower in mar-
kets where ad revenues per household are high. This confirms that station behavior is consistent
with a basic principle of two-sided market theory: since the marginal benefit of an additional
subscriber in terms of advertising revenues is higher in markets with higher per-household ad
rates, stations should set lower retransmission fees in these markets to increase viewership. My
finding of evidence that retransmission fees are lower in lucrative ad markets suggests that plat-
forms may still continue to pursue “two-sided” pricing strategies even through intermediaries.
The remaining two results speak to how distributor intermediaries specifically affect station
pricing incentives.
I find evidence that increased competition from telephone distributors lowers retransmission
fees to cable distributors, while competition primarily from satellite raises retransmission fees
to cable distributors. One explanation for this result is intimately tied to the advertising side
of the market. Since satellite distributors cannot target local audiences, stations have an in-
centive to charge higher fees to cable distributors facing competition primarily from satellite as
this induces higher cable prices and subscriber switching to satellite. Subscriber switching to
satellite in turn lessens the effectiveness of competition from cable distributors in the ad market
(since advertising via cable reaches fewer viewers). When cable distributors face competition
primarily from telephone distributors, a station does not face an incentive to raise cable prices
since higher cable prices induce switching to telephone distributors which has no effect on the
local ad market. This suggests that platforms may not only care about the total number of users
connecting to the platform, but they may also have strong preferences over which intermediary
users choose to connect to the platform.
By examining two types of station mergers that occur under different circumstances, I find
evidence that station mergers lower retransmission fees. One explanation for this finding is that
bundling of local stations introduces a pricing externality among stations that causes them to
Chapter 1. Intermediaries in Two-Sided Markets: U.S. Cable TV 6
set retransmission fees higher than they would absent bundling. Because viewers only observe
a single price for a bundle of all local stations, stations may seek higher retransmission fees
than they would under a la carte pricing because higher retransmission fees can only be passed
through in the form of a higher bundled price for all stations. Simply put, retransmission fees
are determined by a transaction involving a single station and a distributor, but have an impact
on other stations not involved in the transaction; higher retransmission fees impose a cost on
other stations not involved in the transaction, and therefore fees are set too high from the joint
perspective of stations. Station mergers partially resolve this externality because a station rec-
ognizes that higher retransmission fees impose a cost on partner stations, and for this reason,
retransmission fees should fall under joint ownership of stations.
The empirical results of this paper have implications for the existing two-sided market lit-
erature as well as for public policy. The existing literature has largely ignored the role of
intermediaries and the impact that they may have on the pricing decisions of platforms. This
paper shows that intermediaries may cause platforms to price in a way that is different than
if they connected directly to end users, and should not be ignored if there is a possibility that
they may have a material impact on platforms’ pricing decisions. This is especially true if there
is reason to believe that the platform may have a preference for which intermediaries end users
choose; platforms’ preferences over intermediaries may create incentives that affect platform
behavior but which cannot be captured by models assuming platforms connect directly to end
users.
This paper also has implications for policy in the U.S. cable television industry which remains
governed by the 1992 Cable Act. In particular, I find that markets where telephone distributors
are present not only have lower cable prices because of competition, but also indirectly through
lower retransmission fees because stations have less of an incentive to seek high retransmission
fees in markets with telephone distribution downstream. This suggests that telephone distribu-
tors offer a greater restraint on the growth of retransmission fees than do satellite distributors.
I also find evidence that mandatory bundling of local stations together with restrictions on joint

Chapter 1. Intermediaries in Two-Sided Markets: U.S. Cable TV 7
ownership of stations within a market combine to raise retransmission fees, and that this is
an unintended consequence of the 1992 Cable Act which did not anticipate the current market
structure. Allowing a la carte pricing of local stations would lessen a station’s incentive to raise
retransmission fees because this would result in a higher final price for that station alone (and
invite substitution to rival stations), whereas under bundling, higher retransmission fees result
in higher prices for all local stations which does not permit substitution among stations con-
tained in the bundle. I find evidence that joint ownership lessens a station’s incentive to seek
higher retransmission fees under bundling because jointly owned stations are more reluctant to
seek higher retransmission fees that impose costs (in the form of higher cable prices) on other
stations in the same ownership portfolio. In general, the main policy implication of this paper is
that the local television market warrants consideration as a two-sided market, where distributor
intermediaries affect station behavior directly as a distributor of content but also indirectly as
a rival seller of advertising.
The paper is organized as follows: Section 2 provides a review of the literature, Section
3 contains institutional details, Section 4 provides theoretical predictions, Section 5 describes
the empirical approach, Section 6 discusses the data, Section 7 contains the empirical results,
Section 8 presents preliminary evidence of two-sided behavior by distributors, and Section 9
concludes.
1.2 Existing literature
This paper contributes to several literatures. Broadly speaking, the main contribution is to the
empirical literature which tests for the existence of two-sided behavior on the part of platforms.
Since two-sided theory often predicts behavior that is inconsistent with predominantly one-sided
theories of firm behavior (such as below cost pricing), the two-sided empirical literature tests
whether any weight should be given to two-sided theories. After having found evidence of two-
sided behavior, part of this literature has proceeded to examine the effect of platform mergers

Chapter 1. Intermediaries in Two-Sided Markets: U.S. Cable TV 8
on the balance of prices to each side of the market. This paper contributes to the general em-
pirical two-sided literature by testing for two-sided behavior on the part of stations, analyzing
the effects of station mergers on prices to both sides of the market, and, mostly importantly,
considering two aspects of two-sided markets which to my knowledge have not been considered
before empirically: what effects intermediaries have on platform pricing in a two-sided market,
and whether intermediaries themselves can be considered platforms. There is also a contribution
to the study of the U.S. cable television industry itself, which as the industry evolves has had
to re-evaluate certain policies such as forced distributor bundling of local channels and restric-
tions on joint ownership of stations. This paper directly speaks to the debate surrounding the
regulatory framework imposed by the 1992 Cable Act because it examines the effects of station
and distributor concentration on cable prices for consumers.
The earliest two-sided market theories (Rochet and Tirole 2002, Caillaud and Jullien 2003)
examined optimal platform pricing and found that prices should be lower for the group of users
which has relatively elastic demand for the platform, and that prices should be higher for the
group which has relatively inelastic demand for the platform. As this relates to the U.S. cable
television industry, it is natural to suppose that advertisers value viewers more than viewers
value advertisers which is supported by the prevalence of ad-avoidance technologies. The pre-
dicted result is station “subsidization” of viewers and revenue extraction from advertisers. Since
the original literature considered monopolist platforms, the theoretical literature has turned to
predicting the effects of platform competition on the balance of prices (Armstrong 2006, Weyl
2006, Chandra and Collard-Wexler 2009), but without clear predictions as of yet.
Kind et. al (2011) provide a first step in the direction of developing an understanding of
the role of intermediaries in two-sided markets. The authors develop a theory of the role of
intermediaries in the cable television industry and find that the presence of distributors pushes
channel pricing away from that which would exist under vertical integration of channels and
distributors (to the detriment of both industry profits and consumer welfare). Unfortunately,
the features of the model do not align with those of the U.S. cable television industry so the

Chapter 1. Intermediaries in Two-Sided Markets: U.S. Cable TV 9
predictions do not directly apply.
Several empirical challenges present themselves when attempting to test the theoretical pre-
dictions of two-sided market theory. The key empirical relationship this research attempts to
identify is whether relative prices to each side of the market are a function of each side’s elasticity
of demand for the platform. To estimate such a relationship, the researcher requires meaningful
data on both sides of the market, such as price and quantity observations, as well as exogenous
variation that will identify parameters of interest that drive the equilibrium decisions of plat-
forms. As a result of these requirements, researchers have turned to newspaper and magazine
markets where advertising and circulation information has been made available. The Dutch
(Filistrucchi, 2011), Belgian (Van Cayseele and Vanormelingen, 2010), Italian (Argentesi and
Filistrucchi, 2007), and Canadian (Chandra and Collard-Wexler, 2009) newspaper markets have
been studied as two-sided markets but with different research questions. Kaiser and Wright
(2006) study the German magazine market and find evidence of textbook two-sided behavior:
advertisers value magazine readers more than readers value advertisers, and cover prices are
“subsidized” as a result. Chandra and Collard-Wexler study a series of mergers in local Cana-
dian newspaper markets and finds that prices fell to both advertisers and readers.
A related literature is concerned with how platforms determine the optimal mix of its prod-
ucts (such as newspaper or television content) along with advertising levels and subscription
prices. This has proven a difficult problem to solve due to various cross-group effects or “chicken-
and-egg” effects. For example, Anderson and Coate (2005) model the effects of platform (tele-
vision station) concentration on the numbers of ads and programs under the assumption that
stations price directly to viewers, but with unclear predictions over which level of concentration
is more socially desirable. Wilbur (2008) serves as both a theoretical and empirical example
of this literature; he presents a theoretical model of network behavior in the U.S. cable indus-
try followed by an estimation of various cross-group elasticities and their effects on networks’
program choices. Among other results, Wilbur finds that the preferences of advertisers affect
networks’ programming choices more than viewers’ preferences.

Chapter 1. Intermediaries in Two-Sided Markets: U.S. Cable TV 10
Due to the difficulties in estimating a number of parameters simultaneously, it has been
helpful to examine industries where the problem is simplified because, either for technological
or regulatory reasons, one of the platform’s choice variables is held constant. Jeziorski (2012)
provides an excellent example; he uses radio station mergers in the U.S. to structurally estimate
various industry parameters which are then used to perform a welfare analysis of radio station
mergers. Because radio stations cannot charge listeners for their content, nor can they pay
listeners to tune in, the estimation problem is greatly simplified and Jeziorski is able to focus
on the effects of station mergers on advertising levels, content variety, and listener welfare. The
approach taken in this paper is very similar to Jeziorski, though almost the mirror image of
it, because the number of ads and the content aired during prime time are variables that are
out of the control of a local television station. But unlike radio stations, television stations are
restrained in choice of content but flexible in prices to viewers because most viewers access their
content through cable, telco, or satellite distributors that have the ability to exclude non-paying
viewers.
1.3 Industry background
The U.S. cable television industry is broken down into 210 Designated Market Areas (DMAs)
that for simplicity will be referred to as markets. Households watch local and national channels
either through a local cable distributor (Comcast, Time Warner Cable, Cox, etc.), a local telco
distributor (Verizon FiOS, AT&T U-verse), or through a national satellite distributor (DirecTV,
DISH Network). Virtually all households have access to a national satellite distributor. Almost
all households in urban markets have access to a local cable distributor, and some of the larger
markets have a third option of a telco distributor. Cable and satellite distributors have been in
the market for at least two decades, but telco distributors are relatively new and began opera-
tions around 2005.
Households pay their distributor a monthly subscription fee to receive access to a certain

Chapter 1. Intermediaries in Two-Sided Markets: U.S. Cable TV 11
number of channels. In turn, distributors pay national and local channels a fee per subscriber for
their content which is negotiated. When distributors receive the content of a national channel,
they also receive 2-3 minutes worth of ad slots per hour for that channel which they can use
to sell to advertisers or which they can use to advertise themselves. While they amount to less
than subscription revenues, ad revenues derived from these slots are substantial, amounting to
roughly $2 billion per year for the largest distributor Comcast, and $1 billion per year for Time
Warner Cable. Because distributors distribute their content to households from a local headend
facility (essentially the origin of the cable or fibre lines that reach out to households), local
distributors can offer advertisers the ability to sell ads that target a local audience. Therefore
Comcast subscribers in different markets may see different ads on national channels (such as
ESPN) for 2-3 minutes per hour, and neighbours in the same market but who separately sub-
scribe to Comcast and Verizon may also see different ads on the same channel at the same time.
This contrasts with national satellite distributors who distribute their content from satellite and
cannot feasibly target local audiences in the same way.2 Instead, satellite providers sell national
advertisements and so all DirecTV subscribers view the same advertisements on national chan-
nels at the same time.
When distributors negotiate to receive content from local channels (or “stations”) the dis-
tributors do not typically receive any ad slots, at least not for free. For this reason, the linear
fees per subscriber that distributors pay local stations are lower than what they pay for national
channels of comparable popularity. These linear fees in the context of agreements between dis-
tributors and stations are known as “retransmission fees”, as local distributors historically served
to extend the broadcast signals of these stations to neighbourhoods too distant to receive those
signals with over-the-air antennas. Although retransmission revenues are substantial, stations
derive most of their revenues from the sale of advertising slots provided by their parent network
2They would need to increase their satellite transponder capacity by 210 times to have this capability forall markets. Transponder space on a satellite is very expensive, roughly $2million per transponder per year.The satellite distributors, however, are slowly beginning to offer local advertising capabilities by preloading theirdigital receivers with thousands of ads to be played based upon household-level characteristics, which couldultimately provide advertisers with the ability to target audiences even further.

Chapter 1. Intermediaries in Two-Sided Markets: U.S. Cable TV 12
(e.g. ABC, CBS, FOX, NBC). A given parent network provides all of its affiliate stations with
the same number of ad slots, but this allotment varies across networks.
Retransmission agreements are governed by the 1992 Cable Act which offers stations the
option every three years to demand “must carry” status from distributors. This requires dis-
tributors to carry the station, but the station relinquishes the right to charge the distributor
for content. If a station does not elect must carry status, then the station retains the option to
charge a positive retransmission fee, but the distributor has the option not to carry the station.
These agreements are re-negotiated every three years, though the length of contracts can extend
further. From 1992 until 2005, stations elected must carry status and so aggregate retransmis-
sion revenues were zero. As illustrated in Figure 2, since 2005, stations have sought payment
for their content from distributors and in 2012 aggregate retransmission fees amounted to an
estimated $2.5 billion. Unfortunately, retransmission fees agreed upon between specific stations
and distributors are closely guarded secrets and so are unobserved.
While retransmission fees are not observed, some aggregate retransmission revenue data is
available which can be overlapped with subscriber information to calculate average retransmis-
sion fees. Retransmission fees are climbing, and there is evidence of substantial variation in
fees across stations. Figure 3 presents SNL Kagan estimates of average retransmission fees per
subscriber for a selection of station groups (entities that own multiple stations across markets).3
The magnitudes of the retransmission fees may appear trivial, but these fees are well above what
most national channels receive (some earn pennies per subscriber), not to mention that national
channels provide distributors with free ad time whereas stations do not.
Distributors are required by FCC regulations to offer consumers a “Basic” bundle of channels
for sale which contain (at a minimum) all local channels. Roughly 9% of all subscribers subscribe
to the Basic package. Historically, the price of this bundle was regulated by local municipalities
as part of a Local Franchise Agreement that distributors sought in exchange for the right to
3Many station groups do not report any information regarding its retransmission revenues. The estimatespresented are sometimes based only upon comments made by a station group’s CEO regarding the neighbourhoodof its aggregate retransmission revenues.
Chapter 1. Intermediaries in Two-Sided Markets: U.S. Cable TV 13
distribute in the area. With the entry of satellite and telco providers, very few municipalities
still regulate the price of distributors’ Basic package, with one distributor indicating that less
than 1% of its municipalities are subject to price regulation.4
Another important FCC regulation relates to ownership rules, which limit a single entity to
owning up to two stations in a single market, and not more than one of the top four stations in
a market. Essentially this prevents a group from owning two or more of the Big Four stations
in a market. Ownership of stations across markets is permitted, however, though a group’s
ownership of stations cannot exceed 39% of the national audience. Ownership of stations across
markets is common; station groups exist that own dozens of Big Four stations across markets.
Many stations are owned and operated by their parent network, known as “O&O” stations, but
the extent of ownership is again limited by the 39% rule.
FCC regulations prevent distributors from importing signals from out of market, and so
if negotiations break down between, say, FOX Chicago and Comcast, Comcast cannot import
FOX Detroit. Instead, a blackout arises and Comcast subscribers will no longer be able to view
any FOX programming. Since the primetime content aired on FOX Chicago and FOX Detroit
is identical, Chicago-area subscribers would view it as a reasonably good substitute; the only
difference would be seeing Detroit-area advertisements and Detroit-area news. As a result, this
FCC regulation grants local stations substantial bargaining power as blackouts may lead some
subscribers to cancel their subscription with their distributor.5
There are a number of industry concerns regarding these rules. For one, if a station is strug-
gling financially, local ownership rules are often waived in order to preserve local programming
diversity. One such example is the San Antonio market where Sinclair Broadcast Group owns
both the FOX and NBC stations. Another circumvention of these rules occurs through “Lo-
4Technically, distributors must file to the FCC stating effective competition, but most municipalities do notwant the administrative burden of regulating.
5The costs of a blackout to a station are mostly reduced advertising revenues from lower viewership. Thecost to a distributor is that some subscribers will switch to a rival distributor to regain access to the blackedout channel. For this reason, stations often find it beneficial to renegotiate retransmission agreements ahead oftelevision events that subscribers are most likely to switch distributers to see, such as the Superbowl.

Chapter 1. Intermediaries in Two-Sided Markets: U.S. Cable TV 14
cal Marketing Agreements” (LMAs) where a station delegates its entire operations, including
retransmission negotiations, to another station in the market.6 These agreements amount to
virtual mergers among stations; as of this writing there are 46 known LMAs in existence.
While all markets have access to the content of the Big Four, there are a few markets where
the content is not supplied from a local station. For example, the Juneau market does not have
a local FOX station and instead distributors in Juneau are permitted import FOX Anchorage
for their subscribers. ABC, CBS, and NBC each have 192 locally-represented stations while
FOX has 185. Despite these occasional exceptions, the number and concentration of stations is
mostly fixed across the 210 markets.
1.4 Theoretical predictions
My objective is to lay out a simple theoretical framework that can generate a series of predictions
about how platform behavior is affected by the presence of intermediaries. To be specific, the
main objective is to identify (from final cable prices) how distributor competition affects the
setting of retransmission fees. I then proceed to examine how ad rates and joint ownership of
stations are predicted to affect retransmission fees.
To do this, I first introduce some notation and then formalize the objectives of stations and
distributors. I derive a measure of how lucrative the ad market is by introducing the concept
of a per-household ad rate that serves as a measure of the marginal benefit of an additional
viewer in terms of advertising revenues. I then examine how distributor concentration might
affect stations’ retransmission fees under two competing hypotheses: a “one-sided” hypothesis
that retransmission fees are determined in isolation of conditions in the ad market, and a “two-
sided” hypothesis that retransmission fees are a function of conditions in the ad market, and in
particular, per-household ad rates. The final item is a discussion of how station mergers might
remedy an externality created by a provision of the 1992 Cable Act that mandates bundling of
6Less of a concern, at least from a market power standpoint but not a diversity standpoint, are Joint ServiceAgreements where stations agree to share production equipment, news crews, etc.

Chapter 1. Intermediaries in Two-Sided Markets: U.S. Cable TV 15
local stations.
1.4.1 Local ad market
The primary determinant of advertising rates is the number of viewers. It is helpful to create
a measure of ad rates which is independent of the viewing population so that differences in ad
rates across markets are not determined by market size. Such a per-household ad rate will serve
as the measure of the marginal benefit of a viewer in terms of advertising revenues.
In the cable television industry, the unit of viewership is the household. Each market has
a set of television households which are defined as any household that has a television (but
which is not necessarily watched). Reachable households in market m, Hm, is the subset of
television households that watches television either over-the-air using an antenna, through a
cable subscription, telco subscription, or satellite subscription. Let Rsm be the average non-
household adjusted ad rate station s receives for a 30-second ad. Then rsm = (Rsm/Hm) is the
per-household ad rate of station s.7
Each station s has a fixed allotment of ad slots am to sell. This allotment is determined by
the parent network, such as ABC, CBS, FOX or NBC. While a varies across stations within a
market, it does not vary across stations in different markets with the same parent.8 Since station
ad output is fixed at a, supply is vertical and the non-household adjusted ad rate R∗sm that will
just clear this ad inventory is determined by the intersection of that vertical supply curve with
the demand to advertise on the station. The determinants of R∗ are therefore entirely driven by
local demand factors such as market-specific viewership of the station, the price of substitute
advertising such as rival local stations but also newspaper and radio. Most importantly, R∗
is also a function of how viewers are distributed across cable, telco, and satellite distributors.
Ideally, stations would prefer that all viewers connect to the station through a satellite distributor
7Note that this is not the same as the commonly used viewing metric CPM (cost per 1000 impressions) whichmeasures the cost to an advertiser of actually reaching 1000 viewers. Here, rsm measures the cost of potentiallyreaching a single household. That household may not actually see the advertisement.
8For example, the ABC affiliate in San Francisco has the same allotment as the ABC affiliate in Los Angeles.

Chapter 1. Intermediaries in Two-Sided Markets: U.S. Cable TV 16
so that they would not face local ad competition from cable or telco distributors.9 Therefore
R∗ is most importantly a function of “satellite penetration” so that R∗ = R(SatelliteSubscribersTotalV iewers
).
Once divided by the number of reachable households, R∗ provides an appropriate measure of
the advertising marginal benefit of a subscriber and is given by r∗sm = (R∗sm/Hm).
It is important to emphasize that a given station has no control over the total number of
advertisements seen by its viewers. For example, stations cannot pursue a strategy of reducing
the number of ads seen by viewers to increase viewership, and then increasing subscription prices
via retransmission fees. While stations do have the option to advertise their own programming so
that they can move up their demand curve and extract a higher ad rate from paying advertisers,
this does not affect the number of advertisements seen by viewers.10
1.4.2 Distributor market structure
A key ingredient for identifying the effect of distributor competition on retransmission fees is to
note that distributors do not earn any advertising revenue when viewers subscribe to its Basic
package.11 An implicit assumption is that the distributor’s profit-maximizing choice of price for
its Basic package is not materially impacted by the prices of its better-than-Basic packages. A
theory of multi-product price discrimination is beyond the scope of this paper, but this theme
is explored later in the paper when testing for two-sided behavior by distributors themselves.
Distributor competition varies at the zipcode-level. The price set by a distributor is therefore
a function of zipcode demand characteristics, costs, and the number of competing distributors
in that zipcode. The existence of rival distributors in the rest of the market does not directly
impact the pricing decision of a distributor in a given zipcode. When setting the price of its
9Recall that satellite distributors cannot sell local ads.10It is natural to assume that viewers are indifferent between seeing advertisements for local programming and
advertisements for local car dealerships, restaurants, or even a blank screen. While a station may move up itsdemand curve to increase R∗, since this does not affect viewership, R∗ (once adjusted for number of reachablehouseholds) still represents the marginal benefit of an additional viewer.
11The exceptions are the satellite providers whose cheapest offering is a form of “expanded Basic” and doesinclude national channels.

Chapter 1. Intermediaries in Two-Sided Markets: U.S. Cable TV 17
Basic package in zipcode z in market m, distributor d chooses pdzm to maximize
(pdzm −RTdm)qdzm(pdzm, p−dzm)
where p−dzm represents the prices of rival distributors in zipcode z, RTdm is the sum of the
retransmission fees the distributor d must pay to all local stations in market m and is the
distributor’s constant marginal cost of a subscriber. Note that because this is the price for
the Basic package, the distributor’s local ad sales do not enter the objective function. Out of
this maximization problem is assumed to arrive an equilibrium price p∗dzm and a corresponding
equilibrium number of subscribers q∗dzm. The equilibrium price is expected to be increasing in
retransmission fees and decreasing in the number of rival distributors in the zipcode.
1.4.3 Retransmission fee setting
Retransmission fees are negotiated between distributors and stations. This paper does not de-
velop a formal model of the bargaining game that occurs between a distributor and a station.
Instead, it is useful to consider as a benchmark the take-it-or-leave-it retransmission fee that
would prevail if the station had full bargaining power in a negotiation. Since a station does not
have full bargaining power, the station is not able to achieve that level of retransmission fee.
However, as distributor competition increases, a station’s bargaining position clearly increases
and a station behaving in a one-sided manner will always choose to exercise that bargaining
power to increase retransmission fees.
In contrast, a station behaving in a two-sided manner may respond to an increase in distrib-
utor competition differently depending on who the competing distributors are. For example,
when cable distributors face competition only from satellite, stations have an incentive to raise
retransmission fees to cable distributors because higher cable prices result in switching to satel-
lite which lessens the effectiveness of cable as a competitor in the ad market (meanwhile satellite
distributors do not compete in the ad market). However, when cable distributors face compe-
Chapter 1. Intermediaries in Two-Sided Markets: U.S. Cable TV 18
tition mostly from a telco distributor, stations have less of an incentive to raise retransmission
fees to cable distributors because higher cable prices result in switching to telco which has no
effect on the local ad market (since both cable and telco participate in the ad market). The key
institutional details to keep in mind are that satellite distributors do not compete in the local
ad market, so that stations have a preference for viewers to access their content through satellite
rather than cable or telco. This preference only matters, however, if stations are behaving in a
two-sided manner and consider the ad market when negotiating retransmission fees.
The effects of distributor competition on retransmission fees
Consider a single market consisting of a single zipcode which before entry contains only one cable
distributor, Comcast (C), and one satellite provider DirecTV (D).12 Before entry and under take-
it-or-leave-it offers, a station s behaving in a one-sided manner only interested in maximizing
retransmission revenues would choose in its negotiation with Comcast a retransmission fee t∗sc
according to
t∗sc = argmax tscqc(p∗c , p
∗d) + tsdqd(p
∗c , p
∗d) (1.1)
where p∗c = p∗c(RT ) is Comcast’s downstream price and a function of its marginal cost RT =S∑s
tsc (of which tsc is a component), qc is Comcast’s demand which without competition from
telco is a function of its own price and the satellite distributor’s price. The satellite distributor’s
demand is given by qd, and tsd is the already agreed upon retransmission fee paid by the satellite
distributor to the station. In practice, the satellite provider’s price p∗d is fixed across all markets.
Since a breakdown in negotiations harms the station, it does not have full bargaining power and
will have to settle for a retransmission fee that is lower than t∗sc. If there is greater distributor
competition because of the entry of a telco distributor (Verizon), the station would choose its
12For simplicity only one satellite provider is considered though in practice both DirecTV and DISH Networkoperate in every market. Further, only one zipcode is considered when in practice markets consist of manyzipcodes. The results that follow easily generalize to any number of zipcodes and these simplifications are onlymade for ease of exposition.
Chapter 1. Intermediaries in Two-Sided Markets: U.S. Cable TV 19
retransmission fee according to
t∗sc = argmax tscqc(p∗c , p
∗d, p
∗v) + tsdqd(p
∗c , p
∗d, p
∗v) + tsvqd(p
∗c , p
∗d, p
∗v) (1.2)
where the v subscripts indicate Verizon. Standard models of competition suggest that the t∗sc
in (1) is identical to that in (2), so that all that has changed for the station is the cost of
a breakdown in negotiations.13 This cost decreases because any subscribers who cancel their
Comcast subscription are more likely to re-appear as subscribers of either Verizon or DirecTV
(compared to a situation where DirecTV is the only alternative). Standard bargaining models
suggest that because of this increase in the station’s “outside option” , the station’s realized
retransmission fee will be closer to t∗sc.
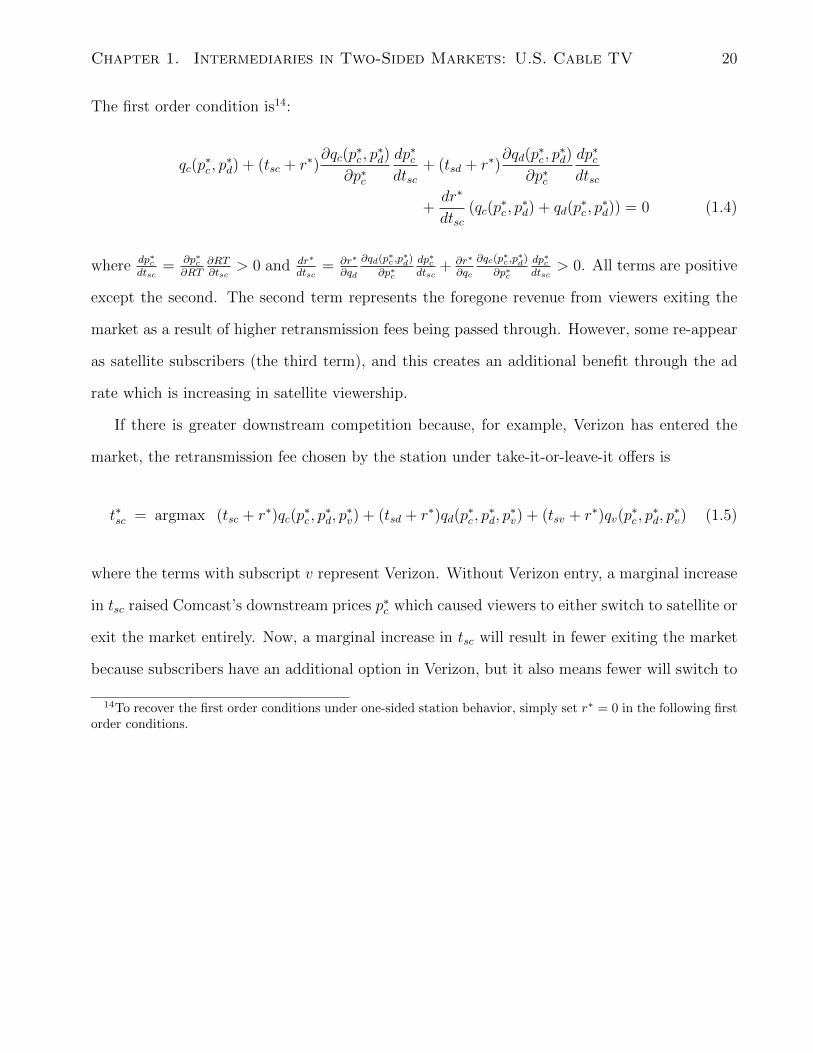
I now re-examine how the entry of a telco distributor under the assumption that stations
behave in a two-sided manner. Before entry of a telco distributor and under take-it-or-leave-
it offers, a station s behaving in a two-sided manner recognizes that higher retransmission
revenues risk reducing viewership which negatively impacts advertising revenues. A two-sided
station would choose tsc according to
t∗sc = argmax (tsc + r∗)qc(p∗c , p
∗d) + (tsd + r∗)qd(p
∗c , p
∗d) (1.3)
Station profits consist of retransmission revenues plus advertising revenues from both distrib-
utors. Recall that r∗ is an increasing function of satellite penetration so that r∗ = r∗(
qdqd+qc
).
13For example, with a single manufacturer upstream who has zero costs of production and retailers downstreamwith final demand q = 100 − p, the take-it-or-leave-it wholesale price is w = 50 whether the retail sector ismonopolized or perfectly competitive. If the wholesale price is negotiated, Nash Bargaining suggests w = 25when retail is monopolized and w = 50 if retail is perfectly competitive.
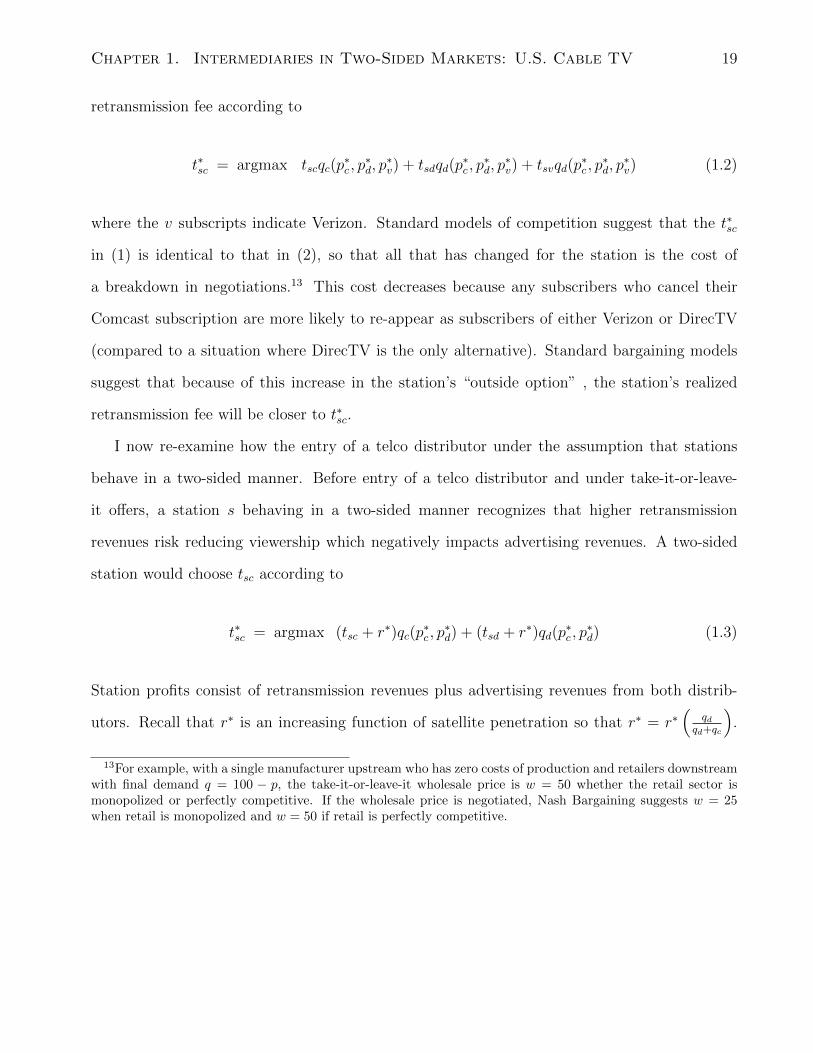
Chapter 1. Intermediaries in Two-Sided Markets: U.S. Cable TV 20
The first order condition is14:
qc(p∗c , p
∗d) + (tsc + r∗)
∂qc(p∗c , p
∗d)
∂p∗c
dp∗cdtsc
+ (tsd + r∗)∂qd(p
∗c , p
∗d)
∂p∗c
dp∗cdtsc
+dr∗
dtsc(qc(p
∗c , p
∗d) + qd(p
∗c , p
∗d)) = 0 (1.4)
where dp∗cdtsc
= ∂p∗c∂RT
∂RT∂tsc
> 0 and dr∗
dtsc= ∂r∗
∂qd
∂qd(p∗c ,p
∗d)
∂p∗c
dp∗cdtsc
+ ∂r∗
∂qc
∂qc(p∗c ,p∗d)
∂p∗c
dp∗cdtsc
> 0. All terms are positive
except the second. The second term represents the foregone revenue from viewers exiting the
market as a result of higher retransmission fees being passed through. However, some re-appear
as satellite subscribers (the third term), and this creates an additional benefit through the ad
rate which is increasing in satellite viewership.
If there is greater downstream competition because, for example, Verizon has entered the
market, the retransmission fee chosen by the station under take-it-or-leave-it offers is
t∗sc = argmax (tsc + r∗)qc(p∗c , p
∗d, p
∗v) + (tsd + r∗)qd(p
∗c , p
∗d, p
∗v) + (tsv + r∗)qv(p
∗c , p
∗d, p
∗v) (1.5)
where the terms with subscript v represent Verizon. Without Verizon entry, a marginal increase
in tsc raised Comcast’s downstream prices p∗c which caused viewers to either switch to satellite or
exit the market entirely. Now, a marginal increase in tsc will result in fewer exiting the market
because subscribers have an additional option in Verizon, but it also means fewer will switch to
14To recover the first order conditions under one-sided station behavior, simply set r∗ = 0 in the following firstorder conditions.
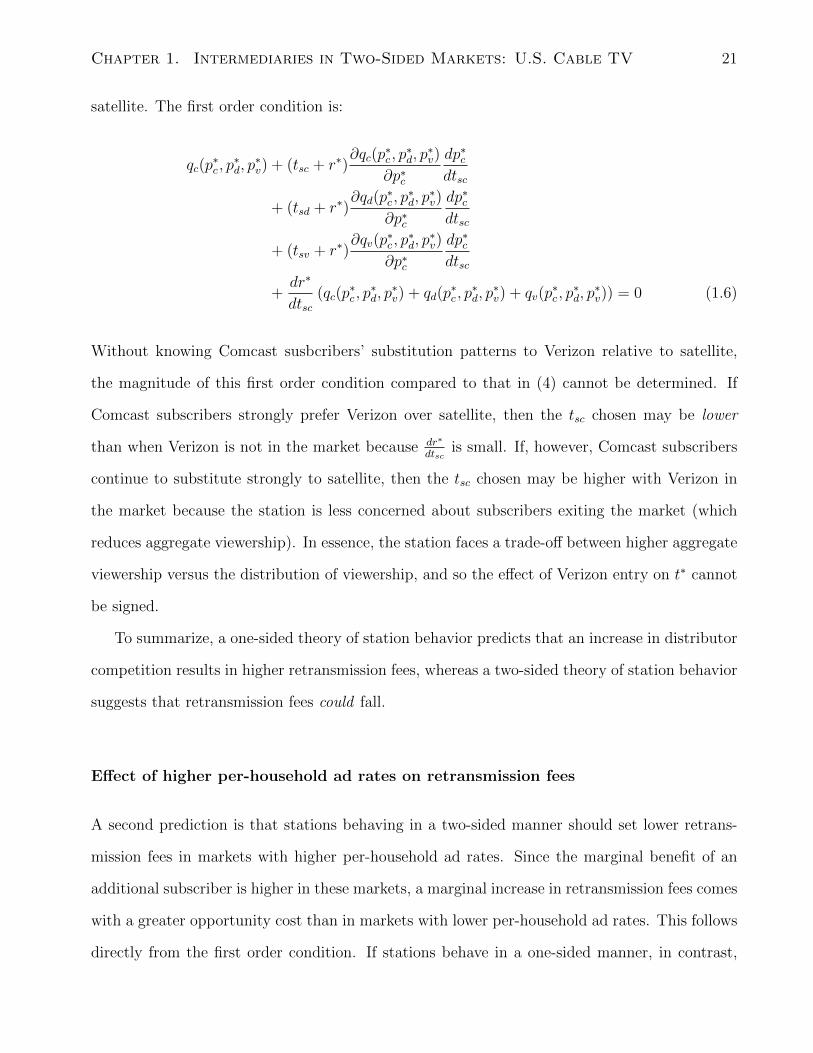
Chapter 1. Intermediaries in Two-Sided Markets: U.S. Cable TV 21
satellite. The first order condition is:
qc(p∗c , p
∗d, p
∗v) + (tsc + r∗)
∂qc(p∗c , p
∗d, p
∗v)
∂p∗c
dp∗cdtsc
+ (tsd + r∗)∂qd(p
∗c , p
∗d, p
∗v)
∂p∗c
dp∗cdtsc
+ (tsv + r∗)∂qv(p
∗c , p
∗d, p
∗v)
∂p∗c
dp∗cdtsc
+dr∗
dtsc(qc(p
∗c , p
∗d, p
∗v) + qd(p
∗c , p
∗d, p
∗v) + qv(p
∗c , p
∗d, p
∗v)) = 0 (1.6)
Without knowing Comcast susbcribers’ substitution patterns to Verizon relative to satellite,
the magnitude of this first order condition compared to that in (4) cannot be determined. If
Comcast subscribers strongly prefer Verizon over satellite, then the tsc chosen may be lower
than when Verizon is not in the market because dr∗
dtscis small. If, however, Comcast subscribers
continue to substitute strongly to satellite, then the tsc chosen may be higher with Verizon in
the market because the station is less concerned about subscribers exiting the market (which
reduces aggregate viewership). In essence, the station faces a trade-off between higher aggregate
viewership versus the distribution of viewership, and so the effect of Verizon entry on t∗ cannot
be signed.
To summarize, a one-sided theory of station behavior predicts that an increase in distributor
competition results in higher retransmission fees, whereas a two-sided theory of station behavior
suggests that retransmission fees could fall.
Effect of higher per-household ad rates on retransmission fees
A second prediction is that stations behaving in a two-sided manner should set lower retrans-
mission fees in markets with higher per-household ad rates. Since the marginal benefit of an
additional subscriber is higher in these markets, a marginal increase in retransmission fees comes
with a greater opportunity cost than in markets with lower per-household ad rates. This follows
directly from the first order condition. If stations behave in a one-sided manner, in contrast,

Chapter 1. Intermediaries in Two-Sided Markets: U.S. Cable TV 22
then prevailing ad rates should have no effect on retransmission fees.
Station mergers
An often discussed question in two-sided market theory is what effect platform mergers have
on the balance of prices on each side of the market. As of yet there are no clears answers,
mostly because the network effects present in two-sided markets result in complicated “chicken-
and-egg” problems where a change in price affects demand on one side of the market, which
in turn affects demand on the other side of the market, etc. (Weyl, 2006). In the context
of the local cable television industry, platform mergers correspond to station mergers and for
reasons explained in the theory of the local ad market, network effects do not exist in one
direction: since stations do not control the number of ads seen by viewers, they cannot pursue a
strategy of reducing ads to spur viewership and then recoup through higher subscription prices.
Since stations cannot affect the number of ads seen by viewers, station mergers are predicted
to unambiguously increase local ad rates through increased market power on the ad side of the
market. In essence, this prediction is simply that if stations can clear their ad inventory at a
higher price as a result of station mergers, they will choose to do so since there is no benefit
from clearing their inventory at a lower price.
The effect of station mergers on retransmission fees is less clear because station mergers
may increase or decrease their bargaining power (Chipty and Snyder, 1999), but there is one
reason why station mergers may decrease retransmission fees. Whether stations are behaving
in a one-sided or a two-sided manner, there exists a pricing externality through mandated
distributor bundling of local stations. Stations unilaterally negotiate their retransmission fee,
but consumers do not then observe a vector of a la carte prices for each station. Instead, they
observe a single price for the entire bundle of local stations. This limits switching among local
stations which would otherwise be substitutes for each other. Under a la carte pricing, a station
is concerned that if it increases its retransmission fee, the price of its individual station will
increase and subscribers will substitute to another local channel. Under bundling, the price of

Chapter 1. Intermediaries in Two-Sided Markets: U.S. Cable TV 23
all local stations must rise with that increase in retransmission fee, which reduces the station’s
incentive to keep retransmission fees low. When stations merge, the externality created by
bundling is mitigated because stations internalize the effect that higher retransmission fees have
on the demand for their partner stations.15
To summarize the theoretical predictions of this section, I find that (i) retransmission fees
could fall in response to an increase in competition from telco distributors, but only if stations are
pursuing a two-sided pricing strategy, (ii) retransmission fees should fall in response to increases
in per-household ad rates, but only if stations are pursuing a two-sided pricing strategy, and (iii)
station mergers should again reduce retransmission fees by mitigating an externality created by
a provision of the 1992 Cable Act which mandates distributor bundling of local stations.
1.5 Empirical approach
The empirical objectives of this paper are to examine whether (i) stations continue to pursue
two-sided pricing strategies in the presence of distributors, (ii) how exactly the pricing behav-
ior of stations is affected by the presence of distributors, and (iii) to examine whether station
mergers remedy an externality created by a provision of the 1992 Cable Act which mandates
distributor bundling of local stations. It would be ideal to observe station retransmission fees
with and without distributor intermediaries, but unfortunately, virtually all viewers connect
to stations through distributors and a key price variable (retransmission fees) is unobserved.
The main empirical challenge is therefore to infer how retransmission fees change in response
to various market conditions (such as distributor competition, prevailing ad rates, and station
concentration) from final subscriber prices.
The strategy to identify retransmission fees involves exploiting variation in distributor con-
15Crawford and Yurukoglu (2012) find that for national channels (which are owned by a handful of conglom-erates), this pricing externality is outweighed by another effect whereby the conglomerates accept lower fees inexchange for the distributor carrying their other less popular programming. Since this effect does not occurbetween a station and distributor in a single local market, the effect of local bundling on prices is unambiguouslypositive.

Chapter 1. Intermediaries in Two-Sided Markets: U.S. Cable TV 24
centration (i.e. the presence of a telco distributor) across markets and the fact that distributors
do not earn advertising revenues from viewers who subscribe only to Basic. This variation occurs
while station concentration and content remains fixed across markets. To this end, the main
identifying assumptions are that distributor pricing in a given zipcode is independent of how
competitive other zipcodes are in a given market, and that distributor pricing of Basic is only
influenced by advertising rates indirectly through stations’ determination of retransmission fees
(since distributors themselves do not earn ad revenues from Basic subscriptions).
1.5.1 The subscription market
The first empirical test investigates whether increased distributor competition from telco distrib-
utors results in higher or lower retransmission fees. The strategy to carry out this test involves
exploiting variation in distributor concentration across markets. The theoretical prediction is
that stations behaving in a one-sided manner will have higher retransmission fees in markets
with more telco competition because their bargaining power is enhanced in retransmission fee
negotiations. In contrast, stations behaving in a two-sided manner may have lower retransmis-
sion fees in markets with more telco competition because stations have less of an incentive to
induce cable subscribers to switch to satellite through higher retransmission fees to cable. Iden-
tification of this effect comes from the fact that distributor pricing of Basic is only influenced
through stations’ retransmission fees, and the relevant level of distributor competition is the
zipcode, not the market. To investigate the relationship between distributor competition and
retransmission fees, I estimate the following equation:
BasicPricedzm = β0 + β1Controlsz + β2Telcozm + β3ShareDuopm + β4StationMergerm + εzm
(1.7)
where BasicPricedzm is cable distributor d’s price of Basic in zipcode z in market m, Telcozm
is a dummy for whether a telco distributor competes with the cable distributor in zipcode z,
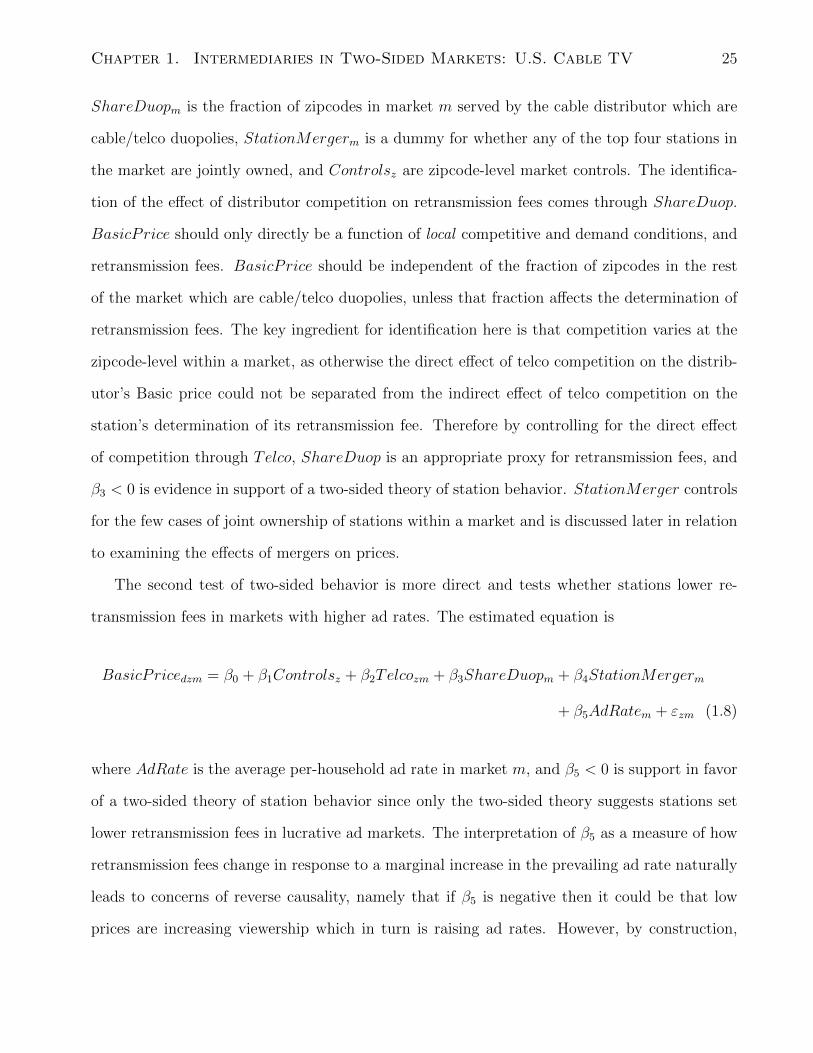
Chapter 1. Intermediaries in Two-Sided Markets: U.S. Cable TV 25
ShareDuopm is the fraction of zipcodes in market m served by the cable distributor which are
cable/telco duopolies, StationMergerm is a dummy for whether any of the top four stations in
the market are jointly owned, and Controlsz are zipcode-level market controls. The identifica-
tion of the effect of distributor competition on retransmission fees comes through ShareDuop.
BasicPrice should only directly be a function of local competitive and demand conditions, and
retransmission fees. BasicPrice should be independent of the fraction of zipcodes in the rest
of the market which are cable/telco duopolies, unless that fraction affects the determination of
retransmission fees. The key ingredient for identification here is that competition varies at the
zipcode-level within a market, as otherwise the direct effect of telco competition on the distrib-
utor’s Basic price could not be separated from the indirect effect of telco competition on the
station’s determination of its retransmission fee. Therefore by controlling for the direct effect
of competition through Telco, ShareDuop is an appropriate proxy for retransmission fees, and
β3 < 0 is evidence in support of a two-sided theory of station behavior. StationMerger controls
for the few cases of joint ownership of stations within a market and is discussed later in relation
to examining the effects of mergers on prices.
The second test of two-sided behavior is more direct and tests whether stations lower re-
transmission fees in markets with higher ad rates. The estimated equation is
BasicPricedzm = β0 + β1Controlsz + β2Telcozm + β3ShareDuopm + β4StationMergerm
+ β5AdRatem + εzm (1.8)
where AdRate is the average per-household ad rate in market m, and β5 < 0 is support in favor
of a two-sided theory of station behavior since only the two-sided theory suggests stations set
lower retransmission fees in lucrative ad markets. The interpretation of β5 as a measure of how
retransmission fees change in response to a marginal increase in the prevailing ad rate naturally
leads to concerns of reverse causality, namely that if β5 is negative then it could be that low
prices are increasing viewership which in turn is raising ad rates. However, by construction,

Chapter 1. Intermediaries in Two-Sided Markets: U.S. Cable TV 26
AdRate is a per-household ad rate that is independent of the number of viewers and therefore
unaffected by the price of Basic. As will be seen, the validity of this argument is supported
by the data since there is no evidence of per-household ad rates varying non-linearly with the
number of viewing households.
The final estimation involving zipcode-level Basic prices is used to test whether station
mergers decrease retransmission fees by mitigating an externality created by the 1992 Cable
Act mandating that local stations be sold to potential subscribers as a bundle (which results
in retransmission fees that are too high from the joint perspective of stations). The estimated
equation is identical to (8) but where β4 is the estimate of interest. StationMerger is broken
down into two types of station mergers that can occur. “Natural mergers” are those which occur
in name and are officially sanctioned by the FCC, whereas those arising from Local Marketing
Agreements (LMAs) are not officially approved and arguably violate the FCC’s local ownership
rules. NaturalMergerm is a dummy referring to the former type of merger, and LMAm a
dummy for the latter type.
Stations self-select into mergers and it is unclear how the unobserved factors that cause
stations to self select may bias the estimate of the true effect of the merger on retransmission
fees. I do not propose a way to control for this selection bias, though there is anecdotal evidence
of the direction of the bias. Natural mergers sometimes occur as a result of one station purchasing
a failing station in a market. The FCC may permit joint ownership in these instances if the
alternative is for the station to exit the market and for diversity in local content to decline.
For this reason, we may expect that natural mergers occur in markets with weak demand
characteristics which will be negatively correlated with Basic prices, biasing β4 downwards.
Mergers that occur as a result of LMAs are plausibly exogenous since they occur between
station groups (who own multiple stations across markets) and affect all stations in markets
where the station groups’ assets overlap. The LMA in the sample that affects the largest
number of stations is between Nexstar Broadcasting Group and Mission Broadcasting which is
given special consideration in the estimation since their station mergers may be less correlated

Chapter 1. Intermediaries in Two-Sided Markets: U.S. Cable TV 27
with local demand conditions than mergers that occurred between ownership groups with few
overlapping stations.16
1.5.2 The advertising market
The effects of station mergers on ad rates are also considered in this paper, and while they are
not of direct interest to the research questions at hand, they are included in a baseline estimation
of factors that influence prevailing local ad rates. The purpose of examining comparative statics
in the local ad market is to validate that per-household ad rates are responsive to market
conditions, in particular that per-household ad rates are increasing in the fraction of viewers
connecting to stations via satellite distributors. Motivated by the theory presented of the local
ad market, the station-market level estimated equation is
StationAdRatesm = α0 + α1Controlsm + α2SatellitePenetrationm
+ α3OverTheAirPenetrationm + α4Distributorsm
+ α5OwnMergerm + α6RivalMergerm+
+ α7,...,10NetworkDummiesm + α11OtherStationDummiesm + ψsm
(1.9)
where StationAdRate is the per-household ad rate of station s in marketm, SatellitePenetration
is the fraction of viewers that watch via satellite, OverTheAirPenetration is the fraction of view-
ers that watch using an antenna, Distributors is the number of distributors in the entire market
which is the appropriate level of competition in the local advertising market, and OwnMerger
and RivalMerger are dummies for whether the given station s is part of a merger and whether
a rival station in the market is involved in a merger. Both natural mergers and mergers through
LMAs are again considered. NetworkDummies simply control for whether the given station is
16As will be seen, this LMA was formed in response to the death of the owner of a station group (see section7.3).

Chapter 1. Intermediaries in Two-Sided Markets: U.S. Cable TV 28
affiliated with ABC, CBS, FOX, or NBC, and OtherStationDummies control for the presence
of other local stations such as TheCW, Univision, Telemundo, etc. To validate the theory of
the local market in general, and in particular the effect of satellite penetration on ad rates, α2
is predicted to be positive so that stations prefer viewership through satellite rather than cable
or telco.
1.6 Data
1.6.1 Sources of data
Most of the data used in this paper is original, and collected from a number of different sources.
Household addresses at the zipcode-level were collected via web scraping from the website Real-
tor.com and then over a two-week period in January 2013 were used as an input into Comcast’s
website to obtain package and price quotes. Data identifying the presence of telco competition
from Verizon at the zipcode-level was obtained from Mediacensus. Market-level data was ob-
tained from SNL Kagan, including the composition of viewership across distributors, the number
and identity of stations in each market, station ownership information, and various market-level
controls. Median income at the zipcode level was collected from IRS filings data. Advertis-
ing data at the station level were obtained from KANTAR Media. The list of known Local
Marketing Agreements between stations was provided by the American Cable Association.
1.6.2 Construction of the sample
The sample period is January, 2013. I restrict the advertising data only to include advertising
revenues collected during prime time (8-11PM) programming as this does not vary across stations
with the same parent network. Duplicate Comcast price observations within the same zipcode
are omitted as the price data collected never varies within zipcodes. The remaining number of
zipcode-level Basic price observations is roughly 5,300.

Chapter 1. Intermediaries in Two-Sided Markets: U.S. Cable TV 29
1.6.3 Variables and descriptive statistics
Summary statistics of the data broken down by the level of observation are presented in Table
1. Comcast is the largest distributor in the U.S. market with over 20 million subscribers and
is the only distributor for which I have collected Basic price data. The corresponding variable
is BasicPrice. The second and third largest distributors are DirecTV and the Dish Network,
neither of whom offer a Basic package (the cheapest package includes some national channels)
nor vary the price of that package across markets. Other large cable distributors such as Time
Warner Cable and Charter do not vary their prices across markets, at least not from information
available on their websites.17 Cox is a cable distributor that does vary its Basic price across
markets, but the number of markets is relatively small and not considered in the analysis. Nei-
ther AT&T nor Verizon vary their prices across markets.
The source of variation in distributor competition comes from the entry of telco distribu-
tor Verizon FiOS that occurred over the period of 2006-2009. Verizon is the only distributor
that conditional on being in a market, offers its services in some zipcodes in that market but
not others. This within-market variation is critical in carrying out the identification strategy
described in the previous section. Other distributors are not appropriate because cable distrib-
utors rarely overlap, satellite distributors operate in every zipcode in every market, and AT&T
U-verse operates in virtually every zipcode in markets where it has a presence because of its
history as a home phone provider.18 Verizon presence in a market is captured by the dummy
V erizonInMarket. Verizon competes with Comcast in 13 markets, and in roughly a third of all
zipcodes in the sample collected. ShareDuop represents the number of zipcodes in a given mar-
ket which are Comcast-Verizon duopolies. Conditional on Verizon being in a market, Verizon
may compete with Comcast in as few as 9% of zipcodes in the market, or as many as 84%. This
17It is possible that there are sales or special offers directed to viewers in some markets but not others, however,this information is difficult to collect.
18AT&T entered the television market by laying new fibre wires that connect to neighbourhood telephone“nodes”, but the decades-old wires that connect from those nodes to the viewer’s home are copper. Therefore,conditional on entry into a market occurring, the marginal cost of entering additional neighbourhoods was verylow and resulted in complete market coverage.

Chapter 1. Intermediaries in Two-Sided Markets: U.S. Cable TV 30
within-market variation in competition among Comcast and Verizon is important for identifying
the effect of Verizon competition on retransmission fees.
An important variable in this paper is the per-household ad rate in a market, AdRate, and
is constructed using data obtained from KANTAR Media. Each station’s aggregate advertising
revenues during the primetime hours (roughly 8-11PM) of January 2013 are divided by the num-
ber of 30 second ad spots sold by that station, then further divided by the number of viewers
in the market: cable subscribers + telco subscribers + satellite subscribers + over-the-air sub-
scribers (as estimated by SNL Kagan). Since this number is very small, it is multiplied by 1,000
for ease of interpretation. In the sample, the cost to an advertiser of potentially reaching 1,000
viewers is almost two dollars. Figures 4 and 5 plot this per-household ad rate across markets
which are ordered from largest (New York, NY) to smallest (Glendive, MT).
One of the benefits of studying local television stations is that the number of stations, their
content, and their ownership concentration is mostly fixed across markets. Table 2 shows the
frequency distribution of the number of local Big Four stations in a market and how often joint
ownership of stations occurs within a market. For much of the empirical analysis, the sample
is restricted to markets where all Big Four stations have a local presence (rather than being
imported from elsewhere) and there is no joint ownership of stations, though the exceptions
of joint ownership that occur are returned to the sample when testing for the price effects of
mergers.
There are limitations of the data collected. Despite over 5,000 zipcode-level price obser-
vations and over 600 station-market level ad rate observations, the appropriate calculation of
standard errors involves clustering at the market level, which reduces the statistical significance
of the estimates presented because both the price and ad rate data are strongly correlated
within markets. Since retransmission fees are negotiated only once every three years, it is ex-
pected that the relationship in the data between Basic prices and retransmission fees will not be
strong. However, while retransmission fees are negotiated once every few years, they do include
provisions for annual escalators so that retransmission fees in terms of absolute size are roughly

Chapter 1. Intermediaries in Two-Sided Markets: U.S. Cable TV 31
in line with the overall trend across markets and not strongly determined by the date of the
most recent agreement. A final caution is that while a number of key cross-market variables are
held constant due to technological or regulatory features of the industry, the empirical results
presented below are subject to the usual caveats of cross-sectional estimation.
1.7 Results
In this section I present the estimation results corresponding to the empirical approach section.
The main objective is to determine how stations’ retransmission fees are affected by the presence
of distributors, and whether stations pursue two-sided pricing strategies in the presence of
distributors. I also present estimates of the effects of station mergers on retransmission fees,
and conclude with a discussion of the estimates corresponding to the baseline specification of
the ad market.
1.7.1 The estimated effects of distributor market structure on re-
transmission fees
Table 3 estimates the effect of distributor competition from Verizon on retransmission fees, prox-
ied for by Comcast Basic prices. The first column includes the entire sample of Basic prices,
even those in markets with fewer than four stations which are subsequently excluded. The direct
effect of Verizon’s presence in a zipcode is negative, significant, and associated with an almost
$2 decrease in Comcast’s Basic price (a roughly 10% decrease in price as a result of direct com-
petition). The measure of downstream competition in other zipcodes in the market, ShareDuop
is the main variable of interest and is negative and significant at the 5% level, indicating that
when the rest of the market is in general more competitive, retransmission fees are lower. To be
precise, I estimate that a 10% increase in the number of Comcast-Verizon duopolies decreases
Comcast’s Basic prices by roughly $0.45. Since the actual retransmission fees are unobserved,
only certain bounds can be placed on how exactly stations react to more competition down-

Chapter 1. Intermediaries in Two-Sided Markets: U.S. Cable TV 32
stream: assuming a Comcast pass through rate between 0.5 (for monopoly downstream) or 1
(for perfect competition), and that only the Top Four stations charge meaningful retransmission
fees, I estimate that a 10% increase in Comcast-Verizon duopolies decreases a single station’s
retransmission fee by between roughly $0.11 and $0.22, or approximately 10-20% since the av-
erage retransmission fee in 2013 was roughly $1.00.19 These estimates suggest an economically
significant response by stations to the presence of telephone competition downstream.
This negative relationship persists when the sample only includes markets with all Big Four
stations represented, with almost no change in the coefficient estimates. Specification (2) will
remain as the baseline specification for subsequent estimations that include AdRate and different
controls for mergers. Specifications (3) and (4) appear for robustness, with V erizonInMarket
being a simple dummy for whether Verizon has a presence in any Comcast zipcode in the mar-
ket. Since there is no a priori way to know how market structure across zipcodes aggregates to
a market-level measure of “downstream competition”, the final specification acknowledges that
the effect of distributor competition on retransmission fees may not be linear, and may instead
affect retransmission fees only if distributor competition is “high” or “low”. There is no effect
of distributor competition when the extent of entry into the market is less than 25%, but a
negative relationship is found at higher levels. The estimated effect of median income in the
zipcode is positive as expected, and NaturalMerger is included for now as a control but will
be the focus of discussion when station mergers are examined. The relationship is also robust
to alternative specifications of ShareDuop.20
The finding of a negative relationship between Comcast’s Basic prices and the extent of
competition from Verizon suggests that when Comcast faces competition primarily from Ver-
izon, retransmission fees are lower compared to a situation where Comcast faces competition
primarily from satellite distributors. One explanation for this result is closely related to the
19The upper and lower bounds are calculated by dividing $0.45 by the number of stations (4) and the passthrough rate.
20For example, not all zipcodes have the same population, so that ShareDuop would overestimate the amountof downstream competition if duopoly zipcodes tend to have few television households. The estimated relationshipbetween ShareDuop and Comcast’s Basic prices persists after appropriately weighting zipcodes by population.

Chapter 1. Intermediaries in Two-Sided Markets: U.S. Cable TV 33
advertising market. Since satellite distributors cannot target local audiences, stations have an
incentive to charge higher fees to cable distributors since higher cable prices result in switching
to satellite (and which lessens ad market competition from cable). However, when cable distrib-
utors face competition primarily from a telco distributor such as Verizon, stations have less of an
incentive to charge higher fees to cable distributors since higher cable prices result in relatively
more substitution to telco distributors (and which has no effect on the local ad market since less
ad market competition from cable is replaced with more effective ad market competition from
telco). This explanation suggests stations care not only about the absolute number of viewers,
but also the composition of viewers across different distributors.
There are naturally alternative explanations for this finding. For example, it could be that
Verizon specifically entered markets where retransmission fees were already low for unobserved
reasons so that the extent of entry (and therefore distributor competition) is driven by already
low retransmission fees and not the other way around. Fortunately, the bulk of Verizon’s entry
occurred between 2006 and 2009 at a time when stations mostly elected “must carry” status and
were not receiving positive retransmission fees for their content, or if they were, the amounts
were negligible. Moreover, the period of 2006 to 2009 corresponds to the actual expansion of
the network; the entry decisions preceded that period since Verizon first had to complete local
franchise agreements with the relevant municipalities (a non-trivial process). While there are
unobserved demand characteristics that caused Verizon to enter some markets and not others,
these demand characteristics should be positively correlated with entry as well as positively
correlated with Comcast’s Basic prices. Therefore any bias in the estimate of the effect of
ShareDuop is expected to be positive rather than negative, indicating the true effect may even
be stronger.
1.7.2 The estimated effect of advertising rates on retransmission fees
Table 4 estimates the effect of advertising rates on retransmission fees, proxied for by Comcast
Basic prices, with the baseline specification carried forward from Table 3. The first specification

Chapter 1. Intermediaries in Two-Sided Markets: U.S. Cable TV 34
considers the continuous measure of the average per-household ad rate in a market, AdRate,
which has a negative point estimate but is not statistically significant. However, high levels of
local ad rates have a strong negative and economically meaningful effect on Basic prices that is
statistically significant at the 1% level. While in markets with all Big Four stations represented
there does not appear to be a strong linear effect of ad rates on Basic prices, when ad rates are
substantially higher, Basic prices are indeed found to be lower.
Restricting the sample only to consider markets where all four networks have a local station
allows station market structure to remain fixed across markets, however, this also restricts the
amount of variation in ad rates. Much of the variation in ad rates occurs across markets that
have fewer than four locally represented stations. Therefore, it is worthwhile to re-include
these markets into the sample to test whether large differences in ad rates result in significantly
lower cable prices. The cost of including these markets, unfortunately, is that market structure
is no longer held constant across markets and it is possible that this may affect an unbiased
estimation of the effects of ad rates on retransmission fees. Specifications (4) and (5) re-include
these markets into the sample, and the negative relationship between ad rates and Basic prices
persists and is statistically significant. Overall, the evidence supports the claim that stations
behave in a manner consistent with two-sided market theory by lowering retransmission fees in
markets with higher potential for advertising revenues.
There may again be concerns that these results are driven by reverse causality or endogeneity
resulting from unobserved demand characteristics, namely that the negative relationship between
prices and ad rates is driven by low cable prices increasing viewership which increase ad rates.
However, by construction, AdRate is a per-household ad rate so that it is independent of total
viewership. Therefore changes in the per-household ad rate may affect prices through stations’
retransmission fees, but prices do not in turn affect per-household ad rates. Figures 4 and 5
show that per-household ad rates are almost perfectly linear in viewership. Further, unobserved
market characteristics that are positively correlated with advertiser demand (and therefore ad
rates) would generally be expected to be positively correlated with demand for cable television

Chapter 1. Intermediaries in Two-Sided Markets: U.S. Cable TV 35
so that any bias in the estimate of the effect of ad rates on retransmission fees would be expected
to be positive. However, it is possible that demand specifically for the Basic package may be
negatively correlated with advertiser demand since the Basic package could be considered an
inferior good. In this case, the bias would affect the estimate negatively and be a cause of
concern.
1.7.3 The estimated effect of station mergers on retransmission fees
Table 5 estimates the effect of two types of station mergers on retransmission fees, again proxied
for by Comcast Basic prices. Natural mergers were previously included as a control but are now
part of the focus when examining the effect of mergers on Basic prices. The first specification
also includes a dummy for whether two or more stations are merged in the market as a result
of a local marketing agreement (LMA). The estimate of the effects of both types of mergers
is negative, but neither is statistically significant. The second specification breaks the LMAs
into those that were a result of the Nexstar LMA with Mission Broadcasting or not. The
Nexstar LMA is of particular interest because it affected the most markets, and also because
there is anecdotal evidence that it was formed as a result of the death of the founder of Mission
Broadcasting.21 While both Nexstar and Non-Nexstar LMAs are associated with lower Basic
prices, that negative relationship is only significant in markets affected by the Nexstar LMA.
Specifications (3) and (4) repeat the analysis with an alternative measure of prevailing ad rates
and the estimates remain the same, though the effect of natural mergers becomes marginally
significant. While the estimates do not indicate a definitively negative relationship between
station mergers and Basic prices, there is certainly no evidence that station mergers result in
higher Basic prices. However, the usual caveats of empirical estimates of mergers apply as the
bias introduced by self-selection into mergers cannot typically be controlled for.
21Anecdotal evidence suggests the surviving family was not interested in managing Mission Broadcasting, butrather than sell its station assets, maintained ownership in name and permitted Nexstar to handle all Missionoperations in exchange for a 70% royalty.
Chapter 1. Intermediaries in Two-Sided Markets: U.S. Cable TV 36
1.7.4 The effect of station mergers on advertising rates
Table 6 presents the estimates of how station concentration affects per-household advertising
rates. Instead of examining the effects of station mergers on Basic prices, the estimates are of the
effect of station mergers on per-household ad rates. The merger estimates are the primary focus
of the estimation, though it is important to first discuss the controls. Across all specifications,
the number of distributors in the entire market, Distributors, negatively impacts per-household
ad rates which is consistent with the theory of the local ad market presented earlier. Distributors
also sell local advertisements and so this variable captures the number of competitors in the ad
market. The positive and statistically significant effect of SatellitePenetration is also predicted
by the theory; the more viewers that connect to stations’ content via satellite, the higher are
per-household ad rates because the effectiveness of competition from cable and telco distributors
in the ad market is greatly reduced. The effects of Distributors and SatellitePenetration are
also economically significant. The addition of just a single distributor to the market has an esti-
mated 10% negative effect on per-household ad rates. Moreover, if one were to consider a market
where all viewers subscribe to a cable or telco distributor and then have all subscribers switch to
satellite, ad rates are estimated to increase by roughly 60%. Of course the coefficient estimates
only apply locally but they illustrate that the composition of viewership within a market greatly
affects ad rates. The negative effect of OverTheAirPenetration on ad rates is curious since
from the perspective of a station, a viewer connecting over-the-air is equally beneficial as one
connecting through a satellite subscription. One likely explanation for the effect is through the
construction of SNL Kagan’s measure of the number of over-the-air viewers; over-the-air viewers
are assumed to be a subsample of households that identify themselves as having a television but
not a paying subscription. As a result, OverTheAirPenetration is correlated with the number
of households that have a low intensity of viewing and so advertisers have a low willingness to
pay to reach them.22
22Anecdotal evidence suggests such viewers are not priced into advertising packages sold to advertisers for thisreason.

Chapter 1. Intermediaries in Two-Sided Markets: U.S. Cable TV 37
Turning to the estimates of how mergers affect per-household ad rates, the first specification
considers only a dummy variable NaturalMerger that indicates whether any stations are jointly
owned in the market. The second specification breaks these down into whether the station con-
sidered is part of the merger or it is rival stations in the market that have merged. Specifications
(3) and (4) follow the same theme, but for mergers resulting from local marketing agreements.
While the estimates are all positive, indicating both natural mergers and mergers arising from
LMAs raise local ad rates, the estimates are either not statistically significant or marginally
significant. Curiously, for both natural mergers and LMAs, the positive effect on a station’s
ad rate (if any) comes through mergers which the station itself was not involved in. Standard
models of competition typically predict the effect in reverse. The difficulty in identifying an
effect of station mergers on ad rates arises because most of the variation in ad rates comes from
smaller markets, as shown in the right tail of Figures 4 and 5. A common approach to treating
outliers is to consider a logged form of the variable; Table 7 follows the same specifications as
in Table 6 but the dependent variable is transformed into log(StationAdRatem). The effects
of both types of mergers remain positive, with a stronger effect coming from the LMAs than
the natural mergers. Table 8 follows the same approach with a threshold form of the ad rate,
(StationAdRatesm < 2.00), and is estimated as a probit model. Once again the mergers appear
to increase ad rates, but stations’ own ad rates appear to be more influenced by rivals’ mergers
than mergers in which they are directly involved.
Though the effects of mergers on both Basic prices and ad rates are only marginally statisti-
cally significant, the direction of the effects is consistent with the theory provided. Since stations
cannot control the number of ads seen by viewers, they cannot influence viewer demand. As
a result, the local ad market is “one-sided” in the sense that stations need only to consider a
typical marginal revenue versus marginal cost trade-off contained within the ad market. These
trade-offs are well understood and increased seller concentration is expected to raise ad rates.
On the subscriber side of the market, forced bundling of local stations creates a pricing external-
ity among stations that increases their marginal incentive to raise retransmission fees. Station

Chapter 1. Intermediaries in Two-Sided Markets: U.S. Cable TV 38
mergers are found to lower cable prices, and the reason could be that station mergers mitigate
the externality created by bundling because stations will be reluctant to raise retransmission
fees if it harms partner stations.
1.8 Distributors as platforms
A final issue I consider is whether intermediaries (i.e. distributors in this setting) may them-
selves behave in a two-sided manner. Since distributors also connect local advertisers to local
viewers, and derive meaningful revenues from both advertisers and viewers, it is possible that
distributors themselves may be considered platforms operating in a two-sided manner. The key
institutional feature here that is relevant is that distributors sell local advertisements using ad
slots provided to them by national channels such as ESPN. Therefore, distributors only earn
advertising revenues by being able to connect local advertisers to viewers who have access to
national channels. A distributor with exclusively Basic subscribers earns no advertising rev-
enues. It is possible that distributors themselves may behave in a two-sided manner by carefully
balancing subscription and advertising rates – markets with particularly high local advertising
rates imply that the marginal advertising benefit of a “better-than-Basic” subscriber are higher
and so the distributor should lower the price of better-than-Basic channels. Since distributors
offer multiple package tiers, it is not only the absolute price of better-than-Basic packages that
matter but also those prices relative to Basic: in a lucrative ad market, the distributor could
lower the price of better-than-Basic, raise the price of Basic, or both. The empirical challenge
is to identify evidence of distributors “steering” subscribers towards better-than-Basic.
While not the primary focus of this paper, I briefly explore whether there is evidence of
distributor intermediaries themselves behaving in a two-sided manner, though a full exploration
is reserved for future work. The first thing to note is that the marginal advertising benefit for
a distributor from inducing a subscriber to upgrade from Basic to better-than-Basic is much
greater than the benefit from a subscriber upgrading from one better-than-Basic package to

Chapter 1. Intermediaries in Two-Sided Markets: U.S. Cable TV 39
another. The reason is that a viewer upgrading from Basic to better-than-Basic moves from
being completely unreachable by the distributor’s ads to reachable. This viewer is likely to
substitute meaningfully away from local channels towards national channels. A viewer with
access to a large number of national channels upgrading to a package with even more national
channels is likely spending a similar number of hours watching national channels. In terms of
advertising revenues, a distributor is indifferent between a subscriber spending 8 hours a day
watching ESPN and a subscriber spending 4 hours on each of ESPN and ESPN2. Therefore
unless the upgrade within better-than-Basic induces a substantial increase in overall viewership,
the distributor does not stand to gain much in terms of additional advertising revenue. For
Comcast, the preference relation over the packages it offers is given by
Basic ≺ Digital Economy ≺ Digital Starter ≺ Digital Preferred ≺ Digital Premier
A two-sided analysis suggests, all else equal, that in markets with high ad rates, Comcast
should especially steer subscribers away from Basic towards Economy. There are a number
of ways to measure the extent to which Comcast is attempting to induce subscribers to choose
Economy (or better) over Basic. Natural examples are price differences and ratios. The empirical
difficulty with these measures is that the price of better-than-Basic does not take on multiple
values. In contrast with Basic prices which vary continuously, Economy is either offered at a
price of $29.95, $34.95, or not offered as an option at all.
To explore this, I construct three variables that measure whether the distributor may be
steering subscribers away from Basic towards better-than-Basic packages. The first measure of
steering is EconomyI which is a dummy for whether or not Digital Economy was offered to the
potential subscriber, EconomyII takes a value of 0 for Economy not being offered, 1 for being
offered at $34.95, and 2 for being offered at $29.95. Difference is the price difference between
the cheapest better-than-Basic package offered and the price of Basic, and finally Ratio is the
ratio of the cheapest better-than-Basic package to the price of Basic. For the first two measures,

Chapter 1. Intermediaries in Two-Sided Markets: U.S. Cable TV 40
larger numbers represent a greater probability of Economy being offered.
Table 9 presents the various measures of steering by prevailing ad rates. There is little
evidence of steering between per-household ad rates of 1 and 3, but the likelihood of Economy
being offered increases dramatically when ad rates are substantially higher. For Difference
and Ratio, lower numbers are evidence of steering, but there is not much change across different
thresholds of ad rates. Note that in this table AdRate refers to station ad rates, as distributor
ad rates at the local level are not observed. While distributor ad rates should be positively
correlated with station ad rates in the same market, this remains a limitation of the analysis.
Overall there is some evidence of distributors behaving in a two-sided manner, however this
finding is preliminary and remains an avenue for future research. That distributors sell local ads
is likely a curiosity of the U.S. cable television market, but meaningful intermediaries in other
two-sided markets may also have this property which only serves to strengthen their relevance
in the analysis of two-sided markets.
1.9 Conclusion
This paper examined the role of intermediaries in two-sided markets by considering the case
of cable distributors that act as intermediaries between local television stations and viewers.
Because distributors are required by the 1992 Cable Act to bundle local stations, and because
many distributors do not vary the price of this bundle across markets, it is unclear to what
extent stations can affect the final prices paid by viewers. This paper followed Comcast, the
largest distributor in the U.S., because it is a distributor that does vary the price of its Basic
package across markets and even zipcodes. Since station concentration scarcely varies across
markets, but because Comcast faces different competitive constraints in different markets, the
effect of distributor concentration on station price setting behavior can be examined.
This paper has three key findings. The first is that retransmission fees that stations charge
Comcast are lower in markets where per-household advertising revenues are high. This is a

Chapter 1. Intermediaries in Two-Sided Markets: U.S. Cable TV 41
basic test for whether stations price in accordance with two-sided market theory. When per-
household advertising rates are high, the marginal benefit of an additional subscriber is higher
and so stations should set lower fees in these markets. Generally speaking, this suggests that
platforms may continue to pursue two-sided pricing strategies in the presence of intermediaries.
I also examine two ways in which intermediaries (distributors) in this industry affect platform
(station) behavior. The first is that because stations have a preference for how viewers access
their content, stations have an incentive to charge different retransmission fees to different
distributors. Because satellite distributors do not participate in the local ad market, stations
strictly prefer that viewers access their content through satellite distributors rather than cable
or telephone distributors that do participate in the local ad market. I find evidence that stations
charge higher retransmission fees to cable distributors when viewers’ next-best substitute to cable
is satellite, but that stations charge relatively lower retransmission fees to cable distributors when
viewers’ next-best substitute is a telco distributor such as Verizon FiOS. The explanation for
this finding is that when a telco distributor is absent, stations recognize that higher cable prices
induce viewer switching to satellite (which lessens competition from cable in the ad market),
whereas with a telco distributor present, higher cable prices mostly induce switching to telco
(which has no effect on competition in the ad market). The main implication of this finding
is that in general platforms may have preferences over which intermediaries end users choose,
and may therefore set different input prices to different intermediaries. Such variation in input
prices cannot be explained by a model that assumes platforms directly interact with both groups
of end users. This is important to our understanding of two-sided markets because final prices
observed by both groups of end users will be a function of these input prices.
The second way in which intermediaries affect platform pricing in this industry is through
distributor bundling of local stations as mandated by the 1992 Cable Act. Forced bundling of
local stations is predicted to raise retransmission fees relative to a situation where distributors
price stations a la carte. The reason is that bundling creates a pricing externality among stations
that pushes retransmission fees higher than they otherwise would be; a higher retransmission

Chapter 1. Intermediaries in Two-Sided Markets: U.S. Cable TV 42
fee charged by one station increases the final price of all local stations, and hence retransmission
fees are set too high from the joint perspective of stations. In examining two types of station
mergers that occur in my sample, I find evidence that station mergers lower retransmission fees,
which suggests stations are reluctant to impose the cost of higher retransmission fees on partner
stations. The implication of this finding is that non-price actions taken by intermediaries, such
as bundling of rival platforms, may also affect the pricing incentives of platforms.
The findings of this paper not only have implications for our understanding of two-sided
markets, but they also have implications for policy in the U.S. cable television industry which
remains governed by the 1992 Cable Act. This Act was introduced at a time when the viewing
and advertising sides of the market were essentially segmented. Today, the two sides of the
market are closely linked by retransmission fees; these fees affect viewership, and viewership
in turn affects advertising rates, and so on. The first result of this paper, that retransmission
fees are lower in markets with higher per-household advertising revenues, suggests that the local
television market warrants consideration as a two-sided market. Whether a market is two-sided
or not is important policy prescriptions in these markets may differ substantially from those in
standard “one-sided” markets. The final result of the paper highlights this point by examining
an example of a policy introduced to the industry at a time when it was essentially “one-sided”.
Bundling of local stations, originally intended to ensure access to local television content, now
creates a pricing externality among stations that raises retransmission fees and cable prices,
reducing access to local television content. The finding that bundling of local stations raises
cable prices suggests that either station mergers within markets should be permitted (since they
mitigate this externality) or that regulators should reconsider forcing distributors to bundle local
stations.

Chapter 1. Intermediaries in Two-Sided Markets: U.S. Cable TV 43
Figure 1.1: Revenue flows in a local television market. Cable, telephone, and satellite distribu-tors receive monthly subscription revenues from viewers. Local television stations receive per-subscriber fees “retransmission fees” for their content. Stations, as well as cable and telephonedistributors, receive local advertising revenues, however satellite distributors do not participatein the local advertising market.

Chapter 1. Intermediaries in Two-Sided Markets: U.S. Cable TV 44
Table 1.1: Summary Statistics
Comcast Zipcode-Level Variables Obs Mean Std Dev Min Max Markets
BasicPricezm 5384 20.46 5.10 5.05 29.97 100
Economy Price 1502 31.60 2.35 29.95 34.95 100
Starter Price 5321 51.65 13.61 29.99 70.90 100
Preferred Price 5334 62.76 20.08 39.99 90.10 100
Premier Price 3023 82.90 5.20 69.99 84.99 100
V erizonzm 5384 0.19 0.39 0 1 100
Incomezm (Median, 1000s) 5264 17.09 9.73 0 73.70 100
Comcast Market-Level Variables Obs Mean Std Dev Min Max Markets
V erizonInMarketm 5384 0.31 0.46 0 1 100
FourStationsm 5384 0.94 0.24 0 1 100
NaturalMergerm 5384 0.08 0.28 0 1 100
ShareDuopm|ShareDuopm ≥ 0 5384 0.20 0.32 0 0.84 100
ShareDuopm|ShareDuopm > 0 1645 0.65 0.22 0.09 0.84 13
(0.00 < ShareDuopm ≤ 0.25) 5384 0.03 0.17 0 1 13
(0.25 < ShareDuopm ≤ 0.50) 5384 0.03 0.16 0 1 13
(0.50 < ShareDuopm ≤ 0.75) 5384 0.10 0.30 0 1 13
(0.75 < ShareDuopm ≤ 1.00) 5384 0.15 0.36 0 1 13
AdRatem 5384 1.44 0.66 0.62 14.38 100
(AdRatem > 2.00) 5384 0.07 0.26 0 1 100
LMAm 5384 0.06 0.28 0 1 100
NexstarLMAm 5384 0.02 0.12 0 1 100
NonNexstarLMAm 5384 0.05 0.23 0 1 100
Advertiser Level Variables Obs Mean Std Dev Min Max Markets
StationAdRateABCm 195 1.58 1.58 0.20 13.82 195
StationAdRateCBSm 191 1.84 1.48 0.43 14.38 191
StationAdRateFOXm 183 1.52 0.76 0.47 6.12 183
StationAdRateNBCm 192 1.39 0.93 0.46 6.57 192
AdRatem 210 1.84 1.67 0.62 14.38 210
FourStationsm 210 0.78 0.42 0 1 210
NaturalMergerm 210 0.12 0.32 0 1 210
Distributorsm 210 3.50 1.66 1 9 210
SatellitePenetrationm 210 0.45 0.16 0.09 1 210
OverTheAirPenetrationm 210 0.13 0.07 0.01 0.61 210

Chapter 1. Intermediaries in Two-Sided Markets: U.S. Cable TV 45
Table 1.2: Frequency distribution of number of stations and number of owners in a market
1 2 3 4 Stations
1 10 10
2 0 12 12
3 1 2 18 21
4 0 2 22 143 167
Owners 11 16 40 143 210

Chapter 1. Intermediaries in Two-Sided Markets: U.S. Cable TV 46
Figure 1.2: Aggregate retransmission revenues and number of television households (in millionsof dollars and millions, respectively), by year. Retransmission revenues are steadily increasingand predicted to continue upwards, whereas the number of television households has remainedvirtually unchanged. Source: SNL Kagan and Nielsen.
Figure 1.3: Estimated retransmission fees per subscriber for various station groups in 2012(measured in dollars). Source: SNL Kagan.

Chapter 1. Intermediaries in Two-Sided Markets: U.S. Cable TV 47
Figure 1.4: Per-household ad rates across all 210 markets sorted from largest number of house-holds to smallest. Diamonds represent markets with all Big Four stations present, and squaresrepresent markets where at least one Big Four station is imported from out of market.
Figure 1.5: Per-household ad rates across the 100 Comcast markets sorted from largest numberof households to smallest. Diamonds represent markets with all Big Four stations present, andsquares represent markets where at least one Big Four station is imported from out of market.

Chapter 1. Intermediaries in Two-Sided Markets: U.S. Cable TV 48
Table 1.3: Estimated Effect of Downstream Competition on Retransmission Fees (proxied byComcast’s Basic Prices). Dependent variable is Comcast’s BasicPricezm
Model Specification (1) (2) (3) (4) (5)
V erizonzm -1.86*** -1.84*** -2.51*** -1.84*** -1.36*(0.66) (0.68) (0.81) (0.68) (0.70)
ShareDuopm -4.46** -4.45** -3.99(2.12) (2.14) (4.01)
V erizonInMarketm -2.59* -0.35(1.38) (2.28)
(0.00 < ShareDuopm ≤ 0.25) 0.54(1.11)
(0.25 < ShareDuopm ≤ 0.50) -6.37***(1.59)
(0.50 < ShareDuopm ≤ 0.75) -1.40(1.45)
(0.75 < ShareDuopm ≤ 1.00) -4.71***(1.75)
Incomezm 0.04** 0.04* 0.03* 0.03* 0.03(0.02) (0.02) (0.02) (0.02) (0.02)
NaturalMergerm -5.64 -5.65 -5.67 -5.66 -5.71(3.51) (3.51) (3.52) (3.52) (3.51)
FourStationsm 5.03(3.53)
Constant 21.18*** 21.22*** 21.28*** 21.24*** 21.39***(0.60) (0.60) (0.63) (0.63) (0.60)
Four Stations Only N Y Y Y Y
R2 0.17 0.17 0.16 0.17 0.21
Observations 5264 4927 4927 4927 4927
∗ p < 0.10, ∗∗ p < 0.05, ∗∗∗ p < 0.01
Standard errors are clustered at the market level

Chapter 1. Intermediaries in Two-Sided Markets: U.S. Cable TV 49
Table 1.4: Estimated Effect of Local Advertising Rates on Retransmission Fees (proxied byComcast’s Basic Prices). Dependent variable is Comcast’s BasicPricezm
Model Specification (1) (2) (3) (4) (5)
V erizonzm -1.86*** -1.86*** -1.84*** -1.85*** -1.87***(0.69) (0.69) (0.68) (0.67) (0.66)
ShareDuopm -4.28* -4.69** -5.14** -4.30* -4.71**(2.23) (2.13) (1.99) (2.21) (2.10)
AdRatem -0.93 -0.46**(1.56) (0.21)
AdRatem > 2.00) -5.01*** 1.50(1.59) (1.29)
(1.00 < AdRatem ≤ 1.50) -0.45(1.17)
(1.50 < AdRatem ≤ 2.00) 0.77(1.29)
(2.00 < AdRatem ≤ 2.50) -5.44***(1.84)
(2.50 < AdRatem) -3.44***(0.99)
FourStationsm -5.18 -3.84(4.13) (3.62)
FourStationsm x AdRatem -0.47(1.57)
FourStationsm x (AdRatem > 2.00) -6.52***(2.06)
Incomezm 0.04** 0.04* 0.03* 0.04** 0.04**(0.02) (0.02) (0.02) (0.02) (0.02)
NaturalMergerm -5.60 -5.83 -5.60 -5.59 -5.83*(3.54) (3.51) (3.54) (3.54) (3.51)
Constant 22.37*** 21.38*** 21.64*** 27.53*** 21.36***(2.17) (0.60) (0.91) (3.69) (0.60)
Four Stations Only Y Y Y N N
R2 0.17 0.19 0.20 0.17 0.19
Observations 4927 4927 4927 5264 5264
∗ p < 0.10, ∗∗ p < 0.05, ∗∗∗ p < 0.01
Standard errors are clustered at the market level

Chapter 1. Intermediaries in Two-Sided Markets: U.S. Cable TV 50
Table 1.5: Estimated Effect of Local Marketing Agreements on Retransmission Fees (proxiedby Comcast’s Basic Prices). Dependent variable is Comcast’s BasicPricezm
Model Specification (1) (2) (3) (4)
V erizonzm -1.84*** -1.84*** -1.84*** -1.84***(0.69) (0.69) (0.68) (0.68)
ShareDuopm -4.43* -4.44* -4.85** -4.85**(2.24) (2.23) (2.14) (2.14)
AdRatem -0.83 -0.74(1.57) (1.58)
(AdRatem > 2.00) -5.14*** -5.13***(1.60) (1.60)
NaturalMergerm -5.73 -5.73 -5.99* -5.98*(3.54) (3.54) (3.52) (3.52)
LMAm -1.38 -1.68(1.91) (1.91)
NonNexstarLMAm -0.39 -0.60(1.58) (1.57)
NexstarLMAm -3.23** -3.66**(1.44) (1.42)
Incomezm 0.03* 0.03* 0.03* 0.03*(0.02) (0.02) (0.02) (0.02)
Constant 22.41*** 22.30*** 21.59*** 21.58***(2.18) (2.18) (0.63) (0.63)
Four Stations Only Y Y Y Y
R2 0.18 0.18 0.20 0.20Observations 4927 4927 4927 4927
∗ p < 0.10, ∗∗ p < 0.05, ∗∗∗ p < 0.01
Standard errors are clustered at the market level

Chapter 1. Intermediaries in Two-Sided Markets: U.S. Cable TV 51
Table 1.6: Effect of “Natural Mergers” and Local Marketing Agreements on Advertising Rates.Dependent variable is StationAdRatesm
Model Specification (1) (2) (3) (4) (5)
NaturalMergerm 0.20 0.21 0.21 0.28*(0.16) (0.16) (0.17) (0.15)
OwnMergerm 0.17(0.21)
RivalMergerm 0.24(0.16)
LMAm 0.17 -1.45***(0.10) (0.35)
OwnLMAsm 0.11(0.10)
RivalLMAsm 0.25*(0.13)
FourStationsm -1.75***(0.28)
LMAm x FourStationsm 1.57***(0.35)
Distributorsm -0.09*** -0.09*** -0.08*** -0.08*** -0.15***(0.03) (0.03) (0.02) (0.03) (0.04)
SatellitePenetrationm 1.09** 1.10** 1.04** 1.05** 2.81***(0.50) (0.49) (0.52) (0.52) (0.97)
OverTheAirPenetrationm -1.88* -1.89* -1.78* -1.79* -5.28***(0.98) (0.97) (0.96) (0.95) (1.73)
Constant 1.26*** 1.26*** 1.21*** 1.20*** 2.76***(0.21) (0.21) (0.20) (0.20) (0.38)
Parent Network Dummies Y Y Y Y Y
Four Stations Only Y Y Y Y N
Other Station Dummies Y Y Y Y Y
R2 0.19 0.20 0.21 0.21 0.39
Observations 661 661 661 661 761
∗ p < 0.10, ∗∗ p < 0.05, ∗∗∗ p < 0.01
Standard errors are clustered at the market level

Chapter 1. Intermediaries in Two-Sided Markets: U.S. Cable TV 52
Table 1.7: Effect of “Natural Mergers” and Local Marketing Agreements on Advertising Rates.Dependent variable is log(StationAdRatesm)
Model Specification (1) (2) (3) (4) (5)
NaturalMergerm 0.08 0.08 0.08 0.02(0.08) (0.08) (0.08) (0.01)
OwnMergerm 0.04(0.10)
RivalMergerm 0.12(0.09)
LMAm 0.13** -0.03*(0.06) (0.02)
OwnLMAsm 0.11*(0.06)
RivalLMAsm 0.15**(0.07)
FourStationsm -0.92***(0.07)
LMAm x FourStationsm 0.98***(0.02)
Distributorsm -0.05*** -0.05*** -0.05*** -0.05*** -0.02**(0.02) (0.02) (0.02) (0.02) (0.01)
SatellitePenetrationm 0.52** 0.53** 0.48** 0.49** 0.36*(0.24) (0.24) (0.24) (0.24) (0.20)
OverTheAirPenetrationm -1.24** -1.25** -1.16** -1.17** -0.81**(0.60) (0.60) (0.57) (0.57) (0.34)
Constant 0.23* 0.22* 0.18 0.18 0.92***(0.13) (0.13) (0.13) (0.13) (0.09)
Parent Network Dummies Y Y Y Y Y
Four Stations Only Y Y Y Y N
Other Station Dummies Y Y Y Y Y
R2 0.20 0.20 0.21 0.21 0.83
Observations 661 661 661 661 761
∗ p < 0.10, ∗∗ p < 0.05, ∗∗∗ p < 0.01
Standard errors are clustered at the market level
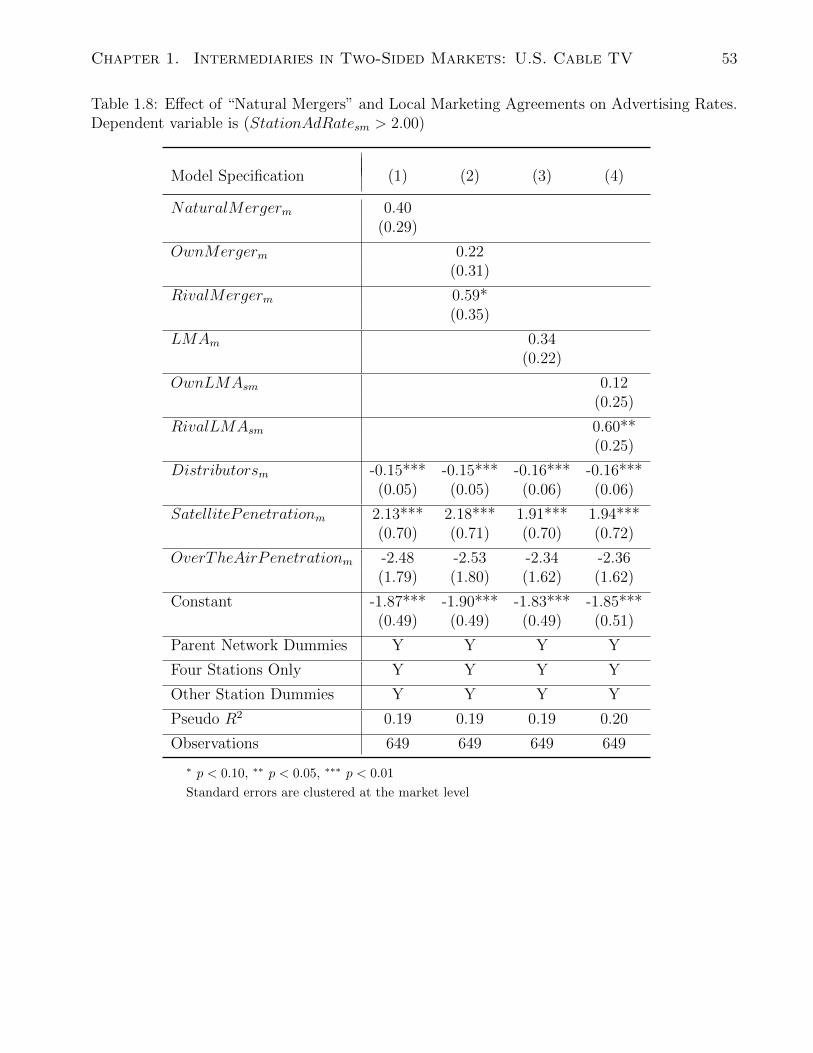
Chapter 1. Intermediaries in Two-Sided Markets: U.S. Cable TV 53
Table 1.8: Effect of “Natural Mergers” and Local Marketing Agreements on Advertising Rates.Dependent variable is (StationAdRatesm > 2.00)
Model Specification (1) (2) (3) (4)
NaturalMergerm 0.40(0.29)
OwnMergerm 0.22(0.31)
RivalMergerm 0.59*(0.35)
LMAm 0.34(0.22)
OwnLMAsm 0.12(0.25)
RivalLMAsm 0.60**(0.25)
Distributorsm -0.15*** -0.15*** -0.16*** -0.16***(0.05) (0.05) (0.06) (0.06)
SatellitePenetrationm 2.13*** 2.18*** 1.91*** 1.94***(0.70) (0.71) (0.70) (0.72)
OverTheAirPenetrationm -2.48 -2.53 -2.34 -2.36(1.79) (1.80) (1.62) (1.62)
Constant -1.87*** -1.90*** -1.83*** -1.85***(0.49) (0.49) (0.49) (0.51)
Parent Network Dummies Y Y Y Y
Four Stations Only Y Y Y Y
Other Station Dummies Y Y Y Y
Pseudo R2 0.19 0.19 0.19 0.20
Observations 649 649 649 649
∗ p < 0.10, ∗∗ p < 0.05, ∗∗∗ p < 0.01
Standard errors are clustered at the market level
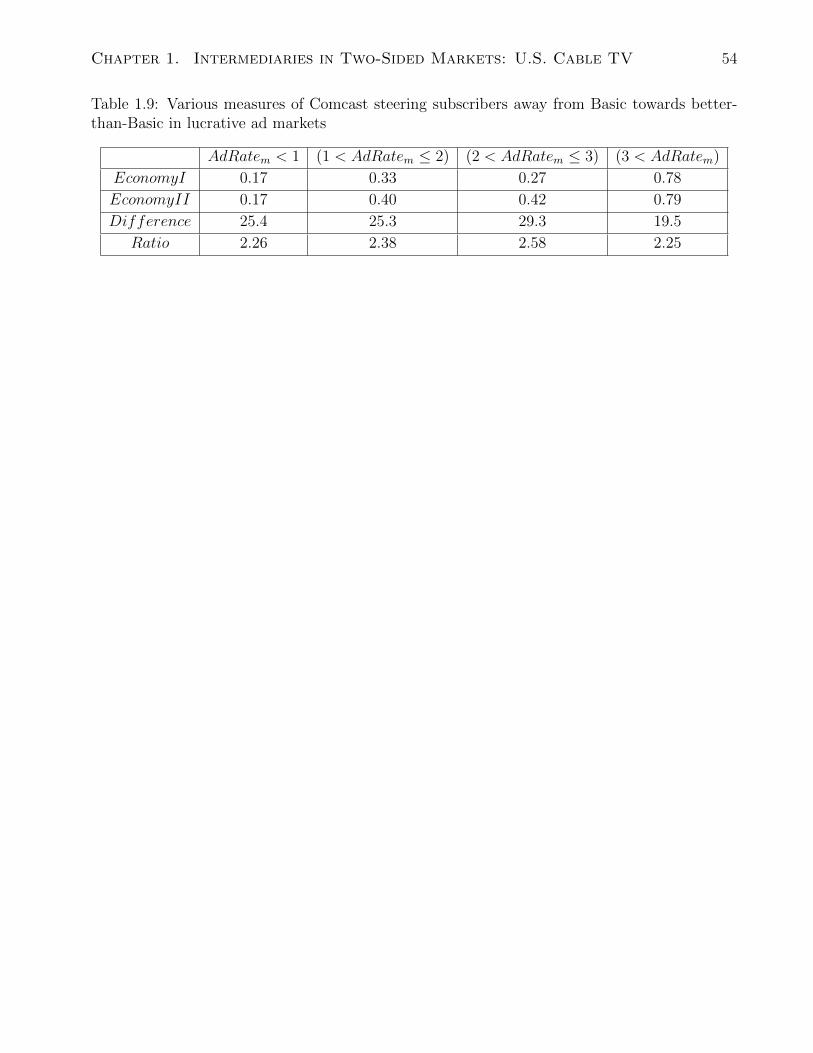
Chapter 1. Intermediaries in Two-Sided Markets: U.S. Cable TV 54
Table 1.9: Various measures of Comcast steering subscribers away from Basic towards better-than-Basic in lucrative ad markets
AdRatem < 1 (1 < AdRatem ≤ 2) (2 < AdRatem ≤ 3) (3 < AdRatem)
EconomyI 0.17 0.33 0.27 0.78
EconomyII 0.17 0.40 0.42 0.79
Difference 25.4 25.3 29.3 19.5
Ratio 2.26 2.38 2.58 2.25

Chapter 2
The Effects of Platform MFNs on
Competition and Entry (with Kenneth
S. Corts)
2.1 Introduction
Recent interest from competition authorities in contracts that reference rivals has dovetailed
with interest in platforms and two-sided markets to draw significant attention to the effects of
a type of contract known variously as a platform parity agreement or platform most-favored
nation agreement. In settings in which a seller sets a price and transacts with a buyer through
an intermediary platform (which may charge a fee or a commission to the seller), such contracts
restrict the seller not to sell through any alternative platform at a lower price. Most-favored-
nation contracts and other contracts that reference rivals have recently been the subject of a US
Department of Justice Antitrust Division workshop (Baker and Chevalier, 2013), a UK Office
of Fair Trading report (Lear, 2012), and a speech by the Deputy Assistant Attorney General of
the US DOJ Antitrust Division (Scott Morton, 2012). Platform MFN agreements in particular
have played a key role in recent antitrust cases involving credit cards, ebooks, and health care
55

Chapter 2. Platform MFNs, Competition and Entry 56
networks (see Salop and Scott Morton (2013) for an overview). The policy-oriented literature
conjectures that these agreements can raise prices for consumers and profits for platforms, and
also that they may limit entry of low-cost business models. However, there exists little theoretical
work to support or qualify these assertions. Analyzing these agreements in an explicit model,
we find support for some of these claims, but with important caveats.
To fix ideas, consider two examples of such a platform MFN policy. First, Apple facilitates the
sale of ebooks through its online platform, where publishers set retail prices and pay a fraction
of their revenue to Apple. Apple has in place agreements that require publishers not to sell the
same ebooks through other channels at lower prices. Second, a bank that issues VISA cards
processes transactions between retailers and consumers at prices determined by the retailer,
with the retailer paying a fee to the card-issuing bank. VISA has in place contractual provisions
that limit the ability of the retailer to offer lower retail prices for purchases made through other
payment mechanisms. The conventional wisdom about these agreements, which appears with
varying degrees of clarity or explicitness in Schuh, Shy, Stavins, and Triest (2012), Salop and
Scott Morton (2013) and in chapter 6 of the Lear (2012) report for the OFT, among other
places, is simple.1 These policies create an incentive for the platform to raise fees in attempt to
squeeze the retailer, since the platform MFN limits the ability of the platform to pass through
higher fees in the form of higher retail prices. These higher fees in turn lead in equilibrium
to higher retail prices and potentially higher fees and profits for platforms. In addition, such
policies disadvantage potential platform entrants with low-end business models by eliminating
the entrant’s ability to win customers away from the incumbent through lower prices.
However, we find that the effects of these policies are not quite that simple. With respect to
price and profit effects, we find that platform MFN agreements do tend to raise prices, but also
that they may raise prices so much that they hurt industry profits. Whether this is the case
depends on the substitutability of the platforms. With respect to effects on entry, we find that
a platform MFN agreement may encourage or discourage entry when the entrant’s competitive
1One of the authors of the present paper (Corts) was retained by Lear to coauthor the cited report.
Chapter 2. Platform MFNs, Competition and Entry 57
position is exogenous, depending on how different from the incumbent the entrant is. When
the entrant’s competitive position is endogenous, a platform MFN agreement may distort the
entrant’s choice toward a lower-end business model even when it fails to deter entry. Our results
therefore support some aspects of the conventional wisdom, but add important nuance and
qualification that aid in understanding the effects of these platform MFN policies.
The most relevant theoretical paper is Johnson (2013), which studies an environment in
which multiple sellers sell through multiple platforms under either the “wholesale” model (in
which sellers set wholesale prices and platforms set retail prices, as in traditional bricks-and-
mortar retailing) or the “agency” model (in which sellers set retail prices and platforms set
commissions paid by the retailer, as in many online marketplaces such as Amazon Marketplace,
eBay’s fixed price auctions, and the market for ebooks). That paper is primarily concerned with
the comparison between these two models; however, one section addresses the effect of platform
MFN agreements on the equilibrium under the agency model. That paper finds, as do we, that
platform MFNs raise platform fees and retail prices; however, it also shows, in contrast to our
results, that platform MFNs always raise industry profits and are always adopted by platforms
in equilibrium. These differences arise because of a difference in the way demand is modeled,
which is discussed in more detail in the text. Johnson does not consider asymmetric firms and
only tangentially considers effects on entry incentives, noting that in some circumstances the
price-increasing power of platform MFNs might induce socially desirable entry.
In a paper on the dissemination of mobile applications, Gans (2012) studies a model in
which the firm controlling the mobile platform can offer direct access to app purchases within
the platform, while app developers can also sell directly to consumers. He is primarily focused
on the difficulties platforms have in charging for the platform in the presence of hold-up by
apps developers, and he shows that a platform MFN policy can help solve this problem. The
literature on payment processing arrangements in credit card markets largely either ignores
the no-surcharge rule (which is arguably tantamount to a platform MFN in this setting) or
takes it for granted. A notable exception is Rochet and Tirole (2002), which briefly discusses the

Chapter 2. Platform MFNs, Competition and Entry 58
ambiguous welfare effects of abolishing the no-surcharge rule in their model. Thus, the literature
is quite limited; in this context, we make a significant contribution by explicitly considering the
effects of platform MFN policies in a fairly general setting, including effects on the potential
entry of a differentiated firm.
Section 2 lays out the model. Section 3 considers the effects of platform MFN agreements on
competition between two symmetric incumbent platforms. Section 4 considers the equilibrium
adoption of such agreements. Section 5 analyzes the effect of such policies on incentives for entry
and endogenous choice of competitive position for an entrant platform. Section 6 concludes by
relating this paper to recent antitrust activity in the credit card, ebook, and health insurance
markets.
2.2 Model
A single seller S sells its products to buyers through one or both of two platforms (or “market-
places”) Mi, i = {1, 2}. The seller incurs three kinds of costs: fixed cost KS, constant marginal
and average production cost cS, and a per-unit transaction fee fi charged by each platform i.2
The seller sets a price pi on each platform i. Buyer demand through a particular platform i
is given by qi(p). Each platform i incurs a fixed cost Ki and a constant marginal and average
production cost ci.
The timing is as follows. The platforms simultaneously choose whether to require platform
MFN policies. They then simultaneously choose transaction fees fi. The seller then sets prices
pi, abiding by the terms of any platform MFN policies in place. The seller earns profits πS =∑i=1,2[pi − fi − cS]qi(p); each platform i earns profit of πi = [fi − ci]qi(p). For the analysis of
competition between incumbent platforms (sections 3 and 4), we ignore any fixed costs, which
2In many applications, platforms charge a commission proportional to retail price rather than a fixed per-unitfee. We expect that our qualitative results would apply to both types of fees. In general, in these kinds of models,a proportional commission has the effect of raising the seller’s “perceived marginal cost” (as in Johnson (2013))because of the divergence between the taxed revenue and the maximized profit, whereas in our model the fixedunit fee directly raises that marginal cost.

Chapter 2. Platform MFNs, Competition and Entry 59
will not affect pricing or fee-setting incentives. Fixed costs are introduced in section 5, in which
we focus on the effect of platform MFN policies on entry decisions.
Because the final stage involves only the single seller’s pricing decision, it is convenient to
suppress this stage of the game in the analysis by writing platform-level demand functions
as a function of the transaction fees fi rather than prices pi, where these demand functions
indicate demand at the seller’s optimal prices given the transaction fees. Note that the seller is
effectively a simple multi-product monopolist (where the underlying product sold through each
of the platforms is thought of as a distinct product) facing demand qi(p) and with potentially
different marginal costs (cS + f1) and (cS + f2) for its two “products”. However, the seller
may also face a constraint imposed by the presence of one or more platform MFN agreements.
Therefore, this implied demand function varies with the platform MFN regime. We denote this
implied demand function qki (f), where k = 0, 2 denotes how many platform MFN agreements
are present. The case of a single platform MFN agreement is analyzed separately and does not
require its own implied demand functions for reasons that will become apparent later.
We analyze this model under two different scenarios for demand: “general” and “linear”. We
first assume that an unspecified underlying general demand function induces a unique optimal
pricing rule for the single multi-product seller, yielding a differentiable and well-behaved im-
plied demand function on transaction fees, qki (f). We later assume that the underlying demand
function is a familiar linear differentiated-products demand function, which we show satisfies all
of the assumptions we maintain in the general demand case.
2.2.1 General Demand
In the general demand case, we assume that the multi-product seller’s optimal pricing, given
underlying demand and a given set of transaction fees, is well-behaved, yielding an implied
demand function qki (f) with the following properties.
(A1) Implied demand is a differentiable function qki (f).
(A2) Implied demand is not too nonlinear; in particular, second-order effects do not over-

Chapter 2. Platform MFNs, Competition and Entry 60
whelm first-order effects in signing second-order conditions or the slopes of best-response func-
tions.
(A3) Implied demand for each platform is downsloping in that platform’s own fee,∂qki∂fi
< 0,
and aggregate demand is downsloping in a common fee (for f1 = f2 = f ,∂qki∂f
< 0).
(A4) Quantity demanded is more responsive to one’s own fee when there are no platform
MFN agreements than when there are two platform MFN agreements:∂q0i∂fi
<∂q2i∂fi
< 0.
(A5) Quantity demanded is increasing in the rival’s fee if and only if there are no platform
MFN agreements:∂q0i∂fj
> 0 >∂q2i∂fj
.
Again, each of these properties will subsequently be shown to hold for a linear differentiated
products demand model. In addition, the appendix will (eventually) show that they hold for
general (non-linear) demand functions satisfying typical regularity conditions (these properties
can be derived by applying the implicit function theorem to the seller’s multi-product pricing
first-order conditions). Conditions (A4) and (A5) should be intuitive, but they merit further
discussion because they lie at the heart of the strategic effects of platform MFN agreements
(hereafter, PMFNs).
First consider (A4). When there are no PMFNs in effect, the multi-product seller reacts to
a fee increase by one platform by raising that platform’s price, which diverts demand to the
other, now relatively higher-margin, platform. When there are two PMFNs in effects, the seller
is constrained to set a uniform prices across platforms. As a result, it has reduced flexibility
in diverting sales to the other platform. Raising price on one platform means raising price on
both platforms. While the higher fee on one platform does induce the seller to raise price on
that platform (and on the other platform), this is now more costly in lost demand on both
platforms, and the seller optimally chooses to raise price on the fee-raising platform less than
it would have absent the PMFN agreements. Now consider (A5). Absent PMFNs, the seller’s
price increase for a platform in response to a fee increase on that platform increases demand for
the non-fee-raising platform. But, with two PMFNs, the seller’s uniform price increase reduces
demand for both platforms.
Chapter 2. Platform MFNs, Competition and Entry 61
2.2.2 Linear Demand
We show that all of the above assumptions for general demand do in fact hold when the under-
lying demand takes the familiar linear differentiated products form: qi(p) = a− bpi + dpj,where
a, b, d > 0 and b > d. In this case we also assume ci + cs <ab−d , where this quantity is the
symmetric choke price. It is in fact straightforward to determine the optimal pricing rule for
the two-product monopoly seller under both the 0-PMFN and 2-PMFN regimes. Maximizing
the seller’s profit yields optimal prices that are linear in the platform fees. These optimal pric-
ing rules give non-negative quantities as long as the seller’s total effective marginal cost is less
than the symmetric choke price–that is, cS + fi <ab−d , which can be shown to hold for all
profit-maximizing fi under the assumption on cS + ci above.
Substituting the optimal pricing rules into the demand function yields implied demand as a
function of transaction fees:
q0i (f) = [a− b(cs + fi) + d(cs + fj)]/2
q2i (f) = [2a− (b− d)(2cs + fi + fj)]/4.
It is easy to check that these implied demand functions immediately satisfy conditions (A1)-(A5).
2.3 Competitive effects of platform MFNs
This section analyzes a model with two symmetric incumbent platforms: the platforms have the
same cost structure and demand is symmetric (qi(pi = y, pj = z) = qj(pj = y, pi = z)). In this
section, we analyze the best-response functions and equilibrium transaction fees that arise in
the stage 2 subgame in which platforms simultaneously set fees. This allows us to characterize
the impact of PMFN policies on competition, comparing the cases with and without PMFN
policies present.

Chapter 2. Platform MFNs, Competition and Entry 62
2.3.1 General Demand
Platform i’s profit is given by πi = (fi − ci)qki (f), which yields a first-order condition of
∂πi∂fi
= (fi − ci)∂qki (f)
∂fi+ qki (f) = 0.
This yields a second-order condition of
∂2πi∂f 2
i
= (fi − ci)∂2qki (f)
∂f 2i
+ 2∂qki (f)
∂fi.
The last term is negative by (A3); the second-order condition therefore holds by (A2).
Totally differentiating the FOC gives the slope of the best-response function in the fee-setting
game:
dfkidfj
= −∂qki (f)
∂fj+ (fi − ci)∂
2qki (f)
∂fi∂fj
(fi − ci)∂2qki (f)
∂f2i+ 2
∂qki (f)
∂fi
.
The denominator is exactly the second-order condition; therefore, the slope of the best-response
function has the same sign as the numerator. By (A2), the best-response function therefore has
the same sign as the first-order cross-partial∂qki (f)
∂fj. By (A5), this implies a game of strategic
substitutes with 0 PMFNs and a game of strategic complements with two PMFNs. Assume
the existence of a symmetric equilibrium under both 0 PMFNs and 2 PMFNs. Each of these
equilibria must be unique by the monotonicity of the best-response functions. Denote these
equilibrium fees fk∗i .
The first result of interest arises from comparing these equilibria. In fact, as the conventional
wisdom suggests, fees and prices are higher when both firms adopt PMFN policies. To see this,
note that by (A4) the FOC for 2 PMFNs evaluated at the 0 PMFN equilibrium fees is positive.
Thus, the symmetric equilibrium fees must be higher under 2 PMFNs than under 0 PMFNs.
Moreover, (A3) implies that these higher fees also lead to higher prices. Specifically, the fact
that quantity falls as both fees rise implies that the seller’s prices are rising along with fees.
These results can be summarized in the following proposition.
Chapter 2. Platform MFNs, Competition and Entry 63
Proposition 1. Assume that (A1)-(A5) hold. Then there exists a unique symmetric equilibrium
in transaction fees if no platforms have PMFN agreements or if both platforms have PMFN
agreements. Equilibrium fees and prices are higher when both platforms have PMFN agreements.
The intuition for this result should be quite clear. Consider the case in which both platforms
have PMFN agreements and consider hypothetical fees equal to the 0 PMFN equilibrium fees.
These are best-response fees absent PMFN agreements. They weigh off the increased margin of
a higher fee against the reduction in quantity that results from the multi-product seller raising
one’s price and diverting demand to the other platform. When PMFNs are present and the
seller is constrained in its price-setting, this trade-off is altered. The increase in margin of a
higher fee is no longer offset by the same reduction in demand. Rather, the reduction in demand
is smaller because the constrained seller must raise the fee-raising platform’s price and also the
other platform’s price, which has a positive impact on quantity at the fee-raising firm. This
effects leads to higher equilibrium fees and prices and is at the heart of the competitive effects
of PMFN agreements.
We can also compare the 2PMFN equilibrium fees and prices to those that would arise
under collusive platform fee-setting absent PMFNs. Perhaps surprisingly, PMFNs necessarily
lead to fees and prices even higher than those chosen by perfectly colluding platforms. To see
this, note first that under either symmetric collusive fees or symmetric 2PMFN equilibrium,
the seller optimally chooses a symmetric price. In the 0PMFN equilibrium the seller’s variable
profit following collusive symmetric fee-setting reduces to∑
i=1,2[p − cS − f ]qi(p) = 2[p − cS −
f ]q1(p). In the 2PMFN equilibrium, the seller variable profit reduces to∑
i=1,2[p−cS−fi]q(p) =
2[p − cS − (f1 + f2)/2]q1(p). Importantly, in both of these cases (and unlike the non-collusive
0PMFN case) the seller’s optimal pricing rule can be reduced to a function of the average
fee f = (f1 + f2)/2. Therefore, both situations generate the same implied demand function,
which can be denoted qSYM(f). Now compare the collusive fee-setting FOC with the 2PMFN
equilibrium fee-setting FOC. The former yields ∂qSY M
∂f(f − ci) + qSYM(f) = 0, while the latter
yields 12∂qSY M
∂f(fi−ci)+qSYM(f) = 0. The latter is clearly positive at the solution to the former,

Chapter 2. Platform MFNs, Competition and Entry 64
implying that the 2PMFN fees (and therefore prices) must be higher than the collusive fees and
prices absent PMFNs.
Proposition 2. Assume that (A1)-(A5) hold. Then the unique symmetric equilibrium fees and
prices when both platforms have PMFN agreements are higher than the symmetric equilibrium
fees and prices that would arise under collusive fee-setting by platforms absent PMFNs.
This is the point at which the stark contrast with the results on platform MFN agreements
in Johnson (2013) is most evident. That paper shows that platform MFNs lead to equilibrium
pricing that maximizes industry profits (defined as the sum of seller and platform profits). This
is clearly not the case in the present paper, where retail prices under platform MFNs are higher
than those under collusive fee-setting, which are themselves already higher than those that
would maximize industry profits, given the inefficiencies involved in the double markup problem
associated with higher-than-cost platform fees. This result in turn drives the difference between
Johnson’s adoption results (in which platform MFN adoption is always part of an equilibrium
with appropriate beliefs) and ours (in which adoption is far from certain because the resulting
equilibrium may not be very attractive). These differences arise because of differences in the
way demand is modeled. In particular, Johnson employs a unit demand model and maintains
an assumption of market coverage. This implies that there is no aggregate demand effect–i.e.,
that increases in symmetric prices never reduce quantity sold or industry profit. This is not the
case in either the general or linear version of our model. In our model, even at the fees that
maximize joint platform profits, an individual platform has an incentive under PMFNs to raise
its fee (this is exactly Proposition 2): it raises its unit revenue without losing its share of sales,
with the aggregate demand effect being shared across all firms (that is, imposing an externality
through reduction of demand for the platforms that did not raise their fee but nonetheless faced
retail price increases). In Johnson’s model, aggregate demand is fixed (by the unit demand
and market coverage assumptions); therefore, only shares of sales matter. Since these shares
are themselves fixed under PMFNs, an individual platform does not have an incentive to raise
fees beyond the point at which joint platform profits are maximized, and PMFNs necessarily

Chapter 2. Platform MFNs, Competition and Entry 65
increase profits.3
2.3.2 Linear demand
The linear model allows us to explore some aspects of the model for which we do not have general
results. Proposition 2 suggests the possibility that 2-PMFN profits might actually fall below the
0-PMFN profits, since fees and prices are higher than in the case of collusive fee-setting. The
linear model allows us to examine under what conditions this may arise; the following pair of
results demonstrate that which case prevails depends on the own- and cross-price elasticities of
demand.
Proposition 3. In the linear model, 2-PMFN profits are higher than 0-PMFN profits if plat-
forms are sufficiently close substitutes–that is, if b− d is sufficiently small. Specifically, for any
b > 0, there exists a d < b such that 2-PMFN equilibrium profits are higher than the 0-PMFN
profits for all d > d.
Proposition 4. In the linear model, 0-PMFN profits are higher than 2-PMFN profits if plat-
forms are sufficiently independent and demand is sufficiently inelastic in own price. Specifically,
if d = αb, then for b sufficiently small there exists an α > 0 such that 0-PMFN profits are higher
than 2-PMFN profits for all if α < α.
Both propositions are proved algebraically by analyzing π2∗ − π0∗. While the individual
profit expressions are complex, the sign of this difference can be shown to be of the same sign as
(2b− d)2 − 9(b− d). Since this is continuous, increasing in d, and strictly positive at d = b, the
expression must be positive for all d < b sufficiently close to b, as in the first of these propositions.
Similarly, substituting d = αb in this expression, the expression is negative if b < 9(1−α)(2−α)2 , which
holds in the limit as α→ 0 if b < 92. The result then follows by continuity of the expression.
3Put differently, in Johnson’s model the discrete drop in demand encountered when the buyer’s utility hitsthat of the outside option limits the incentive of the platform to raise fees. Once fees are high enough to createa retail price such that the buyer’s outside option binds (which is also the price that maxmizes industry profits)and the platforms capture all the available surplus, there is no incentive to raise fees further because sales willfall to zero. This discrete drop in demand never arises in our model.

Chapter 2. Platform MFNs, Competition and Entry 66
It is important to develop some intuition for why the higher prices that result under 2PMFN
pricing are more likely to be profitable for platforms the more substitutable they are. One can
think of the effects on the platform in the 2PMFN regime as having two effects: a “squeezing
the seller” effect and a “softening competition” effect. The “squeezing the seller” effect exists
regardless of the interdependence of demand. This captures the idea that each platform knows
that the seller is constrained in its pricing, making the seller (optimally) less responsive to a
unilateral increase in fee. This leads each platform to raise fees even beyond the collusive fee
solution (this is the effect used in proving Proposition 2). Moreover, note that this effect exists
without any regard to the substitutability of the products. Even if the two platforms served
entirely distinct markets, it would remain true that the constraint to equal pricing would reduce
the seller’s pass-through of a unilateral fee increase (thus, “squeezing the seller”), leading to
higher-than-collusive pricing. The fact that profits fall once fees pass the collusive fees indicates
that the firms reach a point where each suffers more from the rival’s excessive incentive to raise
fees than each gains from its own ability to squeeze the seller directly.
In contrast, the “softening competition” effect exists only when platform demand is interde-
pendent, and its strength increases with the interdependence of demand. Since each platform’s
implied demand is increasing in the other platform’s price, each platform effectively faces less
elastic demand when the seller is constrained to symmetric pricing. Any unilateral increase in
fee is passed through (equally) in both platform prices, and that increase in the rival platform’s
price increases the fee-raising platform’s demand, mitigating the direct effect of its own higher
price. Since this effect serves to raise profits (i.e., the same increase in joint fees has a less
negative impact on profits when demand is more interrelated because of the positive effect of
a higher rival’s price on one’s own demand), conditions are more favorable for PMFNs to raise
equilibrium profits when it is at work.

Chapter 2. Platform MFNs, Competition and Entry 67
2.4 Endogenous adoption of PMFN policies
This section considers stage 1 of the full game, in which firms simultaneously decide whether
to endogenously adopt PMFN policies. The above results on whether PMFNs raise profits for
the platforms do not suffice to demonstrate whether PMFNs will be adopted in equilibrium
when chosen by the platforms simultaneously; rather, we must characterize the outcome when
only one firm adopts a PMFN and compare the profits under that equilibrium to 0PMFN and
2PMFN profits. This section continues to employ the symmetric duopoly model.
2.4.1 General Demand
The results on equilibrium fees and best-response functions can be graphed to develop further
intuition about competition under PMFNs and, in particular, about incentives to adopt PMFNs
in the first stage of the full game. Figure 1 lays out two sets of best-response functions–those
that prevail under 0PMFN and 2PMFN–in a single graph in f1× f2 space. We denote platform
i’s best-response curve under a scenario with k PMFNs by bki . Best-response functions are for
simplicity portrayed as linear, as they are under the linear differentiated product demand model.
The two points along the 45-degree line at which bk1 and bk2 cross define the 0PMFN and 2PMFN
equilibria. The primary value in this figure is in the analysis of competition in the scenario in
which only one platform (which we assume to be platform 1) has a PMFN in place. We therefore
proceed to construct the best-response functions in this scenario, using bold solid and dashed
lines to denote these best-response functions, as indicated in Figure 1.
First, note that for a particular platform, pricing incentives are determined under either
the 0PMFN best-response calculation (there is no PMFN binding and q0(f) is relevant) or the
2PMFN best-response calculation (there is a PMFN binding and q2(f) is relevant). Which of
these calculations is relevant depends on the relative prices of the two platforms. In particular,
the PMFN is irrelevant if f1 < f2, and the 0PMFN incentives apply. Alternatively, when f1 > f2,
the PMFN binds; the fact that platform 2 does not have a PMFN is irrelevant; and the 2PMFN
Chapter 2. Platform MFNs, Competition and Entry 68
incentives apply.
Consider platform 2, the platform without the PMFN agreement. At low f1, platform 2
prices off its b02 curve; since this calls for overpricing the platform with the PMFN, the presence
of the PMFN is irrelevant. Once that b02 curve falls below the 45-degree line (at the 0-PMFN
equilibrium fee), however, this best-response curve is no longer relevant as the price it dictates
will trigger 2PMFN pricing by the seller. Considering this, platform 2 prefers to price off its b22
curve. However, any price above the 45-degree line renders the PMFN not binding, triggering
0PMFN pricing by the seller. As a result, the best response by the non-adopting platform 2 is to
match platform 1’s fee for all fees between the 0PMFN equilibrium and 2PMFN equilibrium fees.
(Put another way, over this range of f1, profits under the PMFN-binding regime are increasing
in f2 below f 22 and profits under the PMFN-not-binding regime are decreasing in f2 above
f 02 .) Once f1 exceeds the 2-MFN equilibrium fee, platform 2’s b22 is relevant since it prescribes
undercutting platform 1, triggering the PMFN policy and making the 2PMFN best-response
the relevant curve.
Now consider platform 1. At any f2 equal to or below the 0-PMFN equilibrium fee, platform
1’s best-response is given by b21, which prescribes overpricing platform 2, making the PMFN bind.
Since even its 0-PMFN best-response involves overpricing platform 2, the PMFN will certainly
be binding; given this, b22 reflects the correct incentives. For any fee equal to or above the 2-
PMFN equilibrium fee, platform 1’s best-response is given by b01. Since even the PMFN-binding
incentives (reflected in the 2-PMFN best-response) imply a best-response fee at which the PMFN
is not binding (i.e., lie above the 45-degree line), the PMFN will not be binding and b01 gives the
correct best-response. Somewhere between the 0- and 2-PMFN equilibrium fees there lies a fee f2
at which firm 1 is indifferent between undercutting and overpricing platform 2’s fee. Since firm 1
is indifferent between these two strategies, it is part of a mixed strategy equilibrium for firm 1 to
randomize between b01(f2) and b21(f2) with any probabilities σ and 1−σ, respectively. In addition,
there is a unique σ for which f2 is the best response of platform 2 to platform 1’s mixing strategy;
more formally, there exists a σ such that f2 = arg maxf2 σπ2(b01(f2), f2) + (1− σ)π2(b
21(f2), f2).

Chapter 2. Platform MFNs, Competition and Entry 69
This follows from the continuity of the profit function. If σ = 0 then the argmax is f 22 , and if
σ = 1 then the argmax is f 02 . There is some f2 in between that is the best response of platform 2
to platform 1’s mixing strategy σ. This f2 and σ constitute a mixed strategy equilibrium to the
simultaneous pricing subgame when only platform 1 has adopted a PMFN policy. This yields
the figure as drawn (for an arbitrary and illustrative f2 between the two equilibrium fees). The
following proposition follows from this analysis.
Proposition 5. Assume (A1)-(A5) hold. Then (1) there can be no pure-strategy equilibrium in
fees when exactly one firm has a PMFN agreement, and (2) there is a mixed-strategy equilibrium
in which firm 2 sets f2 (such that f 0∗i < f2 < f 2∗
i ) and firm 1 randomizes with appropriate
probabilities between b01(f2) and b21(f2).
Without further structure on demand, it is impossible to evaluate f2 or the profits in this
mixed strategy equilibrium. It is therefore not possible to assess in general the profitability of
the unilateral adoption of a PMFN policy as required to characterize the equilibrium of the
full game with adoption of PMFN policies preceding price-setting. However, this analysis is
sufficient to characterize the pure strategy equilibria of the related game in which PMFNs are
adopted or not simultaneously with the setting of transaction fees.
Proposition 6. Consider a game with the alternative timing in which platforms simultaneously
set fees and adopt PMFNs in the same stage. Then there are exactly two pure strategy equilibria;
one in which both firms adopt PMFNs and set fees f 2∗i and one in which both firms do not not
adopt PMFNs and set fees f 0∗i .
PMFNs may or may not be adopted in this game depending on the equilibrium selection
mechanism. It remains true as in the earlier propositions that either of these equilibria may
be the more profitable one for the platforms, depending on the substitutability of the products
and other characteristics of demand. Note that this implies that in this game with alternative
timing it is possible to experience a coordination trap in two forms: firms might fail to adopt

Chapter 2. Platform MFNs, Competition and Entry 70
PMFNs when it is profitable and firms might also adopt PMFNs when they raise prices so high
as to lower profits.
2.4.2 Linear Demand
Focusing on the linear demand model does allow us to more fully characterize incentives for
PMFN adoption. First, it allows a straightforward corollary to the last proposition, combining
it with the earlier result on the relative profitability of 0PMFN and 2PMFN equilibria.
Corollary 7. Consider a game with the alternative timing in which platforms simultaneously
set fees and adopt PMFNs in the same stage, and assume an equilibrium selection rule that
eliminates equilibria that are Pareto-dominated from the point of view of the platforms. Then
in the unique Pareto-undominated pure strategy equilibrium both platforms adopt PMFNs if the
two platforms are sufficiently close substitutes.
Moreover, focusing on the linear demand model allows us to characterize equilibrium adop-
tion in the full game, with simultaneous adoption of PMFN policies preceding simultaneous
fee-setting by the platforms. What is required to characterize the conditions for equilibrium
mutual adoption of PMFN policies is an understanding of the 1PMFN equilibrium profits. In
what follows, asterisks indicate profits in under the fees that arise in equilibrium of the ensuing
fee-setting subgame, the superscript indicates the number of platform with PMFN policies, and
the subscript indicates the platform, where platform 1 is the adopter in the 1PMFN subgame.
If π0∗i < π1∗
1 (a single PMFN adopter finds the policy profitable) and π1∗2 < π2∗
i (a single PMFN
non-adopter finds it profitable also to adopt the policy), then mutual adoption is the unique
equilibrium in the full game. We proceed by showing that both of these are true in the linear
model when platforms are close enough substitutes.
That the first inequality holds is easy to see. The sole adopter’s profit is π1∗1 = π0
1(b01(f2), f2) >
π0i (f
1∗). That is, the sole adopter’s 1PMFN equilibrium profit is the profit at that firm’s best
response to a rival’s higher price, compared to the 0PMFN equilibrium. This is clearly higher

Chapter 2. Platform MFNs, Competition and Entry 71
since higher rival’s prices directly raise profits under 0PMFN pricing by the seller.
The second inequality is much more complicated to assess, as it requires the non-adopter’s
profit under 1PMFN, which is a weighted average of being undercut and overpriced by the
adopting firm while maintaining the price f2. First, note that being overpriced in the mixed
strategy equilibrium is always worse than being in the 2PMFN equilibrium. To see this, note
that π22(b21(f2), f2) < π2
2(b21(f2), b22(b
21(f2)) < π2
2(f 2∗2 ). The first of these inequalities follows from
the fact that platform 2 would certainly rather be best-responding to the adopter’s price (in
the figure, platform 2 would rather be on b2∗2 , directly above the point at which platform 1
overprices against f2). The second inequality follows from the fact that profits under the 2PMFN
equilibrium are decreasing in the rival’s fee (in the figure, platform 2 would rather be at the
2PMFN equilibrium than down the b22 curve at a higher f1).
Now, in addition we show, as a sufficient condition, that platform 2 also prefers the 2PMFN
equilibrium to being undercut.4 This seems natural, in the sense that the situation in which
platform 1 is able to best-respond to f2 with an undercutting fee, and in which the seller, in
turn, is unconstrained by any PMFNs in altering prices to reflect these relative prices, seems
very grim indeed for the non-adopting platform 2. However, it does not immediately follow that
the non-adopter prefers the 2PMFN equilibrium to this since it is at least conceptually possible
that the 2PMFN pricing is so high that it is preferable to be undercut at some price intermediate
to the 0PMFN and 2PMFN equilibrium pricing. The earlier results suggest that this will not
be the case when platforms are close substitutes, so that the 2PMFN fee equilibrium is not so
high as to be terribly destructive of platform profits. This is true, although the algebra to prove
the result is extremely tedious; it is therefore reserved for the Appendix.
Proposition 8. Consider the full game, in which platforms simultaneously adopt PMFNs prior
to simultaneously setting fees. Then if platforms are sufficiently close substitutes, both firms
adopt PMFN policies.
4Note that this condition is sufficient but not necessary. What is necessary is that the weighted average ofthe nonadopter’s 1PMFN profits under the mixed strategy equilibrium is lower than its 2PMFN profit. Fortractability, we focus instead on conditions for which each component of that weighted average is smaller.

Chapter 2. Platform MFNs, Competition and Entry 72
2.5 The effects of PMFNs on entry incentives
This section explores the effects of PMFNs on entry incentives. Obviously, for symmetric firms,
whether PMFNs induce additional entry or curtail entry depends on how they affect equilibrium
profits. This follows directly from the results proved earlier on when adoption of PMFNs raises
equilibrium platform profits. What is of interest in this section, therefore, is the effect that
PMFNs might have on the entry of firms with different characteristics in demand or cost, or
on the endogenous selection of those characteristics. We will consider the sequential entry of
a firm facing different demand or cost parameters against an incumbent firm with a PMFN
in place. Given that PMFNs explicitly rule out a low-price entry strategy for an entrant, and
given that such a strategy is likely to be especially important for an entrant who has a lower
cost or a lower-value platform, it is natural to assume (as in the conventional wisdom described
in the introduction) that a PMFN policy by an incumbent inhibits entry by lower-cost, lower-
value platforms. For example, one might expect that adoption of a PMFN by a full-service
platform would make entry by platform with a bare-bones, low-cost (and potentially) low-price
business model much more difficult, given the constraint it places on the seller’s ability to pass
through those lower costs or to offer a discount price for transactions through the lower-quality
platform. Similarly, one could argue that these same forces would lead an entrant endogenously
determining its cost and value characteristics to choose a higher-cost, higher-value position or
business model than it might have done otherwise.
To analyze these questions we focus on the linear demand model but allow two kinds of
asymmetry. Specifically, we allow c2 < c1, where firm 1 refers to the incumbent throughout this
section. We also permit the possibility that the entrant has a lower value offering, resulting
in a reduction in demand of x > 0 for any given prices: q1(p) = a − bp1 + dp2 and q2(p) =
a− x− bp2 + dp1. Note that lower x need not reflect an “inferior” platform in a general sense;

Chapter 2. Platform MFNs, Competition and Entry 73
it is a platform that faces lower demand at given prices, but this may be accompanied by
lower variable or fixed costs that make the entrant quite a viable competitor and a potential
contributor to total welfare. Similarly, a lower cost need not make a firm a superior creator of
value if it is accompanied by a demand disadvantage.
Given the results on equilibrium PMFN adoption above, we assume that the 2PMFN regime
will prevail post-entry. This is basically an assumption that either the entrant adopts a PMFN
along with the incumbent, or the entrant is asymmetric enough that the fee-setting equilibrium
behaves as if there are 2 PMFNs. It is evident in Figure 1 that if the non-adopting platform has
a much lower best-response function, there will come to be an intersection of the bolded 1PMFN
best-responses where both firms are on their 2PMFN portions of the best-responses; in this case,
the (incumbent’s) single PMFN is binding because platform 2 is undercutting platform 1 and
whether platform 1 (the entrant) in fact has adopted a PMFN policy is irrelevant.
2.5.1 The effects on implied demand
The basic logic of this argument that PMFNs skew entry away from lower-cost, lower-value
business models and toward higher-cost, higher-value business models can be seen directly from
the implied demand functions. Again, the basic intuition is that a firm seeking to compete on
the basis of low-price (typically, a demand-disadvantaged or marginal cost-advantaged firm) has
a hard time competing when the possibility of undercutting the higher-value, or higher-cost
incumbent is precluded.
For the case of x this is evident in the implied demand functions if∂q2∗2∂x
<∂q0∗2∂x
< 0–that is, if
increases in x lowers demand more quickly in the presence of 2PMFNs. This reflects the seller’s
inability to discount the lower-value platform in order to attract customers to it. It is easy to
check from the (linear) implied demand functions that this is true:∂q2∗2∂x
= −34< −1
2=
∂q0∗2∂x
< 0.
For the case of c2 < c1 this is evident in the implied demand functions if∂q0∗2∂f2
<∂q2∗2∂f2
< 0–that
is, if lowering one’s fees in response to one’s lower marginal cost has a smaller effect on one’s
sales in the presence of 2PMFN. It is easy to check from the (linear) implied demand functions

Chapter 2. Platform MFNs, Competition and Entry 74
that this is true:∂q0∗2∂f2
= − b2< − b−d
4=
∂q2∗2∂f2
< 0.
Thus, with respect to choices in both willingness-to-pay and marginal cost, the entrant’s
residual demand more quickly diminishes as its position deviates from the incumbent’s (toward
lower costs or lower value) when the incumbent has adopted a PMFN policy. In this sense, the
incumbent’s PMFN can be said to skew incentives for choice of business model or inhibit entry
of low-cost, low-value business models.
2.5.2 The effects on profits
Of course, a full analysis of the incentives for entry are more complex. The analysis in previous
sections suggests that PMFNs may raise levels of profits, even as they increase the absolute value
of the slope of profits in quality or costs (that is, making profits fall more quickly as a platform
becomes more downward differentiated). It seems entirely possible that the former effect might
outweigh the latter, causing PMFNs to encourage the entry of competing platforms even as they
skew incentives for competitive positioning. To make progress in understanding these competing
effects, we need to characterize the relationship of profits to competitive position across regimes
both with and without PMFNs. For tractability, we pursue this for the case of differentiated
products (x > 0) with zero costs throughout the model (c1 = c2 = cS = 0). We are interested in
the entrant’s profits as a function of x and as a function of whether the incumbent has adopted
a PMFN policy. Because we are interested in entry, we are interested in net profits, accounting
for fixed entry costs, which we allow to vary with x. The entrant will enter if πk∗2 (x)−f2(x) ≥ 0,
where k = 0, 2 indicates whether PMFN policies are adopted. (Recall that we assume that the
outcome is as if the entrant follows suit, if the incumbent has already adopted a PMFN policy.)
We can establish three facts about the relationship between π0∗2 (x) and π2∗
2 (x), which form the
basis for this analysis.
First, from the results proved in the earlier sections, we know that as x → 0 and d → b,
π2∗2 (x) > π0∗
2 (x). Second, for x not too large relative to a (specifically, x < 2a/7), both profit
functions are downsloping in x (∂πk∗
2 (x)
∂x< 0, for k = 0, 2). This follows from straightforward

Chapter 2. Platform MFNs, Competition and Entry 75
algebraic manipulation of the derivatives of πk∗2 (x) with respect to x. This condition is the one
that ensures negativity of∂π2∗
2 (x)
∂x, which is the stronger of the two conditions. Third, for small x,
PMFNs make profits diminish more rapidly in the demand disadvantage (∂π2∗
2 (x)
∂x<
∂π0∗2 (x)
∂x< 0).
This is intuitive given the earlier result that PMFNs make implied demand decrease more rapidly
in the demand disadvantage. This follows from the straightforward comparison of the derivatives
of πk∗2 (x); the desired inequality can be show to hold if and only if 1−γ2(4−γ2)2 <
736
, which can be
shown to hold for all γ ∈ [0, 1].
2.5.3 The effects on entry when entrant’s quality is exogenous
Together, these facts yield the scenario captured in Figure 2.5 For small demand disadvantages,
PMFN policies raise equilibrium post-entry profits. However, because PMFNs also make profits
more sensitive to the demand disadvantage, this relationship may reverse for large enough x. As
the demand disadvantage increases, the presence of PMFNs causes the entrant’s profit to fall
more quickly, implying that the ordering of profits π0∗2 (x) and π2∗
2 (x) may potentially reverse.
As a result, whether the incumbent’s PMFN policy encourages or discourages entry depends on
the exogenous demand disadvantage x of the entrant and its associated fixed cost f2(x).
Figure 2 depicts the effect of PMFNs on entry for any pair of exogenous x and f2(x). At
the top of the figure, fixed entry costs are so high that the entrant does not enter regardless
of whether the incumbent adopts a PMFN policy. At the bottom, fixed entry costs are so low
that the entrant enters regardless of whether the incumbent adopts a PMFN policy. At left is
a region in which the profit-increasing effects of PMFNs encourage the entry of the relatively
similar entrant. To be clear, here the entrant would not enter absent a PMFN policy, but does
enter when the incumbent adopts PMFN. At right is a region in which the augmentation of the
demand disadvantage by the PMFN policy is so strong that it outweighs the profit-increasing
effects of PMFNs, and entry of the more demand-disadvantaged entrant is deterred. Again,
5It is easy to graph a numerical example corresponding to this graph. For example, for a = 10, b = 4, d = 3,and x ∈ [0, 1], the figure looks much like this, with a slight convexity to both profit curves and an intersectionat about 1
2 .
Chapter 2. Platform MFNs, Competition and Entry 76
in this region the entrant would have entered absent the incumbent’s PMFN policy but is
deterred by that policy. This figure clearly demonstrates both the legitimacy and the limits
to the conventional wisdom that PMFNs curtail entry by low-end platforms. The conventional
wisdom applies in the shaded region, but only there, when the entrant contemplates entry
with an exogenous competitive position. These arguments are summarized in the following
proposition (which, in addition, relies only on continuity arguments).
Proposition 9. Assume that all costs are approximately zero (c1, c2, cS ' 0) and that a potential
entrant has an exogenous differentiated position (x > 0). Then the incumbent’s adoption of
a PMFN policy encourages entry (raises post-entry profits relative to those that arise absent
PMFNs) if the entrant is not too differentiated; if the policy discourages entry (lowers post-entry
profits relative to those that arise absent PMFNs), it is only for entrants with a sufficiently large
difference in position.
2.5.4 The effects on entry when entrant’s quality is endogenous
We can also consider the effect on entry by an entrant that endogenously chooses its competitive
position x, by evaluating πk∗2 (x)−f2(x) ≥ 0 for an endogenously chosen xk∗2 = arg maxx πk∗2 (x)−
f2(x). For f2(x) convex enough, the net profit will be concave for k = 0, 2, and we maintain
this assumption throughout this section. We also restrict x to some compact interval, x ∈ X.
Because increases in x correspond to lower quality, it is natural to model f2 as decreasing.
Convexity of f2(x) then implies that the largest cost savings come from the first departures
from symmetry (x = 0), with these cost savings becoming smaller at the margin as the platform
becomes more downward-differentiated (x increases). Note that the third fact above (that the
slope of profit in x is greater under PMFNs) means that PMFNs will bias the entrant’s optimal
x down (toward more similar platforms). This is most easily seen by considering the fact that the
first-order condition under PMFNs at the no-PMFN optimal x must be negative. As a result,
if there is an interior optimal x under either regime, then x2∗2 < x0∗2 (i.e., regardless of whether
the other regime has an interior or corner optimum).

Chapter 2. Platform MFNs, Competition and Entry 77
Proposition 10. Assume that a potential entrant chooses its position x ∈ X after observing
the incumbent’s PMFN adoption decision, and that the entrant’s optimal x is interior to X
either with or without PMFNs (or both). Then if entry occurs regardless of PMFN adoption,
the entrant chooses a less differentiated position (strictly smaller x) when the incumbent adopts
a PMFN policy.
Whether entry is encouraged or deterred due to the incumbent’s PMFN now rests on the
profit that is obtainable by the entrant at its optimal competitive position, which may vary
with the incumbent’s PMFN decision. We must separately determine xk∗2 , and then evaluate
πk∗2 (xk∗2 )− f2(xk∗2 ) for each k.
Two possibilities arise. It may be that the optimized net profit πk∗2 (xk∗2 )− f2(xk∗2 ) is higher
under 0PMFN or 2PMFN. When it is higher under 0PMFN this indicates that the incumbent’s
PMFN policy may deter entry, in the sense that it is reducing the maximal profit available to the
entrant. When it is higher under 2PMFN then the incumbent’s PMFN policy may encourage
entry, in the sense that it is increasing the maximal profit available to the entrant. Given the
analysis of the exogenous-x case, it seems natural that the former (entry-deterring) scenario is
more likely when the optimal x absent PMFNs is high, which will be the case when cost savings
associated with higher x are significant. Similarly, the latter (entry-encouraging) scenario is
more likely when the optimal x absent PMFNs is low, as when cost savings are relatively small.
It is possible to use numerical examples to illustrate these possibilities. For simplicity, assume
that f2(x) = F − w√x, which is convex as assumed. Fixing w, one can then find the optimal
x (which will not depend on the fixed component of cost F ), and the profits at that optimal
x, net of all costs except F . This then yields the threshold F k at which entry is realized
under the various scenarios. Comparison of this F k under the 0PMFN and 2PMFN scenarios
then determines whether entry is encouraged or discouraged (or unaffected) by the incumbent’s
PMFN policy. In both of the following examples, a = 10, b = 4, d = 3, and x ∈ [0, 1].
First consider a case in which cost savings are significant enough to create an interior x0∗2 but
still relatively small: w = 1. Here, x0∗2 = 0.2 and x2∗2 = 0. The threshold fixed costs are F 0 = 8.2

Chapter 2. Platform MFNs, Competition and Entry 78
and F 2 = 11.1. Thus, for low fixed costs (F < 8.2), there is entry regardless of the incumbent’s
adoption of a PMFN policy, and the chosen x is reduced by the incumbent’s PMFN policy. For
intermediate entry costs (F ∈ (8.2, 11.1)), entry occurs only if the entrant incumbent adopts a
PMFN policy. For high entry costs (F > 11.1), there is no entry regardless of the incumbent’s
PMFN adoption decision.
Now consider a case with more significant cost savings: w = 7. Now, x0∗2 = 1.0 and x2∗2 =
0.25. The threshold fixed costs are F 0 = 13.85 and F 2 = 12.75. For low entry costs (F < 12.75),
there is entry regardless of the incumbent’s adoption of a PMFN policy, and the chosen x is
reduced by the incumbent’s PMFN policy. For intermediate entry costs (F ∈ (12.75, 13.85)),
entry occurs only if the entrant incumbent does not adopt a PMFN policy. For high entry costs
(F > 13.85), there is no entry regardless of the incumbent’s PMFN adoption decision. This case
is depicted in Figure 3.
This case, in which cost savings are sufficiently high that an entrant would choose a sub-
stantially different position from the incumbent absent PMFN policies, illustrates precisely the
conventional wisdom. Here, for low fixed costs, there is entry regardless of the PMFN policy,
but the presence of the policy distorts the entrant’s choice of position and leads the entrant to
choose a less differentiated and higher-end business model. For intermediate fixed costs, the
PMFN deters entry that would have occurred absent the policies, because the entrant would
have maximized its profits by choosing a very differentiated position that is penalized too heav-
ily by the PMFN. This illuminates the potential for both deterrence of low-cost business model
entry and the distortion of business model choice when entry does occur.
Comparing this case with the prior case, in which cost savings were more modest, also
demonstrates the limitations of the conventional wisdom. When an entrant would not choose a
very differentiated position absent the incumbent’s PMFN policy, the skewing of that position
by the PMFN is unlikely to deter entry; in fact, it is quite possible that the price-raising effects
of the PMFN will encourage entry that would not have occurred absent the PMFN. Obviously, a
full analysis of whether the encouragement, deterrence, or skewing of entry increases or decreases

Chapter 2. Platform MFNs, Competition and Entry 79
social welfare requires much more structure on both demand and costs, and is beyond the scope
of this paper.
2.6 Conclusion
We study the effects on pricing and entry of platform MFN policies–a type of policy not widely
studied in the extant literature, but one that is of increasing interest and importance in antitrust
enforcement. It is worth reemphasizing that these platform MFN policies are not the same as
traditional MFN policies, which have been the subject of considerable theoretical inquiry (see,
for example, Cooper (1986) and Besanko and Lyon (1993)). In our main model, in which one
supplier (our “seller”) sells through two symmetric intermediary retailers (our “platforms”), a
traditional MFN policy is of no consequence. Consider adapting our model to the alternative
contracting arrangement in which the supplier sets wholesale prices for the retailers, with the
retailers subsequently (and simultaneously) setting retail prices (which is the arrangement to
which a traditional MFN applies). A traditional MFN policy would then consist of contractual
provisions that ensure uniform wholesale prices (that is, the supplier cannot sell to any retailer
at a price lower than the price at which it sells to the other retailer). Absent MFN policies,
the supplier optimally chooses symmetric wholesale prices to maximize its profit given the
anticipated markups of its retailers. Constraining the supplier to set uniform wholesale prices
through an MFN policy therefore has no effect.6 Similarly, traditional MFN policies would have
a less dramatic effect on the incentives of low-end business model entrants. While a traditional
MFN policy would prevent the upstream producer from favoring a low-end entrant with a
lower wholesale price (and might therefore reduce the entrant’s post-entry profits somewhat), it
would not prevent the low-end entrant from competing on price altogether, as is the case with a
platform MFN. Thus, the effects of platform MFN policies are different from those of traditional
6A long literature in this field considers more complex contracting games, including the scenario in whichthere is secret bilateral contracting rather than simple posting of wholesale prices (see, for example, O’Brien andShaffer (1992)). Even in such a model, an MFN policy (if enforceable despite the secret recontracting) simplyrestores the outcome achieved with posted wholesale prices, by eliminating the possibility of secret price cuts.

Chapter 2. Platform MFNs, Competition and Entry 80
MFN policies and warrant careful theoretical examination.
We show that platform MFN agreements tend to raise fees charged by platforms and prices
charged by sellers, and that these policies are adopted in equilibrium and increase platform prof-
its when the platforms are close substitutes. However, when platforms are not close substitutes
platform MFNs may raise prices so high that industry profits fall. We also show that the adop-
tion of a platform MFN agreement by an incumbent platform can discourage entry by an entrant
if it is sufficiently downward-differentiated; however, when the potential entrant has a business
model relatively similar to the incumbent’s, platform MFNs actually work to encourage entry
through their price-raising effects. Moreover, when entry occurs regardless of the incumbent’s
adoption of a platform MFN policy, platform MFNs have the effect of distorting the entrant’s
choice of business model towards a model more similar to that of the incumbent. These results
have important implications for ongoing antitrust scrutiny of these policies in ebook, credit card,
and health care markets.
2.7 Appendix
With linear demand, platform 2’s profits at the 2MFN fee equilibrium are:
π2∗2 = π2
2(f 21 , f
22 ) =
1
36(b− d)(2a− (b− d)(c1 + c2 + 2cs))
and platform 2’s profits in the 1MFN mixed-strategy fee equilibrium when undercut by platform
1 are:
π02(b01(f2), f2) = (1/2)(f2)− c2)(a+ dcs − b(f2 + cs) + (1/2b)
(d(a+ b(c1 − cs) + d(f2 + cs)
)
where f2 is given by:
f2 =b− d
b2 − 3bd+ 2d2(2(a− (b− d)cs)− bc1)±
√2√b(a− (c1 + cs)(b− d))2(b− d)

Chapter 2. Platform MFNs, Competition and Entry 81
Substituting f2 into π02(b01(f2), f2) and defining Z = π2
2(f 21 , f
22 ) − π0
2(b01(f2), f2), any parameter
values for which Z ≥ 0 support PMFN adoption by platform 2. It is helpful to define h =
db∈ (0, 1) as a measure of substitutability between the platforms; by substituting d = hb, this
simplifies the expressions greatly. Under the maintained assumption of symmetry (c1 = c2), it
can be shown that
sign(Z) = sign(2(38 + h− 28h2
)± 9√
2− 2h(−6− 3h+ 2h2
)).
For any h, (38 + h− 28h2) > 0 and (−6− 3h+ 2h2) < 0. Therefore the negative root guarantees
Z ≥ 0. For the positive root, it can be shown that Z ≥ 0 for h larger than the value of a complex
expression that can be shown numerically to be approximately 0.303.
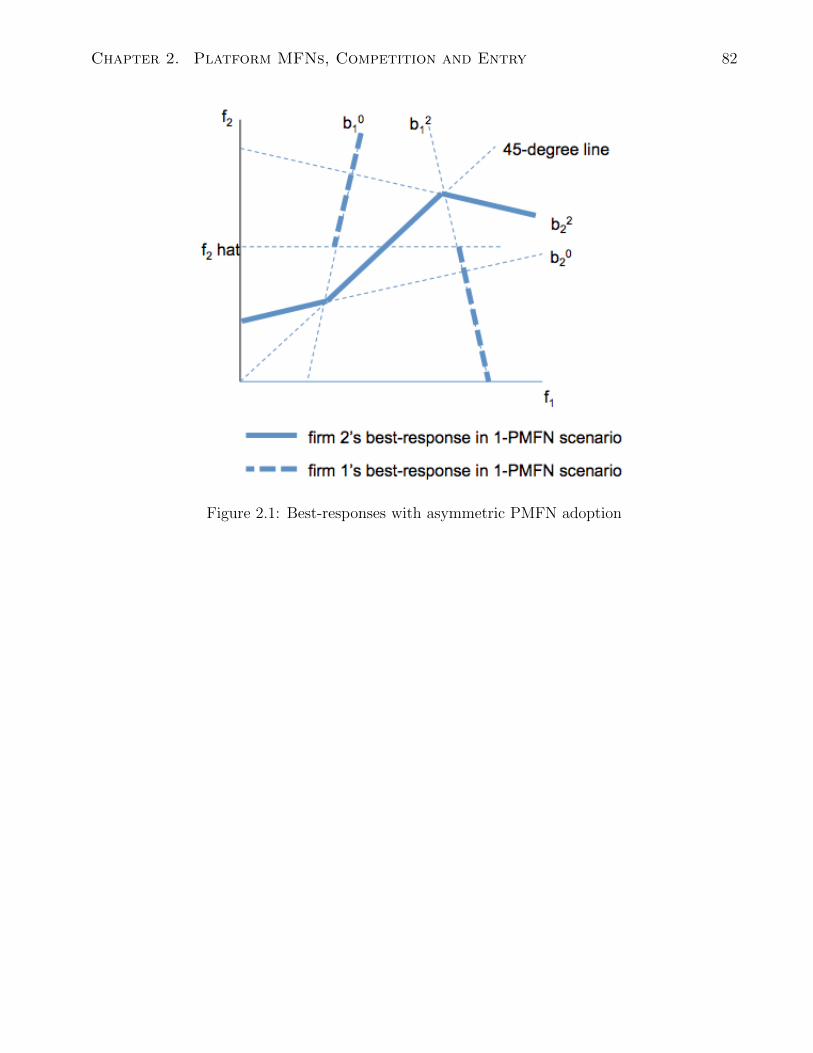
Chapter 2. Platform MFNs, Competition and Entry 82
Figure 2.1: Best-responses with asymmetric PMFN adoption

Chapter 2. Platform MFNs, Competition and Entry 83
Figure 2.2: The effects of PMFNs on entry with exogenous position

Chapter 2. Platform MFNs, Competition and Entry 84
Figure 2.3: The effects of PMFNs on entry with endogenous position

Chapter 3
MFN Clauses in Health Care Provider
Contracts
3.1 Introduction
A most-favored-nation (MFN) clause is a promise made from a seller to a buyer that that buyer
will receive at least as favorable a price as any other buyer.1 The U.S. Department of Justice
has recently increased the number of challenges against the use of MFNs, alleging that MFNs
have the effect of discouraging discounting, leading to higher prices for consumers (Department
of Justice, 2012). These challenges have been particularly targeted towards the health insurance
industry, the latest of which involves Blue Cross & Blue Shield of Michigan. The Department
of Justice has alleged that Blue Cross & Blue Shield’s MFNs in its contracts with Michigan
hospitals “inhibit competitive entry and expansion from other insurers and likely raise insurance
rates” (Department of Justice, 2012). The origin of the alleged harm is that hospitals will be
reluctant to give discounts to smaller insurers if they must also extend those discounts to the
larger insurer Blue Cross & Blue Shield. While in this case the suppliers of medical services are
1MFN clauses are sometimes referred to as most-favored-customer clauses, prudent buyer clauses, non-discrimination clauses, etc.
85

Chapter 3. MFN Clauses in Health Care Provider Contracts 86
hospitals, antitrust challenges involving the use of MFNs have previously involved physicians,
dentists, optometrists, and pharmacists.2
Despite the existence of a substantial literature on MFNs and price matching guarantees in
general, there has yet to be a formal welfare analysis of MFNs in a vertical supply relationship.
Instead, previous studies have typically focused on the effects of MFNs in a horizontal setting,
such as facilitating collusion and solving the durable good monopolist’s problem by acting as
a commitment not to lower price. A standard vertical setting usually features a manufacturer
upstream and retailer downstream, and the health insurance market can be viewed in the same
way. Medical providers such as hospitals can be thought of as supplying medical services to
health insurers who re-sell them to consumers. Figure 1 illustrates the basic mechanics of an
MFN in the health insurance market for an arbitrary medical service.
This paper is the first to examine theoretically the antitrust implications of MFNs in a
vertical supply relationship. The main result of the paper is that an MFN can enhance welfare
because while it decreases the magnitude of discounting by providers, discounting still occurs
and extends across more insurers. The focus has typically been on the first effect of discouraging
discounting, but less attention has been paid to the fact that the insurer with the MFN now pays
less for medical services, and that these cost savings are partially passed through to consumers.
The theory presented suggests the welfare effects of MFNs depend upon demand curvature, but
that they are welfare enhancing under most typical models of demand.
To ensure this result is not isolated to particular assumptions on competition, I directly
consider a general form of equilibrium output function which depends only on input prices. A
sufficient but not necessary condition for an MFN to increase consumer welfare is that this
equilibrium output function be weakly concave in input prices. Since an MFN is a commitment
not to price discriminate, this result is consistent with the general price discrimination literature
which finds uniform pricing improves welfare if demand is concave in price.3 In contrast to this
2See Figure 2 for a summary of these cases.3The seminal references are Schmalensee (1981) and Varian (1983). More recently, Cowan (2007) finds that
the conditions for price discrimination to enhance welfare are strict and so the presumption is that uniform

Chapter 3. MFN Clauses in Health Care Provider Contracts 87
literature, however, the case of linear demand leads to an MFN strictly improving welfare rather
than having a neutral effect. Since the condition for an MFN to reduce welfare is stringent, this
paper suggests a more lenient view of MFNs in contrast to the general perception that MFNs
are anti-competitive.
While the main result is that MFNs are presumptively welfare enhancing, welfare unambigu-
ously falls when an MFN is implemented by a provider-controlled insurer whose objective is to
coordinate a provider cartel. In this case the MFN can be used to discourage discounting by
providers who have a private incentive to support the entry of a rival low-cost insurer because
they do not internalize the cost that entry has on other providers. In this case the MFN reduces
welfare because the cost-savings generated by the MFN are passed upstream to other providers
who The antitrust implication of this paper is that a rule of reason approach should be taken
towards the use of MFNs. When applying this rule of reason, the antitrust authority should
recognize the beneficial cost savings that accrue to the insurer implementing the MFN and the
lower prices that result for consumers. Antitrust enforcement should instead pay special atten-
tion to MFNs implemented by insurers that have an interest in the welfare of their providers.
RxCare of Tennessee offers a clear example of when this applies: here the insurer had a publicly
stated mandate to promote compensation for its participating providers.
The paper is organized as follows. Section 2 provides a review of the economic and legal
literature concerning MFNs as well as a case summary. Section 3 introduces a model that shows
in a very simple environment that an MFN can improve consumer welfare, while section 4 illus-
trates how an MFN used by a provider-controlled insurer to coordinate a provider cartel reduces
consumer welfare. Section 5 concludes.
pricing is more likely to enhance welfare.

Chapter 3. MFN Clauses in Health Care Provider Contracts 88
3.2 Literature Review
3.2.1 Economic
The economic literature on MFNs has not explicitly considered the type of vertical market setting
discussed above. Instead, it has focused on the ability of MFNs to facilitate horizontal collusion
(Cooper 1986, Neilson and Winter 1993, Besanko and Lyon 1993), to solve the durable good
monopolist’s problem (Butz, 1990), to reduce investment uncertainty (Crocker and Lyon, 1994),
and to speed up litigation in cases with multiple plaintiffs (Spier 2003, Daughety and Reinganum
2004). The papers most closely related to an examination of MFNs in the health insurance
market are DeGraba and Postlewaite (1992), McAfee and Schwartz (1994), and O’Brien and
Shaffer (1993) who examine an input monopolist deciding which prices to charge competing
downstream firms.
Cooper (1986) shows that an MFN can act as a pre-commitment not to lower price in the
future because it would involve giving a rebate to consumers who purchased previously at a
higher price, and therefore allows duopolists to maintain a price higher than the competitive
level. Butz (1990) shows that a durable goods monopolist can achieve the regular monopoly
outcome with an MFN because consumers know the monopolist will not lower price in the future
as it would trigger rebates to purchasers in previous periods.
The previous two uses for an MFN indicate they do not benefit consumers, but Crocker
and Lyon (1994) show an MFN can be welfare enhancing when it solves investment uncertainty
problems in gas supplier/pipeline relationships. A gas supplier may not commit to drilling in
a specific location at an agreed-upon tariff with the pipeline if he thinks gas suppliers entering
in the future may get a more favorable tariff from the pipeline. An MFN gives the gas supplier
a guarantee that he will not be at a permanent cost disadvantage in the future. Spier (2003)
shows an MFN can speed up litigation with multiple plaintiffs because early plaintiffs have an
incentive to settle early - they know if later plaintiffs receive a more favorable settlement that
they are entitled to receive it as well.

Chapter 3. MFN Clauses in Health Care Provider Contracts 89
Examining MFNs in a horizontal context has recently come back into focus. Klibanoff and
Kundu (2009) characterize the solution to a monopolist’s price discrimination problem where
the monopolist sells both to Medicaid patients and to those with private insurance. The novelty
of the problem arises from the fact that Medicaid patients have an MFN in their contract with
the monopolist, a feature that is motivated by Medicaid’s adoption of an MFN in 1991. The
theory developed by Klibanoff and Kundu (2009) complements Morton (1997)’s empirical study
of the 1991 Medicaid rule adoption which finds that the MFN resulted in higher prices for non-
Medicaid consumers. Chen and Liu (2011) find that an MFN implemented by Best Buy led to
lower retail prices for electronics. Since the Best Buy MFN was both contemporaneous (Cooper,
1986) and retroactive (Butz, 1990), Chen and Liu’s finding contradicts the theory that predicts
the MFN should have increased prices by facilitating collusion.
DeGraba and Postlewaite (1992), McAfee and Schwartz (1994), and O’Brien and Shaffer
(1993) are the most relevant to the study of MFNs in a health insurance setting. Each studies a
setting where an input monopolist supplies several competing retailers downstream. The authors
show that the input monopolist may not want to offer a uniform price to all of the retailers.
Instead, the input monopolist may have an incentive to offer a retailer a lower price, giving it
a competitive advantage over its rivals; the extra profits derived from this cost advantage are
then divided between that retailer and the input monopolist. However, the outside retailers
realize they may be put at such a disadvantage before entering the retail market and therefore
their willingness to pay a franchise fee falls. DeGraba and Postlewaite show an MFN clause in
this context can act as a commitment mechanism to assure retailers they will not be at a cost
disadvantage in the future, similar to the analysis of Crocker and Lyon. However, McAfee and
Schwartz, and O’Brien and Shaffer show that if the retailers do not observe the contracts of
their rivals, an MFN may not be sufficient to re-assure retailers that they will receive at least
as favorable a price.4
4The empirical literature has similarly mixed conclusions. For example, Villas-Boas (2009) studies the Germancoffee market and finds wholesale price discrimination distorts productive efficiency so that uniform pricingincreases welfare, while Grennan (2012) studies the market for medical devices and suggests a move towards

Chapter 3. MFN Clauses in Health Care Provider Contracts 90
While the preceding studies focus on the use of MFNs to re-assure retailers about relative
wholesale prices post-entry, this paper is concerned with the price effects of MFNs conditional
on acceptance. Further, this paper allows for the asymmetric welfare effects we would expect
when moving away from price discrimination towards uniform pricing, which are not present in
the preceding studies featuring symmetric retailers.
3.2.2 Legal
The remaining literature involves legal commentary on the antitrust implications of MFNs in
health care providers’ contracts. Baker (1988) was one of the first to outline the potentially
anti-competitive effects of MFNs. Although he focuses more generally on vertical restraints in
the health insurance industry, Baker considers MFN clauses as a device with which a dominant
insurer can raise its rivals’ costs (see Salop and Scheffman, 1983). He discusses one case of
particular interest: Ocean State Physicians Health Plan, Inc. v. Blue Cross and Blue Shield of
Rhode Island.
Ocean State saw Blue Cross implement an MFN clause among its physicians in response to
the entry and growth of Ocean State (a competing health insurer) in the Rhode Island health
insurance market. Ocean State claimed the clause was intended to exclude competition in the
insurance market. Blue Cross had at least 57% market share while Ocean State possessed
approximately 10%.5 Ocean State entered into “risk sharing” agreements with its physicians,
whereby physicians would be paid only 80% of their fees unless Ocean State made a profit that
year. If it did, the other 20% would be returned to physicians. In its three years of operation,
however, Ocean State never earned a profit - physicians working for Ocean State were essen-
tially doing so at a 20% discount. Observing that some of its physicians were working for lower
fees, Blue Cross implemented an MFN clause requiring physicians to extend any Ocean State
discounts to Blue Cross as well. Of the 1200 physicians participating with Ocean State, 350
uniform pricing reduces welfare because it reduces competition downstream.5Blue Cross claimed its market share was 57%, while Ocean State asserted it was actually 80%. Nevertheless,
Blue Cross did not deny that it had substantial market power.

Chapter 3. MFN Clauses in Health Care Provider Contracts 91
left the plan with many citing the MFN clause as the reason.6 The 350 physicians decided they
could not “afford” to extend the 20% discount to their sizeable base of Blue Cross patients.
Blue Cross claimed its only intent was to minimize its costs and to avoid being taken ad-
vantage of by physicians.7 Baker seems skeptical of Blue Cross’s motives, reasoning that “it is
curious that [Blue Cross] limited its attention to those doctors who were affiliated with both
[Blue Cross and Ocean State] plans” (Baker, 1988, p. 161). Baker insinuates that if Blue Cross
were actually interested in lowering its costs, it would have also aggressively pursued discounts
from physicians not in Ocean State’s network. In fact, Baker (1988) is the only analysis to
address the question of why Ocean State was able to elicit discounting from providers but Blue
Cross was not despite its position as a monopsonist.
Baker hypothesizes that Blue Cross was
controlled by doctors who in effect employed the insurer to coordinate a physician
cartel ... The most favored nations clause may have deterred cheating on a physician
cartel, thereby facilitating collusion among doctors, by making it uneconomic for
physicians to lower their fees to those patients participating in the HMO. Unfortu-
nately, it is difficult to evaluate whether this plausible explanation for the anticom-
petitive effect of a most favored nations clause applied to the facts of Ocean State
because no evidence was presented from which it would be possible to determine
whether [Blue Cross] in effect acted to manage a physician cartel in Rhode Island
(Baker, 1988, p. 167-168).
Even before Baker (1988) there has been empirical support for the hypothesis that provider
control of an insurer raises reimbursement rates for physicians. A 1979 FTC staff report cites
medical society involvement in board member selection and physician presence on these boards
as having a significant positive effect on physician reimbursement rates (Kass and Pautler, 1979).
6Ocean State Physicians Health Plan, Inc. v. Blue Cross & Blue Shield of R.I. (883 F.2d 1101), pp. 5-6(D.R.I. 1988).
7Ocean State Physicians Health Plan, Inc. v. Blue Cross & Blue Shield of R.I. (692 F. Supp. 52), p. 12(D.R.I. 1988).

Chapter 3. MFN Clauses in Health Care Provider Contracts 92
This positive relationship between physician control and reimbursement fees has also been found
in another study, though it exists only for insurers that enjoy a federal tax advantage such as
Blue Cross & Blue Shield (Arnault and Eisenstadt, 1980).
3.2.3 Case history and empirical facts
Ocean State was only one of many cases featuring the use of an MFN. Figure 2 summarizes all
American federal and state cases whose central issue was the use of an MFN clause in contracts
between health insurers and medical providers.8 All private cases from 1986-1989 were ruled in
favor of MFNs, but in the mid-1990s the Department of Justice brought several challenges, all of
which ended in consent decrees; the insurer implementing the MFN agreed to remove the clause
from its contracts with providers.9 While the market shares have varied across these cases, the
basic facts are the same.
Physicians are not permitted to organize themselves to negotiate collectively with an insurer
regarding fees. In Ocean State for example, Blue Cross alleged that Ocean State and its par-
ticipating physicians “violated Section One of the Sherman Act by conspiring to collectively
negotiate with Blue Cross”.10 The court ruled that there was no evidence that “the Physicians
and Surgeon Association of Rhode Island negotiated or attempted to negotiate collectively with
Blue Cross concerning physicians’ fees.”11
In both the cases brought privately and by the Department of Justice, there has been little
evidence regarding whether the MFN implementing insurer was acting on behalf of its providers.
The one exception is U.S. v. RxCare of Tennessee. RxCare is a pharmacy network that at the
time of the complaint had 95% of Tennessee’s pharmacies in its network, and served more than
50% of those with third-party pharmacy benefits. The difference between RxCare and the other
8Some often cited but less relevant cases include Blue Cross & Blue Shield (Wisconsin) v. Marshfield Clinic;Reazin v. Blue Cross & Blue Shield of Kansas; Kartell v. Blue Shield of Massachusetts.
9Willamette Dental Group v. Oregon Dental Service originally had Willamette as the complainant but theDepartment of Justice took up the case.
10Ocean State Physicians Health Plan, Inc., et al. v. Blue Cross & Blue Shield of Rhode Island (692 F. Supp.52), p.6.
11Ibid.

Chapter 3. MFN Clauses in Health Care Provider Contracts 93
cases is that RxCare had as its sole shareholder the Tennessee Pharmacists Association which
sought to “define and promote appropriate compensation to pharmacists for patient care”.12
Instead of seeking cost-savings, it appears RxCare used the MFN to discourage discounting by
its providers which was allowing rivals to undercut RxCare in the insurance market. The fact
that the MFN discourages discounting likely makes providers better off in aggregate. Supporting
a rival insurer erodes the market position of the incumbent insurer, which in turn reduces the
number of desirable incumbent customers. This cost, however, is borne by the entire network
of pharmacists. In this way, an MFN can mitigate a horizontal externality among pharmacists
by discouraging discounting.13
While the magnitude of the discounting in RxCare is not known, in other cases it has been
substantial. In Vision Services Plan, physicians granted 20-40% discounts to non-VSP insurers
(Doherty and Ras, 2005). And Delta Dental of Rhode Island calculated that its dentists were
accepting fees 14% lower than what they were paying.14
The following model aims to capture the main features of the cases above, and to show
that in a very simple setting an MFN can improve consumer welfare because the cost savings
it generates for the implementing insurer are partially passed through to consumers. On the
other hand, the model also shows that when an insurer is interested in maximizing provider
welfare, an MFN can be used by an insurer to facilitate coordinating a provider cartel. This
claim regarding provider control is supported by the fact that in the case of a single provider, a
provider-controlled insurer has no use for an MFN because there is no coordination problem.
12U.S. v. RxCare of Tennessee, Inc., 121 F.T.C. 762.13Sometimes those opposed to MFNs are not rival insurers, but the providers themselves. In Hawaii, the
largest insurer (HDS) implemented an MFN after it discovered a rival insurer (HMSA) was obtaining discountsfrom dentists. One dentist stated that “HDS discriminates against HMSA providers by paying the lesser HMSAfee. Dentists who participate only with them and not with HMSA receive a higher fee – this is discriminatory.”(Jaworowski, 1997). This dentist believes it is discriminatory to prevent him from price discriminating.
14U.S. v. Delta Dental of Rhode Island (943 F. Supp. 172), p.16.

Chapter 3. MFN Clauses in Health Care Provider Contracts 94
3.3 Model
3.3.1 Setup
The players are an incumbent insurer (I), a potential entrant insurer (E), and a single provider.
Before potential entry, the incumbent agrees to pay the provider an exogenous wage wI > 0 per
patient seen.15 The timing of the game is as follows:
Stage 0 I chooses MFN or No MFN
Stage 1 E enters and offers the provider a wage wE
Stage 2 The provider accepts or rejects the offer of wE
Stage 3 The incumbent and entrant compete in the insurance market
If the entrant does not enter, or enters and has his offer rejected, the monopoly outcome
ensues. The assumptions regarding the nature of competition are as follows.
The incumbent and entrant insurers maximize variable profits πi = π(wi, wj) with i, j ∈
{I, E} and i 6= j where wi is what insurer i pays the provider per patient seen. The provider
has a marginal cost of 0 and has an objective function given by π1 = wEqE + wIqI , where qi is
the amount of insurance sold by insurer i. Because the entrant’s only costs are wage payments
to the provider (who has a marginal cost of 0) then depending on the wE that is determined,
there is potential for the entrant to have a cost advantage over the incumbent. As is often the
case in entry models, the incumbent’s positive cost per unit of insurance, wI , is taken to be
exogenous.16
15This assumption will be relaxed later.16There are a number of hypotheses regarding why wI is strictly positive. One is that a strictly positive wI is
the result of a previous bargaining agreement between incumbent and provider; since in reality the provider has
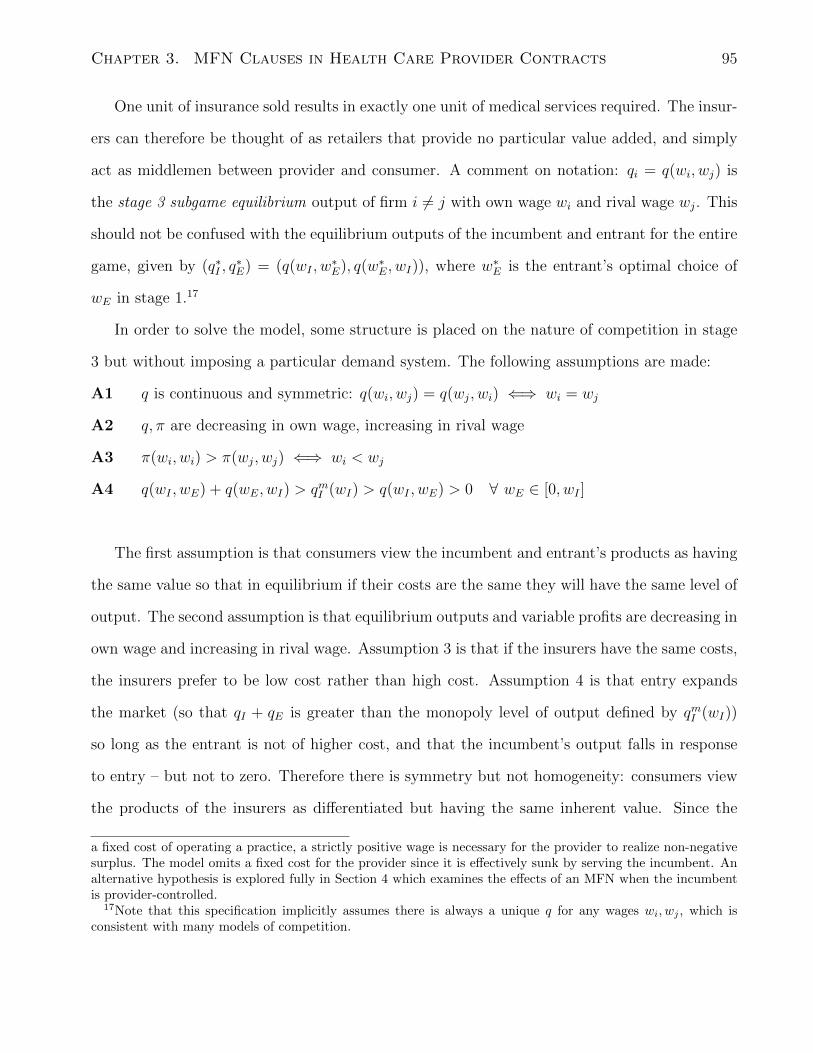
Chapter 3. MFN Clauses in Health Care Provider Contracts 95
One unit of insurance sold results in exactly one unit of medical services required. The insur-
ers can therefore be thought of as retailers that provide no particular value added, and simply
act as middlemen between provider and consumer. A comment on notation: qi = q(wi, wj) is
the stage 3 subgame equilibrium output of firm i 6= j with own wage wi and rival wage wj. This
should not be confused with the equilibrium outputs of the incumbent and entrant for the entire
game, given by (q∗I , q∗E) = (q(wI , w
∗E), q(w∗
E, wI)), where w∗E is the entrant’s optimal choice of
wE in stage 1.17
In order to solve the model, some structure is placed on the nature of competition in stage
3 but without imposing a particular demand system. The following assumptions are made:
A1 q is continuous and symmetric: q(wi, wj) = q(wj, wi) ⇐⇒ wi = wj
A2 q, π are decreasing in own wage, increasing in rival wage
A3 π(wi, wi) > π(wj, wj) ⇐⇒ wi < wj
A4 q(wI , wE) + q(wE, wI) > qmI (wI) > q(wI , wE) > 0 ∀ wE ∈ [0, wI ]
The first assumption is that consumers view the incumbent and entrant’s products as having
the same value so that in equilibrium if their costs are the same they will have the same level of
output. The second assumption is that equilibrium outputs and variable profits are decreasing in
own wage and increasing in rival wage. Assumption 3 is that if the insurers have the same costs,
the insurers prefer to be low cost rather than high cost. Assumption 4 is that entry expands
the market (so that qI + qE is greater than the monopoly level of output defined by qmI (wI))
so long as the entrant is not of higher cost, and that the incumbent’s output falls in response
to entry – but not to zero. Therefore there is symmetry but not homogeneity: consumers view
the products of the insurers as differentiated but having the same inherent value. Since the
a fixed cost of operating a practice, a strictly positive wage is necessary for the provider to realize non-negativesurplus. The model omits a fixed cost for the provider since it is effectively sunk by serving the incumbent. Analternative hypothesis is explored fully in Section 4 which examines the effects of an MFN when the incumbentis provider-controlled.
17Note that this specification implicitly assumes there is always a unique q for any wages wi, wj , which isconsistent with many models of competition.

Chapter 3. MFN Clauses in Health Care Provider Contracts 96
insurers’ products are symmetric, the measure of consumer welfare used is total output, and the
equilibrium concept adopted is Subgame Perfect Nash Equilibrium.
This reduced form approach is useful because it focuses directly on the effect of the cost of
medical services on output, while abstracting from the mechanics of insurer competition. That
is not to say that insurer competition is ignored. The preceding assumptions are natural enough
that they are satisfied by many well known models of price/quantity competition such as text-
book Cournot or differentiated Bertrand competition, and so an advantage of this reduced form
approach is that the welfare results are not confined to a particular competitive framework.
3.3.2 Solution without an MFN
The model is solved by backward induction. Consider a stage 3 history where the incum-
bent has chosen not to impose an MFN in its contract with the provider, and the entrant
has already entered and had his wage offer accepted. The equilibrium outputs are (qI , qE) =
(q(wI , wE), q(wE, wI)). Since the entrant’s profits are decreasing in wE, in stage 1 the entrant
will offer the lowest wE such that the provider accepts. The provider will accept an offer wE in
stage 2 if:
wEq(wE, wI) + wIq(wI , wE) ≥ wIqmI (wI) (3.1)
The entrant will choose wE such that this “participation constraint” binds, and so the wage
offer chosen by the entrant, w∗E, is defined by:
w∗Eq(w
∗E, wI) + wIq(wI , w
∗E) = wIq
mI (wI) (3.2)
which leads to unique equilibrium outputs for the entire game given by (q∗I , q∗E) = (q(wI , w
∗E), q(w∗
E, wI)).18
18In equilibrium equation 1 must bind; if it does not then holding all else constant there exists a lower wE thatsatisfies the participation constraint, violating profit maximization on the part of the entrant. I implicitly assumethere exists a w∗
E that binds this equation as otherwise entry does not occur and the model is not interesting.

Chapter 3. MFN Clauses in Health Care Provider Contracts 97
3.3.3 Solution with an MFN
The previous section describes the equilibrium that occurs when the incumbent chooses not to
include an MFN clause in its contract with the provider. Suppose now that the incumbent does
impose an MFN clause on the provider in stage 0.19 The MFN states that should the provider
see the patients of a rival insurer at a wage less than wI that that lower wage be granted to the
incumbent insurer as well. Therefore a wage offer wE < wI triggers the MFN clause and the
incumbent’s effective marginal cost falls to wE.
In stage 1, the entrant will offer a wage wME that again binds the provider’s participation
constraint20:
wME (q(wME , wME ) + q(wME , w
ME )) = 2wME q(w
ME , w
ME ) = wIq
mI (wI) (3.3)
which leads to symmetric outputs since the MFN requires that the incumbent receive the lower
wME as well. Therefore the equilibrium quantities for the entire game are identical and given
by (q(wME , wME ), q(wME , w
ME )) which for notational convenience will be referred to as (qMI , q
ME ).
Under an MFN, the incumbent’s wage falls and the entrant’s wage increases compared to the
no MFN case, so the incumbent always has an incentive to implement an MFN in stage 0. The
incumbent’s preference for an MFN does not depend on the curvature of the equilibrium output
function. Consumer welfare does, however.
19From a modelling perspective, there is no benefit from allowing the provider to refuse the MFN clause asthe provider will never choose to do so – such a refusal results in lost access to incumbent patients (and profitsof wIqI) without any benefit in return. That said, the provider may seek to share in any benefits accruing tothe incumbent from the MFN. This is a legitimate concern if providers are few, but if they are many then theyare not in a strong position to refuse. The assumption here of a single provider is an abstraction that allows forcleaner exposition.
20Equation (3) presumes that wE ≤ wI so that the MFN is triggered. This is clearly the case as there is noincentive to offer a wage wE > wI since the entrant could do better by offering wE = wI and achieving profitsof πE(wI , wI) > πE(wE , wI) by Assumption 3.

Chapter 3. MFN Clauses in Health Care Provider Contracts 98
3.3.4 Consumer welfare
From the preceding participation constraints, it can be shown that with a reasonable assumption
on the curvature of the equilibrium output function that the MFN increases consumer welfare.
The first step involves recognizing that the entrant need not offer a wage as high as wI , since this
strictly satisfies the participation constraint of equation (3), so that the MFN will be triggered
with wME < wI . The second step shows a wage offer of wME =w∗
E+wI
2strictly satisfies the partic-
ipation constraint, implying that the average wage falls and consumer welfare increases with an
MFN if q is not too convex. The following proposition is the first of two main results of the paper.
Proposition 1: If q is concave in its arguments then the MFN strictly increases total output
and consumer welfare increases.
Proof:
Let w = [w1, w2] with w1, w2 ≥ 0. Then q : w→ R+ is concave if for t ∈ [0, 1]
q(tw1 + (1− t)w2) ≥ tq(w1) + (1− t)q(w2) (3.4)
The purpose of this proof is to show that with concavity, the MFN strictly increases total output,
or that in equilibrium 2qME > q∗E + q∗I . The approach taken is to show that if wME =w∗
E+wI
2then
total output weakly increases when q is weakly concave, and then to show that wME is chosen to
be strictly smaller thanw∗
E+wI
2which establishes the strict inequality 2qME > q∗E + q∗I .
Letting w1= [w∗E, wI ], w2= [wI , w
∗E], and t = 0.5, concavity implies
2q(wM) ≥ q(w1) + q(w2) = q∗E + q∗I (3.5)

Chapter 3. MFN Clauses in Health Care Provider Contracts 99
where wM = [w∗
E+wI
2,w∗
E+wI
2]. Continuing with the above inequality:
2
(w∗E + wI
2
)q(wM) ≥
(w∗E + wI
2
)(q(w1) + q(w2))
2
(w∗E + wI
2
)q(wM) ≥ w∗
Eq(w1) + wIq(w2) +
(w∗E − wI
2
)(q(w2)− q(w1))
2
(w∗E + wI
2
)q(wM) ≥ w∗
Eq∗E + wIq
∗I +
(w∗E − wI
2
)(q(w2)− q(w1)) (3.6)
> w∗Eq
∗E + wIq
∗I
since w∗E < wI =⇒ q(w2) < q(w1). But we know from the participation constraints in eq
(2)-(3) that it must be in equilibrium that the provider earns the same level of profits given by
2wME qME = wIq
mI = w∗
Eq∗E + wIq
∗I (3.7)
Therefore choosing wE =w∗
E+wI
2under an MFN strictly satisfies the participation constraint;
instead there exists a wME <w∗
E+wI
2that the entrant would choose instead. The following
concludes the proof:
2qME = 2q(wME , wME ) > 2q
(w∗E + wI
2,w∗E + wI
2
)= 2q(wM) ≥ q∗E + q∗I
2qME > q∗E + q∗I (3.8)
Proposition 2: Strict convexity of q is not sufficient to guarantee that total output falls and
consumer welfare declines.
Proof: It can be seen intuitively that a strictly convex q can still lead to a strict increase
in total output. With linear q and wME =w∗
E+wI
2, total output strictly increases, but the entrant
chooses a wage offer which is lower. If q is slightly convex, then there should exist a wage offer
slightly greater than the one chosen under linearity that satisfies the participation constraint

Chapter 3. MFN Clauses in Health Care Provider Contracts 100
and is still low enough to strictly increase total output. Examples can be constructed using
specific functional forms such that q is strictly convex and output strictly increases with an
MFN.21
Therefore concavity is sufficient but not necessary for consumer welfare to increase. The
result is illustrated in figure 3 with linear equilibrium output functions, and the intuition is as
follows. Without an MFN, the provider receives many patients from the entrant but is paid a
low wage wE, while the incumbent sends the provider few patients but pays the provider a high
wage wI . A one unit decrease in the incumbent wage combined with a one unit increase in the
entrant wage leads to a strict increase in provider profits despite neither the average wage nor
total output from changing; the profits the provider loses on the lucrative but scarce incumbent
patients are more than made up for by the unit wage increase earned over the larger patient
base of the entrant.
An MFN mandates that this wage gap shrink to zero since both the incumbent and entrant
pay the provider the same wage rate under the MFN. Holding the average wage constant, the
provider strictly prefers this outcome, and as a result is willing to accept a decrease in the aver-
age wage in order to reduce the difference in wages. The entrant recognizes this, and offers that
lower average wage of wME <w∗
E+wI
2. Therefore, the magnitude of the discount offered to the
entrant decreases with an MFN, but this discount now extends to the incumbent as well. Since
the average wage strictly falls, total output strictly increases. When the equilibrium output
function is linear, total output strictly increases, and this implies that the equilibrium output
function can even be “slightly convex” for the MFN to increase total output. Since the MFN
leads to wE increasing and wI decreasing, the incumbent always has an incentive to implement
an MFN, especially when providers are numerous and not in a position to share in the incum-
bent’s increase in profits.
Note that the incumbent chooses to implement an MFN regardless of whether q is concave or
21Let q(wi, wj) = A−(2wi−wj)x which is linear in q when x = 1, concave when x > 1 and convex when x < 1.
Letting A = 100, x = 0.999, w∗E = 1, wI = 2, it can be shown that wM
E = 1.4925 satisfies the participationconstraint, lowers the average wage, and yields total output greater with an MFN than without.

Chapter 3. MFN Clauses in Health Care Provider Contracts 101
convex. Weak concavity of q is sufficient to guarantee that the incentives of the incumbent and
consumers are aligned: the incumbent strictly prefers to implement the MFN and consumers
are strictly better off as a result. Below are the Cournot and Bertrand interpretations of the
model, both of which satisfy assumptions A1-A4.22
3.3.5 Cournot example
Consider a simple Cournot example with linear demand given by P (Q) = A − bQ where
Q = qI + qE. The equilibrium outputs in Cournot satisfy all of the assumptions A1-A4. As
Cournot competitors the equilibrium outputs of the incumbent and entrant are qI = A−2wI+wE
3b
and qE = A−2wE+wI
3b, respectively. Total quantity is given by 2A−(wI+wE)
3bwhich is linear in the
wages so that total output will increase if the average wage falls.
Before entry, the incumbent’s monopoly output is A−wI
2band the provider’s rents are wI
(A−wI
2b
).
Without an MFN, the entrant offers w∗E that makes the provider just as well off as he was under
an incumbent monopoly:
w∗E
(A− 2w∗
E + wI3b
)+ wI
(A− 2wI + w∗
E
3b
)= wI
(A− wI
2b
)(3.9)
With an MFN, the entrant offers wME that satisfies
2wME
(A− wME
3b
)= wI
(A− wI
2b
)(3.10)
22A Hotelling model could also be considered, which typically assumes the entire market is covered so thatqI + qE = 1. Johnson (2012) uses such a linear city representation to compare retail competition under awholesale model of supply with that of an agency or sales model of supply. Johnson finds an MFN under theagency model is welfare neutral from the view of consumers, which reflects the assumption of total output beingfixed.

Chapter 3. MFN Clauses in Health Care Provider Contracts 102
which is simplified since under an MFN, the incumbent’s wage falls from wI to wME . Since these
participation constraints involve quadratics, at this point it is simplest to verify numerically
that the average wage falls under an MFN (i.e. wME <w∗
E+wI
2). Let A = 100, b = 1 and wI = 40.
Then without an MFN, w∗E = 20. With an MFN, offering wME = 30 strictly satisfies the partic-
ipation constraint. Instead, the entrant must only offer wME = 23.53 which is much lower than
the average wage. From this it can be seen that even if the equilibrium output function were
“slightly convex” instead of linear, the wage offer under an MFN would still be low enough to
strictly increase output and consumer welfare.
3.3.6 Differentiated Bertrand example
Consider a setting of differentiated Bertrand competition with linear demands given by qi =
v − pi + γpj for i 6= j ∈ {I, E} and γ ∈ (0, 1). With marginal costs of wI and wE, the
equilibrium outputs of the incumbent and entrant are qI = 2(v−wI)+γ(v+wE)+γ2wI
4−γ2 and qE =
2(v−wE)+γ(v+wI)+γ2wE
4−γ2 with total output given by Q = (4+2γ)v−(2−γ−γ2)(wE+wI)4−γ2 . Note that again
total output depends linearly on the sum of marginal costs so that a fall in the average wage
results in total output increasing.
The simplest way to illustrate that total output increases is to show that wME <w∗
E+wI
2so
that the average wage falls. This can be done by showing that wME =w∗
E+wI
2is a wage that is
higher than the entrant needs to offer to satisfy the participation constraints. Note that with
linear equilibrium output functions, wME =w∗
E+wI
2results in the same level of output because
the average wage is the same. But such a wage strictly satisfies the participation constraint
(w∗E + wI
2
)(qME + qMI
)=
(w∗E + wI
2
)(q∗E + q∗I ) > w∗
Eq∗E + wIq
∗I (3.11)
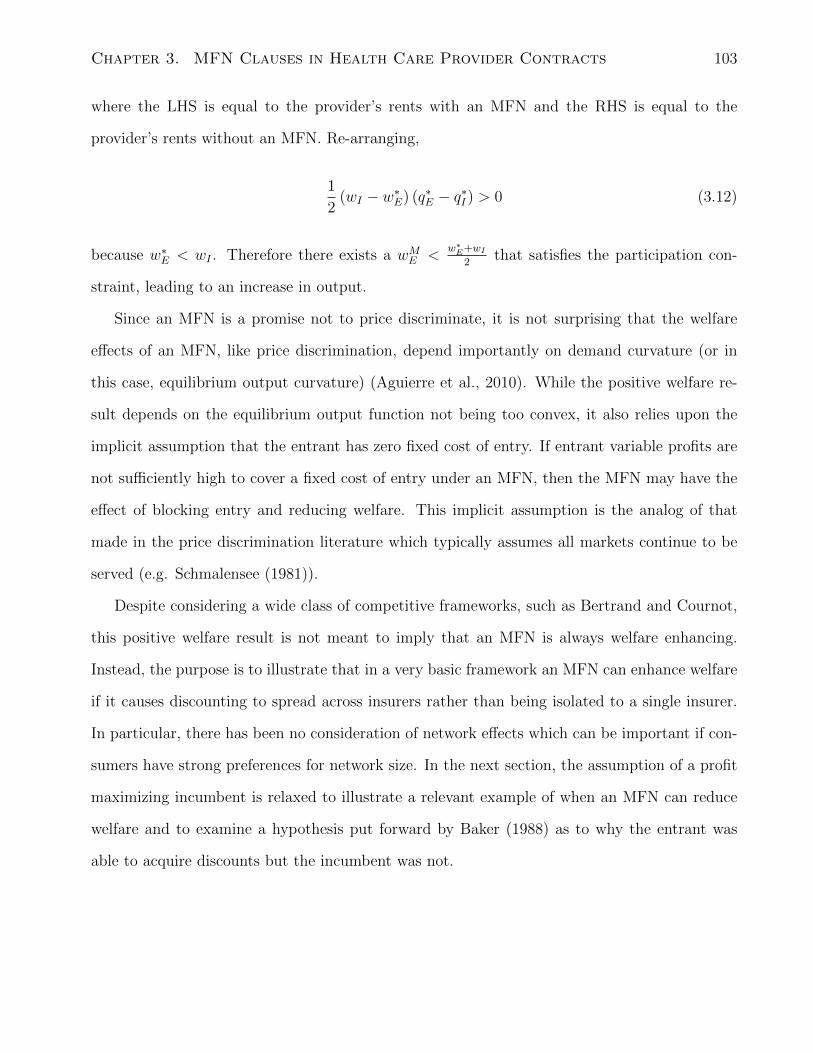
Chapter 3. MFN Clauses in Health Care Provider Contracts 103
where the LHS is equal to the provider’s rents with an MFN and the RHS is equal to the
provider’s rents without an MFN. Re-arranging,
1
2(wI − w∗
E) (q∗E − q∗I ) > 0 (3.12)
because w∗E < wI . Therefore there exists a wME <
w∗E+wI
2that satisfies the participation con-
straint, leading to an increase in output.
Since an MFN is a promise not to price discriminate, it is not surprising that the welfare
effects of an MFN, like price discrimination, depend importantly on demand curvature (or in
this case, equilibrium output curvature) (Aguierre et al., 2010). While the positive welfare re-
sult depends on the equilibrium output function not being too convex, it also relies upon the
implicit assumption that the entrant has zero fixed cost of entry. If entrant variable profits are
not sufficiently high to cover a fixed cost of entry under an MFN, then the MFN may have the
effect of blocking entry and reducing welfare. This implicit assumption is the analog of that
made in the price discrimination literature which typically assumes all markets continue to be
served (e.g. Schmalensee (1981)).
Despite considering a wide class of competitive frameworks, such as Bertrand and Cournot,
this positive welfare result is not meant to imply that an MFN is always welfare enhancing.
Instead, the purpose is to illustrate that in a very basic framework an MFN can enhance welfare
if it causes discounting to spread across insurers rather than being isolated to a single insurer.
In particular, there has been no consideration of network effects which can be important if con-
sumers have strong preferences for network size. In the next section, the assumption of a profit
maximizing incumbent is relaxed to illustrate a relevant example of when an MFN can reduce
welfare and to examine a hypothesis put forward by Baker (1988) as to why the entrant was
able to acquire discounts but the incumbent was not.

Chapter 3. MFN Clauses in Health Care Provider Contracts 104
3.4 Incumbent as a provider-controlled cartel manager
In the antitrust cases presented earlier, it is interesting to consider why the entrant was able
to acquire discounts from providers but the incumbent insurer was not. Providers are typically
numerous and dependent on the incumbent for patients; presumably the incumbent should have
been able to get comparable discounts from providers even before the arrival of the entrant. In
terms of the model presented, the question is why it was that wI > 0 before the arrival of the
entrant. One hypothesis regarding why the incumbent did not seek these discounts itself is that
the incumbent acted as a provider-controlled cartel manager (Baker, 1988). The objective of
such an incumbent would be to facilitate collusion among providers who would otherwise have
an incentive to compete with each other, not to negotiate lower fees. There is strong evidence
to suggest that in at least one antitrust case, this mechanism was at play.23
In this section, rather than the incumbent maximizing its profits, the incumbent maximizes
an alternative objective function which is equal to the welfare of its providers. When the
incumbent maximizes this alternative objective function, an MFN improves provider welfare by
mitigating a free-rider problem among providers. The free rider problem faced by providers is
that they are better off in aggregate not serving the entrant insurer, but face a private incentive
to do so.
This free rider problem should only exist if there are multiple providers. The alternative
model presented below endogenizes the choice of wI and shows that with a single provider, a
provider-controlled incumbent has no incentive to impose an MFN, but as soon as a second
provider is introduced, the incumbent will want to introduce an MFN. The purpose of this is
to highlight that it is the provider-coordinating aspect of the MFN that drives the incumbent’s
desire to use it, and is also the reason the MFN decreases consumer welfare under provider
control.
23RxCare of Tennessee provided pharmacy network services in Tennessee, and was owned exclusively bythe Tennessee Pharmacists Associations which had as part of its mandate to “define and promote appropriatecompensation to pharmacists for patient care”.

Chapter 3. MFN Clauses in Health Care Provider Contracts 105
The model presented above remains the same except that wI is endogenized and chosen by the
incumbent to maximize provider welfare subject to making non-negative profits in the insurance
market. Without an entrant insurer in the market, the incumbent takes the true marginal cost
of the provider of 0 as given, chooses a price in the insurance market that maximizes profits, then
pays its provider that price. In this way, the profits earned in the insurance market are entirely
transferred to the provider. I denote the associated output of the incumbent monopolist as
qmI = q(0) since the incumbent acts based upon the provider’s marginal cost of 0. It follows that
the profits earned by the provider are wmI q(0) where wmI is the price charged by the incumbent
in the insurance market (and equals the wage paid to the provider).
3.4.1 Single provider’s welfare cannot be increased via an MFN
If the incumbent chooses No MFN in stage 0, then the entrant again offers the provider the
lowest wE such that the provider accepts. If the provider accepts this offer w∗E the equilibrium
outputs are (q∗I , q∗E) = (q(0, w∗
E), q(w∗E, 0)).24 The provider earns profits of
wIq∗I + w∗
Eq∗E = wmI q(0) (3.13)
where wI is chosen by the incumbent and set equal to whatever price the incumbent commands
in the insurance market.
If the incumbent chooses MFN in stage 0, the entrant again offers the lowest wE such that
the provider accepts. If the provider accepts this offer wME the equilibrium outputs are (qMI , qME ).
The provider earns profits of
wME qMI + wME q
ME = wmI q(0) (3.14)
24These should not be confused with the q∗I and q∗E from section 3.

Chapter 3. MFN Clauses in Health Care Provider Contracts 106
assuming such a wME exists.25
The provider’s profits are the same with the MFN as without it; as such, the provider-
controlled incumbent has no reason to implement it. However, with the introduction of only a
second provider, an MFN has a role to play because there exists a horizontal externality between
the two providers that doesn’t exist with only one provider.
3.4.2 The MFN increases provider welfare with two providers
With a second provider, something must be said about consumers’ preferences for network size.
To keep the model as simple as possible, assume that consumers do not care about network size,
so that whether an insurer offers access to one provider or two providers makes no difference - all
consumers desire is for the insurer to have at least one provider. The purpose of this unrealistic
assumption is to highlight the externality faced by providers. Therefore if each insurer provides
access to at least one provider, then the equilibrium output functions are exactly the same as
before. Further, if both providers participate in an insurer’s network, then I assume patients
coming from that insurer are split evenly between providers. In terms of the timing of the game,
the incumbent still chooses MFN or No MFN in stage 0, the entrant still makes a uniform wage
offer wE to both providers in stage 1, the providers then simultaneously accept/reject in stage
3, and in the final stage the incumbent and entrant compete.
Without an MFN, what wage will the entrant offer these providers? The entrant recognizes
that he only needs one provider to sell insurance and chooses the lowest wE such that there
exists an equilibrium where at least one provider accepts. Given an entrant offer of wE, if both
accept then the providers each earn profits of
1
2(wIq(0, wE) + wEq(wE, 0)) ≥ 1
2wIq(0, wE) (3.15)
25If it does not exist, then the entrant cannot make an acceptable offer to the provider, and the monopolyoutcome is maintained regardless.

Chapter 3. MFN Clauses in Health Care Provider Contracts 107
which binds if wE = 0. Therefore there exists an equilibrium with two providers where the
entrant offers wE = 0 and both accept. The reason is that if one of the two providers attempts
to deviate by rejecting, he will earn exactly the same amount of profits since his leaving the
entrant’s network has no effect on the entrant’s ability to sell insurance.
The providers have allowed entry to occur without receiving any compensation from the
entrant, but have harmed themselves by reducing the incumbent’s ability to earn profits in the
insurance market on their behalf. The providers would both be better off rejecting and each
receiving half of wmI q(0) rather than half of wIq(0, 0). Since (Reject, Reject) payoff-dominates
(Accept, Accept), the providers face a coordination problem - they are both better off rejecting,
however if one thinks the other is accepting then that provider may as well accept too.
The result of w∗E = 0 takes this intuition to the extreme: in reality, the entrant just has to
offer the providers a wage slightly above marginal cost. The providers as a whole are better
off shunning the entrant to preserve the incumbent’s share of the market, but if one is going
to accept and earn extra profits from the entrant, then the other provider may as well accept
and share in those profits too since the damage to the incumbent has already been done. This
is what some refer to as a “horizontal externality” among providers, with the classic reference
being Rasmusen et al (1991). With a single provider, a wage offer of wE = 0 is quickly rejected.
With two providers, the entrant fully exploits the coordination problem, even though the two
providers both recognize the effect their decisions have on the insurance market.
3.4.3 The MFN solves the coordination problem
With two providers, the no-MFN equilibrium is that the entrant exploits a coordination problem
among providers to be able to pay them only wE = 0, a wage offer that would not be accepted by
a single provider that faces no coordination problem. A provider-controlled incumbent can use an
MFN to mitigate this coordination problem. The following shows that despite the possibility of
multiple equilibria, each equilibrium with an MFN strictly dominates the corresponding outcome
without an MFN.

Chapter 3. MFN Clauses in Health Care Provider Contracts 108
Since there is so little structure placed on demand, there are 3 types of Nash equilibria in the
stage 2 subgame: (Accept, Accept), (Accept, Reject), and (Reject, Reject).26 For each wE offer
made in stage 1, there is a corresponding stage 2 Nash equilibrium. When the entrant makes his
wage offer, his objective is to offer the lowest wE such that at least one provider accepts. The
following shows that regardless of which stage 2 Nash equilibrium we consider, provider welfare
is higher with an MFN than without it.
Consider an (Accept, Accept) Nash equilibrium. For neither provider to want to deviate,
it must be that their profits from both accepting are at least as high as their profits from
unilaterally deviating to (Accept, Reject). For this to be an equilibrium, the entrant’s wage
offer wME must satisfy the following constraint for each provider:
wME
(q(wME , 0) + q(0, wME )
2
)≥ wMI q(0, w
ME )
2(3.16)
which increases each provider’s welfare because
wMI q(0, wME )
2>wIq(0, 0)
2(3.17)
where qI(0, 0) < qI(0, wME ).27 The intuition is simple. If the incumbent knows the providers are
going to accept the entrant’s wage offer regardless of whether there’s an MFN or not, he may
as well implement an MFN so as to force the entrant to increase his wage offer from wE = 0 to
wME > 0.
Now consider an (Accept, Reject) Nash equilibrium. For neither provider to want to deviate,
it must be that their profits from accepting are at least as high as their profits from unilaterally
deviating to (Reject, Reject) [for the acceptor] or (Accept, Accept) [for the rejector]. The
26The equilibria (Accept, Reject) and (Reject, Accept) are treated as a single equilibrium.27The wage wI is equal to whatever price the incumbent charges in the insurance market when there is no
MFN. The wage that the incumbent pays the rejecting provider, wMI , is actually higher than the price the
incumbent charges in the insurance market with an MFN, since it only has to pay the accepting provider
wME < pI =
wME +wM
I
2 . Because with concavity qI(0, wME ) + qE(wM
E , 0) < qI(0, 0) + qE(0, 0), prices are higher withthe MFN assuming demand is decreasing in price.

Chapter 3. MFN Clauses in Health Care Provider Contracts 109
acceptor’s profits must satisfy
wME
(q(wME , 0) +
q(0, wME )
2
)≥ 1
2wmI q(0) (3.18)
so that the acceptor does not want to reject and revert to the monopoly outcome. And the
rejector’s profits must satisfy
wMI q(0, wME )
2≥ wME
(q(wME , 0) + q(0, wME )
2
)(3.19)
so that the rejector does not want to also accept and receive wME , and then obtain patients
from both insurers. Both constraints yield profits to the providers that exceed the profits of
12wIqI(0, 0) that they receive without an MFN.28
Note that since the MFN mandates that the incumbent pay the accepting provider wME < wmI ,
the incumbent is able to pay the rejecting provider even more than wmI with an MFN. The rea-
son is that if the incumbent maintained a wage of wmI for the rejecting provider, the incumbent
would earn positive profits in the insurance market because now it’s only paying the accepting
provider wME . But since the incumbent has no incentive to earn profits in the insurance market,
it can either transfer those profits to consumers by lowering price, or instead increase wmI and
transfer them to the rejecting provider. Of course since the incumbent is maximizing provider
profits, it will choose the latter. This can be interpreted as the incumbent rewarding the re-
jecting provider with a higher wage for not supporting the entrant, and punishing the accepting
provider with a lower wage.
The final case is that of a (Reject, Reject) Nash equilibrium which means the entrant has
offered a wE that neither provider finds acceptable. In fact, it is possible there is no such wE
that a provider would accept. In this case the entrant is blocked from entering the market, and
the MFN restores both providers to the monopoly outcome which again yields profits to the
28Equation 14 shows the acceptor is made at least as well off as under monopoly, and equation 15 shows the
rejector obtains utilitywM
I q(0,wME )
2 > wIqI(0,0)2 as before in equation 13.

Chapter 3. MFN Clauses in Health Care Provider Contracts 110
providers strictly greater than the no MFN case. Therefore in stage 0 it is weakly dominant for
the incumbent to choose MFN over No MFN.
Unlike an insurer interested in its own profits, a provider-controlled insurer uses the MFN to
discourage discounting by its providers. While the MFN can block entry entirely, the provider-
controlled insurer still finds the MFN useful when entry cannot be blocked because it forces the
entrant insurer to pay providers more. The following is the second main result of the paper.
Proposition 3: If q is concave in its arguments, an MFN implemented by a provider-controlled
incumbent reduces consumer welfare.
Proof: it’s been shown above that a provider-controlled incumbent with two providers always
has an incentive to implement an MFN, and that when this occurs the entrant must always
offer a strictly positive wage. Without an MFN the entrant offers wE = 0 and total output is
qE(0, 0) + qI(0, 0), whereas with an MFN, wME > 0 and total output is qE(wME , 0) + qI(0, wME ) <
qE(0, 0) + qI(0, 0).29
The provider-controlled incumbent is not interested in the cost-savings earned through the
MFN, since any “savings” come at the expense of provider welfare. Instead, the incumbent
finds the MFN useful for coordinating a provider cartel; the MFN discourages discounting by
providers because even though providers recognize the incumbent is operating in the insurance
market on their behalf, providers have a private incentive to earn extra profits by supporting
the entrant as half the cost of entry is borne by the other provider. The MFN not only pun-
ishes providers who continue to support the entrant, but also allows the incumbent to issue a
higher wage as a reward to the provider who does not support the entrant. The MFN mitigates
the horizontal externality between providers because it better aligns the private incentives of
providers with the total welfare of providers.30
29A2 gives q(0, 0) > q(wE
2 ,wE
2 ) and concavity implies q(wE
2 ,wE
2 ) ≥ q(wE , 0) + q(0, wE).30The positive welfare result of Section 3 continues to hold with two providers: an MFN implemented by
a for-profit incumbent still increases welfare. It can be shown that the entrant will offer wE = 0 without an

Chapter 3. MFN Clauses in Health Care Provider Contracts 111
3.5 Conclusion
Recent statements made by members of the Department of Justice suggest a generally negative
attitude towards the use of MFNs in vertical supply relationships. This paper shows that this
view is not necessarily warranted, as the use of an MFN by a for-profit insurer may improve
welfare in certain circumstances. The MFN generates cost savings for the insurer implementing
it, and these cost savings may be passed through to the benefit of subscribers of that insurer.
The MFN, however, also raises rival insurers’ costs of medical services which harms subscribers
of those rival insurers. This paper suggests that antitrust authorities should be cognizant of
these changes to the welfare of different consumers when designing policy.
That the MFN generates cost savings for the implementing insurer suggests that the intent
of an MFN is not necessarily predatory even though it decreases the variable profits of rival
insurers. As such, the theory implies an MFN-implementing insurer will always pass a test of
predation since it does not incur any short-run losses.31
If, however, there is evidence to suggest the MFN-implementing insurer is not interested in
earning profits in the insurance market but instead is interested in the welfare of its providers
upstream, then the MFN does not result in cost-savings to consumers. Here, the MFN reduces
welfare because any cost-savings resulting from the MFN are transferred upstream to providers
that did not join the entrant’s network, and not to consumers downstream. In this case the
cost-savings rationale for the MFN should be viewed skeptically and for this reason it would
be interesting for future analysis carried out by antitrust authorities to specifically investigate
the objectives of the insurer imposing the MFN. This would be particularly prudent when the
insurer has a publicly-stated mandate to protect provider welfare, as in RxCare. These con-
MFN and wME <
wmI
3 with an MFN. The wage offer wME is accepted by one provider and average wages fall since
c+c+wME +wM
E
4 <wm
I +wmI +0+04 where c is the incumbent’s effective marginal cost of
wmI +wM
E
2 with an MFN. Becausethe average wage falls, total output increases (from concavity) and consumer welfare increases.
31To be specific, the use of the MFN would easily pass the Brooke Group standard for establishing predation,which requires showing the plaintiff priced below an appropriate measure of cost and had a reasonable prospectof recouping the resulting losses in the future. This is likely the reason why Blue Cross & Blue Shield has arguedthat this is the standard that should apply to the evaluation of MFNs. See U.S. v. Blue Cross & Blue Shield ofMichigan.

Chapter 3. MFN Clauses in Health Care Provider Contracts 112
trasting uses of an MFN suggest the rule of reason approach currently taken by the Department
of Justice towards MFNs is appropriate, but that the Department’s apparent presumption that
MFNs reduce welfare is misguided.
A benefit of the simple model presented is that it captures features of many familiar mar-
kets. Instead of the market being for health insurance, the market could be for cable television,
smartphones, operating systems, eBook readers, etc. Rather than providers upstream, these
markets feature television programmers, software developers, and eBook publishers upstream,
which consumers must typically access through a device downstream. The Department of Jus-
tice’s recent challenge of Apple’s use of an MFN in its contracts with eBook publishers suggests
the use of price relationship agreements in vertical contracts will continue to be an important
antitrust issue going forward.32
Despite considering a wide class of competitive frameworks, including Bertrand and Cournot,
the model presented makes a number of abstractions from a market that is known for its com-
plexity. For example, network effects are considered in only a very simplistic way. Since the
MFN causes reluctance on the part of providers to participate in the entrant insurer’s network,
the entrant may find it more difficult to sell insurance due to its smaller network. A next step
for future work involves generalizing the results of this reduced form approach to consider the
role that network effects could play.
32See U.S. v. Apple, et al. Competitive Impact Statement, April 11, 2012

Chapter 3. MFN Clauses in Health Care Provider Contracts 113
Figure 3.1: Health insurance as a vertical supply chain. Suppose insurer 2 negotiates a 20%discount from what insurer 1 pays a provider. If Insurer 1 has an MFN clause in its contractwith the provider, that discount must also be granted to insurer 1.

Chapter 3. MFN Clauses in Health Care Provider Contracts 114
Figure 3.2: A summary of MFN cases. The insurer implementing the MFN typically had sub-stantial market size and virtually all providers participating in its network. Early cases wereruled in favor of MFNs, but later Department of Justice challenges result in settlements.

Chapter 3. MFN Clauses in Health Care Provider Contracts 115
Figure 3.3: The provider strictly prefers uniform pricing by an amount equal to twice the shadedarea, despite neither the average wage nor the average quantity changing. As such, the provideris willing to accept a decrease in the average wage to obtain uniform pricing which leads to theaverage wage falling, and total quantity along with consumer welfare increasing.

Bibliography
Aguierre, I., Cowan, S., and J. Vickers (2010), “Monopoly Price Discrimination and
Demand Curvature,”American Economic Review 100, 1601-15.
Ambrus, A., Calvano, E., and M. Reisinger (2013), “Either or Both Competition: a
‘Two-Sided’ Theory of Advertising with Overlapping Viewerships,” Working Paper.
Anderson, S. P., and S. Coate (2005), “Market Provision of Broadcasting: a Welfare
Analysis,” Review of Economic Studies 72, 947-972.
Anderson, S. P., and J. J. Gabszewicz (2005), “The Media and Advertising: a Tale of Two
Sided Markets,” Discussion Paper 2005-60, University of Louvain.
Argentesi, E., and L. Filistrucchi (2007), “Estimating Market Power in a Two-Sided
Market: The Case of Newspapers,” Journal of Applied Econometrics 22, 1247-1266.
Armstrong, M. (2006), “Competition in Two-Sided Markets,” The RAND Journal of
Economics 37, 668-691.
Arnault, R. J., and D. M. Eistenstadt (1980), “The Effects of Provider Control of Blue
Shield Plans: Regulatory Options,”Working Paper 645, University of Illinois at Urbana-
Champaign.
Baker, J. B. (1988), “Vertical Restraints among Hospitals, Physicians and Health Insurers
that Raise Rivals’ Costs,”American Journal of Law & Medicine 14, 147-169.
Baker, J. B., and J. A. Chevalier (2013), “The Competitive Consequences of Most-
Favored-Nation Provisions,” Antitrust 27 (2), 20-26.
Besanko, D., and T. P. Lyon (1993), “Equilibrium Incentives for Most-Favored Customer
116

Bibliography 117
Clauses in an Oligopolistic Industry”, International Journal of Industrial Organization 11,
347-367.
Butz, D. A. (1990), “Durable Good Monopoly and Best-Price Provisions,”American
Economic Review 80, 1062-1076.
Chandra, A., and A. Collard-Wexler (2009), “Mergers in Two-Sided Markets: an Applica-
tion to the Canadian Newspaper Industry,” Journal of Economics & Management Strategy
18, 1045-1070.
Chen, J., and Q. Liu (2011), “The Effect of Most-Favored Customer Clauses on
Prices,”Journal of Industrial Economics 59, 343-371.
Chipty, T., and C.M. Snyder (1999), “The Role of Firm Size in Bilateral Bargaining:
a Study of the Cable Television Industry,” The Review of Economics and Statistics 81,
326-340.
Cooper, T. E. (1986), “Most-Favored-Customer Pricing and Tacit Collusion,”RAND
Journal of Economics 17, 377-388.
Cowan, S. (2007), “The Welfare Effects of Third-Degree Price Discrimination with
Nonlinear Demand Functions,”RAND Journal of Economics 38, 419-428.
Crawford, G.S., and A. Yurukoglu (2012), “The Welfare Effects of Bundling in Multichan-
nel Television Markets,” American Economic Review 102, 643-685.
Crocker, K. J., and T. P. Lyon (1994), “What do ‘Facilitating Practices’ Facilitate? an
Empirical Investigation of Most-Favored-Nation Clauses in Natural Gas Contracts,”Journal
of Law and Economics 37, 297-322.
Daughety, A. F., and J. F. Reinganum (2004), “Exploiting Future Settlements: a
Signalling Model of Most-Favored-Nation Clauses in Settlement Bargaining,”RAND Journal
of Economics 35, 467-485.
DeGraba, P., and A. Postlewaite (1992), “Exclusivity Clauses and Best Price Policies in
Input Markets,”Journal of Economics & Management Strategy 1, 423-454.
Department of Justice (2012), “Competition and Health Care: A Prescription for

Bibliography 118
High-Quality, Affordable Care,”March 19, 2012.
Doherty, J. F., and M. Ras (2005), “Most Favored Nation Clauses in Payor/Provider
Agreements,”Working Paper, University of Maryland School of Law.
Filistrucchi, L., Klein, T., and T. Michielsen (2011), “Assessing Unilateral Merger Effects
in a Two-Sided Market: an Application to the Dutch Daily Newspaper Market,” Working
Paper Tilburg Law and Economics Center.
Gans, J. (2012), “Mobile Application Pricing,” Information Economics and Policy 24,
52-59.
Grennan, M. (2012), “Price Discrimination and Bargaining: Empirical Evidence from
Medical Devices,”American Economic Review 103, 145-177.
Jaworowski, S. (1997), “Teeth on Edge: the Debate on Dental Insurance in Hawai’i,”Report
No. 4. Legislative Reference Bureau.
Jeziorski, P. (2012), “Effects of Mergers in Two-sided Markets: Examination of the
U.S. Radio Industry,” Working Paper Haas School of Business, University of California at
Berkeley.
Johnson, J. P. (2012), “MFN Clauses and the Agency and Wholesale Models in Electronic
Content Markets,”Working Paper, Cornell University.
Kaiser, U., and J. Wright (2006), “Price Structure in Two-Sided Markets: Evidence from
the Magazine Industry,” International Journal of Industrial Organization 24, 1-28.
Kass, D. I., and P. A. Pautler (1979), “Staff Report on Physician Control of Blue Shield
Plans,”Federal Trade Commission, November 1979.
Kind, H.J., Nilssen, T., and L. Sorgard (2011), “Channel Coordination and Competition
in Two-Sided Markets,” Working Paper August 31, 2011.
Klibanoff, P., and T. Kundu (2009), “Monopoly Pricing under a Medicaid-Style Most-
Favored-Customer Clause and its Welfare Implication,”CSIO Working Paper #0100.
Lear (2012), “Can ‘Fair’ Prices be Unfair? A Review of Price Relationship Agreements,”
U.K. Office of Fair Trading Paper #1438

Bibliography 119
McAfee, R. P., and M. Schwartz (1994), “Opportunism in Multilateral Vertical Con-
tracting: Nondiscrimination, Exclusivity, and Uniformity,”American Economic Review 84,
210-230.
Neilson, W. S., and H. Winter (1993), “Bilateral Most-Favored-Customer Pricing and
Collusion,”RAND Journal of Economics 24, 147-155.
O’Brien, D. P., and G. Shaffer (1992), “Vertical Control with Bilateral Contracts,”RAND
Journal of Economics 23, 299-308.
Rasmusen, E. B., J. M. Ramseyer, and J. S. Wiley Jr. (1991), “Naked Exclusion,”American
Economic Review 81, 1137-45.
Rochet, J., and J. Tirole (2002), “Cooperation among Competitors: Some Economics of
Payment Card Associations,” RAND Journal of Economics 33, 549-570.
Rogerson, W.P. (2013), “Vertical Mergers in the Video Programming and Distribution
Industry: The Case of Comcast-NBCU,” The Antitrust Revolution 6th Edition, Ed: John E.
Kwoka, Jr. and Lawrence J. White. Oxford University Press, 2013.
Salop, S., and D. T. Scheffman (1983), “Raising Rivals’ Costs,”American Economic
Review 73, 267-271.
Salop, S. and F. Scott Morton (2013), “Developing an Administrable MFN Policy,”
Antitrust, 27 (2), 15-20.
Schmalensee, R. (1981), “Output and Welfare Implications of Monopolistic Third-Degree
Price Discrimination,”American Economic Review 71, 242-247.
Schuh, S., O. Shy, J. Stavins, and R. Triest (2012), “An Economic Analysis of the 2011
Settlement Between the Department of Justice and Credit Card Networks,” Journal of
Competition Law and Economics 8, 107-144.
Scott Morton, F. (2012), “Contracts that Reference Rivals,” Antitrust 27 (3), 72-79.
Scott Morton, F. (1997), “The Strategic Response by Pharmaceutical Firms to the
Medicaid Most-Favored-Customer Rules,”RAND Journal of Economics 28, 269-290.
Spier, K. E. (2003), “The Use of Most-Favored-Nation Clauses in Settlement of Litiga-

Bibliography 120
tion,”RAND Journal of Economics 34, 78-95.
Van Cayseele, P. and S. Vanormelingen (2010), “Merger Analysis in Two-Sided Markets:
the Belgian Newspaper Industry,” Working Paper.
Varian, H. R. (1983), “Price Discrimination and Social Welfare,”American Economic
Review 75, 870-875.
Villas-Boas, S. B. (2009), “An Empirical Investigation of the Welfare Effects of Banning
Wholesale Price Discrimination,”RAND Journal of Economics 40, 20-46 .
Weyl, E. G. (2006), “The Price Theory of Two-Sided Markets,” Working Paper. Many
of the results in this paper no longer appear in the much modified version published in the
American Economic Review, 2010.
Wilbur, K.C. (2008), “A Two-Sided, Empirical Model of Television Advertising and
Viewing Markets,” Management Science 27, 356-378.
Wright, J. (2004), “One-sided Logic in Two-sided Markets,” Review of Network Economics
3, 44-64.