Embed Size (px)
Citation preview

ESSAYS ON PHARMACEUTICALS AND HEALTH CARE EXPENDITURES
A Dissertation
by
ZEYNAL KARACA
Submitted to the Office of Graduate Studies of Texas A&M University
in partial fulfillment of the requirements for the degree of
DOCTOR OF PHILOSOPHY
August 2007
Major Subject: Economics
ESSAYS ON PHARMACEUTICALS AND HEALTH CARE EXPENDITURES
A Dissertation
by
ZEYNAL KARACA
Submitted to the Office of Graduate Studies of Texas A&M University
in partial fulfillment of the requirements for the degree of
DOCTOR OF PHILOSOPHY
Approved by: Chair of Committee, Steven N. Wiggins Committee Members, Steven L. Puller Qi Li George Davis Head of the Department, Amy J. Glass August 2007 Major Subject: Economics

iii
ABSTRACT
Essays on Pharmaceuticals and Health Care Expenditures. (August 2007)
Zeynal Karaca, B.S., Bilkent University;
M.A., Bilkent University
Chair of Advisory Committee: Dr. Steven N. Wiggins
The U.S. pharmaceutical industry has been remarkably successful in developing new
treatments for many of the leading causes of morbidity and mortality. These new treatments and
their high prices lead government and private parties to increase spending and raise the issue of
access. Price and cost increases have stimulated insurance costs, raising questions about the
value of new technologies. A key way to address the increase in pharmaceutical prices is to
investigate the impact of newer therapies on overall health expenditure.
There is a conflict among researchers about the benefits and costs of newer and better
drugs. Some researchers argue that newer and better drugs keep people out of hospitals and
provide significant cost savings. Another group of researchers argue in their work that newer
drugs do not really provide significant cost savings. This dissertation investigates the impacts of
break-through drug classes on overall health care expenditures. Empirical evidence presented in
this dissertation shows that drugs belonging to new drug classes provide significant advances in
treatment of conditions compared to other drugs. The results indicate that all new drug classes
except Fluoroquinolones provide substantial cost savings on overall health care expenditures.
This dissertation also explores the relations between FDA Therapeutic Drug
Classification and total health care expenditures. It offers a better methodology by incorporating
both the quality and the age of the drugs to capture their effects on total health care expenditures.

iv
It studies the impacts of the quality and the age of the drugs on the diseases of following
therapeutic classes: musculoskeletal system and connective tissue, skin and subcutaneous tissue,
neoplasm, mental disorders, nervous system and sense organs, circulatory system, respiratory
system, digestive system, genitourinary system. The nature of therapeutic conditions coupled
with their duration lead us to conclude that for some therapeutic categories newer priority drugs
are preferable, for others newer standard drugs are better. The results suggest that there is no
general rule to state that newer priority drugs decrease health care expenditures.

v
DEDICATION
To my wife, Pervin, my daughter Ezo Helin and my son Baran Ekin

vi
ACKNOWLEDGEMENTS
I want to thank Steven N. Wiggins, my dissertation advisor, who guided and supported
me through my Ph.D. program. He offered very helpful and precious comments and suggestions
during my research. His technical and editorial help were essential to the completion of this
dissertation. I am enormously grateful to Steven Puller, Qi Li and George Davis for their
encouragement and invaluable help. I also specifically thank James Griffin for guiding me in the
consulting world, and for initiating great opportunities for me in my career. His great economic
intuition and insight has inspired my way of thinking as an economist. Both Steve Wiggins and
James Griffin are the best examples, for me of how a researcher should be.
I am also grateful to my wife, Pervin Karaca, for her belief, patience and support. I am
very grateful to my daughter, Ezo Helin and my son Baran Ekin, the spirit and joys of my life.
I also thank all my friends and officemates especially Anirban Sengupta, Ivan Tasic and
Ahmad Alwaked for their friendship and support. In addition, I thank Mutlu and Mevlude
Yuksel, Faruk and Hatice Balli for their friendship and support.
Finally, I would like to express my deepest gratitude to my family. I thank them for their
love and dedication for all these years.
vii
TABLE OF CONTENTS
Page
ABSTRACT........................................................................................................................... iii
DEDICATION....................................................................................................................... v
ACKNOWLEDGEMENTS................................................................................................... vi
TABLE OF CONTENTS....................................................................................................... vii
LIST OF TABLES................................................................................................................. ix
CHAPTER
I INTRODUCTION.................................................................................................. 1
II LITERATURE REVIEW....................................................................................... 5
II.1 Literature on Cost and Benefit of Newer Drugs ........................................... 5 II.2 Literature on Prescription Drug Cost Sharing............................................... 9 II.3 Literature on Access to Newer Therapies ..................................................... 11 II.4 Literature on FDA Therapeutic Classification and Quality Measurement ... 16
III THE IMPACTS OF BREAK-THROUGH DRUG CLASSES ON TOTAL HEALTH CARE EXPENDITURES ...................................................................... 22
III.1 Introduction................................................................................................... 22 III.2 Model ............................................................................................................ 27 III.3 Data ............................................................................................................... 29 III.4 Empirical Analysis........................................................................................ 31 III.4.1 Selective Serotonin Reuptake Inhibitors (SSRIs) ........................... 34 III.4.2 Statins.............................................................................................. 39 III.4.3 Ace Inhibitors.................................................................................. 42
III.4.4 H2 Receptors Antagonists and Proton Pump Inhibitors (H2s and PPIs) ................................................................................ 45 III.4.5 Calcium Channel Blockers (CCBs) ................................................ 48 III.4.6 Fluoroquinolones ............................................................................ 51 III.5 Conclusion .................................................................................................... 53

viii
CHAPTER Page
IV NOVEL DRUGS AND HEALTH CARE EXPENDITURES ............................. 55
IV.1 Introduction................................................................................................... 55 IV.2 Model............................................................................................................ 58 IV.3 Data............................................................................................................... 60 IV.4 Empirical Analysis........................................................................................ 61 IV.4.1 Musculoskeletal System and Connective Tissue Diseases............. 62 IV.4.2 Skin and Subcutaneous Tissue Diseases......................................... 65 IV.4.3 Neoplasm ........................................................................................ 68 IV.4.4 Mental Disorders ............................................................................ 70 IV.4.5 Diseases of Nervous System and Sense Organs ............................. 72 IV.4.6 Circulatory System Diseases .......................................................... 74 IV.4.7 Respiratory System Diseases.......................................................... 76 IV.4.8 Digestive System Diseases ............................................................. 78 IV.4.9 Genitourinary System Diseases ...................................................... 80 IV.5 Conclusion ................................................................................................... 82 V CONCLUSION...................................................................................................... 83 REFERENCE......................................................................................................................... 85 APPENDIX A........................................................................................................................ 90 VITA .............................................................................................................................. 108

ix
LIST OF TABLES
TABLE Page
1. New Drug Classes...................................................................................................... 32
2. Selective Serotonin Reuptake Inhibitors ICD-9 Codes for 4, 5 and 6 Percent Samples ............................................................ 33
3. Summary Statistics for Five Percent Sample
Various Break-Through Drug Categories.................................................................. 33 4. Selective Serotonin Reuptake Inhibitors
Analysis of Impact of Health Care Expenditures ...................................................... 36 5. Statins
Analysis of Impact of Health Care Expenditures ...................................................... 41 6. Ace Inhibitors
Analysis of Impact of Health Care Expenditures ...................................................... 44 7. H2 Antagonists and Proton Pump Inhibitors
Analysis of Impact of Health Care Expenditures ...................................................... 47 8. Calcium Channel Blockers
Analysis of Impact of Health Care Expenditures ...................................................... 50 9. Fluoroquinolones
Analysis of Impact of Health Care Expenditures ...................................................... 52 10. Summary Statistics for Various Therapeutic Classes of Diseases............................. 63 11. Analysis of Impacts of Quality and Age of the Drugs on
Total Health Care Expenditures Associated with Diseases of Musculoskeletal System and Connective Tissue ....................................................... 64
12. Analysis of Impacts of Quality and Age of the Drugs on
Total Health Care Expenditures Associated with Diseases of Skin and Subcutaneous Tissue................................................................................... 67
13. Analysis of Impacts of Quality and Age of the Drugs on
Total Health Care Expenditures Associated with Neoplasm..................................... 69

x
TABLE Page
14. Analysis of Impacts of Quality and Age of the Drugs on
Total Health Care Expenditures Associated with Diseases of Mental Disorders........................................................................................................ 71
15. Analysis of Impacts of Quality and Age of the Drugs on
Total Health Care Expenditures Associated with Diseases of Nervous Systems and Sense Organs .......................................................................... 73
16. Analysis of Impacts of Quality and Age of the Drugs on
Total Health Care Expenditures Associated with Diseases of Circulatory Systems ................................................................................................... 75
17. Analysis of Impacts of Quality and Age of the Drugs on
Total Health Care Expenditures Associated with Diseases of Respiratory Systems................................................................................................... 77
18. Analysis of Impacts of Quality and Age of the Drugs on
Total Health Care Expenditures Associated with Diseases of Digestive Systems...................................................................................................... 79
19. Analysis of Impacts of Quality and Age of the Drugs on
Total Health Care Expenditures Associated with Diseases of Genitourinary Systems............................................................................................... 81

1
CHAPTER I
INTRODUCTION
This dissertation is composed of a detailed examination of the impact of new drugs on
the cost of prescriptions and on the overall cost of healthcare. The impact of new drugs and drug
classes on overall healthcare expenditures is an important medical and economic question.
Pharmaceutical firms spend billions of dollars developing new therapies. These therapies are
typically sold at a substantial premium over older therapies and the use of these drugs is
controversial. Some claim that there are few therapeutic advantages of these newer drugs and
they simply drive up costs. This position has found its way into certain policies as public and
private insurers restrict the inclusion of certain drugs in their formularies. Health plan and
Medicare/Medicaid often restrict the use of newer therapies pointing to associated cost savings.
These policies may lead to prescription cost savings, but run the risk of excluding therapies that
lower total healthcare spending.
In an important paper, Lichtenberg (2001a and 2001b) shows that people taking newer
drugs pay more, but experience even larger nondrug cost savings, and fewer lost work-days than
people using older drugs. His results indicate that newer drugs reduce overall medical costs and
improve health. Lichtenberg (2002) updates the original study by incorporating new
observations from 1997 and 1998 MEPS dataset and by analyzing the sample for the entire
population and for just the Medicare population. The new results support his previous findings
with higher effects of drug age on medical expenditures, showing that newer drugs decrease
nondrug expenditures by about seven times more than the increase in drug expenditures.
This dissertation follows the style of Journal of Health Economics.

2
Lichtenberg (2002) also found that the mean age of drugs used by Medicare enrollees with
private prescription insurance is about 9 percent lower than the mean age of drugs used by
Medicare enrollees without either private or public prescription insurance.
Duggan (2005) has criticized the argument that the “replacement of older drugs by newer
drugs may lower health care spending by reducing the demand for hospitalizations and other
health care services”. Duggan investigates antipsychotic drugs and shows that newer
antipsychotic drugs increase prescription drug expenditures by 610 percent, but do not reduce
spending on other types of medical care services.
These results call into question certain of Lichtenberg’s conclusions. Lichtenberg’s study
was subject to a number of data and computational limitations. First, to obtain precise estimates
of effect of drug age on outcomes and spending for specific conditions, larger samples are
required. Second, he analyzed only one indicator of drug quality: years since FDA approval.
Other indicators, such as FDA evaluation of therapeutic potential were not investigated. Third,
the most important, Lichtenberg assumes that all newer drugs of a similar age represent
comparable improvements compared to older drugs of a similar age. That is, drug improvement
is linear in time and the rate of improvement is the same across all classes. This assumption is
strong and potentially could lead to biased estimation of the impact of drug age on drug and
nondrug expenditures.
This dissertation addresses these issues by using an improved set of methodologies.
First, we have increased the sample size by incorporating additional panels from 1999, 2000 and
2001 from Medical Expenditure Panel Surveys. Second, we added the FDA evaluation of
therapeutic potential as quality measurement of the drugs. Third, the most important one is the
methodological change regarding the identification of drug innovation. The available evidence

3
indicates that drug innovation often consists of significant breakthroughs where varied firms
introduce similar new therapies that replace numerous pre-existing therapies. These new drugs
are often comparable to each other even though they are introduced years apart. Further, these
waves do not hit all classes. A wave of major innovation in one class may occur during a period
when innovation is relatively static in another.
Our approach to measure innovation builds on these facts by examining the cost savings
associated with major groups of new drugs. More specifically, between the late 1970s and early
to mid-1990s, there were several widely noted breakthroughs in pharmaceutical research that led
to new substantial classes of drugs. These breakthroughs included the Selective Serotonin
Reuptake Inhibitors, Statins, Ace Inhibitors, H2 Antagonists, Proton Pump Inhibitors Calcium
Channel Blockers, and Fluoroquinolones. These classes of drugs are important because each
class represents a novel approach to therapy or a unique mode of action. Further, if newer drugs
have a significant impact on medical expenditures, as suggested by Lichtenberg and challenged
by Duggan (2005), then the effects ought to show up strongly for these important new classes of
drugs.
The impact of the quality and the age of the drugs may differ across therapeutic
conditions. For instance, drugs prescribed for infectious diseases may totally have different
impacts on health care expenditures than the drugs prescribed for mental disorders. The former
one is usually prescribed for the treatment of very short-term infections and patients usually end
up purchasing one or two prescriptions. However, drugs prescribed for mental disorders are
mostly prescribed for longer terms. We analyzed the impacts of the quality and the age of the
drugs on each therapeutic class separately based on their clinical modification of the 9th edition
of International Classes of Diseases prepared by United States and adopted in 1979 (ICD-9-CM).

4
ICD-9-CM categorizes diseases and injuries broadly into 18 categories. Availability of the data
from Medical Expenditure Panel Survey (MEPS) allowed us to create unique data sets for only
nine of them, namely; neoplasm, mental disorders, diseases of the nervous system and sense
organs, diseases of the circulatory system, diseases of the respiratory system, diseases of the
digestive system, diseases of the genitourinary system, diseases of the skin and subcutaneous
tissue, and diseases of the musculoskeletal system and connective tissue.
The policy implications of this dissertation are especially crucial for Medicare and
Medicaid enrollees. They have experienced firm restrictions from policymakers to have access to
newer drugs due to the high cost associated with usage of new drugs. Medicaid drug access
restriction programs have increased the age of prescribed drugs for Medicaid patients versus
non-Medicaid patients. Since, previous researches have suggested that using newer drugs
decrease the overall spending on health care use and morbidity and mortality rates, this
restriction can make Medicaid beneficiaries worse off.
The remaining of the dissertation is as follows: Chapter II reviews the literature review.
Chapter III presents the study regarding the impacts of breakthrough drug classes on health care
expenditures. Chapter IV presents the FDA Drug Evaluations and health care expenditures and
Chapter V conclude the remarks.

5
CHAPTER II
LITERATURE REVIEW
This dissertation explores the main waves of pharmacoeconomics and health economics.
This dissertation is connected to the existing literature in three broad categories. The first
category regards to the impact of newer drugs on overall health care expenditures. The second
category relates our work to the access of Medicaid and Medicare enrollees to newer, expensive
drugs. The last category of this dissertation in existing literature is related to the analysis of FDA
drug approval and therapeutic classification.
II.1. Literature on Cost and Benefit of Newer Drugs
Spending on prescription drugs in the United States from 1996 to 2001 grew at a 15%
annual rate, accounting for more than 10% of all health care expenditures. This growth was
mainly driven by an increase in the average price of a prescription, which rose by more than 10%
per year from 1996 to 2001 (Berndt, 2000). Price increases were caused both by an increase in
the price of existing drugs and by a shift to newly approved drugs, which tend to be more
expensive than the drugs that preceded them in the same therapeutic category.
Determining how optimally to respond to the growth in prescription drug spending is a
highly sophisticated problem. It will be very hard to capture the effects of severity of conditions,
the interaction among the conditions, the prescription behavior of doctors and the behavior of
insurance providers in regards to payments simultaneously. It will be very hard to remove the
adverse selection and moral hazard impacts while determining the optimal response of patients
and/or institutions to the growth in prescription drug expenditures.

6
Recent researchers have noted, the difference between two drug prices may not
accurately reflect the difference in health care spending that would result if a patient were to
choose one treatment over another (Lichtenberg 1996, 2001a, 2001b and 2002). A more
expensive drug may deliver health benefits that reduce the patient’s demand for other health care
services, to some extent offsetting its higher price. A similar offset effect could occur for
individuals who otherwise would take no treatment. Even with no offset effect, a more expensive
treatment may deliver health or quality of life benefits that are sufficiently large to pass a cost–
benefit test. In measuring the value of any drug treatment, one would like to know its effect on
both spending and health, with these effects potentially varying across individuals. The results of
Lichtenberg (1996) show that the number of hospital bed-days decreased most rapidly for those
diagnoses with the greatest increase in the total number of drugs prescribed and the biggest
change in the distribution of the drugs.
Lichtenberg (2001a and 2001b) investigates the new drugs and measures the effect of
new drug treatment on both spending and health utilization indicator, with these effects
potentially varying across individuals. In his paper, he has analyzed prescribed medicine event-
level data from the 1996 Medical Expenditure Panel Survey (MEPS), which provide evidence
about the effect of drug age on mortality, morbidity and total medical expenditures. His results
indicate that people consuming new drugs had significantly fewer hospital stays than people
consuming the old drugs. The increase in expenditures because of using new drugs is around $18
per prescription while the reduction in total nondrug expenditures, $70 per prescription, is much
larger than increase in new drug prices. The empirical results of this study indicate that people
taking newer drugs are likely to have significantly lower medical expenditures and fewer work-
loss days than people who are consuming the old drugs.
7
Lichtenberg (2002) has updated the previous study by incorporating the extra
observations from 1997 and 1998 MEPS and by analyzing the sample for the entire population
and for Medicare population. He used the medical condition as unit of analysis rather than a
prescription in this updated version of the paper. The new results are stronger than the existing
ones. Additionally, the results in this paper show that Medicare enrollees with private
prescription insurance use newer drugs more than Medicare enrollees without either private or
public prescription insurance. The age of the drugs in the former group is 8.6% lower than in the
latter group. A reduction in the age of drugs decreases nondrug expenditures around seven times
higher than increase in drug expenditures. Two-third of the decrease in total nondrug
expenditures comes from hospital costs.
The introduction of new drugs has increased society's ability to produce goods and
services by increasing the number of hours worked per member of the working-age population.
Lichtenberg (2005) shows that under very conservative assumptions, the value of the increase in
ability to work attributable to new drugs is 2.5 times as great as expenditure on new drugs. This
suggests that the potential of drugs to increase employee productivity should be considered in the
design of drug-reimbursement policies. Conversely, policies that broadly reduce the development
and utilization of new drugs may ultimately reduce our ability to produce other goods and
services.
Advances in medical care have led to sustained increases in medical spending over time.
An evaluation of whether increased medical spending is useful requires the valuation of the
increase in care. The enormous growth in spending has led many to argue that the increasing
costs are excessive. Others, however, suggest that spending more may provide good value,
whether measured in costs per year of life gained or in overall measures of economic benefit.

8
The vast literature on the cost-effectiveness of specific medical treatments and other
interventions suggests that many medical treatments provide reasonable value. However, there
has been comparatively little effort to understand the value of the medical system as a whole: Is
the increase in spending by more than a factor of eight worth it? Cutler et al. (2006) addressed
this question by examining how medical spending has translated into medical gain in survivals.
They analyzed the value of medical spending in the United States from 1960 to 2000. They
compared the adjusted increases in life expectancy with the lifetime cost of medical care in the
same years. Their results show that the life expectancy for newborns increased by 6.97 years
from 1960 through 2000. They pointed out that, on average, the increases in medical spending
since 1960 have provided reasonable value. However, the spending increases in medical care for
the elderly since 1980 are associated with a high cost per year of life gained. They concluded that
the national focus on the rise in medical spending should be balanced by attention to the health
benefits of this increased spending.
The potential role of new drugs in reducing expenditures for nondrug health services has
also received considerable attention in recent policy debates. Miller, Moeller and Stafford (2005)
studied the patterns of use and association with nondrug health expenditures for new
cardiovascular drugs. They estimate expenditure models to determine whether the use of newer
drugs to treat cardiovascular conditions is of associated with lower (or higher) nondrug
expenditures for these conditions. They fail to confirm the findings of previous research that
newer drugs are associated with reductions in nondrug expenditures. They find, however, that
increases in the number of drugs used, or the mix of drugs of different ages, are associated with
increased nondrug expenditures and find that the number or mix of drugs used are important
confounders in the estimated association between drug age and nondrug expenditures.

9
Duggan (2005) has criticized the argument that the “replacement of older drugs by
newer drugs may lower health care spending by reducing the demand for hospitalizations and
other health care services”. Duggan investigates antipsychotic drugs and shows that newer
antipsychotic drugs increase prescription drug expenditures by 610 percent, but do not reduce
spending on other types of medical care services. The results presented in this paper generalize to
other categories of prescription drugs or to individuals with other types of health insurance is of
course not obvious. The paper points out that the incentives for Medicaid recipients are not much
different from those that exist in many private insurance plans, which often have small co-pay
that may differ slightly between brand and generic drugs. Besides, antipsychotics are very
different from the typical drug category given that Medicaid accounts for the vast majority of
spending on the drugs. The author concludes that Medicaid’s experience with antipsychotics
during the last decade may shed some light on what can occur when the government becomes the
dominant purchaser for one category of prescription drugs.
II.2. Literature on Prescription Drug Cost Sharing
Prescription drug expenditures are one of the fastest growing components of national
health expenditures. To control prescription drug costs, health plans and employers have
increased prescription drug cost-sharing amounts for patients. Gibson, Ozminkowski and Goetzel
(2005) analyzed the effects of prescription drug cost sharing. They analyzed patients respond to
increased cost sharing by substituting less expensive alternatives for medications with higher
levels of co-payments or coinsurance, and examined the body of evidence on the relationships
between cost sharing and use of essential or maintenance medications, health outcomes, process-
of-cue measures (such as medication adherence and discontinuation), and costs. They used
healthcare reference databases and key journals to identify peer-reviewed empirical studies that

10
examined the effects of variation in the amount of prescription drug co-payments or coinsurance
on healthcare utilization patterns. Their results show that higher levels of prescription drug cost
sharing generally produce intended effects, namely, decreasing the consumption of prescription
drugs and steering patients away from nonpreferred to preferred brand-name drugs. However,
patients do not always switch to generic drugs. Although not consistently reported, the most
troublesome effects associated with higher levels of cost sharing are treatment disruptions (such
as lower levels of treatment adherence, continuation, and initiation) for chronically ill patients.
At times, higher levels of cost sharing can affect the use of essential, medications and outcomes
of care. They conclude that cost sharing reduces the consumption of prescription drugs but may
have unintended effects on the process and outcomes of therapy.
Many managed care organization use some managerial mechanism to increase drug
utilization and decrease its associated cost. Some efforts have focused on monitoring clinical
conditions, drug use, and compliance, whereas other efforts have focused on consumer cost
sharing and changing product-mix. Efforts focusing on improving quality of care by identifying
untreated patients or by enhancing compliance can lead to appropriately increased drug costs,
although perhaps with reduced overall medical expenditures (Fendrick et al., 2001). In contrast,
the mechanisms implemented to constrain drug costs have raised concerns regarding missed
opportunities to enhance clinical outcomes, and the possibility of higher medical expenditures.
To balance the demands for access to pharmaceuticals with pressures to constrain costs, levels of
cost sharing could be set in a manner that achieves appropriate clinical and financial outcomes.
Modern multitier systems often base patient contributions on drug acquisition cost, and often do
not consider medical necessity as a coverage criterion. Fendrick et al. (2001) have also used the
benefit-based copay approach and determined that patient contributions are based on the

11
potential for clinical benefit, taking into consideration the patient's clinical condition. For any
given drug, patients with a high potential benefit would have lower copays than patients with a
low potential benefit. Implementation of such a system would provide a financial incentive for
individuals to prioritize their out-of-pocket drug expenditures based on the value of their
medications, not their price.
Trends in drug spending over time closely paralleled the growth in drug coverage.
Danzon and Pauly (2001) examines the contribution of insurance coverage to the recent growth
in spending on pharmaceuticals. The authors find that most of the coverage growth reflects an
increase in the number of people with coverage, 65 percent from 1987 to 1996, rather than
increased depth of coverage. The direct moral hazard effect of this insurance growth accounts for
between one-fourth and one-half of the increase in drug spending. The authors also point out that
technological improvements contributed to these changes, because both the flow of new drugs
increased the demand for insurance and information technologies enabled the development of
pharmacy benefit management, which reduced the real price of drug coverage.
II.3. Literature on Access to Newer Therapies
The economic and human impact of new drugs is an important issue for both public and
private policymakers. The benefits of new drugs to society exceed their cost by a substantial
margin. These benefits include net decrease in overall medical expenditures, reduced limitations
on work and other activities contributing to quality of life, and increased longevity. Further, new
drugs contribute to health and economic growth in the United States. Formularies, to the extent
that they restrict drug choices, restrict access to new drugs (Lichtenberg, 2003).
Majority of Medicaid and Medicare enrollees experience some restrictions on their
prescription medication use because of associated higher costs. Heisler et al. (2004) analyzed

12
data from two prospective cohort studies of adults who reported regularly taking prescription
medications using two waves of the Health and Retirement Study, a national survey of adults
aged 51 to 61 in 1992, and the Asset and Health Dynamics Among the Oldest Old Study, a
national survey of adults aged 70 or older in 1993. They assessed the independent effect on
health outcomes over two to three years of follow up of reporting in 1995-1996 having taken less
medicine than prescribed because of cost during the prior two years. After adjusting for
differences in socio demographic characteristics, health status, alcohol consumption, smoking,
body mass index (BMI), and comorbid chronic conditions, they determined the risk of a
significant decline in overall health among respondents in good to excellent health at baseline
and of developing new disease-related adverse outcomes among respondents with cardiovascular
disease, diabetes, arthritis, and depression. Their results show that 32.1% of those who had
restricted medications because of cost reported a significant decline in their health status
compared with 21.2% of those who had not. An important outcome of this study shows that cost-
related medication restriction among middle-aged and elderly Americans is associated with an
increased risk of a subsequent decline in their self-reported health status, and among those with
preexisting cardiovascular disease with higher rates of angina and nonfatal heart attacks or
strokes.
Increase in pharmacy costs and demand for prescription drug coverage for broader
populations of seniors have resulted in the implementation of generic-only pharmacy benefits in
Medicare health maintenance organizations (HMOs). Christian-Herman, Emons and George
(2004) studied the effects of generic-only drug coverage in a Medicare HMO. The impact on cost
and quality of care is unknown. They examined data for members of a California Medicare HMO
whose coverage changed to a generic-only benefit and found that the change was associated with

13
reduced health plan pharmacy cost, increased out-of-pocket pharmacy costs for members,
increased overall hospital admissions, changed drug-use patterns, and a negative impact on
quality metrics for certain conditions. Banthin and Miller (2006) analyzed recent trends in
Medicaid prescription drug expenditures by therapeutic classes and subclasses. They identified
the fastest growing categories of drugs, where drugs are grouped into clinically relevant classes
and subclasses. They used data from the Medical Expenditure Panel Survey linked to a
prescription drug therapeutic classification system, to examine trends between 1996/1997 and
2001/2002 in utilization and expenditures for the noninstitutionalized Medicaid population. They
found rapid growth in expenditures for antidepressants, antipsychotics, antihyperlipidemics,
antidiabetic agents, antihistamines, COX-2 inhibitors, and proton pump inhibitors. Their results
point that Medicaid programs may want to reassess their cost-containment policies in light of the
rapid take-up of new drugs.
Murawski and Abdelgawad (2005) explore of the impact of preferred drug lists on
hospital and physician visits and the costs to Medicaid. They conduct an exploratory
investigation of the possible effects of the implementation of a state Medicaid preferred drug list
on the average number of visits by Medicaid patients to hospitals and physicians, and to provide
preliminary estimates of the Medicaid reimbursement costs of these additional visits. They
design a regression-based, difference-in-differences retrospective analysis using anonymized
patient-level data on cardiovascular-related inpatient and outpatient hospital visits and
procedures, and physician visits and procedures. The empirical results indicate that there is a
statistically significant increase in the number of outpatient hospital visits and physician visits
for the test group compared with the control group in the first 6 months after preferred drug list
implementation. The results also show that there is a positive but statistically insignificant

14
increase in the number of inpatient hospital visits. All increases in visits for the test group
compared with the control group in the second 6 months after preferred drug list implementation
were positive but statistically insignificant. As a result, estimated average Medicaid
reimbursement costs for cardiovascular patients in the state increased during that year. The
authors state that the observed range of increases in hospital and physician visits is evidence for
the possible existence of an unintended consequence of preferred drug list implementation by
state Medicaid programs.
Recently, some policymakers questioned the Medicare policy in regard to prescription
drug coverage. In late 2003, US Congress passed the new law and approved Medicare
Prescription Drug Improvement and Modernization Act (MMA), which provides universally
available prescription drug benefits to elderly and disabled Medicare beneficiaries for the first
time. Frencher and Glied (2006) discusses the form of the prescription drug benefit package, the
use of competing private plans and the uncertainty about the future cost of the new prescription
drug benefit. The paper then evaluates the implications for academic medicine of the prescription
drug benefit and other MMA legislative provisions aimed at improving the quality of medical
practice and shifting away from acute care. The authors find that the health of seniors and the
efficient use of public funds in the new prescription drug benefit depend centrally on the
prescribing practices of physicians. Academic medicine should turn its attention to training the
next generation of physicians to be more effective agents and advocates for their patients in their
use of pharmaceuticals.
Pauly (2004) studied Medicare drug coverage and moral hazard. This paper explores the
effect of more extensive drug coverage in Medicare on the use of and spending for prescription
drugs and considers whether any additional use is likely to represent satisfaction of previously

15
unmet needs or whether it represents yet more overuse. Reasonable estimates of the effect on
spending strongly suggest that the spending increase will be small and that some of it will go to
beneficiaries who do not face high financial barriers at present. Thus, from the viewpoint of
improvements in health, national spending on drugs, or pharmaceutical firm revenues, effects is
small. The effects of such programs on Medicare's fiscal future are much more important.
The access to new treatments and health care may differ across different demographic
groups. Few studies address racial and ethnic disparities in essential new drug use and whether
disparities decrease through time. Wang et al. (2006) studied the disparities in access to essential
new prescription drugs between Hispanic whites, non-hispanic whites and non-Hispanic blacks.
The paper examined racial and ethnic disparities separately by comparing respectively non-
Hispanic whites to non-Hispanic blacks and Hispanic whites using the Medical Expenditure
Panel Survey (1996-2001). New drugs were defined as approved within the past 5 years, and an
expert panel identified essential drugs. They stated that disparities exist in new, essential drug
acquisition between non-Hispanic whites and non-Hispanic blacks and they contribute this
outcome to socioeconomic and health characteristics of the population.
Headen and Masia (2005) also studied the Medicaid restrictions to the novel drugs by
quantifying its affects on physician location and health disparities. Their results suggest that non-
white residents are more likely to be affected than the white residents living in a zip code where
Medicaid prescribing rules affect the drug choice of physicians.
The patterns of pharmaceutical consumption may also differ across groups based on
their characteristics such as age, sex, socioeconomic status, and region of residence. Metge et al.
(1999) made a population-based analysis to explore the pattern of the population’s use of
pharmaceuticals. The study also includes an examination of whether pharmaceutical use is

16
responsive to differential health needs across the population. The results show that there is a
greater number of prescriptions are dispensed in areas where health is generally poorer. The
highest use of pharmaceuticals also was found in the lower-income quintiles and among those at
greatest socioeconomic risk, traditionally those with the poorest health status.
II.4. Literature on FDA Therapeutic Classification and Quality Measurement
The dual roles of pharmaceutical industry as a manufacturer of health inputs and
producer of health services has led to extreme scrutiny by patients and by both legislative and
executive branches of federal government (Comanor and Schweitzer 1994). Moreover, the
demand for pharmaceutical products is both patient-driven and generated from the decision of
others, such as physicians and insurers. This makes it clear that pharmaceutical industry is
unique in many ways and the peculiar nature of industry creates particular dilemma in public
policy.
The United States has a widely respected but stringent review process overseen by
Federal Drug Administration (FDA). The FDA sets out guidelines for basic research and animal
testing that must be met before human tests begin. Once humans’ tests are allowed, they take
place in progressively larger phases to observe dangerous side effects before the product has
been distributed to the market. Once FDA approved the new drugs, they label them based on
their quality and therapeutic advances. In late 1975 the Federal Drug Administration (FDA)
formed a 3-tier rating system for prioritizing review of New Drug Applications (NDA). If the
drug provided a significant gain over existing therapy, FDA classified that drug with an A rating,
if the drug brought a modest gain then that drug was given a B rating and if drug provided little
or no gain over existing therapy, then it was given C rating. In 1992 the FDA switched its rating
system into two categories: P (priority) and S (standard). A priority drug would provide a

17
significant improvement compared to marketed products in the treatment, diagnosis, or
prevention of a disease.
The quality of the drugs is important and has significant impacts on morbidity and
mortality. People using newer, or later vintage drugs will be in better health, and will therefore
be less likely to be admitted to hospitals and nursing homes, by examining the effect of
pharmaceutical innovation on the utilization of hospital and long-term care by elderly Americans
during 1997-2003 (Lichtenberg, 2006). That implies that the states that have larger increases in
drug vintage will have smaller increases in the number of hospital discharges per elderly
individual.
Majority of the new drugs have therapeutic advances over the existing drugs.
Pharmaceutical firms set prices for new drugs that provide important therapeutic advances
couple of times higher than the existing drugs that are used for the similar therapeutic conditions.
If the new drugs provide little improvements or replicate the existing drugs, then they are priced
relatively at the range of existing drugs prescribed for the similar therapeutic conditions. In
addition, the number of branded drugs has negative impact on launch prices of new drugs that
suggest the pressure of competition in that therapeutic field. The empirical findings suggest that
both the introductory price and subsequent price increases are lower when there are more
branded substitutes in the market (Lu and Comaner, 1998). The pricing regime for new drugs
may also depend upon whether the drug is generic or branded. Wiggins and Manes (2004)
focused on one segment of the pharmaceutical industry, anti-infective, and they discovered a
significant drop in the prices of branded drugs following the entry of generic drugs.
The Food and Drug Administration has accelerated the approval of therapeutically novel
drugs so that patients have faster access to innovative drug therapies. Little research, however,

18
has examined the variation in risks among therapeutically novel and less novel drugs. Olson
(2004) examined the variation in risks among therapeutically novel and less novel drugs. This
paper uses post-marketing drug safety surveillance data from the FDA to examine the adverse
drug reactions associated with novel and less novel drugs. She examined the impact of a drug's
FDA novelty rating on its number of adverse drug reactions controlling for differences in drug
utilization, the conditions being treated, disease characteristics, patient characteristics, drug
review times, and year-specific effects. The results show that drugs deemed novel by the FDA
are associated with a greater number of serious drug reactions, including those that result in
hospitalization and death, than less novel drugs. These results suggest that novel drugs pose
greater risk of serious adverse drug reactions for patients relative to less novel drugs.
The approval of new drugs by FDA involves a balancing of two conflicting objectives:
assuring the population access to the latest therapeutic agents available while protecting patients
from the risk of dangerous products (Schweitzer, 1997). 1962 regulation by FDA has decreased
the number of new chemical entities (NCE) and increase the real level of R&D expenditures.
Unlike 1938 amendments, which was basically asking for safety, the new 1962 regulation bring a
lot of burden on pharmaceutical firms. Many small firms either stop or seize their R&D
expenditures, because it is too costly. On the other hand, big firms have enjoyed this new
regulation. Big firms have the motivation to decrease the dissatisfaction of physicians by
increasing safety and effectiveness of the new drugs. Clinical testing, especially for serious
diseases such as heart diseases, will be crucial for the drugs and it will increase its market power
once the clinical tests have been performed successfully. Increasing market size and
technological innovations coupled with physician satisfaction and clinical testing for safety and
efficacy motivate big pharmaceutical firms to perform FDA regulation. Once they have

19
completed the sequence, they will entertain a monopoly power on that drug and the sales of that
new drug will also increase due to its effectiveness and safety. Hence, big firms profit will
increase with a cost of having small number of NCEs and less number of small firms remaining.
Thomas (1990) has focused on productivity effects of FDA regulation and finds out that for
larger US firms, any declines in NCE introduction rate after 1962 were more than offset by
increases in the sales of each NCE. Many small firms have seizes R&D activities hence unlike
big firms they have suffered from FDA regulations.
The FDA is recognized as one of the world’s most important sources of customer
protection information regarding safety and efficacy of new drugs. This highly stringent
regulation strictly increased the cost of developing new drugs (Wiggins, 1987 and DiMasi et al.,
2003). However, the FDA offered pharmaceutical firms to exercise a monopoly power through
patent protection of newer drugs. Caves, Whinston and Hurwitz (1991) investigated the patterns
of competition surrounding patent expiration and subsequent generic entry in pharmaceutical
markets. The paper discusses the structure of the market and deeply analyzes the demand and
supply side influences of the market. Then, decision variables of innovators, which are basically
price and sales-promotion outlays have been examined. A descriptive analysis of their data set
reveals that generics that enter a given drug market do not enter immediately after the patent
expiration date, but rather flow into market over time. One of the main reasons for this delay is
the approval time to enter the market. Another interesting fact gathered from data is the change
in rate of entry in the last three years that coincides with the Waxman-Hatch Act. Data shows
that there is an increase in the number of entrants after patent expiration for first eight years and
then there is a cumulative decline starts. They have found that the innovator's price decline with
the number of generic entrants, but the rate of decline is smaller than generic drug prices.

20
Therefore they have concluded that price is an important decision variable for the innovators.
Besides price, the second important decision variable is the level of sales-promotion outlays.
Though innovators' promotional patterns are complex, however, both anticipated and actual
entrance of generic drugs reduce the amount of promotional activities of branded drugs. They
have also found that the branded drug price reduction is larger, the generic price discount is
smaller and the market share of branded drugs decreases more in hospital than in the pharmacy
segment of the market. This paper also points out the importance of product differentiation in
this market. Branded producer does accumulate loyalty-inducing goodwill during the period of
patent protection, which forces generic producers to have product differentiation. The advantage
of branded drugs over generic drugs is mainly coming from the doctor's habitual use of it, which
have been established through branded producers' informative and persuasive sales promotion
activities. Finally, they have found that there is very little evidence of active attempt by branded
producers to prevent entry of generic drugs into the market.
Safety, efficacy and acceptability of pharmaceuticals usually generate consumption
externality. Strong consumption externalities may lead a specific drug, which is not necessarily
the most safest or efficacious to dominate the market. One way of its diffusion is through word-
of-mouth. As more people use the product, word-of-mouth advertising increases and hence
increases the product sales. Consumption externality may positively affect the share of a specific
brand and hence may have indirect effects on research and development expenditures of
pharmaceutical firms (Berndt, Pindyck and Azoulay, 2003). If the product diffusion rate is
positively related to the number of its users, then it would be rational for the firm to bring that
product into market and taste the advantage of being first-mover. That requires that
pharmaceutical firm put significant budget shares in R&D. However, when the consumption

21
externality occurs at the therapeutic class level, they can create second-mover advantage that is
the later entrants free-ride on the information and awareness generated by the innovator firms
and put more quality, such decreasing the side effects or dosage, into that generic drugs and than
market the product. If the effect of latter is higher than first-mover, then entrant enjoys much
higher profit and market share than the innovators. For example, Zantac came to the market
much later than Tagamet but it has achieved a much higher sales and market shares in a few
years.
Giaccotto, Santerre, and Vernon (2005) also studied the drug prices and research and
development investment behavior in the pharmaceutical industry. This paper argues theoretically
and shows empirically that pharmaceutical research and development spending increases with
real drug prices, after holding constant other determinants of research and development. They
find that a 10 percent increase in the growth of real drug prices is associated with nearly a 6
percent increase in the growth of research and development intensity. Their results also suggest
that a drug price control regime would have resulted in 330 - 365 fewer new drugs, representing
over one-third of all actual new drug launches brought to the global market during 1980 to 2001.

22
CHAPTER III
THE IMPACTS OF BREAK-THROUGH DRUG CLASSES ON TOTAL HEALTH
EXPENDITURES
This chapter contributes to the growing literature regarding the impact of new drugs on
medical costs. Using age as a measure of drug quality, Lichtenberg (2001a, 2001b and 2002)
concludes that newer drugs cost more, but their use reduces nondrug expenditures by more than
the increase in drug costs. Duggan (2005) finds in contrast that newer antipsychotics do not
result in substantial cost savings. Our analysis contributes to this literature by examining six
different groups of breakthrough drugs, Selective Serotonin Reuptake Inhibitors, Statins, Ace
Inhibitors, H2 Antagonists, Proton Pump Inhibitors, Calcium Channel Blockers, and
Fluoroquinolones. All drug classes except Fluoroquinolones provide substantial cost savings on
overall health care expenditures.
III.1. Introduction
The impact of new drugs and drug classes on overall healthcare expenditures is an
important medical and economic question. Pharmaceutical firms spend billions of dollars
developing new therapies, which are often sold at a substantial premium over older therapies.
The use of these newer and more expensive drugs, however, is controversial. Health plans,
Medicare, and Medicaid often restrict the use of newer therapies due to cost considerations.
These policies may reduce pharmaceutical costs, but run the risk of excluding valuable therapies
that can lower overall healthcare spending, reduce morbidity, lost schooling and work, and
hospital stays. Others argue that newer therapies cost more and there are few differences
between their therapeutic effects as compared to older, cheaper therapies.

23
In an important paper, Lichtenberg (2001a) shows that people taking newer drugs pay
more, but experience even larger nondrug cost savings and experience fewer lost work-days than
people using older drugs. His results indicate that newer drugs reduce overall medical costs and
improve health. Lichtenberg (2002) updates the original study by incorporating new
observations from the 1997 and 1998 MEPS datasets and by analyzing the sample for the entire
population and for just the Medicare population. The new results parallel his previous findings,
but the effect of drug age on medical expenditures is found to be even higher, showing that
newer drugs decrease nondrug expenditures by about seven times more than the increase in drug
expenditures. Lichtenberg (2002) also found that the mean age of drugs used by Medicare
enrollees with private prescription insurance is about 9 percent lower than the mean age of drugs
used by Medicare enrollees without either private or public prescription insurance.
Duggan (2005) has criticized the argument that the “replacement of older drugs by newer
drugs may lower health care spending by reducing the demand for hospitalizations and other
health care services.” Duggan investigates antipsychotic drugs and shows that newer
antipsychotic drugs increase prescription drug expenditures by 610 percent but do not reduce
spending on other types of medical care services.
These results call into question certain of Lichtenberg’s conclusions. Most important,
Duggan shows that, at least for antipsychotics, the use of new drugs does not appear to be linked
to reduced health care expenditures. This conclusion raises questions about Lichtenberg’s
methodology. In particular, Lichtenberg assumes that all newer drugs of a similar age represent
comparable improvements compared to older drugs of a similar age. That is, drug improvement
is linear in time and the rate of improvement is the same across all classes. This assumption is
strong and could potentially lead to biased estimation of the cost impact of drug innovation.

24
More generally, the Duggan results raise the question of whether newer drugs generally reduce
nondrug expenditures, as found by Lichtenberg, or whether such reductions occur in only certain
therapeutic classes.
This chapter addresses these issues by using an improved set of methodologies. The
most important methodological change regards the identification of drug innovation. In contrast
to Lichtenberg’s assumption that the pace of innovation is constant across time and therapeutic
classes, the available evidence indicates that drug innovation often consists of significant
breakthroughs. When a breakthrough occurs, varied firms introduce similar new therapies that
replace numerous pre-existing therapies. These new drugs are often comparable to each other
even though they may be introduced years apart. Further, these waves do not hit all classes at the
same time. A wave of major innovation in one class may occur during a period when innovation
is relatively slow in another.
Our approach to measuring innovation builds on these facts by examining the cost
savings associated with major groups of new drugs. More specifically, between the late 1970s
and early to mid-1990s, there were several widely noted breakthroughs in pharmaceutical
research that led to substantial new classes of drugs. These breakthroughs included the Selective
Serotonin Reuptake Inhibitors, Statins, Ace Inhibitors, H2 Antagonists, Proton Pump Inhibitors,
Calcium Channel Blockers, and Fluoroquinolones.1 These classes of drugs are important because
each class represents a novel approach to therapy or a unique mode of action. Further, if newer
drugs have a significant impact on medical expenditures, as suggested by Lichtenberg and
1 Table 1 presents further details about each new drug class.
25
challenged by Duggan (2005), then the effects ought to show up strongly for these important new
classes of drugs.2
These new classes of drugs seemingly focus on new therapeutic methods and provide
better treatment. A couple of examples illustrate this phenomenon. An important milestone for
the pharmaceutical industry was the introduction of Tagamet. It was the first H2 Antagonist and
was specifically designed to control acid secretion. These histamine antagonists are prescribed to
treat active duodenal ulcers, benign gastric ulcers, gastro esophageal reflux disease, and the
prophylaxis of stress induced ulcers. Other important H2 Antagonists include Zantac, Pepcid and
Axid, all of which were introduced during the 1980s. These products offered new modes of
action but cost more than previously existing therapies (see below). Our goal is to measure the
impact of the use of these drugs on drug and nondrug medical expenditures.
There were similar substantial pharmaceutical breatkthroughs in several other areas. For
instance, Selective Serotonin Reuptake Inhibitors (SSRIs) work as antidepressants by blocking
the central nervous system’s uptake of serotonin. SSRIs offer a novel mode of action and are the
treatment of choice for many indications, including depression, panic disorder, obsessive-
compulsive disorder, and post-traumatic stress disorders. Their use is aided by their good side-
effect profile, efficacy, tolerability, safety in overdose, and patient compliance.
Statins similarly provide a novel approach to therapy and mode of action. The statins
treat heart disease by lowering cholesterol. More specifically, they control the production of
cholesterol by inhibiting an enzyme, HMG- CoA reductase. They also reduce cholesterol by
increasing the liver's ability to remove cholesterol from the blood. Statins are especially helpful
2 From now on, we will call drugs belonging to break-through therapeutic classes “important drugs” and drugs belonging to other therapeutic classes as “other drugs.”

26
for patients who have had inadequate response to dietary restrictions of saturated fat and
cholesterol.
The other innovations listed above exhibit similar changes in therapeutic method and
modes of action. These drugs treat conditions in novel ways but improved treatment is
associated with increased pharmaceutical costs. This chapter attempts to determine whether
these drugs impact other medical expenditures, and if so whether there is a net cost saving from
their use.
We depart methodologically from Lichtenberg by examining whether an entire group of
breakthrough drugs reduces costs compared to older, pre-existing therapies. Our analysis of
these drug groupings offers several improvements over prior work. First, we treat all drugs with
a similar pharmacology as the same rather than simply assigning their therapeutic value based on
year of introduction. This measure offers substantial improvement over drug age because we can
separately estimate the cost impact of each group of important drugs compared to previously
existing therapies. Second, our approach recognizes that innovations emerge in waves and that
drugs within a particular group are therapeutically similar to each other.
Third, we separately estimate the effects of each of these groups of drugs on drug and
nondrug expenditures. Licthenberg’s approach implicitly assumes that therapeutic
improvements and cost impacts are linear in time and the same across classes. Duggan’s
analysis raises issues about whether Lichtenberg’s analysis applies to all therapeutic areas. Our
approach relaxes Lichtenberg’s assumption and specifically addresses group-by-group whether
innovative classes of drugs lower nondrug medical expenditures.
Finally, we offer an improved way of measuring cost impact. As discussed below, the
MEPs data is organized by medical event so that data for a particular medical event records the

27
contemporaneous drug and nondrug expenditures associated with that event. Lichtenberg uses
this event level data and effectively analyzes the contemporaneous cost impact of drug use.
While it may be true that usage of a superior drug will reduce contemporaneous medical
expenditures, for many drugs, such as those used for chronic conditions, medical cost savings
will be distributed over time. For example, cholesterol reducing drugs (Statins) would not likely
reduce current expenditures, but instead would lower medical expenditures over time.
These facts raise numerous measurement issues, particularly because some patients (and
their doctors) switch drugs regularly, going back and forth between newer and older drugs. Our
analysis addresses this issue by separating patients into groups based upon the regularity of their
use of particular drugs. We then measure drug and nondrug expenditures for patients over the
entire period of treatment. This method permits us to analyze the cost impact of important new
drugs over time.
The remainder of the chapter is as follows. Section 2 presents the model, and Section 3
presents an overview of the data. Section 4 displays the results, and Section 5 concludes.
III.2. Model
The analysis relies on a variant of Lichtenberg’s (2001a) model where we use a
substantially improved measure of new technologies and tighten the definition of drug use. We
focus attention on the Selective Serotonin Reuptake Inhibitors, Statins, Ace Inhibitors, H2
Antagonists, Proton Pump Inhibitors, Calcium Channel Blockers, and Fluoroquinolones. These
drugs are widely used, have large sales, and are commonly thought to provide substantial
therapeutic benefits.
As noted above the MEPS data is organized so that individual records correspond to
individual medical events. In contrast, the therapeutic benefit of many drugs will be spread over

28
time. Since some patients switch drugs regularly, we assigned patients to groups based upon the
consistency of their use of breakthrough drugs. We grouped patients into three categories. The
baseline category consists of patients who frequently switch back and forth between important
drugs and other drugs over time. The second category consists of patients who regularly used
the important new groups of drugs. This group includes patients who used the important drugs all
the time or patients who switch between important drugs and other drugs only once throughout
their treatment history for a particular ICD-9 code. The third category consists of patients who
never used the breakthrough drug class.
Our analysis measures the differences in drug and nondrug expenditures across these
three patient groups, enabling us to identify the long run cost impact of the use of these groups of
important drugs. We control for the same sets of factors used by Lichtenberg and Duggan,
incorporating for example the duration of the patient’s condition, demographic variables and the
patient’s diagnosis, or ICD-9 codes.3
More formally, our model is a variant of Lichtenberg’s:
Ycij = ΦΧj + ΨΖij + ΠΜi + ξij
where Ycij is the category (c) of either prescription drug expenditures (c=DE) or total non-drug
expenditure (c=NDE) associated with the jth prescription consumed by person i. The Χj variables
measure usage of important drugs. Χ1 takes a value of 1 if the patient regularly used important
drugs, and a value of zero otherwise. Χ2 takes a value of one for patients who never use
important drugs and is zero otherwise. The omitted category consists of patients who switch
multiple times between important drugs and other drugs. Ζij includes dummy variables for
3 The ICD-9 codes are described at Medical Condition Files located at the web site: http://www.meps.ahrq.gov/

29
conditions described as ICD-9-CM 3-digit diagnosis for which person i used prescription j and
also includes condition durations. Μi includes patient i’s income level and demographic
variables for sex, race, insurance status, education, and age. ξij is the disturbance term. Φ, Ψ and
Π are the set of coefficients to be estimated.
III.3. Data
We use the Medical Expenditure Panel Survey (MEPS) data sets from 1996 to 2001.
MEPS is cosponsored by the Agency for Health Care Research and Quality and the National
Center for Health Statistics. MEPS is a nationally representative survey of health care use,
expenditures, sources of payments, insurance coverage, and demographic characteristics for the
U.S. civilian noninstitutionalized population. MEPS consists of three components, including the
Household Component (HC), the Medical Provider Component (MPC), and the Insurance
Component (IC). These surveys jointly generate exceptionally rich datasets that provide national
estimates of the level and distribution of health care use and expenditures.
Our data set consists of the first five panels of MEPS from 1996 to 2001. First, we
created our data set for each panel separately by merging the HC files, MPC files, and IC files.
Then, we calculated the medical expenditures associated with each condition by event type using
the Condition-Event Link File.4 Finally, we used the Medical Care Index (1982-1984=0) to
express all the dollar values in terms of year 2001.5
We sorted the MEPS data by patient and condition. We then sorted each patient’s
records into chronological order so that the drug treatment history for each patient/condition
could be assessed. Individual patient treatment histories vary substantially. For some patients,
physicians frequently change drugs, while for others there are initial changes followed by
4 For further information about the MEPS, see the web site: http://www.meps.ahrq.gov/
5 For the description of Medical Care Index, see the web site: http://www.bls.gov/cpi/cpifact4.htm

30
stability, and for still others there is little change. These differences lead to our three categories
of drug use: one category is the control group, which consists of patients who frequently switch
drugs over time; a second category that consists of patients who exclusively use important drugs
or switch drugs only once; and a third category that consists of patients who never use the
important drugs.
The next step was to identify the set of diagnostic codes where particular groups of
breakthrough drugs were regularly used. This issue is important because the MEPS data include
prescriptions that do not appear to match well with the associated ICD-9 (diagnostic) codes. For
example, Statins will be prescribed “for” ulcers, and H2 Antagonists will be prescribed “for”
depression. The apparent reason is that patients present with multiple indications (diagnoses)
and all codes are not recorded.
This data problem creates issues for cost measurement associated with a medical
condition. In particular, when a drug is “used” for an unrelated condition “other medical
expenses” will be mismeasured, and these medical expenses cannot be compared to the expenses
of conditions for which the drug is normally used. Accordingly, we sought to identify medical
conditions for which groups of breakthrough drugs were regularly used. To address this issue,
we sought to identify ICD-9 codes where the groups of breakthrough drugs were regularly used.
Since the definition of “regularly” is subjective, we carried out our analysis using several
alternatives. More specifically, we used all codes where the breakthrough drugs were prescribed
for at least four percent of all encounters, at least five percent, and at least six percent. These
procedures resulted in three separate data sets for each breakthrough drug group. The exception
consisted of the H2 Antagonists and the Proton Pump Inhibitors. Since these drugs are used to
treat largely overlapping groups of conditions, their data sets were combined.

31
Table 1 displays the molecule name, trade name and FDA approval years for each break-
through drug classes. Table 2 presents a list of the ICD-9 codes where the SSRIs were used at
least four, five, and six percent of the time. The Appendix Table A.3 contains similar lists of
ICD-9 codes for the remaining classes of breakthrough drugs. Analysis of these various
groupings indicates that the central results are not sensitive to the use of the four, five, or six
percent cutoff.
Similar to ICD-9 codes, the beginning year of a patient’s condition (duration) and the
health insurance coverage for each patient are also used. We include four overlapping health
insurance indicators in our analysis because patients at times have more than one type of
coverage. The Medicare variable takes a value of one if the patient has Medicare, and otherwise
is zero. We include similar Medicaid and Private Insurance variables, and Uninsured identifies
patients who do not have insurance.
The MEPS data set also provides detailed demographic characteristics of each patient
including age, sex, race, educational attainment, and income. Age represents patient age at the
end of the interview year. MEPS data also includes self-reported race, broken down into
American Indian, Aleut/Eskimo, Asian, Black, White, and Other Races. MEPS also provides
total patient income.
III.4. Empirical Analysis
The empirical analysis focuses on these different groups of important new drugs,
beginning with the SSRIs. All of the data presented reflect event level outcomes, which mean
average expenditures are per event and the regression coefficients reflect impact per event.

32
Table 1
New Drug Classes
Molecule Name Trade Name App. Year Molecule Name Trade Name App. Year Selective Serotonin Reuptake Inhibitors H2 Receptor Antagonists
Fluoxetine Hydrochloride Prozac 1987 Cimetidine Tagamet 1977 Sertraline Hydrochloride Zoloft 1991 Ranitidine Zantac 1983 Paroxetine Hydrochloride Paxil 1992 Famotidine Pepcid 1986 Fluvoxamine Maleate Luvox 1994 Nizatidine Axid 1988 Citalopram Hydrobromide Celexa 1998 Rabeprazole Sodium Aciphex 1999 Pantoprazole Protonix 2000 Proton Pump Inhibitors
Statins Omeprazole Prilosec 1989 Lansoprazole Prevacid 1995
Lovastatin Mevacor 1989 Rabeprazole Sodium Aciphex 1999 Simvastatin Zocor 1991 Pantoprazole Protonix 2000 Pravastatin Pravachol 1991 Fluvastatin Lescol 1993 Calcium Channel Blockers Atorvastatin Lipitor 1996 Cerivastatin Sodium Baycol 1997 Verapamil Hydrochloride Calan
Isoption Verelan
1981 1981 1981
ACE Inhibitors Nifedipine Adalat
Procardia 1981 1981
Captopril Capoten 1981 Enalapril Maleate Vasotec 1985
Diltiazem Hydrochloride Cardizem Tiamate Dilacor Tiazac
1982 1982 1982 1982
Nicardipine Hydrochloride Cardene 1988 Lisinopril Prinivil Zestril
1987 1987 Nimodipine Nimotop 1988
Benazepril Hydrochloride Lotensin 1991 Isradipine DynaCirc 1990 Fosinopril Sodium Monopril 1991 Bepridil Hydrochloride Vascor 1990 Quinapril Hydrochloride Accupril 1991 Felodipine Plendil 1991 Ramipril Altace 1991 Amlodipine Maleate Norvasc 1992 Moexipril Hydrochloride Univasc 1995 Nisoldipine Sular 1995 Trandolapril Mavik 1996
Fluoroquinolones Norfloxacin Noroxin 1986 Ciprofloxacin Cipro 1987 Ofloxacin Floxin 1990 Enoxacin Penetrex 1991 Lomefloxacin Hydrochloride Maxaquin 1992 Sparfloxacin Zagam 1996 Levofloxacin Levaquin 1996 Gerafloxacin Raxar 1997 Travofloxacin Mesylate Trovan 1997 Gatifloxacin Tequin 1999 Moxifloxacin Avelox 1999 Note: Trade names are used for identification purposes only and do not imply product endorsement. For more detailed information about each drug class, please check the following sources: 1) Drug Facts and Comparisons 2005, by Facts and Comparisons. 2) Goodman and Gilman’s The Pharmacological basis of therapeutic, 10th Edition by McGraw-Hill Companies. 3) Physicians’ Desk Reference 2005, by Medical Economics.

33
Table 2
Selective Serotonin Reuptake Inhibitors6 ICD-9 Codes for 4, 5 and 6 Percent Samples
Description of ICD-9 Codes
ICD-9 Codes
Four Percent
Sample
Five Percent Sample
Six Percent Sample
Viral hepatitis 70 70 70 Malignant neoplasm colon 153 153 153 Schizophrenic disorders 295 295 Affective psychoses 296 296 296 Neurotic disorders 300 300 300 Personality disorders 301 301 301 Alcohol dependence syndrome 303 303 303 Drug dependence 304 304 304 Special symptom nec 307 307 307 Acute reaction to stress 308 308 308 Adjustment reaction 309 309 309 Conduct disturbance nec 312 311 311 Mental retardation nos 319 312 312 Cerebral degeneration 331 Extrapyramidal dis nec 333 Migraine 346 333 333 Cataplexy and narcolepsy 347 Other brain conditions 348 347 347 Atherosclerosis 440 348 Noninflamm dis vagina 623 440 Female genital symptoms 625 623 623 Nutrit/metab/devel symptoms 783 625 625 Oth ill-defined morbidity/mortality 799 Other brain injury 854 799 799 HX of disease nec V12 854 854 Mental/behavioral prob V40 V12 V12 Other psychosocial circumstances V62 V40 V40 Other reason for consult V65 V62 V62
6 For further details regarding ICD-9 codes, see http://www.meps.ahrq.gov, http://icd9cm.chrisendres.com and http://www.cdc.gov/nchs/data/icd9/icdguide.pdf.

34
III.4.1. Selective Serotonin Reuptake Inhibitors (SSRIs)
The SSRIs7 include such well-known drugs as Paxil, Prozac, and Zoloft. As noted in
Table 1, the first SSRI was Fluoxetine, which was introduced in 1987. During the next 15 years,
additional SSRIs were introduced including Sertraline in 1991, Paroxetine in 1992, Fluvoxamine
in 1994, Citalopram in 1998, Rabeprazole in 1999, and Pantoprazole in 2000.
These drugs created substantial changes in the pharmacological treatment of numerous
diseases. SSRIs have been prescribed for a wide range of conditions, including schizophrenic
disorders, neurotic disorders, personality disorders, and depressive disorders. Table 3 presents
summary statistics. These data reveal that SSRIs are prescribed for chronic conditions. The
reported treatment length is at least five years for 36.8 percent of the conditions. Health care
expenditures vary with income, insurance status, sex, race, and age. The data indicate that
patients’ mean age is about 44.5 years and average per capita income is $17,386. SSRIs, when
compared to other drugs used for the same conditions, are typically associated with higher drug
expenditures ($81.40 versus $53.30) but lower non-drug expenditures ($306.20 versus $455.40).
Table 3 also reveals that on average SSRIs account for 20.1 percent of prescriptions in the
categories where they are regularly used.
7 SSRIs are generally prescribed for the treatment of depressive disorders, obsessive compulsive disorders, social anxiety, and panic attack disorders. Depression usually occurs as a result of the lack of stimulation of the recipient neuron at a synapse. To stimulate the recipient cell, SSRIs inhibit the reuptake of serotonin and increase the chance for serotonin to be recognized by the receptors. The increase in serotonin level by the recipient cell is believed to act as a stimulant, counteracting depression and increasing the motivation. (For detailed information about SSRIs see 2005 Lippincott’s Nursing Drug Guide).

35
Table 3
Summary Statistics for Five Percent Sample Various Break-Through Drug Categories
Selective
Serotonin Reuptake Inhibitors Statins
ACE Inhibitors
H2 AntagonistsProton
Inhibitors
Calcium Channel Blockers
Fluoroquinolones
Year of First Introduction 1987 1989 1981 1977 1981 1986 Demographics: Mean Age 44.5 57.6 59.5 45.2 58.6 43.0 Mean Education Years 11.3 11.5 11.1 9.8 11.1 10.5 Mean Income $17,386 $22,883 $20,218 $18,468 $20,752 $18,525 Percentage of Male Patients 32.5 47.8 43.2 41.3 43.2 28.7 Percentage of White Patients 86.9 85.4 77.7 84.2 79.4 87.6 Percentage of Medicare Enrollees 23.9 42.1 44.9 28.1 45.4 25.6
Percentage of Medicaid Enrollees 23.8 14.0 16.3 19.6 15.7 13.9
Percentage of Private Insurance Enrollees 56.0 64.5 58.0 60.2 58.9 65.1
Percentage of Patients with No Insurance Coverage 12.2 7.6 9.2 10.8 8.9 12.1
Average Healthcare Expenditures ($):
Drug Expenditures $81.4 $85.1 $44.5 $95.2 $57.7 $63.2
Important Drugs:
Nondrug Expenditures 306.2 714.6 833.7 696.6 662.5 832.7
Drug Expenditures 53.3 42.4 43.6 41.3 41.6 29.5
Other Drugs:
Nondrug Expenditures 455.4 1,979.4 943.8 1688.1 1236.3 418.9
Percentage of Reported Condition Durations:
Less than 1 year 17.7% 40.7% 19.1% 37.41% 22.5% 57.8% 1 year 12.1 11.0 10.8 20.28 11.0 6.4 2 years 7.2 8.9 7.4 6.71 7.0 9.4 3 years 7.9 6.4 6.6 4.16 6.0 3.4 4 years 4.4 4.7 4.7 5.51 4.4 5.7 5 years 4.6 3.4 4.8 2.62 4.6 5.5 More than 5 years 46.2 24.9 46.6 23.28 44.5 11.8 Percentage of Important Drugs Prescriptions 20.1% 15.4% 8.4% 17.7% 10.1% 10.0%
Number of Patients in Sample 3,098 2,111 7,846 6,773 6,976 2,746

36
Table 4
Selective Serotonin Reuptake Inhibitors Analysis of Impact on Health Care Expenditures
4 percent Sample 5 percent Sample 6 percent Sample
Dependant Variables: Total Drug
Expenditures
Total Non-Drug
Expenditures Total Drug
Expenditures
Total Non-Drug
Expenditures Total Drug
Expenditures
Total Non-Drug
Expenditures Independent Variables: Important Drugs 18.302 -370.987 18.191 -402.159 18.468 -399.022 (1.415)‡ (51.070)‡ (1.459)‡ (55.279)‡ (1.406)‡ (57.478)‡ Other Drugs -15.291 -56.219 -15.080 -82.180 -13.358 -132.975 (1.057)‡ (54.639) (1.149)‡ (63.085) (1.074)‡ (66.870)† Income 0.000 -0.000 0.000 -0.001 0.000 -0.004 (0.000)* (0.001) (0.000)* (0.001) (0.000)‡ (0.001)‡ Male -2.127 45.261 -1.608 39.995 -1.199 40.891 (1.037)† (49.213) (1.115) (55.195) (1.129) (60.839) Private Insurance 9.289 241.241 10.857 320.718 5.200 447.344 (1.626)‡ (67.305)‡ (1.765)‡ (79.803)‡ (1.908)‡ (93.084)‡ Medicare 7.999 -13.422 9.260 32.144 0.048 79.966 (1.632)‡ (51.394) (1.767)‡ (58.288) (1.682) (58.480) Medicaid 9.206 14.940 11.612 66.257 5.003 145.025 (1.736)‡ (53.088) (1.877)‡ (61.027) (1.995)† (73.700)† Uninsured -5.096 94.051 -6.182 51.443 0.526 -109.634 (2.064)† (86.773) (2.244)‡ (97.827) (2.314) (111.148) Eskimo/Aleut -24.230 -956.797 -34.307 -1,116.302 -33.238 -1,113.981 (10.062)† (592.872) (10.135)‡ (657.417)* (10.101)‡ (624.080)* Asian -7.696 -413.666 -20.515 -532.736 -21.094 -486.633 (6.428) (582.748) (6.482)‡ (658.770) (6.219)‡ (621.746) Black -18.888 -279.511 -23.323 -331.141 -18.881 -196.583 (4.720)‡ (608.760) (5.123)‡ (691.931) (4.878)‡ (663.194) White -12.784 -445.391 -18.024 -542.843 -17.629 -441.127 (4.533)‡ (589.610) (4.891)‡ (666.137) (4.615)‡ (632.513) Other Race -42.888 -651.814 (6.089)‡ (595.498) ICD-9 Codes8
70 184.779 261.513 183.733 289.796 183.191 365.659 (23.628)‡ (261.486) (23.511)‡ (263.415) (23.513)‡ (262.952)
153 12.147 2,152.089 9.459 2,216.539 8.233 2,237.423 (8.989) (688.120)‡ (8.839) (686.774)‡ (8.732) (692.387)‡
295 30.979 -133.954 29.412 -152.989 (2.818)‡ (46.618)‡ (2.825)‡ (48.549)‡
296 -3.476 -90.471 -3.816 -95.326 -4.040 -99.093 (1.401)† (51.508)* (1.410)‡ (52.701)* (1.402)‡ (53.416)*
300 -0.819 -221.430 -0.945 -211.921 -0.877 -201.956 (1.249) (33.910)‡ (1.255) (35.033)‡ (1.240) (35.912)‡
8 Appendix-3 provides the definition of each ICD-9 codes.
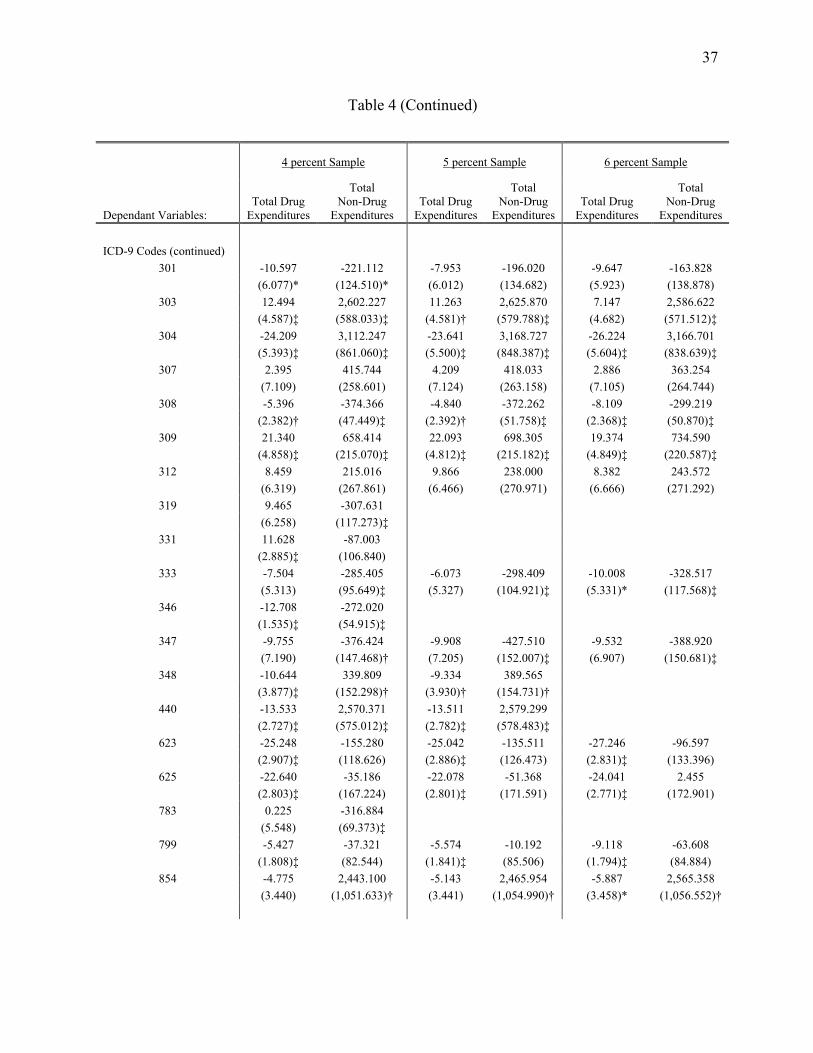
37
Table 4 (Continued)
4 percent Sample 5 percent Sample 6 percent Sample
Dependant Variables: Total Drug
Expenditures
Total Non-Drug
Expenditures Total Drug
Expenditures
Total Non-Drug
Expenditures Total Drug
Expenditures
Total Non-Drug
Expenditures ICD-9 Codes (continued)
301 -10.597 -221.112 -7.953 -196.020 -9.647 -163.828 (6.077)* (124.510)* (6.012) (134.682) (5.923) (138.878)
303 12.494 2,602.227 11.263 2,625.870 7.147 2,586.622 (4.587)‡ (588.033)‡ (4.581)† (579.788)‡ (4.682) (571.512)‡
304 -24.209 3,112.247 -23.641 3,168.727 -26.224 3,166.701 (5.393)‡ (861.060)‡ (5.500)‡ (848.387)‡ (5.604)‡ (838.639)‡
307 2.395 415.744 4.209 418.033 2.886 363.254 (7.109) (258.601) (7.124) (263.158) (7.105) (264.744)
308 -5.396 -374.366 -4.840 -372.262 -8.109 -299.219 (2.382)† (47.449)‡ (2.392)† (51.758)‡ (2.368)‡ (50.870)‡
309 21.340 658.414 22.093 698.305 19.374 734.590 (4.858)‡ (215.070)‡ (4.812)‡ (215.182)‡ (4.849)‡ (220.587)‡
312 8.459 215.016 9.866 238.000 8.382 243.572 (6.319) (267.861) (6.466) (270.971) (6.666) (271.292)
319 9.465 -307.631 (6.258) (117.273)‡
331 11.628 -87.003 (2.885)‡ (106.840)
333 -7.504 -285.405 -6.073 -298.409 -10.008 -328.517 (5.313) (95.649)‡ (5.327) (104.921)‡ (5.331)* (117.568)‡
346 -12.708 -272.020 (1.535)‡ (54.915)‡
347 -9.755 -376.424 -9.908 -427.510 -9.532 -388.920 (7.190) (147.468)† (7.205) (152.007)‡ (6.907) (150.681)‡
348 -10.644 339.809 -9.334 389.565 (3.877)‡ (152.298)† (3.930)† (154.731)†
440 -13.533 2,570.371 -13.511 2,579.299 (2.727)‡ (575.012)‡ (2.782)‡ (578.483)‡
623 -25.248 -155.280 -25.042 -135.511 -27.246 -96.597 (2.907)‡ (118.626) (2.886)‡ (126.473) (2.831)‡ (133.396)
625 -22.640 -35.186 -22.078 -51.368 -24.041 2.455 (2.803)‡ (167.224) (2.801)‡ (171.591) (2.771)‡ (172.901)
783 0.225 -316.884 (5.548) (69.373)‡
799 -5.427 -37.321 -5.574 -10.192 -9.118 -63.608 (1.808)‡ (82.544) (1.841)‡ (85.506) (1.794)‡ (84.884)
854 -4.775 2,443.100 -5.143 2,465.954 -5.887 2,565.358 (3.440) (1,051.633)† (3.441) (1,054.990)† (3.458)* (1,056.552)†

38
Table 4 (Continued)
4 percent Sample 5 percent Sample 6 percent Sample
Dependant Variables: Total Drug
Expenditures
Total Non-Drug
Expenditures Total Drug
Expenditures
Total Non-Drug
Expenditures Total Drug
Expenditures
Total Non-Drug
Expenditures ICD-9 Codes (continued)
V12 -0.162 -229.366 0.379 -305.110 -3.895 -412.469 (4.744) (181.261) (4.779) (193.585) (4.569) (197.951)†
V40 2.370 622.120 2.838 605.554 4.573 637.635 (3.543) (484.535) (3.604) (492.361) (3.405) (496.500)
V62 -23.177 911.312 -22.541 889.230 -24.175 824.103 (3.622)‡ (458.003)† (3.720)‡ (468.354)* (3.666)‡ (470.962)*
V65 6.181 -282.708 6.209 -264.296 3.216 -236.755 (4.443) (59.059)‡ (4.427) (64.377)‡ (4.428) (68.915)‡ Constant 47.147 160.359 40.888 163.158 53.780 287.496 (15.297)‡ (977.019) (16.066)† (861.747) (20.145)‡ (920.635) Observations 28626 28626 24734 24734 22034 22034 R-squared 0.10 0.05 0.11 0.05 0.11 0.05 Absolute value of robust standard errors in parentheses; * significant at 10%; † significant at 5%; ‡ significant at 1% Note: The estimated coefficients of dummy variables for Condition Duration, Age and Education Year are suppressed.
Table 4 presents regression results measuring the impact of SSRIs on drug and nondrug
expenditures. Inspection of the results shows that the control variables are generally significant
and plausible.9 The results show that income is associated with a small but positive effect on
total drug expenditures and has an insignificant negative effect on total non-drug expenditures.
Patients enrolled with insurance have higher total drug expenditures than uninsured patients. The
results also show that, separately controlling for breakthrough drugs, patients enrolled in private
insurance have significantly higher total non-drug expenditures than all other patients, except
those on Medicaid.
The empirical results indicate that SSRIs cost more than other drugs, controlling for
diagnosis, insurance, and demographics, but reduce nondrug expenditure by substantially more.
9 We will present the results for all the samples, but discuss them only for the 5 percent sample.

39
The omitted category of drug use consists of patients who sporadically use breakthrough drugs.
Focusing on the five percent sample, the estimated results from Table 4 show that the patients
regularly using SSRIs incur higher total drug expenditures of $18.19 compared to the patients
sporadically using SSRIs. In contrast, patients who never use SSRIs experience savings in total
drug expenditures of $15.08 compared to those who sporadically use SSRIs and save $33.27
compared to those who regularly use SSRIs.
The results also show that SSRIs significantly decrease total non-drug expenditures.
Estimated results from Table 4 show that patients who regularly use SSRIs experience decreased
total non-drug expenditures of $402.16 compared to patients who sporadically use SSRIs,
controlling therapeutic conditions. These savings are about 20 times the amount of the measured
increase in drug expenditures. Patients who regularly use SSRIs also experience considerable
savings compared to patients who never use SSRIs. 10 Our results indicate that SSRIs result in
large decreases in total health expenditures for the patients who use them.
III.4.2. Statins
In contrast to the widely used SSRIs, Statins11 are normally prescribed for a relatively
narrow range of conditions, including myocardial infarction and other types of heart disease.
Lovastatin (Mevacor) was the first Statin introduced, receiving marketing approval in 1989. As
10 We also used a t-test to determine whether the coefficients for the impact of important drugs on drug and nondrug expenditures are different from the coefficients on other drugs. This test will determine whether there are cost savings for those who regularly use important drugs as compared to those who never use them. The statistics in the drug expenditure equation and nondrug expenditure equation are respectively 24.02 and 5.59 indicating that the coefficients on important drugs and other drugs are significantly different from each other in both equations. 11 Statins are prescribed for the treatment of cholesterol reduction. They control the rate of cholesterol production in the body by inhibiting an enzyme, HMG- CoA reductase. They decrease the cholesterol level by slowing down the production of cholesterol and by increasing the liver's ability to remove the cholesterol from the blood.

40
noted in Table 1, other Statins were introduced over time, including Zocor (1991), Pravachol
(1991), and Lescol (1993). Table 1 contains a complete list.
Statins are designed to reduce cholesterol. They control the rate of cholesterol production in
the body by inhibiting an enzyme, HMG- CoA reductase. They also exert vasculoprotective
actions that include improvement of endothelial function, antioxidant properties, stabilization of
atherosclerotic plaques, regulation of progenitor cells, inhibition of inflammatory responses, and
immunomodulatory actions. Stabilization of atherosclerosis will treat and prevent chest pain,
heart attacks, and strokes.
Table 3 presents summary statistics for the Statins. The data reveals that on average
Statins account for 15.4 percent of prescriptions in the categories where they are regularly used.
They are generally prescribed for conditions associated with higher cholesterol levels, and they
are associated with a moderate treatment period, though this may in part reflect the newness of
these drugs. Twenty-nine percent of patients have a condition treatment period of more than five
years. Ninety-two percent of patients are insured and forty-eight percent of patients are male.
Patients’ mean age is fifty-eight and average per capita income is $22,883. Statins, when
compared at sample means to other drugs used for the same conditions, are typically associated
with higher drug expenditures ($85.10 versus $42.40) but lower non-drug expenditures ($714.60
versus $1,979.40).
Table 5 presents the regression results regarding the impact of Statins on drug and
nondrug medical expenditures. Focusing attention on the five percent sample, the results for the
control variables show that income, insurance status, sex, race, and age all affect health care
expenditures. The estimated coefficients of these control variables are generally significant and
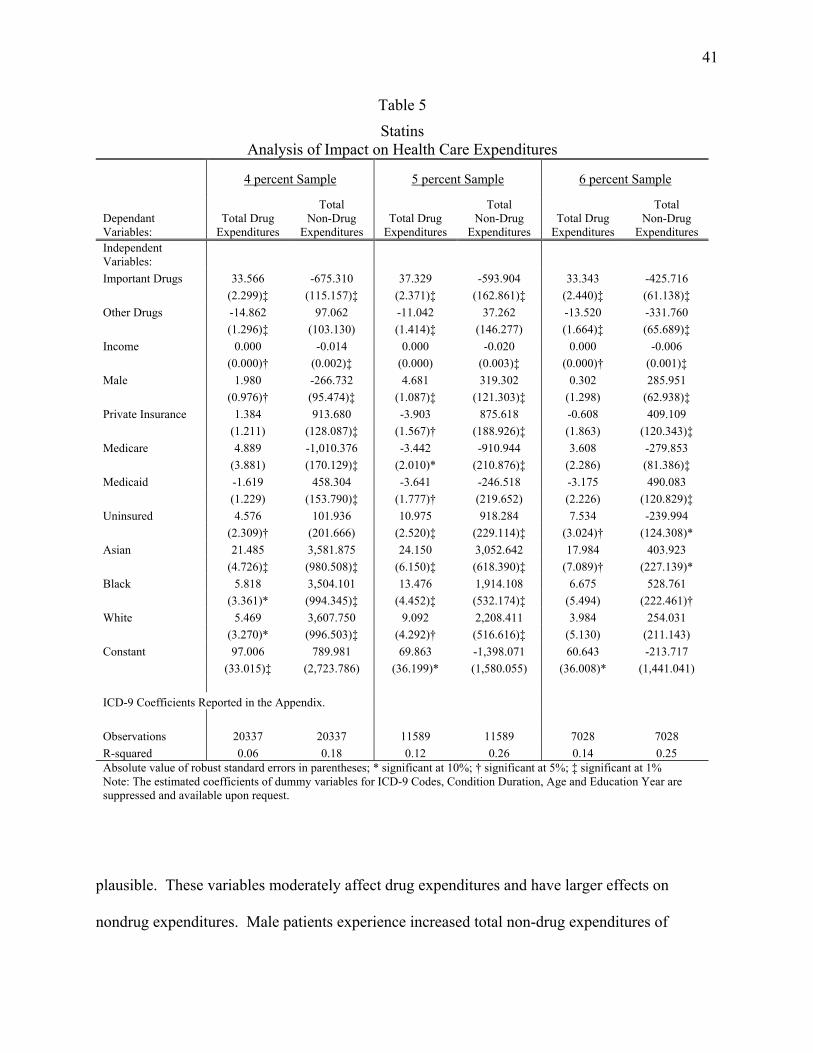
41
Table 5
Statins Analysis of Impact on Health Care Expenditures
4 percent Sample 5 percent Sample 6 percent Sample
Dependant Variables:
Total Drug Expenditures
Total Non-Drug
Expenditures Total Drug
Expenditures
Total Non-Drug
Expenditures Total Drug
Expenditures
Total Non-Drug
Expenditures Independent Variables: Important Drugs 33.566 -675.310 37.329 -593.904 33.343 -425.716 (2.299)‡ (115.157)‡ (2.371)‡ (162.861)‡ (2.440)‡ (61.138)‡ Other Drugs -14.862 97.062 -11.042 37.262 -13.520 -331.760 (1.296)‡ (103.130) (1.414)‡ (146.277) (1.664)‡ (65.689)‡ Income 0.000 -0.014 0.000 -0.020 0.000 -0.006 (0.000)† (0.002)‡ (0.000) (0.003)‡ (0.000)† (0.001)‡ Male 1.980 -266.732 4.681 319.302 0.302 285.951 (0.976)† (95.474)‡ (1.087)‡ (121.303)‡ (1.298) (62.938)‡ Private Insurance 1.384 913.680 -3.903 875.618 -0.608 409.109 (1.211) (128.087)‡ (1.567)† (188.926)‡ (1.863) (120.343)‡ Medicare 4.889 -1,010.376 -3.442 -910.944 3.608 -279.853 (3.881) (170.129)‡ (2.010)* (210.876)‡ (2.286) (81.386)‡ Medicaid -1.619 458.304 -3.641 -246.518 -3.175 490.083 (1.229) (153.790)‡ (1.777)† (219.652) (2.226) (120.829)‡ Uninsured 4.576 101.936 10.975 918.284 7.534 -239.994 (2.309)† (201.666) (2.520)‡ (229.114)‡ (3.024)† (124.308)* Asian 21.485 3,581.875 24.150 3,052.642 17.984 403.923 (4.726)‡ (980.508)‡ (6.150)‡ (618.390)‡ (7.089)† (227.139)* Black 5.818 3,504.101 13.476 1,914.108 6.675 528.761 (3.361)* (994.345)‡ (4.452)‡ (532.174)‡ (5.494) (222.461)† White 5.469 3,607.750 9.092 2,208.411 3.984 254.031 (3.270)* (996.503)‡ (4.292)† (516.616)‡ (5.130) (211.143) Constant 97.006 789.981 69.863 -1,398.071 60.643 -213.717 (33.015)‡ (2,723.786) (36.199)* (1,580.055) (36.008)* (1,441.041) ICD-9 Coefficients Reported in the Appendix. Observations 20337 20337 11589 11589 7028 7028 R-squared 0.06 0.18 0.12 0.26 0.14 0.25 Absolute value of robust standard errors in parentheses; * significant at 10%; † significant at 5%; ‡ significant at 1% Note: The estimated coefficients of dummy variables for ICD-9 Codes, Condition Duration, Age and Education Year are suppressed and available upon request.
plausible. These variables moderately affect drug expenditures and have larger effects on
nondrug expenditures. Male patients experience increased total non-drug expenditures of

42
$319.3. Privately insured patients experience higher non-drug expenditures, while Medicare and
Medicaid enrollees experience lower total non-drug expenditures. Increased income is associated
with reduced nondrug expenditures, perhaps because of greater attention to health care by the
wealthy.
Statins are associated with increased drug expenditures but even larger reductions in
nondrug expenditures. Patients who regularly use Statins experience increased total drug
expenditures of $37.33 over patients sporadically using Statins, and an increase of $48.07 in drug
expenditures compared to patients who did not use Statins. These higher drug expenditures,
however, are more than offset by reduced non-drug expenditures. Patients regularly using Statins
experience reduced non-drug expenditures of $593.90 compared to other patients, noting that
there are insignificant differences in this impact between the other two groups of patients. Hence
Statins generate nondrug savings on the order of twelve times their incremental costs. This large
decrease in nondrug expenditures indicates that Statins provide a novel and effective mode of
action for the treatment of high-level cholesterol diseases and save on other medical costs.12
III.4.3. Ace Inhibitors
ACE Inhibitors were first introduced in 1981 when Capoten (Captopril) was marketed.
This introduction was followed by the marketing of numerous other ACE Inhibitors over the next
15 years, including Vasotec, Prinivil, Zestril, Lotensin, Accupril, and others.
ACE inhibitors are usually prescribed for the treatment of hypertension and congestive
heart failure. These drugs are also used for metabolic diseases and other diseases of the
12 As above, we used a t-test to determine whether the coefficients for the impact of important drugs on drug and nondrug expenditures are different from the coefficients on other drugs. The t-test statistics in the drug expenditure equation and nondrug expenditure equation are respectively 21.23 and 4.61 indicating that the coefficients on important drugs and other drugs are significantly different from each other in both equations. These statistics suggest that there is significant cost savings for those who regularly use important drugs as compared to those who never use them.
43
circulatory system. Following a heart attack, the heart muscle may weaken. ACE Inhibitors help
slow weakening of the heart. They also help prevent future heart attacks by blocking an enzyme
that causes blood vessels to tighten. As a result, blood pressure decreases and the supply of blood
and oxygen to the heart increases.13 Hypertension, myocardial infarction, heart failure, and
diabetes mellitus are the most frequently observed conditions where Ace Inhibitors are used.
They are generally associated with longer treatment periods; forty-seven percent of patients have
treatment periods of more than five years.
Table 3 presents summary statistics. The data reveal that on average Ace Inhibitors
account for 8.4 percent of prescriptions in the categories where they are regularly used. Ace
Inhibitors are generally prescribed for elderly people; the patients’ mean age is fifty-nine and the
average per capita income is about $20,218. Forty-three percent of the patients are male and
ninety percent of patients have health insurance. Ace Inhibitors, when compared to other drugs
used for the same conditions, are associated with slightly lower nondrug expenditures ($833.70
versus $943.80). The drug expenditures for Ace Inhibitors and other drugs are very close to each
other ($44.50 versus $43.60).
Table 6 presents the regression results analyzing the impact of the use of ACE Inhibitors
on drug and nondrug medical expenditures. The results for the control variables show only a
small (if any) impact of income, gender, and insurance coverage on drug expenditures. The race
related variables have a significant impact on both drug and nondrug expenditures, with much
larger effects on nondrug expenditures. Gender and insurance coverage have significant effects,
both statistically and economically, on nondrug medical expenditures in these samples,
controlling for drug use.
13 http://www.nlm.nih.gov/medlineplus/druginfo/uspdi/202044.htm and Table 1 provides further information regarding Ace Inhibitors.

44
Table 6
Ace Inhibitors Analysis of Impact on Health Care Expenditures
4 percent Sample 5 percent Sample 6 percent Sample
Dependant Variables:
Total Drug Expenditures
Total Non-Drug
Expenditures Total Drug
Expenditures
Total Non-Drug
Expenditures Total Drug
Expenditures
Total Non-Drug
Expenditures Independent Variables: Important Drugs -2.281 -507.487 -1.435 -592.599 -1.479 -626.421 (1.023)† (54.630)‡ (1.277) (57.402)‡ (1.277) (59.679)‡ Other Drugs 1.536 -154.202 0.707 -208.558 0.819 -236.283 (0.455)‡ (46.208)‡ (0.464) (49.691)‡ (0.490)* (53.741)‡ Income 0.000 -0.003 0.000 -0.003 0.000 -0.003 (0.000)‡ (0.001)† (0.000)‡ (0.001)† (0.000)‡ (0.001)† Male -0.166 175.895 0.103 207.024 0.252 245.925 (0.414) (55.035)‡ (0.422) (60.200)‡ (0.447) (64.904)‡ Private Insurance 4.317 437.844 3.650 426.267 3.336 403.292 (0.557)‡ (53.291)‡ (0.565)‡ (56.275)‡ (0.600)‡ (61.457)‡ Medicare 3.322 155.355 2.977 109.198 1.893 119.930 (1.176)‡ (71.415)† (1.208)† (75.722) (1.242) (79.018) Medicaid 1.696 265.221 0.717 212.535 -0.118 210.317 (0.658)‡ (54.765)‡ (0.607) (56.627)‡ (0.623) (61.509)‡ Uninsured 2.268 -63.769 2.779 -55.191 3.459 -43.463 (0.936)† (72.097) (0.954)‡ (76.648) (1.001)‡ (82.225) Eskimo/Aleut 27.410 -509.407 31.245 -300.531 32.896 -209.656 (9.575)‡ (187.674)‡ (9.962)‡ (180.711)* (10.001)‡ (266.979) Asian 9.332 645.375 7.934 724.499 10.115 838.000 (1.974)‡ (143.093)‡ (1.956)‡ (154.317)‡ (2.008)‡ (249.454)‡ Black 3.608 639.396 2.805 686.494 4.776 830.818 (1.620)† (115.123)‡ (1.669)* (121.849)‡ (1.714)‡ (234.470)‡ White 6.821 768.987 6.437 827.827 8.750 960.700 (1.567)‡ (112.243)‡ (1.630)‡ (119.982)‡ (1.666)‡ (232.861)‡ Other Race -22.049 150.827 -21.813 97.717 -19.332 157.625 (4.716)‡ (234.783) (4.742)‡ (248.632) (4.809)‡ (336.669) Constant 81.181 10,831.975 85.689 10,971.423 99.334 8,898.153 (19.284)‡ (4,577.772)† (19.722)‡ (4,647.565)† (54.280)* (4,550.750)*
ICD-9 Coefficients Reported in the Appendix.
Observations 84350 84350 77796 77796 71101 71101 R-squared 0.02 0.09 0.02 0.09 0.02 0.09 Absolute value of robust standard errors in parentheses; * significant at 10%; † significant at 5%; ‡ significant at 1% Note: The estimated coefficients of dummy variables for ICD-9 Codes, Condition Duration, Age and Education Year are suppressed and available upon request.

45
The results show that ACE Inhibitors substantially reduce nondrug expenditures but have
little effect on drug expenditures. The coefficients in the drug expenditure equation in Table 6
are small ($1.43) and insignificant. In contrast, patients who regularly use ACE Inhibitors
experience sharply lower nondrug expenditures. These patients who regularly use ACE
Inhibitors save approximately $592.60 per encounter compared to patients who sporadically use
ACE Inhibitors. Regular users of ACE Inhibitors also spend $384.04 less than patients who
never use ACE Inhibitors (where $384.04 = $592.60-208.56). The results indicate that ACE
Inhibitors are drugs that cost little (if any) more than previously existing therapies but produce
large nondrug cost savings. These newer drugs provide an important contribution to medical
cost containment.14
III.4.4. H2 Receptor Antagonists & Proton Pump Inhibitors (H2s and PPIs)
We group together our analysis of the H2 Antagonists and PPIs15. We use this grouping because
the focus of our analysis is to determine the impact of classes of breakthrough drugs on drug and
nondrug expenditures as compared to older therapies. The hypothesis to be investigated in this
section is whether the use of H2 Antagonists and PPIs has affected medical expenditures
compared to older therapies.
H2 Antagonists made their first appearance in 1977 with the introduction of cimetidine
(Tagamet). This introduction was followed by several other H2 Antagonists in the mid-1980s,
14 We also used a t-test to determine whether the coefficients for the impact of important drugs on drug and nondrug expenditures are different from the coefficients on other drugs. The statistics in the drug expenditure equation and nondrug expenditure equation are respectively 1.72 and 7.90 indicating that the coefficients on important drugs and other drugs are significantly different from each other in both equations. 15 Histamine (H2) antagonists are prescribed to treat active duodenal ulcer, benign gastric ulcer, erosive gastro esophageal reflux disease, and prophylaxis of stress induced ulcers. Proton pump inhibitors are usually prescribed for the same treatments offered by H2 antagonists. They work by suppressing the gastric acid secretion through specific inhibition of the hydrogen-potassium ATPase anzyme system at the secretory surface of gastric parietal cells. They are used for short-term treatment of active duodenal ulcer and benign gastric ulcer, severe erosive esophagitis and long-term treatment of pathologic hypersecretory conditions.

46
including ranitidine (Zantac), famotidine (Pepcid), and mizatidine (Axid). The first Proton Pump
Inhibitor, Prilosec, was introduced in 1989. Other PPIs were introduced over the following
decade, including Prevacid, Aciphex, and Protonix.
The H2s and PPIs are prescribed for a broad range of conditions including, for example,
nutritional and metabolic diseases, as well as digestive and genitourinary system diseases. The
most frequently observed conditions are diseases of the esophagus, gastric ulcers, stomach
function disorders, and abdominal hernia.
Summary Statistics are presented in Table 3. These statistics show that H2s and PPIs are
generally prescribed for conditions requiring short or medium treatment periods. Only twenty-
three percent of patients report conditions existing for more than five years, while thirty-seven
percent report conditions lasting less than one year. Eighty-nine percent of patients are insured
and forty-one percent of patients are male. The patients’ average age is forty-five years and per
capita income averages $18,468. H2s and PPIs, when compared at sample means to other drugs
used for the same conditions, are typically associated with higher drug expenditures ($85.20
versus $41.30) but significantly lower nondrug expenditures ($696.60 versus $1688.10).
Table 7 presents the regression results regarding the impact of the H2s and PPIs on drug
and nondrug expenditures. The estimation results show that health care expenditures are
influenced by the control variables, including income, gender, insurance status, race, and
education. These variables have significant effects on nondrug expenditures but modest effects
on drug expenditures. Male patients experience higher nondrug expenditures of $1,215.93.
Patients with private health insurance incur higher total nondrug expenditures compared to other

47
Table 7
H2 Antagonists and Proton Pump Inhibitors Analysis of Impact on Health Care Expenditures
4 percent Sample 5 percent Sample 6 percent Sample
Dependant Variables:
Total Drug Expenditures
Total Non-Drug
Expenditures Total Drug
Expenditures
Total Non-Drug
Expenditures Total Drug
Expenditures
Total Non-Drug
Expenditures Independent Variables: Important Drugs 40.640 -1,284.852 40.099 -1,580.870 38.696 -414.079 (1.745)‡ (123.597)‡ (1.894)‡ (156.447)‡ (1.869)‡ (72.331)‡ Other Drugs -16.699 -817.692 -21.859 -1,149.979 -24.656 123.094 (1.018)‡ (120.395)‡ (1.286)‡ (157.406)‡ (1.244)‡ (78.342) Income -0.000 -0.013 -0.000 -0.008 -0.000 -0.002 (0.000)* (0.002)‡ (0.000)‡ (0.002)‡ (0.000) (0.002) Male 2.735 935.846 2.814 1,215.929 1.672 500.476 (0.819)‡ (90.001)‡ (1.130)† (108.365)‡ (1.133) (66.813)‡ Private Insurance 2.846 592.724 4.067 323.102 2.636 528.169 (1.088)‡ (100.963)‡ (1.473)‡ (122.155)‡ (1.541)* (118.506)‡ Medicare 0.347 -548.015 1.967 -203.995 3.639 30.660 (1.990) (118.023)‡ (3.022) (140.666) (3.095) (109.415) Medicaid 5.510 -124.458 5.623 -80.889 4.412 167.632 (1.303)‡ (101.326) (1.695)‡ (130.810) (1.562)‡ (125.468) Uninsured 1.979 131.018 1.979 -20.917 7.600 -294.655 (1.702) (141.637) (2.305) (202.781) (2.076)‡ (139.154)† Eskimo/Aleut 0.604 1,586.621 9.606 2,171.633 6.696 1,617.314 (5.308) (654.683)† (7.874) (1,281.585)* (7.675) (1,323.499) Asian 4.071 -455.990 10.701 -1,429.762 6.946 -325.968 (3.452) (316.553) (4.410)† (429.190)‡ (4.312) (306.640) Black 2.375 354.935 6.420 -217.027 6.880 195.928 (2.518) (212.639)* (2.941)† (279.325) (3.308)† (300.384) White 5.656 705.013 9.003 375.578 6.365 85.596 (2.342)† (190.673)‡ (2.650)‡ (239.838) (2.964)† (285.134) Other Race -29.655 -568.567 -39.331 -3,044.615 -26.067 577.065 (10.013)‡ (820.180) (12.634)‡ (1,377.925)† (9.876)‡ (503.403) Constant 25.777 29,324.505 5.951 36,581.191 26.474 5,861.404 (7.985)‡ (4,185.424)‡ (22.433) (5,133.497)‡ (26.020) (1,832.678)‡ ICD-9 Coefficients Reported in the Appendix. Observations 29899 29899 19415 19415 15538 15538 R-squared 0.13 0.17 0.15 0.25 0.16 0.24 Absolute value of robust standard errors in parentheses; * significant at 10%; † significant at 5%; ‡ significant at 1% Note: The estimated coefficients of dummy variables for ICD-9 Codes, Condition Duration, Age and Education Year are suppressed and available upon request.

48
groups. Increased income decreases both total drug and nondrug expenditures. Asian and black
patients have lower and white patients have higher total nondrug expenditures when compared to
the American Indian patients.
The results in Table 7 strongly support the proposition that H2s and PPIs are associated
with higher drug costs but substantially lower nondrug medical expenditures. The estimated
results from Table 7 show that patients regularly using H2s or PPIs have greater drug
expenditures of $40.09 but lower total non-drug expenditures of $1,581 compared to patients
sporadically using these products. In contrast, patients who never used H2s or PPIs incur $61.96
in lower average costs than those regularly using these products (where $61.96 = $40.10 –
($21.86)). These patients, however, incur higher nondrug costs of $430.89. These differences
are highly statistically significant. Hence the results indicate that H2 Antagonists and Proton
Pump Inhibitors substantially reduce healthcare costs.16
III.4.5. Calcium Channel-Blockers (CCBs)
The first CCBs17, Verapamil (Calan and Isoption) and Nifedipine (Adalat and Procardia) were
introduced in 1981. During the next 15 years, additional CCBs were introduced including
Diltiazem (Cardizem) in 1982, Nicardipine (Cardene), and Nimodipine (Nimotop) in 1988.
16 To determine the cost savings for those who regularly use important drugs as compared to those who never use them, we test whether the coefficients for the impact of important drugs on drug and nondrug expenditures are different from the coefficients on other drugs. The t-test statistics in the drug expenditure equation and nondrug expenditure equation are respectively 36.25 and 4.39 indicating that the coefficients on important drugs and other drugs are significantly different from each other in both equations. 17 CCBs are antihypertensive and antianginal. They are prescribed for the treatment of angina due to coronary artery spasm, chronic stable angina, hypertension, and arrhythmias. They inhibit the movement of calcium ions across the membranes of cardiac and arterial muscle cell to slowdown the velocity of transmission of cardiac impulse, depression of myocardial contractility, and dilation of coronary arteries. As a result, they relax blood vessels and increase the supply of blood and oxygen to the heart while reducing its workload. (Futher details about CCBs are available at http://www.nlm.nih.gov/medlineplus/druginfo/uspdi/202107.html and Lippincott’s Nursing Drug Guide, 2005).

49
Other CCBs are shown in Table 1. CCBs are antihypertensives and are generally prescribed for
the treatment of hypertension, chronic stable angina, arrhythmias, and heart valve disorders.
The summary statistics in Table 3 show that CCBs are generally prescribed for chronic
conditions with a treatment length of at least five years reported by forty-four percent of patients.
Ninety percent of patients are insured and thirty-two percent are male. Patients’ average age is
forty-three years and per capita income is $20,752. CCBs, when compared at sample means to
other drugs used for the same conditions, are typically associated with higher drug expenditures
($57.70 versus $41.60) but lower nondrug expenditures ($662.50 versus $1236.30).
Table 8 presents the regression results measuring the impact of Calcium Channel
Blockers on drug and nondrug expenditures. The results for the control variables show that the
demographic and insurance variables have some effect on drug expenditures, though these
effects are generally small. The control variables generally impact nondrug medical
expenditures, and most of these effects are large and significant. Insured patients have
significantly higher nondrug expenditures than uninsured patients. Male patients experience
higher nondrug expenditures of $135.72, and various population groups experience substantial
differences in nondrug expenditures.
The empirical results in Table 8 show that CCBs cost somewhat more than other drugs
but lead to significant reductions in nondrug expenditures. Patients regularly using CCBs
experience increased total drug expenditures of $7.92, but decreased total non-drug expenditures
of $223.49 compared to patients sporadically using CCBs. Comparing patients regularly using
CCBs with patients who never use CCBs, the group never using CCBs on average saves $14.32
(=$(7.92-(-$6.40)) in drug expenditures but experience an increase of $70.89

50
Table 8
Calcium Channel Blockers Analysis of Impact on Health Care Expenditures
4 percent Sample 5 percent Sample 6 percent Sample
Dependant Variables:
Total Drug Expenditures
Total Non-Drug
Expenditures Total Drug
Expenditures
Total Non-Drug
Expenditures Total Drug
Expenditures
Total Non-Drug
Expenditures Independent Variables: Important Drugs 8.648 -216.385 7.920 -223.494 8.305 -208.329 (1.093)‡ (72.518)‡ (1.112)‡ (71.687)‡ (1.104)‡ (72.084)‡ Other Drugs -6.265 -102.320 -6.403 -152.597 -5.807 -148.028 (0.527)‡ (55.981)* (0.560)‡ (55.764)‡ (0.529)‡ (56.325)‡ Income 0.000 -0.002 0.000 -0.001 0.000 0.000 (0.000)‡ (0.001) (0.000)† (0.001) (0.000)‡ (0.001) Male 1.125 223.543 1.611 135.722 1.001 141.825 (0.478)† (61.291)‡ (0.514)‡ (66.674)† (0.500)† (68.723)† Private Insurance 3.685 483.047 3.780 472.624 4.181 398.923 (0.644)‡ (69.179)‡ (0.696)‡ (75.980)‡ (0.692)‡ (76.273)‡ Medicare 7.315 190.570 8.482 265.338 7.581 108.566 (1.601)‡ (93.772)† (1.781)‡ (103.680)† (1.715)‡ (102.307) Medicaid 2.237 357.487 2.043 394.039 0.161 308.418 (0.749)‡ (67.261)‡ (0.811)† (72.639)‡ (0.704) (72.963)‡ Uninsured -0.167 -62.885 0.700 -90.948 0.101 -45.111 (1.171) (103.623) (1.167) (111.173) (1.178) (112.450) Eskimo/Aleut 10.948 -4,242.223 12.597 -4,020.026 12.230 -4,248.219 (6.837) (2,573.193)* (7.631)* (2,603.127) (7.697) (2,596.222) Asian 5.332 508.904 6.032 541.090 7.197 604.386 (2.512)† (162.372)‡ (2.820)† (204.674)‡ (2.898)† (214.187)‡ Black 3.796 816.618 5.382 792.308 3.160 677.732 (2.152)* (146.488)‡ (2.509)† (189.577)‡ (2.568) (200.381)‡ White 5.973 971.412 6.976 1,009.730 6.060 927.350 (2.131)‡ (147.666)‡ (2.486)‡ (194.320)‡ (2.568)† (205.193)‡ Other Race -18.232 1,200.091 -5.667 1,551.894 -6.092 1,353.715 (9.890)* (1,041.881) (7.688) (811.965)* (9.017) (841.461) Constant 75.547 8,073.432 85.452 9,913.010 95.472 9,662.076 (18.073)‡ (3,461.455)† (24.165)‡ (4,295.244)† (27.333)‡ (4,406.881)† ICD-9 Coefficients Reported in the Appendix. Observations 63900 63900 57695 57695 55086 55086 R-squared 0.03 0.12 0.03 0.13 0.03 0.13 Absolute value of robust standard errors in parentheses; * significant at 10%; † significant at 5%; ‡ significant at 1% Note: The estimated coefficients of dummy variables for ICD-9 Codes, Condition Duration, Age and Education Year are suppressed and available upon request.

51
(=$(223.49-152.60)) in nondrug expenditures. Both the savings in drug costs and the increase in
nondrug costs are measured at the medical event level and are highly significant.18
III.4.6. Fluoroquinolones
The first Fluoroquinolone, Norfloxacin, was introduced in 1986. During the next decade,
there were many Fluoroquinolones introduced, such as Enoxacin in 1991, Levofloxacin in 1996
and Moxifloxacin in 1999. Table 1 provides the entire list of Fluoroquinolones with year of
introduction.
Fluoroquinolones19 are prescribed for a narrow range of conditions, for example,
infectious and parasitic diseases of the genitourinary system. Cystitis, a bladder infection, and
urinary tract disorders are the two most frequently observed conditions for which
Fluoroquinolones are used, and they comprise more than half of our observations.
The summary statistics in Table 3 show that Fluoroquinolones are generally prescribed
for conditions requiring short treatment length and moderate cost. Fifty-seven percent of the
reported conditions have a treatment period of less than one year. Eighty-eight percent of
patients are insured and twenty-nine percent of the patients are male. Patients’ average age is
forty-three and per capita income is $18,525. Unlike breakthrough drug classes described above,
Fluoroquinolones are associated with both higher drug expenditures ($63.20 versus $29.50) and
higher nondrug expenditures ($832.70 versus $418.90).
18 We also used a t-test to determine whether the coefficients for the impact of important drugs on drug and nondrug expenditures are different from the coefficients on other drugs. The statistics in the drug expenditure equation is highly significant, 13.55 indicating that the coefficients on important drugs and other drugs are significantly different from each other. The statistics in the nondrug expenditure equation is not significant, 1.09. 19 Fluoroquinolones are prescribed for the treatment of infections caused by susceptible gram negative bacteria, like E. coli. They work by killing bacteria or preventing their growth. Further details regarding Fluoroquinolones are available at See http://www.nlm.nih.gov/medlineplus/druginfo/uspdi/202656.html.

52
Table 9
Fluoroquinolones Analysis of Impact on Health Care Expenditures
4 percent Sample 5 percent Sample 6 percent Sample
Dependant Variables: Total Drug
Expenditures
Total Non-Drug
Expenditures Total Drug
Expenditures
Total Non-Drug
Expenditures Total Drug
Expenditures
Total Non-Drug
Expenditures Independent Variables: Important Drugs 30.519 -427.470 31.455 -294.685 31.658 141.713 (2.432)‡ (181.856)† (2.584)‡ (190.719) (2.613)‡ (182.199) Other Drugs -9.953 -539.017 -9.342 -436.255 -11.766 7.138 (1.476)‡ (126.280)‡ (1.631)‡ (132.013)‡ (1.682)‡ (85.983) Income -0.000 -0.003 -0.000 -0.004 -0.000 -0.002 (0.000)† (0.002) (0.000)* (0.001)‡ (0.000) (0.001)* Male 2.775 360.170 3.924 406.386 3.795 371.022 (1.194)† (85.898)‡ (1.411)‡ (98.173)‡ (1.436)‡ (99.681)‡ Private Insurance 1.859 -87.183 3.212 23.643 -1.131 -125.241 (1.681) (90.823) (1.876)* (94.109) (1.710) (101.563) Medicare 9.449 54.299 7.315 -219.994 4.445 -203.882 (2.465)‡ (121.359) (2.610)‡ (119.939)* (2.683)* (122.716)* Medicaid 3.600 -240.935 5.792 -158.528 0.360 -182.731 (1.967)* (94.072)† (2.170)‡ (89.009)* (1.925) (97.901)* Uninsured -3.096 490.554 -3.916 456.987 -0.299 454.147 (1.975) (107.074)‡ (2.193)* (114.219)‡ (2.168) (111.499)‡ Eskimo/Aleut -3.774 71.462 -2.835 -369.146 -4.465 -290.416 (5.506) (247.170) (5.522) (328.606) (5.824) (237.966) Asian 13.201 -79.771 14.489 -313.024 -3.310 528.181 (5.226)† (344.039) (5.570)‡ (382.705) (5.359) (406.173) Black -1.629 339.234 -2.778 -32.177 0.258 182.722 (3.911) (182.530)* (4.105) (163.494) (4.088) (157.907) White 1.754 167.028 0.943 10.928 1.267 -78.845 (3.633) (153.144) (3.797) (146.989) (3.858) (138.472) Constant 44.699 -565.807 70.917 205.912 69.372 362.030 (13.649)‡ (768.047) (18.516)‡ (529.104) (18.711)‡ (447.487) ICD-9 Coefficients Reported in the Appendix. Observations 7337 7337 6317 6317 5053 5053 R-squared 0.19 0.17 0.21 0.17 0.19 0.12 Absolute value of robust standard errors in parentheses; * significant at 10%; † significant at 5%; ‡ significant at 1% Note: The estimated coefficients of dummy variables for ICD-9 Codes, Condition Duration, Age and Education Year are suppressed and available upon request.
The regression results for Fluoroquinolones are presented in Table 9. These results show
that the control variables are generally small in the drug expenditures equation. With the
exception of the race variables, the demographic and insurance variables are generally large and

53
significant in the nondrug expenditures equation. Male patients experience increased total
nondrug expenditures of $406.39. Income has a small, negative impact on total nondrug
expenditures. Uninsured patients face higher total nondrug expenditures of $456.99.
In contrast to the results for the other breakthrough classes of drugs, the results for the
Fluoroquinolones do not support the hypothesis of cost savings for nondrug medical expenditure.
The results show that Fluoroquinolones are more expensive than other drugs - - the coefficients
indicate that patients who regularly use Fluoroquinolones on average pay $31.46 more than
patients who sporadically use them and pay $40.90 more than patients who never use them.
There is some weak evidence that there are cost savings from the use of Fluoroquinolones
compared to some but not all groups. Specifically, the point estimate indicates a cost savings of
$295 for patients regularly using Fluoroquinolones as compared to patients who sporadically use
them. This difference, however, is not statistically significant. Nondrug expenditures, moreover,
are lowest for the group that never uses Fluoroquinolones.
It is important to note the differences between Fluoroquinolones and other drugs under
study. Fluoroquinolones are expensive antibiotics, and it may be that for this category
expensive, leading edge drugs are used for more severe cases, which may also entail other
complementary and expensive treatments. Still, regardless of the reason, the evidence does not
point toward nondrug cost savings for this class of drugs.20
III.5. Conclusion
This chapter investigated impact of new drugs and drug classes on overall healthcare
expenditures. The chapter provides a more flexible approach than the existing literature by
20 We also used a t-test to determine whether the coefficients for the impact of important drugs on drug and nondrug expenditures are different from the coefficients on other drugs. The statistics in the drug expenditure equation is highly significant, 16.41 indicating that the coefficients on important drugs and other drugs are significantly different from each other. The statistics in the nondrug expenditure equation is not significant, 0.71

54
separately estimating the cost impact of important new groups of breakthrough drugs. The
chapter also improves on the previously existing methodology by capturing the long term effects
of using drugs rather than just focusing on contemporaneous medical expenditures associated
with a single medical event.
Our analysis used a variant of Lichtenberg’s (2001a) model where we have substantially
improved the measure of new technologies and tightened the definition of drug use. We measure
improvements in drug technology by determining whether patients regularly used drugs
belonging to selected groups of breakthrough drugs. Our measure captures the fact that
innovations emerge in waves and that drugs within a particular group are more similar
therapeutically to each other than to other existing drugs. We then separately estimate for each
group the impact of the group on drug and nondrug medical expenditures. This method
improves on the previously existing literature because it allows for differences in the pace of
innovation across therapeutic classes, differences in the cost impact, and measures long run
effects. To measure long run effects, we created three groups of patients: those regularly using
the breakthrough drugs, those sporadically using them, and those who never used them. We then
identified conditions for which the drugs were regularly used.
The results confirm that with the exception of ACE Inhibitors breakthrough drugs are
associated with higher drug expenditures. The results also show, however, that these
breakthrough drug groups, with the exception of the Fluoroquinolones, are associated with very
substantial reductions in nondrug expenditures. These reduced nondrug expenditures are
typically many times larger than the increase in drug expenditures. Hence, the use of these
groups of breakthrough drugs substantially reduce overall medical expenditures and have
contributed to medical cost containment.

55
CHAPTER IV
NOVEL DRUGS AND HEALTH CARE EXPENDITURES
Prescription drug expenditures constitute an important account for each individual in the
United States. The quality and effectiveness of drugs take place an important role in total health
care expenditure. There is a conflict among researchers about the benefits and costs of newer and
better drugs. Some researchers argue that newer and better drugs reduce hospital stays and
provide significant cost savings. Another group of researchers argue that newer and better drugs
are more expensive than older therapies and do not provide significant cost savings. In this
chapter, we offered a new methodology by incorporating both the quality and the age of the
drugs to capture their effects on total health care expenditures. We analyzed the impacts of the
quality and the age of the drugs on the following therapeutic classes: Musculoskeletal system and
connective tissue diseases, skin and subcutaneous tissue diseases, neoplasm, mental disorders,
diseases of nervous system and sense organs, circulatory system diseases, respiratory system
diseases, digestive system diseases, genitourinary system diseases.
IV.1. Introduction
The impact of newer and better drugs on overall healthcare expenditures is an important
medical and economic question. Pharmaceutical firms spend billions of dollars developing new
therapies, which are usually sold at a substantial premium over older therapies. Health plan and
Medicare/Medicaid often restrict the use of newer therapies pointing to associated cost savings.
These policies may lead to prescription cost savings, but run the risk of excluding therapies that
lower total healthcare spending.

56
There are few studies discussing the impacts of drugs on total health care expenditures.
The most influential of these studies (Lichtenberg, 2001a and 2002) shows that the replacement
of older drugs by newer drugs reduce total medical expenditures. Duggan (2005), on the other
hand, argued that the replacement of older drugs by newer, more expensive drugs may not
decrease total medical expenditures by analyzing health care expenditures for antipsychotic
drugs.
This chapter addresses this issue by extending the study of Lichtenberg (2001 and 2002).
He measured the therapeutic advances of a drug by the number of years that drug had been on
the market. This measurement is valuable but limited because it implicitly treats all drugs of
comparable age as the same quality. Our approach is to look at both the quality and the age of the
drugs to measure their impacts on pharmaceutical spending and total healthcare expenditures.
We have used the FDA Drug Evaluation as our quality indicator.
In late 1975 the FDA formed a 3-tier rating system for prioritizing review of New Drug
Applications (NDA). If the drug provided a significant gain over existing therapy, FDA
classified that drug with an A rating, if the drug brought a modest gain then that drug was given
a B rating and if the drug provided little or no gain over existing therapy, then it was given a C
rating. In 1992 the FDA switched its rating system into 2 categories: P (priority) and S
(standard). A priority drug would provide a significant improvement compared to marketed
products in the treatment, diagnosis, or prevention of a disease. We grouped those approved
NDAs that had received an A or B rating with those NDAs that had received P rating to form a
"priority-rated" category for our analysis. Similarly, we grouped NDAs that had been assigned a
C rating by the FDA with NDAs that had been assigned an S rating to form a "standard-rated"
category.

57
The impact of the quality and the age of the drugs may differ across conditions. For example,
drugs prescribed for infectious diseases may totally have different impacts on health care
expenditures than the drugs prescribed for mental disorders. While infectious diseases are cured
with one or two purchase of prescriptions, however, mental disorders generally require long-term
treatment. We analyzed the impacts of the quality and the age of the drugs on each therapeutic
class separately based on their clinical modification of the 9th edition of International Classes of
Diseases prepared by United States and adopted in 1979 (ICD-9-CM)21. ICD-9-CM categorizes
diseases and injuries broadly into 18 categories. Availability of the data from Medical
Expenditure Panel Survey (MEPS) allowed us to create unique data sets for only nine of them,
namely; musculoskeletal system and connective tissue diseases, skin and subcutaneous tissue
diseases, neoplasm, mental disorders, diseases of nervous system and sense organs, circulatory
system diseases, respiratory system diseases, digestive system diseases, genitourinary system
diseases.
Newer drugs generally make patients’ life more comfortable by providing better and
reliable treatment. Better and reliable treatment comes with a higher cost. This chapter studies if
better and newer drugs are worth to pay higher prices. This chapter examines the change in total
drug and nondrug expenditures when patients are on priority drugs and/or standard drugs. In this
study, we offered a better methodology by incorporating the quality and the ages of the drugs to
capture the effects of better and newer drugs on pharmaceutical spending and total healthcare
expenditures. Our results confirm the empirical findings of Lichtenberg (2001a, 2002), Olson
(2004) and Lu & Comanor (1998) by displaying that for some of the therapeutic categories,
newer priority drugs are better and for some therapeutic categories newer standard drugs are
21 For further information about ICD-9-CM codes, see the web site: http://www.cdc.gov/nchs/data/icd9/icdguide.pdf

58
better. Our results also support the empirical findings of Duggan (2005) by showing that newer
drugs do not decrease total non-drug expenditures for mental disorders and diseases of the
nervous system and sense organs.
The remaining of the chapter is as follows: Section-2 displays the model and its
theoretical background. Section-3 provides details about the data set. The results are presented
and discussed in section-4. The final section concludes.
IV.2. Model
The model we use is a variant of the model used by Lichtenberg (2001a and 2002). He
estimated the effect of drug age on expenditures across the patients by using the random
variations in prescribing behaviors of physicians and by controlling for many important attributes
of the individuals, conditions, and prescriptions that influence outcomes and non-drug
expenditures and that may be correlated with drug age.
The most important distinction between our approach and Lichtenberg’s is that we
incorporate the effects of both drug’s age and quality on expenditures within patients. This
measure offers a substantial improvement over drug age because multiple drugs introduced in a
given year do not necessarily represent the same level of quality over existing therapies.
The second improvement we offer is to measure the impacts of drugs on total health care
expenditures by determining whether drugs prescribed for a selected group of therapeutic
classes. The random variations in prescribing behaviors of physicians and in patients’
consumptions of drugs help us to analyze the effect of novel drugs on total drug and non-drug
expenditures.
The third substantial improvement is that we measure the impact of drug usage on
expenditures within patients. Lichtenberg measures drug input by examining differences in drug

59
and non-drug expenditures across patients while controlling for demographic variables such as
sex, age, education and the like. Our specification tests favor the model with individual patient
effects.
Our analysis incorporates each of these methodological improvements in measuring the
effects of newer and better drugs on healthcare outcomes. We control the effects of the
conditions by incorporating the condition duration and their ICD-9 codes. We also controlled
both individuals’ observed and unobserved characteristics by introducing an individual fixed
effects variable. The model is as follows:
Ycij =αi + β1 (PRIORITY_DRUGij) + β2 ln( AGE_PRIORITY_DRUGij)
+ β3 ln( AGE_STANDARD_DRUGij) + λ1GENERICij
+ λ2BEFORE_1970ij + ∑cθcCONDITIONijc+∑dδdCON_DURijd + ξj
where:
Ycij is the category (c) of either prescription drug expenditures (c=DE) or total non-drug
expenditure (c=NDE) associated with the jth prescription consumed by person i.
αi = 1 for the ith person, zero otherwise.
PRIORITY_DRUGij = 1 if prescribed drug j consumed by person i is rated as priority drugs by
FDA, otherwise zero.
AGE_PRIORITY_DRUGij = the age of the priority drug j used by person i.
AGE_STANDARD_DRUGij = the age of the standard drug j used by person i.
GENERICij = 1 if the prescribed drug used by person i is generic, otherwise zero.

60
BEFORE_1970ij = 1 if the prescribed drug consumed by person i was first approved by FDA
before 1970, otherwise zero. Since FDA started classifying drugs after 1970, we assumed that all
the drugs approved before 1970 were standard drugs and have controlled this effect by
introducing a year dummy variable, BEFORE_1970.
CONDITIONijc = 1 if prescription drug j consumed by person i is prescribed for condition c,
otherwise zero.
CON_DURijd = 1 if the condition for which prescription drug j consumed by person i began d
years ago, otherwise zero.
ξj is the disturbance term.
Estimates of parameters of β’s are of interest here. Hereafter, the superscripts and
subscripts are suppressed for notational conveniences.
IV.3. Data
We used Medical Expenditure Panel Survey (MEPS) data sets from 1996 to 2001.
MEPS, which is cosponsored by the Agency for Health Care Research and Quality and the
National Center for Health Statistics is a nationally representative survey of health care use,
expenditures, sources of payments, insurance coverage and demographic characteristics for the
U.S. civilian noninstitutionalized population. MEPS consist of three surveys: Household
Component (HC), Medical Provider Component (MPC) and Insurance Component (IC). HC is
the core survey and it establishes the basis for the MPC and part of the IC. These surveys jointly
generate exceptionally rich datasets that provide national estimates of the level and distribution
of health care use and expenditures, support health services research, and can be used to evaluate
health care policy implications.
61
Our data set consists of the first five panels of MEPS from 1996 to 2001. First, we
created our data set for each panel separately by merging the HC files, MPC files and IC files.
Then, we calculated the expenditures associated with each condition, by event type using
Condition-Event Link File.22 And finally, we have used medical care index (1982-1984=0) and
expressed all the dollar values in terms of year 2001.
Following the ICD-9-CM categorization of diseases and injuries and using ICD-9 codes
within each category, we generate unique data sets for only 9 therapeutic classes, which are
musculoskeletal system and connective tissue diseases, skin and subcutaneous tissue diseases,
neoplasm, mental disorders, diseases of nervous system and sense organs, circulatory system
diseases, respiratory system diseases, digestive system diseases, genitourinary system diseases.
The MEPS Prescribed Medicine Event file contains information about the amount paid
for the each prescription, by source of payment but does not include information about the year
in which the active ingredient was first approved by FDA. We have created a dataset by
collecting information for some drugs from the Orange Book, Physician’s Desk Reference 2003,
Drug Facts and Comparisons 2003 and from a data set that was graciously provided to us by
Frank L. Lichtenberg. Using National Drug Code, we merge this data file into Prescribed
Medicine Event file so that we have information about the year in which the active ingredient
was first approved by FDA. Finally, we have used the data set that was graciously provided to us
by Joseph A. DiMasi to incorporate the quality of drugs into our data set.
IV.4. Empirical Results
The empirical analysis focuses on these different groups of important therapeutic
categories, beginning with the Musculoskeletal System and Connective Tissue Diseases. All of
22 For further information about the MEPS, see the web site: http://www.meps.ahrq.gov/

62
the data presented reflect event level outcomes, which mean average expenditures are per event
and the regression coefficients reflect impact per event.
IV.4.1. Musculoskeletal System and Connective Tissue Diseases
Diseases of musculoskeletal system and connective tissue23 include some of the well-
known diseases such as arhtropathies, dorsopathies, osteopathies and rheumatism. Rheumatoid
arthritis is a chronic disease of the joints, marked by inflammatory changes in the synovial
membranes and articular structures, widespread fibrinoid degeneration of the collagen fibers in
mesenchymal tissues, and by atrophy and rarefaction of bony structures.
Musculoskeletal system and connective tissue diseases are usually associated with longer
treatment period and higher health care expenditures. Table 10 presents the descriptive statistics.
These data reveal that 45.85 percent of conditions have more than five years of treatment period.
Data also reveals that priority drugs occupy 14.63 percent of the prescriptions and generic drugs
occupy 50.52 percent of prescriptions. Patients who use priority drugs experience higher drug
expenditures but lover nondrug expenditures when compared to standard drugs. Data show that
priority drugs when compared to standard drugs used for same condition, are typically associated
with higher drug expenditures ($65.94 versus $34.59), but lower nondrug expenditures ($436.23
and $509.66).
Table 11 presents the regression results measuring the impact of priority and standard
drugs on total drug and nondrug expenditures. The inspection of the results shows that control
variables are generally significant and plausible. The estimated results also indicate that generic
drugs have significant impact on health care expenditures. They decrease total drug and non-drug
expenditures respectively by $18.96 and $90.99.
23 Includes the diseases defined by ICD-9-CM codes from 710 to 739

63Table 10
Summary Statistics for Various Therapeutic Classes of Diseases
ICD9 CODES 710-739 680-709 140-239 290-319 320-389 390-459 460-519 520-579 580-629 Average Healthcare Expenditures ($):
Drug Expenditures $65.94 $85.07 $78.40 $85.56 $43.13 $64.87 $32.63 $78.17 $62.92 Priority
Drugs: Nondrug Expenditures 436.23 256.65 5170.38 302.79 287.40 1290.25 470.97 926.34 790.97
Drug Expenditures $34.59 $36.85 $47.43 $50.84 $32.01 $38.03 $32.47 $39.13 $30.11 Standard
Drugs: Nondrug Expenditures 509.66 248.81 4294.46 331.54 333.76 1319.08 510.54 953.57 601.25
Percentage of Reported Condition Durations:
Less than one year 24.2 34.38 47.07 18.25 25.9 22.80 28.43 49.87 47.24 1 year 9.65 18.47 20.14 12.06 10.82 11.05 8.46 15.17 13.73 2 years 6.73 6.39 8.35 7.89 6.66 7.22 5.71 6.86 4.63 3 years 4.3 4.55 7.4 8.05 6.86 6.54 5.4 2.7 4.1 4 years 5.79 3.27 3.86 4.21 2.55 4.66 3.63 3.17 6.24 5 years 3.48 5.26 1.16 4.78 6.66 4.58 4.05 0.88 3.83 More than 5 years 45.85 27.70 12.01 44.75 40.56 43.14 44.32 21.35 20.23 Percentage of Priority Drugs 14.63% 14.12% 13.14% 21.14% 27.84% 18.37% 26.83% 22.37% 13.72% Percentage of Generic Drugs 50.52% 44.43% 42.03% 35.95% 47.77% 37.49% 46.45% 40.98% 42.14% Number of Patients in Sample 6276 3816 1352 3151 9124 6760 16073 3810 4405 Note: Definitions of ICD9 Codes are as follow = [710-739] : Musculoskeletal system and connective tissue diseases; [680-709]: Skin and subcutaneous tissue diseases; [140-239]: Neoplasm; [290-319]: Mental disorders; [320-389]: Nervous system and sense organs diseases; [390-459]: Circularity system diseases; [460-519]: Respiratory system diseases; [520-579]: Digestive system diseases; [580-629]: Genitourinary system diseases.

64
Table 11
Analysis of Impacts of Quality and Age of Drugs on Total Health Care Expenditures
Associated with Diseases of Musculoskeletal System and Connective Tissue Dependent Variable
Total Drug Expenditures
Total Non-Drug Expenditures
Coefficient t-value Coefficient t-value Priority Drugs 16.424 (6.66)‡ -337.147 (2.44)† Log Age of Priority Drugs -12.055 (14.68)‡ 227.319 (4.94)‡ Log Age of Standard Drugs -8.061 (12.29)‡ 84.543 (2.30)† Generic -18.975 (30.22)‡ -90.997 (2.59)‡ Year Before 1970 -16.902 (16.19)‡ -11.702 (0.20) ICD-9-CODS
711 -13.571 (0.27) 304.135 (0.11) 712 22.686 (1.31) 93.035 (0.10) 714 -13.971 (3.89)‡ -315.899 (1.57) 715 -16.103 (4.24)‡ -34.520 (0.16) 716 -8.617 (2.79)‡ 155.336 (0.90) 717 -15.637 (1.63) 615.398 (1.15) 718 -6.477 (0.63) 961.754 (1.66)* 719 -13.751 (4.03)‡ 550.102 (2.88)‡ 720 -21.423 (2.26)† 87.133 (0.16) 721 -12.249 (2.69)‡ -206.889 (0.81) 722 -17.235 (5.24)‡ 170.694 (0.93) 723 -17.518 (3.86)‡ 582.962 (2.29)† 724 -9.982 (3.12)‡ 474.428 (2.65)‡ 725 2.408 (0.26) -521.164 (1.02) 726 -11.838 (2.94)‡ 136.271 (0.60) 727 -13.571 (3.16)‡ 304.135 (1.26) 728 -5.496 (1.26) 845.520 (3.46)‡ 729 -13.651 (4.45)‡ 31.213 (0.18) 730 -1.110 (0.06) 2,445.384 (2.50)† 731 12.850 (0.74) 4,099.924 (4.20)‡ 732 0.000 (.) 0.000 (.) 733 -16.245 (4.78)‡ -597.511 (3.14)‡ 734 34.179 (1.54) 16.327 (0.01) 735 -15.422 (1.24) -339.751 (0.49) 736 20.565 (1.31) 3,973.369 (4.53)‡ 737 -12.706 (1.60) -139.932 (0.31) 738 -7.737 (0.38) 1,294.704 (1.15)
Constant 98.342 (11.97)‡ -89.429 (0.19) Control for Separate “Condition Duration” Dummy Variables Yes Yes
Control For Condition Duration Yes Yes Observations R-squared
32405 0.54
32405 0.61
Absolute value of t statistics in parentheses; * significant at 10%; † significant at 5%; ‡ significant at 1% Note: The estimated coefficients of dummy variables for Condition Duration are suppressed.

65
The empirical results show that priority drugs cost more than standard drugs. The
estimated results from Table 11 show that priority drugs are on average $16 more expensive than
standard drugs when both are one year old. Estimated results also reveal that replacement of
fifteen years old priority (standard) drugs with five years old priority (standard) drug increases
total drug expenditures respectively by $12.06 ($8.06).
The empirical results also show that priority drugs reduce nondrug expenditures by
substantially more than the increase in drug expenditures. The estimated results from Table 2
indicate that one-year old priority drugs reduce total nondrug expenditures by $337.15 compared
to one-year old standard drugs prescribed for the same conditions. The results support the
empirical findings of Lichtenberg (2001a and 2002) by showing that a unit decrease in the log
age of priority and standard drugs will decrease total non-drug expenditures respectively by
$227.32 and $84.54. It is straight forward to show that 10.6 years old or younger priority drugs
are associated with lower non-drug expenditures when compared to standard drugs prescribed for
the same condition.
Our empirical findings suggest that policymakers of any insurance or health care agency
should allow patients to have access to the younger priority drugs prescribed for musculoskeletal
system and connective tissue diseases, because they provide significant cost benefits over any
standard drugs or older priority drugs.
IV.4.2. Skin and Subcutaneous Tissue Diseases
Seborrheic, atopic dermatitis and eczema are some of the well-know skin and
subcutaneous disease24. Seborrheic dermatitis is a chronic inflammatory disease of the skin
characterized by moderate erythema, dry, moist, or greasy scaling, and yellow crusted patches on
24 Includes the diseases defined by ICD-9-CM codes from 680 to 709.

66
various areas, especially the scalp.25 It generally appears first as small patches of and then
progressing to involve the entire scalp with exfoliation of excessive amounts of dry scales.
Diseases of skin and subcutaneous tissue are usually associated with shorter treatment
period; one or two prescriptions usually cure the condition. Descriptive statistics presented in
Table 10 show that 34.38 percent of the conditions has less than one year treatment period.
Inspections of the data also show that priority drugs and generic drugs occupy respectively 14.12
and 44.43 percent of the prescriptions and 71.55. Priority drugs are usually cost more than
standard drugs. Priority drugs when compared to standard drugs used for same condition, are
associated with higher drug expenditures ($85.07 and $36.85), but slightly lower nondrug
expenditures ($248.81 and $256.65).
Table 12 presents the empirical results regarding the impact of priority and standard
drugs on total drug and nondrug expenditures. The results for control variables show that generic
drugs decrease both drug and nondrug expenditures ($20.62 and $70.20) when compared to
branded drugs prescribed for the same condition. The results also show that the dummy the
coefficient on “Year Before 1970” is only significant for drug expenditures regression and imply
that drugs approved before 1970 decrease drug expenditures.
The results also show that priority drugs are associated with increased drug expenditures
but even larger reductions in nondrug expenditures when compared to standard drugs. The
estimated results from Table 12 show that one-year old priority drugs are on average $126.48
more expensive than one-year old standard drugs prescribed for the same condition. Similarly,
the replacements of fifteen years old priority (standard) drugs with five years old priority
(standard) drugs increase total drug expenditures by $38.43 ($3.00).
25 http://www.icd9data.com/2006/Volume1/680-709/690-698/690/default.htm provides more details.

67
Table 12
Analysis of Impacts of Quality and Age of Drugs on Total Health Care Expenditures Associated with Diseases of Skin and Subcutaneous Tissue
Dependent Variable
Total Drug Expenditures
Total Non-Drug Expenditures
Coefficient t-value Coefficient t-value Priority Drugs 126.476 (10.69)‡ -562.303 (3.97)‡ Log Age of Priority Drugs -38.425 (9.74)‡ 228.435 (4.84)‡ Log Age of Standard Drugs -3.001 (1.53) 38.903 (1.66)* Generic -20.616 (9.91)‡ -70.199 (2.82)‡ Year Before 1970 -20.979 (7.17)‡ -9.468 (0.27) Constant 230.165 (2.62)‡ -273.850 (0.26) Control for Separate “ICD9 Codes” Dummy Variables Yes Yes
Control for Separate “Condition Duration” Dummy Variables Yes Yes
Observations R-squared
9915 0.70
9915 0.87
Absolute value of t statistics in parentheses; * significant at 10%; † significant at 5%; ‡ significant at 1% Note: The estimated coefficients of dummy variables for ICD9 Codes and Condition Duration are suppressed and available upon request.
Even though priority drugs are associated with higher drug expenditures, however, they
are associated with even larger reductions in nondrug expenditures when compared to standard
drugs. The estimated results in Table 12 indicate that one-year old priority drugs reduce total
nondrug expenditures by $562.30 when compared to one-year old standard drugs prescribed for
the same conditions. The results also suggest that both younger priority and standard drugs
decrease nondrug expenditures when compared to older drugs. A unit decrease in the log age of
priority and standard drugs decrease total non-drug expenditures respectively by $228.44 and
$38.90 indicating that younger priority drugs are superior over younger standard drugs regarding
cost-benefit analysis. It is straightforward to show those 19.46 years old or younger priority

68
drugs decrease nondrug expenditures more than standard drugs of any age prescribed for the
same conditions. Our empirical findings suggest that policymakers of any insurance or health
care agency should allow patients to have access to the younger priority drugs prescribed for skin
and subcutaneous tissue diseases, because they provide crucial cost savings over any standard
drugs or older priority drugs.
IV.4.3. Neoplasm
Neoplasm26 includes a wide range of conditions, for example, malignant neoplasm of lip,
oral cavity, digestive organs, respiratory organs, genitourinary organs and hematopoietic tissue.
Malignant neoplasm of esophagus is a well-known disease of malignant growth of cells in the
esophagus. This is a common cancer in the in France, Switzerland with highest mortality rates
seen in China, Singapore, and Puerto Rico.27 Excessive consumption of ethanol and cigarette
increases the risk for development of this cancer, acting in a synergistic fashion.
The drugs prescribed for neoplasm are usually more expensive than other drugs, may be
because of higher research and development cost involved. The average total drug and nondrug
expenditures vary across conditions for each treatment method. Inspections of the summary
statistics presented in Table 10 show that patients using priority drugs experience higher drug
and nondrug expenditures. Priority drugs when compared to standard drugs used for same
condition, are associated with higher drug expenditures ($78.40 and $47.43), and higher nondrug
expenditures ($5170.38 and $4294.46). Priority (generic) drugs occupy only 13.14 (42.03)
percent of the prescriptions. Data also reveals that 47.07 conditions have reported less than one
year treatment period and 13.14 (42.03) percent of the prescribed prescriptions belong to priority
(generic) drugs. 26 Includes the diseases defined by ICD-9-CM codes from 140 to 239. 27 http://www.icd9data.com/2006/Volume1/140-239/150-159/150/default.htm provides further details.

69
Table 13 presents the regression results regarding the impact of priority and standard
drugs on drug and nondrug expenditures associated with neoplasm. Contrary to the previous
therapeutic categories, the estimated results show those younger standards are more expensive
than priority drugs. Estimated results from Table 13 show that priority drugs are on average
$22.85 cheaper than standard drugs when both are one-year old and prescribed for the same
conditions. The results also indicate that both younger standard and priority drugs increase total
drug expenditures and the results are highly significant. A unit decrease in log of drug age
increase total drug expenditures by $ 38.54 and $31.67 respectively for standard and priority
drugs.
Table 13
Analysis of Impacts of Quality and Age of Drugs on Total Health Care Expenditures
Associated with Neoplasm Dependent Variable
Total Drug Expenditures
Total Non-Drug Expenditures
Coefficient t-value Coefficient t-value Priority Drugs -22.854 (1.06) 762.067 (0.30) Log Age of Priority Drugs -31.673 (4.24)‡ 1,699.351 (1.92)* Log Age of Standard Drugs -38.537 (9.39)‡ 2,128.864 (4.39)‡ Generic -30.602 (8.70)‡ -14.937 (0.04) Year Before 1970 -10.072 (1.66)* -2,443.631 (3.42)‡ Constant 275.148 (2.34)† 30,787.730 (2.21)† Control for Separate “ICD9 Codes” Dummy Variables Yes Yes
Control for Separate “Condition Duration” Dummy Variables Yes Yes
Observations R-squared
6594 0.45
6594 0.89
Absolute value of t statistics in parentheses; * significant at 10%; † significant at 5%; ‡ significant at 1% Note: The estimated coefficients of dummy variables for ICD9 Codes and Condition Duration are suppressed and available upon request.

70
The empirical results in Table 13 show that standard drugs lead to significant reduction in
total health care expenditures. One-year old standard drugs reduce total drug expenditures by
$762.08 when compared to one-year old priority drugs prescribed for the same condition.
Estimated results reveal that replacement of older drugs with younger drugs significantly
decrease total nondrug expenditures. For example, the replacement of fifteen years old priority
(standard) drugs with five years old priority (standard) drug significantly decrease total nondrug
expenditures by $1699.35 ($2128.86). These results imply that prescribing younger standard
drugs for neoplasm diseases over priority drugs of any age and older standard drugs significantly
decrease total health care expenditures.
IV.4.4. Mental Disorders
Organic psychotic conditions, neurotic and personal disorders and mental retardations are
common disease of mental disorders28. A well-know mental disorder is Schizophrenia, which is
a severe emotional disorder of psychotic depth characteristically marked by a retreat from reality
with delusion formation, hallucinations, emotional disharmony, and regressive behavior.29
Table 10 presents summary statistics for mental disorders. The data reveals that 21.14
(35.955) percent of prescriptions is chosen from priority (generic) drugs. Priority drugs when
compared to standard drugs are associated with higher drug expenditures ($85.55 and $50.54),
but slightly lower nondrug expenditures ($302.79 and $331.54). The mental disorder diseases are
generally chronic and require long-term drug treatment. Inspection of the data reveals that the
treatment duration for 44.75 percent of conditions is more than five years.
Table 14 presents the regression results regarding the impact of priority and standard
drugs on drug and nondrug expenditures associated with mental disorders. The estimated results
28 Includes the diseases defined by ICD-9-CM codes from 290 to 319. 29 http://www.icd9data.com/2006/Volume1/290-319/295-299/295/default.htm provides further details.

71
from Table 14 show that both younger priority and standard drugs increase drug expenditures.
One-year old priority drugs increase drug expenditures by $47.84 when compared to one-year
old standard drugs prescribed for the same condition. Similarly, a unit decrease in log of drug
age increase total drug expenditures by $ 38.06 and $28.07 respectively for priority and standard
drugs.
Table 14
Analysis of Impacts of Quality and Age of Drugs on Total Health Care Expenditures Associated with Mental Disorders
Dependent Variable
Total Drug Expenditures
Total Non-Drug Expenditures
Coefficient t-value Coefficient t-value Priority Drugs 47.834 (9.24)‡ -13.605 (0.09) Log Age of Priority Drugs -38.062 (19.23)‡ -92.870 (1.57) Log Age of Standard Drugs -28.065 (31.42)‡ -85.743 (3.20)‡ Generic -30.119 (26.16)‡ 97.619 (2.83)‡ Year Before 1970 8.084 (5.15)‡ 31.536 (0.67) Constant 83.813 (1.11) 1,054.906 (0.47) Control for Separate “ICD9 Codes” Dummy Variables Yes Yes
Control for Separate “Condition Duration” Dummy Variables Yes Yes
Observations R-squared
26799 0.52
26799 0.61
Absolute value of t statistics in parentheses; * significant at 10%; † significant at 5%; ‡ significant at 1% Note: The estimated coefficients of dummy variables for ICD9 Codes and Condition Duration are suppressed and available upon request.
The empirical results from Table 14 show neither priority drugs no standard drugs
provides cost saving on total nondrug expenditures. The results are only statistically significant
for the standard drugs. The estimated results show that younger standard drugs increase total

72
nondrug expenditures. A unit decrease in the log of the age of standard drugs increase total non-
drug expenditures by $85.74.
The empirical results presented in Table 14 support a Duggan (2005) finding, which is
despite newer drugs increase prescription drug expenditures; however, they do no reduce
spending on other types of medical care services for antipsychotic diseases. Our results suggest
that older standard drugs for the mental disorders provides more saving when compared to
younger standard drugs or both younger and older priority drugs.
IV.4.5. Diseases of Nervous System and Sense Organs
Inflammatory, hereditary and degenerative disease of the nervous system and disorders of
eye and adnexa and peripheral nervous system are the common diseases of this category30. One
of the well-know disease of this category is Parkinson's disease, which is a progressive disorder
of the nervous system marked by muscle tremors, muscle rigidity, decreased mobility, stooped
posture, slow voluntary movements, and a mask-like facial expression.31
The condition duration and treatment mode for nervous system and sense organs diseases
are very close to mental disorders. Summary statistics presented in Table 10 show that 40.65
percent of the reported conditions have more than five years of treatment period. Data reveal that
priority (generic) drugs occupy 27.84 (47.77) percent of the total dispensed prescriptions. The
average total drug and nondrug expenditures vary across conditions for each treatment method.
Data shows that patients using priority drugs experience higher drug expenditures. Priority drugs
when compared to standard drugs used for same condition, are associated with higher drug
expenditures ($43.13 and $32.01), but lower nondrug expenditures ($287.40 and $333.76).
30 Includes the diseases defined by ICD-9-CM codes from 320 to 389. 31 http://www.icd9data.com/2006/Volume1/320-389/330-337/332/default.htm provides further details.

73
Table 15 presents the regression results regarding the impact of priority and standard
drugs on total drug and nondrug expenditures associated with nervous system and sense organs
diseases. The empirical results presented in Table 15 show that the priority drugs are generally
more expensive and increase total drug expenditures. Estimated results show that one-year old
priority drugs when compared to standard drugs of same age increase drug expenditures by
$15.02. Similarly, a unit decrease in the log of drug age increases total drug expenditures by
$12.83 and $10.53 for priority and standard drugs respectively; suggesting that younger drugs
are expensive and increase total drug expenditures. The results are statistically significant and
support the existing studies.
Table 15
Analysis of Impacts of Quality and Age of Drugs on Total Health Care Expenditures Associated with Diseases of Nervous System And Sense Organs
Dependent Variable
Total Drug Expenditures
Total Non-Drug Expenditures
Coefficient t-value Coefficient t-value Priority Drugs 15.019 (3.10)‡ 356.857 (2.60)‡ Log Age of Priority Drugs -12.821 (8.47)‡ -112.175 (2.62)‡ Log Age of Standard Drugs -10.529 (8.33)‡ 6.624 (0.18) Generic -23.834 (19.11)‡ -87.127 (2.47)† Year Before 1970 -8.899 (4.36)‡ 118.644 (2.05)† Constant 23.897 (0.30) -3,439.784 (1.51) Control for Separate “ICD9 Codes” Dummy Variables Yes Yes
Control for Separate “Condition Duration” Dummy Variables Yes Yes
Observations R-squared
28113 0.59
28113 0.79
Absolute value of t statistics in parentheses; * significant at 10%; † significant at 5%; ‡ significant at 1% Note: The estimated coefficients of dummy variables for ICD9 Codes and Condition Duration are suppressed and available upon request.

74
The empirical results presented in Table 15 show that priority drugs increase total
nondrug expenditures too. Estimated results from Table 15 indicate that one-year old priority
drugs when compared to standard drugs of same age increase total drug expenditures by $356.86.
The replacement of 15 year-old priority drug with a 5.5 year old priority drug increases total
nondrug expenditures by $112.18. These empirical results support both Duggan (2005) and
Olson (2004) empirical findings, which are respectively; younger drugs do not reduce total
health care expenditures and novel drugs increase total health care expenditures.
IV.4.6. Circulatory System Diseases
Most frequently observed diseases of circularity system32 are ischemic hearth diseases,
cerebrovascular diseases and acute and chronic rheumatic diseases. One of the well-known
diseases of circularity system is angina pectoris, which is the symptom of paroxysmal pain
consequent to myocardial ischemia usually of distinctive character, location and radiation;
provoked by a transient stressful situation during which the oxygen requirements of the
myocardium exceed that supplied amount coronary circulation.33
Circularity system diseases are widespread among the elder people and associated with
long term treatment periods. Inspection of summary statistics presented in Table 10 show that the
43.19 percent of reported conditions have at least five years of treatment history. Data show that
priority (generic) drugs occupy 18.37 (37.49) percent of total dispensed prescriptions.
Descriptive statistics reveal that average total drug and nondrug expenditures vary across
conditions for each treatment methods. Patients who use priority drugs face higher drug
expenditures. The average total drug expenditures per priority and standard drug prescription are
respectively $64.87 and $38.03. On the other hand, patients on priority drugs experience slightly
32 Includes the diseases defined by ICD-9-CM codes from 390 to 459. 33 http://www.icd9data.com/2006/Volume1/390-459/410-414/413/default.htm provides further details.

75
lower non-drug related health care expenditures. The average total non-drug expenditures per
prescription on priority and standard drugs are respectively $1290.25 and $1319.08.
The empirical results presented in Table 16 show that priority drugs are very expensive
drugs. The estimated results in Table 16 show that one-year old priority drugs increase drug
expenditures by $42.66 when compared to one-year old standard drugs prescribed for the same
conditions. The results also show that both younger priority and standard drugs are expensive
and increase total drug expenditures. A unit decrease in the log of the ages of the priority and the
standard drugs increase total drug expenditures respectively by $23.20 and $10.14. The results
are highly statistically significant and plausible.
Table 16
Analysis of Impacts of Quality and Age of Drugs on Total Health Care Expenditures Associated with Diseases of Circulatory System
Dependent Variable
Total Drug Expenditures
Total Non-Drug Expenditures
Coefficient t-value Coefficient t-value Priority Drugs 42.658 (18.58)‡ -357.827 (1.77)* Log Age of Priority Drugs -23.200 (31.00)‡ 101.688 (1.55) Log Age of Standard Drugs -10.144 (17.93)‡ -78.876 (1.59) Generic -21.681 (45.09)‡ 61.736 (1.46) Year Before 1970 -17.600 (19.68)‡ 205.074 (2.61)‡ Constant 124.134 (4.71)‡ 5,710.454 (2.47)† Control for Separate “ICD9 Codes” Dummy Variables Yes Yes
Control for Separate “Condition Duration” Dummy Variables Yes Yes
Observations R-squared
57239 0.53
57239 0.78
Absolute value of t statistics in parentheses; * significant at 10%; † significant at 5%; ‡ significant at 1% Note: The estimated coefficients of dummy variables for ICD9 Codes and Condition Duration are suppressed and available upon request.

76
The empirical results presented in Table 16 also show that priority drugs decrease total
nondrug expenditures substantially more when compared standard drugs. The estimated results
displayed in Table 16 imply that one-year old priority drugs when compared to standard drugs of
same age decrease total nondrug expenditures by $357.83 more. It is straightforward to show
that any priority drugs younger than 34 years (=exp (357.83 / 101.68)) decrease total nondrug
expenditures. Contrary to the empirical findings of Lichtenberg 2001a and 2002, replacements of
older standard drugs with younger ones do not decrease total health care expenditures. Our
empirical findings suggest that policymakers of any insurance or health care agency should allow
patients to have access to the priority drugs. They may lead to higher prescription cost, but
decrease the risk of higher nondrug expenditures when compared to standard drugs.
IV.4.7. Respiratory System Diseases
Acute respiratory infections, chronic obstructive pulmonary diseases and
pneumoconioses are some of the common respiratory diseases34. Asthma is one of the well-
known and widespread respiratory system diseases. It is a form of bronchial disorder associated
with airway obstruction, marked by recurrent attacks of paroxysmal dyspnea, with wheezing due
to spasmodic contraction of the bronchi.35
Respiratory system diseases are usually associated with moderate term treatment and
observable across all ages. Analysis of the descriptive statistics presented in Table 10 show that
44.32 of conditions have history of more than five years. Data also reveals that priority (generic)
drugs occupy 26.83 (46.45) percent of the prescriptions and priority drugs are associated with
drug but slightly lower nondrug expenditures when compared to standard drugs. The average
34 Includes the diseases defined by ICD-9-CM codes from 460 to 519. 35 http://www.icd9data.com/2006/Volume1/460-519/490-496/493/default.htm provides further details.

77
drug and nondrug expenditures per priority (standard) drug prescription are respectively $32.63
and $470.97 ($32.46 and $510.54).
The empirical results presented in Table 17 shows that priority drugs costs more than
standard drugs but lead to significant reductions in nondrug expenditures. Patients using one-
year old drugs over one-year old standard drugs experience increased total drug expenditures by
$41.89, but decreased total nondrug expenditures of $310.57. The estimated results also show
that younger priority drugs increase total drug expenditures but decrease total nondrug
expenditures by substantially more. The replacement of a 15 year-old priority drug with a 5.5
year-old priority drug increases drug expenditures by $ 23.98, but decreases total nondrug
expenditures by $142.79. The results are highly statistically significant and plausible.
Table 17
Analysis of Impacts of Quality and Age of Drugs on Total Health Care Expenditures Associated with Diseases of Respiratory System
Dependent Variable
Total Drug Expenditures
Total Non-Drug Expenditures
Coefficient t-value Coefficient t-value Priority Drugs 41.885 (16.24)‡ -310.571 (1.95)* Log Age of Priority Drugs -23.984 (27.64)‡ 142.789 (2.67)‡ Log Age of Standard Drugs -4.891 (8.99)‡ 17.297 (0.52) Generic -18.195 (32.83)‡ -93.375 (2.73)‡ Year Before 1970 -21.200 (23.10)‡ 62.710 (1.11) Constant 82.543 (4.37)‡ -397.830 (0.34) Control for Separate “ICD9 Codes” Dummy Variables Yes Yes
Control for Separate “Condition Duration” Dummy Variables Yes Yes
Observations R-squared
57232 0.54
57232 0.86
Absolute value of t statistics in parentheses; * significant at 10%; † significant at 5%; ‡ significant at 1% Note: The estimated coefficients of dummy variables for ICD9 Codes and Condition Duration are suppressed and available upon request.

78
The estimated coefficients on standard drugs are not large in magnitude for drug
expenditures regression and not significant for nondrug expenditures regression. It is easy to
show that 9.5 years old or younger priority drugs - which includes 29.46 percent of the priority
drugs in our sample- decrease total health care expenditures when compared to standard drugs
prescribed for the same condition. Contrary to the empirical findings of Lichtenberg 2001a and
2002, our empirical results show that there is no cost benefit through prescription of younger
standard drugs. The empirical findings suggest that having access to the priority drugs decrease
the total healthcare expenditures.
IV.4.8. Digestive System Diseases
The most common diseases of digestive systems36 are oral cavity, esophagus, gastric and
peptic ulcers, appendicitis and other diseases of intestines and peritoneum. The defects in the
mucosa barrier cause peptic ulcer, which occurs in the regions of the gastrointestinal tract which
come into contact with gastric liquid containing pepsin and gastric acid.37
Digestive system diseases are widespread among the elder people and associated with
moderate term treatment periods. Table 10 displays the descriptive statistic. Inspection of the
data shows that only 21.35 percent of reported condition duration is associated with more than
five years of treatment period. Data also show that while priority drugs occupy only 22.37
percent of the dispensed prescriptions; generic drugs, however, occupy majority of the drugs,
40.38 percent of total prescriptions. Data reveals that priority drugs are more expensive than
standard drugs. The average drug and non-drug expenditures per priority (standard) drug
prescription are respectively $78.17 and $924.34 ($39.13 and $953.57).
36 Includes the diseases defined by ICD-9-CM codes from 520 to 579. 37 http://www.icd9data.com/2006/Volume1/520-579/530-537/533/default.htm provides further details.

79
Table 18 presents the regression results regarding the impact of both priority and standard
drugs on total drug and nondrug expenditures associated with diseases of digestive systems. The
empirical results presented in Table 18 show that the priority drugs are very expensive and
increase total drug expenditures. Estimated results show that one-year old priority drugs when
compared to standard drugs of same age dispensed for the same conditions increase total drug
expenditures by $50.21. Similarly, a unit decrease in the log of drug age increases total drug
expenditures by $31.92 for priority drugs and by $17.22 for standard drugs suggesting that
younger priority drugs are much more expensive than standard drugs of same ages. The results
are statistically significant and plausible.
Table 18
Analysis of Impacts of Quality and Age Of Drugs on Total Health Care Expenditures Associated with Diseases of Digestive System
Dependent Variable
Total Drug Expenditures
Total Non-Drug Expenditures
Coefficient t-value Coefficient t-value Priority Drugs 50.208 (7.57)‡ 89.133 (0.27) Log Age of Priority Drugs -31.917 (13.29)‡ 42.770 (0.35) Log Age of Standard Drugs -17.217 (12.74)‡ 121.752 (1.79)* Generic -22.534 (16.72)‡ -132.774 (1.96)† Year Before 1970 -10.973 (4.75)‡ -55.238 (0.48) Constant 127.581 (2.61)‡ 8,576.797 (3.49)‡ Control for Separate “ICD9 Codes” Dummy Variables Yes Yes
Control for Separate “Condition Duration” Dummy Variables Yes Yes
Observations R-squared
13279 0.66
13279 0.77
Absolute value of t statistics in parentheses; * significant at 10%; † significant at 5%; ‡ significant at 1% Note: The estimated coefficients of dummy variables for ICD9 Codes and Condition Duration are suppressed and available upon request.

80
Empirical results presented in Table 18 show, however, that priority drugs do not
decrease total nondrug expenditures and coefficients on priority drugs are not statistically
significant. Estimated results in Table 18 indicate that younger standard drugs significantly
decrease the total nondrug expenditures. The replacement of a 15 year-old standard drug with a
5.5 year-old standard drug decreases total non-drug expenditures by $121.75 and the results are
highly statistically significant. These results support the findings of Lichtenberg 2001a and 2002
by displaying that newer drugs are more expensive than older drugs. Our results also reveal that
despite priority drugs provide a significant improvement compared to marketed products in the
treatment, diagnosis, or prevention of a disease, they, however, may not decrease total health
care expenditures.
IV.4.9. Genitourinary System Diseases
Nephritis, nephrotic syndrome, diseases of male genital organs and inflammatory disease
of female pelvic organs are the most common diseases of genitourinary system38. One of the
well-know disease of this category is solitary cyst of breast, which appear as a single large cyst
in one breast, multifocal, or bilateral in fibrocystic breast disease. It occurs as a result of a fluid-
filled closed cavity or sac that is lined by an epithelium and found in the breast.39
Genitourinary system diseases are usually observed among the elder patients and
associated with shorter treatment period. Inspection of the summary statistics presented in Table
10 reveals that only 20.23 percent of the conditions have more than five years treatment period.
Analysis of the data also show priority drugs occupy only 13.72 percent of total dispensed
prescriptions and they are generally sold at a substantial premium over standard drugs. The
38 Includes the diseases defined by ICD-9-CM codes from 580 to 629. 39 http://www.icd9data.com/2006/Volume1/580-629/610-611/610/default.htm includes futher details.

81
average total drug and non-drug expenditures per priority (standard) drug prescription are
respectively $62.92 and $790.97 ($30.11 and $601.25).
Table 19 presents the regression results regarding the impact of both priority and standard
drugs on total drug and nondrug expenditures associated with diseases of genitourinary systems.
The estimated results presented in Table 19 shows that both younger priority and standard drugs
increase total drug expenditure about the same scale. A unit decrease in log age of the drugs
increases total drug expenditures by $12.15 and $13.72 respectively for the priority and standard
drugs.
Table 19
Analysis of Impacts of Quality and Age of Drugs on Total Health Care Expenditures Associated with Diseases of Genitourinary System
Dependent Variable
Total Drug Expenditures
Total Non-Drug Expenditures
Coefficient t-value Coefficient t-value Priority Drugs 4.393 (0.46) 165.260 (0.55) Log Age of Priority Drugs -12.147 (3.60)‡ 109.631 (1.02) Log Age of Standard Drugs -13.721 (7.22)‡ 179.912 (2.98)‡ Generic -19.111 (11.26)‡ -67.267 (1.25) Year Before 1970 -12.961 (4.31)‡ -181.572 (1.90)* Constant 281.146 (3.22)‡ -28,489.932 (10.29)‡ Control for Separate “ICD9 Codes” Dummy Variables Yes Yes
Control for Separate “Condition Duration” Dummy Variables
Yes Yes
Observations R-squared
12273 0.52
12273 0.79
Absolute value of t statistics in parentheses; * significant at 10%; † significant at 5%; ‡ significant at 1% Note: The estimated coefficients of dummy variables for ICD9 Codes and Condition Duration are suppressed and available upon request.

82
Similar to digestive system diseases, priority drugs do not provide cost savings and
coefficients on priority drugs are not statistically significant. However, younger standard drugs
significantly decrease the total non-drug expenditures. Estimated results in Table 19 indicate that
the replacement of a 15 year-old standard drug with a 5.5 year-old standard drug decreases total
non-drug expenditures by $179.91. These results support the empirical findings of Lichtenberg
(2001a and 2002) by displaying those newer drugs are more expensive than older drugs. Our
results also suggest policymakers or physicians that prescribing younger standard drugs over
novel drugs provides significant cost benefits despite novel drugs have therapeutic advances over
standard drugs.
IV.6. Conclusion
Contrary to literature and FDA evaluations, newer and better drugs do not always reduce
health care expenditure. The nature of therapeutic conditions coupled with their duration yield us
to conclude that newer priority drugs decrease overall health care expenditures for diseases of
skin and subcutaneous tissue, musculoskeletal system and connective tissue, circulatory system
and respiratory system. The empirical findings presented in this chapter show that newer
standard drugs decrease overall health care expenditures for diseases of digestive system,
genitourinary system and neoplasm. Newer drugs do not decrease total health care expenditures
for mental disorders and diseases of the nervous system and sense organs.

83
CHAPTER V
CONCLUSION
This dissertation explores two important aspects of new pharmaceuticals and health care
expenditures: The impact of breakthrough drug classes on total health care expenditures and the
correlation between FDA Drug Classification and health care expenditures. Empirical evidence
presented in this dissertation shows that drugs belonging to new drug classes provide significant
advances in treatment of conditions compared to other drugs. The dissertation provides a more
flexible approach than the existing literature by separately estimating the cost impact of
important new groups of breakthrough drugs. The dissertation also improves on the previously
existing methodology by capturing the long term effects of using drugs rather than just focusing
on contemporaneous medical expenditures associated with a single medical event. Our unique
approach in measuring innovation allowed us to analyze the cost savings associated with major
groups of new drug classes, which are Selective Serotonin Reuptake Inhibitors, Statins, Ace
Inhibitors, H2 Antagonists, Proton Pump Inhibitors, Calcium Channel Blockers, and
Fluoroquinolones.
The results presented in this dissertation confirm that with the exception of ACE
Inhibitors breakthrough drugs are associated with higher drug expenditures. The results also
show, however, that these breakthrough drug groups, with the exception of the Fluoroquinolones,
are associated with very substantial reductions in nondrug expenditures. These reduced nondrug
expenditures are typically many times larger than the increase in drug expenditures. Hence, the
use of these groups of breakthrough drugs substantially reduce overall medical expenditures and
have contributed to medical cost containment.

84
This dissertation also explores the relations between FDA Therapeutic Drug
Classification and total health care expenditures. This dissertation incorporates both the quality
and the age of the drugs to capture their impacts on total health care expenditures. The
availability of the data allowed us to examine the following therapeutic classes: Musculoskeletal
system and connective tissue diseases, skin and subcutaneous tissue diseases, neoplasm, mental
disorders, diseases of nervous system and sense organs, circulatory system diseases, respiratory
system diseases, digestive system diseases, genitourinary system diseases.
The empirical results suggest that newer priority drugs significantly reduce total health
care expenditures for diseases of the circulatory system, diseases of the respiratory system,
diseases of the skin and subcutaneous tissue, and diseases of the musculoskeletal system and
connective tissue; newer standard drugs, however, provide cost savings for neoplasm, diseases
from digestive and genitourinary systems. Both newer priority and standard drugs do not provide
any cost savings for mental disorders and diseases of the nervous system and sense organs.
Contrary to literature and FDA evaluations, newer and better drugs do not always reduce
health care expenditure. The nature of therapeutic conditions coupled with their duration yield us
to conclude that newer priority drugs decrease overall health care expenditures for diseases of
skin and subcutaneous tissue, musculoskeletal system and connective tissue, circulatory system
and respiratory system. The empirical findings presented in this chapter show that newer
standard drugs decrease overall health care expenditures for diseases of digestive system,
genitourinary system and neoplasm. Newer drugs do not decrease total health care expenditures
for mental disorders and diseases of the nervous system and sense organs.
85
REFERENCES
Banthin, JS; Miller, GE 2006. Trends in prescription drug expenditures by Medicaid enrollees.
Medical Care 44:5, pp: 27-35.
Berndt, ER, Pindyck, RD, Azoulay, P 2003. Consumption externalities and diffusion in
pharmaceutical markets: Antiulcer Drugs. Journal of Industrial Economics 51:2, pp:243-270.
Berndt, ER 2000. Pharmaceuticals in U.S. health care: Determinants of quantity and price.
Journal of Economic Perspectives. 6:4, pp:45-66.
Caves, RE, Whinston, MD; Hurwitz, MA 1991. Patent expiration, entry and competiton in the
United States pharmaceutical industry. Brooking Papers on Economic Activity 14:3, pp:613-617.
Christian-Herman, J; Emons, M; George, D 2004. Effects of generic-only drug coverage in a
Medicare HMO. Health Affairs 23:6, pp: 4455-4468.
Comanor, WS and Schweitzer, SO 1994. Pharmaceuticals: The structure of American industry,
9th edition, Englewood Cliffs, NJ: Prentice Hall.
Cutler, DM; Rosen, AB; Vijan, S 2005. The value of medical spending in the United States,
1960-2000. New England Journal of Medicine 355:9, pp: 920-927.
86
Danzon, PM; Pauly, MV 2001. Health insurance and the growth in pharmaceutical expenditures.
Journal of Law and Economics 45:2, pp: 587-613.
DiMasi, JA, Hansen, RW, Grabowski, H.G., Lasagna, L., 2003. The price of innovation: New
estimates of the drug development costs. Journal of Health Economics 22, 151-185.
Duggan, M 2005. Do new prescription drugs pay for themselves? The case of second generation
antipsychotics. Journal of Health Economics 24:1, pp: 1-31.
Fendrick, AM; Smith, DG; Chernew, ME; Shah SN 2001. A benefit-based copay for prescription
drugs: Patient contribution based on total benefits, not drug acquisition cost. American Journal of
Managed Care 7:9, pp: 861-867.
Frencher, SK; Glied, S 2006. Title: The Medicare prescription drug improvement and
modernization act: Prescription drugs and academic medicine. Academic Medicine 81:9, pp:
812:816.
Giaccotto, C; Santerre, RE; Vernon, JA 2005. Drug prices and research and development
investment behavior in the pharmaceutical industry. Journal of Law and Economics 48:1, pp:
195-214.
Gibson, TB; Ozminkowski, RJ; Goetzel, RZ 2005. The effects of prescription drug cost sharing:
A review of the evidence. American Journal of Managed Care 11, pp: 730-740

87
Headen, A; Masia, N 2005. Exploring the potential link between medical access restrictions,
physician location, and health disparities. American Journal of managed Care 11, pp:21-26.
Heisler, L; Langa, KM; Eby, EL; Fendrick, AM; Kabetu, MU et al. 2004. The health effects of
restricting prescription medication use because of cost. Medical Care 42:7, pp: 626-634.
Lichtenberg, FR 2006. The effect of using newer drugs on admissions of elderly Americans to
hospitals and nursing homes: State-level evidence from 1997 to 2003. Pharmacoeconomics 24,
pp: 5-25.
Lichtenberg, FR 2005. .The effect of access restrictions on the vintage of drugs used by medicaid
enrollees. American Journal of Managed Care 11, pp: 7-13.
Lichtenberg, FR 2003. The economic and human impact of new drugs. Journal of Clinical
Psychiatry, 64:17, pp: 15-18
Lichtenberg, FR 2002. New drugs and lower cost. American Journal of Health-System Pharmacy
59:19, pp: 1894-1895.
Lichtenberg, FR 2001a, Are the benefits of newer drugs worth their cost? Evidence from the
1996 Medical Expenditure Panel Survey. NBER Working Paper No. W8147, March, 2001.

88
Lichtenberg, FR 2001b. Are the benefits of newer drugs worth their cost? Evidence from the
1996 MEPS. Health Affairs 20:5, pp: 241-251.
Lichtenberg, FR 1996, Do (more and better) drugs keep people out of hospitals?. American
Economic Review 86, May, 1996, 384-8.
Lu, ZJ; Comanor, WS 1998. Strategic pricing of new pharmaceuticals. The Review of
Economics and Statistics 80:1, pp: 108-118.
Medical Expenditure Panel Data Survey (MEPS).
http://www.meps.ahrq.gov/mepsweb/data_stats/download_data_files.jsp
Metge, C; Black, C; Peterson, S; Kozyrskyj, AL 1999. The population’s use of pharmaceuticals.
Managed Care 37:6, pp: 42-59.
Miller, GE; Moeller, JF; Stafford, RS 2005. New cardiovascular drugs: Patterns of use and
association with non-drug health expenditures. The Journal of Health Care Organization
Provision and Financing 42:4, pp: 397-412
Murawski, MM; Abdelgawad, T 2005. Title: Exploration of the impact of preferred drug lists on
hospital and physician visits and the costs to Medicaid. American Journal of Managed Care 11,
pp: 35-42.

89
Olson, MK 2004. Are novel drugs more risky than less novel drugs?. Journal of Health
Economics 23:6, pp: 1135-1158.
Pauly, MV 2004. Medicare drug coverage and moral hazard. Health Affairs 23:1, pp: 113-122.
Scheweitzer, SO 1997. Pharmaceutical economics and policy, Oxford University Press, New
York.
Thomas, LG, 1990. Regulation and firm size- FDA impacts on innovation. Rand Journal of
Economics 21:4, pp:497-517.
Wang, JL; Noel, JM; Zuckerman, IH; Miller, NA; T Shaya, F et al. 2006. Disparities in access to
essential new prescription drugs between non-hispanic whites, non-hispanic blacks, and hispanic
whites. Medical Care Research and Review 63:6, pp: 742-763.
Wiggins, SN; Mannes, R 2004. Price competition in pharmaceuticals: The case of anti-
invectives. Economic Inquiry 42:2, pp: 247-263.
Wiggins, SN 1987. The cost of developing a new drug. Pharmaceutical Manufacturers
Association. June, pp: 1-29.

90
APPENDIX A
Table A.1
A Hypothetical Example to Demonstrate the Methodology of Chronological Orderings of the Patients
Patient Identifier Purchase Round ICD-9 Codes Drug Name
09155028 2 311 XANAX 09155028 2 311 PROZAC 09155028 2 311 PROZAC 09155028 2 311 XANAX 09155028 2 311 XANAX 09155028 3 311 CLOMIPHENE 09155028 3 311 PROZAC 09155028 3 311 BUSPAR 09155028 5 311 PROZAC 09809019 1 311 ZOLOFT 09809019 1 311 ZOLOFT 09809019 1 311 ZOLOFT 09809019 2 311 MEDROXYPROGESTERONE 09809019 2 311 MEDROXYPROGESTERONE 01726016 3 311 ALPRAZOLAM 01726016 4 311 PAXIL 01726016 4 311 PAXIL 72986019 1 311 PAXIL 72986019 2 311 PAXIL 72986019 2 311 PAXIL 01751012 1 311 EFFEXOR 01751012 1 311 EFFEXOR 01751012 2 311 EFFEXOR 01751012 2 311 EFFEXOR
We develop three categories of drug use. The first category consists of the patients who frequently switch
drugs over time. The second category consists of patients who use important drugs all the time or switch drugs only
once. The third category consists of patients who never use important drugs. To clarify the categorization of
patients, we chose five patients diagnosed with the same condition of Depressive Disorders (ICD-9 Code 311). The
patient with personal identification number 09155028 is placed in category 1 due to frequent switches between
important drugs and other drugs over time. The patients with personal identification number 09809019 and
01726016 switched between important drugs and other drugs only once; while the patient with personal
identification number 72986019 always used important drugs. All three of these patients are grouped as category 2
patients. The last patient with personal identification number 01751012 has been placed under category 3, since that
patient never used important drugs.

91
Table A.2
Summary Statistics for 4, 5 and 6 Percent Samples Various Break-Through Drug Categories
Selective Serotonin Reuptake Inhibitors
Statins
ACE Inhibitors
4 % Sample
5 % Sample
6 % Sample
4 % Sample
5 % Sample
6 % Sample
4 % Sample
5 % Sample
6 % Sample
Year of First Introduction 1987 1987 1987 1989 1989 1989 1981 1981 1981 Demographics: Mean Age 43.8 44.5 44.3 59.4 57.6 58.3 58.3 59.5 59.3 Mean Education Year 11.3 11.3 11.3 11.0 11.5 11.7 11.2 11.1 11.2 Mean Income($) $17,629 $17,386 $17,487 $20,512 $22,883 $24,301 $20,809 $20,218 $20,277 Percentage of Male Patients 31.0 32.5 31.3 46.1 47.8 46.9 43.9 43.2 43.0 Percentage of White Patients 86.4 86.9 87.1 83.0 85.4 86.2 79.2 77.7 77.7 Percentage of Medicare enrollees 22.3 23.9 23.0 48.6 42.1 41.9 43.9 44.9 45.6 Percentage of Medicaid enrollees 22.3 23.8 23.2 17.2 14.0 13.0 15.8 16.3 16.3 Percentage of Private Insurance Enrollees 58.1 56.0 56.7 58.3 64.5 66.4 59.1 58.0 57.5
Percentage of Patients with No Insurance Coverage 12.0 12.2 12.4 7.7 7.6 7.2 9.0 9.2 9.3
Average Healthcare Expenditures ($):
Drug Expenditures $81.6 $81.4 $81.3 $86.1 $85.1 $83.4 $44.5 $44.5 $44.6 Important Drugs: Nondrug Expenditures 298.7 306.2 313.1 81.9 714.6 225.8 802.3 833.7 837.5
Drug Expenditures 51.8 53.3 50.3 40.7 42.4 42.9 44.9 43.6 43.6 Other Drugs: Nondrug Expenditures 413.9 455.4 442.9 123.2 1,979.4 450.6 900.7 943.8 965.0 Number of Patients in Sample 3,701 3,098 2,978 3,033 2,111 1,483 8,401 7,846 7,147
H2 Antagonists Proton Inhibitors
Calcium Channel Blockers Fluoroquinolones
4 % Sample
5 % Sample
6 % Sample
4 % Sample
5 % Sample
6 % Sample
4 % Sample
5 % Sample
6 % Sample
Year of First Introduction 1977 1977 1977 1981 1981 1981 1986 1986 1986 Demographics: Mean Age 45.2 45.2 45.2 57.8 58.6 59.1 43.0 43.0 41.2 Mean Education Year 9.8 9.8 9.8 11.0 11.1 11.1 10.6 10.5 10.5 Mean Income($) 18,468 18,468 18,468 20,479 20,752 20,658 19,204 18,525 18,090 Percentage of Male Patients 41.3 41.3 41.3 43.0 43.2 42.4 30.9 28.7 21.6 Percentage of White Patients 84.2 84.2 84.2 79.8 79.4 79.1 87.4 87.6 88.0 Percentage of Medicare enrollees 28.1 28.1 28.1 44.6 45.4 46.1 24.7 25.6 22.5 Percentage of Medicaid enrollees 19.6 19.6 19.6 16.1 15.7 15.8 13.9 13.9 14.3 Percentage of Private Insurance Enrollees 60.2 60.2 60.2 58.7 58.9 58.5 65.1 65.1 65.1
Percentage of Patients with No Insurance Coverage 10.8 10.8 10.8 9.1 8.9 8.8 12.3 12.1 12.5
Average Healthcare Expenditures ($):
Drug Expenditures 94.5 95.2 95.3 57.9 57.7 57.8 64.0 63.2 62.9 Important Drugs: Nondrug Expenditures 767.9 696.6 535.8 682.2 662.5 625.1 878.1 832.7 440.7
Drug Expenditures 40.5 41.3 36.6 41.7 41.6 41.1 28.9 29.5 24.2 Other Drugs: Nondrug Expenditures 1,635.2 1,688.1 1,189.9 1,256.7 1,236.3 1,160.2 527.2 418.9 372.6 Number of Patients in Sample 6,773 6,773 6,773 7,616 6,976 6,581 3,098 2,746 2,442
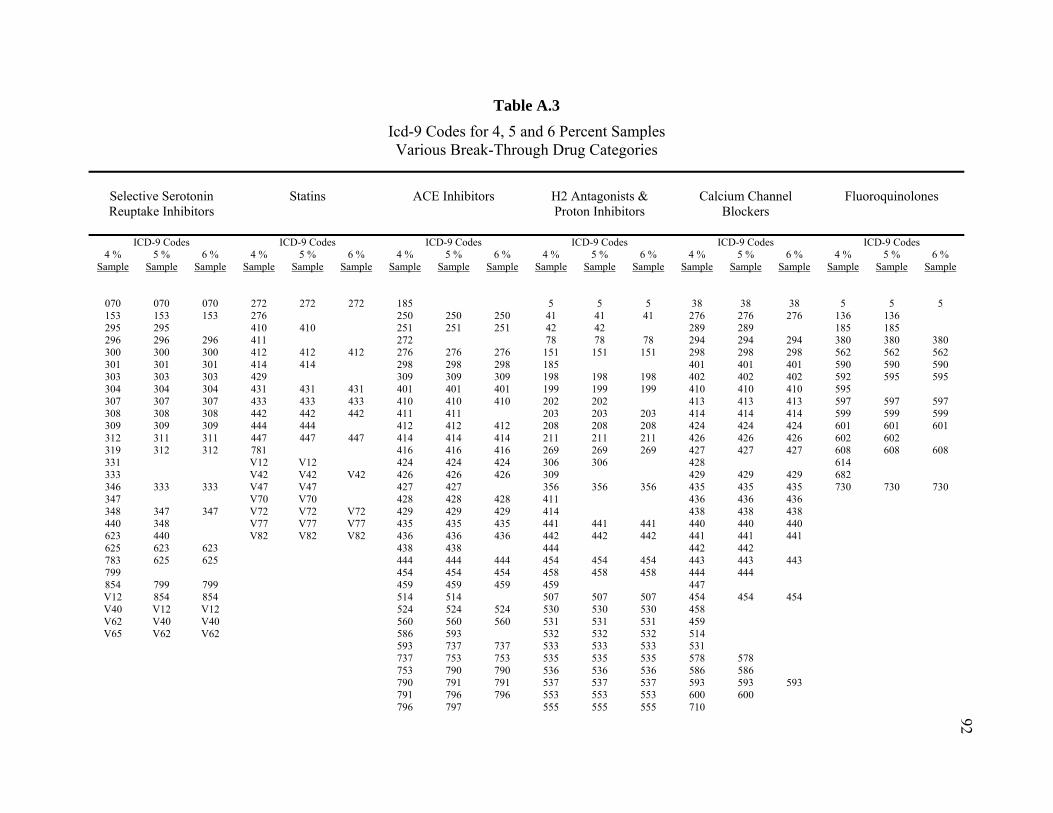
92Table A.3
Icd-9 Codes for 4, 5 and 6 Percent Samples Various Break-Through Drug Categories
Selective Serotonin Reuptake Inhibitors
Statins
ACE Inhibitors
H2 Antagonists & Proton Inhibitors
Calcium Channel
Blockers
Fluoroquinolones
ICD-9 Codes ICD-9 Codes ICD-9 Codes ICD-9 Codes ICD-9 Codes ICD-9 Codes 4 %
Sample 5 %
Sample 6 %
Sample 4 %
Sample 5 %
Sample 6 %
Sample 4 %
Sample 5 %
Sample 6 %
Sample 4 %
Sample 5 %
Sample 6 %
Sample 4 %
Sample 5 %
Sample 6 %
Sample 4 %
Sample 5 %
Sample 6 %
Sample
070 070 070 272 272 272 185 5 5 5 38 38 38 5 5 5 153 153 153 276 250 250 250 41 41 41 276 276 276 136 136 295 295 410 410 251 251 251 42 42 289 289 185 185 296 296 296 411 272 78 78 78 294 294 294 380 380 380 300 300 300 412 412 412 276 276 276 151 151 151 298 298 298 562 562 562 301 301 301 414 414 298 298 298 185 401 401 401 590 590 590 303 303 303 429 309 309 309 198 198 198 402 402 402 592 595 595 304 304 304 431 431 431 401 401 401 199 199 199 410 410 410 595 307 307 307 433 433 433 410 410 410 202 202 413 413 413 597 597 597 308 308 308 442 442 442 411 411 203 203 203 414 414 414 599 599 599 309 309 309 444 444 412 412 412 208 208 208 424 424 424 601 601 601 312 311 311 447 447 447 414 414 414 211 211 211 426 426 426 602 602 319 312 312 781 416 416 416 269 269 269 427 427 427 608 608 608 331 V12 V12 424 424 424 306 306 428 614 333 V42 V42 V42 426 426 426 309 429 429 429 682 346 333 333 V47 V47 427 427 356 356 356 435 435 435 730 730 730 347 V70 V70 428 428 428 411 436 436 436 348 347 347 V72 V72 V72 429 429 429 414 438 438 438 440 348 V77 V77 V77 435 435 435 441 441 441 440 440 440 623 440 V82 V82 V82 436 436 436 442 442 442 441 441 441 625 623 623 438 438 444 442 442 783 625 625 444 444 444 454 454 454 443 443 443 799 454 454 454 458 458 458 444 444 854 799 799 459 459 459 459 447 V12 854 854 514 514 507 507 507 454 454 454 V40 V12 V12 524 524 524 530 530 530 458 V62 V40 V40 560 560 560 531 531 531 459 V65 V62 V62 586 593 532 532 532 514
593 737 737 533 533 533 531 737 753 753 535 535 535 578 578 753 790 790 536 536 536 586 586 790 791 791 537 537 537 593 593 593 791 796 796 553 553 553 600 600 796 797 555 555 555 710

93
Table A.3 (Continued)
Selective Serotonin Reuptake Inhibitors
Statins
ACE Inhibitors
H2 Antagonists
Proton Inhibitors
Calcium Channel
Blockers
Fluoroquinolones
4 %
Sample 5 %
Sample 6 %
Sample 4 %
Sample 5 %
Sample 6 %
Sample 4 %
Sample 5 %
Sample 6 %
Sample 4 %
Sample 5 %
Sample 6 %
Sample 4 %
Sample 5 %
Sample 6 %
Sample 4 %
Sample 5 %
Sample 6 %
Sample 797 558 558 558 747 747 747 V42 V42 562 562 562 781 V47 V47 V42 564 564 564 785 785 785 V72 V72 V47 569 569 569 790 573 573 573 796 796 796 574 574 574 V12 V12 V12 575 575 575 V42 V42 V42 577 577 577 V45 V45 V45 578 578 578 V49 V49 V49 593 593 V70 V70 682 V72 V72 V72 707 707 707 714 786 787 787 787 789 789 789 805 850 850 850 V42 V42 V42 V43 V43 V43 V45 V45 V45 V47 V47 V47 V53 V56 V56 V56 V76 V76 V76

94
Table A.4
Statins Analysis of Impact on Health Care Expenditures
4 percent Sample 5 percent Sample 6 percent Sample
Dependant Variables: Total Drug
Expenditures
Total Non-Drug
Expenditures Total Drug
Expenditures
Total Non-Drug
Expenditures Total Drug
Expenditures
Total Non-Drug
Expenditures ICD-9 Codes
272 2.433 -1,444.461 (1.382)* (95.918)‡
276 4.785 915.993 (4.801) (254.307)‡
410 1.523 3,948.794 -3.797 5,434.941 (1.490) (260.673)‡ (1.515)† (250.913)‡
411 7.300 3,843.937 (4.079)* (908.470)‡
412 -13.294 1,762.808 -22.058 2,876.183 -18.103 3,152.949 (2.696)‡ (462.017)‡ (2.794)‡ (447.092)‡ (2.921)‡ (422.964)‡
414 4.305 1,344.644 2.580 3,006.599 (2.323)* (282.466)‡ (2.091) (291.819)‡
431 14.053 -83.489 14.160 1,382.708 11.748 3,014.434 (4.817)‡ (732.855) (4.986)‡ (771.441)* (5.210)† (692.535)‡
433 3.837 -865.618 2.341 987.089 -1.929 1,715.007 (4.351) (494.345)* (4.403) (479.522)† (4.820) (523.397)‡
442 9.420 2,559.216 3.873 4,155.006 0.340 4,080.339 (4.394)† (658.535)‡ (4.512) (655.310)‡ (4.630) (689.584)‡
444 -0.487 4,934.336 -3.646 6,490.118 (2.650) (484.454)‡ (2.662) (483.388)‡
447 -0.828 343.809 -0.715 1,589.236 -1.208 2,023.731 (4.114) (518.611) (4.027) (526.471)‡ (4.086) (506.360)‡
781 9.410 -961.621 (3.319)‡ (146.075)‡
V12 2.730 -1,468.157 1.239 641.522 (4.305) (266.502)‡ (4.531) (316.327)†
V42 28.535 750.809 23.098 3,528.432 17.581 2,549.848 (10.508)‡ (819.784) (9.392)† (852.429)‡ (8.565)† (814.743)‡
V47 11.275 -536.123 7.062 1,088.361 (3.556)‡ (224.256)† (3.549)† (242.192)‡
V70 14.731 -1,280.012 12.684 516.573 (4.314)‡ (156.770)‡ (4.216)‡ (131.091)‡
V72 6.968 -1,181.810 2.897 406.131 2.309 97.296 (1.619)‡ (90.038)‡ (1.504)* (89.818)‡ (1.573) (45.202)†
V77 -12.081 -2,663.447 -12.909 -1,328.058 -14.578 -852.047 (3.222)‡ (337.413)‡ (3.216)‡ (274.970)‡ (3.402)‡ (186.672)‡
V82 14.373 -1,849.683 38.277 -21.206 37.090 -329.401 (14.317) (257.947)‡ (10.574)‡ (347.057) (12.214)‡ (299.635)

95
Table A.4 (Continued)
4 percent Sample 5 percent Sample 6 percent Sample
Dependant Variables: Total Drug
Expenditures
Total Non-Drug
Expenditures Total Drug
Expenditures
Total Non-Drug
Expenditures Total Drug
Expenditures
Total Non-Drug
Expenditures
Control for Separate “Condition Duration” Dummy Variables
Yes Yes Yes Yes Yes Yes
Control for Separate “Age” Dummy Variables
Yes Yes Yes Yes Yes Yes
Control for Separate “Education Year” Dummy Variables
Yes Yes Yes Yes Yes Yes
Absolute value of robust standard errors in parentheses; * significant at 10%; † significant at 5%; ‡ significant at 1% Note: The estimated coefficients of dummy variables for Condition Duration, Age and Education Year are suppressed.

96
Table A.5
Ace Inhibitors Analysis of Impact on Health Care Expenditures
4 percent Sample 5 percent Sample 6 percent Sample
Dependant Variables:
Total Drug Expenditures
Total Non-Drug
Expenditures
Total Drug Expenditures
Total Non-Drug
Expenditures
Total Drug Expenditures
Total Non-Drug
Expenditures
ICD-9 Codes
185 25.790 951.632 (4.540)‡ (252.589)‡
250 3.443 198.017 3.353 187.633 3.306 186.887 (0.542)‡ (44.585)‡ (0.541)‡ (44.314)‡ (0.540)‡ (43.998)‡
251 16.391 8,202.254 15.713 8,204.968 15.053 8,232.455 (6.066)‡ (1,130.246)‡ (6.050)‡ (1,119.883)‡ (6.068)† (1,109.630)‡
272 13.717 -318.998 (0.857)‡ (21.546)‡
276 -0.166 1,815.568 -0.161 1,847.772 -0.376 1,748.621 (4.225) (215.188)‡ (4.224) (215.439)‡ (4.272) (232.967)‡
298 15.523 494.846 15.215 490.144 16.319 481.623 (6.039)† (185.858)‡ (6.061)† (186.950)‡ (6.149)‡ (188.544)†
309 31.770 855.861 31.773 841.121 30.521 814.193 (4.801)‡ (220.431)‡ (4.825)‡ (223.265)‡ (4.881)‡ (222.920)‡
410 0.406 4,636.714 0.016 4,535.529 0.354 4,502.939 (1.015) (216.299)‡ (1.016) (216.811)‡ (1.020) (217.790)‡
411 5.778 5,221.913 4.317 5,138.958 (3.894) (828.573)‡ (3.894) (826.903)‡
412 -11.607 3,267.074 -12.976 3,152.717 -12.558 3,133.044 (2.019)‡ (516.397)‡ (2.030)‡ (513.522)‡ (2.028)‡ (510.030)‡
414 4.191 1,936.045 4.213 1,915.882 4.374 1,897.560 (1.702)† (214.397)‡ (1.707)† (213.943)‡ (1.711)† (214.272)‡
416 3.419 8,715.757 3.401 8,609.717 2.633 8,711.369 (4.959) (776.843)‡ (4.933) (771.362)‡ (4.965) (784.835)‡
424 -5.685 6,886.781 -5.505 6,853.279 -5.636 6,812.689 (1.923)‡ (678.107)‡ (1.926)‡ (676.139)‡ (1.934)‡ (675.049)‡
426 -4.294 822.439 -4.424 781.500 -4.478 756.695 (4.227) (316.783)‡ (4.210) (315.863)† (4.200) (315.737)†
427 -4.889 507.499 -4.883 488.488 (0.943)‡ (61.582)‡ (0.942)‡ (62.192)‡
428 -6.835 1,795.962 -7.083 1,734.839 -6.933 1,718.381 (1.026)‡ (199.841)‡ (1.027)‡ (200.849)‡ (1.035)‡ (202.219)‡
429 -0.131 1,070.634 -0.287 1,043.432 -0.292 1,021.341 (0.801) (70.040)‡ (0.803) (71.135)‡ (0.810) (67.971)‡
435 4.309 950.522 4.519 843.031 4.832 862.548 (3.242) (221.090)‡ (3.219) (225.316)‡ (3.236) (224.904)‡

97
Table A.5 (Continued)
4 percent Sample 5 percent Sample 6 percent Sample
Dependant Variables: Total Drug
Expenditures
Total Non-Drug
Expenditures Total Drug
Expenditures
Total Non-Drug
Expenditures Total Drug
Expenditures
Total Non-Drug
Expenditures 436 -3.330 3,892.327 -3.780 3,796.796 -3.254 3,785.669
(1.007)‡ (340.953)‡ (1.013)‡ (338.290)‡ (1.018)‡ (336.120)‡ 438 -7.295 460.375 -7.423 471.494
(3.076)† (122.600)‡ (3.062)† (126.566)‡ 444 -0.355 4,851.070 -0.716 4,814.663 -0.846 4,814.301
(2.246) (352.637)‡ (2.245) (352.192)‡ (2.248) (352.276)‡ 454 -5.231 2,665.179 -5.461 2,720.715 -5.253 2,757.827
(5.018) (511.745)‡ (5.034) (511.475)‡ (5.044) (513.302)‡ 459 1.481 712.140 1.633 737.492 1.687 708.677
(1.663) (125.675)‡ (1.662) (125.955)‡ (1.664) (126.330)‡ 514 -5.418 1,635.097 -5.539 1,647.832
(2.553)† (395.669)‡ (2.552)† (395.333)‡ 524 -25.308 458.257 -25.343 487.358 -26.092 566.137
(2.220)‡ (127.644)‡ (2.207)‡ (134.083)‡ (2.234)‡ (142.827)‡ 560 -13.469 4,189.310 -14.045 4,206.740 -14.513 4,219.873
(4.811)‡ (754.794)‡ (4.844)‡ (754.928)‡ (4.832)‡ (756.570)‡ 586 25.053 4,123.555
(11.513)† (571.261)‡ 593 10.310 854.134 10.346 877.126
(2.958)‡ (150.945)‡ (2.957)‡ (151.396)‡ 737 -6.641 946.307 -6.308 983.742 -6.411 1,004.662
(3.541)* (395.135)† (3.541)* (392.999)† (3.554)* (387.617)‡ 753 6.159 525.066 5.007 481.782 3.182 419.838
(7.178) (259.865)† (7.177) (263.411)* (7.410) (316.019) 790 -0.721 147.619 -1.074 136.709 -1.140 138.567
(2.132) (85.605)* (2.137) (88.111) (2.146) (92.091) 791 21.580 281.464 21.648 308.469 21.259 331.675
(6.687)‡ (114.198)† (6.627)‡ (124.005)† (6.682)‡ (133.206)† 796 -3.013 -51.881 -2.816 -35.563 -2.942 -51.945
(1.093)‡ (33.466) (1.098)† (35.191) (1.103)‡ (37.468) 797 -3.439 209.719 -3.446 242.852
(2.765) (83.507)† (2.774) (85.830)‡ V42 40.541 1,348.100 42.370 1,301.272 40.184 1,288.414
(11.086)‡ (536.457)† (11.107)‡ (539.996)† (11.065)‡ (552.880)† V47 4.437 583.706 4.852 629.953 4.631 562.124
(2.883) (156.693)‡ (2.886)* (158.808)‡ (2.914) (170.744)‡ V72 5.934 -11.920 6.215 19.573
(1.093)‡ (29.574) (1.091)‡ (30.594)

98
Table A.5 (Continued)
4 percent Sample 5 percent Sample 6 percent Sample
Dependant Variable Total Drug
Expenditures
Total Non-Drug
Expenditures Total Drug
Expenditures
Total Non-Drug
Expenditures Total Drug
Expenditures
Total Non-Drug
Expenditures Control for Separate “Condition Duration” Dummy Variables
Yes Yes Yes Yes Yes Yes
Control for Separate “Age” Dummy Variables
Yes Yes Yes Yes Yes Yes
Control for Separate “Education Year” Dummy Variables
Yes Yes Yes Yes Yes Yes
Absolute value of robust standard errors in parentheses; * significant at 10%; † significant at 5%; ‡ significant at 1% Note: The estimated coefficients of dummy variables for Condition Duration, Age and Education Year are suppressed.
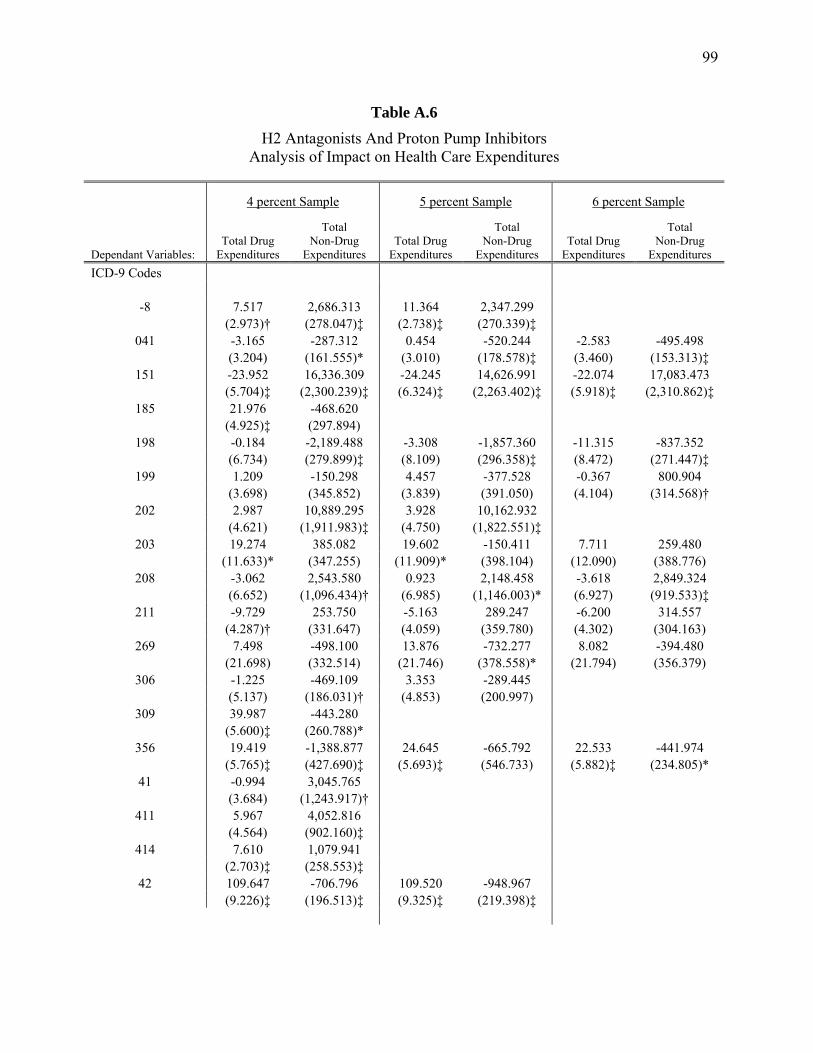
99
Table A.6
H2 Antagonists And Proton Pump Inhibitors Analysis of Impact on Health Care Expenditures
4 percent Sample 5 percent Sample 6 percent Sample
Dependant Variables: Total Drug
Expenditures
Total Non-Drug
Expenditures Total Drug
Expenditures
Total Non-Drug
Expenditures Total Drug
Expenditures
Total Non-Drug
Expenditures ICD-9 Codes
-8 7.517 2,686.313 11.364 2,347.299 (2.973)† (278.047)‡ (2.738)‡ (270.339)‡
041 -3.165 -287.312 0.454 -520.244 -2.583 -495.498 (3.204) (161.555)* (3.010) (178.578)‡ (3.460) (153.313)‡
151 -23.952 16,336.309 -24.245 14,626.991 -22.074 17,083.473 (5.704)‡ (2,300.239)‡ (6.324)‡ (2,263.402)‡ (5.918)‡ (2,310.862)‡
185 21.976 -468.620 (4.925)‡ (297.894)
198 -0.184 -2,189.488 -3.308 -1,857.360 -11.315 -837.352 (6.734) (279.899)‡ (8.109) (296.358)‡ (8.472) (271.447)‡
199 1.209 -150.298 4.457 -377.528 -0.367 800.904 (3.698) (345.852) (3.839) (391.050) (4.104) (314.568)†
202 2.987 10,889.295 3.928 10,162.932 (4.621) (1,911.983)‡ (4.750) (1,822.551)‡
203 19.274 385.082 19.602 -150.411 7.711 259.480 (11.633)* (347.255) (11.909)* (398.104) (12.090) (388.776)
208 -3.062 2,543.580 0.923 2,148.458 -3.618 2,849.324 (6.652) (1,096.434)† (6.985) (1,146.003)* (6.927) (919.533)‡
211 -9.729 253.750 -5.163 289.247 -6.200 314.557 (4.287)† (331.647) (4.059) (359.780) (4.302) (304.163)
269 7.498 -498.100 13.876 -732.277 8.082 -394.480 (21.698) (332.514) (21.746) (378.558)* (21.794) (356.379)
306 -1.225 -469.109 3.353 -289.445 (5.137) (186.031)† (4.853) (200.997)
309 39.987 -443.280 (5.600)‡ (260.788)*
356 19.419 -1,388.877 24.645 -665.792 22.533 -441.974 (5.765)‡ (427.690)‡ (5.693)‡ (546.733) (5.882)‡ (234.805)*
41 -0.994 3,045.765 (3.684) (1,243.917)†
411 5.967 4,052.816 (4.564) (902.160)‡
414 7.610 1,079.941 (2.703)‡ (258.553)‡
42 109.647 -706.796 109.520 -948.967 (9.226)‡ (196.513)‡ (9.325)‡ (219.398)‡
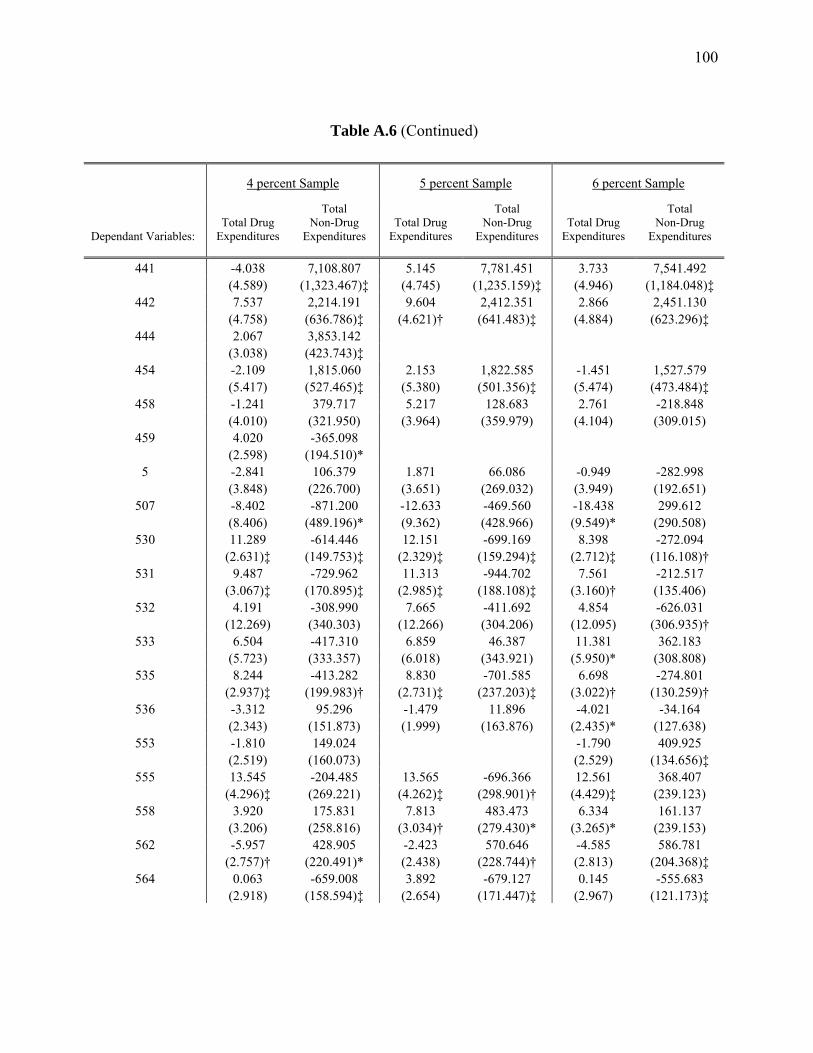
100
Table A.6 (Continued)
4 percent Sample 5 percent Sample 6 percent Sample
Dependant Variables:
Total Drug Expenditures
Total Non-Drug
Expenditures
Total Drug Expenditures
Total Non-Drug
Expenditures
Total Drug Expenditures
Total Non-Drug
Expenditures
441 -4.038 7,108.807 5.145 7,781.451 3.733 7,541.492 (4.589) (1,323.467)‡ (4.745) (1,235.159)‡ (4.946) (1,184.048)‡
442 7.537 2,214.191 9.604 2,412.351 2.866 2,451.130 (4.758) (636.786)‡ (4.621)† (641.483)‡ (4.884) (623.296)‡
444 2.067 3,853.142 (3.038) (423.743)‡
454 -2.109 1,815.060 2.153 1,822.585 -1.451 1,527.579 (5.417) (527.465)‡ (5.380) (501.356)‡ (5.474) (473.484)‡
458 -1.241 379.717 5.217 128.683 2.761 -218.848 (4.010) (321.950) (3.964) (359.979) (4.104) (309.015)
459 4.020 -365.098 (2.598) (194.510)*
5 -2.841 106.379 1.871 66.086 -0.949 -282.998 (3.848) (226.700) (3.651) (269.032) (3.949) (192.651)
507 -8.402 -871.200 -12.633 -469.560 -18.438 299.612 (8.406) (489.196)* (9.362) (428.966) (9.549)* (290.508)
530 11.289 -614.446 12.151 -699.169 8.398 -272.094 (2.631)‡ (149.753)‡ (2.329)‡ (159.294)‡ (2.712)‡ (116.108)†
531 9.487 -729.962 11.313 -944.702 7.561 -212.517 (3.067)‡ (170.895)‡ (2.985)‡ (188.108)‡ (3.160)† (135.406)
532 4.191 -308.990 7.665 -411.692 4.854 -626.031 (12.269) (340.303) (12.266) (304.206) (12.095) (306.935)†
533 6.504 -417.310 6.859 46.387 11.381 362.183 (5.723) (333.357) (6.018) (343.921) (5.950)* (308.808)
535 8.244 -413.282 8.830 -701.585 6.698 -274.801 (2.937)‡ (199.983)† (2.731)‡ (237.203)‡ (3.022)† (130.259)†
536 -3.312 95.296 -1.479 11.896 -4.021 -34.164 (2.343) (151.873) (1.999) (163.876) (2.435)* (127.638)
553 -1.810 149.024 -1.790 409.925 (2.519) (160.073) (2.529) (134.656)‡
555 13.545 -204.485 13.565 -696.366 12.561 368.407 (4.296)‡ (269.221) (4.262)‡ (298.901)† (4.429)‡ (239.123)
558 3.920 175.831 7.813 483.473 6.334 161.137 (3.206) (258.816) (3.034)† (279.430)* (3.265)* (239.153)
562 -5.957 428.905 -2.423 570.646 -4.585 586.781 (2.757)† (220.491)* (2.438) (228.744)† (2.813) (204.368)‡
564 0.063 -659.008 3.892 -679.127 0.145 -555.683 (2.918) (158.594)‡ (2.654) (171.447)‡ (2.967) (121.173)‡

101
Table A.6 (Continued)
4 percent Sample 5 percent Sample 6 percent Sample
Dependant Variables:
Total Drug Expenditures
Total Non-Drug
Expenditures
Total Drug Expenditures
Total Non-Drug
Expenditures
Total Drug Expenditures
Total Non-Drug
Expenditures
569 3.124 220.658 7.245 348.957 4.241 129.496 (4.757) (199.838) (4.616) (217.672) (4.790) (187.184)
573 3.438 621.042 5.268 428.588 4.725 128.034 (4.556) (218.615)‡ (4.464) (238.356)* (4.567) (192.428)
574 -5.967 2,749.643 -4.017 2,505.964 -6.795 2,493.244 (3.283)* (403.566)‡ (3.099) (426.213)‡ (3.344)† (373.124)‡
575 -6.012 399.054 -5.189 30.126 -7.281 867.722 (3.064)† (287.454) (2.922)* (308.001) (3.093)† (237.839)‡
577 4.111 778.932 4.362 762.682 0.498 1,395.846 (5.594) (372.516)† (5.235) (378.297)† (5.233) (378.907)‡
578 0.829 849.494 5.391 497.774 0.032 1,196.798 (4.511) (473.663)* (4.384) (516.056) (4.594) (417.082)‡
593 12.599 224.674 17.644 397.415 (3.598)‡ (196.978) (3.439)‡ (213.233)*
682 0.572 515.369 (3.363) (250.632)†
707 9.550 -327.883 10.487 -581.170 8.980 -414.477 (2.786)‡ (173.322)* (2.609)‡ (185.160)‡ (2.843)‡ (154.797)‡
714 1.297 -759.538 (2.392) (146.927)‡
78 15.274 -280.367 18.663 -639.791 19.176 -470.166 (4.650)‡ (198.082) (4.459)‡ (224.769)‡ (4.557)‡ (178.367)‡
786 -4.506 456.649 (2.154)† (155.435)‡
787 2.598 -301.472 6.059 -271.991 3.480 -340.565 (3.483) (142.952)† (3.274)* (154.792)* (3.708) (118.370)‡
789 -4.505 89.385 -1.908 145.471 -3.317 136.734 (2.942) (184.574) (2.719) (207.660) (3.013) (141.386)
805 -0.447 2,077.803 4.104 2,221.523 (3.401) (437.198)‡ (3.228) (438.294)‡
850 -8.205 594.439 -6.320 156.490 -10.606 263.315 (3.931)† (294.499)† (3.904) (306.355) (4.120)† (274.374)
V42 21.208 721.592 27.494 630.278 29.334 1,902.720 (10.948)* (617.977) (10.744)† (692.436) (10.671)‡ (612.281)‡
V43 3.457 2,193.155 4.818 1,826.423 3.584 2,188.753 (7.465) (774.880)‡ (7.392) (767.083)† (7.452) (786.687)‡
V45 -5.713 -1,094.420 -1.228 -1,155.014 -0.819 -700.613 (4.059) (270.242)‡ (4.058) (307.339)‡ (4.216) (226.196)‡

102
Table A.6 (Continued)
4 percent Sample 5 percent Sample 6 percent Sample
Dependant Variables:
Total Drug Expenditures
Total Non-Drug
Expenditures
Total Drug Expenditures
Total Non-Drug
Expenditures
Total Drug Expenditures
Total Non-Drug
Expenditures
V47 5.415 -347.945 9.814 -174.033 6.789 -272.608 (3.740) (214.077) (3.763)‡ (236.742) (3.932)* (196.073)
V53 -7.004 -594.790 (3.428)† (261.413)†
V56 10.678 -1,152.534 5.347 -1,058.595 5.968 160.511 (8.938) (362.942)‡ (8.950) (453.629)† (9.004) (177.056)
V76 8.109 -1,145.510 10.204 -1,085.970 9.402 -630.280 (3.517)† (211.108)‡ (3.637)‡ (279.333)‡ (3.744)† (168.868)‡
Control for Separate “Condition Duration” Dummy Variables
Yes Yes Yes Yes Yes Yes
Control for Separate “Age” Dummy Variables
Yes Yes Yes Yes Yes Yes
Control for Separate “Education Year” Dummy Variables
Yes Yes Yes Yes Yes Yes
Absolute value of robust standard errors in parentheses; * significant at 10%; † significant at 5%; ‡ significant at 1% Note: The estimated coefficients of dummy variables for Condition Duration, Age and Education Year are suppressed.

103
Table A.7
Calcium Channel Blockers Analysis of Impact on Health Care Expenditures
4 percent Sample 5 percent Sample 6 percent Sample
Dependant Variables:
Total Drug Expenditures
Total Non-Drug
Expenditures
Total Drug Expenditures
Dependant Variable
Total Drug Expenditures
Total Non-Drug
Expenditures
ICD-9 Codes
276 2.339 1,102.390 2.400 1,066.074 1.777 1,070.293 (4.208) (141.651)‡ (4.222) (149.108)‡ (4.227) (152.866)‡
289 15.952 1,849.302 16.428 1,853.216 (4.871)‡ (325.611)‡ (4.872)‡ (323.948)‡
294 7.432 178.130 8.299 -78.303 8.538 71.331 (5.861) (682.524) (5.907) (670.438) (5.868) (672.603)
298 17.034 229.405 16.264 187.199 15.769 255.752 (6.153)‡ (216.163) (6.192)‡ (208.962) (6.171)† (208.410)
38 5.495 7,702.429 6.295 7,679.520 6.520 7,700.774 (5.087) (2,461.496)‡ (5.116) (2,434.669)‡ (5.157) (2,430.594)‡
402 -20.328 3,652.028 -19.649 3,608.922 -20.724 3,559.597 (3.441)‡ (1,592.599)† (3.495)‡ (1,585.852)† (3.524)‡ (1,593.218)†
410 -0.152 5,057.474 -0.273 5,048.425 -0.186 5,049.964 (0.978) (221.134)‡ (0.991) (224.236)‡ (0.986) (225.235)‡
413 -0.710 756.357 -0.264 765.016 -0.628 849.414 (1.318) (156.931)‡ (1.321) (159.460)‡ (1.322) (158.807)‡
414 4.574 1,718.740 4.351 1,705.285 4.335 1,733.536 (1.773)‡ (213.487)‡ (1.776)† (213.780)‡ (1.778)† (213.731)‡
424 -2.627 6,730.146 -2.917 6,698.257 -3.609 6,702.187 (1.986) (672.068)‡ (1.995) (668.783)‡ (1.990)* (668.938)‡
426 -3.002 636.718 -2.980 656.189 -4.408 598.782 (4.277) (326.929)* (4.287) (327.021)† (4.282) (325.703)*
427 -4.012 196.338 -3.783 219.835 -4.031 249.868 (0.944)‡ (61.112)‡ (0.942)‡ (63.057)‡ (0.944)‡ (63.367)‡
428 -6.125 1,721.690 (1.033)‡ (213.120)‡
429 -0.462 1,110.507 -0.467 1,131.302 -0.364 1,155.097 (0.812) (70.331)‡ (0.821) (70.390)‡ (0.823) (70.254)‡
435 6.389 676.607 7.167 614.973 6.566 553.476 (3.226)† (238.845)‡ (3.253)† (244.773)† (3.240)† (246.237)†
436 -3.769 4,500.751 -3.790 4,460.302 -3.185 4,535.726 (1.004)‡ (347.089)‡ (1.025)‡ (333.116)‡ (1.023)‡ (331.049)‡
438 -1.283 4,814.027 -1.892 4,946.280 -1.213 4,978.196 (3.902) (704.572)‡ (3.943) (712.805)‡ (3.941) (719.842)‡
440 -2.376 2,798.360 -2.857 2,771.044 -3.573 2,848.715 (2.126) (475.979)‡ (2.144) (476.435)‡ (2.136)* (475.703)‡

104
Table A.7 (Continued)
4 percent Sample 5 percent Sample 6 percent Sample
Dependant Variables: Total Drug
Expenditures
Total Non-Drug
Expenditures Total Drug
Expenditures Dependant Variable
Total Drug Expenditures
Total Non-Drug
Expenditures 441 -6.055 7,835.129 -5.470 7,661.469 -5.968 7,579.262
(3.839) (1,229.745)‡ (3.850) (1,216.154)‡ (3.834) (1,209.420)‡ 442 7.954 3,417.543 8.268 3,412.409
(4.311)* (673.658)‡ (4.332)* (675.751)‡ 443 5.461 695.602 3.926 730.938 2.909 761.975
(5.429) (213.748)‡ (5.274) (215.336)‡ (5.157) (215.097)‡ 444 -0.042 5,056.107 -0.091 5,062.133
(2.226) (399.345)‡ (2.226) (399.643)‡ 447 2.806 1,611.458
(4.173) (384.990)‡ 454 -3.771 2,820.085 -3.698 2,836.105 -3.799 2,812.275
(4.987) (516.014)‡ (4.972) (516.509)‡ (4.959) (514.134)‡ 458 -3.060 818.283
(3.418) (284.105)‡ 459 2.474 615.953
(1.689) (130.042)‡ 514 -3.186 1,556.244
(2.452) (360.118)‡ 531 22.944 409.502
(2.049)‡ (86.734)‡ 578 -2.775 1,980.682 -2.612 1,879.249
(3.766) (418.457)‡ (3.767) (427.547)‡ 586 36.866 5,206.878 36.129 5,268.675
(15.056)† (732.488)‡ (15.092)† (734.947)‡ 593 11.416 853.705 11.050 744.543 10.723 764.088
(2.953)‡ (148.876)‡ (2.978)‡ (160.250)‡ (3.003)‡ (166.064)‡ 600 8.476 385.873 8.218 451.531
(2.755)‡ (168.322)† (2.761)‡ (170.411)‡ 710 1.106 930.527
(3.040) (159.354)‡ 747 -11.279 4,977.037 -11.816 5,092.546 -12.256 5,109.623
(3.108)‡ (818.982)‡ (3.159)‡ (783.820)‡ (3.164)‡ (777.013)‡ 781 4.829 135.979
(2.849)* (94.721) 785 -0.633 883.005 -0.467 822.592 -1.318 828.087
(1.683) (147.241)‡ (1.696) (152.344)‡ (1.711) (155.658)‡ 790 1.503 97.566
(2.171) (89.841)

105
Table A.7 (Continued)
4 percent Sample 5 percent Sample 6 percent Sample
Dependant Variables: Total Drug
Expenditures
Total Non-Drug
Expenditures Total Drug
Expenditures Dependant Variable
Total Drug Expenditures
Total Non-Drug
Expenditures 796 -4.013 -20.152 -4.126 -2.155 -4.162 17.678
(1.130)‡ (44.017) (1.134)‡ (45.892) (1.130)‡ (44.914) V12 -0.580 -723.363 -0.535 -900.371 -0.543 -834.540
(4.033) (358.016)† (4.067) (437.961)† (4.053) (440.807)* V42 36.387 2,238.996 36.032 2,277.779 36.278 2,307.721
(10.940)‡ (528.269)‡ (10.856)‡ (510.605)‡ (10.864)‡ (512.418)‡ V45 -5.528 119.950 -6.075 154.266 -6.140 333.554
(3.458) (175.745) (3.459)* (178.441) (3.476)* (178.289)* V49 4.450 642.078 3.594 609.349 2.909 695.939
(3.778) (119.632)‡ (3.714) (128.308)‡ (3.701) (121.558)‡ V70 11.509 55.673 11.757 27.402
(3.793)‡ (66.065) (3.812)‡ (75.979) V72 6.663 -30.852 6.749 -16.252 6.882 5.129
(1.098)‡ (33.850) (1.100)‡ (36.000) (1.095)‡ (35.365)
Control for Separate “Condition Duration” Dummy Variables
Yes Yes Yes Yes Yes Yes
Control for Separate “Age” Dummy Variables
Yes Yes Yes Yes Yes Yes
Control for Separate “Education Year” Dummy Variables
Yes Yes Yes Yes Yes Yes
Absolute value of robust standard errors in parentheses; * significant at 10%; † significant at 5%; ‡ significant at 1% Note: The estimated coefficients of dummy variables for Condition Duration, Age and Education Year are suppressed.

106
Table A.8
Fluoroquinolones Analysis of Impact on Health Care Expenditures
4 percent Sample 5 percent Sample 6 percent Sample
Dependant Variables:
Total Drug Expenditures
Total Non-Drug
Expenditures
Total Drug Expenditures
Total Non-Drug
Expenditures
Total Drug Expenditures
Total Non-Drug
Expenditures
ICD-9 Codes
005 -2.965 42.490 -3.648 65.008 -6.856 -470.626 (4.087) (137.820) (4.063) (120.384) (4.008)* (137.818)‡
136 4.813 180.422 4.937 159.575 (2.833)* (161.683) (2.879)* (157.570)
185 40.324 1,395.634 40.447 1,658.827 (4.769)‡ (324.878)‡ (4.972)‡ (330.058)‡
380 5.936 -50.564 5.590 -155.284 4.370 -473.155 (2.544)† (65.261) (2.555)† (67.991)† (2.615)* (79.746)‡
5 9.907 390.571 9.651 317.406 3.093 -79.353 (3.610)‡ (138.145)‡ (3.650)‡ (144.948)† (3.670) (158.840)
562 12.045 1,099.323 12.015 1,062.565 10.544 748.592 (2.322)‡ (195.400)‡ (2.376)‡ (193.057)‡ (2.385)‡ (205.052)‡
590 2.345 501.644 2.598 454.488 (1.395)* (85.815)‡ (1.414)* (85.642)‡
592 -2.057 1,188.592 (1.604) (126.254)‡
597 6.385 213.392 8.486 276.404 8.947 -63.626 (6.256) (157.239) (6.411) (158.225)* (5.653) (173.981)
599 1.733 226.340 1.768 210.758 -0.027 -207.809 (1.118) (50.660)‡ (1.127) (49.408)‡ (1.359) (90.348)†
601 10.772 -228.136 9.613 -228.908 5.040 -740.576 (3.315)‡ (119.142)* (3.419)‡ (126.951)* (3.387) (134.098)‡
602 19.278 -368.151 18.624 -287.277 (2.391)‡ (110.693)‡ (2.526)‡ (116.964)†
608 29.562 379.602 28.216 223.782 26.287 -248.165 (6.928)‡ (164.787)† (6.874)‡ (171.766) (6.865)‡ (187.822)
614 6.793 319.453 (2.241)‡ (83.949)‡
682 15.906 1,232.305 (2.867)‡ (144.888)‡
730 3.068 1,730.777 2.947 1,694.970 0.375 1,163.738 (5.032) (582.862)‡ (5.003) (576.723)‡ (4.824) (565.818)†
Control for Separate “Condition Duration” Dummy Variables
Yes Yes Yes Yes Yes Yes

107
Table A.8 (Continued)
4 percent Sample 5 percent Sample 6 percent Sample
Dependant Variables:
Total Drug Expenditures
Total Non-Drug
Expenditures
Total Drug Expenditures
Total Non-Drug
Expenditures
Total Drug Expenditures
Total Non-Drug
Expenditures
Control for Separate “Age” Dummy Variables
Yes Yes Yes Yes Yes Yes
Control for Separate “Education Year” Dummy Variables
Yes Yes Yes Yes Yes Yes
Absolute value of robust standard errors in parentheses; * significant at 10%; † significant at 5%; ‡ significant at 1% Note: The estimated coefficients of dummy variables for Condition Duration, Age and Education Year are suppressed.

108
VITA
Zeynal Karaca Address: Department of Economics, Texas A&M University College Station, TX, 77843 Email: [email protected] Web: http://www.zeynalkaraca.com Phone: 979.845.7353 Cell: 979.571.4015 EDUCATION Texas A&M University at College Station, Ph.D., Economics, August 2007. Field of Specialization: Health Economics, Empirical Industrial Organization and Applied Econometrics. Bilkent University, M.A., Economics, 2001, Ankara, Turkey. Bilkent University, B.S., Industrial Engineering, 1999, Ankara, Turkey.