Embed Size (px)
Citation preview

Essays on Credit Rating Agencies and the
Assessment of Sovereign Risk
Dissertation
zur Erlangung des Grades eines Doktors der
wirtschaftlichen Staatswissenschaften
(Dr. rer. pol.)
des Fachbereichs Rechts- und Wirtschaftswissenschaften
der Johannes Gutenberg-Universität Mainz
vorgelegt von
Bernhard Bartels, Magister Artium
in Mainz
vorgelegt am 12. Februar 2015

Contents
1 Introduction 1
2 Misleading Incentives in the Rating Industry 8
2.1 Introduction . . . . . . . . . . . . . . . . . . . . . . . . . . . . . . . . . . . . 8
2.2 The Oligopolistic Market Structure . . . . . . . . . . . . . . . . . . . . . . . 9
2.3 The "Issuer-pays" Model . . . . . . . . . . . . . . . . . . . . . . . . . . . . . 10
2.4 No Fear of Reputation Loss . . . . . . . . . . . . . . . . . . . . . . . . . . . 11
2.5 The "Revolving Door" . . . . . . . . . . . . . . . . . . . . . . . . . . . . . . 12
2.6 The Regulatory Inclusion . . . . . . . . . . . . . . . . . . . . . . . . . . . . 13
2.7 Concluding Remarks . . . . . . . . . . . . . . . . . . . . . . . . . . . . . . . 14
3 Determinants and Impact of Sovereign Ratings 16
3.1 Introduction . . . . . . . . . . . . . . . . . . . . . . . . . . . . . . . . . . . . 16
3.2 Determinants of Sovereign Credit Ratings . . . . . . . . . . . . . . . . . . . 17
3.3 The Impact of Sovereign Ratings on Financial Markets . . . . . . . . . . . . 21
3.4 Real E�ects of Sovereign Rating Announcements . . . . . . . . . . . . . . . 25
3.5 Concluding Remarks . . . . . . . . . . . . . . . . . . . . . . . . . . . . . . . 28
4 Public Debt and Sovereign Ratings 29
4.1 Introduction . . . . . . . . . . . . . . . . . . . . . . . . . . . . . . . . . . . . 29
4.2 Data & Stylized Facts . . . . . . . . . . . . . . . . . . . . . . . . . . . . . . 32
4.3 Empirical Analysis . . . . . . . . . . . . . . . . . . . . . . . . . . . . . . . . 39
4.3.1 Industrialized Countries vs. Emerging Markets . . . . . . . . . . . . 41
4.3.2 Rating and Debt Dynamics in Industrialized Countries . . . . . . . . 48
4.3.3 Debt and Ratings in the European Monetary Union . . . . . . . . . 52
4.4 Concluding Remarks . . . . . . . . . . . . . . . . . . . . . . . . . . . . . . . 55
4.5 Appendix to Chapter 4 . . . . . . . . . . . . . . . . . . . . . . . . . . . . . . 56
5 Why Rating Agencies Disagree on Sovereign Ratings 63
5.1 Introduction . . . . . . . . . . . . . . . . . . . . . . . . . . . . . . . . . . . . 63
5.2 Literature Review . . . . . . . . . . . . . . . . . . . . . . . . . . . . . . . . . 66
ii

5.3 Data and Stylized Facts . . . . . . . . . . . . . . . . . . . . . . . . . . . . . 68
5.4 Determinants of Split Ratings . . . . . . . . . . . . . . . . . . . . . . . . . . 71
5.5 Are Sovereign Ratings Lopsided? . . . . . . . . . . . . . . . . . . . . . . . . 77
5.6 Rating Agency Interaction . . . . . . . . . . . . . . . . . . . . . . . . . . . . 84
5.7 Concluding Remarks . . . . . . . . . . . . . . . . . . . . . . . . . . . . . . . 89
5.8 Appendix to Chapter 5 . . . . . . . . . . . . . . . . . . . . . . . . . . . . . . 92
6 Does the Rating Industry Need Further Reforms? 96
6.1 Introduction . . . . . . . . . . . . . . . . . . . . . . . . . . . . . . . . . . . . 96
6.2 Regulatory Initiatives . . . . . . . . . . . . . . . . . . . . . . . . . . . . . . 97
6.2.1 Rating Agency Regulation in the EU . . . . . . . . . . . . . . . . . . 97
6.2.2 Rating Agency Regulation in the U.S. . . . . . . . . . . . . . . . . . 99
6.2.3 Alternative Compensation Models (GAO Report) . . . . . . . . . . . 101
6.3 Potential Supplements to the Current Regulation . . . . . . . . . . . . . . . 104
6.3.1 The Introduction of Rating Auctions . . . . . . . . . . . . . . . . . . 104
6.3.2 Towards a Decentralized Supply Side . . . . . . . . . . . . . . . . . . 107
6.3.3 Centralized Publication of Ratings . . . . . . . . . . . . . . . . . . . 109
6.3.4 The Use of Investor-paid Rating Services . . . . . . . . . . . . . . . . 111
6.4 Concluding Remarks . . . . . . . . . . . . . . . . . . . . . . . . . . . . . . . 112
6.5 Appendix to Chapter 6 . . . . . . . . . . . . . . . . . . . . . . . . . . . . . . 113
7 Summary of Findings 116
References 119
iii

List of Figures
1 The Debt Privilege . . . . . . . . . . . . . . . . . . . . . . . . . . . . . . . . 33
2 Correlation between Debt and Country Credit Ratings . . . . . . . . . . . . 34
3 CCRs at Di�erent Levels of Debt . . . . . . . . . . . . . . . . . . . . . . . . 35
4 Debt and Ratings in the EMU . . . . . . . . . . . . . . . . . . . . . . . . . . 36
5 Cooks's Distance for Fixed E�ects Estimates . . . . . . . . . . . . . . . . . 47
6 Jackknife Resampling for Fixed E�ects Estimates . . . . . . . . . . . . . . . 47
7 Link between Level and Change in Public Debt and the E�ect on CCR . . . 51
8 Jackknife Resampling for the Interaction Term Full Sample . . . . . . . . . 51
9 Jackknife Resampling for the Interaction Term excl. Greece/Japan . . . . . 52
10 Monte Carlo experiment using Fixed e�ects vs. Di�erence GMM estimator . 62
11 Monte Carlo experiment using Fixed e�ects vs. System GMM estimator . . 62
12 Sovereign Credit Ratings during the Euro Crisis . . . . . . . . . . . . . . . . 65
13 The Rating Process . . . . . . . . . . . . . . . . . . . . . . . . . . . . . . . . 114
iv

List of Tables
1 Empirical Literature on the Determinants of Sovereign Credit Ratings . . . 18
2 Empirical Literature on the Impact of Ratings on Sovereign Bond Markets . 22
3 Empirical Literature on the Impact of Sovereign Ratings on the Corporate
Sector . . . . . . . . . . . . . . . . . . . . . . . . . . . . . . . . . . . . . . . 26
4 Summary Statistics of Control Variables . . . . . . . . . . . . . . . . . . . . 37
5 Industrialized vs. Emerging (OLS) . . . . . . . . . . . . . . . . . . . . . . . 42
6 Industrialized vs. Emerging (OLS Di�) . . . . . . . . . . . . . . . . . . . . . 44
7 Industrialized vs. Emerging (Panel GMM) . . . . . . . . . . . . . . . . . . . 46
8 Ratings in Highly-Indebted Countries (OLS-Di�) . . . . . . . . . . . . . . . 50
9 Debt Coe�cients EMU and Crisis using Di�erence OLS . . . . . . . . . . . 53
10 Country Sample . . . . . . . . . . . . . . . . . . . . . . . . . . . . . . . . . . 57
11 Country Sample EMU . . . . . . . . . . . . . . . . . . . . . . . . . . . . . . 58
12 Variance Decomposition . . . . . . . . . . . . . . . . . . . . . . . . . . . . . 58
13 Contingency Tables . . . . . . . . . . . . . . . . . . . . . . . . . . . . . . . . 59
14 Industrialized vs. Emerging (OLS lagged 1 year) . . . . . . . . . . . . . . . 60
15 Debt and Ratings in EMU (OLS Di�) . . . . . . . . . . . . . . . . . . . . . 61
16 Classi�cation of Ratings . . . . . . . . . . . . . . . . . . . . . . . . . . . . . 70
17 Split Ratings across Rating Agencies . . . . . . . . . . . . . . . . . . . . . . 71
18 Split Ratings across Regions . . . . . . . . . . . . . . . . . . . . . . . . . . . 72
19 Split Ratings AAA vs. Non-AAA . . . . . . . . . . . . . . . . . . . . . . . . 75
20 Split Ratings Speculative vs. Investment Grade . . . . . . . . . . . . . . . . 76
21 Mean Comparison of Ratings to the World . . . . . . . . . . . . . . . . . . . 78
22 Mean Comparison of Ratings within the Euro Area . . . . . . . . . . . . . . 78
23 No. of Negative Deviations towards other CRAs . . . . . . . . . . . . . . . 80
24 No. of Positive Deviations towards other CRAs . . . . . . . . . . . . . . . . 81
25 Probit Results for a Negative Bias . . . . . . . . . . . . . . . . . . . . . . . 82
26 Probit Results for a Positive Bias . . . . . . . . . . . . . . . . . . . . . . . . 83
27 Number of Up- and Downgrades . . . . . . . . . . . . . . . . . . . . . . . . 85
28 Downgrade Interaction . . . . . . . . . . . . . . . . . . . . . . . . . . . . . . 86
v

29 Upgrade Interaction . . . . . . . . . . . . . . . . . . . . . . . . . . . . . . . 88
30 Country Table 1999-2012 . . . . . . . . . . . . . . . . . . . . . . . . . . . . . 92
31 Rating Transformation . . . . . . . . . . . . . . . . . . . . . . . . . . . . . . 93
32 Classi�cation of Ratings . . . . . . . . . . . . . . . . . . . . . . . . . . . . . 94
33 Descriptive Statistics . . . . . . . . . . . . . . . . . . . . . . . . . . . . . . . 95
34 GAO Proposals . . . . . . . . . . . . . . . . . . . . . . . . . . . . . . . . . . 115
vi

1 INTRODUCTION 1
1 Introduction
The rating industry was born in the beginning of the 20th century resulting from the in-
creasing use of bond markets by (initially) railroad companies and governments. At the
time, investment banks and credit-reporting agencies were engaged as intermediaries be-
tween issuers and investors. Credit quality was mainly assessed by the use of personal
relations among creditors (for instance by recommendation letters) or qualitative analyses
(rating reports consisting of �nancial and operating statistics) (Sylla (2002)). In conse-
quence of the increasing bond market, Moody's and Poor's introduced a more convenient
quantitative measure by providing a letter-based rating. Later on, the breakdown of the
Bretton Woods System led to the introduction of free-�oating exchange rates and opening
capital markets. Investors began to look for international investment projects and con-
tributed to an ever increasing importance of the rating agencies who o�ered them an easily
comparable measure of credit risk for various asset classes on a global level. In line with
this development, regulatory authorities began to incorporate the ratings into regulation
(Sylla (2002)).
Since then, a handful of credit rating agencies rate bond and security issues on a global
level: In its Annual Report to Congress in December 2013, the SEC (U.S. Securities and
Exchange Commission) stated that Standard & Poor's (S&P) alone had 1,143,300 ratings
outstanding in the previous year being followed by Moody's (923,000) and Fitch (350,000).
Thereby, the so called "Big Three" have accounted for 96.5% of all outstanding ratings in
2012 (SEC (2013)). This said, one should keep in mind that the overall dollar amounts of
issuance - in particular on the market for structured �nance products - collapsed dramati-
cally after 2006 (the volume of Asset Backed Securities only in the United States dropped
from a high of USD900 bn. in 2006 to USD200 bn. in 2011 (SEC (2012))).
Given their importance, the same three agencies have been exposed to a barrage of
criticism, especially since the outbreak of the �nancial crisis in 2007. Policy-makers and
public observers have called into question whether rating changes have been assigned in a
timely, accurate and transparent fashion. Also, academics have paid particular attention
to the role and behavior of the agencies: In particular, the industry has been accused
1 INTRODUCTION 2
of insu�cient competition and con�icts of interest (Eij�nger (2012)). Others blame the
agencies for being subject to a home bias and for a pro-cyclical ampli�cation of crises (Fuchs
and Gehring (2013), Ferri et al. (1999), Gaertner et al. (2011)). The U.S. government and
the EU Commission have responded to the criticism by rearranging regulatory frameworks
and by trying to set more incentives for competition among agencies and thereby reducing
the overall reliance on ratings (see chapter six for details).
However, the rating industry is linked to more �elds of economic research than cur-
rently discussed. Aside from the recent academic response to the �nancial crisis, rating
agencies have been in the focus of economists for many years. The major areas of economic
research on credit rating agencies (CRAs) are presented below.
To begin with, their role as information intermediary between issuers and investors has
often been studied in microeconomic theory. Speci�cally, the main proponents ask whether
CRAs increase general economic welfare by reducing asymmetric information. The bulk
of literature argues that an intermediary supports the �ow of information by serving as a
"focal point" and even without the need of providing any new information for investors
(Boot et al. (2006), Parlour and Rajan (2014)). Contrary to their argument, Donaldson
and Piacentino (2014) claim that the mechanistic use of (precise) credit ratings leads to
less risk-sharing and therefore to a welfare loss among investors and fund managers because
the latter will provide less insurance in the contract. The idea behind is that an investor
(principal) delegates his funds to an asset manager (agent) who invests those funds in a
certain project. If the projects are rated, the asset manager writes a contract with the
pay-o� being contingent on a later assigned credit rating instead of providing insurance.
Thereby, the risk is redirected to the investor. Hence, the authors suggest that rating
agencies should at least publish less accurate ratings in order to incentivize asset managers
to provide loss insurance.
The same strand of literature has paid particular attention to the question which types
of contracts between the di�erent parties (and the government) may be welfare-enhancing
for society, i.e. help to reduce con�icts of interest. The issues most widely discussed are
whether investors or issuers should pay the agencies (Bolton et al. (2012), Jiang et al.
(2012)) and which kind of regulation should be applied (Opp et al. (2013)). Also, au-

1 INTRODUCTION 3
thors discuss the role of switching analysts between issuers and rating agencies ("revolving
doors") (Bar-Isaac and Shapiro (2011)). In general, the majority of studies supports the
view that the CRAs contribute to social welfare, however, at the same time they are critical
of the current institutional setup.
Apart from the microeconomic focus, the credit rating industry is linked to the eco-
nomics of industrial organization. The fact that only three large agencies have rated more
than 90% of the world's issuers for now more than 80 years led to a series of research pa-
pers on potential market failure due to the oligopolistic market structure (Leland and Pyle
(1977), White (2010), Mathis et al. (2009)). However, it is widely debated whether the
oligopolistic market structure is a consequence of regulation (White (2010)), past reputa-
tion gains (Covitz and Harrison (2003)) or the issuer-pays structure (Bolton et al. (2012)).
Other authors claim that increasing competition even leads to less e�cient outcomes due
to rating in�ation and rating shopping behavior (Mathis et al. (2009), Bolton et al. (2012))
when agencies assign better ratings in exchange for a higher rating fee.
More recently, the rating industry has also attracted �nancial economists' attention.
The latest studies seek to explore the contribution of rating agencies to the outbreak of the
�nancial crisis (Opp et al. (2013), Kisgen and Strahan (2010), Ghent et al. (2014)). Other
strands of the literature have tested the importance of ratings for a �rm's cost of capital,
the capital structure or the lending and investment activity of (�nancial) �rms (Bruno et al.
(2013) among others). Beyond that, the literature studies the relative performance of rating
agencies in the corporate and �nancial sector. Performance is measured by comparing
timeliness and anticipation of defaults (Hill and Fa� (2010), Güttler and Wahrenburg
(2007)) or by looking at the response to rating changes by investors and by a comparison
of abnormal returns for the clients (Bruno et al. (2013)).
In this thesis, the major focus is on sovereign ratings. Apart from their impact on
�nancial and non-�nancial �rms, sovereign ratings are often at the top when CRAs create
ratings for banks and other resident corporate issuers.1 Also, sovereign rating changes
receive critical attention by the media and by government o�cials of a�ected countries.
Not least the sovereign debt crisis in Southern Europe has revived the debate on the
1Please refer to chapter 3 for details.
1 INTRODUCTION 4
adequacy and timing of sovereign credit ratings when the peripheral members of the euro
area were confronted with a series of downgrades (de Haan and Amtenbrink (2011)). Also,
empirical studies claim that re�nancing costs of governments are often a�ected by changes
in the foreign currency rating (Hand et al. (1992), Afonso et al. (2012)). Finally, the
rating decision on a sovereign is often shown to have repercussions on the creditworthiness
of �rms, regional states and local municipalities within the country and neighbors with
strong economic or political ties to the a�ected country (Borensztein et al. (2013), Adelino
and Ferreira (2014)).
This thesis begins with a summary of the literature on misleading incentives within the
rating industry in chapter two. Following, I provide a review of the literature on determi-
nants and the impact of sovereign ratings in particular. The fourth chapter explores the
link between public debt and sovereign ratings. In chapter �ve, I test di�erent explana-
tions for disagreement towards sovereign creditworthiness. In the �nal part, I review the
recently adopted reforms for the rating industry and discuss potential amendments.
Chapter two deals with misleading incentives in the rating industry. Against the back-
ground that the measurement of rating agency performance is only possible with a su�-
ciently long history of default in a particular asset class, it is challenging to put criticism
against rating agencies on solid ground. However, the collapse of the market for structured
�nance products has led to a series of publications with a strong focus on rating agency
performance. In this chapter, I provide a systematic summary of the mentioned �aws
within the rating industry. The major �nding is that potential �aws in the rating industry
primarily refer to the rating market for structured �nance products - and not to sovereign
ratings - due to their complexity and high fees.
Chapter three is subdivided into three parts. It �rst gives an overview of the major
raters of sovereign risk and their used methodology. In the second part, the literature on
the importance of sovereign ratings for �nancial markets is presented. Finally, I review the
impact of ratings on the real sector.
The main �ndings can be summarized as follows: Sovereign ratings have a crucial in�uence
on �nancial markets and the real sector alike. The impact on �nancial markets is shown
to be quite robust in the long-term and more disputed in the short-term. The literature

1 INTRODUCTION 5
provides further evidence to suggest that the e�ects on the real sector are partly driven by
self-imposed regulation of rating agencies (besides other factors such as access to foreign
capital or a higher future tax burden).
Chapter four (co-authored work with Constantin Weiser) studies the relative impor-
tance of sovereign debt for a country's credit rating. Here, we use the Institutional In-
vestor's Country Credit Rating (CCR) which is based on semi-annual surveys among ma-
jor sovereign bondholders. We distinguish between three country groups: industrialized
vs. emerging market countries, highly-indebted industrialized countries vs. other indus-
trialized countries and members of the euro area vs. other industrialized countries. The
empirical analysis is linked to previous research across the three country groups: Reinhart
et al. (2003) �nd that as a consequence of structural weaknesses and a history of defaults
industrialized countries are less vulnerable to surges in foreign debt than emerging mar-
kets and developing countries ("debt intolerance"). In this chapter, we test their result by
employing Panel GMM and di�erence OLS methods. Our second group comparison builds
on the �ndings by Ghosh et al. (2013) who show that industrialized countries with a high
level of public debt are more likely to experience a high de�cit in times of an economic
slowdown which in turn leads them to suddenly reach a debt limit when public �nances
become unsustainable. We test whether sovereign ratings mirror these developments. The
third group comparison is motivated by studies which �nd di�erences in sovereign credit-
worthiness for members of a currency union compared to countries with an independent
national monetary authority. Here, the authors �nd that euro area members have su�ered
from a decline in creditworthiness (since the outbreak of the crisis) which cannot be fully
explained by economic fundamentals (Gaertner et al. (2011), Dell'Erba et al. (2013)). In
this chapter, we study whether this result is con�rmed when we use di�erences instead of
levels.
For the �rst group comparison, we �nd no signi�cant di�erence in the reaction of ratings
to changes in public debt between industrialized and emerging markets. We even observe
a rating penalty for advanced countries when we control for the ability to issue debt in the
domestic currency. For the second group comparison, our results reveal that countries with
high de�cits and high levels of public debt at the same time are subject to an additional

1 INTRODUCTION 6
rating penalty. Our �ndings for members of the euro area suggest that sovereigns in the
euro periphery bene�ted from the common currency until 2008 but experienced stronger
downgrades than other countries (core economies and other advanced countries) during
the crisis (controlling for other fundamentals).
Chapter �ve addresses the disagreement among four rating agencies towards sovereign
risk. We test whether disagreement is determined by speci�c fundamentals, regions or
by the type of rating agency (issuer- versus investor-paid). At �rst sight, this seems
to be a di�cult task since sovereign ratings often remain constant for a long period of
time (especially in advanced economies) and sovereign default rates are low compared
to corporate defaults. Besides few exceptions, as for instance Alsakka and ap Gwilym
(2010) the literature only provides evidence for disagreement towards corporate issuers (see
for instance Güttler and Wahrenburg (2007)). However, our descriptive data show that
disagreement on sovereign ratings is more pronounced than one might assume. Speci�cally,
we �nd that a small European rating agency (called Feri) disagrees with the Big Three in
almost every second case (average country-year observation). Add to this, the Big Three
agencies have often been accused of pro-cyclical downgrades and a tendency to assign the
same rating to an issuer as their competitor (Ferri et al. (1999), Beck and Wienert (2010)).
Thus, sovereign ratings are far from being non-controversial.
In this chapter, I �rst examine whether a rating agency rates particular regions better
than others (controlling for other political and macroeconomic determinants). Next, I
test whether the propensity to downgrade a country's rating signi�cantly increases when a
competitor has assigned a previous downgrade. Here, I control for other explanations such
as publicly observable changes in creditworthiness during the previous months.
I �nd that Feri seems to put more weight on short-term variables than the Big Three. This
observation can also explain why I observe a higher frequency of rating changes in the case
of Feri relative to the Big Three. I do not �nd signi�cant e�ects for the agencies assigning
di�erent ratings to their residency. Also, the home country's language and the business
model has no signi�cant e�ect on split ratings. However, in the case of the Big Three I
�nd that the propensity to downgrade a country's rating signi�cantly increases if one of
the other two has assigned a downgrade in the previous months. In contrast to this, Feri

1 INTRODUCTION 7
seems to be more independent in its rating decisions.
Chapter six discusses three possible amendments to the current regulation of the rating
industry: First, an auction process is proposed in order to prevent potential con�icts of
interest when issuers pay raters. Second, I suggest to promote a more decentralized supply
side and third, I introduce a centralized publication of ratings in order to mitigate pro-
cyclical announcements. Thereby, a clear distinction is made between sovereigns ratings
and the ratings for structured �nance products. Whereas the �rst two amendments seem
to be particular relevant for the ratings of structured �nance products, I consider the
centralized publication process to be a relevant policy option for sovereign ratings in order
to mitigate pro-cyclicality.

2 MISLEADING INCENTIVES IN THE RATING INDUSTRY 8
2 Misleading Incentives in the Rating Industry
2.1 Introduction
In principle, the role of a credit rating agency (CRA) is to serve as an information interme-
diary between borrowers and lenders: It collects, aggregates and distributes information
about the creditworthiness of countries, �rms and structured products such as Mortgage
Backed Securities (MBS) or Collateralized Debt Obligations (CDO). This information is
used by �nancial markets to form decisions about buying or selling debt from the rated
entities. Boot et al. (2006) show that CRAs are important for �nancial markets because
they serve as "focal points" by simplifying and accelerating the �ow of information from
issuers to investors. Thus, the rating industry exerts a considerable in�uence: Numerous
empirical studies have observed that CDS spreads and bond yields are often driven by their
underlying ratings.2
And still, the rating industry is often criticized: CRAs have been blamed for reacting
too late and too harsh in times of crisis (Reinhart (2002), Ferri et al. (1999)), for being
subject to imperfect competition (Bolton et al. (2012), Eij�nger (2012)) and for having
incentives to assign better ratings when they are paid by the rated entities (issuer-pays
model) (Mathis et al. (2009)). Also, analysts have been suspected to be subject to con-
�ict of interests when they are potential candidates to be hired by the rated �rms, i.e.
investment banks (Cornaggia et al. (2013)). Finally, the inclusion of ratings in regula-
tory frameworks may lead to a rating bias and pro-cyclical behavior of CRAs (Opp et al.
(2013)). Thus, it seems that neither the maintenance of the status-quo nor the proposal
to completely forbid the publication of ratings is a reasonable idea.
The chapter is organized as follows: Section two summarizes the literature which in-
vestigates whether the oligopolistic market structure contributes to less accurate ratings.
Afterwards, I present the "Issuer-pays" model and its potential weaknesses before the fear
of reputation loss for CRAs is discussed. Finally, I summarize the literature on "revolving
doors" in the rating industry and show why the use of ratings in regulation may lead to
rating agency failure.
2A detailed literature review on the impact of ratings on �nancial markets is provided in chapter 3.3.

2 MISLEADING INCENTIVES IN THE RATING INDUSTRY 9
2.2 The Oligopolistic Market Structure
With the beginning of the 20th century, the �rst credit rating agency was founded by John
Moody. It was followed by Poor's Publishing Company, the Standard Statistics Company
and Fitch Publishing Company (White (2010)) shortly afterwards. Since then, the three
agencies have controlled the market for ratings across all rated products and across all
countries in the world. Despite a number of mergers and a shift of market shares between
the so called "Big Three", more than 90% of the market is supplied by Standard & Poor's,
Moody's and Fitch Ratings to the present day.
White (2010) mentions two natural entry barriers for potential competitors, namely
economies of scale and reputation. Economies of scale emerge when a rating agency is
established in a certain industry due to past acquisition of expertise. For this agency,
the marginal cost of rating an additional �rm in a speci�c sector should be lower than
for competing newcomers with no experience in this particular area (Leland and Pyle
(1977)). Also reputation prevents competition because investors are interested in reliable
information. Consequently, they will choose those ratings that have a long-standing history.
This makes it di�cult for a newcomer with no opportunity of building up a reputation
beforehand to enter the market.
With the beginning of the 21st century, the amount and complexity of rated products
has increased strongly due to the emergence of structured �nance products. Pagano and
Volpin (2010) show that the issuance of MBS and CDO products has risen tenfold between
2001 and 2006. At the same time the number of rating companies and their sta� remained
almost constant (White (2010), Bar-Isaac and Shapiro (2011)). Not only did the estab-
lished agencies retain their market shares but were able to expand their business activities
simultaneously when they started to rate complex securities.
In principle, one can argue that a lack of competition does not necessarily lead to
eroding rating quality as long as the agencies' behavior is driven by reputation. As soon
as one agency starts to publish inaccurate assessments, it should lose its reputation and
make lower pro�ts when investors decide under rational expectations (Opp et al. (2013)).
However, we will show in the following that other features of the current regulation prevent

2 MISLEADING INCENTIVES IN THE RATING INDUSTRY 10
the reputation channel to work properly in some cases.
2.3 The "Issuer-pays" Model
In the 1970s, the rating industry insisted on a change of its compensation structure. At the
time, CRAs were striving for an alternative to the investor-pays model since they feared
a decline in the willingness to pay on the side of investors. This anxiety was grounded in
the increased availability of photocopy machines leading to an easier distribution of ratings
and consequently to free-riding behavior (Jiang et al. (2012)). In addition, investors cannot
observe the true value of the bought information (future performance of the asset/�rm).
This leads to the so called "lemon" problem, when the market is dominated by those
agencies which o�er poor information to investors. The latter have no possibility to identify
the high-quality rating agency because they are not able to assess the provided information
ex ante. Hence, they pay an average price for ratings. In this case �rms o�ering high
quality information do not receive adequate compensation and leave the market. Thus,
rating quality will erode and �nally the market collapses (Leland and Pyle (1977)).
The introduction of the issuer-pays model has led to other incentive problems, namely
con�icts of interest for credit rating agencies. Mathis et al. (2009) �nd that CRAs in�ate
ratings when they face competition. This result has been con�rmed by numerous studies:
For instance, Jiang et al. (2012) observe that ratings are higher when an agency is paid by
issuers compared to another agency that receives rating fees from the investor's side. Hau
et al. (2013) study the determinants of bank ratings and �nd that better ratings are assigned
to those banks that are potential customers for ancillary services (i.e. ratings for securities
or structured products). In a theoretical framework, Bolton et al. (2012) show that rating
in�ation increases with the fraction of naive investors and low reputation risk. Finally,
Skreta and Veldkamp (2009) �nd that �rms begin to shop for ratings, when assets are
su�ciently complex. Rating shopping occurs when bond issuers observe multiple ratings
and choose the most favorable. Both phenomena - rating in�ation and rating shopping
- are the unintended consequence of the issuer-pays model in which the rating agency is
economically dependent on the issuers.
In their empirical work Becker and Milbourn (2011) show that more competition does

2 MISLEADING INCENTIVES IN THE RATING INDUSTRY 11
not improve ratings when the issuer pays the rating agency. On the contrary, they �nd that
the increasing market share by Fitch Ratings in the previous decade has led to even more
rating shopping and rating in�ation. This result has been con�rmed by Bolton et al. (2012):
The authors claim that incentives for rating shopping will only come up when more than
one CRA exists because then �rms have the possibility to choose the most favorable rating.
From the perspective of social welfare, it would hence be more desirable for investors and
issuers to have a monopolistic structure rather than free market competition (Bolton et al.
(2012)). Thus, it seems that not insu�cient competition is the foremost problem in the
industry but a misleading incentive structure.
2.4 No Fear of Reputation Loss
As mentioned before, the fear of losing reputation should prevent rating agencies from
in�ating their ratings. If one CRA decides to assign better ratings without an observable
decrease in credit risk, it has to take into account the future reputation loss when these
issuers declare bankruptcy. Covitz and Harrison (2003) �nd that reputation concerns
have indeed driven rating agency behavior: For a sample of corporate bond ratings from
1997-2002, they �nd no evidence for a delay of rating changes behind the market when
controlling for the size of a �rm or the downgrade from investment grade to speculative
grade ("fallen angel").
However, Mathis et al. (2009) �nd that reputation loss plays a minor role when it comes
to structured �nance products. In their model, the authors show that rating agencies have
strong incentives to use reputation gains from the past to in�ate ratings. This leads
ultimately to default. After a loss in con�dence and a collapse of issuance, the cycle
starts again. The result coincides with the �ndings of Bar-Isaac and Shapiro (2013): They
consider reputation to be endogenously driven by business cycle developments. This leads
rating agencies to publish less accurate ratings in boom periods than during recessions.
Empirical studies con�rm the above results: Whereas Covitz and Harrison (2003) did
not consider the emergence of structured products during the past ten years, more recent
studies show that rating in�ation is a rather young phenomenon, which is mainly observed
on the market for sub-prime mortgage backed securities (MBS) (Ashcraft et al. (2011),

2 MISLEADING INCENTIVES IN THE RATING INDUSTRY 12
(Stanton and Wallace, 2010)). Bolton et al. (2012) point out that CRAs care even less
about their reputation in the case of high entry barriers and when the issuer-pays model
is used. This is in line with the �ndings of Goodhart (2009): The author claims that
reputation is predominantly an issue on the market for structured �nance products for two
reasons: First, it is considered as a new business with high pro�t margins and second, the
product is often rated by only one or two agencies (which are potentially subject to rating
in�ation/ rating shopping).
To sum up, it seems as if rating agencies took care of reputation in the past, but had
less incentives to do so when they began to rate structured �nance products. This seems
to be a consequence of the increased opacity of bonds (uncertainty about underlying loans)
and the higher pro�t margins.
2.5 The "Revolving Door"
When it comes to structured �nance products, rating analysts may also be subject to con-
�icts of interest when the issuer of a rated product is potentially o�ering a more attractive
contract to the analyst. Before the outset of the recent �nancial crisis, investment banks
have often hired credit analysts from the rating agencies which were not able to o�er a
competitive salary (Bar-Isaac and Shapiro (2011)). If issuers are pro�table enough to hire
the best analysts, CRAs would be left with a lower quality of sta� and they have less
incentives to invest in training when the probability of losing the analyst increases. On the
other hand, the analyst has more incentives to provide accurate ratings as a junior when
trying to attract the attention of potential employers. Thus, Bar-Isaac and Shapiro (2011)
conclude that the problem of eroding rating quality arises especially in boom phases when
investment banks have more vacancies than during recessions.
When studying the revolving door e�ects on credit analysts, Cornaggia et al. (2013)
�nd that rating agencies with a transitioning employee (the one using the revolving door)
assigned better ratings to their new employer than non-transitioning analysts of competing
agencies. They conclude that revolving door e�ects have an impact on credit ratings. Using
a sample of 114 transitions, the authors �nd that issuers hire analysts from harsher CRAs,
but that the rating di�erences to competitors is shrinking prior to the recruitment.

2 MISLEADING INCENTIVES IN THE RATING INDUSTRY 13
Again, it seems that this potential con�ict of interest appeared primarily on the market
for structured �nance products before the recent crisis when incentives to earn higher
salaries at an investment bank led to frequent job rotation (Bar-Isaac and Shapiro (2011).
There is no good case to believe that the same e�ect holds when it comes to sovereign
or corporate entities where rating fees are much smaller (or not even paid in the case of
unsolicited ratings).
2.6 The Regulatory Inclusion
In the 1970s, the Securities and Exchange Commission (SEC) started to restrict the entry
of new rating agencies by certifying only the Big Three as National Recognized Statistical
Rating Organizations (NRSROs). During the subsequent 25 years, four other �rms have
received this status (White (2010)). The registration as a certi�ed CRA is of major impor-
tance because only the ratings of NRSROs can be used for regulatory purposes (de Haan
and Amtenbrink (2011)). In the previous decade, the U.S. Congress has responded to the
restricted access for potential NRSROs by changing the statutes of the SEC in order to
allow for more transparency (U.S. Government (2006)). Still, the dominance of the Big
Three has not been touched considerably. If anything, the regulatory inclusion reinforced
the dominant market position of the Big Three with their ratings having a rules-based
in�uence on market participants (White (2010)). A similar regulation can be observed in
Europe: Here, the requirements for equity capital ratios are also based on the ratings of
certi�ed agencies.3 If a rating is downgraded to speculative grade status, pension funds
and other institutional investors may short-sell funds in order to keep the share of risky as-
sets in their portfolio according to internal or external risk management approaches. This
may trigger �re sales leading to pro-cyclical developments and further downgrades (Purda
(2011)).
Added to the pro-cyclical ampli�cation and competition e�ects of ratings' inclusion
into regulation, Opp et al. (2013) show that rating in�ation may also be a consequence
of their inclusion into regulation: In contrast to Bolton et al. (2012) they assume that
3The banking regulation of Basel II allows bank to choose between the standardized approach or thebasis of the internal ratings based approach. When using the latter, banks are not required to use externalratings.
2 MISLEADING INCENTIVES IN THE RATING INDUSTRY 14
investors have rational expectations and anticipate rating in�ation by the agencies. In
their model, an increase in the rating from junk status to investment grade (de�ned as
the regulatory advantage) diminishes incentives for CRAs to acquire costly information
about the issuer's credit quality. Investors do not scrutinize in�ated ratings because they
also bene�t from the regulatory advantage by the opportunity to acquire investment grade
bonds. Irrespective of the true underlyling credit risk, the investor may use the opportunity
to have a more diversi�ed portfolio without additional capital requirements. This e�ect
is especially pronounced for products with high information costs (i.e. CDOs, MBS).
Kisgen and Strahan (2010) con�rmed the theoretical result when they observed that the
certi�cation of a fourth rating agency, namely the Canadian rating agency "Dominion
Bond Rating Services" (DBRS) led to a signi�cant reduction of yields for those �rms that
received better ratings by DBRS than by the Big Three. The e�ect is stronger when
�rms are near to the investment-grade cut o� towards junk status. However, when DBRS
assigned a lower rating than other NRSROs, the authors found no change in the bond
yields of the respective �rm. It seems that investors only wait for one NRSRO to publish
an investment-grade rating before starting to buy the respective asset.
2.7 Concluding Remarks
This chapter has summarized the literature on potential market failures in the rating in-
dustry due to misleading incentives. Two results are worth highlighting in the context
of this thesis: First, the potential �aws seem to be linked with each other: For instance,
the issuer-pays problem would be less severe if the fear of reputation loss determined the
behavior of rating agencies. Also, the use of ratings in regulation creates an additional
market entry barrier for newcomers which may further undermine the fear of reputation
loss.
Second, the described �aws do not uniformly apply to the various asset classes: It seems
that especially structured �nance products have been subject to most of the incentive
problems due to the fact that these products are especially complex and provided high
pro�t margins. As opposed to this, corporate and sovereign issuers appear to be more
transparent in terms of information availability and provide less incentives for "revolving

2 MISLEADING INCENTIVES IN THE RATING INDUSTRY 15
doors" and rating in�ation- or rating shopping-behavior due to lower rating fees. Thus, a
potential future regulation should focus primarily on the issuers and raters of structured
�nance products. A detailed review of the new regulation and remaining challenges - espe-
cially with regards to the inter-linkage of the aforementioned �aws - is provided in chapter
six.
Although sovereign ratings are obviously less a�ected by the issuer-pays problem and "re-
volving doors", the Big Three agencies have often been criticized for being subject to a
home bias. Also, their ratings are used in regulation which may lead to spillovers across
rating agencies in the case of downgrades. In chapter �ve, I will discuss these issues in
more detail by studying the determinants of sovereign rating disagreement across credit
rating agencies.
The following three chapters deal speci�cally with sovereign risk. To begin with, I pro-
vide a rationale why sovereign ratings play in important role not only for the respective
governments but also for �nancial markets and the real sector of an economy.

3 DETERMINANTS AND IMPACT OF SOVEREIGN RATINGS 16
3 Determinants and Impact of Sovereign Ratings
3.1 Introduction
It seems impossible to imagine �nancial markets without the rating industry: By providing
quality signals for traded bonds and securities, they not only give direction to the buying
decision of investors but they also in�uence �rm behavior by monitoring (and sanctioning)
performance. If a rating agency expects a �rm's credit quality to deteriorate, it may
exert pressure on the management to change its strategy in order to prevent a downgrade
(by imposing a credit watch or negative outlook). Moreover, regulatory authorities have
distributed additional competencies to the rating industry by including the ratings of
certi�ed agencies into regulatory frameworks. Thereby, institutional investors may not be
willing but are sometimes required to sell certain assets when rating decisions trigger a
binding regulatory provision (for instance, pension funds may only hold a �xed share of
speculative grade bonds). Facing the in�uence of CRAs through regulatory inclusion,
White (2010) concludes that rating agencies have "attained the force of law". Taken
together, the rating industry has an undisputed impact on the decisions of issuers and
investors.
Despite the fact that observers agree on the rating industry's in�uence, it is still widely
debated whether rating decisions add value in providing new information to �nancial mar-
kets which is not already re�ected in market prices (bond yield spreads, CDS spreads, stock
market indices or exchange rates). In other words, CRAs are in�uential but they do not
necessarily contribute to an e�cient matching between issuer and investor. In particular,
during times of crises the rating industry has been accused of being responsible for delayed
downgrades which led to pro-cyclical ampli�cations of recessions.
Apart from this, the literature has also discussed the range of rating decisions by exploring
potential spillover e�ects to other countries. For example, the European sovereign debt
crisis has shown that a downgrade of one country quickly led to rising yield spreads in
other member states of the currency union. The same phenomenon has already been dis-
cussed during the Asian Crisis in the 1990s when CRAs were blamed for having aggravated
the economic situation by being overly conservative (Ferri et al. (1999)). The literature

3 DETERMINANTS AND IMPACT OF SOVEREIGN RATINGS 17
also emphasizes the fact that regulatory provisions may even amplify a potentially wrong
decision by inducing �re sales (Reisen (2002), Ellul et al. (2011)).
In this chapter, it is �rst explained what sovereign credit ratings are and how they are
formed by the agencies. In this context, the thesis summarizes the literature on determi-
nants of sovereign credit ratings in order to highlight the most prominent variables used
by the agencies to form their decisions.
The second part of this chapter addresses the impact of rating decisions on the econ-
omy. Thereby, I distinguish between two types of in�uence: First, I explore the ratings'
impact on sovereign interest rates, bond yield spreads and CDS spreads. Whereas it is
not controversial that sovereign ratings are negatively correlated with market prices, it
is more di�cult to identify causation in either direction. Thus, one needs an empirical
model accounting for omitted variable bias when ratings and markets respond to the same
underlying fundamentals. Next, it is asked whether sovereign downgrades spill over to
the real sector, for instance by a�ecting the bank lending channel, stock markets and cor-
porate spreads. This question also requires the use of good instruments because both a
rating downgrade and a decline in corporate risk are often driven by the same economic
fundamentals. Thus, one has to account for potential endogeneity.
3.2 Determinants of Sovereign Credit Ratings
In general, sovereign credit ratings are supposed to "pertain to a sovereign's ability and
willingness to service �nancial obligations to non-o�cial (in other words, commercial)
creditors." (Standard and Poor's (2013)). This statement by Standard & Poor's is similar
in kind across all Big Three rating agencies. However, each agency uses a di�erent set of
political and economic performance criteria to re�ect the ability and willingness to service
public debt.
First, they all agree on three key rating factors, namely the institutional and political
stance, the economic strength, and public �nances. Fitch Ratings and Standard & Poor's
add an external score and S&P's alone also uses a monetary score. Moody's uses an event

3 DETERMINANTS AND IMPACT OF SOVEREIGN RATINGS 18
Table 1: Empirical Literature on the Determinants of Sovereign Credit Ratings
(1) (2) (3) (4)Authors Sample Methodology Expl. variables
Cantor and Packer(1996)
49 countries inSep. 1995
Cross-Section, OLS GDP p.c (+), GDPgrowth (+), in�ation(-), external debt (+),industrialized country(IMF de�nition) (+),default history (-)4
Haque et al. (1996) 60 developingcountries(1980-1993)
OLS with �xede�ects
reserves to imports (+),current account balance(+), export structure,international interestrates (+)
Mulder and Montfort(2000)
20 emergingmarkets(1995-1999)
Dynamicspeci�cation (errorcorrection model)
crisis indicators (-),exports (+), reale�ective exchange rate(+) in the long-run,random walk in theshort-term
Borio and Packer(2004)
52 countries(1996-2003)
OLS with�xed/random e�ects
Original Sin (-),Currency Mismatch (-),Debt intolerance (-)
Butler and Fauver(2006)
86 countries(2004)
Cross-Section, OLS legal environmentvariables (politicalstability(+), rule of law(+), regulatory quality(+), corruption (-))
Afonso et al. (2011) 78-130 countries(1995-2005)
OLS with randome�ects + orderedprobit
Gov. e�ectiveness (+),reserves (+), EUmembership (+)
Celasun and Harms(2011)
65 countries(1980-2005)
Panel GMM, OLS(with �xed e�ects)
private share ofexternal debt (+)

3 DETERMINANTS AND IMPACT OF SOVEREIGN RATINGS 19
risk score which entails risk assessments in the �nancial, external, and political sector.5
Second, the agencies emphasize that their ratings always consist of a quantitative and
qualitative component. This said, it is not possible to only refer to the quantitative score
models but one has to take into account that the agencies give ample scope for �exibility.
Accordingly, broad literature on the determinants of sovereign credit ratings is available
(see Table 1 for a summary of the main �ndings).
Third, the agencies distinguish between a local and a foreign currency rating whereby the
former refers to debt issued in local currency and the latter to debt issuance in foreign
currency.6 In the following chapters, the thesis will always relate to the "foreign currency
rating" when using the term "sovereign rating". Local currency ratings are of minor
importance, especially in emerging markets where governments often do not even have the
ability to issue bonds in domestic currency.
The �rst empirical study on determinants of sovereign credit ratings has been published
by Cantor and Packer (1996). Their most important �nding has been that most of the
cross-country variation in rating levels can be explained by few macroeconomic factors.7
Later studies have con�rmed that GDP per capita, in�ation, public debt and a country's
default history remain among the most important determinants of ratings when expanding
the sample size (across years and countries) and when exploiting within country variation.
Building on these results, Mulder and Montfort (2000) conducted a panel analysis and
showed that ratings also reveal a high degree of inertia and often follow a random walk apart
from their reaction to structural factors. Besides, the authors emphasize that countries
have been often downgraded during times of crisis when they performed below expectations.
In line with Reinhart (2002) and Ferri et al. (1999), the authors claim that ratings decline
when the real e�ective exchange rate depreciates although it is usually considered to be
an indicator for external recovery whereas the real appreciation was meant to be an early
warning signal for an upcoming crisis.
5For details, please refer to the most recent publications on the used methodologies by Standard andPoor's (2013), Moody's (2013), Fitch (2014).
6A third category of sovereign ratings refers to speci�c bonds which depart from the ordinary bondissued, for instance by the fact that they often entail a third-party guarantee in case of default (forinstance the IMF, EU).
7A more con�ned review of the determinants of sovereign credit ratings will be provided in chapter 4of this thesis.
3 DETERMINANTS AND IMPACT OF SOVEREIGN RATINGS 20
On the contrary, Afonso et al. (2012) �nd that one year previous to default no such
country has ever enjoyed an investment grade rating. Also Reinhart (2002) shows that
rating agencies have done a much better job in predicting sovereign debt crises in emerging
markets than in forecasting currency crises. The author claims that CRAs have ignored
indicators of liquidity, currency misalignment, and asset price behavior. Still, lagged down-
grades of emerging markets' ratings should not only be regarded as a late response but
also as an anticipation of a sovereign default which often has been preceded by currency
crises. Kaminsky and Schmukler (2002) �nd that the impact of ratings during crises on
the Emerging Markets Bond Index spread (EMBI) is almost twice as large as in non-crisis
periods. Also changes in outlook which have shown to be insigni�cant in tranquil times
became signi�cant in a crisis (see also Hill and Fa� (2010)). Mora (2006) presents a dif-
ferent view by emphasizing the long-term orientation of CRAs which leads them to adjust
a rating only when the di�erence between the estimated and the actual creditworthiness
has become su�ciently large. For instance, the author shows that the rating of a country
in default has often not even been rated as such. In line with the late reaction in a crisis,
CRAs continue to assign relatively low ratings in the aftermath of crises. Mora (2006)
considers this behavior to be an indication for rating agencies to serve merely as providers
of long-term risk assessors than as predictors of crises.
The Big Three themselves have rejected the criticism of reacting too late during times
of crisis by emphasizing their policy of providing stable assessments of future credit risk
independent of business-cycle developments. For instance, Fitch Ratings uses a sovereign
rating model which is stated to be "a sovereign default model, which generates a predicted
Long-Term IDR [Issuer Default Rating; note by the author] rather than a probability of
default." (Fitch (2014)). Moody's also emphasizes that they give more importance to the
long-term stability of a rating than to its short-term accuracy (Moody's (2006)).
In a more recent study by Afonso et al. (2011) the authors di�erentiate between short-
term (contemporary) and long-term (3-year-average) determinants of ratings and �nd that
either explain part of the variation across the Big Three. Whereas changes in GDP per
capita, GDP growth, government debt and the �scal balance are found to have a short-run
impact, government e�ectiveness, external debt, foreign reserves and the default history

3 DETERMINANTS AND IMPACT OF SOVEREIGN RATINGS 21
determine ratings in the long-run. Their models correctly predict the ratings of 40% of
their sample and 75% of the up- and downgrades. Hence, the authors consider this a
good model performance in the light of the agencies' statements to also use qualitative
assessments and forecasting models for future economic performance.
Taken together, it seems that ratings are usually very stable for a long period of time
which makes them at the same time rather weak indicators for an upcoming crisis (in
terms of observing a previous downgrade). Also, most studies agree that ratings re�ect the
institutional and economic performance across countries quite well. Thus, it seems that on
the one hand, ratings do not serve as a good short-term predictor of crises but on the other
hand they are a well-performing tool to study sovereign risk di�erences across countries in
the long-term. In the following, it is to be explored how much attention sovereign rating
changes receive from markets.
3.3 The Impact of Sovereign Ratings on Financial Markets
Empirical studies on the relationship between sovereign ratings and �nancial market vari-
ables are generally motivated by two separate questions: One strand of the literature asks
whether the markets or the rating agencies are better informed about the underlying credit
risk of sovereigns or the other way around (see for instance Cavallo et al. (2013)). Others
put emphasis on the question whether sovereign rating assignments have spillover e�ects
on �nancial market variables of related sovereign entities (Gande and Parsley (2005)). This
issue has recently attracted even more attention with globalization having led to enhanced
integration, especially regarding �nancial and capital �ows. International portfolios and
investment strategies thus depend on adequate information regarding the range and cov-
erage of a rating (for instance, how much importance is given to idiosyncratic components
relative to (international) market conditions).
Empirical evidence with respect to the question of causality is mixed: First, the ma-
jority of studies �nds that causality runs in both directions (see Table 2). It appears that
CRAs often lag behind markets during times of crisis (in particular the Asian crisis and
the European sovereign debt crisis). Nevertheless, the rating actions (although appearing
often late) still lead to abnormal returns of sovereign CDS spreads and bond yield spreads:

3 DETERMINANTS AND IMPACT OF SOVEREIGN RATINGS 22
Table 2: Empirical Literature on the Impact of Ratings on Sovereign Bond Markets
(1) (2) (3) (4) (5)Authors Dep. Variables Sample Methodology Results
Cantor and Packer(1996)
relative sovereigndollar yieldspreads
79 announcements(1987-94)
EventStudy
Bi-directional
Reisen andVon Maltzan (1999)
relative sovereigndollar yieldspreads
152 announcements(1989-97)
EventStudy &Grangertest
Bi-directional
Kaminsky andSchmukler (2002)
EMBI spreads,yield spreads
16 emerging markets& 103announcements(1990-2000)
Panel &Eventstudy
Spillovere�ects &bi-directional
Gande and Parsley(2005)
Sovereign yieldspreads of othercountries
155 rating events in34 countries(1991-2000)
EventStudy
Spillovere�ects inthe caseof DG
Kräussl (2005) emerging marketsinterest rates(among others)
302 rating events in28 countries(1997-2000)
EventStudy
Signi�cante�ects ofDG onspreads
Ismailescu and Kazemi(2010)
CDS spreads 161 rating events &22 emerging markets(2001-2009)
EventStudy
Spillovere�ects inthe caseof UG
Arezki et al. (2011) CDS spreads,banking &insurancesub-indices
71 announcementsin Europeancountries (2006-10)
VARanalysis
Spillovere�ects(mostly)in caseof DG
Afonso et al. (2012) Sovereign bondyields, CDSspreads and stockreturns
167-252 ratingannouncements inEU countries(1995-2010)
EventStudy &Grangertest
Bi-directional,spillovere�ects(strongerfor DG)

3 DETERMINANTS AND IMPACT OF SOVEREIGN RATINGS 23
Cavallo et al. (2013) show that they do contain new information for markets. Also Afonso
et al. (2012) �nd that rating announcements in the EU have been anticipated 1-2 weeks
before the event. In general, it remains di�cult to assess the performance of CRAs with
respect to sovereign ratings because of the limited number of sovereign defaults relative
to corporate default rates. Therefore, most analyses of sovereign rating performance are
restricted to crisis periods (with few or even no defaults on debt). Hill and Fa� (2010) �nd
that negative watch and outlook decisions have a large negative and signi�cant e�ect on
spreads prior and independent of the occurrence of a later crisis. However, the e�ect fails
to be signi�cant when only downgrades are considered and crisis periods are excluded.
The literature also concludes that the impact of negative announcements on markets
has been stronger than that of positive assignments. Afonso et al. (2012) assume that this
di�erence is driven by the loss aversion of investors or the fact that good news are often
leaked by governments before the rating change occurs whereas the same o�cials are more
reluctant to do so in the case of bad news (Hand et al. (1992)). On the contrary, Boot
et al. (2006) argue that the reaction is due to the di�erent information content. They show
that the information contained in upgrades is typically smaller than the added value for
investors if negative credit watches interact with subsequent rating changes. This is mainly
due to the fact that �rms receive a signal by rating agencies encouraging them to undertake
more e�ort and thereby enhancing the credit quality within a �xed period of time (period
between credit watch assignment and �nal rating decision) which is only observable by the
rating agency. This theoretical idea has been tested empirically by Bannier and Hirsch
(2010) who �nd that especially lower rated issuers are put under pressure to improve their
credit quality after a negative watch assignment. This also explains why outlooks and credit
watches lead to more accentuated responses on �nancial markets than changes of the rating
itself (Kaminsky and Schmukler (2002)). However, by using a di�erent methodology to
identify the information content of ratings, Cavallo et al. (2013) �nd no signi�cant di�erence
between up- and downgrades.
Third, the literature o�ers empirical evidence towards spillover e�ects of sovereign
announcements to other countries. Kaminsky and Schmukler (2002) were among the �rst to
assess the spillover e�ects of sovereign announcements on other emerging market economies.

3 DETERMINANTS AND IMPACT OF SOVEREIGN RATINGS 24
They �nd that spillover e�ects are more likely at the regional level and during times of
crisis. Also, less transparent countries are more a�ected by rating changes to a related
sovereign than transparent ones. Afonso et al. (2012) state that the size of the spillover
depends on the respective �nancial market variable (no e�ect on CDS but strong e�ect on
yield spreads) and on the distance in relative credit quality. If a country enjoys better credit
quality than the event country, it is more vulnerable to experience a rise in spreads than
a country with a lower credit quality. Finally, countries with weak �scal positions have a
higher probability to be a�ected by spillovers. Kräussl (2005) and Arezki et al. (2011) �nd
that spillover e�ects are more likely to be observed in the case of negative announcements
whereas Ismailescu and Kazemi (2010) show exactly the opposite. Moreover, Arezki et al.
(2011) and Hill and Fa� (2010) show that the size of the spillover also depends on the type
of announcement and the rating agency from which the announcement originates. For
instance, Arezki et al. (2011) argue that outlook revisions have negative spillovers to other
countries whereas a downgrade has positive spillovers. They explain these contradicting
�ndings with regulatory provisions: Whereas a downgrade can trigger a binding regulatory
provision, the outlook revision has no such consequences. Of course, the in�uence of a
rating change is contingent on whether it has a regulatory consequence. Besides the capital
adequacy ratios from the Capital Requirements Directive (CRD) in the EU, pension funds
are required to hold a �xed share of investment grade rated assets and the European
Central Bank only accepts bonds as collateral if these are rated above BBB-. By contrast,
Cavallo et al. (2013) �nd no supportive evidence for di�erent market reactions to rating
changes at the gap between investment- and speculative grade status.
The empirical studies also present results on the relative impact CRAs have on markets.
Afonso et al. (2012) �nd that in the case of negative decisions S&P's rating announcements
have the largest signi�cant impact on sovereign yield spreads. They claim that this is due to
the fact that the agency in most cases precedes Fitch's and Moody's downgrades. However,
if it comes to the persistence of the reaction to a rating change, Moody's has the strongest
in�uence. Hill and Fa� (2010) come to similar results: S&P's provides most timely ratings
and has the largest in�uence in times of crisis. They are also more active outside crisis
periods towards IMF non-advanced countries whereas Moody's is shown to lead among

3 DETERMINANTS AND IMPACT OF SOVEREIGN RATINGS 25
IMF advanced countries.
3.4 Real E�ects of Sovereign Rating Announcements
Apart from the direct in�uence of ratings on sovereign yield spreads and spillovers on other
countries' creditworthiness, the literature has also studied the impact of sovereign ratings
on the real economy. This section begins by identifying the main channels through which
rating changes may spread to (non-�nancial) �rms. Kaminsky and Schmukler (2002) argue
that a sovereign downgrade adversely a�ects stock markets in the respective country due
to imminent tax increases for the traded �rms in order to re-balance the public budget.
Brooks et al. (2004) motivate their study by the increased globalization of markets which
has led investors and fund managers to focus more on the understanding of the underlying
country risk when they hold stocks of local companies. When motivating their analysis, the
authors do not present a channel which links sovereign to corporate risk within the country.
Instead, they argue that the higher share of foreign investors gives more importance to the
sovereign rating when deciding about the holding of a local stock than national investors.
Ferreira and Gama (2007) add that a sovereign downgrade often leads to a tightening of
foreign borrowing conditions which also a�ects domestic �rms negatively.
Another important channel has �rst been investigated by Borensztein et al. (2013) who
study the e�ect of a country's downgrade on (non-�nancial) �rm ratings at the sovereign
ceiling. For a long time, the rating agencies have followed a policy that has restricted
the best possible rating of a �rm by the rating of its home country. Although rating
agencies have gradually been moving away from such a policy (for instance S&P in the
case of Argentina) the authors claim that the rating industry still considers the sovereign
rating to be an important signal for corporate ratings. That is to say, if this e�ect remains
when one controls for the macroeconomic environment, �rm-level indicators of risk and
the above-mentioned channels, the corporate sector is subject to a negative externality
induced by the rating industry or regulation.8
The main �ndings of the literature on the in�uence of sovereign ratings on the cor-
8Ferreira and Gama (2007) mention the standardized approach in the Basel II accord as an example for�nancial institutions being obliged to receive a risk weight one rating category below that of its countryof residency.

3 DETERMINANTS AND IMPACT OF SOVEREIGN RATINGS 26
Table 3: Empirical Literature on the Impact of Sovereign Ratings on the Corporate Sector
(1) (2) (3) (4)Authors Sample Methodology Expl. variables
Kaminsky andSchmukler (2002)
16 countries(1990-2000)
Event study regional stock markets(only DG) (-), strongerduring crises & innon-transparentcountries
Brooks et al. (2004) max. 69 countries(1973-2000)
Event study national stock market(only DG) (-)
Ferreira and Gama(2007)
29 countries(1989-2003)
Event study spillover on othercountries' stockmarkets, stronger whenclose neighbor andemerging marketcountry
Trebesch et al. (2010) 1828 �rm-yearobservations inmajor emergingmarkets(1993-2007)
OLS with �xede�ects
positive e�ect of ratingson external corporateborrowing and equityissuance
Almeida et al. (2013) (non-�nancial)55,422 �rms in 80countries(1990-2012)
OLS with �xede�ects, di�erence-in-di�erences
�rms at the sovereignceiling receive higherbond yields andinvestment contractionthan lower-rated �rms
Borensztein et al.(2013)
478(non-�nancial)corporations in29 countries(1995-2009)
OLS with �xede�ects,non-parametricanalysis
corporate ratingsdepend on sovereignratings (when �rms arerated at the sovereignceiling)
Adelino and Ferreira(2014)
53 banks in 25countries(1989-2012)
OLS with �xede�ects, logitestimation,Two-Stage LeastSquares
sovereign downgradesleads to lower growthand level of (domesticand foreign) loans givenout by banks (whichare downgraded at thesovereign bound)

3 DETERMINANTS AND IMPACT OF SOVEREIGN RATINGS 27
porate sector can be summarized as follows: First, the impact on national stock markets
is found to be signi�cant in cases of downgrades and especially in emerging markets and
non-transparent countries. Also the presence of a crisis ampli�es the negative e�ect of a
sovereign downgrade on stock markets (also across regions and neighbor countries) (see
Table 3). Further, the e�ect is shown to be more pronounced in traded-goods sectors and
small industries (Ferreira and Gama (2007)). In contrast to the other studies, Brooks et al.
(2004) do not �nd a stronger e�ect of downgrades on resident stock markets in emerging
markets than in advanced economies. Whereas the above mentioned studies use event-
study methods to identify the impact of ratings on stock markets, Trebesch et al. (2010)
instead focus on the volume of external corporate borrowing and equity issuance directly.
By applying OLS with �xed e�ects the authors �nd that ratings for emerging markets have
a positive impact on both indicators.
The above literature mainly uses the event-study methodology in order to identify the
impact of rating changes on stock markets. This procedure seems to be adequate in order
to control for omitted variable bias but on the other hand, it is di�cult to identify the
channels through which the transmission is released. More recent studies try to �ll this gap
by exploiting the sovereign ceiling policy (Borensztein et al. (2013), Adelino and Ferreira
(2014)). Firms are divided into two groups according to whether they enjoy a rating at
the sovereign ceiling or below. If now a sovereign downgrade is assigned, the rating agency
is supposed to downgrade all those �rms which previously received the same rating as
the sovereign regardless of the perceived credit risk. Borensztein et al. (2013) show that
this policy is still widely applied with the e�ect being pronounced in emerging market
economies and for �rms producing non-tradable goods. Besides, the in�uence of sovereign
ceiling policies is stronger in countries with capital account controls and high political risk.
This in turn speaks in favor of an abolition of sovereign ceiling policies since globalization
has led to a constant reduction of capital account controls worldwide (Borensztein et al.
(2013)). Adelino and Ferreira (2014) build on these results by asking whether the sovereign
ceiling policies are also relevant for banks. Beyond that, they explore whether a�ected
banks give out a lower amount of loans. By splitting the sample of banks into two groups
(treated banks are rated at the sovereign ceiling) the authors �nd that treated institutions

3 DETERMINANTS AND IMPACT OF SOVEREIGN RATINGS 28
reduce lending by 30% more than their counterparts in the control group. They also show
that these banks charge higher prices for giving out loans than control banks (17-45 basis
points). This result is worth highlighting because it shows that a reduction in bank lending
is not necessarily driven by the demand side or by deteriorating macroeconomic conditions.
When ignoring the sovereign ceiling, one should expect that the lower rated banks (below
the sovereign ceiling) experience at least the same decline in lending as the better rated
banks. Here, the authors show that the sovereign downgrade alone has an independent
negative e�ect on initially better rated banks (and thereby indirectly on the real economy).
3.5 Concluding Remarks
The previous literature review on rating criteria and their impact on markets has shown
that ratings primarily serve for long-term assessments of credit risk and not as short-term
indicators of crises. This �nding seems to be surprising against the background that CRAs
de�ne their ratings as a measure of the respective country's default risk. However, their
long-term orientation leads them to put more weight on variables which do not serve as
early warning signals for an upcoming crisis. Then again, the rating industry has never
rated a defaulting entity with an investment-grade rating at the time of the default. This
said, one may consider a sovereign credit rating as a rather rough measure of credit risk
with a long-term focus. Institutional investors may then limit their sovereign exposure
after (at least) one agency considers a country to perform below investment-grade.
After all, most studies con�rm that sovereign ratings are considered to be important by
�nancial markets. Whether this is due to their inclusion in regulatory frameworks or the
provision of new information remains however unclear. Over the course of this thesis, I
seek to contribute to the above results of the literature by shedding more light on this issue
by addressing the disagreement of rating agencies towards sovereign risk. Before, the next
chapter deals with the sensitivity of sovereign ratings towards changes in public debt.

4 PUBLIC DEBT AND SOVEREIGN RATINGS 29
4 Public Debt and Sovereign Ratings - Do Industrialized
Countries Enjoy a Privilege?9
4.1 Introduction
In the past, advanced economies have enjoyed continuous access to capital markets, never
scrutinizing their general creditworthiness. This has been re�ected by credit ratings which
remained virtually unchanged on a high level. On the contrary, emerging markets were
relatively often confronted with a sharp decline of their ratings leading to restricted access
to capital markets and eventually to sovereign debt crises.
In this chapter, we contribute to the literature about the relation between sovereign
creditworthiness and public debt. By using historical survey data from the Institutional
Investor magazine, we ask three questions: First, do industrialized countries enjoy a debt
privilege relative to emerging markets? Second, are advanced countries with high public
debt ratios treated di�erently than those with low and medium debt levels? And �nally,
do euro area members receive a debt privilege or a debt penalty compared to non-euro
area members?
The �rst question has already been asked 10 years ago by Borio and Packer (2004)
who found that emerging markets' credit ratings are more sensitive to changes in public
debt than those of advanced economies. Most prominently, Reinhart et al. (2003), Eichen-
green et al. (2007) concentrated on the phenomena of debt intolerance, the original sin and
currency mismatches to explain the di�erence between ratings in developed and emerging
economies/ developing countries. Whereas debt intolerance is often considered as a mea-
sure for country risk, the original sin and currency mismatches are rather considered as
currency risks.
The original sin hypothesis maintains that the lack of capital �ows from advanced to de-
veloping countries is a result of the poorer countries' inability to issue debt in their own
currency. As a consequence, they are vulnerable to exchange rate depreciation making it
9This chapter is based on co-authored work with Constantin Weiser (Doctoral Researcher at the Chairof Applied Statistics and Econometrics at the Johannes Gutenberg-University Mainz Jakob-Welder-Weg4, 55128 Mainz/Germany, Email: [email protected]) and has been published as a Working Paper inthe IPP Discussion Paper Series of the Gutenberg School of Management and Economics (GSME).

4 PUBLIC DEBT AND SOVEREIGN RATINGS 30
hard for the a�ected countries to service foreign currency denominated debt. This in turn
leads to lower capital �ows ex ante (Eichengreen et al. (2007)).
Further, sovereigns su�ering from original sin may become vulnerable to currency mis-
matches when they use the same funds to lend in local currency. During more turbulent
times, the exchange rate depreciates and the value of liabilities quickly exceeds the value
of assets, leading to �nancial and sovereign debt crises. Alternatively, the sovereign may
hold foreign assets in form of reserves in order to prevent currency mismatches. However,
in every case the economy has to incur additional costs compared to a situation in which
it can borrow abroad in its own currency and invest those funds in productive activities
(Eichengreen et al. (2007)).
The idea of debt intolerance o�ers a di�erent approach: Reinhart et al. (2003) explain the
inability of emerging markets and developing countries to accumulate high levels of pub-
lic debt (comparable to the indebtedness of advanced countries' governments) with their
history of defaults and high in�ation. Due to weaker institutions the governments often
experience external defaults after surges in debt ratios during a boom phase. The authors
argue that internal factors like corruption, policy-induced macroeconomic stability or less
developed �nancial systems prevent access to foreign debt markets (Reinhart et al. (2003)).
To sum up, it seems to be non-controversial that governments of advanced countries enjoy
better ratings than emerging markets. However, the dynamics of this rating advanatage
have not yet been thoroughly discussed.
Likewise, the heterogeneity of sovereign creditworthiness across advanced countries has
been rarely examined. In the following, we provide two rationales why the relation between
creditworthiness and public debt might have changed within the industrialized world.
First, public debt ratios in industrialized countries have been considered as sustainable
for a long time. According to Bohn (1998), the United States have followed a path of
sustainable �scal policy between 1916-1995 by satisfying a prede�ned intertemporal budget
constraint. This result has also been con�rmed for European countries by Afonso and
Rault (2010). However, in a more recent study, Ghosh et al. (2013) show that �scal space
- de�ned as the di�erence between the current debt ratio and the debt limit - does not
decrease proportionally with higher levels of government debt but rather follows a cubic

4 PUBLIC DEBT AND SOVEREIGN RATINGS 31
trend. A sovereign may be able to �nance high debt ratios with low interest rates for some
time before re�nancing costs suddenly increase when a negative �scal shock occurs. This
phenomenon is triggered by the so called "�scal fatigue" when the primary balance of a
country responds more slowly to rising debt ratios than the interest-growth di�erential.
Besides, empirical �ndings on the impact of debt on growth are still contradictory: Whereas
Reinhart and Rogo� (2010) �nd that economic growth is negatively a�ected when debt
ratios exceed 90% of GDP, Panizza and Presbitero (2014) observe no causal relation when
they control for endogeneity. Add to this, the current debate about the introduction of a
Sovereign Debt Restructuring Mechanism in the euro area points to a general change in
the perception of default risk in advanced countries (Buchheit et al. (2013)). In line with
the idea of "�scal fatigue" by Ghosh et al. (2013), we will study how ratings respond to
de�cits at high ratios of public debt to GDP.
Second, the privilege might emerge as a consequence of the membership in a currency
union. The monetary uni�cation in Europe has led to signi�cantly lower interest rates in
some member countries who have bene�ted from the import of a credible monetary policy
and the common bond market has also contributed to a higher liquidity of the issued bonds
(Pagano and von Thadden (2004)).10 Thus, it has become more attractive for governments
to issue new debt, in particular for those with large stocks of public liabilities.
Otherwise, one could argue that the membership has led to lower overall ratings for its
members with countries being no longer able to issue debt in domestic currency (original
sin hypothesis). Dell'Erba et al. (2013) test this hypothesis and �nd that EMU members
experience higher interest rates with increasing debt ratios compared to other advanced
countries. Bernoth et al. (2012) use data of primary market spreads for European govern-
ment bonds between 1993 and 2009 in order to explore whether euro members have to incur
an additional risk premium on public debt because they lost monetary independence. In
contrast to Dell'Erba et al. (2013), the authors �nd no signi�cant increase of interest rate
spreads after the start of EMU. Thus, it is yet an open question whether the membership
in the euro area has led to a debt privilege or a penalty.
10Although interest rates have converged strongly in the early years of EMU, bonds have never becomeperfect substitutes due to small di�erences in liquidity and risk perception (Christiansen (2007), Ehrmannet al. (2011)).

4 PUBLIC DEBT AND SOVEREIGN RATINGS 32
Our results point to the non-existence of a debt privilege relative to emerging markets.
We even observe a debt penalty for the industrialized world when we control for their
ability to issue debt in the own currency. Further, advanced countries with high ratios of
public debt are subject to an additional penalty when debt ratios exhibit a negative trend.
Finally, we �nd that members of the euro area periphery enjoyed an (albeit insigni�cant)
debt privilege before the crisis which turned into a penalty after 2008.
The remainder of this chapter is organized as follows. Section two gives an overview of
the data and presents some stylized facts. Section three presents the empirical framework
and discusses the results. Section four concludes.
4.2 Data & Stylized Facts
In the empirical analysis, we use country-level data of 18 advanced and 17 emerging market
economies ranging from 1993-2012 (unbalanced panel, see Table 10 in the Appendix of this
chapter). Following Reinhart et al. (2003) and others (Haque et al. (1996), Celasun and
Harms (2011)), the Institutional Investor's country credit rating (CCR) is our dependent
variable and serves as a proxy for the perceived creditworthiness of investors. The index is
based on weighted survey data of senior economists and sovereign-risk analysts of the 75-
100 leading �nancial institutions being reported twice a year (in March and September).11
Ratings are running on a scale from 0-100, with 0 representing the least creditworthiness
of a sovereign.
In our view, the survey variable o�ers three considerable advantages compared to other
measures of sovereign creditworthiness: First, the country credit ratings provide a more
segmented scale compared to the CRAs' ratings. The fact that the ratings of the Big Three
have remained constant for many years makes it di�cult to measure (smaller) changes in
perceived creditworthiness especially in the industrialized world. For instance, it is im-
possible to study small changes to the perception of credit risk in countries like Germany
which have enjoyed a AAA rating (or slightly below) by the Big Three agencies for many
years. However, the sovereign debt crisis in Europe has shown that initially investment-
11The responses are weighted according to the institutions' global exposure (for details see the descriptionby the Institutional Investor magazine).

4 PUBLIC DEBT AND SOVEREIGN RATINGS 33
grade rated countries may experience a sudden decline to speculative grade status within
a few months (Greece, Portugal, Ireland). Overall, we �nd a strong correlation of the
CCRs with the Big Three agencies in our sample when using Spearman's rank correlation
coe�cient (with a ρ of 0.94-0.96).
Second, credit rating agencies (CRAs) are currently subject to a lot of criticism regard-
ing their business model and timing with regards to sovereign ratings (Eij�nger (2012),
de Haan and Amtenbrink (2011)). By studying the condensed assessment of sovereign risk
analysts, one may consider the CCR as an unbiased credit risk assessment of the coun-
tries' creditors. Also, rating decisions by the Big Three receive more attention by �nancial
markets and therefore may often initiate market reactions (changes in interest rates) and
thereby cause problems of endogeneity.12
Third, the survey data used in this study are not biased by the application of a speci�c
rating algorithm and it is not skewed by inclusion into regulatory frameworks (Opp et al.
(2013)).
Figure 1: The Debt Privilege
(a) Sovereign Ratings across Country Groups (b) Government Debt across Country Groups
Data Source: International Monetary Fund (IMF), Institutional Investor
In the left-hand panel of Figure 1, we show the development of CCRs over time and
compare it with the dynamics of public debt across advanced and emerging economies
(right-hand panel). Obviously, economic fundamentals declined strongly especially in the
industrialized world during the �nancial crisis: Public debt ratios have increased by 30%
12Chapter 2.3 of this thesis provides a detailed discussion of the literature on sovereign ratings and�nancial markets.

4 PUBLIC DEBT AND SOVEREIGN RATINGS 34
in advanced economies whereas emerging markets were able to reduce their debt ratios by
20% during the past ten years. Still, advanced countries have received considerably better
ratings by investors until recently.
Figure 2: Correlation between Debt and Country Credit Ratings
Data Source: International Monetary Fund (IMF), Institutional Investor
However, if we compare the correlation between general government debt to GDP with
the CCRs across country groups and time (see Figure 2) it appears that the perception
of sovereign creditworthiness across the two groups has changed. Clearly, one can observe
that higher debt ratios are always related to lower ratings for emerging markets whereas
industrialized countries enjoy only a slight negative or even positive correlation between
public debt and creditworthiness. This result is in line with previous �ndings in the litera-
ture (see for instance Dell'Erba et al. (2013) and De Grauwe and Ji (2013)). However, this
relationship has changed during the previous ten years: The correlation became negative
for the industrialized world in 2003 and has strongly decreased since then (to -0.3 in 2012).
Euro area economies seem to have been even stronger a�ected than other industrialized
countries (gap between the solid and the dashed black line). The more recent literature
provides also empirical support to this �nding: Greenlaw et al. (2013) show that debt levels
of more than 80% of GDP in advanced economies lead to strong �scal deterioration and
rising yields when interest rates are not held constant. The opposite is true for emerging

4 PUBLIC DEBT AND SOVEREIGN RATINGS 35
markets: They have experienced a positive trend in the correlation between public debt
and ratings although heterogeneity across countries remains substantial. In the following
empirical analysis, we will study whether this relationship also holds when we test the
relationship by using a multivariate framework.
In the second part of the analysis, we focus on debt sustainability by exploring whether
highly indebted countries experience an additional rating penalty compared to other ad-
vanced economies. The left-hand panel of Figure 3 shows that CCR levels are on average
six points lower when countries' debt ratios increase from 60% to 90% of GDP. However,
Figure 3: CCRs at Di�erent Levels of Debt
(a) CCRs at high levels of debt (b) Changes in CCRs at high levels of debt
Data Source: International Monetary Fund (IMF), Institutional Investor
some countries seem to be able to increase their debt ratios even further (more than 120%
of GDP) without any additional downgrades. The right-hand panel of Figure 3 shows that
countries with debt levels above 60% are facing an average decline in CCRs by -0.5 rising
to -0.9 (-2.1) points with debt ratios being equal and above 90% (120%) of GDP. Taking
the two pictures together, it seems surprising that the highest indebted countries still enjoy
favourable ratings but at the same time they are subject to the largest downgrades. Thus,
we seek to shed more light on the relationship between debt levels and their momentum
in the following analysis.
As a third step, we study whether monetary integration in Europe has led to a debt
privilege compared to other industrialized countries. In Figure 4, the left-hand panel shows
the correlation between debt and ratings over time for the GIIPS countries and the rest of

4 PUBLIC DEBT AND SOVEREIGN RATINGS 36
Figure 4: Debt and Ratings in the EMU
(a) Correlation between Debt and CCR (b) Debt levels
Data Source: International Monetary Fund (IMF), Institutional Investor
the euro area.13 The descriptive picture leads us to suggest that with the initiation of the
European integration process, correlation has converged with a common negative trend
despite a decreasing or at least stable public debt ratio until the onset of the crisis (see
right-hand panel). However, in order to analyze this relationship in more detail we have
to proceed with a multivariate analysis.
In order to control for heterogeneity across countries, we will now present an overview
of important macroeconomic determinants of sovereign creditworthiness to be included in
our models.
In the empirical analysis, we only �nd a limited correlation (0.1-0.6) between the macroe-
conomic variables which leads us to assume that multicollinearity is of minor importance.
We decided to refrain from using political variables in our sample due to the fact that the
indices usually remain stable for a long period of time and can therefore be interpreted as a
part of the country �xed e�ect. Moreover, political stability and government e�ectiveness
are highly correlated with GDP per capita.
Our choice of controls largely follows the studies by Cantor and Packer (1996) and
Afonso et al. (2011). Stated below, we provide summary statistics of our set of exogenous
variables (see Table 4). Apart from the variable of main interest - general government debt
(GOVDEBT ) - we use the gross domestic product per capita (GDPPERCAP ) as a proxy
13The core economies are Austria, Belgium, France, Germany and the Netherlands.

4 PUBLIC DEBT AND SOVEREIGN RATINGS 37
Table 4: Summary Statistics of Control Variables
(1) (2) (3) (4) (5)Mean Std dev. Min Max No. obs
Advanced Countries (18 countries)
Full sample 1993-2012
Country Credit Rating 84.4 10.6 19.4 98.2 347
GDP per Capita 31874 11784 9381 67305 347
Government Debt 72.6 36.4 9.7 238 347
Inflation− 4 year avg 2.2 1.4 -0.8 13.8 347
Growth− 4 year avg 2.0 1.8 -6.4 10.5 347
Net Public Balance− 4 year avg -3.0 3.5 -16.2 4.6 347
Current Account− 4 year avg -0.2 4.3 -13.0 10.1 347
Unemployment 7.9 3.7 2.5 25 347
Original Sin 0.18 0.31 0 0.98 347
Emerging Markets (17 countries)
Full sample 1993-2012
Country Credit Rating 53.9 13.6 16.5 81.8 250
GDP per Capita 5895 3674 467 15410 250
Government Debt 43.5 23.0 3.9 165.0 250
Inflation− 4 year avg 7.8 6.7 -0.9 47.7 250
Growth− 4 year avg 4.5 3.0 -4.9 13.0 250
Public Balance− 4 year avg -2.1 2.8 -16.6 7.0 250
Current Account− 4 year avg -0.4 5.2 -7.8 16.0 250
Unemployment 9.0 4.9 2.2 28.2 250
Original Sin 0.73 0.37 0 1 250
Currency Mismatch -0.6 1.0 -5.2 0.8 250

4 PUBLIC DEBT AND SOVEREIGN RATINGS 38
for the tax base and the degree of vulnerability to external shocks of a country. In�ation
(INFLATION) serves as an indicator for monetary and �scal prudence. The coe�cient
is assumed to take either a positive or negative sign because in�ation may on the one hand
reduce the amount of outstanding government debt but can also be an indicator for unsus-
tainable �scal policy. We further include the unemployment rate (UNEMPLOYMENT ).
The coe�cient is expected to be negative with higher social contributions leading to an ad-
ditional �scal burden. In addition, we control for the medium-term economic development
by including GROWTH, the FISCAL BALANCE, and the EXTERNAL BALANCE.
Whereas the �rst two should contribute to a good reputation of the government and in-
crease the government's ability to repay debt, the external balance is expected to have an
ambiguous impact on ratings: If a current account de�cit is driven by net foreign invest-
ment, it is expected to contribute to the growth of a country. Otherwise, the de�cit might
also be signaling over-consumption and a lack of international competitiveness.
We also control for original sin (OSIN) and currency mismatch (MISMATCH).
Given the limited data availability for international debt securities from the BIS, our es-
timations only cover the period 1993-2012. Original sin and currency mismatch serve
as indicators for a country's vulnerability towards external indebtedness. OSIN is con-
structed as one minus the share of international debt securities issued in domestic currency
over total issues of international debt securities by country i. A high value for OSIN sig-
nals that the country is unable to issue domestic debt. For those industrialized countries
with a higher amount of securities issued in domestic currency than their total amount of
international debt securities, we bound this variable at zero.14 MISMATCH is de�ned as
the share of international reserves minus external debt over exports times original sin (see
Eichengreen et al. (2007)). Here, increasing positive values indicate a lower vulnerability
of the country to run out of reserves.
Moreover, we account for times of extreme events like stock market crashes, in�ation
crises, currency crises, and sovereign debt crises by using the dataset by Carmen Reinhart.15
Three of the crises never occurred in industrialized countries within our sample. Hence, we
14For a detailed discussion of the de�nition see Eichengreen et al. (2007)).15see http://www.carmenreinhart.com/data/browse-by-topic/topics/7/

4 PUBLIC DEBT AND SOVEREIGN RATINGS 39
set the dummy variable equal to zero in these cases. The crises events are included in our
models because high debt ratios may not necessarily be the consequence of unsustainable
�scal policy but rather the outcome of a banking or a currency crisis.
4.3 Empirical Analysis
We now turn to explore the determinants of Country Credit Ratings across time and
countries. As a �rst step, we examine the di�erences between advanced and emerging
economies.16 Next, we analyse the dynamics of sovereign ratings in highly indebted coun-
tries. As a third step, we compare the credit risk between members of the European
Monetary Union and other industrialized countries.
We use three speci�cations for each of the three questions. Thereby, we can exploit
both the between- and within-variation of ratings. In Figure 1, we illustrate that the
within-variation is relatively small in advanced economies compared to emerging markets
but has increased strongly since the outbreak of the �nancial crisis. However, although the
Figure shows a converging trend between the two country groups, a persistent gap between
the ratings in advanced and emerging economies remains.
We begin with a static �xed-e�ects model (see equation 1). The cross-sectional dimen-
sion is at the center of our analysis in order to test whether a di�erence in the impact of
public debt on ratings between the respective country groups exists when we control for
di�erences in the macroeconomic stance (captured by x′i,t).
ccri,t = αi + x′i,tβ + γgovdebti,t + εi,t (1)
This model covers both dimensions (between-country and within-country variation) but
may be biased: Due to the fact that most of the variables seem to be non-stationary the
estimated coe�cients can be the result of a spurious correlation. Further, we are subject
to a potential bias when estimating the coe�cients or computing the t-statistics. At the
16Our classi�cation is based on the IMF classi�cation in 2014 and covers only OECD countries. Accordingto the de�nition of the World Bank, we should have also included Poland, Russia and Uruguay in the groupof advanced economies. Here, we follow Ghosh et al. (2013) and Cantor and Packer (1996) by using theIMF/OECD classi�cation.

4 PUBLIC DEBT AND SOVEREIGN RATINGS 40
same time, the advantage of this model is that it uses all information in contrast to the
next model.
The model in di�erences accounts for the non-stationarity of the variables (see equation
2). However, the explanatory power is considerably reduced compared to the model in
levels because the di�erence operator drops all of the between-variation and 50% of the
within-variation of the ccr-variable in our data sample.17 Therefore, the interpretation of
the coe�cients di�ers somewhat from the other models.
∆ccri,t = αi + x′i,tβ + γ∆govdebti,t + εi,t (2)
Here, ∆ denotes the �rst di�erences operator. In comparison to the original time series
the country-�xed e�ect αi can be interpreted as a country speci�c time trend. The vector
xi,t contains the controls, with most of them also included in �rst di�erences (except for
economic growth). This model is the most conservative, since it includes only stationary
time series and therefore we expect neither the occurrence of spurious correlation nor a bias
for the estimates or the inference. This model also takes into account the path dependency
of ratings by assuming a maximum of persistence.
As a third approach, we use a dynamic panel-data speci�cation related to Arellano-
Bond (Di�erence GMM) (equation 3). In order to study the level e�ects (see the large
distance between ratings of advanced and emerging economies in Figure 1) and to avoid
endogeneity problems, we pursue with a dynamic panel estimation by using lagged levels as
instruments. Thereby, we can combine the merits of the �rst two models (namely exploiting
both dimensions and to prevent spurious regressions) by including the lagged dependent
variable as an additional regressor (high explanatory power and robust estimates).18
ccri,t = αiδ1ccri,t−1 + δ2I × ccri,t−1 + x′i,tβ + γgovdebti,t + εi,t (3)
17For details see the variance decomposition in Table 12 of this chapter's Appendix.18Our Di�erence GMM estimator may be ine�cient because this sample entails a large number of periods
relative to the number of countries. Further information about this problem can be found in Figure 10and Figure 11 where we present Monte Carlo simulations for both the Di�erence and the System GMMestimator in comparison with the performance of the �xed e�ects estimator.

4 PUBLIC DEBT AND SOVEREIGN RATINGS 41
4.3.1 Industrialized Countries vs. Emerging Markets
We begin by exploring the size of a potential debt privilege for industrialized countries
against emerging markets. The analysis consists of three di�erent speci�cations: In order
to identify the debt privilege relative to emerging markets, we �rst interact the level of
general government debt with the industrialized country dummy (Debt ∗ Ind. Country)
and include our set of macroeconomic controls. In the second speci�cation we account for
various types of crisis in order to control for situations in which a rating is a�ected by
country-speci�c shocks. Here, we use dummies for banking crises, in�ation crises, currency
crises, stock market crashes, external and domestic debt crises. Crises dummies take the
value one in all years when the respective country is in a crisis and zero for all other
periods. In our third speci�cation we also include OSIN and MISMATCH in order to
study whether a potential privilege is merely driven by the ability of countries to issue
debt in their own currency than by the accumulation of debt in general.
Column 1 of Table 5 shows the results without controlling for crises and original sin/
currency mismatch. We report standardized coe�cients in order to illustrate the relative
impact on ratings across the determinants and include country �xed e�ects and robust
standard errors clustered on the country level.
All coe�cients have the expected sign and we can explain between 80-95% of the
variation in ratings. Still, this result has to be taken with caution, since we observe a
high persistence of ratings across time and countries and we do not yet control for trend
behavior which might drive large parts of the correlation.
Together with GDP per capita, the public debt to GDP ratio explains most of the variation
in ratings. As expected, the coe�cient for government debt is signi�cant and negative. If
the debt ratio increases by 1 standard deviation, CCRs will be between 0.28-0.43 standard
deviations lower.
The interaction term for government debt in industrialized countries is positive but not
signi�cant. We �nd no indication for multicollinearity between the interaction term and
the other control variables. (correlation ranges between -0.48 and 0.39 and the variance
in�ation factor ranges with 0.659 clearly below the critical value of 10). That is to say,

4 PUBLIC DEBT AND SOVEREIGN RATINGS 42
Table 5: Industrialized vs. Emerging (OLS)
(1) (2) (3)Baseline incl. crises incl. debt burden
GDP per capita 0.219∗∗∗ 0.225∗∗∗ 0.199∗∗∗
(0.0392) (0.0393) (0.0369)
In�ation, 4y avg. -0.241∗∗∗ -0.274∗∗∗ -0.230∗∗∗
(0.0386) (0.0495) (0.0530)
Unemployment -0.245∗∗∗ -0.250∗∗∗ -0.255∗∗∗
(0.0468) (0.0508) (0.0481)
External Balance, 4y avg. -0.0217 -0.0234 -0.0230(0.0473) (0.0437) (0.0418)
Growth, 4y avg. 0.0379 0.0362 0.0413(0.0508) (0.0496) (0.0510)
Fiscal Balance, 4y avg. 0.0716∗∗ 0.0490 0.0580∗
(0.0314) (0.0323) (0.0301)
Gen. Gov. Debt -0.243∗∗ -0.296∗∗ -0.278∗∗∗
(0.119) (0.122) (0.0977)
Gen. Gov. Debt * Ind 0.000787 0.0452 0.0618(0.213) (0.200) (0.172)
Stockmarket Crash 0.0221 0.0283(0.0393) (0.0352)
Currency Crisis 0.0997∗ 0.111∗∗
(0.0523) (0.0475)
In�ation Crisis 0.197∗ 0.157(0.113) (0.112)
Domestic Debt Crisis 0.189 0.128(0.235) (0.204)
External Debt Crisis 0.109 0.109(0.202) (0.153)
Banking Crisis -0.0941 -0.0387(0.0635) (0.0516)
Original Sin -0.494∗∗∗
(0.0916)
Curr. Mismatch 0.0102(0.0693)
Constant 0.911∗∗ 0.917∗∗∗ 0.398(0.358) (0.318) (0.323)
Observations 597 597 597Adjusted R2 0.924 0.926 0.937Country FE Yes Yes Yes
Clustered Standard errors in parentheses∗ p < 0.10, ∗∗ p < 0.05, ∗∗∗ p < 0.01

4 PUBLIC DEBT AND SOVEREIGN RATINGS 43
industrialized countries receive no rating advantage relative to emerging markets in levels.
One should keep in mind that the inclusion of country �xed e�ects is of crucial importance
for this result. Here, we capture variables such as the default history and other political
and socio-economic characteristics of a country, which usually remain in place for a long
period of time. If we ignore the country �xed e�ect, our model will lead to a signi�cant
debt privilege for the industrialized countries. The inclusion of crises and original sin/
currency mismatch in columns (2) and (3) do not a�ect this result.
We assume that rating analysts assess the current economic performance and �scal
stance of governments. Thus, we use the contemporaneous values of the independent
variables. However, in order to make sure that our results are robust to the lagged or
updated publication of macroeconomic data, we check whether our results change when
independent variables in levels are lagged by one year. We �nd that the sign and signi�cance
of our main variable of interest (government debt) is not a�ected (see Table 14 of this
chapter's Appendix).
When we use di�erences instead of levels (Table 6), the debt coe�cient for emerging
markets is reduced to -0.1-0.2 standard deviations. Again, industrialized countries do not
enjoy a debt privilege in the �rst two speci�cations. However, we even �nd a signi�cant
debt penalty when we control for original sin and currency mismatch. Thus, if a country
does not have the ability to issue debt in its own currency, an increase in public debt will
lead to higher downgrades.
The inclusion of crises does neither a�ect the debt coe�cient nor the gap between
industrialized and emerging market economies to a signi�cant extent. Surprisingly, stock
market crashes and currency crises have a positive and signi�cant e�ect on a country's
rating. However, if we only include the �rst year of the crisis, the coe�cients become
negative. One may conclude that the quick recovery of ratings after the �rst crisis year
drives this result.
In the dynamic panel, we use di�erence GMM in order to explain the variation among
CCRs. The coe�cients in Table 7 have the same sign, albeit they are smaller in size
compared to the OLS model in levels. This is due to the inclusion of the lagged CCR

4 PUBLIC DEBT AND SOVEREIGN RATINGS 44
Table 6: Industrialized vs. Emerging (OLS Di�)
(1) (2) (3)Baseline incl. crises incl. debt burden
D.GDP per capita 0.0956∗∗∗ 0.0961∗∗∗ 0.0969∗∗∗
(0.0238) (0.0234) (0.0233)
D.In�ation, 4y avg. -0.0168 -0.0181 -0.000351(0.0610) (0.0642) (0.0661)
D.Unemployment -0.176∗∗∗ -0.193∗∗∗ -0.217∗∗∗
(0.0525) (0.0587) (0.0566)
D.External Balance, 4y avg. -0.0305 -0.0147 -0.0185(0.0243) (0.0285) (0.0296)
Growth, 4y avg. 0.374∗∗∗ 0.362∗∗∗ 0.295∗∗∗
(0.0902) (0.0877) (0.0806)
D.Fiscal Balance, 4y avg. 0.0259 0.0328 0.0269(0.0522) (0.0534) (0.0561)
D.Gen. Gov. Debt -0.184∗∗∗ -0.182∗∗∗ -0.127∗∗∗
(0.0335) (0.0352) (0.0296)
D.Gen. Gov. Debt * Ind -0.0488 -0.0232 -0.131∗∗
(0.0509) (0.0523) (0.0588)
Stockmarket Crash 0.113∗ 0.155∗∗
(0.0660) (0.0597)
Currency Crisis 0.250∗∗ 0.261∗∗
(0.0979) (0.101)
In�ation Crisis -0.0804 -0.212(0.388) (0.337)
Domestic Debt Crisis -1.018∗∗ -1.159∗∗
(0.390) (0.432)
External Debt Crisis -0.214 -0.365(0.595) (0.600)
Banking Crisis -0.161 -0.138(0.113) (0.107)
D.Original Sin -0.847∗∗∗
(0.235)
D.Curr. Mismatch 0.673∗∗∗
(0.155)
Constant -0.173∗∗∗ -0.207∗∗∗ -0.116∗∗∗
(0.0429) (0.0535) (0.0397)
Observations 578 578 559Adjusted R2 0.363 0.377 0.419Country FE Yes Yes Yes
Clustered Standard errors in parentheses∗ p < 0.10, ∗∗ p < 0.05, ∗∗∗ p < 0.01
4 PUBLIC DEBT AND SOVEREIGN RATINGS 45
values which explain a large part of the contemporaneous rating. Here, the debt coe�cient
becomes insigni�cant in the third speci�cation when we include the coe�cients for original
sin and currency mismatch. We suppose that this is due to the ine�cient estimator (see
Tables 10 and 11 in the Appendix of this chapter). The interaction term does not show a
signi�cant di�erence between both country groups in our third speci�cation, whereas it is
negative and signi�cant in (2) and (3).
To sum up, we �nd that general government debt ratios explain a large part of the
overall variation in ratings compared to other macroeconomic determinants such as growth
or the �scal balance. This is true for both country groups. Also, being exposed to original
sin seems to be an important predictor of low creditworthiness. These results con�rm
earlier studies which �nd that some industrialized countries have a considerable advantage
of not being exposed to original sin. Apart from this, we do not �nd evidence for a debt
privilege in advanced countries versus emerging economies across all three speci�cations.
Hence, it seems that the macroeconomic di�erences between the two country groups can
fully explain the rating di�erential. This result stands in contrast to the �ndings by Borio
and Packer (2004) who show a debt privilege for advanced countries. However, they used
a di�erent estimation strategy, they did not control for times of crises and their data miss
the last ten years.
As an additional robustness check, we have included a structural break in the year 2003
to replicate the sample period used by former studies. We �nd that the debt privilege is
positive but not signi�cant before 2003 and turns negative afterwards.19
All three empirical models show that institutional investors do not di�er signi�cantly
in their response to changes of government debt across the two country groups. Still, we
have only accounted for cross-country heterogeneity by distinguishing between the two
groups and by including country �xed e�ects. Thereby, one cannot exclude that single
country-year observations or particular countries have a relatively large impact on the
debt coe�cient compared to the rest of the sample. In order to account for these potential
biases we perform two robustness checks.20
19The results including the structural break for the three speci�cations are available on request.20Here, we only discuss the results for the �xed e�ects speci�cation. However, the other robustness
checks are not materially di�erent and available on request.

4 PUBLIC DEBT AND SOVEREIGN RATINGS 46
Table 7: Industrialized vs. Emerging (Panel GMM)
(1) (2) (3)Baseline incl. crises incl. debt burden
L.Rating 0.660∗∗∗ 0.713∗∗∗ 0.253(0.0373) (0.0778) (0.160)
L.Rating * Ind. -0.299∗∗ -0.363 0.00991(0.143) (0.333) (0.523)
GDP per capita 0.0824∗∗∗ 0.0841∗∗∗ -0.0696(0.0206) (0.0221) (0.0757)
In�ation, 4y avg. -0.0822∗∗∗ -0.0648 -0.0987(0.0141) (0.0458) (0.0783)
Unemployment -0.108∗∗∗ -0.116∗∗∗ -0.167∗∗∗
(0.0228) (0.0297) (0.0402)
External Balance, 4y avg. 0.000140 0.0301 -0.0747(0.0242) (0.0382) (0.0537)
Growth, 4y avg. 0.0655∗∗∗ 0.0827∗∗∗ 0.000826(0.0148) (0.0209) (0.0313)
Fiscal Balance, 4y avg. 0.0474∗∗ 0.0149 0.0279(0.0206) (0.0330) (0.0391)
Gen. Gov. Debt -0.120∗∗∗ -0.0820∗ -0.0562(0.0201) (0.0472) (0.0750)
Gen. Gov. Debt * Ind -0.158∗ -0.199∗ -0.332(0.0917) (0.117) (0.234)
Stockmarket Crash 0.0255∗∗ 0.0217(0.00990) (0.0149)
Currency Crisis 0.0248 0.0464∗∗
(0.0175) (0.0237)
In�ation Crisis -0.0788 -0.0724(0.145) (0.234)
Domestic Debt Crisis -0.145 0.243(0.183) (0.240)
External Debt Crisis 0.0215 -0.0240(0.0924) (0.0968)
Banking Crisis -0.0349 -0.00249(0.0242) (0.0263)
Original Sin -0.318(0.414)
Curr. Mismatch 0.296∗
(0.165)
Constant 0.0375 0.0732∗ -0.000550(0.0340) (0.0422) (0.0408)
No. of Observations 521 521 521Sargan Test (p-values) 1.000 1.000 1.000AR1 (p-values) 0.000 0.000 0.063AR2 (p-values) 0.840 0.848 0.182
Standard errors in parentheses∗ p < 0.10, ∗∗ p < 0.05, ∗∗∗ p < 0.01

4 PUBLIC DEBT AND SOVEREIGN RATINGS 47
Figure 5: Cooks's Distance for Fixed E�ects Estimates
Figure 6: Jackknife Resampling for Fixed E�ects Estimates

4 PUBLIC DEBT AND SOVEREIGN RATINGS 48
First, Cook's distance measures the relative impact of a data point on the entire model
(see Figure 5). Here, we �nd that three observations have a relatively large in�uence. Due
to the fact that all three countries (Greece, Brazil and Venezuela) were involved in a debt
crisis during the respective year and we control for debt crises, the abnormality should be
usually captured by the model. Also, the exclusion of the three outliers from the sample
neither has a strong e�ect on the size nor on the sign of our debt coe�cient.
Second, we use the Jackknife procedure as a re-sampling technique to control for the
relative in�uence of a country on the debt coe�cient. Figure 6 shows that our estimated
coe�cient is robust to the exclusion of single countries. The largest deviation is driven
by Chile which leads to a small overestimation of the debt coe�cient (by 0.06 standard
deviations). To sum up, the overall results neither seem to be biased by single observations
nor by a particular country.
4.3.2 Rating and Debt Dynamics in Industrialized Countries
We now turn to study the dynamics of ratings in industrialized countries. According to
our descriptive �ndings in Figure 3, CCRs decline at debt ratios above 90%. However,
no further downgrades are observed at ratios beyond 120% (albeit heterogeneity across
countries increases). In Figure 3, we also displayed the change in ratings for countries with
high levels of public debt. It shows that economies with debt ratios below 60% receive an
average increase in creditworthiness by 0.4 CCR points annually. With debt ratios rising
further, changes in CCRs turn negative and lead to more pronounced penalties up to an
average of 2 points annually.
Taken together with the �ndings in levels, it seems that some highly-indebted countries still
enjoy favorable ratings but the downgrade probability increases with further rising debt.
These �ndings are con�rmed when we sort the observations according to the above/below
median values of changes in the CCR (+0.4 points), government debt (64.4%), and changes
in government debt (+0.02 percentage points). The contingency tables (see Table 13 in
the Appendix of this chapter) con�rm that countries with a debt level above 64% do
not experience stronger downgrades than lower indebted ones. The same holds if we
consider (isolated) changes in government debt. However, when interacting high debt

4 PUBLIC DEBT AND SOVEREIGN RATINGS 49
levels with positive changes in debt, we �nd that the share of country-year observations
with a downgrade of at least -1 percentage point (∆CCR = p(25)) doubles from 9% to 18%.
Corresponding to our descriptive results in section 4.2, we �nd no relationship between the
change in CCR and the change in debt among the 50% percentile of countries with lower
debt levels. This observation is complementary to the work by Ghosh et al. (2013) who
�nd that governments with high debt levels also tend to have larger �scal de�cits resulting
in higher interest rates or even the exclusion from capital markets.
In the following, we turn to our multivariate framework in order to account for the
macroeconomic stance across countries. In the analysis, we only consider the year-on-year
change in the CCR, since we are primarily interested in the change of ratings at di�erent
levels of debt and its momentum.
In Table 8 (column (1)), squared changes of public debt are used as an additional regressor
(again with country �xed e�ects and including macroeconomic controls) in order to test
whether changes of high debt lead to an additional penalty by investors. The sample is
restricted to positive changes in debt levels in order to ensure that only increases in debt
enter the squared term. We observe that the descriptive �ndings are con�rmed: In general,
changes in public debt to GDP led to a lower rating across industrialized countries but we
�nd no additional rating penalty for countries with large changes in debt (the coe�cient
for squared debt is even positive). In column (2), we look at the reaction of CCRs when
the levels of debt ratios are interacted with their annual change. The resulting coe�cient
suggests that indeed those countries receive an additional penalty whose debt level is
associated with a growing one.
Figure 7 illustrates our results in column (2) by showing the rating change for di�erent
combinations of debt levels and changes in debt. The isoquants based on the interaction
term in Table 8 (column 2) reveal that high debt levels interacted with a growing one lead
to additional rating penalties. The convex shape of the isoquants supports the hypothesis
that both high debt levels in combination with high de�cits lead to larger downgrades than
situations in which a government faces either a strong debt increase or has only a high (but
stable) level of debt. For instance, a country with a debt level of 90% of GDP receives a
penalty of -0.86 CCR points whereas a country with 60% receives a penalty of only -0.46

4 PUBLIC DEBT AND SOVEREIGN RATINGS 50
CCR points given it experiences the same rise in public debt of 3%. A sovereign with a
debt level of only 20% does not receive a penalty at all.
The results presented in Table 8 are based on a restricted sample which excludes Greece
and Japan. When using the full sample of industrialized countries, our results basically
remain the same, however, the Jackknife re-sampling (see Figure 8) shows that both tend to
be outliers in the debt dimension - albeit in di�erent directions. Whereas Japan leads to an
underestimated coe�cient (investors seem to be very debt-tolerant in the case of Japan),
the inclusion of Greece leads to an overestimation of the coe�cient (Greece receives a
strong penalty relative to other countries). The Jackknife results for the interaction term
excluding both countries are shown in Figure 9.
Table 8: Ratings in Highly-Indebted Countries (OLS-Di�)
This Table shows the OLS results for the e�ect of changes in government debt on CCRs.The �rst column presents the coe�cient for large increases in government debt and its e�ecton ratings. The second column presents the coe�cient for the interaction between highdebt levels and changes to government debt. We include country �xed e�ects and a set ofmacroeconomic controls. We exclude Greece and Japan because they tend to be outliers inthe debt dimension.
(1) (2)D.Rating D.Rating
D.Gen. Gov. Debt -0.302 0.114(0.176) (0.134)
Gen. Gov. Debt -0.0172(0.0237)
D.Gen. Gov. Debt sq. 0.00674(0.00652)
Gen. Gov. Debt * D.Gov. Debt -0.00447∗∗∗
(0.00141)
Constant -0.314 1.019(0.747) (1.737)
Observations 137 290Adjusted R2 0.321 0.419Country FE Yes Yes
Clustered Standard errors in parentheses∗ p < 0.10, ∗∗ p < 0.05, ∗∗∗ p < 0.01
To sum up, we do �nd that countries with high levels of public debt are subject to
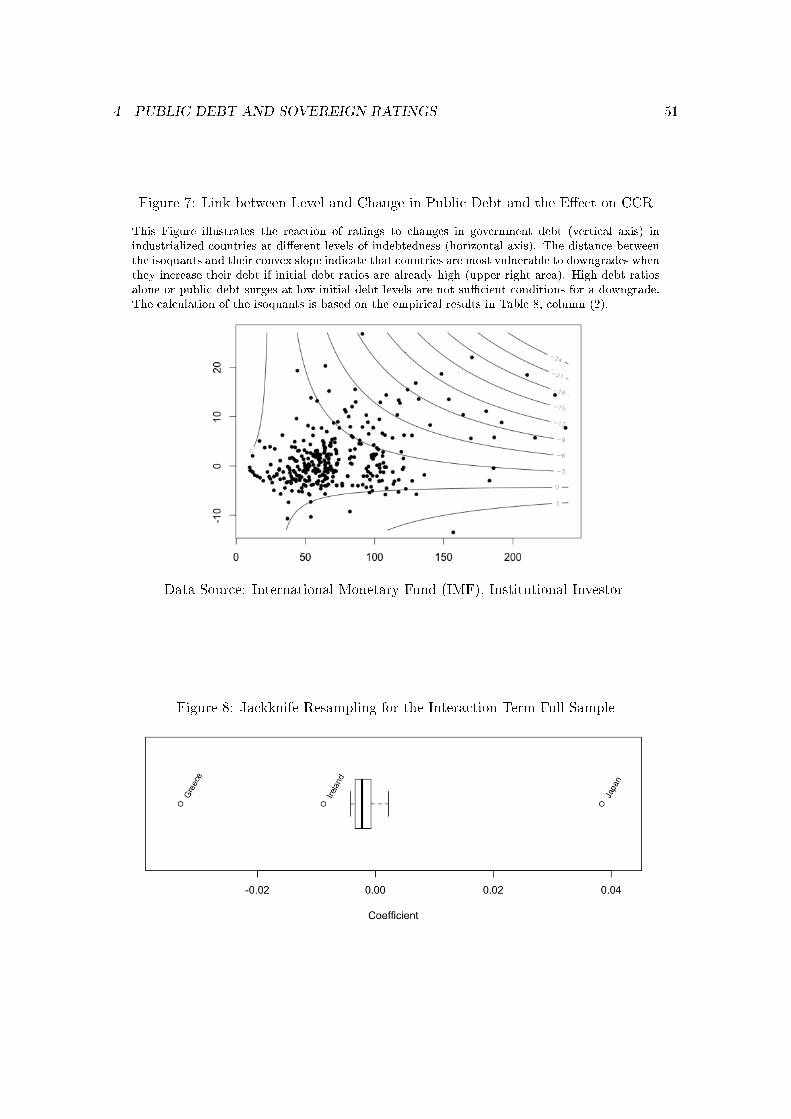
4 PUBLIC DEBT AND SOVEREIGN RATINGS 51
Figure 7: Link between Level and Change in Public Debt and the E�ect on CCR
This Figure illustrates the reaction of ratings to changes in government debt (vertical axis) inindustrialized countries at di�erent levels of indebtedness (horizontal axis). The distance betweenthe isoquants and their convex slope indicate that countries are most vulnerable to downgrades whenthey increase their debt if initial debt ratios are already high (upper right area). High debt ratiosalone or public debt surges at low initial debt levels are not su�cient conditions for a downgrade.The calculation of the isoquants is based on the empirical results in Table 8, column (2).
Data Source: International Monetary Fund (IMF), Institutional Investor
Figure 8: Jackknife Resampling for the Interaction Term Full Sample
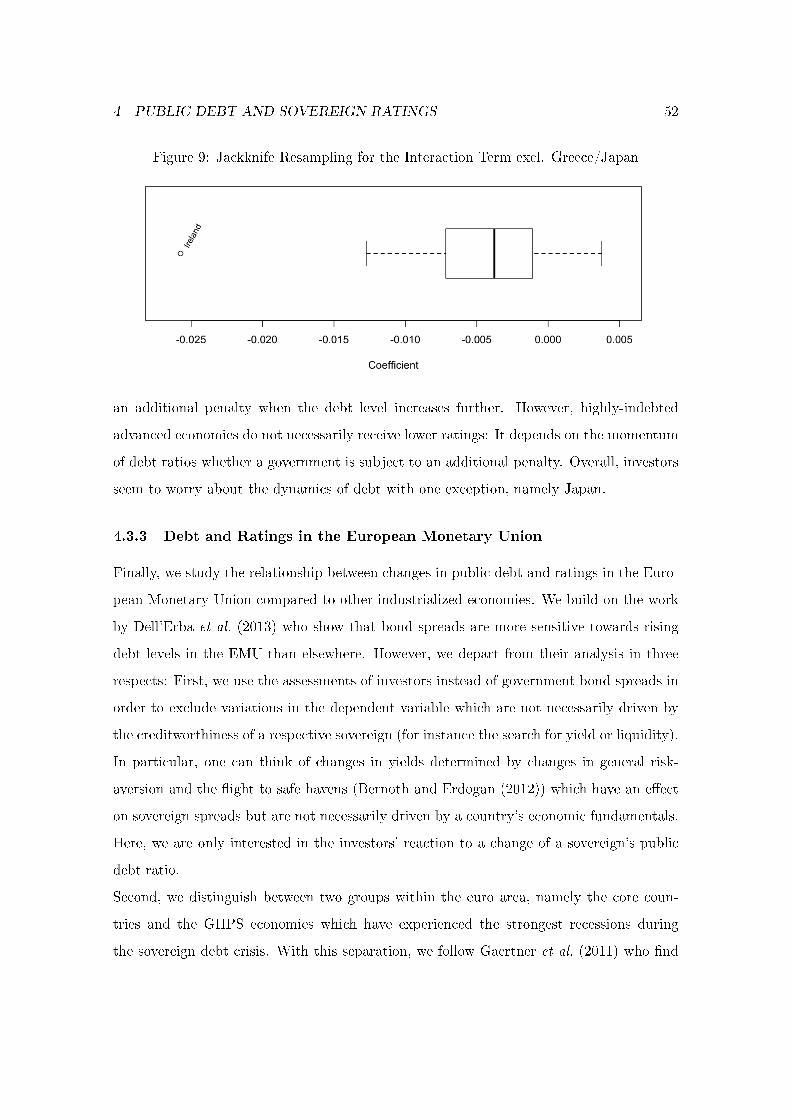
4 PUBLIC DEBT AND SOVEREIGN RATINGS 52
Figure 9: Jackknife Resampling for the Interaction Term excl. Greece/Japan
an additional penalty when the debt level increases further. However, highly-indebted
advanced economies do not necessarily receive lower ratings: It depends on the momentum
of debt ratios whether a government is subject to an additional penalty. Overall, investors
seem to worry about the dynamics of debt with one exception, namely Japan.
4.3.3 Debt and Ratings in the European Monetary Union
Finally, we study the relationship between changes in public debt and ratings in the Euro-
pean Monetary Union compared to other industrialized economies. We build on the work
by Dell'Erba et al. (2013) who show that bond spreads are more sensitive towards rising
debt levels in the EMU than elsewhere. However, we depart from their analysis in three
respects: First, we use the assessments of investors instead of government bond spreads in
order to exclude variations in the dependent variable which are not necessarily driven by
the creditworthiness of a respective sovereign (for instance the search for yield or liquidity).
In particular, one can think of changes in yields determined by changes in general risk-
aversion and the �ight to safe havens (Bernoth and Erdogan (2012)) which have an e�ect
on sovereign spreads but are not necessarily driven by a country's economic fundamentals.
Here, we are only interested in the investors' reaction to a change of a sovereign's public
debt ratio.
Second, we distinguish between two groups within the euro area, namely the core coun-
tries and the GIIPS economies which have experienced the strongest recessions during
the sovereign debt crisis. With this separation, we follow Gaertner et al. (2011) who �nd

4 PUBLIC DEBT AND SOVEREIGN RATINGS 53
Table 9: Debt Coe�cients EMU and Crisis using Di�erence OLS
This Table displays the resulting coe�cients of linear combinations of debt coe�cients acrosstime and country groups. We explain the change in ratings with a change in the public debtratio across three country groups and two periods based on the regression results in Table15.
(1) (2) (3)Non-EMU Core EMU GIIPS
1999-2008 -0.048 0.046 0.295(0.520) (0.627) (0.194)
2008-2012 -0.019 0.075 -0.308***(0.653) (0.539) (0.008)
standard errors in parentheses, coe�cients for other macroeconomic controls are not displayed
Non-EMU countries: Australia, Canada, Denmark, Japan, Sweden, UK, USA
EMU core: Austria, Belgium, Finland, France, Germany, Netherlands
GIIPS: Greece, Ireland, Italy, Portugal, Spain
that large parts of the recent downgrades assigned to the GIIPS cannot be explained by
economic fundamentals. The separation further allows us to make a statement about the
perception of credit risk in the core EMU. If sovereign risk analysts had expected these
countries to become responsible for the bail-out of defaulting members, they would have
assigned a debt penalty to these economies. In addition, we include the years between
the entry to the common currency area and before the onset of the crisis (1999-2008) in
order to identify how analysts assessed changes in public debt ratios relative to countries
outside the euro area during the Great Moderation. Thereby, we seek to identify whether
the entry to the common currency has already changed the perception towards credit risk
before the �nancial crisis.
Our third innovation is grounded in methodology: We build our analysis on interaction
terms in order to measure the quantitative di�erence in the response to changes in debt
across the three country groups (EMU core, GIIPS, other advanced countries). This is
not possible with two separate models where the coe�cients do not measure the di�erence
in the reaction of debt on ratings across groups, but account for the relative strength of
e�ects on ratings within the respective country group.

4 PUBLIC DEBT AND SOVEREIGN RATINGS 54
Table 9 displays the resulting coe�cients of linear combinations of debt coe�cients
across time and country groups. We explain the change in ratings with a change in the
public debt ratio across the three country groups and two periods based on the regression
in Table 15 of this chapter's Appendix.21 First, the model shows no statistically signi�cant
di�erence in the credit risk perception for changes in the debt ratio of countries outside
the euro area and core EMU economies. This is true for both periods before and during
the �nancial crisis. Second, the coe�cients for the GIIPS in column (3) show that these
countries have received a privilege between 1999-2008 (albeit not signi�cant) which turned
into a (signi�cant) penalty after 2008. As shown in Table 15 of the Appendix, our model
explains more than 40% of the variation in ratings which is remarkable when considering
the conservative approach of using di�erences instead of levels.
In line with our previous analyses, we proceed with a robustness check in order to
account for country-driven coe�cients. Again, the results of the Jackknife procedure reveal
that Japan and Greece have a relatively large in�uence. However, their exclusion does not
a�ect the (in-)signi�cance of our coe�cients and the size of the crisis coe�cient for the
GIIPS is only slightly reduced.
To sum up, we observe that the euro area periphery received a strong debt penalty
during the crisis. The core member governments neither seem to bene�t nor to su�er from
their membership with regard to the treatment of their public debt. One may argue that
the higher liquidity is balanced by the inability to issue debt in a national currency and
that a change in bailout expectations explains the coe�cients for the GIIPS countries.
The analysis does not include a study of level e�ects due to the fact that we have
already sorted countries within the EMU according to their level of public debt. Also, the
coe�cients will be di�cult to interpret if we add another interaction term including the
level of debt. We also abstain to report dynamic panel estimates for the crisis, since we
cannot exploit enough variation for each country during the four years between 2009 and
2012 to report a robust estimation result.
21The coe�cients in Table 15 can only be interpreted as linear combinations of the interaction terms asillustrated in Table 9.
4 PUBLIC DEBT AND SOVEREIGN RATINGS 55
4.4 Concluding Remarks
This chapter has studied the e�ect of public debt on ratings across speci�c country groups.
Our results can be summarized as follows: First, we do not �nd a debt privilege for
industrialized versus emerging markets. When we include the ability to issue debt in the
home currency, our results even point to a penalty towards industrialized countries. The
di�erence to previous �ndings can be explained by the time dimension (earlier studies
consider only periods until 2003) and our choice of di�erent estimation methods (static
�xed e�ects, Di�erence OLS, and Panel GMM). When using OlS without �xed e�ects, our
results reveal a positive and signi�cant debt privilege in industrialized countries.
Next, we tested whether ratings respond to high debt ratios and �scal de�cits or a
combination of both. The �ndings suggest that the rating reaction to an increase in the
public debt ratio is up to three times larger at high ratios of government debt compared to
the reaction at low levels of debt to GDP. Thus, it seems that sovereign risk analysts indeed
respond to higher levels of debt in advanced economies which underlines the fact that some
countries have reached a limit of debt sustainability. There are two large outliers, namely
Japan and Greece. Excluding these two countries from the analysis does not change the
results. Japan leads to a downward biased coe�cient (high tolerance of debt dynamics)
whereas Greece has a positive impact on the debt coe�cient (high intolerance towards
public debt possibly due to the recent partial default on government debt).
Third, we studied whether the euro area is treated di�erently by institutional investors
relative to sovereigns outside the euro area. We �nd that this is not the case for the core
members of the euro area. Hence, these countries do not seem to be held responsible
for the bail-out of other members. However, we �nd that the GIIPS economies have
received a large but insigni�cant debt privilege before the onset of the crisis and a large and
signi�cant debt penalty after 2008. Thus, one may conclude that analysts have overrated
creditworthiness during the initial years of EMU (at least in some of the countries) and
that they corrected this view during the crisis.
The major focus of this chapter was to explain how institutional investors respond to
the dynamics of public debt across country groups. The aforementioned results point to-
4 PUBLIC DEBT AND SOVEREIGN RATINGS 56
wards two policy implications for the industrialized world:
First, the observed volatility in euro area CCRs points to a considerable degree of uncer-
tainty among institutional investors regarding the future of the euro area. Therefore, it
is advisable that the treaties are revised to put them on more solid and reliable ground
especially with respect to the bail-out clause. Besides, the proposal of a sovereign debt
restructuring mechanism seems to be an appropriate instrument to deal with investor un-
certainty towards sovereign risk (also beyond the euro area).
Second, the response of ratings to a combination of high debt and its positive momentum
should be taken as a warning signal for highly-indebted industrialized countries and lead
them to more consolidation e�orts before �nancial markets may suddenly lose their faith
in the future creditworthiness of the reigning governments.
4.5 Appendix to Chapter 4

4 PUBLIC DEBT AND SOVEREIGN RATINGS 57
Table 10: Country Sample
(1) (2) (3)First obs. Last obs. No. of obs.
Advanced Countries (18 countries)
Australia 1993 2012 20Austria 1993 2012 20Belgium 1993 2012 20Canada 1993 2012 20Denmark 1993 2012 18Finland 1993 2012 20France 1993 2012 20Germany 1995 2012 19Greece 1993 2012 20Ireland 1999 2012 14Italy 1993 2012 20Japan 1993 2012 20Netherlands 1997 2012 16Portugal 1993 2012 20Spain 1993 2012 20Sweden 1993 2012 20United Kingdom 1993 2012 20United States 1993 2012 20
Emerging Markets (17 countries)
Argentina 1997 2012 16Brazil 2000 2012 13Chile 1993 2012 20China 1993 2012 20Colombia 1996 2012 17Hungary 1997 2012 16Indonesia 2000 2012 13Malaysia 1993 2012 20Mexico 1996 2012 17Peru 2003 2012 11Philippines 1996 2012 17Poland 1997 2012 16Russia 2000 2012 11South Africa 2008 2012 5Turkey 2004 2012 9Uruguay 2001 2012 12V enezuela 1998 2012 15

4 PUBLIC DEBT AND SOVEREIGN RATINGS 58
Table 11: Country Sample EMU
(1) (2) (3)First obs. Last obs. No. of obs.
EMU "core" (6 countries)
Austria 1999 2012 14Belgium 1999 2012 14Finland 1999 2012 14France 1999 2012 14Germany 1999 2012 14Netherlands 1999 2012 14
EMU "GIIPS" (5 countries)
Greece 2001 2012 12Ireland 1999 2012 14Italy 1999 2012 14Portugal 1999 2012 14Spain 1999 2012 14
Table 12: Variance Decomposition
(1) (2) (3)Between Within Total
All countries 309.094 64.574 373.668(7.581) (8.036) (19.330)
Industrialized countries 59.432 57.751 117.183(7.709) (7.599) (10.825)
Emerging markets 114.227 73.68 187.907(10.688) (8.584) (13.708)
Standard errors in parentheses
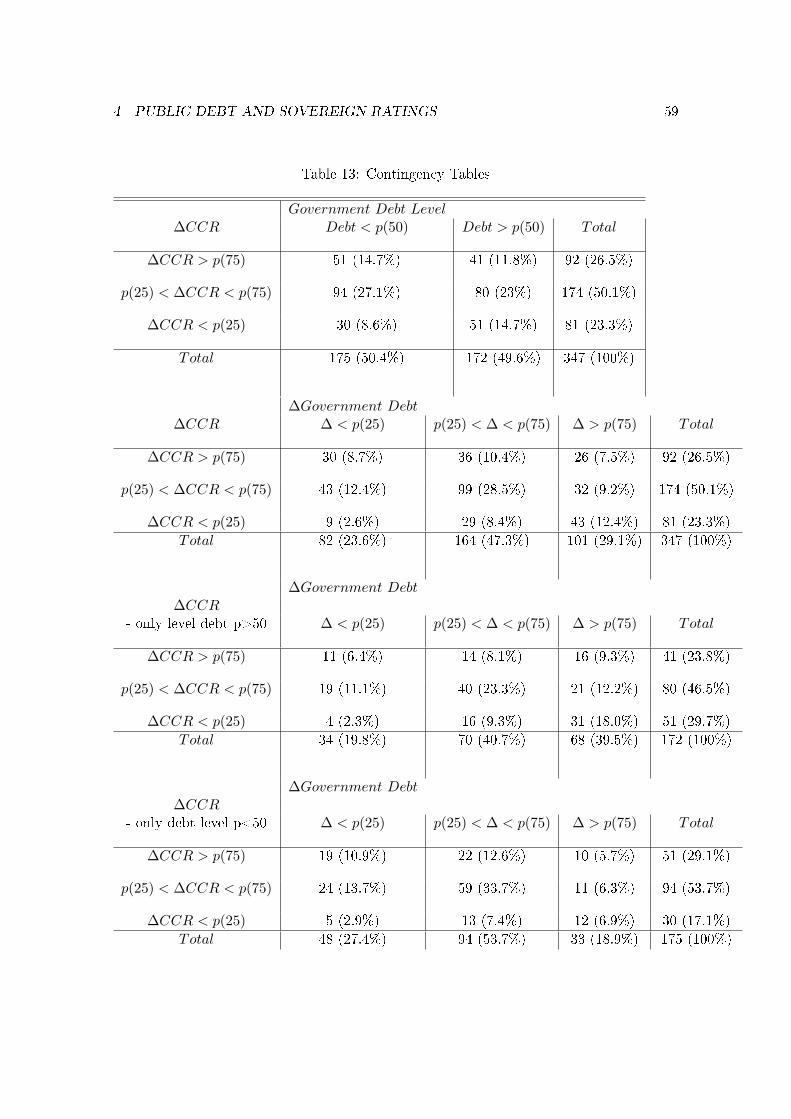
4 PUBLIC DEBT AND SOVEREIGN RATINGS 59
Table 13: Contingency Tables
Government Debt Level∆CCR Debt < p(50) Debt > p(50) Total
∆CCR > p(75) 51 (14.7%) 41 (11.8%) 92 (26.5%)
p(25) < ∆CCR < p(75) 94 (27.1%) 80 (23%) 174 (50.1%)
∆CCR < p(25) 30 (8.6%) 51 (14.7%) 81 (23.3%)
Total 175 (50.4%) 172 (49.6%) 347 (100%)
∆Government Debt∆CCR ∆ < p(25) p(25) < ∆ < p(75) ∆ > p(75) Total
∆CCR > p(75) 30 (8.7%) 36 (10.4%) 26 (7.5%) 92 (26.5%)
p(25) < ∆CCR < p(75) 43 (12.4%) 99 (28.5%) 32 (9.2%) 174 (50.1%)
∆CCR < p(25) 9 (2.6%) 29 (8.4%) 43 (12.4%) 81 (23.3%)
Total 82 (23.6%) 164 (47.3%) 101 (29.1%) 347 (100%)
∆Government Debt∆CCR
- only level debt p>50 ∆ < p(25) p(25) < ∆ < p(75) ∆ > p(75) Total
∆CCR > p(75) 11 (6.4%) 14 (8.1%) 16 (9.3%) 41 (23.8%)
p(25) < ∆CCR < p(75) 19 (11.1%) 40 (23.3%) 21 (12.2%) 80 (46.5%)
∆CCR < p(25) 4 (2.3%) 16 (9.3%) 31 (18.0%) 51 (29.7%)
Total 34 (19.8%) 70 (40.7%) 68 (39.5%) 172 (100%)
∆Government Debt∆CCR
- only debt level p<50 ∆ < p(25) p(25) < ∆ < p(75) ∆ > p(75) Total
∆CCR > p(75) 19 (10.9%) 22 (12.6%) 10 (5.7%) 51 (29.1%)
p(25) < ∆CCR < p(75) 24 (13.7%) 59 (33.7%) 11 (6.3%) 94 (53.7%)
∆CCR < p(25) 5 (2.9%) 13 (7.4%) 12 (6.9%) 30 (17.1%)
Total 48 (27.4%) 94 (53.7%) 33 (18.9%) 175 (100%)

4 PUBLIC DEBT AND SOVEREIGN RATINGS 60
Table 14: Industrialized vs. Emerging (OLS lagged 1 year)
(1) (2) (3)Baseline incl. crises incl. debt burden
L.GDP per capita 0.224∗∗∗ 0.240∗∗∗ 0.213∗∗∗
(0.0462) (0.0441) (0.0425)
In�ation, 4y avg. -0.286∗∗∗ -0.282∗∗∗ -0.224∗∗∗
(0.0395) (0.0545) (0.0584)
L.Unemployment -0.181∗∗∗ -0.182∗∗∗ -0.188∗∗∗
(0.0488) (0.0480) (0.0472)
External Balance, 4y avg. -0.0102 -0.0143 -0.0138(0.0545) (0.0532) (0.0531)
Growth, 4y avg. 0.157∗∗ 0.152∗∗ 0.151∗∗
(0.0590) (0.0603) (0.0617)
Fiscal Balance, 4y avg. 0.0899∗∗∗ 0.0719∗∗ 0.0830∗∗
(0.0327) (0.0342) (0.0334)
L.Gen. Gov. Debt -0.304∗ -0.326∗∗ -0.305∗∗
(0.154) (0.144) (0.119)
L.Gen. Gov. Debt * Ind 0.0438 0.0425 0.0546(0.268) (0.245) (0.216)
Stockmarket Crash 0.0347 0.0309(0.0314) (0.0319)
Currency Crisis 0.0423 0.0433(0.0396) (0.0408)
In�ation Crisis 0.0308 -0.0151(0.125) (0.111)
Domestic Debt Crisis -0.00842 -0.0482(0.177) (0.158)
External Debt Crisis 0.159 0.197(0.138) (0.120)
Banking Crisis -0.119∗ -0.0699(0.0676) (0.0564)
L.Original Sin -0.473∗∗∗
(0.117)
L.Curr. Mismatch 0.0285(0.0659)
Constant 0.299 0.291 -0.115(0.316) (0.288) (0.298)
Observations 559 559 559Adjusted R2 0.917 0.918 0.927Country FE Yes Yes Yes
Clustered Standard errors in parentheses∗ p < 0.10, ∗∗ p < 0.05, ∗∗∗ p < 0.01

4 PUBLIC DEBT AND SOVEREIGN RATINGS 61
Table 15: Debt and Ratings in EMU (OLS Di�)
This Table displays the coe�cients for the OLS Di� regressions withthe interaction terms for the two euro area groups (EMU core andGIIPS). A correct interpretation of the coe�cients is only possible bycalculation of the linear combinations between the interaction terms.The resulting marginal e�ects are displayed in Table 9.
(1)D.Rating
D.Gov. Debt -0.0476(0.0724)
D.Gov. Debt cris. 0.0289(0.0804)
EMU core -0.0904(0.182)
EMU core*D.Gov. Debt 0.0933(0.112)
EMU core*D.Gov. Debt*cris -0.121(0.175)
GIIPS -0.257(0.513)
GIIPS*D.Gov. Debt 0.342(0.205)
GIIPS*D.Gov. Debt*cris -0.632∗∗
(0.299)
Constant -1.011∗∗∗
(0.334)
Observations 231Adjusted R2 0.464
Clustered Standard errors in parentheses∗ p < 0.10, ∗∗ p < 0.05, ∗∗∗ p < 0.01EMU core: Austria, Belgium, Finland, France, Germany, NetherlandsGIIPS: Greece, Ireland, Italy, Portugal, Spain
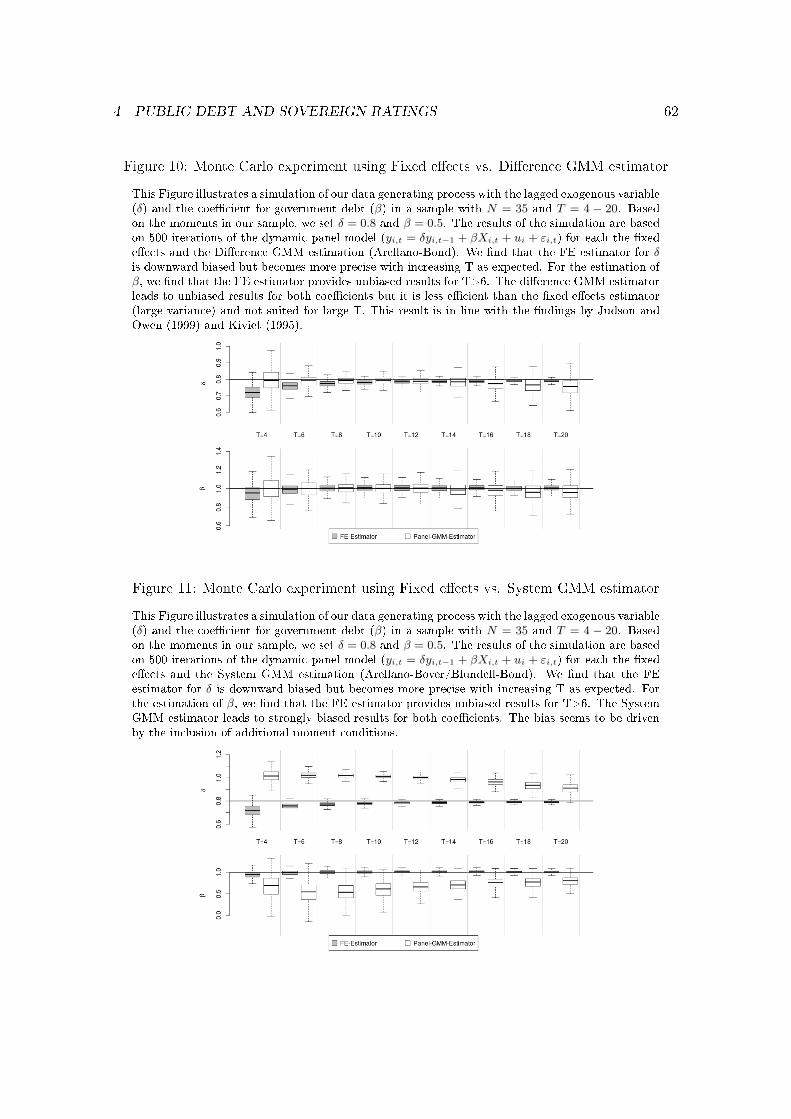
4 PUBLIC DEBT AND SOVEREIGN RATINGS 62
Figure 10: Monte Carlo experiment using Fixed e�ects vs. Di�erence GMM estimator
This Figure illustrates a simulation of our data generating process with the lagged exogenous variable(δ) and the coe�cient for government debt (β) in a sample with N = 35 and T = 4 − 20. Basedon the moments in our sample, we set δ = 0.8 and β = 0.5. The results of the simulation are basedon 500 iterations of the dynamic panel model (yi,t = δyi,t−1 + βXi,t + ui + εi,t) for each the �xede�ects and the Di�erence GMM estimation (Arellano-Bond). We �nd that the FE estimator for δis downward biased but becomes more precise with increasing T as expected. For the estimation ofβ, we �nd that the FE estimator provides unbiased results for T>6. The di�erence GMM estimatorleads to unbiased results for both coe�cients but it is less e�cient than the �xed e�ects estimator(large variance) and not suited for large T. This result is in line with the �ndings by Judson andOwen (1999) and Kiviet (1995).
Figure 11: Monte Carlo experiment using Fixed e�ects vs. System GMM estimator
This Figure illustrates a simulation of our data generating process with the lagged exogenous variable(δ) and the coe�cient for government debt (β) in a sample with N = 35 and T = 4 − 20. Basedon the moments in our sample, we set δ = 0.8 and β = 0.5. The results of the simulation are basedon 500 iterations of the dynamic panel model (yi,t = δyi,t−1 + βXi,t + ui + εi,t) for each the �xede�ects and the System GMM estimation (Arellano-Bover/Blundell-Bond). We �nd that the FEestimator for δ is downward biased but becomes more precise with increasing T as expected. Forthe estimation of β, we �nd that the FE estimator provides unbiased results for T>6. The SystemGMM estimator leads to strongly biased results for both coe�cients. The bias seems to be drivenby the inclusion of additional moment conditions.

5 WHY RATING AGENCIES DISAGREE ON SOVEREIGN RATINGS 63
5 Why Rating Agencies Disagree on Sovereign Ratings22
5.1 Introduction
The recent �nancial crisis has evoked a revival of the discussion about the role of Credit
Rating Agencies (CRAs). During the sovereign debt crisis in Europe, the so called Big
Three rating agencies Standard & Poor's, Moody's and Fitch Ratings started to downgrade
several euro area economies and even assigned junk status to Ireland, Portugal and Greece.
The sudden decline of trust in the solvency of European economies led many politicians to
claim that the Big Three did either not realize the true credit risk or that their decisions
were biased by political in�uence.23
Also, the academic literature has contributed to this debate: For instance, Gaertner
et al. (2011) �nd that ratings in selected euro area economies between 2009 and 2010
ranked 2.3 notches below a hypothetical rating for a country outside the monetary union
with the same economic fundamentals. Ferri et al. (1999) show that ratings have been
pro-cyclical during the Asian crisis, thereby amplifying the recessions in a�ected countries.
Add to this, Fuchs and Gehring (2013) �nd that sovereign ratings are subject to a home
bias (the resident agency assigns a rating which is on average one notch higher than that
of competitors). Also, the most in�uential agencies, namely the Big Three are shown to
exhibit only a weak home bias.24 Further, by comparing the behavior of nine agencies,
the authors �nd that cultural distance (for instance language) and economic ties (bank
exposure, export interests) with the home country a�ect the respective country's rating.
However, the channels through which the ratings are biased vary substantially across the
individual agencies. Finally, the authors admit that most of the variation in ratings is
explained by macroeconomic and political fundamentals.
At the same time, the literature on determinants of sovereign credit ratings also shows
that large parts of the variation can be explained with few macroeconomic variables (see
for instance Cantor and Packer (1996)). In a related panel analysis for sovereign ratings
22This chapter has been published as a Working Paper in the IPP Discussion Paper Series of the Guten-berg School of Management and Economics (GSME).
23see Handelsblatt (January 17, 2012): "The myth of the U.S. conspiracy"24Only S&P is shown to rate the United States better than other countries and Fitch exhibits a home
bias for both France and the United States (based on ownership and headquarter).
5 WHY RATING AGENCIES DISAGREE ON SOVEREIGN RATINGS 64
between 1995 and 2005, Afonso et al. (2011) �nd that their model (including a set of
macroeconomic, political and regional variables) correctly predicts 75 percent of the rat-
ings (within one notch variation) despite the fact that expectations for future economic
development or other qualitative assessments are not taken into account by the respective
agency.
Thus, empirical evidence towards the adequacy of sovereign ratings appears to be
mixed: In general, ratings seem to quite well re�ect the credit risk of a country, how-
ever, during times of crisis, the Big Three have often been accused of reacting too late
and to be overly bearish towards a country's creditworthiness. However, compared to
the corporate sector it remains di�cult to assess the adequacy of ratings since at least
the advanced countries have not defaulted for many years. Therefore, I have to rely on
indirect measures of performance such as the relative activity of rating agencies by study-
ing follower-leader behavior (Hill and Fa� (2010)) or by comparing whether some regions
systematically receive better ratings than others (Fuchs and Gehring (2013)).
Figure 12 illustrates the recent downgrades of euro area countries. Here, I observe
that the Big Three decided almost unanimously on euro area ratings (besides Moody's
downgrade for Ireland to speculative grade status). However, when adding the ratings
from the smaller European rating agency, I observe that Feri has started to downgrade the
same countries earlier and it assigned junk status to Portugal even one year before the Big
Three took action. This observation raises the question how often rating agencies disagree
on sovereign ratings and, even more important, what the reason for this disagreement
might be.
The purpose of this chapter is to shed more light on the issue of disagreement among
CRAs. I study the determinants of sovereign split ratings across agencies and their propen-
sity to be optimistic/pessimistic towards a country's credit risk (lopsided or symmetric rat-
ings). Further, I evaluate whether the individual propensity to up- or downgrade a coun-
try's credit rating increases, following a previous rating change of a competitive agency in
the same direction.
My results indicate that split probabilities are not driven by a rating agency's home
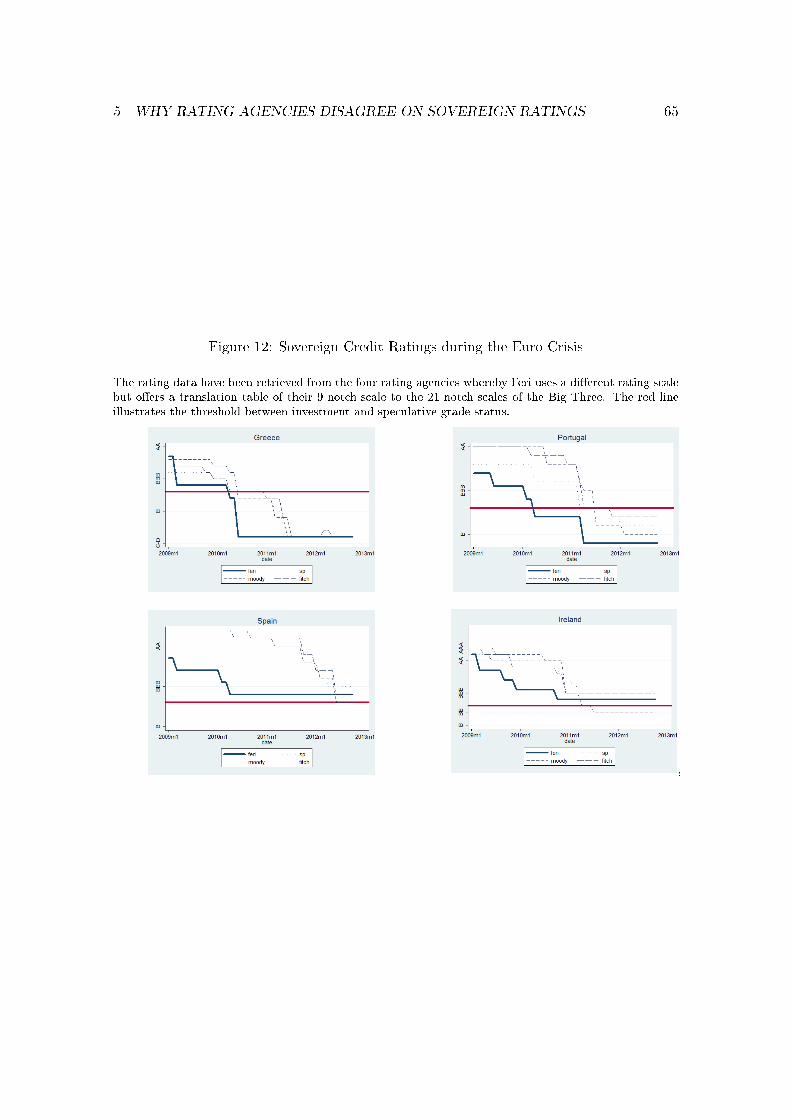
5 WHY RATING AGENCIES DISAGREE ON SOVEREIGN RATINGS 65
Figure 12: Sovereign Credit Ratings during the Euro Crisis
The rating data have been retrieved from the four rating agencies whereby Feri uses a di�erent rating scalebut o�ers a translation table of their 9-notch-scale to the 21-notch-scales of the Big Three. The red lineillustrates the threshold between investment and speculative grade status.
,

5 WHY RATING AGENCIES DISAGREE ON SOVEREIGN RATINGS 66
region but rather seem to be a consequence of the use of di�erent rating models and
uncertainty in the presence of adverse shocks. I also observe a di�erent rating behavior
between the subscriber funded European agency and the Big Three which can be explained
by the varying frequency of rating actions.
The chapter is organized as follows: In section 5.2, I brie�y review the related literature.
Section 5.3 presents my data sample. In section 5.4, I show the results for political,
macroeconomic and regional determinants of split ratings between the four agencies. In
Section 5.5, I explore whether ratings are lopsided across agencies and analyze potential
determinants of optimism and pessimism. Section 5.6 presents the results of up- and
downgrade interaction between rating agencies before I conclude in section 5.7.
5.2 Literature Review
In principle, one can distinguish between three types of explanations for split ratings:
First, splits are the consequence of uncertainty towards the true credit risk. Until
now, the literature has only focused on banks (Morgan (2002)) and non-�nancial �rms
(Livingston et al. (2007)). They �nd that disagreement is not randomly distributed but
that those companies with higher asset opaqueness are more likely to receive split ratings.
To my knowledge, determinants of rating splits in the case of sovereigns have not been
studied so far. However, looking at the frequency of rating splits (see section 5.2), it
seems that rating agencies have di�erent views on a country's default risk. These may be
attributed to the use of di�erent rating models or uncertainty in times of adverse shocks.
For instance, one agency may put more weight on the default history and public debt ratio
of a country whereas another primarily considers the economic well-being and political
stability. Taking into account the empirical �ndings during times of crisis, one may also
contemplate whether the frequency of split ratings increases when a country is subject to
adverse shocks.
Second, prior studies have discussed whether di�erent business models among rating
agencies can be a reason for split ratings. Using corporate bond ratings from 1999 to
2013 Bruno et al. (2013) �nd that a subscriber funded rating agency (Egan-Jones Rating
Company) provides more rating updates than a rating agency that uses the issuer-pays

5 WHY RATING AGENCIES DISAGREE ON SOVEREIGN RATINGS 67
model (Big Three agencies). This observation is robust to the registration of Egan-Jones
as a National Recognized Statistical Rating Organization (NRSRO) in 2007. The authors
conclude that the rating behavior is thus driven by di�erent business models (issuer-pays
vs. subscriber funded). Bhattacharya et al. (2014) �nd that Egan-Jones provides not only
more rating updates but also a higher rating quality suggesting that subscriber-funded
agencies are even better suited to act in the best interest of investors. In case of sovereign
ratings it is more di�cult to measure the rating performance due to a lack of defaults.
However, issuer-paid agencies may be acting in the home country's interest in order to
keep their mandate whereas subscriber funded companies should be primarily interested
in satisfying their customers.25
Third, split ratings can be the consequence of a rating agency's inclusion in regulatory
frameworks. Many studies �nd that decisions by the Big Three have an impact on bond
rates (Gaertner et al. (2011), Afonso et al. (2012), Alsakka and ap Gwilym (2010), Arezki
et al. (2011)) and stock prices. That is to say, interest rates often follow rating decisions.26
One may suggest that a part of the causal relationship is driven by the quasi-automatic
impact on bond rates and stock prices via the inclusion of external ratings in regulatory
frameworks: According to the Basel rules, institutional investors (pension funds, insurance
companies etc.) are required to hold a �xed share of investment grade rated bonds in
their portfolio. The decision of a rating agency to downgrade a country close to (or even
to) junk status, might prompt investors to sell the respective bonds just to comply with
the established rules.27 Consequently, if ratings are included in regulation, a respective
CRA may have incentives to follow the decisions of other regulated competitors due to the
expected e�ect of a rating change on interest rates.
Moreover, CRAs whose ratings are used by regulators may have incentives to be reluc-
tant towards sovereign downgrades when they use sovereign ceiling policies which compel
rating agencies not to assign a better rating to a �rm than to the sovereign (Borensztein
25Only a limited number of the Big Three ratings are unsolicited (26.6%). In my sample, I �nd nosigni�cant di�erence across rating agencies between unsolicited and solicited ratings for one particularcountry.
26Some of those studies �nd that the relationship is bi-directional.27Investors do not necessarily rely on the rules of this standardized approach if they use the internal risk
based approach (IRB).

5 WHY RATING AGENCIES DISAGREE ON SOVEREIGN RATINGS 68
et al. (2013)). Adelino and Ferreira (2014) �nd that the downgrades of banks due to
sovereign ceiling policies have signi�cant negative e�ects on bank lending. This may lead
rating agencies to be reluctant towards changes in sovereign credit risk. However, if one
of the Big Three agencies takes the �rst step, competitors are incentivized to follow this
decision due to expected repercussions on the country's credit risk. On the contrary, a
smaller CRA has a higher degree of �exibility (it rates fewer big issuers like large banks
and corporate �rms (Bhattacharya et al. (2014))) and may thus have less concern to change
a country's rating.
I contribute to the literature by exploring major determinants of split ratings for
sovereigns across the four agencies. In particular, I investigate three hypotheses why split
ratings for countries may exist:
(1) Split ratings for sovereigns can be explained by model uncertainty when rating
agencies measure default risk di�erently, especially in the presence of large adverse shocks
to credit risk.
(2) Conditional on the place of residence and the ownership, rating agencies assign
better ratings to their home region (given the economic and political environment of coun-
tries).
(3) The inclusion of ratings into regulatory frameworks leads to a more reluctant stance
of the respective agency towards downgrades because it fears more far-reaching conse-
quences than intended such as accompanying downgrades of bank ratings and rising in-
terest rates. This in turn increases the tendency of agencies to follow competitors if these
assign a downgrade previously.
5.3 Data and Stylized Facts
In this chapter, I use monthly sovereign ratings from the Big Three rating agencies and from
Feri AG, Germany's largest non-bank adviser/asset manager for private and institutional
assets.28
Exploring these data, I obtain a sample of 54 countries with monthly rating actions
28see homepage of Feri AG at http://www.feri.de/en/company/portrait/

5 WHY RATING AGENCIES DISAGREE ON SOVEREIGN RATINGS 69
ranging from June 1999 to October 2012. The sample comprises 23 industrial countries
and 31 emerging market economies and the total number of monthly observations for each
rating agency is 9,016 (except for Fitch with 8,929 country-month observations).29 During
my sample period of 13 years, I observe between 169 (Moody's) and 393 (Feri) rating
changes. For robustness checks, I also consider watch and outlook decisions by the Big
Three.
One part of the analysis will use annual data due to the fact that political and economic
variables are only available on a yearly basis. The sample entails 702 (except for Fitch
with 695) rating observations by using end-of-year ratings in the analyses. As robustness
checks, I also computed the results by using yearly rating averages.
I start by mapping the alphabetical notches into numerical values in order to perform
statistical analyses.30 A 17 maps the best rating (AAA or AAa) and a 1 the worst (D/D/C).
Therefore, lower values indicate a higher default probability. The Big Three ratings have
22 notches when using a linear scale.31 Feri uses 11 notches and provides a translation
table for comparison with the Big Three. I apply this transformation.32 The dividing
line between investment grade and speculative grade on Feri's scale is between C and D,
for S&P and Fitch the dividing line is between BBB- and BB+ and for Moody's it runs
between the Baa3 and Ba1.
In order to compare rating di�erences across CRAs, the most convenient approach
would be to use the transformation in Table 31. However, I cannot ensure that the values
in the provided diagram by Feri are perfectly comparable. For instance, I am not able to
verify that a letter B+ on the Feri scale is comparable to the letter A on the Big Three
scale. For that reason, I decided to classify the rating scales into broader categories as to
ensure a better comparability. In the roughest classi�cation I distinguish between three
classes (see Table 16): First, I separate the best possible rating category (AAA) from
those ratings considered as investment grade (while lower than AAA). The third category
29see list of countries in Table 30 of this chapter's Appendix30see Table 31 in the Appendix of this chapter31I follow Güttler and Wahrenburg (2007) and Afonso et al. (2011) in restricting the scale to 17 values
since there are few observations in the lowest range32see Feri press release on country ratings: http://frr.feri.de/files/documents/fer/press/
2010-06-07_FER_PM_0.pdf

5 WHY RATING AGENCIES DISAGREE ON SOVEREIGN RATINGS 70
entails country-year observations with speculative grade ratings. In the authors' opinion,
this approach has two advantages: First, I ensure that ratings are better comparable
across agencies and second, the balanced number of ratings in each category enables us to
exploit di�erences in the rating behavior among industrialized countries (AAA/ investment
grade) and emerging markets (investment grade/ speculative grade). A more segmented
classi�cation is provided in Table 32 of the Appendix and has been used for the mean-
comparison tests in section 5.5.
Table 16: Classi�cation of Ratings
This Table summarizes annual observations of ratings acrossCRAs according to the three rating categories AAA/investmentgrade/speculative grade.
(1) (2) (3) (4)S&P Moody's Fitch Feri
AAA/Aaa/AAA 179 191 169 142
Investment Grade 351 340 362 435
Speculative Grade 172 191 164 125
Observations 702 702 695 702
Table 17 shows the absolute numbers of split ratings across the agencies. Here, all
four agencies agreed in more than 50 percent of the sample (396/702). Feri has relatively
often disagreed with the ratings of the Big Three (200-300/702) whereas I observe a split
across the Big Three only in every �fth case (105/702). The numbers remain broadly the
same if I use yearly averages instead of year-end values and they indicate that Feri has
more often deviated from the assessments of the Big Three than the latter to each other.
Consequently, one might suggest that Feri's ratings are more independent compared to
those by the Big Three. However, the results give no indication of whether the observed
di�erences are region-speci�c or randomly distributed. I will shed more light on this issue
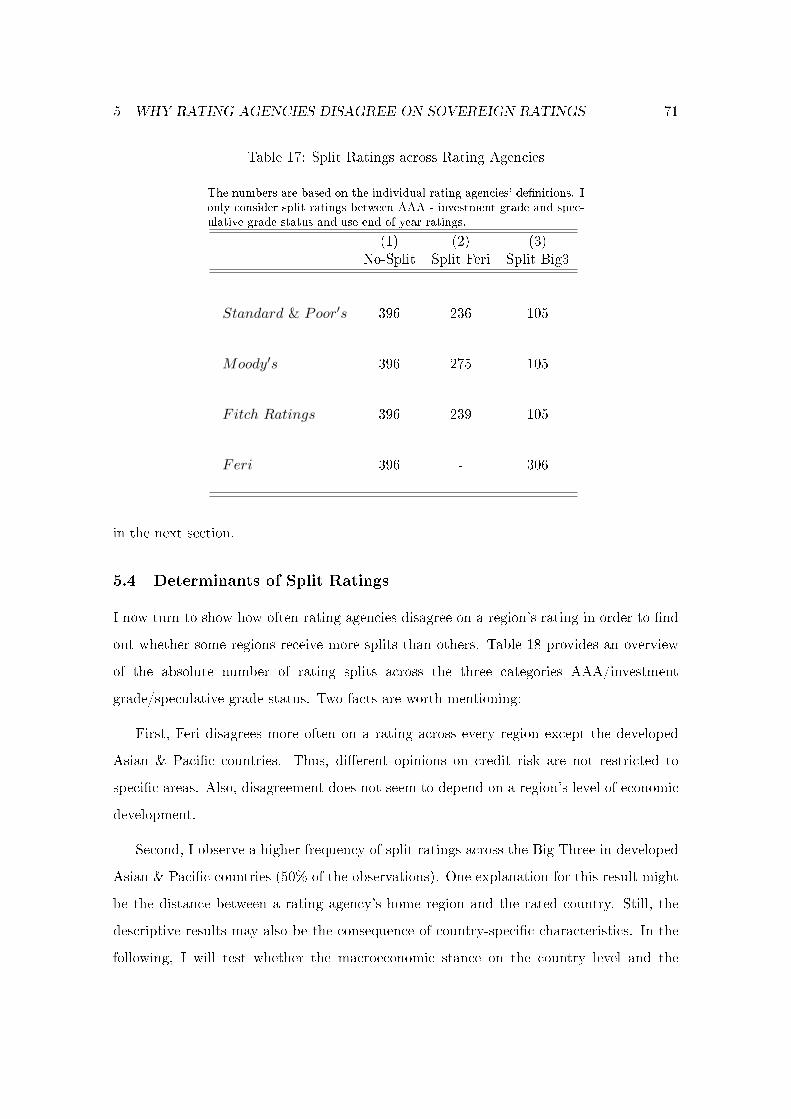
5 WHY RATING AGENCIES DISAGREE ON SOVEREIGN RATINGS 71
Table 17: Split Ratings across Rating Agencies
The numbers are based on the individual rating agencies' de�nitions. Ionly consider split ratings between AAA - investment grade and spec-ulative grade status and use end-of-year ratings.
(1) (2) (3)No-Split Split Feri Split Big3
Standard & Poor′s 396 236 105
Moody′s 396 275 105
Fitch Ratings 396 239 105
Feri 396 - 306
in the next section.
5.4 Determinants of Split Ratings
I now turn to show how often rating agencies disagree on a region's rating in order to �nd
out whether some regions receive more splits than others. Table 18 provides an overview
of the absolute number of rating splits across the three categories AAA/investment
grade/speculative grade status. Two facts are worth mentioning:
First, Feri disagrees more often on a rating across every region except the developed
Asian & Paci�c countries. Thus, di�erent opinions on credit risk are not restricted to
speci�c areas. Also, disagreement does not seem to depend on a region's level of economic
development.
Second, I observe a higher frequency of split ratings across the Big Three in developed
Asian & Paci�c countries (50% of the observations). One explanation for this result might
be the distance between a rating agency's home region and the rated country. Still, the
descriptive results may also be the consequence of country-speci�c characteristics. In the
following, I will test whether the macroeconomic stance on the country level and the

5 WHY RATING AGENCIES DISAGREE ON SOVEREIGN RATINGS 72
Table 18: Split Ratings across Regions
This Table displays split ratings across selected regions. I di�er between the three di�erent rating classesaccording to Table 16. The industrialized Asian & Paci�c countries include Australia, New Zealand, Japan,Singapore and South Korea.
(1) (2) (3) (4) (5)Feri S&P Feri Moody Feri Fitch Split Big3 Observations
EMU 35 40 38 12 137
US/Canada 7 8 6 3 39
Asia & Paci�c (ind.) 17 28 18 33 65
Asia (emerg.) 34 32 36 9 91
South America 38 40 39 3 78
Eastern Europe 67 72 66 20 169
5 WHY RATING AGENCIES DISAGREE ON SOVEREIGN RATINGS 73
political environment have an in�uence on the disagreement across CRAs.
It is a generally accepted view that political risk determines the willingness to re-
pay debt obligations whereas economic risk mirrors the country's ability to repay. Both
variables are considered in the rating agencies' methodologies. By contrast, a country's
business climate (protection of property rights, predictability of tax and legal regimes) is
not necessarily related to the probability of sovereign debt repayment.33
The authors include the following two determinants of political uncertainty: (1) Po-
litical stability measures the probability of a government to be destabilized by unconsti-
tutional or violent means. If political stability is endangered rating agencies may have
di�erent views on political developments within the country or on future governments. (2)
Government e�ectiveness captures the ability of a government to provide public services,
the degree of independence from political pressures and government credibility (Kaufmann
et al. (2010)). If government e�ectiveness is low, rating agencies may face uncertainty with
respect to the formal capacity of the government to service its debt.
I also use determinants for economic uncertainty: First, a higher (1) GDP per capita
reduces the uncertainty towards a country's ability to repay its debt due to a large tax
base. Second, a low ratio of (2) government debt to GDP reduces uncertainty as well as a
low ratio of (3) external debt to imports. I also control for the (4) default history where a
past default (after 1945) potentially increases uncertainty.
Finally, I include a measure for large adverse shocks to a country's default risk within
a given year. If a country is subject to such a shock, I assume that rating agencies face
a greater uncertainty towards future country risk. In the model, I use the Institutional
Investor's country credit risk index which is based on a semi-annual survey among institu-
tional investors and weighted by their exposure to sovereign risk. The variable is computed
as the squared one-year-change in credit risk whereby we only consider negative changes
in credit risk.34 Thus, positive coe�cients indicate that large adverse shocks to credit risk
lead to higher uncertainty among rating agencies.
In the following, I carry out two separate regressions and present the results. First, I
33For details, I refer to the published methodologies of the CRAs34Positive values are set equal to zero.

5 WHY RATING AGENCIES DISAGREE ON SOVEREIGN RATINGS 74
restrict the sample to advanced economies and measure the probability to observe a split
rating between AAA and below. In the second probit model, I measure the probability of
split ratings in emerging economies at the threshold between investment and speculative
grade status.
Pr(Split AAAij,t) = F (macrok,t, region,∆CCRk,t) + eij,t (4)
and
Pr(Split InvJunkij,t) = F (macrok,t, region, defaultk,∆CCRk,t) + eij,t. (5)
Table 19 provides the results obtained from the probit regression on AAA-level splits.
Columns (1) and (2) present split results for Feri against the Big Three. Most importantly,
I �nd no systematic increase in the split probability across regions. Higher government
debt and a negative external balance increase the split probability whereby a lower value
of government e�ectiveness leads to a decline. The latter result looks surprising, however,
one may think of countries having a low probability to receive AAA-status by any agency
if the index has not reached a certain upper threshold. The split probability increases
signi�cantly with a large decline in the Country Credit Rating. Indeed, this result con�rms
earlier �ndings in the literature stating that ratings are less reliable during times of crisis
(Ferri et al. (1999), Gaertner et al. (2011)).
The split results for the Big Three in columns (3) and (4) are similar, however, I
observe that the agencies disagree more often on ratings for Asian & Paci�c countries.35
In contrast to S&P's and Moody's, Fitch has never assigned AAA-status to these countries.
Also, the Big Three are often discordant on Japan's credit risk with S&P's being the most
pessimistic agency.
Taken together, the �ndings for splits on AAA-status do not suggest that countries in
the euro area are particularly a�ected by split ratings whereas other regions are not. It
seems that the frequency of disagreement increases only between the Big Three in the case
of Asian & Paci�c countries, con�rming my descriptive result in Table 18.
35The Asian & Paci�c region includes Australia, New Zealand, Japan, Singapore and South Korea.

5 WHY RATING AGENCIES DISAGREE ON SOVEREIGN RATINGS 75
Table 19: Split Ratings AAA vs. Non-AAA
This Table displays split probabilities for advanced economies at the threshold between AAA and below.I use a probit model with a dummy variable equal to one if two agencies disagree on the rating category(AAA/Non-AAA). Positive coe�cients re�ect an increase in the split probability, negative coe�cientsindicate a decrease. Standard errors are clustered on the country level.
(1) (2) (3) (4)Split Feri-Big3 Split Feri-Big3 Split Big3 Split Big3
∆ CCR sq. 0.000533* 0.000847*** 0.00105*** 0.00134***(1.92) (2.83) (3.94) (4.10)
EMU -0.110 -0.0204 -0.171 -0.167(-0.58) (-0.14) (-1.15) (-1.23)
Asia & Paci�c 0.0975 0.206 0.176 0.179*(0.46) (1.59) (1.27) (1.73)
USA & Canada -0.142 -0.232 -0.123 -0.152(-0.60) (-1.27) (-0.89) (-1.16)
GDP per Capita 0.00167 -0.00385(0.57) (-1.15)
Government Debt 0.00176* 0.000578(1.81) (1.14)
Fiscal Balance -0.00213 -0.00565(-0.22) (-0.83)
External Balance -0.0302*** -0.0175***(-4.47) (-3.73)
GDP Growth 0.00259 0.00889(0.21) (0.80)
Government E�ectiveness 0.651*** 0.358***(4.70) (3.79)
Political Stability 0.0322 0.0934(0.20) (0.78)
Observations 299 297 299 297Pseudo R2 0.025 0.189 0.138 0.283
t statistics in parentheses* p<0.10, ** p<0.05, *** p<0.01

5 WHY RATING AGENCIES DISAGREE ON SOVEREIGN RATINGS 76
Table 20: Split Ratings Speculative vs. Investment Grade
This Table displays split probabilities for countries at the threshold between investment grade and junkstatus. I use a probit model with a dummy variable equal to one if two agencies disagree on the ratingcategory (Investment Grade/Junk status). Positive coe�cients re�ect an increase in the split probability,negative coe�cients indicate a decrease. Standard errors are clustered on the country level.
(1) (2) (3) (4)Split Feri-Big3 Split Feri-Big3 Split Big3 Split Big3
∆ CCR sq. -0.0000553 -0.000897*** 0.0000973 -0.000226(-0.14) (-2.63) (0.55) (-0.76)
Default History 0.137 -0.0360 0.0252 -0.102**(1.22) (-0.32) (0.66) (-2.28)
Eastern Europe 0.0796 0.0225 0.0179 0.0570(0.44) (0.15) (0.32) (0.77)
Asia 0.127 -0.110 0.00731 -0.0226(0.60) (-0.71) (0.11) (-0.33)
South America 0.185 -0.107 -0.0611 -0.0927(0.93) (-0.65) (-0.94) (-1.09)
GDP per Capita -0.0181 0.00307(-1.48) (0.35)
Government Debt -0.000706 0.000970(-0.29) (0.69)
External Debt 0.00166** 0.000206(2.28) (0.55)
Fiscal Balance -0.0101 -0.00283(-0.74) (-0.48)
External Balance -0.00153 -0.000868(-0.19) (-0.26)
GDP Growth -0.00611 -0.00583(-0.69) (-1.27)
Government E�ectiveness -0.299** -0.142*(-2.44) (-1.85)
Political Stability -0.0650 0.0426(-0.90) (1.47)
Observations 403 284 403 284Pseudo R2 0.021 0.217 0.015 0.117
t statistics in parentheses* p<0.10, ** p<0.05, *** p<0.01

5 WHY RATING AGENCIES DISAGREE ON SOVEREIGN RATINGS 77
Table 20 presents the results for splits between investment and speculative grade rat-
ings. I �nd more split ratings between Feri and the Big Three in countries with high
external debt and low levels of government e�ectiveness given. Again, I �nd no signi�cant
increase in the split probability across regions. In contrast to the results in Table 19, I
�nd no positive e�ect of adverse shocks on the split probability. The coe�cient is even
negative and signi�cant in column (2) suggesting that in the case of emerging markets, the
agreement (to downgrade countries) among CRAs even increases. The Big Three disagree
more often if countries have no default history and if the index of government e�ectiveness
is low. I do not �nd an indication for the Big Three to disagree more often on country risk
in one region than in another.
To sum up, my results suggest that disagreement among rating agencies stems either
from the use of di�erent rating models (external balance and debt ratios seem to have
di�erent weights) or from uncertainty during times of adverse shocks (only in advanced
economies). I �nd that regional splits occur more frequently among the Big Three in Asian
& Paci�c countries. In the following, I study in which cases a CRA is more likely to be
optimistic or pessimistic than its competitors.
5.5 Are Sovereign Ratings Lopsided?
During the euro crisis, policy makers have expressed the expectation that a European based
rating agency would publish a more unbiased view about European countries than rating
agencies with headquarters in the U.S. Accordingly, one should expect that the U.S. based
agencies assign better ratings to their immediate neighbors. Given the recent criticism by
European politicians, I �rst examine rating di�erences in the euro area.
To begin, I investigate the rating di�erences in industrialized and emerging markets
and on the euro area in particular. In Tables 21 and 22, I show the mean comparisons
of rating di�erences between Feri and the Big Three. The coe�cients indicate that Feri
has assigned more positive ratings to emerging markets (between 1999 to 2007) and has
had a more pessimistic view on industrialized countries (only during the crisis). Within
the euro area (Table 22), I observe no signi�cant di�erence across the agencies during the
Great Moderation, but a strong decline in both euro area groups (GIIPS and non-GIIPS

5 WHY RATING AGENCIES DISAGREE ON SOVEREIGN RATINGS 78
Table 21: Mean Comparison of Ratings to the World
Di�erences of the ratings are based on the transformation in Table 16; Positive coe�cients indicate a betterrating average compared to Feri; Signi�cance levels of T-test are given as ***, **, and * representing 1%,5%, and 10% respectively
(1) (2) (3)Country Group Feri - S&P Feri - Moody's Feri - Fitch Observations
1999-2012
All Countries 0.18*** 0.12*** 0.19*** 702industrialized Countries -0.1*** -0.16*** -0.09*** 299Emerging Economies 0.12*** 0.11*** 0.11*** 403
Great Moderation (1999-2007)
All Countries 0.36*** 0.33*** 0.35*** 486industrialized Countries 0.02 -0.03 -0.02 207Emerging Economies 0.62*** 0.60*** 0.58*** 279
Crisis Period (2008-2012)
All Countries -0.22*** -0.32*** -0.16*** 216Advanced Countries -0.37*** -0.46*** -0.34*** 92Emerging Economies -0.11*** -0.22*** -0.02 124
Table 22: Mean Comparison of Ratings within the Euro Area
Di�erences of the ratings are based on the transformation in Table 16; Positive coe�cients indicate a betterrating average compared to Feri; Signi�cance levels of T-test are given as ***, **, and * representing 1%,5%, and 10% respectively
(1) (2) (3)Rating Agencies Feri - S&P Feri - Moody's Feri - Fitch Observations
1999-2012
euro area -0.18*** -0.31*** -0.25*** 137GIIPS -0.17** -0.38*** -0.25*** 63Non−GIIPS -0.22*** -0.11* -0.26*** 87
Great Moderation (1999-2007)
euro area 0.03 -0.09 -0.08 89GIIPS 0.05 -0.12 -0.09 43Non−GIIPS 0.02 -0.07 -0.07 46
Crisis Period (2008-2012)
euro area -0.58*** -0.71*** -0.56*** 48GIIPS -0.65*** -0.95*** -0.6*** 20Non−GIIPS -0.54*** -0.54*** -0.54*** 28

5 WHY RATING AGENCIES DISAGREE ON SOVEREIGN RATINGS 79
countries) between 2008-2012.
These preliminary �ndings indicate that Feri tends to be more pro-cyclical in its rating
behavior than the Big Three and that compared to what could be expected it surprisingly
perceives the entire euro area as a more risky asset. This result has not been described
previously. On the contrary, Fuchs and Gehring (2013) �nd that in general rating agencies
give preferential treatment to their home country and to countries with close cultural and
economic ties to the home country.36
I also di�er from Fuchs and Gehring (2013) by using a di�erent de�nition of the home
bias: They reproduce the rating models used by each agency and compare their results with
the actual ratings. If the predicted rating is lower than the actual rating, the authors de�ne
this as a home bias. In this paper, I focus instead on the determinants of disagreement
across agencies. Speci�cally, I ask whether the observed optimistic/pessimistic stance of
a rating agency relative to competitors can be explained by the use of di�erent rating
models (for instance by assigning di�erent weights to economic or political factors) or the
belonging to the home region. I am not able to identify a home bias on the country level
due to the limited variation across the four rating agencies with respect to the ratings of
the United States, Germany and France.
In Table 23, I summarize the number of months in which a CRA had a more pessimistic
stance compared to all competitors across regions. In the case of Feri, I use the classi�cation
in Table 16 due to the di�erent rating scales. The comparison among the Big Three is
based on the scale of alphabetical notches.37 For instance, I consider a more pessimistic
stance for Feri if the agency assigns investment grade whereas all Big Three agencies assign
AAA-status. In case of the Big Three, I attribute a negative stance if one agency assign
B+ whereas another one assigns a B.
The descriptive �ndings indicate that Feri is more often pessimistic towards credit risk
in North America and Eastern Europe than its competitors. Standard & Poor's takes the
lead by having most often a pessimistic stance towards the euro area and emerging Asia
36The home bias has not been identi�ed for Feri and Moody's and it is shown to hold for Fitch in Franceand the U.S. at the same time (ownership and headquarter).
37This explains why disagreement with Feri is less frequent although the agency assigns more ratingchanges overall.

5 WHY RATING AGENCIES DISAGREE ON SOVEREIGN RATINGS 80
whereas Moody's exhibits a negative bias towards South America. Fitch Ratings has most
often assigned lower ratings to the Asian & Paci�c region (industrialized).
Table 23: No. of Negative Deviations towards other CRAs
This Table displays country-month observations in which a rating agency has assigned lower ratings tospeci�c regions than its competitors. Due to the di�erent scales, I compare Feri's ratings with those ofthe Big Three along the pre-de�ned three rating categories whereas I use the full rating scale for the BigThree.
(1) (2) (3) (4) (5)Feri Pes. S&P Pes. Moody Pes. Fitch Pes. Observations
EMU 235 296 92 111 1,738
North America 101 17 0 52 486
Asia & Paci�c (industr.) 12 99 74 136 810
South America 19 9 413 98 972
Eastern Europe 526 249 259 156 2,106
Asia (em. markets) 0 202 157 84 1,134
Observations 893 872 995 637 7,246
The �ndings for optimism in Table 24 show that Feri assigns more often better ratings
to emerging Asia and South America than the Big Three. Moody's has most often assigned
better ratings to the EMU, North America, Asian & Paci�c economies and Eastern Europe.
Taking the two Tables together, three observations are worth mentioning: First, I �nd
more volatility in ratings towards emerging markets than towards advanced economies
(this con�rms earlier �ndings). Second, the Big Three are more often optimistic towards
advanced countries whereas Feri has more frequently assigned better ratings to the emerg-
ing world (except for Eastern Europe). Third, I observe that Moody's is the most often
optimistic agency among the Big Three. The agency assigns more often better ratings in
four of the six regions. It turns out that pessimism is more dispersed across agencies and
regions.
Next, I include a set of macroeconomic variables following Cantor and Packer (1996)
and use a probit model to explain in which cases a rating agency shows a lower/higher

5 WHY RATING AGENCIES DISAGREE ON SOVEREIGN RATINGS 81
Table 24: No. of Positive Deviations towards other CRAs
This Table displays country-month observations in which a rating agency has assigned higher ratings tospeci�c regions than its competitors. Due to the di�erent scales, I compare Feri's ratings with those ofthe Big Three along the pre-de�ned three rating categories whereas I use the full rating scale for the BigThree.
(1) (2) (3) (4) (5)Feri Opt. S&P Opt. Moody Opt. Fitch Opt. Observations
EMU 123 74 193 53 1,738
North America 0 12 98 0 486
Asia & Paci�c (industr.) 45 51 221 158 810
South America 418 159 29 118 972
Eastern Europe 181 302 733 133 2,106
Asia (em. markets) 364 88 87 228 1,134
Observations 1131 686 1361 657 7,246
probability to deviate from its competitors:
Pr(pessimismij,t) = F (macrok,t, region, defaultk) + eij,t. (6)
and
Pr(optimismij,t) = F (macrok,t, region, defaultk) + eij,t (7)
Thereby, I can examine whether the descriptive �ndings hold when I control for country-
speci�c variation in the macroeconomic stance. North American countries are not taken
into account due to the low overall disagreement across agencies. Table 25 presents the
probit results for a negative rating bias. I �nd that Feri shows a higher probability to
downgrade Eastern European countries and to assign lower ratings to countries with higher
per capita income. S&P's is more pessimistic on Eastern Europe and on EMU economies
than the other Big Three. Moody's assigns more often negative ratings to South America,
emerging Asia, countries with a default history and those with higher growth rates. The
results for Fitch mirror the descriptive �ndings: I �nd no signi�cant relation between the
region and a higher frequency of stand-alone negative ratings. Here, I do not include the

5 WHY RATING AGENCIES DISAGREE ON SOVEREIGN RATINGS 82
Table 25: Probit Results for a Negative Bias
This Table displays the probit results for the probability to have a more pessimistic stance on a country'srating. The binary variable takes the value one in all years when the respective CRA assigns a lower rating(class) than competitors. Standard errors are clustered on the country level.
(1) (2) (3) (4)Feri Neg. S&P Neg. Moody Neg. Fitch Neg.
GDP per Capita 0.00358** -0.00350** -0.00501*** -0.00127(2.39) (-2.08) (-2.73) (-0.62)
Government Debt -0.00212** 0.000729 -0.00114 -0.000175(-2.10) (1.26) (-1.33) (-0.24)
Fiscal Balance 0.000112 -0.00156 -0.00315 0.000132(0.02) (-0.35) (-0.49) (0.03)
In�ation -0.00439 0.00364 0.00134 -0.00178(-0.97) (1.37) (0.60) (-0.70)
External Balance -0.00569* 0.00263 -0.000562 0.000313(-1.88) (1.03) (-0.22) (0.13)
GDP Growth -0.0132*** -0.00250 0.00499* -0.00189(-3.34) (-0.64) (1.75) (-0.43)
Industrialized 0.0498 0.136* 0.488** 0.0219(0.64) (1.67) (2.57) (0.28)
Default History -0.0632 -0.0173 0.131*** -0.0574(-1.05) (-0.39) (3.05) (-1.38)
EMU 0.0359 0.107** -0.119 -0.0387(0.71) (2.23) (-0.96) (-0.59)
South America 0.00188 -0.0452 0.359*** 0.0308(0.02) (-0.58) (4.13) (0.40)
Eastern Europe 0.175** 0.169*** 0.190** -0.00802(2.41) (2.72) (2.21) (-0.17)
Asia (em. markets) 0.159** 0.234*** -0.0274(2.03) (2.63) (-0.41)
Asia & Paci�c (industr.) 0.0597 -0.118 0.0356(1.11) (-0.97) (0.42)
Observations 681 681 681 681Pseudo R2 0.236 0.118 0.175 0.033
t statistics in parentheses* p<0.10, ** p<0.05, *** p<0.01
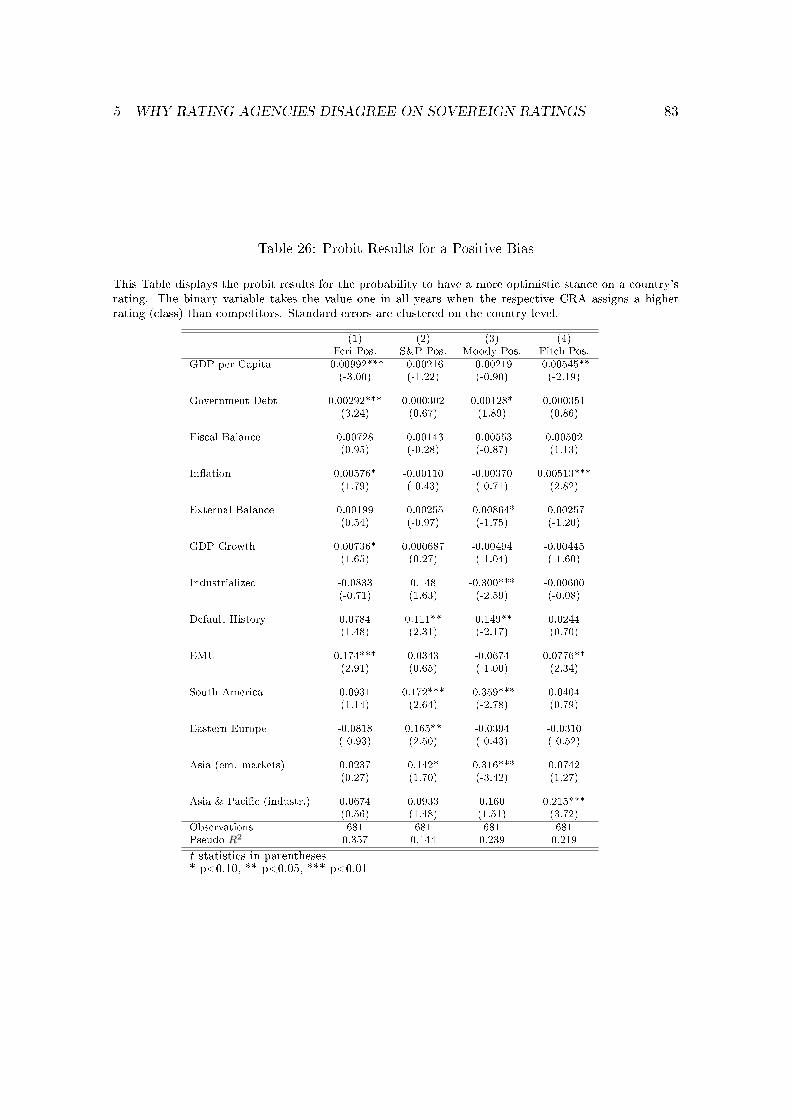
5 WHY RATING AGENCIES DISAGREE ON SOVEREIGN RATINGS 83
Table 26: Probit Results for a Positive Bias
This Table displays the probit results for the probability to have a more optimistic stance on a country'srating. The binary variable takes the value one in all years when the respective CRA assigns a higherrating (class) than competitors. Standard errors are clustered on the country level.
(1) (2) (3) (4)Feri Pos. S&P Pos. Moody Pos. Fitch Pos.
GDP per Capita -0.00992*** -0.00216 -0.00219 -0.00545**(-3.00) (-1.22) (-0.90) (-2.19)
Government Debt 0.00292*** 0.000302 0.00128* 0.000351(3.24) (0.67) (1.89) (0.86)
Fiscal Balance 0.00728 -0.00143 -0.00553 0.00502(0.95) (-0.28) (-0.87) (1.13)
In�ation 0.00576* -0.00110 -0.00370 0.00513***(1.79) (-0.43) (-0.71) (2.82)
External Balance 0.00199 -0.00255 -0.00864* -0.00257(0.54) (-0.97) (-1.75) (-1.20)
GDP Growth 0.00736* 0.000687 -0.00494 -0.00445(1.65) (0.27) (-1.04) (-1.60)
Industrialized -0.0833 0.148 -0.300*** -0.00600(-0.71) (1.63) (-2.59) (-0.08)
Default History 0.0784 0.111** -0.149** 0.0244(1.48) (2.31) (-2.17) (0.70)
EMU 0.174*** 0.0343 -0.0674 0.0776**(2.91) (0.65) (-1.00) (2.34)
South America 0.0931 0.172*** -0.359*** 0.0404(1.14) (2.64) (-2.78) (0.79)
Eastern Europe -0.0818 0.165** -0.0394 -0.0310(-0.93) (2.50) (-0.43) (-0.52)
Asia (em. markets) 0.0237 0.142* -0.316*** 0.0742(0.27) (1.70) (-3.42) (1.27)
Asia & Paci�c (industr.) 0.0674 0.0933 0.160 0.215***(0.56) (1.48) (1.51) (3.72)
Observations 681 681 681 681Pseudo R2 0.357 0.144 0.239 0.219
t statistics in parentheses* p<0.10, ** p<0.05, *** p<0.01

5 WHY RATING AGENCIES DISAGREE ON SOVEREIGN RATINGS 84
United States and Canada due to the lack of variation across agencies.
In Table 26, I show the probit results for a positive rating bias. Here, Feri is more
generous to countries with large ratios of public debt and in�ation. I do not �nd that
a rating agency is characterized by marked optimism towards a speci�c region. This
result stands in contrast to the descriptive �ndings when Feri often assigned more positive
ratings to emerging markets than the Big Three. S&P's has more often an optimistic view
on South America, Eastern Europe and Asia. They also frequently assign better ratings
to previous defaulters than the other Big Three agencies. Moody's is only more optimistic
towards countries with higher public debt ratios whereas Fitch assigns better ratings to
the industrialized Asian & Paci�c region and the euro area.
Taken together, in contrast to widespread political presumptions my results do not
point to the existence of a home bias across the four rating agencies. If anything, Eastern
European countries receive more often lower ratings by Feri than by the Big Three and
S&P's assigns relatively low ratings to the euro area. South American countries are favored
by S&P's and disadvantaged by Moody's. Overall, it seems that Feri assigns more often
positive ratings to emerging markets (and less often negative ratings) whereas the Big
Three are more often generous towards the advanced economies. Fitch seems to have
a more neutral stance towards all regions except for the industrialized Asian & Paci�c
countries.
With respect to the economic determinants of disagreement, Feri seems to assign a lower
weight on general government debt and pays more attention to short-term �uctuations of
economic growth than the Big Three.
5.6 Rating Agency Interaction
Previously, I have explained the behavior of rating agencies by using economic, political
or regional determinants. In this section, I take a closer look at the interaction between
rating agencies. Like I have shown before, Feri disagrees with the Big Three in almost
every second case whereas the Big Three disagree with each other only in every �fth case
(see Table 17).

5 WHY RATING AGENCIES DISAGREE ON SOVEREIGN RATINGS 85
Table 27: Number of Up- and Downgrades
This Table illustrates the total number of up- and downgrades across asample of biannual rating observations across the four rating agencies."Followers" indicate the share of observations when at least one ofthe competitors (excluding Feri) has changed its rating in the samedirection during the previous six months.
(1) (2) (3) (4)Feri S&P Moody's Fitch
Upgrades 185 136 104 126
% of ”Followers” 10% 23% 42% 28%
Downgrades 175 78 48 73
% of ”Followers” 17% 35% 33% 38%
Bartels and Weder di Mauro (2013) and Hill and Fa� (2010) have shown how often
rating agencies take a lead in times of crisis and how often they followed another agency.38
In this chapter, I study whether it is possible to predict a rating agency's downgrade
probability with an empirical model. I deliberately control for times of crisis and focus
on the rating behavior in normal times. During times of crisis CRAs have changed their
ratings frequently which makes it hard to di�erentiate between pure interaction behavior
and common responses to crisis events such as a declaration of default.
My reasoning during normal times is as follows: If one of the Big Three agencies
decides to downgrade a country's rating by at least one notch, sovereign issuers face higher
re�nancing costs when investors begin to sell their positions or when they issue new bonds.
Accordingly, competitors follow with subsequent downgrades as a lower rating increases
sovereign risk by itself due to regulatory provisions such as the Basel capital regulation.
The following behavior is more pronounced for regulated agencies because they face higher
38This part signi�cantly extends an earlier study by Bartels and Weder di Mauro (2013) in which Iprovide a �rst descriptive analysis of leader/follower behavior during selected crises in emerging marketsand the euro area. Here, I extend the previous research by setting up a probit model which also includespotential interaction in normal times.

5 WHY RATING AGENCIES DISAGREE ON SOVEREIGN RATINGS 86
Table 28: Downgrade Interaction
This Table presents the probit results for downgrade interaction between rating agencies. The binaryvariable takes the value in all periods (bi-annual) if a rating agency assigns a downgrade to a country. Theobservations are restricted to those years in which at least one downgrade by at least one agency occurred.The lagged downgrade coe�cients take the value one if a competitor has previously assigned a downgradein the six months before and the agency under consideration has not.
(1) (2) (3) (4)DG Feri DG S&P DG Moody DG Fitch
S&P follower -0.272*** 0.0262 0.0587(-3.33) (0.77) (1.30)
Moody follower -0.0490 0.0563 0.0308(-0.50) (0.84) (0.49)
Fitch follower -0.308*** 0.109** 0.0300(-3.81) (2.07) (0.79)
CCR Change -0.0117** -0.0183*** -0.00585** -0.0142***(-2.12) (-5.00) (-2.06) (-3.97)
Emerging Market Crises 0.111 0.283** 0.167** 0.263**(0.65) (2.55) (2.33) (2.42)
GIIPS Crises 0.117 0.201*** 0.207*** 0.155***(1.23) (3.98) (5.73) (2.97)
Observations 428 428 428 428Pseudo R2 0.078 0.185 0.196 0.135Share of pred. DG (p > 0.5) 0.23 0.4 0.25 0.18
t statistics in parentheses
* p < 0.10, ** p < 0.05, *** p < 0.01

5 WHY RATING AGENCIES DISAGREE ON SOVEREIGN RATINGS 87
costs of downgrades in the form of subsequent changes in bank ratings or rising interest
rates in the economy. On the contrary, a smaller, less in�uential agency is not impeded by
sovereign ceilings policy or other forms of unintended feedback.
In the following probit model I compute the probability of a negative/positive change
in the rating within six months following the assignment of a lower rating by at least
one other agency (lagged DG/ lagged UG). When considering downgrades, I control for
the recent sovereign debt crises in emerging markets as well as the crises in the GIIPS
economies. I also control for external credit risk shocks of common knowledge re�ected
by the semi-annual change in the Institutional Investor's Country Credit Rating (CCR).
The inclusion of this variable helps to account for situations when rating agencies respond
together to previously observable external shocks. Table 27 illustrates the number of up-
and downgrades for each rating agency and shows the share of rating changes when a
competitor has assigned a change in the same direction during the six previous months.
These preliminary results show that the Big Three respond to each other in 23 to 42 percent
of the change observations. Feri follows the Big Three less often which is probably due to
its higher volatility. In the following, I test in three speci�cations for each agency whether
the Big Three have a statistically signi�cant propensity to follow each other. I also test in
a fourth speci�cation whether Feri responds to the Big Three.
Pr(up− /downgradei,t) = F (up− /downgradej,t−1, crisisk,t, ccrk,t) + ei,t (8)
Table 28 presents the probit results for downgrade interaction across agencies. In the
case of Feri (column (1)), i observe that Feri's downgrades are not related to the rating
actions of the Big Three. On the contrary, the coe�cients suggest that a downgrade by Feri
is even less likely when the Big Three assigned a downgrade in the previous six months.
Overall, the model is not able to predict Feri's downgrade probability. Even in times of
crisis in the GIIPS and in emerging markets, Feri does not assign more downgrades than
usual.
In case of the Big Three, I observe that all interaction coe�cients are positive. However,
only the coe�cient for S&P following Fitch is signi�cant. Besides, the Big Three show a
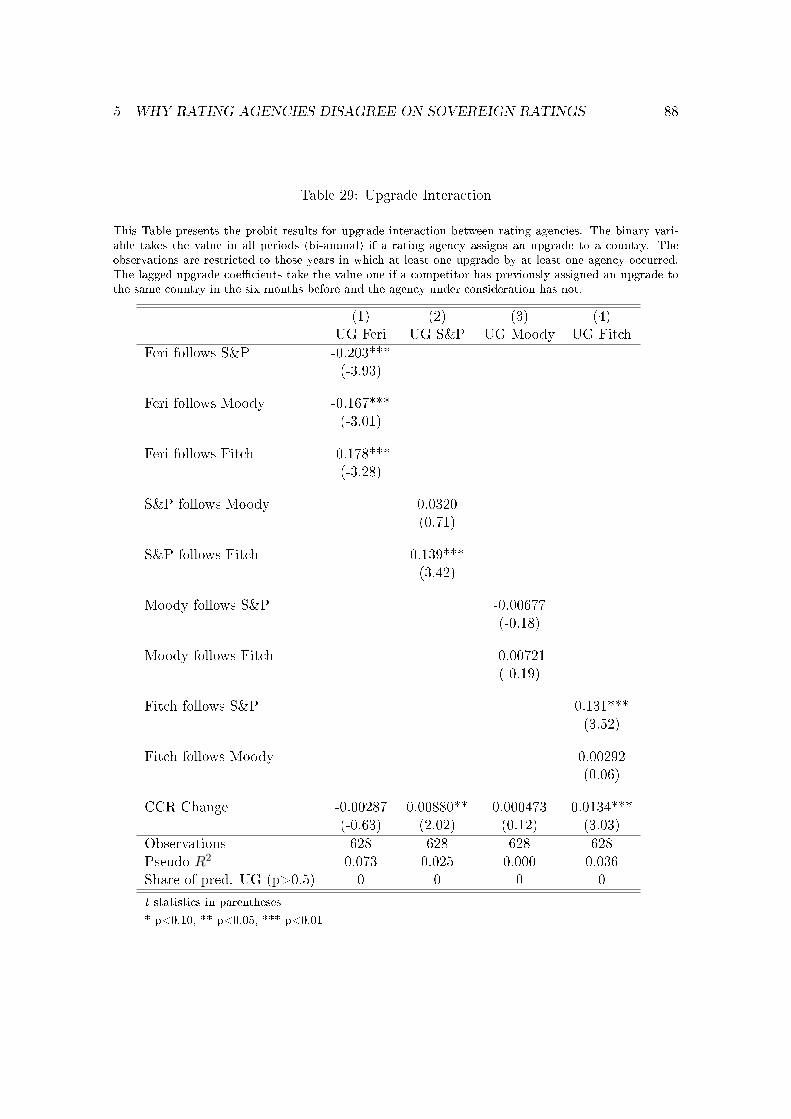
5 WHY RATING AGENCIES DISAGREE ON SOVEREIGN RATINGS 88
Table 29: Upgrade Interaction
This Table presents the probit results for upgrade interaction between rating agencies. The binary vari-able takes the value in all periods (bi-annual) if a rating agency assigns an upgrade to a country. Theobservations are restricted to those years in which at least one upgrade by at least one agency occurred.The lagged upgrade coe�cients take the value one if a competitor has previously assigned an upgrade tothe same country in the six months before and the agency under consideration has not.
(1) (2) (3) (4)UG Feri UG S&P UG Moody UG Fitch
Feri follows S&P -0.203***(-3.93)
Feri follows Moody -0.167***(-3.01)
Feri follows Fitch -0.178***(-3.28)
S&P follows Moody 0.0320(0.71)
S&P follows Fitch 0.139***(3.42)
Moody follows S&P -0.00677(-0.18)
Moody follows Fitch -0.00721(-0.19)
Fitch follows S&P 0.131***(3.52)
Fitch follows Moody 0.00292(0.06)
CCR Change -0.00287 0.00880** 0.000473 0.0134***(-0.63) (2.02) (0.12) (3.03)
Observations 628 628 628 628Pseudo R2 0.073 0.025 0.000 0.036Share of pred. UG (p>0.5) 0 0 0 0
t statistics in parentheses
* p<0.10, ** p<0.05, *** p<0.01

5 WHY RATING AGENCIES DISAGREE ON SOVEREIGN RATINGS 89
higher probability to assign a downgrade in times of crisis and after negative shocks to the
Country Credit Rating. Yet, due to the small number of rating change observations in the
overall sample, the model can only predict between 18 and 40 percent of the downgrades.
In Table 29, I present the results for upgrade interaction. I �nd that Feri assigns
upgrades in a rather anti-cyclical fashion whereas S&P and Fitch have a higher degree of
interaction. I also observe that positive shocks to the CCR increase the upgrade probability
among two of the Big Three, however the coe�cients are much smaller relative to those in
the probit model for downgrade interaction. Add to this, the model does not predict the
upgrade propensity of agencies at all which is in line with former theoretical and empirical
studies which �nd that upgrades usually do not come as a surprise to market participants
because they are based on public information (Hand et al. (1992), Boot et al. (2006)). Also,
rating agencies should be less reluctant to assign upgrades since they are not constrained
by sovereign ceiling policies.
To sum up, I conclude that Feri seems to be more independent in its decisions to
downgrade a country. The coe�cients for Feri are even negative whereas I �nd positive
and signi�cant results for the Big Three. One explanation is that the smaller European
agency uses a di�erent rating model and that it is more independent than the Big Three.
Second, it seems that following behavior is more likely to occur during times of recessions
rather than in times of economic booms.
5.7 Concluding Remarks
The purpose of this chapter is to investigate the question why rating agencies have di�erent
perceptions of country credit risk. After exploring the rating behavior of four agencies I �nd
that belonging to a particular world region or the membership in the European Monetary
Union neither leads to a higher split probability nor does it explain a rating if I control for
other macroeconomic and political determinants.
Besides, the subscriber funded European agency Feri seems to have a stronger short-
term focus (economic growth, �scal balance, external balance) whereas the Big Three put
more weight on long-term macroeconomic developments (GDP per capita, Government

5 WHY RATING AGENCIES DISAGREE ON SOVEREIGN RATINGS 90
Debt). This can serve as an explanation why Feri tends to change its ratings more often
than the Big Three.
My �ndings further suggest that sovereign ratings are not shaped by the origin or the
language of the rating agency. Thus, the issuer-pays model does not constitute a con�ict
of interest for sovereign ratings. I argue that this is due to the fact that fees for sovereign
ratings are relatively low compared to for instance structured �nance products. Also, the
agencies produce unsolicited ratings 39. However, I �nd that CRAs use di�erent rating
models to assess a country's default risk. As I have stated above, the results suggest that
Feri puts more weight on short-term variables.
Finally, I have explored whether rating agencies respond to the actions of their com-
petitors. The probit results indicate that the Big Three have a higher propensity to follow
each other than Feri. The descriptive results show that the Big Three follow each other in
every third case on average while Feri tends to be more independent (10-17% follower deci-
sions). Also, the probit results support this �nding with the follower coe�cients even being
negative and signi�cant. The probit results for downgrades largely support the empirical
�ndings whereas the upgrade results cannot be explained by following behavior. This result
is related to earlier �ndings by Hand et al. (1992) who show that the impact of downgrades
on markets is much stronger than the response of interest rates on upgrades. The authors
conclude that downgrade decisions include more new information than upgrades.
One may conclude from this that the inclusion of sovereign ratings in regulatory frame-
works puts large and in�uential agencies under pressure to be reluctant towards rating
changes until one of the competitors starts to take action. I have shown that this behavior
is especially pronounced in times of crisis (in the euro area and in emerging markets) which
might contribute to explain the pro-cyclical downgrades that I have seen in the past.
To conclude, my analysis does not support the notion that rating agencies have deliber-
ately caused or at least aggravated the sovereign debt crisis in the euro area and might thus
contribute to soothe concerns of European politicians. However, the inclusion in regulatory
frameworks and the sheer size of agencies may have led to some unintended pro-cyclicality.
39Feri produces only unsolicited ratings and the Big Three also have a share of 10-20% unsolicited ratingsacross all country groups and regions.

5 WHY RATING AGENCIES DISAGREE ON SOVEREIGN RATINGS 91
Of course, I do not claim that the same applies to asset classes such as structured �nance
products or corporate bonds where the issuer-pays model is of much more importance.
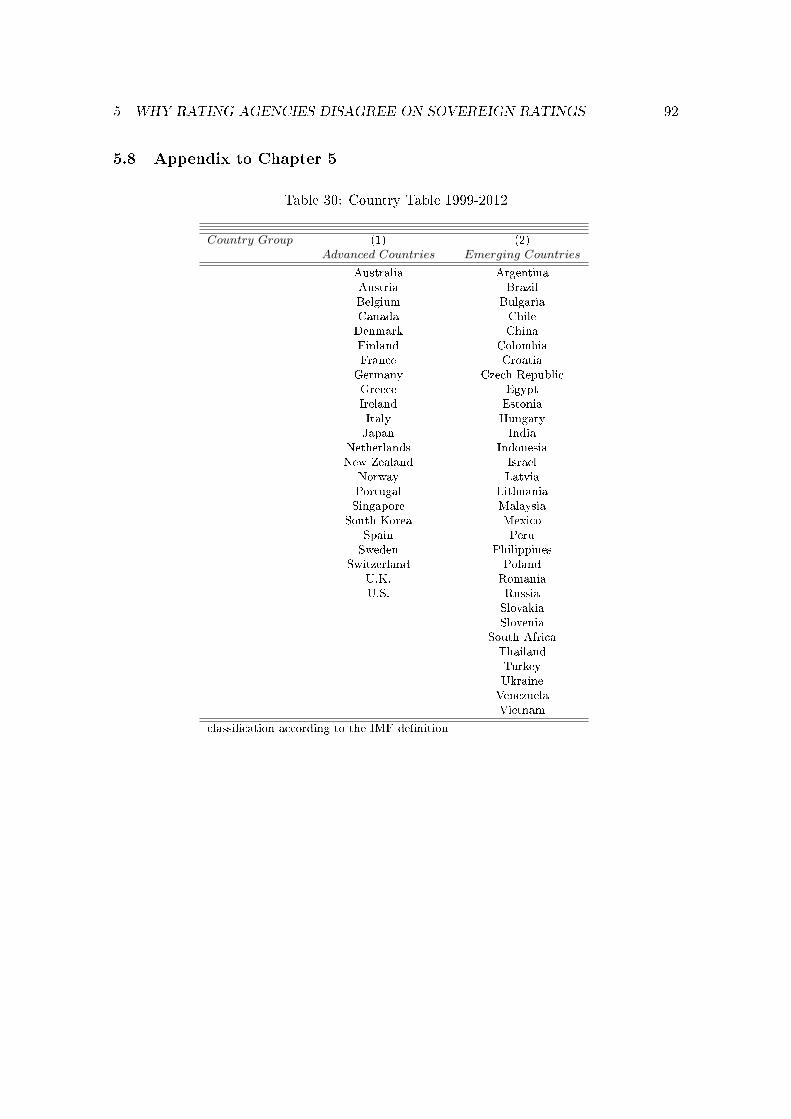
5 WHY RATING AGENCIES DISAGREE ON SOVEREIGN RATINGS 92
5.8 Appendix to Chapter 5
Table 30: Country Table 1999-2012
Country Group (1) (2)Advanced Countries Emerging Countries
Australia ArgentinaAustria BrazilBelgium BulgariaCanada ChileDenmark ChinaFinland ColombiaFrance CroatiaGermany Czech RepublicGreece EgyptIreland EstoniaItaly HungaryJapan India
Netherlands IndonesiaNew Zealand Israel
Norway LatviaPortugal LithuaniaSingapore Malaysia
South Korea MexicoSpain PeruSweden Philippines
Switzerland PolandU.K. RomaniaU.S. Russia
SlovakiaSlovenia
South AfricaThailandTurkeyUkraineVenezuelaVietnam
classi�cation according to the IMF de�nition

5 WHY RATING AGENCIES DISAGREE ON SOVEREIGN RATINGS 93
Table 31: Rating Transformation
(1) (2) (3) (4)Rating Notation Feri S&P/Fitch Moody′s
AAA/AAA/AAa 9 17 17
AA/AA+/Aa1 8 16 16AA/AA/Aa2 8 15 15A/AA-/Aa3 7 14 14B+/A+/A1 6 13 13B+/A/A2 6 12 12B/A-/A3 5 11 11
C/BBB+/Baa1 4 10 10C/BBB/Baa2 4 9 9C/BBB-/Baa3 4 8 8
D/BB+/Ba1 3 7 7D/BB/Ba2 3 6 6D/BB-/Ba3 3 5 5D-/B+/B1 2 4 4D-/B/B2 2 3 3D-/B-/B3 2 2 2
E/CCC+/Caa1 1 1 1E/CCC/Caa2 1 1 1E/CCC-/Caa3 1 1 1E-/CC/Ca 1 1 1E-/C/Ca 1 1 1
Default/Default/C 1 1 1
Rating transformation based on the Feri translation Table
Sources: Feri Rating GmbH, Standard & Poor's, Moody's, Fitch

5 WHY RATING AGENCIES DISAGREE ON SOVEREIGN RATINGS 94
Table 32: Classi�cation of Ratings
(1) (2) (3) (4)S&P Mooody's Fitch Feri
AAA/Aaa/AAA 179 191 169 142
AA/Aa/AA 95 89 104 118
A/A/A−B 122 129 117 145
BBB/Baa/C 134 122 141 172
BB/Ba/D 113 112 110 52
B/B/D− 43 50 43 34
CCC −D/Caa−D/E − E− 16 8 11 39

5 WHY RATING AGENCIES DISAGREE ON SOVEREIGN RATINGS 95
Table 33: Descriptive Statistics
(1) (2) (3) (4)Overall Sample Non-Split Split Feri-Big3 Split Big3
GDP per Capita 19.000 27.205 14.265 15.848
Government Debt 52.6 58.8 48.3 50.8
External Debt 64.2 36.1 84.7 73.2
Political Stability 0.92 1.04 0.98 0.69
Government Effectiveness 0.82 1.18 0.6 0.72
∆ Country Credit Rating (CCR) 4.58 4.17 5.12 5.02
Default History 221 47 100 74
European Monetary Union 137 63 51 23

6 DOES THE RATING INDUSTRY NEED FURTHER REFORMS? 96
6 Does the Rating Industry Need Further Reforms?
6.1 Introduction
In the previous chapter, I found no indication that CRAs systematically rate particular
sovereigns (for instance the home region) better than others. However, the result indicate
that the Big Three seem to follow each other relatively often in the case of downgrades. In
contrast to Feri, the ratings of the Big Three are included in many regulatory frameworks
and thus, the agencies may often feel pressed to follow competitors. In this chapter, I
discuss potential regulatory reforms to mitigate pro-cyclical rating decisions.
Apart from the behavior of sovereign ratings, I have pointed to potentially misleading
incentives in the second chapter of this thesis. The issuer-pays structure and related
problems such as revolving doors appeared speci�cally on the market for structured �nance
products. With the outbreak of the �nancial crisis in 2007, these problems became visible
when investors recognized that underlying loans of structured products (mostly in the form
of subprime mortgages) were not worth a AAA rating.
In their response to the recent crises, the U.S. Government and the EU Commission have
initiated major regulatory reforms for the rating industry in order to enhance competition
and transparency. In 2006, the U.S. Congress passed the Credit Rating Agency Reform Act.
Following the �nancial crisis, these new rules have been further extended by the Dodd-
Frank Act signed in July 2010. The EU introduced a regulatory framework for rating
agencies in 2009 (Regulation No 1060/2009) which was also followed by an amendment
passed in June 2010.
Still, critics claim that the new framework is not su�cient to eliminate the incentive
problems, in particular con�icts of interest (de Haan and Amtenbrink (2011), White (2010),
Opp et al. (2013)).
The idea of this chapter is to provide a review of the regulatory reforms in light of
the previously discussed problems such as the issuer pays structure or revolving doors.
Thereafter, I will present and discuss potential amendments to the current institutional
framework. Here, the major focus is on the establishment of an auctioneer between CRAs
and issuers to eliminate con�icts of interest and to enhance competition (on the market for

6 DOES THE RATING INDUSTRY NEED FURTHER REFORMS? 97
structured �nance products). This idea is complemented by a proposal for a more decen-
tralized supply side. Further, I discuss whether the centralization of rating publication may
help to mitigate pro-cyclical announcements (for sovereign ratings). Finally, this chapter
examines whether the proposed amendments may contribute to an increased utilization of
user-paid rating services.
I start with an overview of the recently passed reforms for the rating industry in the
United States and Europe. In this context, I will also review the alternative compensa-
tion models for the rating agencies which have been proposed by the U.S. Government
Accountability O�ce (GAO). In the main part, I will focus on the potential supplements
to the existing regulation before I conclude.
6.2 Regulatory Initiatives
6.2.1 Rating Agency Regulation in the EU
In September 2009, a new regulatory framework for credit rating agencies has been adopted
by the European Parliament and the Council (Regulation No. 1060/2009). In June 2010,
the rules have been supplemented by an amendment. Taken together, the legislation
is centered around the registration procedure, rules of conduct and the supervision of
registered CRAs (de Haan and Amtenbrink (2011)).
The rules of conduct under Regulation No. 1060/2009 are mostly self-regulating pro-
visions, adopted from the rules of conduct of the International Organization of Securities
Commissions (IOSCO-code). They are based on voluntary compliance and do not include
any enforcement mechanisms (de Haan and Amtenbrink (2011)). Regulation 1060/2009
has transferred some of the voluntary provisions into public law, such as the publication of
changes in methodologies and rating models or the disclosure of business activities related
to the rating process. In addition, the regulation comprises provisions for the relation-
ship among the supervisory authorities (Member States and the European Securities and
Markets Authority (ESMA)). Finally, it includes detailed requirements for the registration
process of CRAs, in particular the provision for foreign rating companies to establish a
subsidiary on European territory (Commission (2010)).

6 DOES THE RATING INDUSTRY NEED FURTHER REFORMS? 98
In the Regulation Amendment to No. 1060/2009, the focus was primarily on more
transparency to enhance competition among CRAs. The administrator (ESMA) was ad-
vised to facilitate the establishment of newly registered agencies by providing private �rm
information for unsolicited ratings. In addition, national entrants shall be supported by
the member states to stimulate competition: Market entry for small and medium-sized
agencies shall be enhanced by encouraging �rms to collaborate on a common rating fo-
rum. Also, the EU Commission considers the creation of a European Independent Rating
Agency with a public/private structure. The rating foundation shall provide more inde-
pendent and reliable ratings for Europe since the market is currently dominated by the Big
Three which have their headquarters in the U.S. All those measures have indeed facilitated
the entrance of new �rms on the rating market, however, until today their market share
remains small compared to that of the Big Three (de Haan and Amtenbrink (2011)).
Furthermore, the EU has decided to deal with the phenomenon of rating in�ation by
authorizing ESMA to monitor and assess rating agencies' performance. However, this
ex-post assessment does not prevent a CRA from in�ating their ratings initially (Mathis
et al. (2009)). Even if the supervisor penalizes misbehavior, the horse has already left the
barn. This was shown by Mathis et al. (2009) and Bar-Isaac and Shapiro (2013) who claim
that reputation concerns are dominated by short-term pro�t-oriented behavior. Add to
this, it is di�cult to measure performance in advance of maturity as risks have not yet
materialized.
The regulation also entails detailed prescriptions to prevent con�icts of interest as for
instance the implementation of a rotation system between analysts and rating committees.
In addition, at least one third of the agency's administrative and supervisory body is not
allowed to participate in rating activities. Still, these extensive and detailed provisions
cannot yet fully prevent the emergence of strong relationships between issuer and rating
agency as the latter is still being paid by the former. What is more, the new regulation
lacks precision, enabling �rms to avoid those rules (Amtenbrink and De Haan (2009)).
Another proposal by the EU claims the wider use unsolicited ratings. The regulators
argue that the mandatory disclosure of �rm information shall lead to more ratings per
rated product. Thereby, competition will be enhanced and the agencies shall be prevented

6 DOES THE RATING INDUSTRY NEED FURTHER REFORMS? 99
from in�ating their ratings. However, Becker and Milbourn (2011) show that a rising
number of market participants in the rating industry will not necessarily lead to better
results when �rms are still able to shop for ratings. In addition, it seems di�cult to
decide which information the �rm has to reveal to the public. Firms may also argue that
the mandatory disclosure of private information leads to an uncontrolled circulation of
intellectual property (White (2010)).
Amtenbrink and De Haan (2009) bring up a more general critique on the reforms: They
claim that the current regulatory framework even worsens the situation compared to the
unregulated past. In their view, the EU tries to re-establish trust in the rating industry
by pointing out its achievements in terms of supervision and transparency. However, since
the major problems (i.e. con�ict of interest, use of ratings in regulation) have not been
eliminated, investors are endangered to walk right into the same trap as before simply
because they trust in the seemingly disciplining e�ect of the new framework.
6.2.2 Rating Agency Regulation in the U.S.
In 2006, the U.S. Congress enacted a reform for the rating industry to "improve ratings
quality for the protection of investors and in the public interest by fostering (...) competi-
tion in the credit rating agency industry" (U.S. Government (2006)). Further steps were
laid down in the Dodd-Frank Act passed in 2010 (U.S. Government (2010)). Following the
Rating Agency Act in 2006, the U.S. Government Accountability O�ce (GAO) was put in
charge to prepare a study on the impact of the Act concerning independence, competition,
transparency, feasibility, market acceptance and choice, and oversight (GAO (2012)). In
its report to congressional committees, the GAO came up with a number of alternative
compensation models which will be discussed later in this chapter.
The Rating Agency Act of 2006 revised the conditions for the registration of NRSROs
and provided more detailed requirements concerning transparency issues. Most impor-
tantly, the SEC was advised to set up rules to facilitate the registration process for new
NRSROs. In addition, it was mandated to formulate provisions in order to deal with
con�icts of interest and to foster transparency. Thus, the SEC formulated a new law for
NRSROs by not allowing them to issue ratings for products they had helped to design.

6 DOES THE RATING INDUSTRY NEED FURTHER REFORMS? 100
Further, rating analysts are prohibited to be involved in pricing decisions. Finally, regis-
tered CRAs are obliged to provide details of their methodologies, assumptions and track
records to the SEC (White (2010)).
Additional binding requirements have been set out in the Dodd-Frank Act: The �rst
objective is to prevent employees from in�ating ratings in their own interest. Compliance
shall be ensured by the managing board ("look-back review"). Job rotation between issuers
and credit rating agencies has to be monitored closely and reported to the SEC. With the
Dodd-Frank Act, the Congress has also imposed additional requirements to the issuers of
structured �nance products. For instance, they have to publish standardized information
about the underlying loans of the rated product. This measure intends to reduce the
reliance of investors on credit ratings (U.S. Government (2010)).
Another provision of the Dodd-Frank Act advises the SEC to hire smaller agencies for
the creation of secondary ratings. The newly registered agencies shall get access to �rm
information in order to provide unsolicited ratings. However, it remains unclear who will
be obliged to pay for these ratings and in which way smaller rating agencies should be
enabled to acquire the necessary resources to provide a credible and qualitative alternative
to the established agencies (SEC (2012)).
In fact, what has been done is similar to the reforms in the EU. Regulators try to deal
with con�icts of interest by facilitating the registration procedure for new entrants and by
setting stricter rules to the NRSROs regarding their incentives to in�ate ratings. However,
White (2010) claims that the new rules in the U.S. are subject to the same problems as
the provisions in the EU: Entry barriers continue to exist, con�icts of interest have not
been credibly removed, and the mandatory disclosure of �rm information may lead to an
erosion of �rms' intellectual property.
It is also remarkable that as part of the new bill the Congress has instructed the GAO
to set up alternative proposals in order to prevent future con�icts of interest in the rating
industry. This mandate leads observers to believe that the regulators were not convinced by
their own reform. Following, I shortly discuss the GAO ideas which have been summarized
in a report to Congress in January 2012 (GAO (2012)).

6 DOES THE RATING INDUSTRY NEED FURTHER REFORMS? 101
6.2.3 Alternative Compensation Models (GAO Report)
The GAO has published seven alternative compensation models. They either follow the
issuer-pays or investor-pays approach or they present a mixture of both. The proposals
also di�er in the design of third-party institutions, the allocation of rating mandates, fee
determination, and performance monitoring. In the following, I compare the presented
models along those criteria and summarize major comments from market participants
which have been published by the SEC (SEC (2012)). A summary of the proposals is
presented in Table 34 of the Appendix. I exclude an analysis of performance monitoring,
since the proposals are similar to recent regulatory innovations.
Third-party institutions All GAO proposals (except the Investor-Owned CRA ap-
proach) introduce a third-party in the form of a governmental agency or an independent
body. Their main tasks are the allocation of rating mandates, fee determination and
performance monitoring.
The third-party institution has a central role in the credit rating process: First, it
decides about the number of NRSROs (registration process) and the allocation of mandates.
Second, it has to monitor the rating agencies' performance and is responsible for sanctions.
Finally, a third-party institution may even be advised to set rating fees.
The formation of an independent body has a major advantage, namely to break the
relationship between CRAs, issuers and investors. But it is also subject to criticism (SEC
(2012)): As an independent institution, the administrator cannot be held accountable by
the public and might be perceived as non-democratic. If the administrator is designed as
a dependent body of the government, one may argue that decisions will be biased in the
direction of the government's interests, i.e. to protect nationally important companies.
One solution of this problem could be the assignation of an explicitly de�ned mandate
to the SEC or ESMA as independent boards. For instance, they are advised to guarantee
a transparent and credible rating process. The administrator's management should then
be held accountable for obvious violations by the Congress/Parliament. The foundation of
competition authorities or antitrust divisions have turned out successful in the past and
may serve as a role model.

6 DOES THE RATING INDUSTRY NEED FURTHER REFORMS? 102
Irrespective of the degree of independence, the complexity of tasks calls for highly
quali�ed sta�: First, employees must be able to assess the adequacy of rating methods
and their applicability during the rating process. Second, they have to assess the agencies'
performance on a regular basis. And third, they might be responsible for the determination
of rating fees (as has been argued by some of the GAO proposals) so that agencies earn
an appropriate return for their activities. Still, important questions remain unanswered:
How many additional resources are needed in the rating process? Which consequences for
prices and supplied quantities of structured �nance products can be expected? How to
recruit quali�ed personnel with su�cient quali�cation (SEC (2012))?
Allocation of rating mandates The selection of NRSROs is another crucial feature in
the credit rating process: Only the ratings of registered and certi�ed CRAs are regarded
as eligible for regulatory purposes. Thus, it is almost impossible for a non-registered rating
agency to gain market shares. But even if a CRA obtains the NRSRO certi�cate, it will re-
main di�cult to acquire rating mandates in the current setting due to a lack of reputation
for any newcomer. The alternative compensation models make several proposals to facil-
itate market entry for newcomers: Random assignment by the administrator, designation
by investors, implementation of a bidding process or allocation of periodic mandates.
If mandates are assigned by random, it will be assured that no long-term relationship
between issuer and rating agency can be built up (reduces the revolving door problem
described in 2.4). At the same time, rating quality may erode because agencies know for
sure that they will receive a mandate, irrespective of their expertise (SEC (2012)). Add to
this, they have no possibility to use experience from the past.
In the designation model, CRAs are directly recruited by investors. On the one hand,
this procedure will strengthen the position of investors in the rating process. On the other
hand, rating agencies are then supposed to provide ratings with no guarantee that these
will later be acquired by an investor. Hence, rating agencies have incentives to invest only
little research e�ort because of the ex-ante uncertainty to receive compensation afterwards
(SEC (2012)).
In the Alternative User-Pays Model, creditors have to contribute upfront fees to a
6 DOES THE RATING INDUSTRY NEED FURTHER REFORMS? 103
central fund before a product is issued. NRSROs are then allowed to bid for a rating
mandate which is assigned conditional on the price, extent of diligence by the agency and
the quantity of �rm information that has to be provided. By implementing a bidding
process, competition between agencies is enhanced and at the same time the regulator
ensures rating quality. Still, a central role is assigned to the latter who has to trade-o� the
lowest bid against the extent of diligence o�ered by the bidder.
Finally, the allocation of periodic mandates ensures that a rating agency has no guar-
antee to receive a mandate until maturity of the product. Instead, the periodic reallocation
of mandates will incentivize agencies to provide accurate ratings. A major problem here
is that the initial mandate is allocated by random and is therefore subject to the same
drawbacks as in the random assignment model.
Fee determination The alternative compensation models o�er two types of fee deter-
mination: administrative price setting or market-based determination. The latter is only
applied in the investor-pays proposal. However, as I have shown in section 6.1, this model
is subject to problems of asymmetric information, namely free-riding incentives and ad-
verse selection (Kashyap and Kovrijnykh (2013), Leland and Pyle (1977)). Then again,
administrative price-setting as an alternative requires a lot of information about the sup-
ply and demand side of the market. Still, the GAO proposals provide little clari�cation
concerning the determination of those fees. Some authors state that fees shall either rely
on the respective type of bond/security or on the complexity of products. Others claim
that fees shall be determined by historic and projected volumes of primary issuance and
secondary market trading.
After all, the process of fee determination is complex and resource-intensive. This may
again lead to higher prices for issued products and possibly to a lack of transparency.
Finally, the administrator will always be subject to criticism and pressure by both market
sides due to the rather vague suggestions concerning determinants of the fee-setting (SEC
(2012)).

6 DOES THE RATING INDUSTRY NEED FURTHER REFORMS? 104
6.3 Potential Supplements to the Current Regulation
Although regulators have taken several initiatives in order to re-establish investors' con-
�dence in the quality of ratings, the reforms are not yet completed. In particular, the
regulatory inclusion of ratings and the issuer-pays structure have largely been left un-
touched. In the following, I combine several existing proposals for the rating industry to
address the ratings for structured �nance products where the issuer-pays structure is of
particular importance. Speci�cally, I discuss a combination of three pillars: First, the in-
troduction of auctions for rating mandates. Second, a registration process to allow for the
emergence of a more decentralized supply side and third, a revised publication process to
reduce pro-cyclical volatility on �nancial markets. Whereas the �rst two pillars refer to the
ratings for structured �nance products, the revised publication process applies especially
to sovereign ratings.
6.3.1 The Introduction of Rating Auctions
Bolton et al. (2012) claimed that the issuer-pays problem can be solved when issuers have
to expend upfront payments before CRAs do their initial analysis. The idea is based on
the so called "Cuomo plan" which is a voluntary agreement between the New York State
Attorney Andrew Cuomo and the Big Three that the latter receive rating fees from the
issuers before their initial analysis. The authors claim that upfront payments will eliminate
incentives to in�ate ratings.
However, the Cuomo agreement does not exclude rating shopping by issuers who are still
allowed to choose freely among a list of registered CRAs. Another problem emerges when
the relationship between �rms and rating agencies goes beyond rating activities. In this
case, both parties may use other channels in order to reward in�ated ratings.
As shown in section 6.2.3, the GAO proposals have set out another way of eliminating
con�icts of interest: In the alternative compensation models, they introduce an indepen-
dent third-party administrator to serve as a bu�er between issuer and rating agency. For
instance, the Random Selection Model suggests the creation of a clearinghouse which as-
signs rating mandates by applying a random procedure. First, issuers have to pay a rating
fee depending on the type of security issued to the clearinghouse. Subsequently, the latter

6 DOES THE RATING INDUSTRY NEED FURTHER REFORMS? 105
allocates these contributions to mandated rating agencies. Similar proposals are mentioned
in the Stand-Alone Model, the Designation Model and the Issuer-and-Investor-pays Model
(see Table 34 in the Appendix to this chapter).
The main advantage of a third-party administrator is the elimination of incentives to in-
�ate ratings or to shop for ratings. Further, rating agencies do not have to worry about
their business model since the fees are still contributed by the issuer and not by the user of
a rating. However, it remains to be explained how a third-party institution will determine
the rating fee. In general, market pricing should be favored in order to ensure market
clearing. This is not the case when a the third-party administrator has to set rating fees.
An alternative solution is the introduction of a market mechanism such as the third-
party administrator organizing auctions. Based on auction platforms, initial rating man-
dates for every new product (or group of products) to be issued are traded. Registered
CRAs (for this product category) will then o�er their bids to the administrator. The three
(or more) lowest bids will be forwarded to the issuer who has either to pay the initial fee
according to the bids or may withdraw his o�er. A second upfront contribution has to be
paid into a fund similar to the "Cuomo plan" to �nance the creation of subsequent ratings
until maturity of the product. The size of those upfront payments will be subject to the
size of the initial fee and they are conditional on maturity. The variable part will be paid
out on an annual basis until maturity.
The set-up ensures that rating agencies are indirectly held responsible in the case of
defaults by keeping the variable part of their rating fees. This framework is analogous to
the current compensation schemes for supervisory board members and the management of
listed companies: Incumbents receive a �xed salary and a variable part whereby the latter
is conditional on the long-term stock performance of the company. Thereby, managers
and board members shall have less incentives to reap short-term pro�ts at the expense of
the company's future value. Likewise, the payout of rating fees may also be divided into
two parts: A �xed component will be disbursed with the initial rating creation whereas a
smaller second component will be paid out annually for subsequent rating updates. For
the case that the issuer becomes insolvent, the variable part is kept in the Fund be it that
the rating agency did not predict the default. Equivalently, the rating agency does not

6 DOES THE RATING INDUSTRY NEED FURTHER REFORMS? 106
receive the annual component in those years when it predicted a default which did not
occur. Thereby, the regulator prevents agencies to assign low ratings as to insure against
the risk of default. This incentive structure may contribute to a stronger commitment of
the CRA to its mandate.
The auction-based framework has a number of implications: First, it mitigates the mis-
allocation of mandates due to an imperfect price-setting. Especially for complex securities,
it seems to be di�cult for a regulatory authority to set market-clearing fees for the rating
production. In my view, the determination of rating fees is of crucial importance since
it determines the �nal price and supply of structured �nance products. Otherwise, if the
rating fee is set by the regulator, one may further expect issuers and CRAs to exert more
pressure on the administrator than in the case of a market-based determination. Here,
increasing rating fees and rising prices for structured securities simply re�ect the research
e�ort in order to provide independent and sophisticated information about the default risk
of complex products.
Second, the auction-based framework ensures competition between the rating agencies.
A bidding process will take place on an auction platform giving access to every registered
agency. New issues are displayed together with information about maturity, underlying
bonds and other concomitant product characteristics. One may criticize that the auction
will be won by those agencies that put the least e�ort in rating activities because the lowest
bids win. However, the CRAs have strong incentives to keep their initial mandate, since
they have already undertaken research e�ort to rate this security in the �rst place (sunk
costs). Also, in contrast to the random-selection of agencies, a bidding process ensures
that registered CRAs continue to innovate and improve their rating methodologies. By
random appointment, the agencies know for sure that they will receive a mandate. Hence,
they have fewer incentives to invest in individual research e�ort than in the case of a
bidding process. Finally, the annual payout of a performance-related part of the fee should
contribute to self-discipline.
However, the auction process has also disadvantages: First, the proposal to split the
rating fee in a �xed and a variable component is not always performance-related. In cases of
issuers not having defaulted, the rating fees are paid out in full despite possible di�erences

6 DOES THE RATING INDUSTRY NEED FURTHER REFORMS? 107
in the relative performance of mandated agencies. However, who should then be in charge
to assess the probability of default before maturity? A truly objective performance measure
seems to be di�cult to obtain as the true default probability is not predictable. Therefore,
the proposed idea uses the only objective criterion for rating performance, namely default
or non-default. In order to improve performance, one may discuss the introduction of a
sanction for high rating volatility (for instance frequent changes of more than one notch).
This would ensure the long-term orientation of credit rating agencies regardless of business
cycles. Gaillard (2014) points out that one important merit for regulators is the stability
of ratings relative to the more volatile market indices. A major drawback of this proposal
is that CRAs become too reluctant to change their rating although they may consider a
rating action to be necessary.
Second and even more important, issuers may fear that the mandated agencies do not
have the desired reputation or expertise to rate them. For this reason, the regulator has
to ensure that only those CRAs have access to the auction process which provide the
necessary resources in terms of sta� size and expertise. Accordingly, I will proceed with a
discussion of the registration process in the following section.
6.3.2 Towards a Decentralized Supply Side
One idea to increase the quality of ratings is presented by Goodhart (2009) and Eij�nger
(2012) who claim that the rating industry needs a more decentralized structure. The
authors suggest that more competition on the supply side would lead to a better use
of comparative advantages by enabling small agencies to establish reputation in speci�c
niches. This reform would entail consequences for the industry and the issuers alike: First,
with a higher percentage of small specialized agencies in the market, the industry will be
more dispersed across product categories and regions. This may lead to negative scale
e�ects and therefore higher rating fees, especially when complex products require a more
intensive use of costly resources. Second, decentralization may facilitate market entry for
small �rms with a special focus on certain products when they provide better expertise
on speci�c issuance than the agencies trying to supply credit ratings for the entire world
across all asset classes.

6 DOES THE RATING INDUSTRY NEED FURTHER REFORMS? 108
In contrast to other proposals (Goodhart (2009) and the Dodd-Frank Act (15E(w) system))
I suggest that rating agencies with no past performance record should also be allowed to
apply for registration. In order to control for a su�cient rating quality, more emphasis
is then to be put on sta� requirements (amount of resources used to rate a product with
respect to sta� quality). Hence, a rating agency may only apply for registration to rate
a speci�ed list of products (MBS issued in speci�c regions, etc.) and will be given a
license conditional on the supplied resources and the provided methodology. The provision
of su�ciently quali�ed sta� will also contribute to reduce revolving-door e�ects. If a
registered agency loses part of its sta�, it has to reduce the number of rating mandates in
order to remain eligible for the continued rating production. Moreover, if rating agencies
are faced with wage pressure (for example due to higher remuneration in investment banks)
they are able to adjust their fees in the auction process. Here, regulator has a central role in
the process of rating creation: First, (s)he is required to ensure the su�cient endowment of
agencies and second, (s)he has to monitor whether the CRAs keep their sta� after receiving
the mandate.
In order to deal with the varying complexity across products, Goodhart (2009) claims
that the regulator should also come up with an uncertainty measure. The idea is that
ESMA and SEC take advice to categorize di�erent asset classes according to their opaque-
ness with respect to risk.40 This measure shall incentivize investors to obtain more infor-
mation about speci�c products and give them an impression about the true cost of rating
production. Another advantage of the uncertainty measure is the increase in comparabil-
ity across asset classes. To date, this comparability is facilitated by the Big Three rating
agencies who o�er rating services across all rating classes. By implementing an uncertainty
measure they would still be allowed to take part in the rating process. Nevertheless, it
is also possible that certain product categories will be rated exclusively by smaller new-
comers. The current regulatory framework in Europe has already led to the emergence of
new competitors: ESMA currently lists 24 registered Credit Rating Agencies (excluding
the Big Three), with four newcomers each in 2013 and 2014.41
40One may take the results of the study by Morgan (2002) as a benchmark.41See this link for a list of currently registered and certi�ed credit rating agencies: http://www.esma.
europa.eu/page/List-registered-and-certified-CRAs
6 DOES THE RATING INDUSTRY NEED FURTHER REFORMS? 109
Rating quality will thus be raised by several quali�cations of the current regulation:
First, newcomers will be given better access to registration as a certi�ed CRA by setting
incentives for applications to particular niches and by the elimination of preconditions
such as past track records. Second, in accordance to Goodhart (2009) the administrator is
supposed to publish an uncertainty measure for the di�erent product categories. On the
one hand, this will reduce the reliance of investors on single ratings and on the other hand
increase their demand for a broader risk analysis of structured �nance products. Third,
the mandatory provision of quali�ed sta� for rating purposes ensures that CRAs will only
get access to the rating process if they can demonstrate a su�cient endowment of resources
exclusively dedicated to rating purposes.
The central role of the administrator in the registration process has also an important
drawback: It requires a transparent and comprehensible de�nition of the sta� requirements
in the registered agencies. This is especially important as it a�ects the rating fee and
�nally, the price of the rated product to a signi�cant extent. In my view, the requirements
have to be determined by policymakers because they ultimately depend on the degree
of desired investor protection. Besides, the regulator is responsible for the registration
already, however, this function becomes even more important when issuers have no longer
a say in the selection of their raters.
6.3.3 Centralized Publication of Ratings
In times of �nancial distress, rating agencies have often contributed to an aggravation of
crises by serial downgrades. During the recent euro turmoil, I have seen numerous an-
nouncements within a few months (see my empirical analysis for sovereign ratings in the
previous chapter). This behavior is especially harmful to issuers when market volatility
increases due to the continuous �ow of rating news in an already troubled market environ-
ment.
One solution to this problem is that the three mandated CRAs send their ratings to
the regulator who is then supposed to publish the median of submitted ratings. A median
puts less weight on outliers than the average which ultimately puts less pressure on the
mandated agencies. The idea is similar to that proposed by Goodhart (2009) suggesting

6 DOES THE RATING INDUSTRY NEED FURTHER REFORMS? 110
that larger banks should publish their ratings via an independent assessment body similar
to the publication of LIBOR estimates. Publication dates are subject to the size and
number of rating changes by the commissioned agencies. The third-party administrator
should be enabled to publish early warnings (comparable to the watch announcements by
the Big Three) well in advance of presumable rating changes to prevent excessive market
volatility.
The advantages of this procedure compared to the current framework can be sum-
marized as follows: First, the probability of a strong and unexpected market reaction is
reduced if the auction-based rating will be published as a median at pre-de�ned dates (for
instance at the end of every month). Second, the individual in�uence of a single rating
agency on �nancial markets is mitigated. Consequently, issuers have less incentives to
exert pressure on registered agencies and investors receive more reliable information by an
independent body.
A major drawback of a centralized publication process may be seen in the protraction of
the information �ow between agencies and investors. For instance, the unexpected election
of a new government may lead a rating agency to change its opinion on the sovereign's
creditworthiness. If this rating change is only published with a delay, one may perceive
the assessment as useless because markets have already priced in the new information.
However, if the sovereign rating is perceived as a long-term assessment of country risk ir-
respective of short-term �uctuations in the political and/or macroeconomic development,
one may ask whether it is necessary to have the information the same day. The Big Three
agencies themselves often claim that they do not respond to short-term developments. My
�ndings in the previous chapter largely con�rm that the agencies indeed follow a long-term
policy except for situations in which competitors have assigned a downgrade. Therefore,
changes in the sovereign rating should be considered as a result of long-term oriented con-
siderations. Whether this also holds for other asset classes (namely corporate or bank
ratings) is less clear: Here, short-term developments of credit risk may be more impor-
tant which is often re�ected in the shorter maturities of bonds. Also, rating agencies may
have better access to private �rm information that should be quickly made available for
investors, especially in the period between a watch decision and the rating assignment. By

6 DOES THE RATING INDUSTRY NEED FURTHER REFORMS? 111
contrast, sovereign risk is strongly related to a country's composition of institutions (i.e.
private property rights, corruption, political stability) which are hardly changing within a
couple of months.
6.3.4 The Use of Investor-paid Rating Services
One may ask whether the introduction of an auction process is really necessary when
looking at the recent emergence of user-paid rating agencies (for instance the U.S. based
Eagon-Jones Rating Company and the German based Feri Rating GmbH). Also the GAO
proposals discuss a re-introduction of the investor-pays structure as one alternative to the
issuer-pays model. However, this compensation scheme may lead to free-riding incentives
and consequently to a break-down of the entire market. On the other hand, one may con-
ceive the user-paid rating services as a complement to the auction-based issuer-pays model.
Free-riding behavior will be less pronounced in this case because a median rating is already
publicly available whereas detailed information about the products has to be paid for by
investors. This kind of system is comparable to the market for media products: Online
media provide basic news at no cost whereas further background information has to be
paid for. For instance, the Financial Times and other newspapers allow free access to the
news on their homepage but one has to subscribe to the newspaper in order to get access
to longer reports, essays or commentaries. In addition, the emergence of companies with
user-pays business models indicates that free-riding behavior might be less pronounced
than previously assumed.
The additional information about credit risk will be sold on the market for rating reports.
At present, CRAs publish rating reports which include various features such as a presen-
tation of assumptions and methodologies, analyses of strengths and risks, credit structure,
amount of defaults and recoveries or a detailed description of collateral. Most reports are
available at no charge since the agencies are paid by the issuers. In order to re-establish
con�dence especially in the market for structured �nance products, I propose to substitute
issuers by investors to compensate the agencies for their work.
Hence, rating agencies may concentrate their business on two markets: They receive fees
for rating mandates and they may sell detailed rating reports to investors. The user-paid

6 DOES THE RATING INDUSTRY NEED FURTHER REFORMS? 112
structure of this market will also have a disciplining e�ect: Rating agencies will be inter-
ested in increasing their revenues by serving their customers with unbiased and independent
information about credit risk. In the current setting, investors are probably dubious about
the reliability of information provided by those agencies who are paid by the issuers at the
same time.
6.4 Concluding Remarks
In this chapter, I have complemented the current regulatory frameworks for the rating
industry by additional features to prevent con�icts of interest and to reduce pro-cyclical
rating assignments. The amendments consist of three pillars: An auction-based allocation
mechanism to mitigate the issuer-pays problem, a revised registration process to allow
for the emergence of a decentralized structure in the rating industry and a centralized
publication process to reduce pro-cyclical rating decisions.
Most of the GAO proposals discussed above attribute a central role to the regulator.
However, a regulator is often claimed to be subject to political pressure and only advisable if
the market is not able to allocate resources e�ciently. This proposal assigns a minor role to
the regulator by limiting its scope to the registration process. The most important function
is to monitor the rating agencies' accordance with pre-established rules. These mainly
consist of quali�ed sta� requirements. Against this, the auction process, the management
of the "Cuomo Fund", and the publication process are administrative tasks which have
neither an e�ect on the determination of ratings nor on the size of rating fees. In the
end, the rating agencies may freely choose the fee for which they are willing to provide a
rating and the issuer decides on whether to agree this o�er or to reject it. Besides, it is the
investor who decides whether to only use the auction-based rating or to take additional
advice by acquiring rating reports of a preferred agency.
Observes may object that the issuers have the best information about their own solvency
making them the best quali�ed party to monitor the rating agencies. However, the recent
literature has shown that in some cases CRAs and issuers have incentives to collude against
investors (see the discussion in chapter 2).
Still, criticism might emerge with respect to the size of rating fees. On the one hand,

6 DOES THE RATING INDUSTRY NEED FURTHER REFORMS? 113
more sta� requirements increase the cost for production subject to the complexity and
opacity of a product. But on the other hand, this will incentivize issuers to be more
transparent on the underlying loan composition of structured products. Besides, the higher
cost of creating a rating for a product should be re�ected in its �nal price to serve as an
additional signal for the investor.
6.5 Appendix to Chapter 6

6 DOES THE RATING INDUSTRY NEED FURTHER REFORMS? 114
Figure 13: The Rating Process

6 DOES THE RATING INDUSTRY NEED FURTHER REFORMS? 115
Table 34: GAO Proposals
Rating Model Compensation Regulator Fee determination Certi�cation Monitoring
RandomSelectionModel
issuer pays Clearinghouse set byClearinghouse,depending onproduct type
randomassignmentby Clearing-house
based ondefault ratesand yielddi�erentials
Investor-OwnedCRA
issuer pays - market-based quali�cationas highlysophisticatedinstitutionalinvestor
indirectmonitoringby investor-ownedagency
Stand-AloneModel
issuer andinvestor pays
Funding source transaction fees setby Funding source
pre-condition ofno chargesto issuers
-
DesignationModel
issuer pays third-partyadministrator
market-based designationby investors
indirectmonitoringby investorsviadesignation
User-PaysModel
investor pays third-partyauditors/publiccompany auditingoversight board
market based user selectsNRSRO
indirectmonitoringby users
AlternativeUser-PaysModel
investor pays governmentagency/independentboard
one-time fee atinitial saleconditional onproduct complexity
biddingprocess byNRSROs
judging bidsby the boardin terms ofextent ofdiligence
Issuer andInvestor-PaysModel
issuer andinvestor pays
Ratings Fund set by RatingsFund anddetermined byhistoric andprojected volumesof primaryissuances andsecondary markettrading
assignedNRSROsreceiveperiodicmandates byRatingsFund to rateissuances (atleast twoagencies)
periodicreviews

7 SUMMARY OF FINDINGS 116
7 Summary of Findings
In the previous chapters, I studied the behavior of rating agencies with a special focus on
the treatment of sovereign risk. The results can be summarized as follows:
The empirical �ndings in the second chapter, the literature on potential let me suggest
that incentive problems such as the issuer-pays structure merely apply to the ratings of
structured �nance products. The higher complexity of these products and higher fee rev-
enues than in the case of sovereign ratings explain why agencies often assigned high ratings
to actually risky securities.
In the third chapter, I studied the existing literature on the importance of sovereign ratings.
Here, most authors claim that sovereign ratings are long-term indicators of a country's de-
fault risk with a weak predictive power to forecast crises in the short-term. Other studies
show that �nancial markets often respond to rating changes whereby it remains unclear to
date if the reaction is due to the provision of new information or whether the inclusion of
ratings in regulatory frameworks initiated the market reaction.
In the fourth chapter, we addressed the relationship between sovereign ratings and a coun-
try's public debt ratio. In the empirical analysis, we use a survey based measure (Country
Credit Rating by the Institutional Investor) that enables as to exploit a more segmented
scale (0-100) than the one used by the Big Three agencies. We �nd that investors give
equal importance to general government debt in advanced and emerging economies. We
also show that advanced countries with large ratios of debt to GDP seem to be especially
vulnerable to a downgrade if they experience a negative �scal shock. Also, peripheral
members of the euro area are subject to larger downgrades with increasing public debt
than core members and non-euro area countries. Finally, Japan seems to receive a rather
large debt privilege compared to other advanced countries.
In the �fth chapter, I explored the sources of disagreement among CRAs towards sovereign
credit ratings. The results suggest that a small European agency has a more pronounced
short-term orientation than the Big Three and that none of the agencies is subject to a
home bias. Besides, a downgrade decisions by one of the Big Three institutions increases
the probability of a negative rating change by the other two, whereas the smaller agency
has shown to be more independent in its rating assignments.
7 SUMMARY OF FINDINGS 117
In the �nal chapter of this thesis, I reviewed the recently passed reforms for the rating
industry in the U.S. and Europe. Building on these reforms, I discussed three amendments
to the current framework in order to deal with the issuer-pays structure and with the pro-
cyclicality of ratings. Based on the �ndings in chapter two and �ve, it seems appropriate
that solutions for the issuer-pays problem should primarily refer to ratings in the area
structured �nance products whereas the revised publication process is more appropriate
for sovereign ratings.
At the end of this thesis, I would like to conclude with two policy implications derived
from the above results: First, it seems that sovereign ratings have been misinterpreted as a
(short-term) predictor of sovereign default, especially during turbulent times. However, at
least the Big Three put emphasis on their long-term orientation with regard to sovereign
risk although the results in chapter �ve do not fully support their published statements.
Besides, the observation that a less popular and in�uential rating agency provides us with
higher rates of disagreement relative to the Big Three than the latter among themselves
speaks in favor of more competition among sovereign raters which may eventually raise the
plurality of opinions towards sovereign risk. More plurality of opinions may �rst reduce
the investors' and regulators' dependency on few institutions and second, it may lead to
more credibility in the public. This is especially relevant for sovereign ratings which are
to a large degree build on qualitative assessments. In contrast to the allowance of more
competition, a reform of the issuer-pays structure does not seem to be a pressing issue in
the case of sovereign ratings as my results in chapter �ve do not indicate that particular
regions receive better ratings than others. Thus, if regulators allow market entry one may
simply let the issuers of sovereign bonds decide on whether they are willing to have more
variety among their raters.
As discussed above, the situation is di�erent for the ratings of structured �nance products.
Here, it seems advisable to take action in order to mitigate the problems resulting from
the issuer-pays structure.
The second policy implication is derived from the fact that sovereign risk analysts
seem to penalize public debt in advanced countries if a high debt ratio is accompanied
with a growing one (see chapter four). Together with the sudden downgrade of the GIIPS

7 SUMMARY OF FINDINGS 118
countries during the sovereign debt crisis, it seems that sovereign ratings may change
rapidly in case of an adverse �scal shock. For instance, Portugal had been assigned a AA
(third-best rating) by Fitch Ratings for more than a decade (since 1998) before the agency
suddenly downgraded the country to junk status within less than two years time (March
2010 - November 2011). Thus, a high rating does not necessarily imply that governments
have guaranteed access to capital markets in the future. Policy-makers and regulators may
take this �nding as a warning signal for the currently highly indebted advanced economies
such as Italy, Spain or France. Added to this, once one of the Big Three agencies initiates
a downgrade, our results in chapter �ve suggest that such an event may quickly result in
a downward spiral due to other agencies following their competitor.
REFERENCES 119
References
Adelino, M. and Ferreira, M. A. (2014). Bank ratings and lending supply: Evidence
from sovereign downgrades. Working Paper presented at the 2014 NBER Credit Rating
Agency Meeting.
Afonso, A., Furceri, D. and Gomes, P. (2012). Sovereign credit ratings and �nancial
markets linkages: Application to european data. Journal of International Money and
Finance, 31 (3), 606�638.
�, Gomes, P. and Rother, P. (2011). Short and long run determinants of sovereign
debt credit ratings. International Journal of Finance & Economics, 16 (1), 1�15.
� and Rault, C. (2010). What do we really now about �scal sustainability in the eu? a
panel data diagnostic. Review of World Economics, 145 (4), 731�755.
Almeida, H., Cunha, I., Ferreira, M. A. and Restrepo, F. (2013). The real e�ects
of credit ratings: Using sovereign downgrades as a natural experiment. Working Paper,
Nova School of Business and Economics.
Alsakka, R. and ap Gwilym, O. (2010). Leads and lags in sovereign credit ratings.
Journal of Banking & Finance, 34 (11), 2614�2626.
Amtenbrink, F. and De Haan, J. (2009). Regulating credit ratings in the european
union: A critical �rst assessment of regulation 1060/2009 on credit rating agencies.
Common Market Law Review, 46.
Arezki, R., Candelon, B. and Sy, A. (2011). Sovereign rating news and �nancial
markets spillovers: Evidence from the european debt crisis. IMF working papers, 11/68,
1�27.
Ashcraft, A. B., Goldsmith-Pinkham, P. S., Hull, P. and Vickery, J. I. (2011).
Credit ratings and security prices in the subprime mbs market. American Economic
Review, 101, 115�119.

REFERENCES 120
Bannier, C. E. and Hirsch, C. (2010). The economic function of credit rating agencies:
what does the watchlist tell us? Journal of Banking & Finance, 34(12) (124), 3037�
3049.
Bar-Isaac, H. and Shapiro, J. (2011). Credit ratings accuracy and analyst incentives.
American Economic Review, 101 (3), 120�24.
� and� (2013). Ratings quality over the business cycle. Journal of Financial Economics,
108, 62�78.
Bartels, B. and Weder di Mauro, B. (2013). A rating agency for europe - a good
idea? CEPR Discussion Paper, No. DP9512.
Beck, H. and Wienert, H. (2010). Brauchen wir eine europäische rating-agentur?
Wirtschaftsdienst - Zeitschrift für Wirtschaftspolitik, 90 (7), 464�469.
Becker, B. and Milbourn, T. (2011). How did increased competition a�ect credit
ratings? Journal of Financial Economics, 101 (3), 493�514.
Bernoth, K. and Erdogan, B. (2012). Sovereign bond yield spreads: A time-varying
coe�cient approach. Journal of International Money and Finance, 31 (3), 639�656.
�, von Hagen, J. and Schuknecht, L. (2012). Sovereign risk premiums in the european
government bond market. Journal of International Money and Finance, 31 (5), 975�995.
Bhattacharya, U.,Wei, K. D. and Xia, H. (2014). Follow the money: Investor trading
around investor-paid rating changes. Working Paper presented at the 2014 NBER Credit
Rating Agency Meeting.
Bohn, H. (1998). The behavior of us public debt and de�cits. the Quarterly Journal of
economics, 113 (3), 949�963.
Bolton, P., Freixas, X. and Shapiro, J. (2012). The credit ratings game. Journal of
Finance, 67 (1), 85�112.
Boot, A. W.,Milbourn, T. T. and Schmeits, A. (2006). Credit ratings as coordination
mechanisms. Review of Financial Studies, 19(1) (02-058/2), 81�118.
REFERENCES 121
Borensztein, E., Cowan, K. and Valenzuela, P. (2013). Sovereign ceilings "lite"?
the impact of sovereign ratings on corporate ratings. Journal of Banking & Finance,
37 (11), 4014�4024.
Borio, C. and Packer, F. (2004). Assessing new perspectives on country risk. BIS
Quarterly Review, pp. 47�65.
Brooks, R., Faff, R. W., Hillier, D. and Hillier, J. (2004). The national market
impact of sovereign rating changes. Journal of banking & �nance, 28 (1), 233�250.
Bruno, V., Cornaggia, J. and Cornaggia, K. R. (2013). Does regulatory certi�cation
a�ect the information content of credit ratings? Available at SSRN 1962840.
Buchheit, L., Gelpern, A., Gulati, M., Panizza, U., di Mauro, B. and
Zettelmeyer, J. (2013). Revisiting sovereign bankruptcy. committee on international
economic policy and reform. Brookings Institution.
Butler, A. W. and Fauver, L. (2006). Institutional environment and sovereign credit
ratings. Financial Management, 35 (3).
Cantor, R. and Packer, F. (1996). Determinants and impact of sovereign credit ratings.
Economic Policy Review, (Oct), 37�53.
Cavallo, E., Powell, A. and Rigobon, R. (2013). Do credit rating agencies add
value? evidence from the sovereign rating business. International Journal of Finance &
Economics, 18 (3), 240�265.
Celasun, O. and Harms, P. (2011). Boon or burden? the e�ect of private sector debt on
the risk of sovereign default in developing countries. Economic Inquiry, 49 (1), 70�88.
Christiansen, C. (2007). Volatility-spillover e�ects in european bond markets. European
Financial Management, 13 (5), 923�948.
Commission, E. (2010). Public consultation on credit rating agencies. Financial Services
Policy and Financial markets - Securities Markets.

REFERENCES 122
Cornaggia, J., Cornaggia, K. and Xia, H. (2013). Revolving doors on wall street.
Unpublished Working Paper.
Covitz, D. M. and Harrison, P. (2003). Testing con�icts of interest at bond rating
agencies with market anticipation: Evidence that reputation incentives dominate. FEDS
Working Paper, No. 2003-68.
De Grauwe, P. and Ji, Y. (2013). Self-ful�lling crises in the eurozone: An empirical
test. Journal of International Money and Finance, 34, 15�36.
de Haan, J. and Amtenbrink, F. (2011). Credit rating agencies. DNB Working Paper,
No. 278 (278).
Dell'Erba, S., Hausmann, R. and Panizza, U. (2013). Debt levels, debt composition,
and sovereign spreads in emerging and advanced economies. Oxford Review of Economic
Policy, 29 (3), 518�547.
Donaldson, J. R. and Piacentino, G. (2014). The downside of precise credit ratings
for delegated asset management. Working Paper presented at the 2014 NBER Credit
Rating Agency Meeting, 2014.
Ehrmann, M., Fratzscher, M., Gürkaynak, R. S. and Swanson, E. T. (2011).
Convergence and anchoring of yield curves in the euro area. The Review of Economics
and Statistics, 93 (1), 350�364.
Eichengreen, B., Hausmann, R. and Panizza, U. (2007). Currency mismatches, debt
intolerance, and the original sin: Why they are not the same and why it matters. In
Capital controls and capital �ows in emerging economies: Policies, practices and conse-
quences, University of Chicago Press, pp. 121�170.
Eijffinger, S. C. W. (2012). Rating agencies: Role and in�uence of their sovereign credit
risk assessment in the eurozone. JCMS: Journal of Common Market Studies, Vol. 50,
Issue 6, pp. 912�921.
Ellul, A., Jotikasthira, C. and Lundblad, C. T. (2011). Regulatory pressure and �re
sales in the corporate bond market. Journal of Financial Economics, 101 (3), 596�620.
REFERENCES 123
Ferreira, M. A. and Gama, P. M. (2007). Does sovereign debt ratings news spill over
to international stock markets? Journal of Banking & Finance, 31 (10), 3162�3182.
Ferri, G., Liu, L.-G. and Stiglitz, J. E. (1999). The procyclical role of rating agencies:
Evidence from the east asian crisis. Economic Notes, 28, 335�355.
Fitch, R. (2014). Sovereign rating criteria, www.�tchratings.com.
Fuchs, A. and Gehring, K. (2013). The home bias in sovereign ratings. Working Paper
University of Heidelberg.
Gaertner, M., Griesbach, B. and Jung, F. (2011). Pigs or lambs? the european
sovereign debt crisis and the role of rating agencies. International Advances in Economic
Research, 17 (3), 288�299.
Gaillard, N. (2014). What is the value of sovereign ratings? German Economic Review,
15 (1), 208�224.
Gande, A. and Parsley, D. C. (2005). News spillovers in the sovereign debt market.
Journal of Financial Economics, 75 (3), 691�734.
GAO (2012). Credit rating agencies - alternative compensation models for naionally rec-
ognized statistical rating organizations. United States Government Accountability O�ce.
Ghent, A., Torous, W. and Valkanov, R. (2014). Complexity in structured �nance:
Financial wizardry or smoke and mirrors? Working Paper presented at the 2014 NBER
Credit Rating Agency Meeting, 2014.
Ghosh, A. R., Kim, J. I., Mendoza, E. G., Ostry, J. D. and Qureshi, M. S. (2013).
Fiscal fatigue, �scal space and debt sustainability in advanced economies. The Economic
Journal, 123 (566), F4�F30.
Goodhart, C. (2009). How, if at all, should credit ratings agencies (cras) be regulated?
Special papers 181, LSE Financial Markets Group Paper Series.

REFERENCES 124
Greenlaw, D., Hamilton, J. D., Hooper, P. andMishkin, F. S. (2013). Crunch time:
Fiscal crises and the role of monetary policy. National Bureau of Economic Research
(NBER), No. 19297.
Güttler, A. andWahrenburg, M. (2007). The adjustment of credit ratings in advance
of defaults. Journal of Banking & Finance, 31 (3), 751�767.
Hand, J. R. M., Holthausen, R. W. and Leftwich, R. W. (1992). The e�ect of bond
rating agency announcements on bond and stock prices. Journal of Finance, 47 (2),
733�52.
Haque, N. U., Kumar, M. S., Mark, N. and Mathieson, D. J. (1996). The economic
content of indicators of developing country creditworthiness. IMF Sta� Papers, 43 (4),
688�724.
Hau, H., Langfield, S. and Marques-Ibanez, D. (2013). Bank ratings: what deter-
mines their quality? Economic Policy, 28 (74), 289�333.
Hill, P. and Faff, R. (2010). The market impact of relative agency activity in the
sovereign ratings market. Journal of Business Finance & Accounting, 37 (9-10), 1309�
1347.
Ismailescu, I. and Kazemi, H. (2010). The reaction of emerging market credit default
swap spreads to sovereign credit rating changes. Journal of Banking & Finance, 34 (12),
2861�2873.
Jiang, J. X., Harris Stanford, M. and Xie, Y. (2012). Does it matter who pays for
bond ratings? historical evidence. Journal of Financial Economics, 105 (3), 607�621.
Judson, R. A. and Owen, A. L. (1999). Estimating dynamic panel data models: a guide
for macroeconomists. Economics letters, 65 (1), 9�15.
Kaminsky, G. and Schmukler, S. (2002). Emerging markets instability: Do sovereign
ratings a�ect country risk and stock returns? The World Bank Economic Review, 16 (2),
171�195.

REFERENCES 125
Kashyap, A. and Kovrijnykh, N. (2013). Who should pay for credit ratings and how?
NBER Working Paper, No. 18923.
Kaufmann, D., Kraay, A. and Mastruzzi, M. (2010). The worldwide governance
indicators - methodology and analytical issues. The World Bank Policy Research Working
Paper, WP5430, 1�29.
Kisgen, D. J. and Strahan, P. E. (2010). Do regulations based on credit ratings a�ect
a �rm's cost of capital? The Review of Financial Studies, 23, 4324�4347.
Kiviet, J. F. (1995). On bias, inconsistency, and e�ciency of various estimators in dy-
namic panel data models. Journal of econometrics, 68 (1), 53�78.
Kräussl, R. (2005). Do credit rating agencies add to the dynamics of emerging market
crises? Journal of Financial Stability, 1 (3), 355�385.
Leland, H. E. and Pyle, D. H. (1977). Informational asymmetries, �nancial structure,
and �nancial intermediation. Journal of Finance, 32 (2), 371�87.
Livingston, M., Naranjo, A. and Zhou, L. (2007). Asset opaqueness and split bond
ratings. Financial Management, 36 (3), 49�62.
Mathis, J., McAndrews, J. and Rochet, J.-C. (2009). Rating the raters: Are rep-
utation concerns powerful enough to discipline rating agencies? Journal of Monetary
Economics, 56 (5), 657�674.
Moody's (2006). Analyzing the tradeo� between ratings accuracy and stability. Special
Comment.
� (2013). Rating methodology: Sovereign bond ratings, www.moodys.com.
Mora, N. (2006). Sovereign credit ratings: guilty beyond reasonable doubt? Journal of
Banking & Finance, 30 (7), 2041�2062.
Morgan, D. P. (2002). Rating banks: Risk and uncertainty in an opaque industry.
American Economic Review, 92 (4), 874�888.

REFERENCES 126
Mulder, C. B. and Montfort, B. (2000). Using credit ratings for capital requirements
on lending to emerging market economies - possible impact of a new basel accord. IMF
Working Papers, 69.
Opp, C. C.,Opp, M. M. andHarris, M. (2013). Rating agencies in the face of regulation.
Journal of Financial Economics, 108 (1), 46�61.
Pagano, M. and Volpin, P. (2010). Credit ratings failures and policy options. Economic
Policy, 25, 401�431.
� and von Thadden, E.-L. (2004). The european bond markets under emu. Oxford
Review of Economic Policy, 20 (4), 531�554.
Panizza, U. and Presbitero, A. F. (2014). Public debt and economic growth: is there
a causal e�ect? Journal of Macroeconomics, 41, 21�41.
Parlour, C. A. and Rajan, U. (2014). Contracting on credit ratings: Adding value to
public information. Working Paper presented at the 2014 NBER Credit Rating Agency
Meeting, 2014.
Purda, L. D. (2011). Assessing credit or determining quantity? the evolving role of rating
agencies. Journal of Applied Finance, Issue 2.
Reinhart, C. and Rogoff, K. (2010). Growth in a time of debt. American Economic
Review, 100 (2), 573�8.
Reinhart, C. M. (2002). Default, currency crises, and sovereign credit ratings. World
Bank Economic Review, 16 (2), 151�170.
�, Rogoff, K. S. and Savastano, M. A. (2003). Debt intolerance. Brookings Papers
on Economic Activity, 34 (1), 1�74.
Reisen, H. (2002). Ratings since the asian crisis. WIDER Discussion Papers//World
Institute for Development Economics (UNU-WIDER), (2002/02).
� and Von Maltzan, J. (1999). Boom and bust and sovereign ratings. International
Finance, 2 (2), 273�293.

REFERENCES 127
SEC (2012). Report to congress on assigned credit ratings. Securities & Markets Authority.
� (2013). Report to congress on assigned credit ratings. Securities & Markets Authority.
Skreta, V. and Veldkamp, L. (2009). Ratings shopping and asset complexity: A theory
of ratings in�ation. Journal of Monetary Economics, 56 (5), 678�695.
Standard and Poor's (2013). Sovereigns: Sovereign government rating methodology and
assumptions, www.standardandpoors.com.
Stanton, R. and Wallace, N. (2010). Cmbs subordination, ratings in�ation, and the
crisis of 2007-2009. Unpublished Working Paper. University of California, Berkeley.
Sylla, R. (2002). A historical primer on the business of credit ratings. Working Paper
presented at the conference on The Role of Credit Reporting Systems in the International
Economy, The World Bank.
Trebesch, C., Das, U. and Papaioannou, M. G. (2010). Sovereign default risk and
private sector access to capital in emerging markets. IMF Working Papers, 10/10, 1�38.
U.S. Government, P. O. (2006). Public law 109-291 credit rating agency reform act of
2006. U.S. Government Information (GPO).
� (2010). Public law 111-203 dodd-frank wall street reform and consumer protection act.
U.S. Government Information (GPO).
White, L. J. (2010). Markets: The credit rating agencies. Journal of Economic Perspec-
tives, 24 (2), 211�26.

Bernhard Bartels, born in 1983, studied Political Sciences and Economics from 2003 to 2008
at the Johannes Gutenberg- University in Mainz and at the Nelson Mandela Metropolitan
University in Port Elizabeth (South Africa). From 2008 to 2009, he completed successfully
the Advanced Studies Program (ASP) in International Economic Policy Research at the
Institute for the World Economy in Kiel. From July 2009 to December 2009, he worked as a
personal assistant to the Chief Economist of Deutsche Bank Group in Frankfurt am Main.
Bernhard Bartels is currently working as a research assistant at the Johannes Gutenberg
University- Mainz.