Embed Size (px)
Citation preview

Essays in Marketing Strategy: The Role of Customer Integration,
Marketing Metrics, and Advertising Effectiveness
Inauguraldissertation
zur
Erlangung des Doktorgrades
der
Wirtschafts- und Sozialwissenschaftlichen Fakultät
der
Universität zu Köln
2017
vorgelegt
von
M. Sc. Annette Ptok
aus
Solingen

Referent: Prof. Dr. Werner Reinartz
Korreferent: Prof. Dr. Marc Fischer
Tag der Promotion: 06.11.2017
I
CONTENTS
List of Tables ........................................................................................................................... IV
List of Figures .......................................................................................................................... V
List of Appendices .................................................................................................................. VI
Introduction .............................................................................................................................. 1
Overview .................................................................................................................................... 1
Essay 1: Wertschöpfung durch Kundenintegration .................................................................... 7
Essay 2: SGA-Based Metrics in Marketing: Conceptual and Measurement Challenges ........... 8
Essay 3: The Effect of Incongruency on Advertising Persuasion and its Underlying
Mechanisms .............................................................................................................................. 10
References ................................................................................................................................ 12
Wertschöpfung durch Kundenintegration ........................................................................... 14
Kurzzusammenfassung ............................................................................................................. 14
Überblick .................................................................................................................................. 15
Veränderungen in der Handelslandschaft ................................................................................ 16
Integration des Kunden entlang der Wertschöpfungskette: Indikatoren betriebswirtschaftlicher
Wertschöpfung ......................................................................................................................... 18
Wertschöpfung durch Integration des Kunden in: Produktentwicklung, Produktion und
Sortimentsbildung ........................................................................................................... 22
Wertschöpfung durch Integration des Kunden in: Informationsbereitstellung, Beratung
und Marketingkommunikation ........................................................................................ 28
Wertschöpfung durch Integration des Kunden in: Transaktionsabwicklung und Logistik
......................................................................................................................................... 34
Wertschöpfung durch Integration des Kunden in: Service und Support ........................ 37
Herausforderungen für den Handel .......................................................................................... 42
Zugang zu Kundendaten ................................................................................................. 43
Gewährleistung von Unternehmenskontrolle ................................................................. 44
Vermeidung von Kundenüberforderung ......................................................................... 46
Vermeidung von Kostenverlagerungen .......................................................................... 49
Aufrechterhaltung der Kundenbindung .......................................................................... 50
Fazit .......................................................................................................................................... 52
Literaturverzeichnis .................................................................................................................. 54
SGA-Based Metrics in Marketing: Conceptual and Measurement Challenges ............... 58
Abstract .................................................................................................................................... 58
II
Introduction .............................................................................................................................. 59
Conceptual Framework ............................................................................................................ 62
Research Design ....................................................................................................................... 69
Testing for Content Validity ........................................................................................... 70
Testing for Construct Validity ........................................................................................ 72
Data .......................................................................................................................................... 74
Data Sources ................................................................................................................... 74
Variables ......................................................................................................................... 77
Results ...................................................................................................................................... 82
Conceptual Assessment (Content Validity) .................................................................... 82
Empirical Results ............................................................................................................ 84
Robustness Checks .......................................................................................................... 92
Discussion ................................................................................................................................ 97
Guidelines for Using SGA ............................................................................................ 100
Limitations and Further Research ................................................................................. 103
References .............................................................................................................................. 104
Appendix ................................................................................................................................ 108
Appendix References ............................................................................................................. 115
The Effect of Incongruency on Advertising Processing and its Underlying Mechanisms
................................................................................................................................................ 121
Abstract .................................................................................................................................. 121
Introduction ............................................................................................................................ 122
Theoretical Background ......................................................................................................... 125
Stimulus Processing and Advertising Persuasion ......................................................... 125
Incongruency in Advertising ......................................................................................... 127
Incongruency Research in Advertising ......................................................................... 128
Hypotheses ............................................................................................................................. 131
The Mediating Role of Emotional and Cognitive Processing Routes .......................... 131
Study ....................................................................................................................................... 137
Method .......................................................................................................................... 137
Results and Discussion ................................................................................................. 142
General Discussion ................................................................................................................. 164
Summary and Conclusion ............................................................................................. 164
Managerial Implications ............................................................................................... 167

III
Limitations and Further Research ................................................................................. 169
References .............................................................................................................................. 172
Appendix ................................................................................................................................ 179
Appendix References ............................................................................................................. 180
References ............................................................................................................................. 181
IV
LIST OF TABLES
Introduction
Table 1: Overview of Dissertation Essays ................................................................................. 6
Wertschöpfung durch Kundenintegration
Tabelle 1: Wertschöpfungspotenziale für Kunden und Handelsunternehmen ......................... 41
SGA-Based Metrics in Marketing: Conceptual and Measurement Challenges
Table 1: Research Process ........................................................................................................ 62
Table 2: SGA-based Operationalization of Marketing and Sales Constructs and Subconstructs
.................................................................................................................................. 65
Table 3: Data Sources, Variables, and Descriptions ................................................................ 79
Table 4: Descriptive Statistics and Correlations ...................................................................... 80
Table 5: Conceptual Analysis Results ...................................................................................... 83
Table 6: Overview of Construct Validity ................................................................................. 85
Table 7: Construct Validation for Marketing Communication Spending ................................ 88
Table 8: Construct Validation for Marketing Assets ............................................................... 91
Table 9: Robustness Checks for Marketing Spending Validation ........................................... 95
Table 10: Correlations of SGA with other Variables from Compustat, 1997 to 2014 (N =
18,481 listwise) ........................................................................................................ 96
The Effect of Incongruency on Advertising Persuasion and its Underlying Mechanisms
Table 1: Descriptive Statistics and Bivariate Correlations among Variables ........................ 144
Table 2: Sample 1: Regression Coefficients, Standard Errors, and Model Summary
Information for the Serial Multiple Mediator Model ............................................. 154
Table 3: Sample 1a: Regression Coefficients, Standard Errors, and Model Summary
Information for the Serial Multiple Mediator Model ............................................. 157
Table 4: Sample 1b: Regression Coefficients, Standard Errors, and Model Summary
Information for the Serial Multiple Mediator Model ............................................. 160

V
LIST OF FIGURES
Wertschöpfung durch Kundenintegration
Abbildung 1: Kapitelüberblick ................................................................................................. 16
Abbildung 2: Der Wertschöpfungsprozess von Handelsunternehmen .................................... 19
Abbildung 3: Formen der Kundenintegration .......................................................................... 21
SGA-Based Metrics in Marketing: Conceptual and Measurement Challenges
Figure 1: Conceptual Framework ............................................................................................. 67
Figure 2: Research Design and Validation Approach .............................................................. 70
Figure 3: Multitrait-Multimethod (MTMM) Matrix ................................................................ 73
Figure 4: Sample Overview ...................................................................................................... 76
Figure 5: Decision Tree ............................................................................................................ 99
The Effect of Incongruency on Advertising Persuasion and its Underlying Mechanisms
Figure 1: Conceptual Framework ........................................................................................... 131
Figure 2: Serial Mediation Model .......................................................................................... 148
Figure 3: Results of the Serial Mediation Model for Sample 1 ............................................. 153
Figure 4: Extended Framework on Advertising Persuasion ................................................... 167

VI
LIST OF APPENDICES
SGA-Based Metrics in Marketing: Conceptual and Measurement Challenges
Appendix 1: Uses of SGA Expenses in Marketing and Management Literature (1995–2016)
................................................................................................................................ 108
Appendix 2: Classification of 29 Items in SGA, according to Porter’s Value Chain Activities
................................................................................................................................ 111
Appendix 3: Concepts, Constructs, and Variables ................................................................. 113
The Effect of Incongruency on Advertising Persuasion and its Underlying Mechanisms
Appendix 1: Full Phrasing of Items and Scales and Cronbach’s Alpha Values for further
Reliability Test ....................................................................................................... 179
1
Introduction
OVERVIEW
Marketing strategy is omnipresent in the practice of management and is devoted a high
status “as being the engine driving the growth and success of many firms” (Shankar and
Carpenter 2012, p. 1). It is defined as a complex bundle of decisions concerning “markets to
serve and market segments to target, marketing actions and marketing resources in the
creation, communication and/or delivery of products that offer value to customers in
exchanges with the organization and thereby enable the organization to achieve specific
objectives” (Varadarajan 2012, p.23). Nowadays, there are several challenges managers need
to tackle with regard to marketing strategy (Bhasin 2016). The most important challenges can
be classified into (1) becoming customer centric, (2) demonstrating the return on investment
(ROI) of marketing actions, and (3) creating awareness for marketing content.
Becoming customer centric and the role of relational marketing strategy in
determining overall value: First, firm value is dependent on the relational role of marketing
strategy, which is devoted to the individual itself (Verhoef, Reinartz, and Krafft 2010). The
consumer serves as a producer of value through the active integration into the value creation
process (Fang, Palmatier, and Evans 2008; Hoyer et al. 2010; Lusch, Vargo, and O’Brien
2007; Moeller 2008). Consequently, a firm’s growth and success crucially depend on the
mutual interaction between the consumer, the company, and other consumers. Technological
and digital interconnectivity have changed the role of the consumer in the value creation
process (Payne, Storbacka, and Frow 2008). The customer becomes a central role in
marketing strategy, actively contributing as a prominent participant in the value creation
process (Xie, Bagozzi, and Troye 2008). This tremendous change in marketing strategy offers
opportunities for both parties, but also new challenges to be attempted.

2
Demonstrating ROI of marketing actions and the role of quantitative marketing
strategy in determining overall value: Second, the quantitative role of marketing strategy,
specifically, budget allocation is an important element of marketing strategy (Shankar 2012)
and is usually considered as an input factor used to create value for the customer. Distributing
the overall budget across different levers of marketing strategy (i.e. communication,
promotion, product innovation etc.), requires a valid assessment of the levers’ effectiveness
(Stewart 2009). Therefore, a detailed accounting approach of the explicit elements of
marketing strategy is required in order to determine marketing performance. In consequence,
measuring the company’s growth and success level strongly depends on correct accounting as
well as valid integration in the overall marketing context. The progress in digital technology
leads to an increase in firm data collection of key performance indicators and provides easy
access to such databases. This has an impact on marketing strategy and its accounting.
Competitive analysis is easily done by such databases. However, often knowledge on the
correct and valid application of such databases appears to be insufficient and/or even missing.
This would have remarkable impact on both parties, researchers and practitioners alike,
endangering the whole marketing strategy plan. Extant research shows a dramatic increase in
the need for analyzing various marketing performance drivers (MSI 2016).
Creating awareness for marketing content and the role of communicative marketing
strategy in determining overall value: Third and lastly, the communicative role of marketing
strategy, which is attributed an intermediary function in terms of informing and persuading
the consumer (Ducoffe and Curlo 2000). Specifically, advertisements serve as an important
connector between companies and customers in terms of communicating the value of the
company’s products and brand (Duncan and Moriarty 1998). Without an effective advertising
strategy, which influences individuals to buy products and service, a firm’s performance level
is expected to stagnate or even to decrease. Hence, growth and success of a company are
dependent on its proper communication strategy to create awareness for the value proposition,

3
to shape consumers’ value expectations and perceptions, and finally to persuade consumers.
Nowadays, the effectiveness of advertising communication suffers from the increase in the
number of exposures and digital media channels, which lead to an advertising clutter (Pieters,
Warlop, and Wedel 2002; Teixeira 2014). As a consequence, advertising strategy shifts from
conventional to unorthodox strategies to provoke consumers’ attention (Halkias and
Kokkinaki 2014). One prominent trigger of attention is the implementation of incongruent
elements within the ad (Lee and Schumann 2004). However, relying on incongruency shows
mixed direct effects on consumers’ thoughts, feelings and decisions. A better understanding
for incongruency and its organismic mechanisms is needed.
Overall, these challenges are driven by the digital transformation, which impacts a
company’s operational processes and interaction with the customer, fosters increasing
competitive markets, and educates individuals. It results in even more demanding consumers
(Prahalad and Ramaswamy 2004; Sheth, Sisodia, and Sharma 2000). The changes due to the
digitalization put pressure on the effectiveness of the overall marketing strategy and value
creation. This dissertation aims to give a detailed view on these recent challenges affecting
marketing strategy and overall firm value.
Essay 1, titled “Wertschöpfung durch Kundenintegration”, is co-authored by Monika
Käuferle, Annette Ptok and Werner Reinartz. Annette Ptok made major and substantial
contributions to this project in terms of idea generation and development of the conceptual
framework, theoretical analysis and writing up the paper. The goal of this study is to
conceptually classify the phenomenon of customer integration and to investigate the chances
and challenges of active customer participation in a company’s value creation process. First,
the authors derive a conceptual classification of the various types of customer integration,
which is overdue in marketing strategy research. Second, they analyze the opportunities for
customer integration along a company’s value creation process and mirror the chances and
challenges for both parties, customers and companies. Finally, managerial implications are
4
derived, helping managers to effectively integrate customers in the value creation process,
while minimizing associated risks. In doing so, the authors refer to real world examples,
providing a better feeling for the implementation of customer integration.
Essay 2, titled “SGA-Based Metrics in Marketing: Conceptual and Measurement
Challenges”, is co-authored by Annette Ptok, Rupinder Jindal, and Werner Reinartz. Annette
Ptok made major and substantial contributions to this project in terms of idea generation and
development of the conceptual framework, the selection and development of the empirical
design, data collection, data analysis, and writing up the paper. The authors empirically
investigate the validity of marketing and sales constructs operationalized by selling, general,
and administrative expenses (SGA). First, they give a structured overview of the widespread
operationalization of selling, general, and administrative expenses for various marketing and
sales constructs. Second, the authors validate those marketing and sales constructs by testing
for content and construct validity. Third, they derive guidelines for researchers that are
interested in using SGA as a valid operationalization within their research design.
Specifically, these guidelines represent the cornerstone for consistent construct measurement
when using SGA.
Essay 3, titled “The Effect of Incongruency on Advertising Processing and its
Underlying Mechanisms”, the author Annette Ptok, empirically investigates the effect of
incongruency in advertisements on the advertising persuasion process and its underlying
mechanisms. The aim of this study is to explain how incongruency influences consumers’
information processing and decision-making and what the mechanisms are that drive ultimate
behavior. First, conducting an exploratory laboratory experiment, the author identifies that
incongruency triggers three routes of processing, i.e. automatic, cognitive and emotional,
which determine the overall conative outcome by the (1) the schema-discrepancy mechanism,
the (2) familiarity mechanism, and (3) the excitation-transfer mechanism. These three
mechanisms operate in parallel. Depending on the strength of each mechanism an incongruent
5
stimulus can either positively or negatively induce individuals’ behavior. Second, in a
subsample, the findings are replicated for specific types of incongruency (humorous and
absurd incongruency). Third, with relevance to practitioners, the author suggests implications
for advertising strategies based on incongruent ad content.
Together these essays reflect the impact on marketing strategy from three different
viewpoints (relational, quantitative, and communicative role of marketing strategy). First, the
ultimate goal of marketing strategy is to enhance performance, knowing the valid metrics,
contributes to the assessment and implementation of successful of marketing strategy and
value creation. Second, marketing strategy, specifically, marketing communication between
company and customer suffers from declining levels of effectiveness. However, it is an
essential tool to exchange informational value of products with customers, which needs to be
managed effectively. Third, marketing strategy faces fundamental changes due to the active
integration of the customer in the value creation process, which offer new chances, but also
challenges to be overcome.
Table 1 provides an overview of the three essays and summarizes the respective key
findings.
6
Table 1: Overview of Dissertation Essays1
Essay No. Authors Title Research Objective Data Key Findings Status of the Project
1) Käuferle, Ptok
and Reinartz
Wertschöpfung durch
Kundenintegration
Investigating the role of
active customer
integration into a
company’s value creation
process
Conceptual paper Increasing possibilities of
customer integration in primary
as well as supportive value
creation activities
Integration leads to additional
value for customers and
companies
Published in W.
Reinartz, M. Käuferle
(Eds.),
Wertschöpfung im
Handel, Stuttgart:
Kohlhammer, 128–
38.
2) Ptok, Jindal, and
Reinartz
SGA-Based Metrics in
Marketing: Conceptual
and Measurement
Challenges
Validation of marketing
and sales constructs
operationalized by SGA
expenses
Secondary, cross-
sectional data that
provides
information on
marketing and
sales figures
Huge heterogeneity in construct
operationalization
SGA does not reveal construct
validity for marketing
constructs, but for sales forces
constructs
Second round in
Journal of the
Academy of
Marketing Science
3) Ptok The Effect of
Incongruency on
Advertising Processing
and its Underlying
Mechanisms
Analyzing the effect of
incongruency on
advertising persuasion
Investigating the role of
automatic, cognitive,
and emotional processing
N = 45 participants
Experimental
study providing
EEG2 and self-
reported survey
data
Incongruency exhibits indirect
effects on purchase intention
through three major
mechanisms: (+) excitation-
transfer mechanism, (+)
familiarity mechanism, and (-)
schema-discrepancy mechanism
Not submitted so far
1 Notes: Annette Ptok made substantial contributions to all three essays. 2This project was composed as an exploratory study. Given, the known risk of exploratory studies, unfortunately, we face the problem of too noisy EEG data, which does not
allow for neuroscientific analysis of this data set. Regrettably, at this point in time the EEG data cannot be used, because it needs further assessment and preparation. Therefore,
we need to focus our exploratory study and preliminary analysis on the behavioral data set of the survey session. It is well known that the sample size strongly limits hypotheses
testing and the generalizability of the results. The goal of the exploratory analysis of the behavioral data set is to serve as a first indicator testing the theoretical assumption of
opposing mechanisms being triggered by an incongruent stimulus. These initial findings need further development and replication in a follow-up EEG study.
7
ESSAY 1: WERTSCHÖPFUNG DURCH KUNDENINTEGRATION
Technological developments have drastically changed the market landscape and the
value creation process. Besides the usage of the Internet as an additional retail channel, firms
face new technological opportunities in order to collaborate with their customers or even to
hand over some functions to them (Payne, Storbacka, and Frow 2008; Xie, Bagozzi, and
Troye 2008). The role of the consumer as a passive recipient of goods and services has turned
into the role of an active participant in the value creation process. Companies integrate
consumers into different value creation activities. However, there are varying types and levels
of customer integration, which are not clearly differentiated from one another. Consequently,
it is necessary to investigate what are the benefits and risks of this management strategy. The
paper contributes to existing literature by filling the theoretical gaps of customer integration
from a company’s and customer’s perspective. First, the authors specify a conceptual
framework that structures customer integration across the level of integration into the various
value creation activities. Three levels of integration are identified: (1) customer segregation,
(2) co-creation and (3) self-service. Second, the possibilities to integrate consumers in the
value chain are analyzed along the primary and supportive value creation activities, which are
classified in the activities of (1) product development, production, assortment, (2) information
provision, consultancy, marketing communication, (3) transaction, logistics, and (4) service
and support. Third, the authors analyze how customer integration leads to increased value for
customers and companies and evaluate the challenges that need to be faced. The main value
of customer integration from a company’s perspective is based on the potential of increased
(1) customer loyalty, (2) higher revenues and (3) profits. From customer perspective active
integration is motivated by (1) improved qualitative purchase decision, (2) time and (3) cost
savings, driving overall customer value.
8
Likewise, customer integration poses new challenges for companies. The major
challenges are (1) gaining access to consumer data, (2) keeping control over the value creation
process, (3) avoiding confusion of the customer, (4) avoiding the shift in costs, and (5)
retaining customer loyalty. The authors provide managerial implications to cope with these
challenges and to benefit from customer integration in the value creation process.
ESSAY 2: SGA-BASED METRICS IN MARKETING: CONCEPTUAL AND MEASUREMENT
CHALLENGES
Measuring and evaluating the value of marketing and sales activities has high priority
in both academic research and in practice (MSI 2016). Many studies use accounting variables
from the Compustat database to measure various marketing constructs, yet no clear guidelines
detail which metrics actually correspond to which constructs. As a result, various metrics have
been utilized to capture the same construct, and the same metric, such as selling, general, and
administrative expenses (SGA), has been applied to capture vastly different constructs.
The objective of this study is to provide a conceptual assessment of commonly used
marketing and sales constructs and an empirical assessment of alternative measures.
Specifically, we address three research questions:
RQ1. Which marketing and sales constructs have been measured using SGA?
RQ2. Is SGA a valid measure for these constructs? Are there alternative measures for
these constructs that may be equally or more valid?
RQ3. What guidelines can be developed for choosing between SGA and these
alternative measures?
The first research question gives a structured overview on the application of SGA in
the marketing domain and uncovers the heterogeneous usage of SGA for a wide variety of
marketing and sales constructs, which have not been identically conceptualized and
9
operationalized across studies. On the one side, the literature comparison shows that SGA has
been used to measure different constructs. On the other side, SGA and modifications of SGA
have been used to operationalize one single construct. The arbitrary usage of SGA emphasizes
the research gap of consistent conceptualization and operationalization at marketing-
accounting interface.
Research questions 2 and 3 address the validation of constructs measured by SGA and
the derivation of guidelines for the usage of SGA in marketing. Given this research gap, the
empirical study tests the content and construct validity for the identified marketing and sales
constructs measured by means of accounting variables. The analysis is performed according
to Campbell and Fiske’s (1962) multitrait-multimethod matrix approach. Data were obtained
from Compustat, Selling Power, and Advertising Age. The results show that SGA cannot
serve as an operationalization across all marketing and sales constructs, but only for a few of
these constructs. The findings indicate that although SGA is conceptually aligned with
marketing constructs, SGA does not reveal construct validity. However, it is an appropriate
measure for sales force constructs, showing content and construct validity.
Based on our results, we derive guidelines for proper conceptualization and
operationalization of constructs using accounting metrics, especially SGA. These guidelines
help to build a coherent knowledge base about the conceptualization of constructs in general
and their operationalization using SGA in particular. The findings provide a valuable
approach to handle conceptual and measurement challenges and allow for unbiased,
comparable and valid research and thus, contributing to managerial decision making in terms
of the estimation of true effects.
10
ESSAY 3: THE EFFECT OF INCONGRUENCY ON ADVERTISING PERSUASION AND ITS
UNDERLYING MECHANISMS
To gain back consumer attention, practitioners try to create awareness by means of
incongruent advertisement (ad) content (Alden, Mukherjee, and Hoyer 2000; Arias-
Bolzmann, Chakraborty, and Mowen 2000). Extant research investigated the effects of
incongruency on consumer response, but found mixed results. This research focuses on the
interplay between cognitive, affective and conative constructs of advertising persuasion and
uncovers the underlying processes and mechanisms that are triggered by incongruency. This
helps to explain the inconsistency in research findings and it supports managers to create
effective advertising strategies, when knowing how incongruency works. The study addresses
the following research questions:
RQ1. What is the effect of incongruency on cognitive, affective, and conative
outcomes?
RQ2. What are the underlying mechanisms of incongruency on the advertising
persuasion process?
The first research questions addresses the bilateral relationship between incongruency
and consumer response, in terms of cognitive, affective, and conative outcomes. The second
research question investigates the underlying mechanisms that are activated when processing
an incongruent stimulus. That is, what is the indirect effect of incongruency and what are
important mediators in the advertising persuasion process?
An exploratory laboratory experiment tests the effect of incongruency in TV ads on
information processing and consumer behavior in a within-subject design with one factor and
two levels (advertising stimulus: congruent versus incongruent ad). The indirect effect of
incongruency on consumers’ purchase behavior follows three causally mediated routes. First,
an incongruent stimulus positively activates feelings of pleasure, which translates into a

11
higher product value and attitude toward the brand. Second, incongruency stimulates
consumer cognition and thus, positively impacts attitude and ultimately purchase intention.
Third, incongruency has a negative effect on purchase intention mediated by attitude. The
inner state of dissonance leads to a lower overall evaluation of the brand and hence, impeding
purchase interest. We further investigated varying effects of incongruency across different
content types, i.e. humorous and absurd incongruency. The results provide evidence for the
three mechanisms and allow for valuable implications for marketing and advertising strategy.
12
REFERENCES
Alden, Dana L., Ashesh Mukherjee, and Wayne D. Hoyer (2000), “The Effects of
Incongruity, Surprise and Positive Moderators on Perceived Humor in Television
Advertising,” Journal of Advertising, 29 (2), 1–15.
Arias-Bolzmann, Leopoldo, Goutam Chakraborty, and John C Mowen (2000), “Effects of
Absurdity in Advertising: The Moderating Role of Product Category Attitude and the
Mediating Role of Cognitive Responses,” Journal of Advertising, 29, 35–49.
Bhasin, Hitesh (2016), “4 Major Challenges for Marketing Managers of 21st Century,”
(accessed September 7, 2017), [available at https://www.marketing91.com/challenges-
for-marketing-managers/].
Ducoffe, Robert H. and Eleonora Curlo (2000), “Advertising Value and Advertising
Processing,” Journal of Marketing Communications, 6 (4), 247–62.
Duncan, Tom and Sandra E. Moriarty (1998), “A Communication-Based Marketing Model
for Managing Relationships,” Journal of Marketing, 62 (2), 1–13.
Fang, Eric, Robert W. Palmatier, and Kenneth R. Evans (2008), “Influence of Customer
Participation on Creating and Sharing of New Product Value,” Journal of the Academy
of Marketing Science, 36 (3), 322–36.
Halkias, Georgios and Flora Kokkinaki (2014), “The Degree of Ad–Brand Incongruity and
the Distinction Between Schema-Driven and Stimulus-Driven Attitudes,” Journal of
Advertising, 43 (4), 397–409.
Hoyer, Wayne D., Rajesh Chandy, Matilda Dorotic, Manfred Krafft, and Siddharth S. Singh
(2010), “Consumer Cocreation in New Product Development,” Journal of Service
Research, 13 (3), 283–96.
Lee, Eun-Ju and David W. Schumann (2004), “Explaining the Special Case of Incongruity in
Advertising: Combining Classic Theoretical Approaches,” Marketing Theory, 4 (1), 59–
90.
Lusch, Robert F., Stephen L. Vargo, and Matthew O’Brien (2007), “Competing through
Service: Insights from Service-Dominant Logic,” Journal of Retailing, 83 (1), 5–18.
Moeller, Sabine (2008), “Customer Integration — A Key to an Implementation Perspective of
Service Provision,” Journal of Service Research, 11 (2), 197–210.
MSI (2016), “2014-2016 Research Priorities,” (accessed May 5, 2016), [available at
http://www.msi.org/research/2014-2016-research-priorities/].
Payne, Adrian F., Kaj Storbacka, and Pennie Frow (2008), “Managing the Co-Creation of
Value,” Journal of the Academy of Marketing Science, 36 (1), 83–96.
Pieters, Rik, Luk Warlop, and Michel Wedel (2002), “Breaking Through the Clutter: Benefits
of Advertisement Originality and Familiarity for Brand Attention and Memory,”
Management Science, 48 (6), 765–81.
Prahalad, C. K. and Venkat Ramaswamy (2004), “Co-Creation Experiences: The Next
Practice in Value Creation,” Journal of Interactive Marketing, 18 (3), 5–14.
Shankar, Venkatesh (2012), “Marketing Strategy and Firm Value,” in Handbook of Marketing
Strategy, V. Shankar and G. S. Carpenter, eds., Cheltenham: Edward Elgar, 415–39.
13
——— and Gregory S. Carpenter (2012), Handbook of Marketing Strategy, (V. Shankar and
G. S. Carpenter, eds.), Cheltenham: Edward Elgar.
Sheth, Jagdish N., Rajendra S. Sisodia, and Arun Sharma (2000), “The Antecedents and
Consequences of Customer-Centric Marketing,” Journal of the Academy of Marketing
Science, 28 (1), 55–66.
Stewart, David W. (2009), “Marketing Accountability: Linking Marketing Actions to
Financial Results,” Journal of Business Research, 62 (6), 636–43.
Teixeira, Thales S. (2014), “The Rising Cost of Consumer Attention: Why You Should Care,
and What You Can Do about It,” HBS Working Paper.
Varadarajan, Rajan (2012), “Strategic Marketing and Marketing Strategy,” in Handbook of
Marketing Strategy, S. Venkatesh and G. S. Carpenter, eds., Cheltenham: Edward Elgar,
9–27.
Verhoef, P. C., W. J. Reinartz, and M. Krafft (2010), “Customer Engagement as a New
Perspective in Customer Management,” Journal of Service Research, 13 (3), 247–52.
Xie, Chunyan, Richard P. Bagozzi, and Sigurd V. Troye (2008), “Trying to Prosume: Toward
a Theory of Consumers as Co-Creators of Value,” Journal of the Academy of Marketing
Science, 36 (1), 109–22.

14
Wertschöpfung durch Kundenintegration
Monika Käuferle, Annette Ptok und Werner Reinartz
KURZZUSAMMENFASSUNG
Insbesondere der technologische Fortschritt, die damit verbundene zunehmende
Digitalisierung und das wandelnde Konsumentenverhalten, sind Treiber für die verstärkte
Integration des Kunden in die Wertschöpfungskette. Der Konsument ist nicht länger passiver
Teilhaber, sondern wird zum aktiven Teilnehmer in die Wertschöpfungsaktivitäten eines
Unternehmens. Dabei kann der Konsument in verschiedenste Wertschöpfungsfelder integriert
werden. Der Grad der Integration des Kunden kann stark variieren. In der Literatur finden sich
diverse Ansätze dieses Phänomen zu definieren und zu gruppieren. Jedoch fehlt es bislang an
einer umfassenden und systematischen Klassifizierung der Kundenintegration in die
Wertschöpfung. Die Autoren systematisieren den Begriff der Kundenintegration unter
Berücksichtigung des Grades der Integration in die Wertschöpfung und der verschiedenen
Wertschöpfungsaktivitäten. Des Weiteren werden sowohl die unternehmens- und kundenseitigen
Wertschöpfungspotentiale für die Integration, als auch damit verbundene Herausforderungen
analysiert und entsprechende Handlungsmaßnahmen abgeleitet.
Schlagwörter: Kundenintegration, Wertschöpfungskette, Wertschöpfungspotential, aktiver
Kunde, Grad an Kundenintegration, Kundensegration, Co-Kreation, Self-Service

15
ÜBERBLICK
Der Kunde ist heutzutage nicht mehr ausschließlich passives Mitglied des
Wertschöpfungsprozesses, sondern wird zunehmend aktiv in die Wertschöpfungsaktivitäten des
Unternehmens eingebunden. Die einzelnen Aktivitäten, die der Handel ursprünglich vollständig
für den Kunden ausgeführt hat, werden immer häufiger entweder in Kooperation mit dem
Kunden vollzogen (Co-Kreation) oder vollständig an den Kunden ausgelagert (Self-Service). So
ist der heutige Kunde bereits mit verschiedensten Ansätzen dieser sogenannten
„Kundenintegration“, wie beispielsweise dem Self-Checkout bei Ikea oder der eigenständigen
Online-Zusammenstellung eines Nike Sportschuhs, vertraut.
Der beschriebene Trend eröffnet neue Möglichkeiten vielfältigen Mehrwert für das Unternehmen
und zugleich auch für den Kunden zu generieren. Aus Unternehmensperspektive liegt dieses
Wertschöpfungspotenzial unter anderem in der Möglichkeit (1) Kundenloyalität, (2)
Umsatzmengen und/oder (3) Ergebnisverbesserung (Gewinne als Differenz aus Gesamterlösen
und Kosten) zu steigern. Dabei handelt es sich bei der Umsatzsteigerung um den Anstieg im
mengenmäßigen Abverkauf von Waren und bei der Ergebnisverbesserung wird Wert durch einen
Erhöhung des Gewinns zum einen durch Kostenreduktionen oder zum anderen durch
Preissteigerungen geschaffen. Aus Kundenperspektive stellt vor allem (1) eine qualitativ bessere
Kaufentscheidung, (2) Zeitersparnis und/oder (3) Kosteneinsparungen im Kaufprozess einen
großen Mehrwert dar. Das vorliegende Kapitel befasst sich mit diesen zahlreichen
Wertschöpfungspotenzialen, die durch die Integration des Kunden in den Wertschöpfungsprozess
entstehen.
Nach einer kurzen Beschreibung der relevanten Veränderungen in der Handelslandschaft,
die die Integration des Kunden begünstigen, werden die begrifflichen Grundlagen von

16
Kundenintegration erläutert. Im Anschluss daran werden verschiedene Möglichkeiten der
Kundenintegration entlang des Wertschöpfungsprozesses aufgezeigt. In diesem Rahmen wird
diskutiert, wie durch Kundenintegration sowohl auf Unternehmens- als auch auf Kundenseite
Wert geschaffen werden kann und mit welchen Herausforderungen sich der Handel heute durch
den Trend zur Kundenintegration konfrontiert sieht (siehe Abb. 1).
Abbildung 1: Kapitelüberblick
VERÄNDERUNGEN IN DER HANDELSLANDSCHAFT
Die Integration des Kunden in die Wertschöpfung wird durch zwei zentrale
Veränderungen in der Handelslandschaft begünstigt: Den technologischen Fortschritt,
insbesondere in der Informationstechnologie, und die daraus entstehenden neuen Vertriebskanäle.
Der rapide technologische Fortschritt bietet dem Handel eine Vielzahl neuer
Möglichkeiten, sowohl im stationären Geschäft (offline), als auch im Internet (online) mit dem
Kunden in Kontakt zu treten und ihn in den Wertschöpfungsprozess einzubinden. Im Offline-
Bereich wurden dadurch verschiedene neue Möglichkeiten der Integration geschaffen, mit denen
Kunden heutzutage bereits vertraut sind und die sie zunehmend bereitwillig nutzen. Kunden des
Händlers Real scannen z.B. ihre Produkte inzwischen selbstständig an der Kasse, aber auch die

17
Lufthansa nutzt den technologischen Fortschritt zur Kundenintegration, indem der Kunde
beispielsweise sein Ticket als QR-Code auf das Smartphone geschickt bekommt und dieses beim
Boarding an den Sensor des Schalters hält. Ein weiteres Beispiel der Integration des Kunden stellt
der sogenannte „dm-Service-Punkt“ des Drogeriehändlers dm dar. Hier kann der Kunde
eigenständig Auskünfte zu Produktpreisen und Inhaltsstoffen einholen, indem die Ware über den
Monitor des Selbstbedienungsautomats gescannt wird.
Derartige technologische Neuerungen in den Geschäften ermöglichen die Einbindung des
Kunden in den Wertschöpfungsprozess. Kunden übernehmen auf diesem Weg Arbeitsschritte des
Händlers und tragen damit einen eigenen signifikanten Anteil zur Wertschöpfung bei. Auf diese
Weise reduzieren sich nicht nur die Personalkosten des Unternehmens (geringere Kosten
und/oder höhere Gewinne); auch Kunden profitieren von ihrer Eigenbeteiligung z.B. durch
kürzere Wartezeiten im Servicebereich und an der Kasse (Zeitersparnis).
Die stetige Entwicklung von Informations- und Kommunikationstechnologien führt auch
zu einer zunehmenden Verbesserung der Online-Schnittstelle zwischen Unternehmen und
Kunden und begünstigt dadurch ebenfalls die Integration des Kunden in den
Wertschöpfungsprozess. Das Internet ermöglicht Konsumenten den unkomplizierten und zeitlich
ungebundenen Zugriff auf anbieterübergreifende Informationen und Produkte und ermöglicht
Kunden somit die eigenständige und unternehmensunabhängige Informationssuche (Grewal, Iyer
und Levy 2004). Diese Entwicklung bildet die Grundlage für die Einbindung des Kunden in die
Wertschöpfung über das Internet.
Die Entstehung neuer mobiler Kanäle gestaltet diesen Zugriff sogar noch komfortabler.
Kunden können heutzutage mittels mobiler Endgeräte wie Smartphones oder Tablet-Computern
zeit- und ortsungebunden über Internetseiten oder Applikationen auf die Informations- und
Produktangebote vielzähliger Händler zugreifen. Dieser neue mobile Vertriebs- und

18
Informationskanal erfreut sich zunehmender Beliebtheit. Das mobile Internet über Smartphones
wird mittlerweile von ca. 20 Mio. Deutschen genutzt (AGOF 2012).
Aber auch die Interaktivität der Online-Schnittstelle hat sich durch die technologischen
Fortschritte stark weiterentwickelt. Es hat sich eine Netzwerkstruktur entwickelt über die Kunden
nicht nur mit Unternehmen sondern auch mit anderen Konsumenten und Freunden im Rahmen
des Kaufprozesses kommunizieren können. So können sich Kunden heute über soziale
Netzwerke oder Onlineforen vor dem Kauf über Produkteigenschaften oder die jeweilige
Produkteignung austauschen und somit die Beratungsfunktion des Händlers übernehmen. Aber
auch nach dem Kauf werden solche interaktiven Plattformen gerne genutzt, um zum Beispiel
Anwendungsprobleme zu diskutieren und zu lösen. Auf diesem Wege übernimmt der Kunde nun
auch zum Teil die Serviceleistung des Händlers in der Nachkaufphase.
INTEGRATION DES KUNDEN ENTLANG DER WERTSCHÖPFUNGSKETTE:
INDIKATOREN BETRIEBSWIRTSCHAFTLICHER WERTSCHÖPFUNG
Die Integration des Kunden durch Handelsunternehmen wird im Folgenden entlang des
Wertschöpfungsprozesses betrachtet. Dabei wird der Wertschöpfungsprozess, wie in Abbildung 2
dargestellt, in vier zentrale Bereiche unterteilt: (1) Produktentwicklung, Produktion und
Sortimentsbildung (2) Informationsbereitstellung, Beratung und Marketingkommunikation, (3)
Transaktionsabwicklung und Logistik und (4) Service und Support.
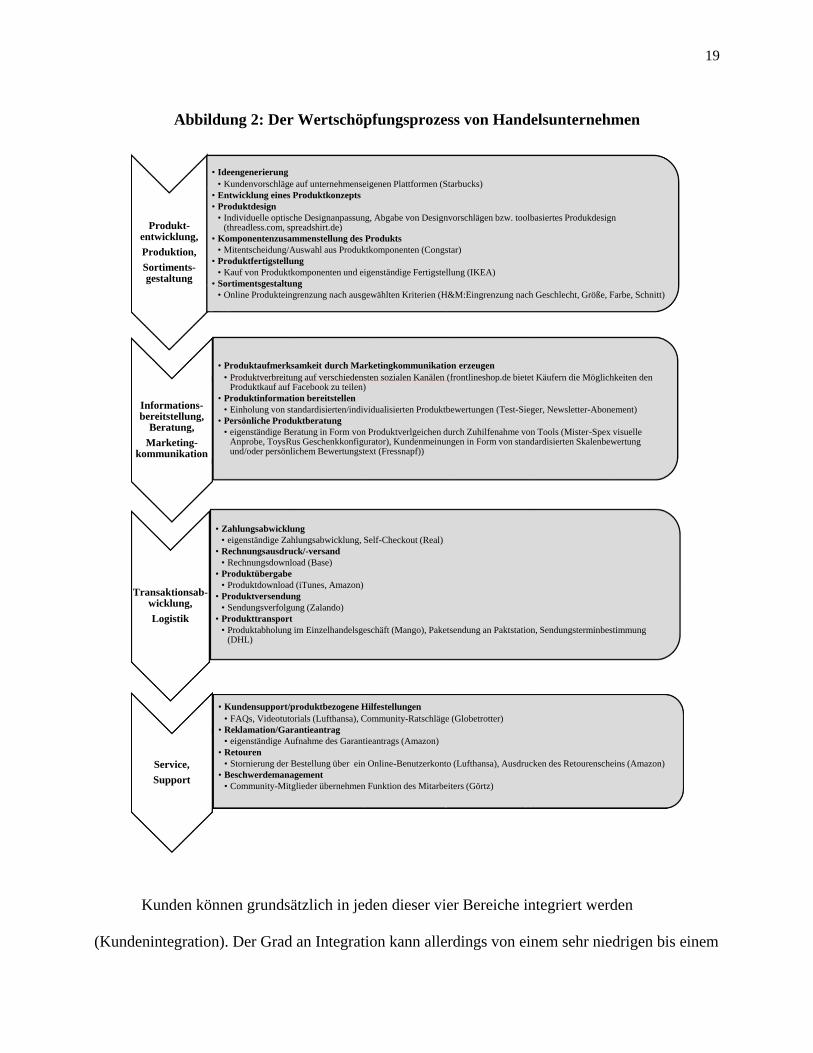
19
Abbildung 2: Der Wertschöpfungsprozess von Handelsunternehmen
Kunden können grundsätzlich in jeden dieser vier Bereiche integriert werden
(Kundenintegration). Der Grad an Integration kann allerdings von einem sehr niedrigen bis einem
Produkt-entwicklung,
Produktion,
Sortiments-gestaltung
• Ideengenerierung
• Kundenvorschläge auf unternehmenseigenen Plattformen (Starbucks)
• Entwicklung eines Produktkonzepts
• Produktdesign
• Individuelle optische Designanpassung, Abgabe von Designvorschlägen bzw. toolbasiertes Produkdesign (threadless.com, spreadshirt.de)
• Komponentenzusammenstellung des Produkts
• Mitentscheidung/Auswahl aus Produktkomponenten (Congstar)
• Produktfertigstellung
• Kauf von Produktkomponenten und eigenständige Fertigstellung (IKEA)
• Sortimentsgestaltung
• Online Produkteingrenzung nach ausgewählten Kriterien (H&M:Eingrenzung nach Geschlecht, Größe, Farbe, Schnitt)
Informations-bereitstellung,
Beratung,
Marketing-kommunikation
• Produktaufmerksamkeit durch Marketingkommunikation erzeugen
• Produktverbreitung auf verschiedensten sozialen Kanälen (frontlineshop.de bietet Käufern die Möglichkeiten den Produktkauf auf Facebook zu teilen)
• Produktinformation bereitstellen
• Einholung von standardisierten/individualisierten Produktbewertungen (Test-Sieger, Newsletter-Abonement)
• Persönliche Produktberatung
• eigenständige Beratung in Form von Produktverlgeichen durch Zuhilfenahme von Tools (Mister-Spex visuelle Anprobe, ToysRus Geschenkkonfigurator), Kundenmeinungen in Form von standardisierten Skalenbewertung und/oder persönlichem Bewertungstext (Fressnapf))
Transaktionsab-wicklung,
Logistik
• Zahlungsabwicklung
• eigenständige Zahlungsabwicklung, Self-Checkout (Real)
• Rechnungsausdruck/-versand
• Rechnungsdownload (Base)
• Produktübergabe
• Produktdownload (iTunes, Amazon)
• Produktversendung
• Sendungsverfolgung (Zalando)
• Produkttransport
• Produktabholung im Einzelhandelsgeschäft (Mango), Paketsendung an Paktstation, Sendungsterminbestimmung (DHL)
Service,
Support
• Kundensupport/produktbezogene Hilfestellungen
• FAQs, Videotutorials (Lufthansa), Community-Ratschläge (Globetrotter)
• Reklamation/Garantieantrag
• eigenständige Aufnahme des Garantieantrags (Amazon)
• Retouren
• Stornierung der Bestellung über ein Online-Benutzerkonto (Lufthansa), Ausdrucken des Retourenscheins (Amazon)
• Beschwerdemanagement
• Community-Mitglieder übernehmen Funktion des Mitarbeiters (Görtz)

20
sehr hohen Grad variieren (Bendapudi und Leone 2003; Blazevic und Lievens 2008; Dong,
Evans und Zou 2007; Meuter und Bitner 1998). Wird der Kunde nicht oder kaum integriert
(Kundensegregation), bedeutet dies im Umkehrschluss, dass der Händler selbst noch stark in die
Ausführung der jeweiligen Wertschöpfungsaktivität involviert ist. Je höher der Grad an
Kundenintegration desto geringer wird der Wertschöpfungsbeitrag des Händlers bei der
jeweiligen Aktivität. Wie in Abbildung 3 veranschaulicht, wird im Folgenden der Grad an
Kundenintegration in drei Stufen betrachtet:
1. Kundensegregation. Der Grad an Kundenintegration ist sehr niedrig, da diese Form, die
traditionelle Rollenverteilung zwischen Kunde und Unternehmen beschreibt und somit nur die
minimalsten Anforderungen an Kundenaktivität verlangt. Der Kunde wird, wenn überhaupt, in
die üblichen Aktivitäten der Transaktionsabwicklung eingebunden. Dies bedeutet, dass das
Unternehmen den kompletten Wertschöpfungsprozess ohne aktives Mitwirken des Kunden
durchführt. Er ist somit passiver Leistungsempfänger (Sawhney, Verona und Prandelli 2005).
2. Co-Kreation. In Kooperation mit dem Kunden wird Wert für das Unternehmen und den
Kunden geschaffen (Payne, Storbacka und Frow 2008). Entgegen der traditionellen Interaktion
zwischen Kunde und Unternehmen, wird der Kunde in der Form der Co-Kreation zu einem
gewissen Level in eine Wertschöpfungsaktivität integriert und interagiert in diesem Rahmen mit
dem Unternehmen (Unternehmen Kunde). Co-Kreation bedeutet also, dass der Kunde den
Händler in seinen Aufgaben unterstützt und damit den Aufwand des Handelsunternehmens
reduziert. Der Händler bleibt weiterhin aktiv und trägt die Hauptverantwortung für die jeweilige
Wertschöpfungsaktivität.
3. Self-Service. Die eigenständige Übernahme von Wertschöpfungsaktivtäten durch den
Kunden und der gleichzeitige Verzicht auf Unterstützung durch das Handelsunternehmen
während der entsprechenden Aktivität wird als Self-Service bezeichnet (Meuter et al. 2000,

21
S.60). Dies ist die stärkste Form der Kundenintegration, da der Händler seine
Wertschöpfungsaktivität (fast) vollständig an den Kunden auslagert. Es gibt zweierlei
Möglichkeiten den Kunden in dieser extremen Form zu integrieren: entweder wird die
entsprechende Wertschöpfungsaktivität vollständig durch den Kunden selbst ausgeführt oder sie
wird in Zusammenarbeit/Interaktion von mehreren Kunden (in beiden Fällen ohne Interaktion mit
dem Unternehmen) ausgeübt (Kunde Kunde). Self-Service bedeutet also, dass der Kunde
Aufgaben des Händlers (nahezu) vollständig übernimmt und damit den Arbeitsaufwand des
Händlers minimiert. Der Händler wird zum passiven Wertschöpfungspartner in der jeweiligen
Wertschöpfungsaktivität; die Hauptverantwortung liegt somit beim Kunden.
Abbildung 3: Formen der Kundenintegration
Im Folgenden wird veranschaulicht, welche Möglichkeiten Unternehmen besitzen, den
Kunden entlang des Wertschöpfungsprozesses durch Co-Kreation oder Self-Service online und
offline zu integrieren und welche Rolle der Kunde damit in der Wertschöpfung einnimmt.
Außerdem wird herausgestellt, inwiefern die eingangs genannten Wertschöpfungspotenziale für
Handelsunternehmen (Kundenloyalität, Umsatzmenge, Ergebnisverbesserung) und Kunden
(qualitativ bessere Kaufentscheidung, Zeitersparnis, Kosteneinsparung) durch
Integrationsmaßnahmen erreichbar sind.

22
Wertschöpfung durch Integration des Kunden in: Produktentwicklung, Produktion und
Sortimentsbildung
Dieser erste Teil des Wertschöpfungsprozesses umfasst die Wertschöpfungsaktivitäten
Produktentwicklung (Ideengenerierung, Konzeptentwicklung, Designkreation), Produktion
(Komponentenzusammenstellung, Fertigung) und Sortimentsbildung.
Neben Herstellerunternehmen betreffen die Wertschöpfungsaktivitäten
Produktentwicklung und Produktion zunehmend auch Handelsunternehmen, da diese verstärkt
vertikal rückwärtsintegrieren und ihre eigenen Produkte (Eigenmarken) auf den Markt bringen
(AC Nielsen 2005). In verschiedensten Handelskategorien haben sich Händler auf solche
sogenannten Eigenmarken fokussiert. Der Lebensmittelhändler Rewe zum Beispiel bietet
Eigenmarken sowohl in niedrig- als auch in hochpreisigen Produktsegmenten mit den Marken
„ja!“ im Discountsegment, der Handelsmarke „Rewe Beste Wahl“, der Ökomarke „Rewe Bio“
und der Premium-Handelsmarke „Rewe feine Welt“ an. Rossmann und dm als Drogeriehändler
folgen diesem Trend ebenfalls mit einer Vielzahl an Eigenmarken.
Handelsunternehmen übernehmen im Rahmen der Rückwärtsintegration aber nicht immer
den kompletten Schritt der Produktentwicklung und Produktion, sondern fokussieren sich zum
Teil auf einzelne der oben genannten Wertschöpfungsaktivitäten. So stellt H&M zwar keine
eigenen Produkte her, erstellt die Produktdesigns aber vollkommen eigenständig.
Zudem stellt der Händler in seiner klassischen Sortimentsfunktion ein adäquates
Produktsortiment für seine Kunden zusammen, das die Kundenansprüche bestmöglich erfüllt.
Je nachdem welche Wertschöpfungsaktivitäten durch den Handel ausgeführt werden,
besteht die Möglichkeit den Kunden in den Wertschöpfungsprozess zu integrieren. Dieser
übernimmt dabei je nach Integrationsgrad die Rolle des (Co-)Entwickler und/oder des (Co-
)Produzenten.

23
Der Kunde als (Co-)Entwickler. Der Kunde trägt als (Co-)Entwickler zur Wertschöpfung
bei, indem er in die Produktentwicklung und Sortimentsbildung eingebunden wird. Dies
geschieht zumeist über das Internet. So integriert Starbucks zum Beispiel Kunden durch Co-
Kreation in den Generierungsprozess von neuen Produktideen. Dabei werden diese aufgefordert
auf einer unternehmenseigenen Internetplattform Ideenbeiträge zu liefern, welche anschließend
vom Unternehmen weiter verarbeitet werden (Produktentwicklung). Das Handelsunternehmen
spreadshirt.com bindet seine Kunden vergleichsweise noch stärker in den Designprozess der
verkauften T-Shirts ein. Kunden können ihre eigenen T-Shirt Designs hochladen und so ohne
Einwirkung des Händlers (Self-Service) selbstständig als Entwickler über das Design der Shirts
bestimmen (Produktentwicklung). Da die selbstkreierten Designs sowohl von dem integrierten
Kunden als auch von anderen Kunden gekauft werden können, gestaltet der Kunde somit auch
das Produktsortiment aktiv mit.
Der Kunde als (Co-)Produzent. Der Wertschöpfungsbeitrag des Kunden als (Co-
)Produzent liegt in der Zusammenstellung und/oder Fertigstellung des Produkts (Produktion). Im
Internet wird der Kunde über entsprechende Webseiten-Tools in die Produktzusammenstellung
integriert. Bekannte Beispiele für diese Art der Kundenintegration liefern die Online-Händler
mymuesli oder chocri meine Schokolade. Der Kunde kann hier zwischen verschiedenen Zutaten
wählen und ein individuelles Müsli bzw. eine individuelle Schokolade zusammenstellen
(Komponentenzusammenstellung). Er arbeitet dabei über eine Online-Plattform in Interaktion mit
dem Unternehmen, da im Prozess der Zusammenstellung auf vorgegebene
Lebensmittelkomponenten zugegriffen wird. Auf diesem Wege ist der Kunde auch in der Rolle
als Co-Produzent in die Sortimentsbildungsfunktion des Händlers involviert. Denn durch die
Einbindung des Kunden als (Co-) Produzent passt er die Produkte des Sortiments an. Die online
co-kreierten Produkte können anschließend auch von anderen Kunden gekauft werden.

24
IKEA und Youcook sind dagegen prominente Beispiele, welche Kundenintegration im
offline-Kanal umgesetzt haben. Der schwedische Möbelhändler integriert seine Kunden durch
Co-Kreation, indem diese im Geschäft die Möglichkeit haben, Möbelstücke wie zum Beispiel
den Pax-Kleiderschrank, eigenständig aus verschiedenen Produktkomponenten individuell
zusammenzustellen (Produktion: Komponentenzusammenstellung). Dabei stellt IKEA die
Produktbestandteile in diversen Farben und Ausführungen separat zur Verfügung und der Kunde
kombiniert seinen Kleiderschrank gemäß seinen Vorstellungen.
Das Jungunternehmen Youcook agiert in der Lebensmittelbranche und bedient sich der
Form des Self-Services. Das Unternehmen verkauft sogenannte „Kochkits“ für verschiedene
Fertiggerichte, die der Kunde zu Hause eigenständig nach Anleitung zubereitet. Ein solches
Kochkit, enthält alle für das Gericht benötigten Zutaten und ist bereits auf die notwendige Menge
portioniert. Der Kunde führt auch in diesem Beispiel einen Teil der ursprünglichen
Wertschöpfungsaktivität des Händlers der Produktion (Fertigstellung) selbstständig von zu Hause
durch.
Wertschöpfungspotenzial für den Kunden
(a) Potenzial zur Erzielung einer qualitativ besseren Kaufentscheidung. Die Integration
des Kunden in Wertschöpfungsaktivitäten der Produktentwicklung, Produktion
(Komponentenzusammenstellung) und Sortimentsanpassung kann zu einer qualitativ besseren
Kaufentscheidung für den Kunden führen. Denn dieser erhält durch seine aktive Teilnahme am
Wertschöpfungsprozess Zugriff auf ein weitestgehend an die eigenen Bedürfnisse angepasstes
Sortiment und/oder Produkt (Franke, Keinz und Steger 2009; Randall, Terwiesch und Ulrich
2007).
(b) Potenzial zur Erzielung von Zeitersparnis. Die Integration des Kunden in die
Produktentwicklung, Produktion (Komponentenzusammenstellung) und Sortimentsbildung geht

25
mit einem zeitlichen Aufwand auf Kundenseite einher. Denn dieser muss sich zunächst mit den
zur Verfügung stehenden Produktbestandteilen vertraut machen, Abwägungen treffen und die
einzelnen Produktkomponenten zusammenstellen. Darüber hinaus muss der Kunde im Rahmen
der Komponentenzusammenstellung die grundlegende Bedienung des jeweiligen
Produktkonfigurators erlernen, was, je nach Komplexität des Tools, einen signifikanten
Zeitaufwand bedeuten kann. Dies hat jedoch nicht zwangsläufig negative Auswirkungen auf den
geschaffenen Mehrwert. Wie die Ergebnisse der Studie von Franke und Schreier (2010) belegen,
wirkt der zusätzliche Aufwand, den Konsumenten im Rahmen der Integrationsmaßnahmen
erbracht haben, bei einer hohen Übereinstimmung von Kundenerwartungen mit dem
tatsächlichem Resultat, positiv auf den geschaffen Mehrwert. Wird der Kunde allerdings in die
Aktivität der Produktion (Fertigstellung) integriert, so kann er von einem schnelleren
Kaufprozess profitieren, da er die Fertigstellung des Produkts in Eigenregie, zeitlich unabhängig
von der Verfügbarkeit des Handelsunternehmens, durchführen kann.
(c) Potenzial zur Erzielung von Kosteneinsparungen. Erwartungsgemäß sollten
Integrationsmaßnahmen für den Kunden in einem effizienteren Kaufprozess resultieren, da der
Kunde das Unternehmen durch seine Mitarbeit entlastet. Dies lässt sich allerdings in der Praxis
bislang nur selten beobachten. Die Integration des Kunden im Rahmen der Produktion resultiert
oftmals sogar in einem Preisaufschlag, da Händler den durch die individuelle Fertigung
entstandenen zusätzlichen Aufwand aufwiegen möchten.
Wertschöpfungspotenzial für das Unternehmen
(a) Potenzial zur Erzielung von Loyalität. Durch das implizite Angebot individuell
passender Produktangebote kann die Kundenzufriedenheit gesteigert werden, was wiederrum zu
einer erhöhten Loyalität zum Unternehmen führt. Ferner kommen Troye und Supphellen (2012)
zu dem Ergebnis, dass insbesondere in der Produktion (Fertigstellung), Kunden ihre

26
Eigenleistung positiv auf das Endprodukt übertragen und sich dadurch die subjektive
Wahrnehmung der Produktqualität erhöht, sodass Unternehmen durch die Kundenintegration eine
stärkere Beziehung zwischen Kunde und Produkt aufbauen können.
Die Integration des Kunden in die Produktentwicklung kann zudem durch
unterhalterischen Mehrwert zu Kundenzufriedenheit führen, da die kreative Arbeit z.B. im
Rahmen Produktentwicklung vielen Kunden Spaß macht. Im Rahmen der Untersuchung von
Franke und Schreier (2010) wird aufgezeigt, dass das Vergnügen am Designprozess
(Produktentwicklung) ebenfalls einen verstärkenden Effekt auf den subjektiven Mehrwert für den
Kunden schafft. Darüber hinaus kann der Kunde durch die Mitwirkung am
Produktentwicklungsprozess soziale Anerkennung bei Mitmenschen erzielen. Diese
„Erlebniskomponente“ stärkt die Beziehung zum Unternehmen und somit die Differenzierung
gegenüber Wettbewerbern (Prahalad und Ramaswamy 2000; 2004). Prahalad und Ramaswamy
(2004, p. 10) sprechen in diesem Zusammenhang von „cocreating experiences as the source of
unique value“, demnach gemeinsam mit dem Kunden eine einzigartige Erfahrung zu schaffen,
um Wert zu erzeugen und somit Wettbewerbsvorteile auszuschöpfen.
(b) Potenzial zur Erzielung höherer Umsätze. Handelsunternehmen haben durch die
Einbeziehung von Kunden in die Produktentwicklung Zugang zu neuen, wertvollen Produkt- und
Gestaltungsideen, die auf die entsprechende Bedürfnisbefriedigung ausgerichtet sind (Gruner und
Homburg 2000).
Die Ergebnisse der Studie von Gruner und Homburg (2000) zeigen, dass die Integration
des Kunden in die Stufe der Produktentwicklung (insbesondere Ideengenerierung und
Konzeptentwicklung) die Erfolgswahrscheinlichkeit von Neuprodukten erhöht. Die Unterphasen
der Produktentwicklung (Ideengeneration, Konzeptentwicklung und Designkreation) sind
keineswegs gleichbedeutend im Hinblick auf die Erfolgswahrscheinlichkeit. Im Vergleich zur

27
Ideengenerierung wird der Konzeptentwicklung eine stärkere Bedeutung zugemessen, da der
Kunde in dieser Wertschöpfungsstufe explizite Umsetzungsvorschläge dem Handelsunternehmen
kommunizieren kann, anstelle von vagen Ideen. Kunden tragen ihre Bedürfnisse im Rahmen ihrer
aktiven Teilnahme am Wertschöpfungsprozess offen an das Unternehmen heran. Unternehmen
können auf diesem Wege Marktlücken erkennen und schließen und somit sowohl bestehende
Kundensegmente besser bedienen als auch neue erschließen.
Außerdem haben Online-Händler im Rahmen der Produktion
(Komponentenzusammenstellung) und Sortimentsbildung zusätzlich die Möglichkeit, basierend
auf einer Kombination aus der aktuellen Suchhistorie und vergangenen Produktkäufen anderer
Käufer, dem Kunden ein abgestimmtes Produktsortiment anzubieten, sodass die
Kaufwahrscheinlichkeit durch eine zufriedenstellende Angebotspalette gesteigert wird.
(c) Potenzial zur Ergebnisverbesserung. Durch die Identifikation von
Kundenbedürfnissen im Rahmen der Produktentwicklung, Produktion
(Komponentenzusammenstellung) und Sortimentsbildung, wird die Gefahr des Misserfolgs von
Neuprodukten reduziert (Gruner und Homburg 2000; Ernst et al. 2011, S. 291; Joshi und Sharma
2004; Lilien et al. 2002; Ogawa und Piller 2006). Händler können dadurch unnötige Kosten
vermeiden und somit ihr Ergebnis verbessern. Darüber hinaus kann das Unternehmen durch die
Ausgliederung von Fertigstellungsaktivitäten Kosten durch Mitarbeitereinsparungen reduzieren.
Welche Vorteile aus der Integration des Kunden in die Wertschöpfungsstufe der
Produktentwicklung (Designkreation) resultieren, untersuchen Schreier, Fuchs und Dahl (2012)
in ihrer Studie. Die Autoren belegen, dass die durch Kunden kreierten Produktdesigns zu einer
gesteigerten Wahrnehmung der Innovationsfähigkeit eines Unternehmens führen. Dies
wiederrum hat einen positiven Effekt auf Performance-Variablen wie Wiederkaufsabsicht und
Zahlungsbereitschaft des Kunden. Die Ergebnisse zeigen, dass Unternehmen bis zu 50%

28
Steigerung in Kundenweiterempfehlungen durch kunden-initiierte Designs erreichen können.
Diese Resultate decken sich branchenweit mit einer Vielzahl wissenschaftlicher Studien, die
ebenfalls belegen, dass die Integration des Kunden in die Produktentwicklung durchaus zu einer
höheren Zahlungsbereitschaft führt (Franke, Keinz und Steger 2009; Franke und Piller 2004;
Franke und Schreier 2008; 2010; Fuchs, Prandelli und Schreier 2010; Schreier 2006). So können
Händler die höhere Zahlungsbereitschaft der Kunden für verbesserte Produkte ausnutzen und
somit zusätzliche Gewinnsteigerungen erzielen. Jedoch besteht die Gefahr, dass der Kunde
falsche bzw. suboptimale Entscheidungen (insbesondere in der Produktenwicklung und
Produktion) trifft, da er gegebenenfalls nicht über ausreichendes Fachwissen verfügt, oder sich
seiner konkreten Bedürfnisse nicht umfassend bewusst ist. In einem solchen Fall zeigen
Bendapudi und Leone (2003), dass der Kunde sich im Rahmen von Integrationsmaßnahmen, die
zu einem positiven Resultat führen, dieses Produktergebnis selbst zuschreibt, wohingegen
negative Produktergebnisse tendenziell überwiegend dem Unternehmen angelastet werden.
Wertschöpfung durch Integration des Kunden in: Informationsbereitstellung, Beratung und
Marketingkommunikation
Der zweite Wertschöpfungsbereich von Handelsunternehmen setzt sich zusammen aus der
Informationsbereitstellung, der Kundenberatung und der Marketingkommunikation zur
Generierung von Kundenaufmerksamkeit. Bevor der Kunde ein Produkt kauft, sucht er
üblicherweise Informationen zu den Produktdetails und den Preisen verschiedener Alternativen.
Der Wertschöpfungsbereich der Informationsbereitstellung umfasst die Aufgabe des Händlers
relevante Produktinformationen für den Kunden zu sammeln und anzubieten. Die Funktion der
Beratung hingegen, grenzt sich von der Informationsbereitstellung in dem Maße ab, dass bei der
Beratung eine Interaktion zwischen dem Kunden und einem Unternehmensmitarbeiter in Form
einer individuellen und persönlichen Kaufentscheidungsunterstützung erfolgt. Die dritte Aktivität

29
des Händlers in diesem Wertschöpfungsbereich ergibt sich aus zielgerichteten
Marketingkommunikationsmaßnahmen, die sowohl der Generierung von Produktaufmerksamkeit
als auch der Kaufbewerbung potentieller Konsumenten, dienen. Während der Kunde im
klassischen Wertschöpfungsprozess hinsichtlich Produkte und Preise vom Unternehmen
informiert, beraten und beworben wurde, wird der Kunde heute selbst häufig aktiv in diesen
Wertschöpfungsschritt eingebunden. Er kann im Rahmen dieser Kundenintegration zum einen als
(Co-)Informationssammler und zum anderen als (Co-)Berater und (Co-)Werber fungieren. Auch
wenn dies bislang ausschließlich über den Onlinekanal umgesetzt wird, ergibt sich ein potentiell
großer Einfluss auf die Wertschöpfungskette.
Der Kunde als (Co-)Informationssammler. Der Kunde ist zunehmend proaktiv in die
Informationsrolle involviert. Er kann sich über das Internet sehr einfach anbieterübergreifend
informieren (Grewal, Iyer und Levy 2004) und entwickelt sich im Hinblick auf diese
Wertschöpfungsaktivität zu einem selbstständigen Akteur in der Wertschöpfung (Prahalad and
Ramaswamy 2000). Konsumenten können Produkt- und Preisinformationen sehr einfach
unabhängig von einzelnen Händlern über Preissuchmaschinen und Foren sammeln und stehen so
in keinem bzw. minimalem Austausch mit dem Händler (Self-Service). Immer mehr Kunden
betreten das stationäre Geschäft mit einem teilweise größeren Wissen zu einem bestimmten
Produkt als die jeweilige Verkaufsperson. Der Handel kann daher in diesem
Wertschöpfungsschritt nur sehr begrenzt auf den Kunden einwirken. Manche
Handelsunternehmen wie Douglas streben daher eine Co-Kreation an, durch die sie mit dem
Kunden weiterhin bei der Informationssuche interagieren können. Beispielsweise integriert
Douglas den Kunden im Internet durch den sogenannten „Duftberater“. Der Kunde kann über
dieses Tool einen Dufttest durchführen und erhält als Ergebnis eine auf seine Duftnote
abgestimmte Flacon-Auswahl. Dafür beantwortet der Kunde online fünf Fragen. Zum einen gibt

30
er an, für welches Geschlecht das Parfüm bestimmt ist und legt die Duftcharakteristika
(orientalisch, holzig, fruchtig-floral oder frisch) fest. Zum anderen wählt der Kunde aus einer
Handvoll Eigenschaften aus, wie der Duft auf Mitmenschen wirken soll und bestimmt in welcher
Lebenssituation (tagsüber oder abends) der Duft benutzt werden soll.
Der Kunde als (Co-)Berater. In der Rolle als Berater unterstützt der Kunde sich und
andere Konsumenten bei der Kaufentscheidungsfindung und übernimmt dadurch die
Beratungsfunktion des Händlers. Er führt diese Wertschöpfungsaktivitäten eigenständig aus
(Self-Service), indem er andere Kunden berät und produktbezogene Informationen und Tipps,
insbesondere in sozialen Medien und Konsumentenforen mit anderen Konsumenten
kommuniziert.
Die teilweise Integration des Konsumenten als Co-Berater ist ebenso denkbar.
Produktbewertungen durch Kunden in der Form der vorgegebenen fünf-Sterne-Skala von
Amazon oder gegebenenfalls mit individueller Kritik über unternehmensspezifische Produkt-
Feedbackmodule, sind ein bekanntes Beispiel für Kundenintegration im Online-Kanal (Co-
Kreation). Auch das Textilunternehmen P&C bietet seinen Kunden die Möglichkeit, ausgewählte
Produkte aus dem Online-Shop mit Hilfe des Buttons „Freunde fragen“ mit wenigen Klicks
direkt an Kontakte aus sozialen Netzwerken weiterzuleiten und deren Meinung anzufragen (Co-
Kreation). Auf diese Weise bietet das Unternehmen die Plattform für eine Kundenberatung durch
andere Kunden, bleibt aber zu einem geringen Ausmaß involviert.
Der Kunde als (Co-)Werber: Der Kunde generiert als (Co-)Werber Aufmerksamkeit für
Händlerprodukte bei potentiellen Konsumenten. Somit wird dem Kunden die Funktion der
Marketingkommunikation zu teil. Dies kann zum einen in der klassischen, freien Form der
Mundpropaganda auftreten. Zum anderen besteht die Möglichkeit im Rahmen der gezielten
Kundenintegration in die Wertschöpfung, den Kunden sowohl im stationären Geschäft, also auch

31
im Online-Handel einzubinden. Beispielsweise kann der Kunde über den stationären Kanal als
Co-Werber integriert werden. Dabei bietet der Händler dem Kunden für gezielte Maßnahmen zur
erfolgreichen Kundenakquise im Gegenzug zumeist eine monetäre oder materielle Vergütung an.
Eine weitere Variante zur Kundenintegration bietet der Online-Kanal. Der Kaffeehändler Tchibo
stellt für seine Online-Produkte über ein Tool eine direkte Verbindung zu sozialen Netzwerken
wie Facebook oder Twitter her. Der Kunde kann entsprechende Produkte mittels eines Klicks an
seine Freunde und Bekannte in sozialen Netzwerken oder per E-Mail weiterleiten und unterstützt
den Händler in diesem Wertschöpfungsbereich als Co-Werber.
Wertschöpfungspotenzial für den Kunden
(a) Potenzial zur Erzielung einer qualitativ besseren Kaufentscheidung. Durch die
Integration in die Informationsaktivität kann der Kunde eine qualitativ bessere Kaufentscheidung
erzielen. Zum einen hat er die Möglichkeit seine Kaufentscheidung durch den Zugang zu
zahlreichen anbieterübergreifenden Informationsquellen auf eine breitere Entscheidungsbasis zu
stützen (Alba et al. 1997). Zum anderen kann er Meinungen anderer Kunden bzw. Freunde mit in
die Entscheidungsfindung (Beratung) einbinden (Chen, Wang und Xie 2011). Der Kunde hat auf
dieser Basis größeres Vertrauen in seine Kaufentscheidung und empfindet ein geringeres
Kaufrisiko. Diesen Effekt zeigen Adjei, Noble und Noble (2010) in ihren Untersuchungen von
Onlineforen und kommen zu dem Ergebnis, dass der Informationsaustausch zwischen Kunden
untereinander das Kaufrisiko deutlich senkt und somit eine mögliche
Umsatzsteigerungsmaßnahme (mengenmäßig) für das Unternehmen darstellt.
(b) Potenzial zur Erzielung von Zeitersparnis. Bedingt durch das Internet, kann der Kunde
sich im Rahmen der Integration in Beratung und Marketingkommunikation unabhängig von den
Geschäftsöffnungszeiten beraten lassen, entscheidende Produkttipps einholen und dadurch
Zeiteinsparungspotenziale erzielen. Das diese Vorteile der Integration von Kunden wertgeschätzt

32
werden, bestätigen eine Vielzahl wissenschaftlicher Untersuchungen (Collier und Sherell 2009;
Dabholkar 1996; Meuter et al. 2000). Im konkreten Fall der Kundenintegration in die
Wertschöpfungsfunktion der Beratung zeigen Weiss, Lurie und MacInnis (2008), dass
Zeiteinsparungspotentiale, insbesondere in Form einer schnellen Beantwortung von
kundengestellten Anfragen durch den Wissensaustausch in Foren (bspw. spezifische
Produktberatung in Foren), den Kundenmehrwert steigern. Auf Grund des technologischen
Fortschritts und der nahezu allgegenwärtigen Internetverfügbarkeit, liegt die Notwendigkeit zur
Integration in die Informationsaktivität von Kundenseite nahe. Denn nur so kann der Kunde
seinem allgemeinen Kaufziel nach günstigen, individuellen und qualitativen Produkten, die seine
Bedürfnisse möglichst optimal befriedigen, näher kommen. Im Gegensatz zur Integration in die
Beratung und Marketingkommunikation birgt die Integration in die Informationsaktivität
demzufolge eher das Risiko eines gegenteiligen Effekts, da der Kunde Zeit investieren muss, um
die zur Verfügung stehende Informationsmenge, die insbesondere der Onlinebereich bietet, zu
verarbeiten. Die Integration des Kunden in diese Wertschöpfungsfunktion kann somit zu einer
Verzögerung der Kaufentscheidung führen.
(c) Potenzial zur Erzielung von Kosteneinsparungen. Im Rahmen der
Informationsaktivität kann Wert für den Kunden in Form einer kostengünstigeren
Kaufentscheidung geschaffen werden. Durch die verfügbare Informationsvielfalt kann der Kunde
händlerübergreifende Preisvergleiche durchführen und auf dieser Basis das kostengünstigste und
individuell passende Angebot identifizieren und auswählen (Bakos 1997, 1998; Grewal, Iyer und
Levy 2004).
Wertschöpfungspotenzial für das Unternehmen
(a) Potenzial zur Erzielung von Loyalität. Die Kundenintegration in den
Wertschöpfungsschritt Information stellt für Handelsunternehmen eine Gefährdung für die

33
Kundenloyalität dar. Der Kunde hat heutzutage über das Internet Zugriff auf eine größere
Bandbreite an Anbietern und ist in der Lage, sich auf einfachem Wege Informationen von
verschiedenen Händlern einzuholen und Preise anbieterübergreifend zu vergleichen. Dies
bedeutet, dass die Informationsasymmetrie, die bislang zugunsten des Händlers bestanden hat,
immer weniger existiert (Sinha 2000). Es kann infolgedessen ein starker Preisfokus auf
Kundenseite beobachtet werden, der sich negativ auf die Kundenloyalität auswirkt.
(b) Potenzial zur Erzielung höherer Umsätze. Die drastische Reduktion der
Informationsasymmetrie gefährdet im Rahmen der Informationsfunktion auch das
Umsatzpotenzial der Händler. Kunden kennen durch die aktive Informationsbeschaffung das
Produktangebot verschiedener Anbieter und können somit ein Produkt mit optimal passenden
Eigenschaften beziehen. Es wird dadurch umso schwerer den Kunden von den eigenen Produkten
zu überzeugen, sofern diese nicht vollkommen den individuellen Vorstellungen entsprechen, was
sich negativ auf den Umsatz auswirken kann (Bakos 1997). Im Gegensatz dazu bietet die
Integration des Kunden in Beratung und Marketingkommunikation das Potenzial für
Umsatzsteigerungen. Dieses Wertschöpfungspotential identifizieren auch Duan, Gu und
Whinston (2008) in ihrer Studie, indem sie zwischen Mundpropaganda im Internet und
Unternehmensabverkäufen einen positiven Feedback-Effekt feststellen. Zum einen führt
Mundpropaganda zu höheren Abverkäufen und zum anderen resultieren gesteigerte Abverkäufe
wiederum in erhöhter Mundpropaganda. Ferner kann durch Kundeneinbindung die
Glaubwürdigkeit der vermittelten Informationen erhöht werden. So haben Markenbotschafter
oder Meinungsführer (oder „Brand Ambassadors“ und „Opinion Leader“) eine stärke
Überzeugungskraft als die von Handelsunternehmen initiierten Kampagnen (Van Eck, Jager und
Leeflang 2011). Dieser Effekt beschränkt sich jedoch nicht nur auf Meinungsführer und
Markenbotschafter. Weitere Studien konnten belegen, dass zum einen die Beratung durch

34
Forenmitglieder ein stärkeres Produktinteresse erzeugt als unternehmenseigene
Produktinformationen (Bickart und Schindler 2001). Dabei identifizieren die Autoren drei
relevante Treiber dieses Effektes: gesteigerte Glaubwürdigkeit, gesteigerte Relevanz und höhere
Empathiefähigkeit durch die Möglichkeit des Austausches von Kunden untereinander. Zum
anderen kommen Untersuchungen zu dem Ergebnis, dass ein positiver Informationsaustausch
unter Konsumenten, sich gleichermaßen positiv auf die Kaufentscheidung auswirkt (Adjei, Noble
und Noble 2010). Dadurch kommt es auf Kundenseite zu einer erhöhten Kaufbereitschaft, die für
den Händler zusätzliches Wertschöpfungspotenzial durch erhöhte Umsatzwahrscheinlichkeit
schafft. Zudem generieren von Kunden initiierte Marketingmaßnahmen in sozialen Netzwerken
eine zunehmende Kundenaufmerksamkeit und eine größere Reichweite (Culnan, McHugh und
Zubillaga 2010; Prahalad und Ramaswamy 2000), wodurch ebenfalls die
Umsatzwahrscheinlichkeit gesteigert werden kann.
(c) Potenzial zur Ergebnisverbesserung. Der starke Preisfokus der Kunden sowie die
zunehmende Unabhängigkeit der Kunden von einzelnen Anbietern durch ihre aktive Beteiligung
an der Informationsfunktion können zu einer Minderung des Ergebnisses führen. In einem
Umfeld transparenter Produktattribute, insbesondere von Markenprodukten, sehen sich Händler
einem zunehmend aggressiven Preiswettbewerb ausgesetzt. Der Druck auf die Margen ist
unausweichlich (Grewal et al. 2003).
Wertschöpfung durch Integration des Kunden in: Transaktionsabwicklung und Logistik
Die Wertschöpfungsaktivität Transaktionsabwicklung bezeichnet die Abwicklung von
Bestell- und Kaufprozessen, während die Logistikfunktion den Versand bzw. Transport umfasst.
Mittels Kundenintegration wird dem Kunden die Funktion des Transaktionsagenten
beziehungsweise des Co-Lieferanten zu Teil.

35
Der Kunde als Transaktionsagent. Handelsunternehmen integrieren ihre Kunden in die
Transaktionsabwicklung sowohl online als auch offline zumeist in der Form des Self-Services. So
binden z.B. Unternehmen wie Real oder Saturn ihre Kunden offline durch aufgestellte Self-
Checkout Kassen in die Transaktionsabwicklung ein. Ein weiteres Offline-Beispiel ist der Fast-
Food Händler McDonalds, der es Kunden ermöglicht, die jeweilige Bestellung an einem
Selbstbedienungs-Bestellterminal aufzugeben ohne dafür mit Mitarbeitern des Fast-Food
Händlers zu interagieren.
Im Gegensatz zu physischen Geschäften ist diese Form der Kundenintegration im Internet
bereits eine Art Selbstverständlichkeit. Jedoch kann der Kunde online zusätzlich zu den schon
beschriebenen Wertschöpfungsaktivitäten beispielsweise in die Beaufsichtigung der
Transaktionsabwicklung nach dem Kauf eingebunden werden. So kann er zum Beispiel bei dem
Sport- und Outdoor-Händler Sportscheck den eigenen Bestellstatus nachverfolgen und
gegebenenfalls eigenständig stornieren.
Der Kunde als (Co-)Lieferant. Zusätzlich hat der Kunde als (Co-)Lieferant die
Möglichkeit aktiv an der Zustellung der gekauften Produkte teilzunehmen. Er kann dabei
entscheiden, ob er sein Produkt an eine Wunschadresse liefern lässt, ob er es in der Rolle als
Lieferant direkt beim Händler vor Ort abholt (Self-Service), oder sich die Aufgabe als Co-
Lieferant teilt und es an eine Packstation liefern lässt. Der Drogeriehändler dm lässt seine
Kunden den jeweilig präferierten Integrationsgrad bei der Zustellung entwickelter Fotos wählen
und staffelt den Zustellungspreis entsprechend des eigenen Logistikaufwands.
Wertschöpfungspotenzial für den Kunden
(a) Potenzial zur Erzielung einer qualitativ besseren Kaufentscheidung. Die Qualität der
Kaufentscheidung bleibt durch die Integration des Kunden in die Transaktionsabwicklung und
Logistik unberührt.

36
(b) Potenzial zur Erzielung von Zeitersparnis. Die Integration des Kunden in die
Transaktionsabwicklung und die damit verbundene Option den Prozess der Kaufabwicklung
durch eigenes Zutun über entsprechende Tools oder SB-Automaten zu beschleunigen, wird von
Kunden geschätzt und vor allem von zeitsensitiven Kunden als Mehrwert empfunden (Bitner et
al. 2002; Meuter et al. 2000). Zudem hat der Kunde die Möglichkeit die Transaktionsabwicklung
im Internet mit zu verfolgen und kann sich somit zu jedem Zeitpunkt über den Status Quo seiner
Bestellung informieren. Ebenfalls führt die Integration des Kunden in die Logistikfunktion zu
einer Beschleunigung des Kaufprozesses. Der Kunde hat die Möglichkeit die
Transportbedingungen seiner Ware zu beeinflussen, sodass er eine individuelle Anpassung der
Logistik an seine persönlichen Zeitpläne vornehmen kann (z.B. Packstation-Lieferung). Dieser
Annehmlichkeitsaspekt (Convenience) wird unteranderem im Rahmen der Self-Service Studie
von Collier und Sherrell (2009) untersucht. Dabei belegen die Ergebnisse deutlich, dass dieser
Effekt ein wesentlicher Auslöser dafür ist, dass Kunden bereit sind, sich in die
Wertschöpfungsschritte von Händlern zu integrieren. Es kann Wert für den Kunden in Form von
Orts- und Zeitungebundenheit geschaffen werden.
(c) Potenzial zur Erzielung von Kosteneinsparungen. Während die Einbindung des
Kunden in die Transaktionsabwicklung nicht-monetäre Kosten in Form von Zahlungs- und
Datenunsicherheiten (z.B.: Kreditkarteneingabe im Bereich der Online-Integration) mit sich
bringt (Schlosser, White und Lloyd 2006), kann die Übernahme der Logistikfunktion zu
Kosteneinsparung für den Kunden im Kaufprozess führen, da bei Selbstabholung der Produkte
die Lieferkosten für den Händler entfallen.
Wertschöpfungspotenzial für das Unternehmen
(a) Potenzial zur Erzielung von Loyalität. Die Einbindung des Kunden in die
Logistikfunktion resultiert in gesteigerter Kundenzufriedenheit, da dieser seinen Lieferprozess

37
individuell an seinen zeitlichen Tagesablauf anpassen kann. Die Ergebnisse von Collier und
Sherrell (2009) bestätigen, dass dieser Annehmlichkeitsaspekt der Kundenintegration in Form
von Self-Service, wiederrum zu gesteigerter zukünftiger Integrationsbereitschaft führt. Dies legt
den Grundstein zu erhöhter Kundenloyalität.
(b) Potenzial zur Erzielung höherer Umsätze. Das Wertschöpfungspotenzial in Form von
Umsatzwachstum bleibt von den Integrationsmaßnahmen unbeeinflusst.
(c) Potenzial zur Ergebnisverbesserung. Die Integration des Kunden in den Bereich der
Transaktionsabwicklung und Logistik kann auf Unternehmensseite zu Kostensenkungen,
insbesondere im Personalbereich führen, da Personalkosten wegfallen (Lovelock und Young
1979).
Wertschöpfung durch Integration des Kunden in: Service und Support
Der letzte Schritt im Wertschöpfungsprozess umfasst Leistungen des
Handelsunternehmens, die sich auf Kundenangelegenheiten nach abgeschlossener Transaktion
beziehen. Dazu gehören Wertschöpfungsaktivitäten wie Reparaturleistungen, die Unterstützung
bei Anwendungsproblemen aber auch die Retourenabwicklung und das Beschwerdemanagement.
Auch in diesen Schritt können Kunden integriert werden. Sie nehmen dabei die Funktion des
(Co-)Problemlösers ein.
Der Kunde als (Co-)Problemlöser. Kundenintegration gewinnt auch in der
Nachkaufphase immer stärker an Wert. Über das Internet können sich Kunden im Falle von
Problemen mit dem gekauften Produkt über mögliche Lösungsansätze informieren und auf
diesem Wege viele Missstände eigenständig beheben.
Einige Onlineshops bieten ihren Kunden z.B. FAQs auf der unternehmenseigenen
Website an. Angeleitet durch die Vorgaben des Unternehmens, können Kunden so kleinere
Probleme in Interaktion mit dem Händler angehen (Co-Kreation). Congstar integriert seine

38
Kunden beispielsweise über die eigene Onlineplattform in die Wertschöpfung, indem diese über
zur Verfügung gestellte Video-Tutorials potentielle Probleme bei der Freischaltung von
Prepaidkarten lösen können.
Die Integration des Kunden ist aber auch in noch stärkerem Maße über Online-
Communitys und Foren möglich, in welchen sich Kunden gegenseitig, ohne Interaktion mit dem
Unternehmen beraten und bei der Problemlösung unterstützen (Kunde-zu-Kunde Self-Service)
(Mathwick, Wiertz, de Ruyter 2008). So beispielsweise auch über die Online-Plattform
gutefrage.net. Auf dieser Ratgeber-Plattform können sich Konsumenten austauschen, indem sie
zum einen Fragen zu beliebigen Themen stellen und zum anderen bei der Lösung von Problemen
anderer Konsumenten behilflich sind. In diesem Teil wird der Kunde in Aktivitäten integriert, die
über den Kaufprozess hinausgehen. Daher wird die Kundenbetrachtung der
Wertschöpfungspotenziale modifiziert unter den drei folgenden Gesichtspunkten vorgenommen:
(1) Qualitativ besseres Abwicklungsresultat, (2) Zeiteinsparung im Abwicklungsprozess und (3)
kostengünstigerer Abwicklungsprozess in der Nachkaufphase.
Wertschöpfungspotenzial für den Kunden
(a) Potenzial zur Erzielung eines qualitativ besseren Abwicklungsresultats. Die
Einbindung des Kunden in den Wertschöpfungsschritt Service und Support kann die
Ergebnisqualität sogar verschlechtern. Stützt sich der Kunde auf die Hilfestellung anderer
Kunden besteht die Gefahr einer geringeren Service- und Supportqualität aufgrund
unzureichender Fachkenntnisse anderer Konsumenten.
(b) Potenzial zur Erzielung von Zeitersparnis. Für Kunden bietet die Einbindung in den
beschriebenen Wertschöpfungsschritt des Service und Supports vor allem einen zeitlichen
Vorteil. Der Kunde kann seinen Abwicklungsprozess beschleunigen indem er sich bei Problemen
mit Produkten nicht an die Kontaktzeiten des Unternehmens halten muss. Stattdessen kann er als

39
Co-Problemlöser durch den Austausch in Communitys und Foren bzw. durch die Suche nach
Lösungsansätzen in den Unternehmens FAQs rund um die Uhr hilfreiche Produktunterstützung
einholen. Untersuchungen haben ergeben, dass sowohl eine breite Informationsvielfalt als auch
die Aktualität des Informationsstandes eine entscheidende Rolle in der Generierung vom
Kundenmehrwert spielen (Dholakia et al. 2009). So können Schwierigkeiten in der
Nachkaufphase zeitnah behoben werden, was die Kundenzufriedenheit steigert und somit für den
Kunden Wert in Form eines schnelleren Abwicklungsprozesses schafft.
(c) Potenzial zur Erzielung von Kosteneinsparungen. Durch seine aktive Teilnahme am
Wertschöpfungsprozess besteht für den Kunden die Möglichkeit potentielle Kosten zu
reduzieren, die im Nachkaufprozess anfallen, falls der Händler sich Service- und
Supportleistungen zusätzlich vergüten lässt.
Wertschöpfungspotenzial für das Unternehmen
(a) Potenzial zur Erzielung von Loyalität. Durch die Einbindung des Kunden in Service-
und Supportleistungen besteht die Möglichkeit, existierende Probleme mit einem Produkt
unmittelbar zu lösen. Dadurch kann Kundenzufriedenheit geschaffen werden, die aber nicht
zwingend zu höherer Loyalität führt. Denn mit der Ausgliederung von Arbeitsschritten an den
Kunden verliert das Unternehmen die Nähe zum Kunden. Dies wirkt sich negativ auf die
Kundenloyalität aus, da sich der persönliche Kontakt zwischen Handelsunternehmen und Kunden
durch entsprechende Integrationsmaßnahmen (Selbstbedienung des Kunden) reduziert und der
Kunde dadurch immer unabhängiger und selbstständiger wird. Eine persönliche Bindung des
Kunden an das Unternehmen wird somit zunehmend schwieriger.
(b) Potenzial zur Erzielung höherer Umsätze. Das Wertschöpfungspotenzial in Form von
Umsatzwachstum bleibt von den Integrationsmaßnahmen unbeeinflusst.

40
(c) Potenzial zur Ergebnisverbesserung. Durch Kostensenkungspotenziale kann die
Einbindung des Kunden in Service- und Supportleistungen zu höheren Gewinnen führen. Dies
geschieht im Rahmen von Kostensenkungspotenzialen, die durch Personaleinsparungen im
Servicebereich entstehen, da der Kunde eigenständig die entsprechenden Service- und Support-
Leistungen erbringt (Bitner et al. 2002). Eine mögliche Form der Kostenreduktion stellt die
Implementierung von Communitys dar. Die Untersuchungen von Jeppesen (2005) belegen, dass
Kundenaustausch untereinander in Foren erheblich mehr Kundenfragen lösen kann, als ein
entsprechender Servicemitarbeiter.
Tabelle 1 fasst die beschriebenen Wertschöpfungspotenziale, die sich durch die
Einbindung des Kunden in die verschiedenen Schritte des Wertschöpfungsprozesses erzielen
lassen können abschließend zusammen.
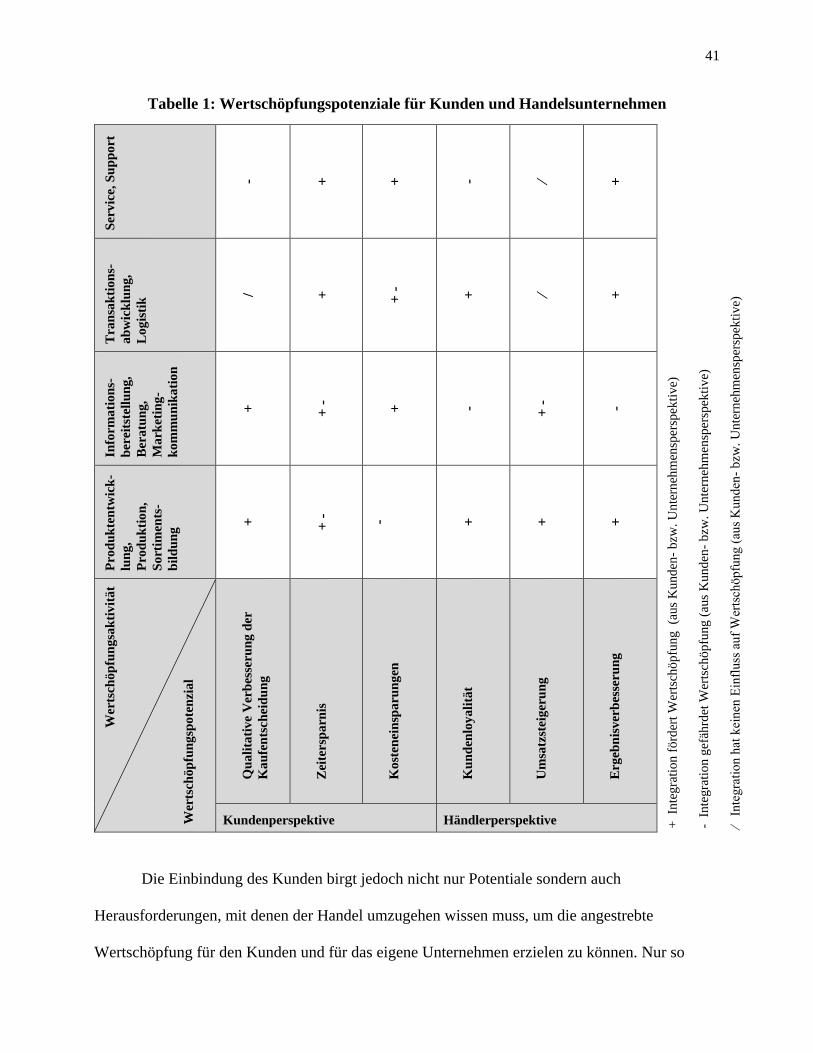
41
Tabelle 1: Wertschöpfungspotenziale für Kunden und Handelsunternehmen S
erv
ice,
Su
pp
ort
- +
+
- ∕ +
+ In
tegra
tion f
örd
ert
Wer
tsch
öp
fun
g
(aus
Ku
nd
en-
bzw
. U
nte
rneh
men
sper
spek
tiv
e)
- In
tegra
tion g
efäh
rdet
Wer
tsch
öp
fung
(au
s K
un
den
- b
zw.
Un
tern
ehm
ensp
ersp
ekti
ve)
∕
Inte
gra
tion h
at k
ein
en E
infl
uss
au
f W
erts
chö
pfu
ng
(au
s K
und
en-
bzw
. U
nte
rneh
men
sper
spek
tiv
e)
Tra
nsa
kti
on
s-
ab
wic
klu
ng
,
Lo
gis
tik
/ +
+ -
+ ∕ +
Info
rmati
on
s-
ber
eits
tell
un
g,
Ber
atu
ng
,
Ma
rket
ing
-
ko
mm
un
ika
tio
n
+
+ -
+
- + -
-
Pro
du
kte
ntw
ick
-
lun
g,
Pro
du
kti
on
,
So
rtim
ents
-
bil
du
ng
+
+ -
- +
+
+
Wer
tsch
öp
fun
gsa
kti
vit
ät
Wer
tsch
öp
fun
gsp
ote
nzi
al
Qu
ali
tati
ve
Ver
bes
seru
ng
der
Ka
ufe
nts
chei
du
ng
Zei
ters
parn
is
Ko
sten
ein
spa
run
gen
Ku
nd
enlo
ya
litä
t
Um
satz
stei
ger
un
g
Erg
ebn
isver
bes
seru
ng
Kundenperspektive Händlerperspektive
Die Einbindung des Kunden birgt jedoch nicht nur Potentiale sondern auch
Herausforderungen, mit denen der Handel umzugehen wissen muss, um die angestrebte
Wertschöpfung für den Kunden und für das eigene Unternehmen erzielen zu können. Nur so

42
können Händler ihre Existenz auf dem Markt sichern und sich gegenüber konkurrierenden
Handelsunternehmen behaupten. Abschnitt 4 widmet sich diesen Herausforderungen und
diskutiert, wie Händler diesen Herausforderungen erfolgversprechend begegnen können.
HERAUSFORDERUNGEN FÜR DEN HANDEL
Die Einbindung des Kunden in den Wertschöpfungsprozess birgt zwar eine Vielzahl von
Wertschöpfungspotenzialen, geht aber auch mit einigen Herausforderungen einher. Diese hängen
u.a. davon ab, wie sehr der Kunde bei der Bearbeitung der Wertschöpfungsaufgabe auf sich
alleine gestellt ist. Das bedeutet zum einen über welchen Weg sich der Kunde in die
Wertschöpfung einbringt (online, offline) und zum anderen wie stark er/sie zugleich in die
jeweilige Wertschöpfungsaufgabe integriert ist (Grad der Kundenintegration).
Wie bereits in den vorangehenden Abschnitten herausgestellt wurde, können Kunden
sowohl online als auch offline (vor Ort im Geschäft oder zuhause) in den Wertschöpfungsprozess
integriert werden. In Bezug auf die Möglichkeit des Unternehmens während der Ausführung
einer Wertschöpfungsaktivität mit dem Kunden zu interagieren, setzt die Integration des Kunden
im Internet und zuhause aber deutliche Grenzen. Ist der Kunde zum Beispiel online oder im
eigenen Zuhause in die Produktfertigstellung integriert, sind die Möglichkeiten der persönlichen
Interaktion zwischen Kunden und Unternehmen stark eingeschränkt und der Kunde ist in seiner
Aufgabe (bzw. Teilaufgabe) auf sich alleine gestellt. Findet die Kundenintegration dagegen beim
Händler vor Ort statt, hat dieser die Möglichkeit mit dem Kunden zu interagieren bzw. den
Kunden zu beobachten und bei Problemen aktiv unterstützend einzugreifen.
Zudem entscheidet der Grad an Kundenintegration über die Verantwortlichkeit des
Kunden in der Wertschöpfungsaktivität. Je stärker der Kunde in eine Aufgabe integriert wird,
desto unabhängiger vom Händler wird die Wertschöpfungsaufgabe ausgeführt. Arbeitet der

43
Kunde im Extremfall im Self-Service, muss er alle anfallenden Entscheidungen eigenständig
treffen und verantworten.
Auf Basis dieser beiden Dimensionen, Integrationsweg und Integrationsgrad, lassen sich
fünf Herausforderungen für den Handel formulieren:
– Zugang zu Kundendaten
– Gewährleistung von Unternehmenskontrolle
– Vermeidung von Kundenüberforderung
– Vermeidung von Kostenverlagerungen und
– Aufrechterhaltung der Kundenbindung
Zugang zu Kundendaten
Die Integration des Kunden, insbesondere im Online-Bereich, ermöglicht es dem Händler
vom Kunden zu lernen, bzw. den Kunden und seine Präferenzen besser kennen zu lernen. Um
sich diese Einblicke umfassend zu Nutze zu machen, benötigt der Händler zusätzliche
Informationen über den Kunden, wie z.B. demographische Daten, Informationen zum
Kaufverhalten und Präferenzen. Im Onlinebereich besteht für das Unternehmen die Chance,
gezielt das Suchverhalten des Kunden zu verfolgen und so neben den Produktkäufen, einen
Einblick in die Suchgewohnheiten und das potentielle Produktspektrum des Kunden zu erhalten
(Ansari, Essegaier und Kohli 2000). Diese Details helfen Händlern zudem ihre Kunden in
ähnliche Kundentypen einzuteilen und das gelernte Wissen auf Kunden des gleichen Typs zu
übertragen. Bei Amazon wird dies intensiv genutzt, denn dort erhält der Kunde angepasste
Produktvorschläge basierend auf der eigenen Sucheingabe und dem Kaufverhalten anderer
Kunden, die das gesuchte Produkt in Kombination mit anderen Waren ebenfalls gekauft haben
(Sortimentsbildung). Für den Kunden erscheinen dann zusätzliche gezielt auf den Kunden
zugeschnittene Produktangebote in Form von Produkterweiterungen und Produktalternativen.

44
Kundenintegration über den Offline-Kanal erschwert Handelsunternehmen allerdings den
Zugang zu Informationen über den Kunden. Während Kunden im Internet üblicherweise Kunden-
Accounts anlegen müssen, um auf die Produkte und Services eines Händlers zugreifen zu können
und zudem das Klick- und Kaufverhalten von Kunden sehr einfach verfolgt und gespeichert
werden kann, können solche Kundendaten im Offline-Kanal unabhängig vom Integrationslevel
nur schwer erhoben werden. Eine Möglichkeit dieser Einschränkung entgegen zu treten besteht in
Kundenkarten bzw. Loyalitätskarten. Auf diesem Wege kann auch offline zumindest ein Teil der
Daten bei der Transaktion bestimmten Kunden zugeordnet werden.
Gewährleistung von Unternehmenskontrolle
Je stärker Kunden in eine Wertschöpfungsaktivität eingebunden werden und je weniger
der Händler bei der Durchführung der Wertschöpfungsaktivität eingreifen kann, desto stärker ist
der potentielle Kontrollverlust des Handels, da der Kunde dadurch vollkommen eigenständig
arbeitet (Hoyer et al. 2010). Dies kann für den Handel zum einen vorteilhaft sein, da auf diese
Weise die eigenen Kosten reduziert werden. Gleichzeitig überträgt der Handel dem Kunden
damit aber auch implizit die Verantwortung, z. B. für das (Co-)Management der
Informationsbereitstellung, der Beratung und der Marketingkommunikation.
Die Integration des Kunden in die Produktentwicklung, insbesondere in die
Ideengenerierung und Designkreation kann unter anderem die Aufmerksamkeit des Kunden auf
das Handelsunternehmen und dessen Produkte lenken. Sobald der Kunde allerdings aktiv in
diesen Teil der Wertschöpfung integriert wird, müssen etwaige Produktvorschläge auch ernst
genommen werden. Denn es besteht hierbei die Gefahr, dass es zu inkongruenten Ansichten
zwischen Kunde und Händler kommt. Beispielsweise, können Imagevorstellungen des
Handelsunternehmens von den Produktideen des Kunden abweichen. Solche Konfliktsituationen
entstehen, wenn dem Kunden entsprechende Spielräume gewährt werden. Solch ein

45
Negativeffekt ist dem Konzern Henkel mit seinem Spülmittel Pril widerfahren. Henkel forderte
im Jahr 2011 seine Kundschaft auf, in einem Wettbewerb auf der Online-Plattform Facebook
Designvorschläge für das Spülmittel zu generieren und für die beliebtesten Ideen abzustimmen.
Die Gewinnerdesigns sollten anschließend in die Produktlinie aufgenommen werden. Gemäß der
Abstimmung wurden allerdings negativ-konnotierte Vorschläge (Grillhähnchen-Design mit dem
Slogan: schmeckt lecker nach Hähnchen, Brezel-Design mit dem Slogan: Jetzt mit frischem
Brezel-Duft, Monsterkopf-Design) favorisiert. Dies veranlasste Henkel sich über die
demokratische Abstimmung hinwegzusetzen um Imageinkonsistenzen entgegenzuwirken.
Imagekonformere Design wurden von Henkel gewählt und auf den Markt gebracht, was zu
großem Unmut bei den Facebook-Mitstreitern führte (Breithut 2011).
Besonders im Bereich der Produktentwicklung sollten daher von vornherein klare
Aufgaben für den Kunden und gleichzeitig auch eindeutige Grenzen gesetzt werden. Damit kann
vermieden werden, dass es zu Unzufriedenheit beim Kunden kommt, weil seine Produktidee
nicht umgesetzt wird oder dass der Händler einen Imageschaden erfährt.
Die Integration des Kunden in Informationsbereitstellung, Beratung und
Marketingkommunikation bietet Potenzial für eine größere Kundenreichweite
(Umsatzsteigerung). Es können in diesem Rahmen aber auch weitreichende negative Eindrücke
verbreitet werden wenn der Kunde mit dem Handelsunternehmen bzw. den Produkten
unzufrieden ist. So kann ein eigenständiger, negativ gestimmter Kunde durch schlechte
Produktbewertungen im Internet oder durch die Verbreitung von Negativeindrücken in sozialen
Netzwerken oder Foren, eine Vielzahl potentieller oder bestehender Konsumenten negativ
beeinflussen und damit Imageschädigungen herbeiführen. Sowohl die Ergebnisse von Chevalier
und Mayzlin (2006) als auch von Chen, Wang und Xie (2011) stellen einen asymmetrischen
Effekt von Mund-zu-Mund-Propaganda heraus, sodass negative Mundpropaganda den

46
Umsatzeffekt von Unternehmen signifikant verschlechtert im Vergleich zu positiver
Mundpropaganda. Wichtig ist es daher, den Kunden gerade in der Interaktion mit anderen
Kunden nicht alleine zu lassen, damit im Ernstfall moderierend eingegriffen werden kann, um das
Aufkommen negativer Mundpropaganda zu vermeiden. So sollte ein Handelsunternehmen seinen
Kunden zum Beispiel die Möglichkeit bereitstellen sich auf einer unternehmenseigenen
Diskussionsplattform auszutauschen. Auf diese Weise können Unternehmensmitarbeiter als
Moderatoren fungieren und negativen Effekten auf das Unternehmensimage bewusst
entgegensteuern. Handelsunternehmen wie der Tierfutterhändler Fressnapf bieten ihren Kunden
solche unternehmensinternen Communitys. Bei Fressnapf beispielsweise hat der Kunde die
Möglichkeit, sich im unternehmenseigenen Forum über Produktbedürfnisse, -probleme oder -
erfahrungen mit anderen Kunden und dem Unternehmen auszutauschen. Dieses Forum wird von
Fressnapf unter dem Nutzernamen „Fressnapf-Team“ moderiert. Der Tierbedarfshändler ist
bemüht durch eigene Beiträge, die in dem Forum gestellten Fragen und Kritiken der Kundschaft
zu beantworten und versucht eventuelle Missverständnisse oder sogar Kundenunzufriedenheit
bestmöglich zu lösen. So kann vermieden werden, dass aufgrund von Missverständnissen über
Produktdetails oder Fehler in der Serviceausführung Negativeindrücke an die gesamte
Kundschaft weitergetragen werden.
Vermeidung von Kundenüberforderung
Wenn Handelsunternehmen ein hohes Integrationslevel wählen und dieses im Online-
Kanal umsetzen, ergibt sich die Herausforderung sicherzustellen, dass der Kunde der jeweiligen
Aufgabe auch gewachsen ist. Denn nur dann können die vielfältigen Wertschöpfungspotenziale
für Händler und Kunden, wie z.B. Kundenzufriedenheit und Reduktion des Kaufrisikos durch
individuelle Produkte und Serviceleistungen (qualitativ bessere Kaufentscheidung),
Kundenentertainment usw. auch tatsächlich erzielt werden. Fühlt sich der Kunde mit einer

47
Aufgabe überfordert, kann dies zu Unzufriedenheit und Frustration führen (Huffman und Kahn
1998, Wind und Rangaswamy 2001).
Gerade in der heutigen Zeit wird der Kunde mit einer Flut an Informationen und einer
uneingeschränkten Vielzahl an Produktalternativen konfrontiert. Dies bietet Kunden einerseits
die Möglichkeit sich vor dem Kauf umfassend über Produkteigenschaften, Preise usw. zu
informieren und schließlich ein perfekt auf die eigenen Bedürfnisse abgestimmtes Produkt zu
identifizieren. Andererseits ist es für Kunden schwer diese uneingeschränkte Produkt- und
Informationsverfügbarkeit zu verarbeiten und umfassend für sich zu nutzen. Eine erhöhte Gefahr
der Kundenüberforderung besteht besonders wenn der Kunde mit einer Wertschöpfungsaktivität
alleine gelassen wird (zuhause oder im Internet) (Randall, Terwiesch und Ulrich 2007) bzw.
wenn der Kunde die vollkommene Wertschöpfungsverantwortung im Hinblick auf die jeweilige
Aktivität übertragen bekommt (hoher Integrationsgrad).
Gerade bei der Integration des Kunden im Internet sollte daher verstärkt versucht werden,
den Kunden in der Durchführung der Wertschöpfungsaktivität zu begleiten und gegebenenfalls
lenkend einzugreifen. Wird dies nicht getan, kann es vor allem im Rahmen der Produktion
(Fertigstellung) zu zwei zentralen Problemen kommen: Zum einen sind sich Kunden nicht immer
ihrer eigenen Präferenzen bewusst (Syam, Krishnamurthy und Hess 2008). Wie die Ergebnisse
von Dellaert und Stremesch (2005) zeigen, kann die detaillierte Einbindung des Kunden in die
Wahl einzelner Produktdetails daher leicht zu Überforderung führen. Die Komplexität des Tools
bzw. der Produktauswahl hat einen signifikant negativen Einfluss auf sowohl die Nützlichkeit des
Produkts als auch die Nützlichkeit der Integrationsmaßnahme in den entsprechenden
Wertschöpfungsschritt. Dabei wirkt dieser Effekt noch stärker bei unerfahrenen Kunden.
Übereinstimmende Ergebnisse liefert die Studie von Zhu et al. (2007). Dabei untersuchen die
Autoren den Effekt von unterschiedliche Komplexitätsausprägungen von Self-Service

48
Technologien auf die wahrgenommene Effektivität der Self-Service Technologie (gemessen
durch Kundenkontrolle und Kundenbewertung der Technologie) und zeigen, dass hohe
Komplexitätsausprägungen, den Kunden kognitiv überfordern. Dieser Basiseffekt wird durch
Persönlichkeitsmerkmale wie frühere Kundenerfahrungen und technologische Akzeptanz
moderiert.
Zum anderen fehlt Kunden oftmals die fachliche Kompetenz die Kompatibilität
verschiedener Produktbestandteile einzuschätzen. So fühlt sich z.B. nicht jeder Kunde in der
Lage Komponenten eines Computers selbst zusammen zu stellen (Produktion). Ein
Lösungsansatz stellt hier ein modulares System zur Produktfertigstellung dar, über das Kunden
Produkte nur aus einer übersichtlichen Auswahl an Komponenten zusammenstellen können.
Diesen Aspekt betrachten Randall, Terwiesch und Ulrich (2007) in ihrer Studie. Sie untersuchen
zwei mögliche Umsetzungsformen zur Kundenintegration in die Produktfertigstellung in der
Computerindustrie: Den bedürfnis-basierten Ansatz und den komponenten-basierten Ansatz.
Beim bedürfnis-basierten Ansatz kommuniziert der Kunde seine Wünsche an das Unternehmen,
welches diese dann auf das Produkt überträgt. Der komponenten-basierte Ansatz ermöglicht es
dem Kunden unmittelbar Komponenten an dem Produkt zu verändern und auszutauschen. Die
Ergebnisse der Studie zeigen, dass in Abhängigkeit von den Erfahrungen des Konsumenten
(Anfänger oder Experte), die zwei Ansätze zu unterschiedlichen Zufriedenheitsresultaten führen.
Anfänger erzielen mit dem bedürfnis-basierten Ansätze bessere Ergebnisse, wo hingen der
komponenten-basierte Ansatz für Experten zufriedenstellende Resultate liefert.
Der Mobilfunkanbieter Congstar nutzt dieses sogenannte Baukastenprinzip, in dem
Kunden ihre Mobilfunkverträge aus vorgegebenen Modulen zusammensetzen können. Dabei
kann der Kunde sich seinen individuellen Vertrag anhand von vier verschiedenen
Vertragsbestandteilen (SMS, surfen, netzübergreifend telefonieren und netzintern telefonieren)

49
nach Belieben zusammensetzen. Zudem kann er anhand einer übersichtlichen Auswahl an
Leistungsstufen den entsprechenden Leistungsumfang der jeweiligen Vertragsbestandteile sowie
die Vertragsdauer (monatlich kündbar oder 24-monatige Vertragsdauer) individuell festlegen.
Durch diese festgelegte Auswahl an Optionen kann Congstar verhindern, dass der Kunde bei der
Komplexität der Produktauswahl bzw. Komponentenzusammenstellung überfordert ist.
Vermeidung von Kostenverlagerungen
Handelsunternehmen übertragen ihren Kunden zum Teil vollständige
Wertschöpfungsaktivitäten, um dadurch eigene Kosten einzusparen. Unabhängig vom gewählten
Integrationsweg besteht bei einem sehr hohen Kundenintegrationsgrad für Unternehmen
allerdings die Gefahr, dass diese Einsparungen dafür an anderen Stellen zu Mehrkosten führen
(Jeppesen 2005). Grund dafür ist, dass der Kunde in diesem Kundenintegrations-Szenario
überwiegend sich selbst überlassen ist und einen Großteil bzw. die volle Verantwortung für die
Wertschöpfungsleistung trägt. Kommt es in diesem Rahmen zu einer Überforderung des Kunden,
kann es zur Kostenverschiebung kommen. Wenn der Kunde zum Beispiel mit der Produktion
(Fertigstellung) überfordert ist, ist es naheliegend, dass er/sie sich z.B. an die Service-Hotline des
Unternehmens wendet und dort um Hilfe bittet. Denkbar ist im Falle der Überforderung auch eine
erhöhte Retouren-Quote, sofern der Kunde nicht in der Lage ist, ein Produkt nach eigenen
Vorstellungen zusammenzustellen oder wenn sich bei der Montage oder Installation eines
Produktes Probleme ergeben (Produktion). Jeppesen (2005) hat in seiner Studie den Effekt von
Kostenverlagerungen in Abhängigkeit von dem Integrationsgrad in der Computerspielindustrie
analysiert. Dabei verdeutlichen die Ergebnisse, dass insbesondere bei hoher Kundenintegration
(bspw. durch die Integration in die Produktentwicklung über Toolkits) der Kunde ein erhöhtes
Service und Supportverlangen hat. Zum einen kann das Unternehmen zwar Kosten für die
Produktentwicklung einsparen, da der Kunde mittels Toolkits in diesem Wertschöpfungsschritt

50
aktiv wird. Zum anderen zeigt die Untersuchung aber, dass aus den Toolkits resultierende
Bedienungsunklarheiten die Unternehmenskosten zur Bereitstellung von Servicemitarbeitern in
die Höhe treiben.
Insgesamt sollten Handelsunternehmen einzelne Wertschöpfungsaktivitäten nie
ausschließlich isoliert betrachten, sondern mögliche Auswirkungen der Kundenintegration auf
andere Wertschöpfungsschritte im Blick behalten und bei der Kosten-Nutzen-Einschätzung
einkalkulieren. Um der Kostenverschiebung entgegen zu wirken, sollte zudem darauf geachtet
werden, dass Integrationstools einfach und intuitiv bedient werden können. Dabei kann das
Unternehmen dem Kunden Hilfestellungen bei der Integration in Form des Self-Services bieten.
Zum Beispiel ist es hilfreich, wenn der Kunde auf Videotutorials oder zumindest auf Anleitungen
und FAQs im Umgang mit dem Integrationstool zurückgreifen kann. Die Fluggesellschaft
Lufthansa stellt Kunden online Videotutorials beispielsweise für einen erfolgreichen Check-In
am Selbstbedienungsautomaten zur Verfügung. Diese Demoversion simuliert mit ausführlichen
Hilfestellungen den Check-In Prozess unter Anwendung des Self-Service Tools.
Aufrechterhaltung der Kundenbindung
Wird einem Kunden eine Wertschöpfungsaufgabe durch ein hohes Integrationslevel
(vollständig) übertragen und führt dieser die Aufgabe im Internet oder zuhause aus
(Integrationsweg), trägt der Kunde die vollständige Verantwortung der Wertschöpfungsaktivität
und tritt zudem kaum in physischen Unternehmenskontakt. Dies birgt für Handelsunternehmen
die Herausforderung einen Kunden an das Unternehmen zu binden
Zum einen steht der Kunde über die Integrationswege Internet und Kundenzuhause in
keinem persönlichen Kontakt mehr zu den Mitarbeitern des Handelsunternehmens. Der dadurch
ausbleibende zwischenmenschliche Austausch unterbindet die Entwicklung einer emotionalen
Bindung an den Händler und erschwert somit den Aufbau von Kundenloyalität. Selnes und

51
Hansen (2001) belegen in ihrer Untersuchung, dass Kundenintegration in Form von Self-Service
einen positiven, aber auch einen negativen Effekt auf die Bindung zum Unternehmen haben kann.
Dieser Effekt hängt von der Komplexität der Beziehung zwischen Kunde und Mitarbeiter
(operative Beziehung vs. operativ-beratende Beziehung) ab. Dabei hat Self-Service einen
negativen Effekt auf die Kundenbindung zum Unternehmen im Falle von Beziehungen mit
geringer Komplexität (operativ).
Zum anderen sind die Wechselkosten für den Kunden über die Integrationswege Internet
und Kundenzuhause äußerst gering. Der Kunde ist durch den hohen Integrationsgrad zunehmend
eigenständig und unabhängig vom Unternehmen. Das impliziert, dass Kunden nur einen geringen
persönlichen Aufwand in Kauf nehmen müssen, um zwischen verschiedenen Händlern zu
wechseln, denn die eigentliche Arbeit wurde bislang ohnehin vom Kunden selbst durchgeführt.
Buell, Campbell und Frei (2010) zeigen, dass bei einem hohen Grad an Kundenintegration (Self-
Service) die Wechselkosten ein entscheidender Treiber für die Loyalität des Kunden darstellen.
Dabei verdeutlichen die Ergebnisse, dass bei niedrigen Wechselkosten die Integration in Form
von Self-Service einen negativen Effekt auf Kundenloyalität hat. Der Effekt von Self-Service auf
Kundenloyalität ist positiv für hohe Wechselkosten. Daher stellt die Selbstständigkeit der Kunden
vor allem im Internet eine große Gefahr für Handelsunternehmen dar, da hier schnell und ohne
größere Mühe auf die Angebote anderer Wettbewerber zugegriffen werden kann. Händler sollten
daher vermeiden, den persönlichen Kontakt zum Kunden vollständig abzubrechen (z.B. im
Service und Support), da dieser im Wertschöpfungsprozess auf lange Sicht den entscheidenden
Schritt im Aufbau der Kundenloyalität bedeuten kann. Dies kann im Onlineshop z. B. durch
Foren und Communitys erfolgen, die durch Unternehmensmitarbeiter moderiert werden und
dadurch die Möglichkeit bieten, soziale Interaktionen mit Handelsvertretern in den Kaufprozess
zu integrieren. Austausch in unternehmenseigenen Communitys kann sozialen Nutzen für den

52
Kunden stiften und wirkt positiv auf die Bereitschaft zur Integration, wie Nambisan und Baron
(2009) im Rahmen ihrer Studie zu Communityaustausch im Wertschöpfungsbereich des Service
und Supports belegen. Darüber hinaus können noch drei weitere Nutzentypen identifiziert:
persönlicher, funktionaler und hedonischer Kundennutzen. Die Erreichung dieser 4 Nutzentypen
hat einen signifikant positiven Einfluss auf den zukünftigen Austausch in dem jeweiligen Forum.
Zudem konnte gezeigt werden, dass die positiven bzw. negativen Interkationserfahrungen in
solchen Communitys dementsprechend die Einstellungen und Wahrnehmungen des Kunden zum
Unternehmen beeinflussen. Die Ergebnisse von Dholakia et al. (2009) können bestätigen, dass
funktionaler und sozialen Kundennutzen durch den Austausch in Onlineforen zu gesteigerter
Integration des Kunden in den Wertschöpfungsbereich des Service und Supports führt. Diese
Ergebnisse lassen sich durch die Untersuchung von Gruen, Osmonbekov und Czaplewski (2007)
ebenfalls für den Offline-Kanal bestätigen. Im Rahmen ihrer Betrachtung belegen die Autoren,
dass persönlicher Kundenaustausch miteinander zu zweierlei Unternehmensvorteilen führt. Zum
einen wird der Wert des Produktes aus Kundensicht gesteigert. Zum anderen hat kundeninterner
Austausch einen direkten Loyalitätseffekt, sodass diese Austauschmöglichkeiten zusätzlichen
Wert für den Kunden generieren. Zudem beeinflusst allein die generelle Option, eines möglichen
Austausches mit anderen Kunden, den Produktwert des Unternehmens.
Händler können demnach durch die Erfüllung dieser Nutzentypen den Grundstein für
gesteigerte Loyalität setzen.
FAZIT
Der Kunde wird immer öfter in den Wertschöpfungsprozess von Handelsunternehmen
integriert und wird dadurch zu einem aktiven Wertschöpfungspartner. Dieser Trend wird vor

53
allem durch kontinuierliche technologische Fortschritte und die daraus entstehenden neuen
Vertriebskanäle ermöglicht und vorangetrieben.
Der Grad an Kundeneinbindung variiert von Fall zu Fall und kann in drei grundlegende
Stufen unterteilt werden: Kundensegregation (minimale Integration), Co-Kreation (mäßige
Integration) und Self-Service (starke Integration). Die Integration des Kunden kann grundsätzlich
auf allen Wertschöpfungsstufen (Produktentwicklung, Produktion, Sortimentsbildung,
Informationsbereitstellung, Beratung, Marketingkommunikation, Transaktionsabwicklung,
Logistik, Service und Support) eines Handelsunternehmens erfolgen. Die Einbindung des
Kunden stellt eine Möglichkeit dar, sowohl auf Händler- als auch auf Kundenseite Mehrwert zu
schaffen. Dieser äußert sich für Handelsunternehmen unter anderem in Kosteneinsparungs- und
Absatzsteigerungspotenzial, aber auch in der Schaffung von Kundenzufriedenheit und Loyalität.
Zugleich haben Kunden dadurch zum Beispiel die Möglichkeit, auf individualisierte Produkte
zugreifen zu können und sowohl Effizienz- (z.B. Zeitersparnis, Kosteneinsparungen) als auch
Effektivitätssteigerungen (qualitativ bessere Kaufentscheidung) im Kaufprozess zu erzielen.
Um das volle Wertschöpfungspotenzial ausschöpfen zu können, muss ein Unternehmen
allerdings mit den einhergehenden Herausforderungen der Kundenintegration vertraut sein und
mit diesen umzugehen wissen. Es lassen sich fünf zentrale Herausforderungen identifizieren:
Zugang zu Kundendaten, Gewährleistung von Unternehmenskontrolle, Vermeidung von
Kundenüberforderung, Vermeidung von Kostenverlagerung und Aufrechterhaltung der
Kundenbindung. Das Ausmaß der entsprechenden Herausforderung variiert in Abhängigkeit des
gewählten (1) Integrationswegs (online versus offline) und (2) Integrationsgrades (niedrig bis
hoch). Durch gezielte Gegenmaßnahmen können und sollten Unternehmen diesen potentiellen
Schwierigkeiten entgegenwirken, um das maximale Wertschöpfungspotenzial der
Kundenintegration auszuschöpfen.
54
LITERATURVERZEICHNIS
Adjei, Mavis T., Stephanie M. Noble, and Charles H. Noble (2010), “The Influence of C2C
Communications in Online Brand Communities on Customer Purchase Behavior,” Journal
of the Academy of Marketing Science, 38 (5), 634–53.
AGOF (2012), “Mobile Facts 2012-II,” (accessed May 11, 2013), [available at
http://www.agof.de/aktuelle-studie.1022.de.html].
Alba, Joseph, John Lynch, Barton Weitz, Chris Janiszewski, Richard Lutz, Alan Sawyer, and
Stacy Wood (1997), “Interactive Home Shopping: Consumer, Retailer, and Manufacturer
Incentive to Participate in Electronic Marketplaces,” Journal of Marketing, 61 (3), 38–53.
Ansari, Asim, Skander Essegaier, and Rajeev Kohli (2000), “Internet Recommendation
Systems,” Journal of Marketing Research, 3 (2), 107–20.
Bakos, Yannis (1997), “Reducing Buyer Search Costs: Implications for Electronic
Marketplaces,” Management Science, 43 (12), 1676–92.
——— (1998), “The Emerging Role of Electronic Marketplaces on the Internet,”
Communications of the ACM, 41 (8), 35–42.
Bendapudi, Neeli and Robert P. Leone (2003), “Psychological Implications of Customer
Participation in Co-Production,” Journal of Marketing, 67 (1), 14–28.
Bickart, Barbara and Robert M. Schindler (2001), “Internet Forums as Influential Sources of
Consumer Information,” Journal of Interactive Marketing, 15 (3), 31–40.
Bitner, Mary Jo, Amy L. Ostrom, Matthew L. Meuter, and Anthony J. Clancy (2002),
“Implementing Successful Self-Service Technologies,” The Academy of Management
Executive, 16 (4), 96–109.
Blazevic, Vera and Annouk Lievens (2008), “Managing Innovation through Customer
Coproduced Knowledge in Electronic Services: An Exploratory Study,” Journal of the
Academy of Marketing Science, 36 (1), 138–51.
Breithut, Jörg (2011), “Soziale Netzwerke: Pril Wettbewerb endet im PR-Debakel,” (accessed
September 20, 2013), [available at http://www.spiegel.de/netzwelt/netzpolitik/soziale-
netzwerke-pril-wettbewerb-endet-im-pr-debakel-a-763808.html].
Buell, Ryan W., Dennis Campbell, and Frances X. Frei (2010), “Are Self-Service Customers
Satisfied or Stuck?,” Production and Operations Management, 19 (6), 679–97.
Chen, Yubo, QI Wang, and Jinhong Xie (2011), “Online Social Interactions: A Natural
Experiment on Word of Mouth versus Observational Learning,” Journal of Marketing
Research, 48 (2), 238–54.
Chevalier, Judith A. and Dina Mayzlin (2006), “The Effect of Word of Mouth on Sales: Online
Book Reviews,” Journal of Marketing Research, 43 (3), 345–54.
Collier, Joel E. and Daniel L. Sherrell (2009), “Examining the Influence of Control and
Convenience in a Self-Service Setting,” Journal of the Academy of Marketing Science, 38
(4), 490–509.

55
Culnan, Mary J., Patrick J. McHugh, and Jesus I. Zubillaga (2010), “How Large U.S. Companies
Can Use Twitter and Other Social Media to Gain Business Value,” MIS Quarterly
Executive, 9 (4), 243–60.
Dabholkar, Pratibha A. (1996), “Consumer Evaluations of New Technology-Based Self-Service
Options: An Investigation of Alternative Models of Service Quality,” International Journal
of Research in Marketing, 13 (1), 29–51.
Dellaert, Benedict G. C. and Stefan Stremersch (2005), “Marketing Mass-Customized Products:
Striking a Balance Between Utility and Complexity,” Journal of Marketing Research, 42
(May), 219–27.
Dholakia, Utpal M., Vera Blazevic, Caroline Wiertz, and René Algesheimer (2009), “Communal
Service Delivery: How Customers Benefit From Participation in Firm-Hosted Virtual P3
Communities,” Journal of Service Research, 12 (2), 208–26.
Dong, Beibei, Kenneth R. Evans, and Shaoming Zou (2007), “The Effects of Customer
Participation in Co-Created Service Recovery,” Journal of the Academy of Marketing
Science, 36 (1), 123–37.
Duan, W, B Gu, and A Whinston (2008), “The Dynamics of Online Word-of-Mouth and Product
Sales—An Empirical Investigation of the Movie Industry,” Journal of Retailing, 84 (2),
233–42.
van Eck, Peter S., Wander Jager, and Peter S. H. Leeflang (2011), “Opinion Leaders’ Role in
Innovation Diffusion: A Simulation Study,” Journal of Product Innovation Management, 28
(2), 187–203.
Ernst, Holger, Wayne D. Hoyer, Manfred Krafft, and Katrin Krieger (2011), “Customer
Relationship Management and Company Performance—the Mediating Role of New Product
Performance,” Journal of the Academy of Marketing Science, 39 (2), 290–306.
Franke, Nikolaus, Peter Keinz, and Christoph J. Steger (2009), “Testing the Value of
Customization: When Do Customers Really Prefer Products Tailored to Their Preferences?,”
Journal of Marketing, 73 (5), 103–21.
——— and Frank Piller (2004), “Value Creation by Toolkits for User Innovation and Design:
The Case of the Watch Market,” The Journal of Product Innovation Management, 21 (6),
401–15.
——— and Martin Schreier (2008), “Product Uniqueness as a Driver of Customer Utility in
Mass Customization,” Marketing Letters, 19 (2), 93–107.
——— and ——— (2010), “Why Customers Value Self-Designed Products: The Importance of
Process Effort and Enjoyment,” Journal of Product Innovation Management, 27 (7), 1020–
31.
Fuchs, Christoph, Emanuela Prandelli, and Martin Schreier (2010), “The Psychological Effects of
Empowerment Strategies on Consumers ’ Product Demand,” Journal of Marketing, 74 (1),
65–79.
Grewal, Dhruv, Gopalkrishnan R. Iyer, R. Krishnan, and Arun Sharma (2003), “The Internet and
the Price–Value–Loyalty Chain,” Journal of Business Research, 56 (5), 391–98.
56
———, ———, and Michael Levy (2004), “Internet Retailing: Enablers, Limiters and Market
Consequences,” Journal of Business Research, 57 (7), 703–13.
Gruen, Thomas W., Talai Osmonbekov, and Andrew J. Czaplewski (2007), “Customer-to-
Customer Exchange: Its MOA Antecedents and its Impact on Value Creation and Loyalty,”
Journal of the Academy of Marketing Science, 35 (4), 537–49.
Gruner, Kjell E. and Christian Homburg (2000), “Does Customer Interaction Enhance New
Product Success?,” Journal of Business Research, 49 (1), 1–14.
Hoyer, Wayne D., Rajesh Chandy, Matilda Dorotic, Manfred Krafft, and Siddharth S. Singh
(2010), “Consumer Cocreation in New Product Development,” Journal of Service Research,
13 (3), 283–96.
Huffman, Cynthia and Barbara E Kahn (1998), “Variety for Sale : Mass Customization or Mass
Confusion ?,” Journal of Retailing, 74 (4), 491–513.
Jeppesen, Lars Bo (2005), “User Toolkits for Innovation: Consumers Support Each Other,”
Journal of Product Innovation Management, 22 (4), 347–62.
Joshi, Ashwin W. and Sanjay Sharma (2004), “Customer Knowledge Development: Antecedents
and Impact on New Product Performance,” Journal of Marketing, 68 (4), 47–59.
Lilien, Gary L., Pamela D. Morrison, Kathleen Searls, Mary Sonnack, and Eric Von Hippel
(2002), “Performance Assessment of the Lead User Idea-Generation Process for New
Product Development,” Management Science, 48 (8), 1042–59.
Lovelock, Christopher H. and Robert F. Young (1979), “Look to Consumers to Increase
Productivity,” Harvard Business Review, 57, 168–78.
Mathwick, Charla, Caroline Wiertz, and Ko de Ruyter (2008), “Social Capital Production in a
Virtual P3,” Journal of Consumer Research, 34 (6), 832–49.
Meuter, Matthew L. and Mary Jo Bitner (1998), “Self-Service Technologies: Extending Service
Frameworks and Identifying Issues for Research,” American Marketing Association, 9, 12–
19.
———, Amy L. Ostrom, Robert I. Roundtree, and Mary Jo Bitner (2000), “Self-Service
Technologies: Understanding Customer Satisfaction with Technology-Based Service
Encounters,” Journal of Marketing, 64 (3), 50–64.
Nambisan, Satish and Robert A Baron (2009), “Virtual Customer Environments: Testing a Model
of Voluntary Participation in Value Co-creation Activities,” Journal of Product Innovation
Management, 26 (4), 388–406.
Nielsen, AC (2005), “The Power of Private Label 2005.”
Ogawa, Susumu and Frank T. Piller (2006), “Reducing the Risks of New Product Development,”
MIT Sloan Managment Review, 47 (2), 65–71.
Payne, Adrian F., Kaj Storbacka, and Pennie Frow (2008), “Managing the Co-Creation of
Value,” Journal of the Academy of Marketing Science, 36 (1), 83–96.
Prahalad, C. K. and Venkat Ramaswamy (2004), “Co-Creation Experiences: The Next Practice in

57
Value Creation,” Journal of Interactive Marketing, 18 (3), 5–14.
——— and Venkatram Ramaswamy (2000), “Co-Opting Customer Competence,” Harvard
Business Review, 78 (1), 79–87.
Randall, Taylor, Christian Terwiesch, and Karl T. Ulrich (2007), “User Design of Customized
Products,” Marketing Science, 26 (2), 268–80.
Sawhney, Mohanbir, Gianmario Verona, and Emanuela Prandelli (2005), “Collaborating to
Create: The Internet as a Platform for Customer Engagement in Product Innovation,”
Journal of Interactive Marketing, 19 (4), 4–17.
Schlosser, Ann E., Tiffany Barnett White, and Susan M. Lloyd (2006), “Converting Web Site
Visitors into Buyers: How Web Site Investment and Online Purchase Intentions,” Journal of
Marketing, 70 (2), 133–48.
Schreier, Martin (2006), “The Value Increment of Mass-Customized Products: An Empirical
Assessment,” Journal of Consumer Behaviour, 5 (4), 317–27.
———, Christoph Fuchs, and Darren W. Dahl (2012), “The Innovation Effect of User Design:
Exploring Consumers’ Innovation Perceptions of Firms Selling Products Designed by
Users,” Journal of Marketing, 76 (5), 18–32.
Selnes, Fred and Havard Hansen (2001), “The Potential Hazard of Self-Service in Developing
Customer Loyalty,” Journal of Service Research, 4 (2), 79–90.
Sinha, Indrajit (2000), “Cost Transparency: The Net’s Real Threat to Prices and Brands,”
Harvard Business Review, 78 (2), 43–50.
Syam, N., P. Krishnamurthy, and James D. Hess (2008), “That’s What I Thought I Wanted?
Miswanting and Regret for a Standard Good in a Mass-Customized World,” Marketing
Science, 27 (3), 379–97.
Troye, Sigurd Villads and Magne Supphellen (2012), “Consumer Participation in Coproduction: ‘
I Made It Myself ’ Effects on Consumers’ Sensory Perceptions and Evaluations of Outcome
and Input Product,” Journal of Marketing, 76 (2), 33–46.
Weiss, Allen M., Nicholas H. Lurie, and Deborah J. MacInnis (2008), “Listening to Strangers:
Whose Responses Are Valuable, How Valuable Are They, and Why?,” Journal of
Marketing Research, 45 (4), 425–36.
Wind, Jerry and Arvind Rangaswamy (2001), “Customerization: The Next Revolution in Mass
Customization,” Journal of Interactive Marketing, 15 (1), 13–32.
Zhu, Zhen, Cheryl Nakata, K. Sivakumar, and Dhruv Grewal (2007), “Self-Service Technology
Effectiveness: The Role of Design Features and Individual Traits,” Journal of the Academy
of Marketing Science, 35 (4), 492–506.
58
SGA-Based Metrics in Marketing: Conceptual and Measurement Challenges
By Annette Ptok, Rupinder Jindal, and Werner Reinartz
ABSTRACT
Many studies use variables from the Compustat database to measure various marketing
constructs, yet no clear guidelines detail which metrics correspond with which constructs.
Justifications rest mainly on the ready availability of easy-to-use measures that seem related to a
particular construct. As a result, various metrics have been utilized to capture the same construct,
and the same metric, such as selling, general, and administrative expenses (SGA), has been
applied to capture vastly different constructs. But using SGA inappropriately can lead to biased
estimates, questionable hypotheses support, and poor study validity. To test the validity of SGA
for multiple relevant marketing and sales constructs, this study gathers data on benchmark
variables from alternative data sources and applies a multitrait-multimethod (MTMM) approach.
Results show that in general, SGA has been applied too liberally in marketing contexts; SGA is
an appropriate operationalization only for some constructs. This article provides general
guidelines for the proper conceptualization and operationalization of marketing constructs.
Keywords: Validation, content validity, construct validity, SGA, Compustat, multitrait-
multimethod (MTMM) matrix, marketing–accounting interface
59
INTRODUCTION
To understand the impact of marketing and sales force activities on firm performance,
vast literature exists in marketing strategy and management that employs constructs ranging from
simple advertising spending to complex, strategic marketing capabilities. As the Marketing
Science Institute (MSI 2016, p. 6) acknowledges, “making every dollar count is a marketing
imperative for all organizations. To do so requires a keen understanding of all the different brand-
building and sales-generating activities an organization may choose to engage in.” This
imperative is challenging though; few sources provide easy, cost-effective access to reliable data
across companies that capture these activities in detail. Companies protect such data closely
because they can reveal their underlying strategies. Faced with this paucity of representative data,
some scholars simply ignore the complexity of marketing constructs and overlook their
conceptual and operational requirements, in favor of achieving their measurement objectives. But
when studies do not fully define or conceptualize the marketing constructs they use, it results in
ambiguity and contradiction in their meaning and measures (Varadarajan 2010).
Given the lack of alternatives, research has heavily relied on one particular source,
Compustat, which has become the go-to source for scholars interested in studying and comparing
brand-building and sales performance across organizations. This database reports on publicly
traded companies that, due to fiscal regulations, must disclose their earnings and expenditures on
various items. Compustat’s reporting is based on more than 300 items from annual income
statements, balance sheets, statements of cash flows, and supplemental data about more than
24,000 publicly traded companies in the United States and Canada (Porter and Millar 1985;
Wharton 2016)). There are, however, no clear guidelines on matching various marketing
constructs to metrics from Compustat. In particular, the selling, general, and administrative
expense (SGA) metric is used extensively to capture diverse constructs, including marketing

60
spending, sales intensity, advertising intensity, and marketing assets. Although this
comprehensive accounting variable “aggregates all costs incurred in the regular course of
business except costs associated with the production of goods and services” (Standard and Poor’s
2013, p. 269), the rationale for using it to capture the various constructs is limited, seemingly
resting on little more than the availability of an easy-to-use measure that appears appropriate.
This characterization applies to several Compustat metrics, and thus, various metrics often serve
to capture the same construct too. For example, in addition to SGA, some studies use marketing
spending metric to assess advertising expenses. We find little research effort that conscientiously
seeks to deduce theoretical constructs, which is a prerequisite for empirical measurement, and
then test the validity of their operationalization (MacKenzie 2003). This neglect increases the
threat of model misspecification and misleading implications for research and practice.
In particular, using Compustat metrics to operationalize marketing constructs combines
two vastly different domains of accounting and marketing. These domains differ in the common
knowledge of how various constructs should be defined and which variables can be applied, in
what ways, to measure them. Despite the lack of validation of SGA as an appropriate measure for
marketing- and sales-related constructs, it appears extensively in prior research. Because using
SGA inappropriately to capture a given marketing construct can lead to biased estimates, invalid
inferences, and questionable hypotheses support, the validity of these studies’ findings may be
questionable.
Our objective is to provide a conceptual assessment of commonly used marketing and
sales constructs and an empirical assessment of alternative measures. Specifically, we address
three research questions:
RQ1. Which marketing and sales constructs have been measured using SGA?

61
RQ2. Is SGA a valid measure for these constructs? Are there alternative measures for
these constructs that may be equally or more valid?
RQ3. What guidelines can be developed for choosing between SGA and these alternative
measures?
In turn, we make several contributions to literature. First, this article provides a structured
overview of the widespread use of SGA in marketing strategy literature. Considering the
disparity in SGA-based operationalizations, this compilation of the status quo is overdue. Second,
by spanning the boundary between the accounting and marketing domains, we integrate
frequently neglected knowledge from accounting into marketing strategy. Specifically, we
address the conceptual breadth of a marketing construct and its operationalization using
accounting-based measures, which helps differentiate the constructs that can be measured
optimally using SGA from those that cannot. We thus demonstrate the importance of a proper
conceptualization of a construct and the validation of its subsequent operationalization. In
general, misspecification on a conceptual or operational level biases estimates of precise effect
sizes, which weakens the credibility of any research findings (MacKenzie 2003). Third, we add to
marketing theory and practice by deducing guidelines for appropriate operationalizations of
several marketing and sales constructs. In so doing, we ensure a better understanding of the scope
of Compustat for marketing research and accordingly generate guidelines for employing available
information. These insights can improve the validity of research findings and their implications
for managers. Table 1 provides an overview of our research process.
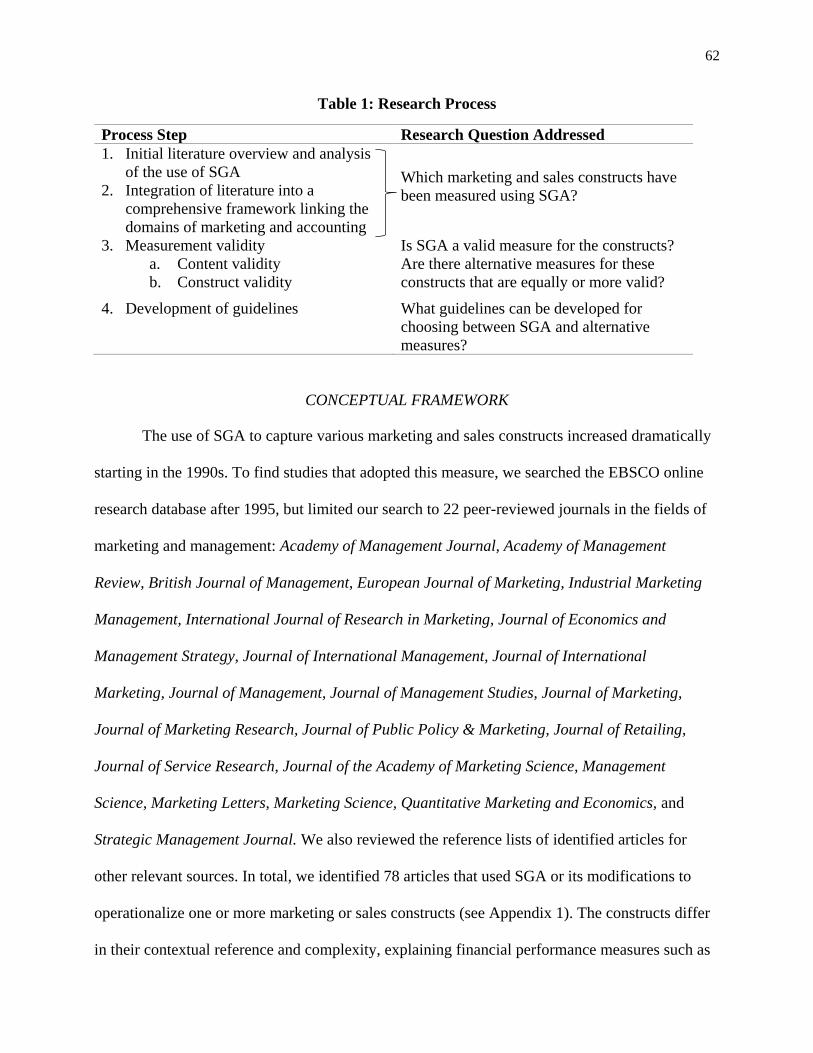
62
Table 1: Research Process
Process Step Research Question Addressed
1. Initial literature overview and analysis
of the use of SGA
2. Integration of literature into a
comprehensive framework linking the
domains of marketing and accounting
Which marketing and sales constructs have
been measured using SGA?
3. Measurement validity
a. Content validity
b. Construct validity
Is SGA a valid measure for the constructs?
Are there alternative measures for these
constructs that are equally or more valid?
4. Development of guidelines What guidelines can be developed for
choosing between SGA and alternative
measures?
CONCEPTUAL FRAMEWORK
The use of SGA to capture various marketing and sales constructs increased dramatically
starting in the 1990s. To find studies that adopted this measure, we searched the EBSCO online
research database after 1995, but limited our search to 22 peer-reviewed journals in the fields of
marketing and management: Academy of Management Journal, Academy of Management
Review, British Journal of Management, European Journal of Marketing, Industrial Marketing
Management, International Journal of Research in Marketing, Journal of Economics and
Management Strategy, Journal of International Management, Journal of International
Marketing, Journal of Management, Journal of Management Studies, Journal of Marketing,
Journal of Marketing Research, Journal of Public Policy & Marketing, Journal of Retailing,
Journal of Service Research, Journal of the Academy of Marketing Science, Management
Science, Marketing Letters, Marketing Science, Quantitative Marketing and Economics, and
Strategic Management Journal. We also reviewed the reference lists of identified articles for
other relevant sources. In total, we identified 78 articles that used SGA or its modifications to
operationalize one or more marketing or sales constructs (see Appendix 1). The constructs differ
in their contextual reference and complexity, explaining financial performance measures such as
63
brand equity, (abnormal) stock market returns, market value, productivity, and profitability. In
turn, these constructs have been used to perform benchmarking analyses, judge managerial
ability, allocate resources, and study firm performance.
Our literature review revealed substantial variation in the emphasis placed on precise
construct definitions, as well as the general lack of validation. Imprecise definitions increase the
likelihood of misaligned or misspecified operationalizations, as manifest in the use of SGA to
operationalize diverse, wide-ranging constructs, such as marketing assets, marketing resources,
marketing capabilities, advertising intensity, sales intensity, and marketing spending. Considering
that SGA comprises 29 cash outflow items (see Appendix 2), it would be difficult to draw a
direct link between it and the various marketing and sales constructs. The SGA items also capture
diverse firm activities, well beyond the functions of sales and marketing. If categorized according
to Porter’s value chain framework (Porter and Millar 1985), two-third of the items relate to
support activities, such as infrastructure and human marketing and sales functions. Furthermore,
only three items—advertising expenses, commissions, and resource management. Only one-third
of them pertain to primary activities, including marketing expenses—directly relate to these
functions (Standard and Poor 2013), and they account for only a small proportion of SGA. For
example, between 1997 and 2014, across all companies in Compustat, aggregate advertising
expenses accounted for less than 10% of SGA, whereas rental expenses made up 6%, and R&D
expenses accounted for 17%. Whereas the use of a composite variable to measure a marketing
construct implies that the estimated effects and resulting strategies pertain to the marketing items
it contains, the composition of this measure suggests that the effects actually could be related to
one or more support activities required for operations. Thus, a detailed analysis is needed to
examine the validity of SGA for measuring marketing and sales constructs.

64
Table 2 summarizes the operationalizations of marketing and sales constructs based on
SGA, revealing both the constructs and the multiple measures employed to capture them.
Broadly, 11 major constructs have been operationalized using three key variables from
Compustat: SGA, advertising expense (ADV), and research and development expense (R&D).
This table also illustrates the arbitrary use of SGA. To take an example, SGA measures marketing
spending in several studies (Dutta, Narasimhan, and Rajiv 1999, 2005; Narasimhan, Rajiv, and
Dutta 2006; Sarkees, Hulland, and Chatterjee 2014), but a modification of this metric, “SGA
minus research and development expense (SGA – R&D)” has been applied for the same purpose
in several other studies (Bharadwaj, Tuli, and Bonfrer 2011; Dinner, Mizik, and Lehmann 2009;
Kurt and Hulland 2013; Luo 2008). In addition to inconsistency in the operationalization of a
particular construct, multiple constructs often rely on the same operationalization. For example,
in addition to marketing spending, marketing assets (Balsam, Fernando, and Tripathy 2011),
marketing intensity (Krishnan, Tadepalli, and Park 2009), marketing efficiency (Lin, Tsai, and
Wu 2014), and marketing capabilities (Luo, Zhao, and Du 2005) have been measured using SGA
too. Yet these constructs are clearly distinct from one another, so SGA cannot serve as a valid
measure for all of them. This arbitrary use of SGA has led to multiple operationalizations of a
single construct and similar operationalizations of multiple constructs. In each case, the
operationalization may not sufficiently match the construct.
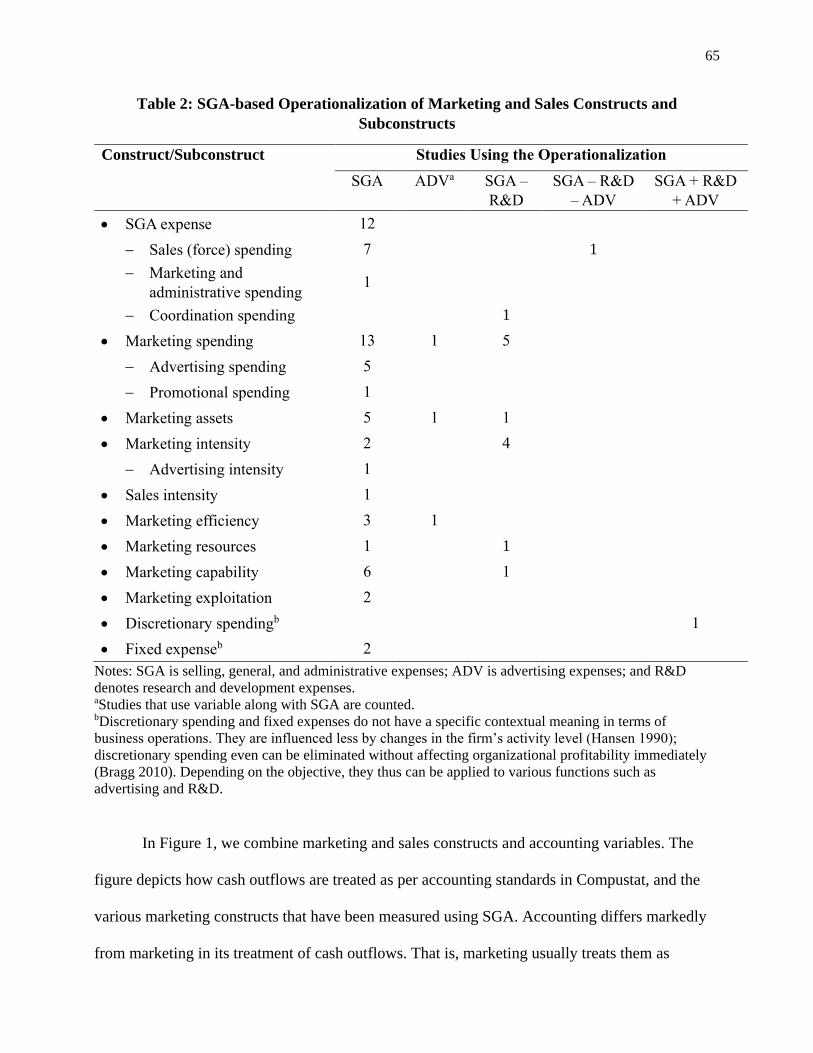
65
Table 2: SGA-based Operationalization of Marketing and Sales Constructs and
Subconstructs
Construct/Subconstruct Studies Using the Operationalization
SGA ADVa SGA –
R&D
SGA – R&D
– ADV
SGA + R&D
+ ADV
SGA expense 12
Sales (force) spending 7 1
Marketing and
administrative spending 1
Coordination spending 1
Marketing spending 13 1 5
Advertising spending 5
Promotional spending 1
Marketing assets 5 1 1
Marketing intensity 2 4
Advertising intensity 1
Sales intensity 1
Marketing efficiency 3 1
Marketing resources 1 1
Marketing capability 6 1
Marketing exploitation 2
Discretionary spendingb 1
Fixed expenseb 2
Notes: SGA is selling, general, and administrative expenses; ADV is advertising expenses; and R&D
denotes research and development expenses. aStudies that use variable along with SGA are counted. bDiscretionary spending and fixed expenses do not have a specific contextual meaning in terms of
business operations. They are influenced less by changes in the firm’s activity level (Hansen 1990);
discretionary spending even can be eliminated without affecting organizational profitability immediately
(Bragg 2010). Depending on the objective, they thus can be applied to various functions such as
advertising and R&D.
In Figure 1, we combine marketing and sales constructs and accounting variables. The
figure depicts how cash outflows are treated as per accounting standards in Compustat, and the
various marketing constructs that have been measured using SGA. Accounting differs markedly
from marketing in its treatment of cash outflows. That is, marketing usually treats them as
66
generic, but accounting has a set of specific rules based primarily on the timing of returns from
outflows (Hansen 1990). Cash outflows that do not generate future economic returns are treated
as expenses in income statements; those that generate future economic returns are capitalized as
assets in the balance sheet and depreciate over time. Expenses also can be divided further into
broad subcategories, such as the cost of goods sold (COGS), SGA, and other expenses. Similarly,
assets comprise two broad subcategories, tangible and intangible.
On the basis of their conceptual properties, we categorize the marketing constructs in Figure 1 as
either accounting or operating in nature, which ideally would be captured with accounting or
operating measures, respectively. Accounting measures are “reflections of past or short-term
financial performance” (Gentry and Shen 2010, p. 514) that “rely upon financial information
reported in income statement, balance sheet and statements of cash flow” (Carton and Hofer
2006, p. 61). They are “generally expressed as values, ratios or percentages” (Carton and Hofer
2006, p. 63). Constructs that are shorter-term, relatively more objective, and primarily concerned
with financial performance, such as marketing spending, are conducive to such measures.
Operating measures instead “represent how the organization is performing on non-financial
issues.… Most of the measures in this category require primary data from management in the
form of their assessment of own performance” (Carton and Hofer 2006, p. 62). They do not
appear in the income statement, balance sheet, or cash flow statement. Constructs such as
marketing capabilities, which are longer-term, relatively more subjective, and concerned with
non-financial performance, are more appropriate for such measures. This categorization provides
a basis for relating the constructs to Compustat metrics and assessing their conceptual validity.
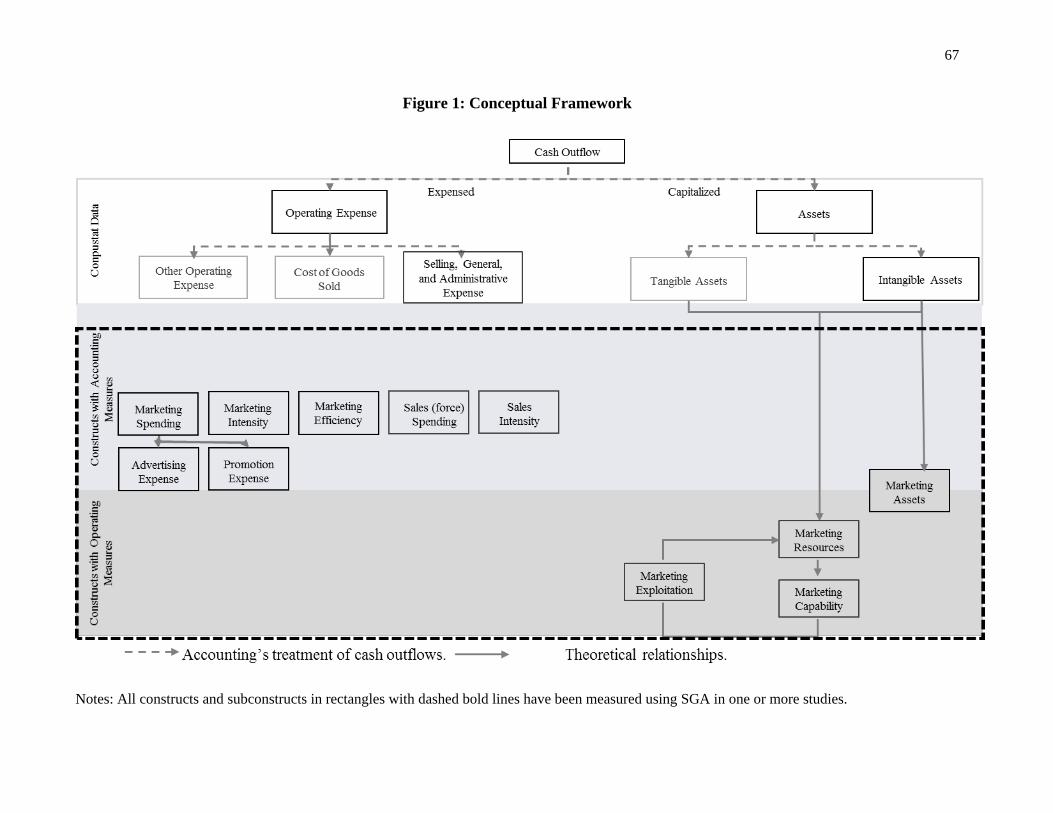
67
Figure 1: Conceptual Framework
Notes: All constructs and subconstructs in rectangles with dashed bold lines have been measured using SGA in one or more studies.
68
Among the constructs depicted, marketing spending is usually defined as “the total
amount of money spent by a firm in all its marketing related activities” (Nath, Nachiappan, and
Ramanathan 2010, p. 322). Sales force spending is the amount of money spent on sales force
activities to stimulate purchases, such as “prospecting, defining needs, preparing and presenting
proposals, negotiating contracts, and implementing the sale” (Kotler and Rackham 2006, p. 11).
Marketing assets are “customer-focused measures of the value of the firm (and its offerings) that
may enhance the firm's long-term value” (Rust et al. 2004, p. 78). Resources in turn are “tangible
and intangible assets firms use to conceive of and implement their strategies” (Barney and Arikan
2001, p. 138 cf. Kozlenkova, Samaha, and Palmatier 2014). They must be valuable, rare,
inimitable, and non-substitutable (Barney 1991). Capabilities are “complex bundles of skills and
collective learning, exercised through organizational processes that ensure superior coordination
of functional activities(Day 1994, p. 38). Whereas resources are monetarily-driven assets
(tangible or intangible) that determine the organization’s input factors, capabilities are its skills to
use these input factors.
Marketing and sales intensity, marketing efficiency, and marketing exploitation represent
higher-level constructs, comprised of one or more of these baseline constructs (spending, assets,
resources, and capabilities) and distinct only in their objectives. Intensity provides information
about profitability, in terms of comparing outflow measures against performance measures (Hatip
and Strehlau 2000). Efficiency represents a “performance outcome viewed relative to the
resources consumed” (Katsikeas et al. 2016, p. 5); it features growth, including changes in cash
inflows or outflows (Ambler et al. 2001; Carton and Hofer 2006). Exploitation is linked to
capabilities, such that it refers to “the refinement and extension of existing competencies,
technologies and paradigms” (March 1991, p. 85). The validation of intensity, efficiency, and
69
exploitation thus depends on the validation of the baseline constructs, so we do not conduct
separate tests for them.
RESEARCH DESIGN
To be valid, a measure should assess “the magnitude and direction of (1) all of the
characteristics and (2) only the characteristics of the construct it is purported to assess” (Peter
1981, p. 134). Simply put, “a measure is valid if it measures what it is supposed to measure”
(Heeler and Ray 1972, p. 361). We analyze the appropriateness and validity of SGA for each
construct using a two-step approach for establishing content and construct validity (Figure 2).
Content validity pertains to the conceptual adequacy of the proposed measure for capturing the
construct’s domain characteristics (DeVellis 2012). We test the content validity of the baseline
constructs (spending, assets, resources, and capabilities) with respect to SGA by deriving a set of
decision rules. Fit between SGA and each construct, according to these decision rules, is a
necessary condition for validation. If content validity exists, we move on to further testing for
construct validity at the operational level. Construct validity is “the vertical correspondence
between a construct, which is at an unobservable conceptual level, and a purported measure of it,
which is at an operational level” (Peter 1981, p. 134). The tests for construct validity use the
multitrait-multimethod (MTMM) approach. We test SGA against a set of reference variables that
are relatively purer and obtained from other data sources (e.g., Advertising Age, Selling Power,
and balance sheet information in Compustat): media spending, estimated unmeasured spending,
number of salespeople, goodwill, and other intangible assets.
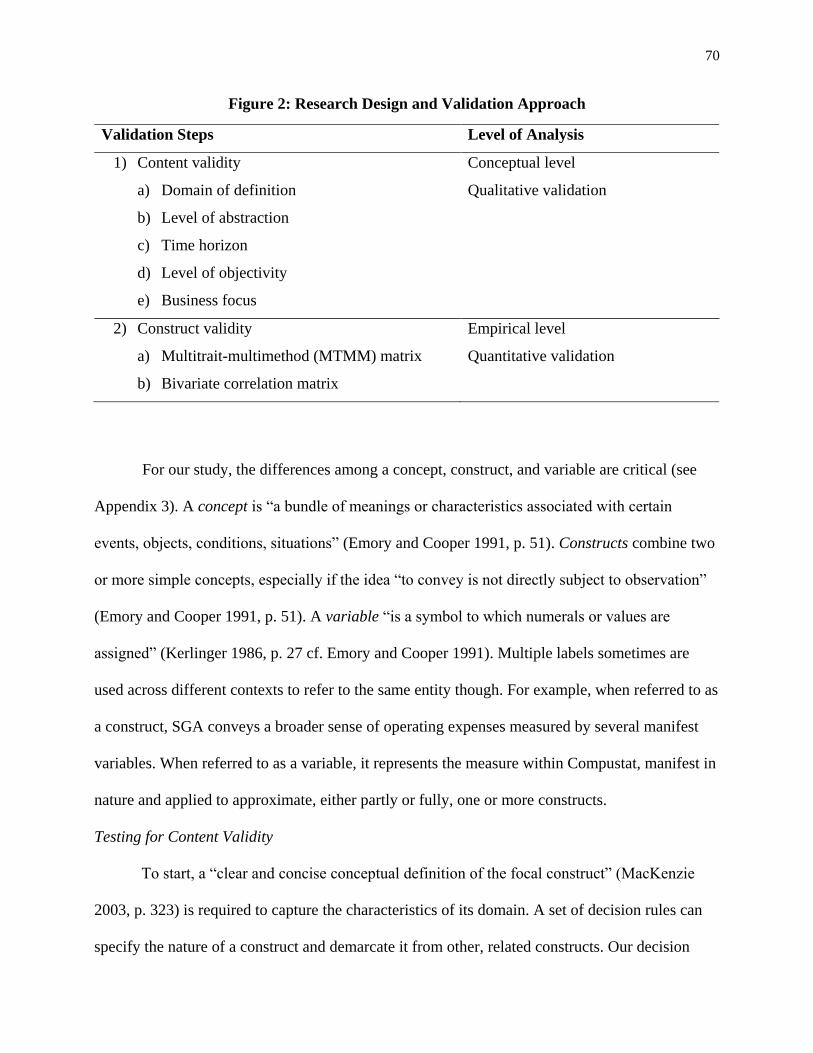
70
Figure 2: Research Design and Validation Approach
Validation Steps Level of Analysis
1) Content validity
a) Domain of definition
b) Level of abstraction
c) Time horizon
d) Level of objectivity
e) Business focus
Conceptual level
Qualitative validation
2) Construct validity
a) Multitrait-multimethod (MTMM) matrix
b) Bivariate correlation matrix
Empirical level
Quantitative validation
For our study, the differences among a concept, construct, and variable are critical (see
Appendix 3). A concept is “a bundle of meanings or characteristics associated with certain
events, objects, conditions, situations” (Emory and Cooper 1991, p. 51). Constructs combine two
or more simple concepts, especially if the idea “to convey is not directly subject to observation”
(Emory and Cooper 1991, p. 51). A variable “is a symbol to which numerals or values are
assigned” (Kerlinger 1986, p. 27 cf. Emory and Cooper 1991). Multiple labels sometimes are
used across different contexts to refer to the same entity though. For example, when referred to as
a construct, SGA conveys a broader sense of operating expenses measured by several manifest
variables. When referred to as a variable, it represents the measure within Compustat, manifest in
nature and applied to approximate, either partly or fully, one or more constructs.
Testing for Content Validity
To start, a “clear and concise conceptual definition of the focal construct” (MacKenzie
2003, p. 323) is required to capture the characteristics of its domain. A set of decision rules can
specify the nature of a construct and demarcate it from other, related constructs. Our decision
71
rules stem from three sets of criteria: conceptual, operational, and managerial. These criteria can
not only parsimoniously determine each construct, in terms of its theoretical and managerial
aspects, but are also in line with academics’ demand for rigor and relevance (Kumar 2016).
Conceptual criteria determine a construct’s conceptual properties, in terms of the domain of its
definition and level of its abstraction. Operational criteria define the construct’s measurement
requirements, according to the time horizon and level of objectivity or subjectivity. Managerial
criteria place the construct in the overall managerial context, reflecting its business focus.
In our framework, the domains of the constructs’ definitions enable us to categorize them
as either accounting or operating. As we noted previously, constructs that are shorter-term,
relatively more objective, and primarily concerned with financial performance (e.g., marketing
spending) are accounting in nature, whereas those that are longer-term, relatively more
subjective, and concerned with non-financial performance (e.g., marketing capabilities) are
operating in nature. The level of abstraction of a construct denotes the divergence between its
conceptual and operational scope and influences the ease with which it can be measured
(Nunnally 1978; Viswanathan 2005). Constructs vary from simple (low abstraction; e.g.,
advertising spending) to difficult (high abstraction; e.g., marketing capabilities) to measure. Time
horizon is the degree to which a construct is attributable to a specific operating period (Katsikeas
et al. 2016). For example, marketing spending is short-term, but marketing assets, which generate
future economic value beyond a particular period, are long-term. The level of objectivity classifies
the construct at an operational level according to the type of measures needed, that is, manifest or
latent (Katsikeas et al. 2016). Constructs such as marketing capabilities include high proportions
of subjective judgment, so they have relatively low objectivity; their measurement depends
largely on qualitative assessments. Constructs such as marketing spending, which primarily
depend on the level of expenses, instead have high objectivity. Finally, the business focus of a

72
construct determines whether it is strategic or tactical (Brink, Odekerken-Schröder, and Pauwels
2006; Casadesus-Masanell and Ricart 2010; Shapiro 1989). Marketing spending might be
considered tactical, because it aims to achieve specific, short-term subgoals that contribute to the
ultimate business goal (e.g., firm performance). Marketing capabilities instead would be more
strategic in nature. With these five decision rules, we define and demarcate the constructs,
according to both research and practice perspectives.
Testing for Construct Validity
We test whether an operationalization corresponds to the underlying construct it aims to
measure. Construct validity consists of convergent and discriminant validity; we assess it using
the MTMM matrix (Campbell and Fiske 1962; Churchill 1979). Convergent validity indicates the
degree to which different measures of the same construct correlate. Discriminant validity implies
that measures that correspond to different constructs are not highly related (Himme 2009). The
MTMM matrix offers a “framework for developing measure validation from available or easily
obtainable generated data” (Heeler and Ray 1972, p. 363), relying on the analysis of correlations
among several variables measured by different techniques. Thus a construct of interest, measured
with SGA from Compustat, can be tested against the same construct, measured by a benchmark
variable obtained from an alternative data source (Figure 3). The alternative data source should
provide relatively purer and less biased information about the construct of interest.

73
Figure 3: Multitrait-Multimethod (MTMM) Matrix
Method 1 (Data Source 1) Method 2 (Data Source 2)
Trait 1 Trait 2 Trait 1 Trait 2
Variable 1 Variable 2 Variable 3 Variable 4
Method 1
(Data Source 1)
Trait 1 Variable 1 I 1.00
Trait 2 Variable 2 Heterotrait-
monomethodII I 1.00
Method 2
(Data Source 2)
Trait 1 Variable 3 Monotrait-
heteromethodIII
Heterotrait-
heteromethodIV I 1.00
Trait 2 Variable 4 Heterotrait-
heteromethodIV
Monotrait-
heteromethodIII
Heterotrait-
monomethodII I 1.00
Notes: The reliability coefficients (values on the diagonal labeled I) usually represent the highest
correlation coefficients in an MTMM matrix. In our case, these coefficients equal 1.00, because we
compare secondary data sources. The accounting data sources are assumed to have a test–retest reliability
of 1.00.
The main diagonal of the MTMM matrix (I in Figure 3) consists of the reliability
correlations, derived from the correlation of a trait (measure) with itself in a test–retest situation.
In our study context, this diagonal consistently takes a value of 1, because all the data were
obtained from secondary sources that are subjected to consistent, regulated data reporting
standards (Carton and Hofer 2006).
For construct validity, the MTMM method includes several requirements. Specifically,
convergent validity requires that the entries in the monotrait-heteromethod (or validity) diagonal
(III in Figure 3) are significantly different from 0 and sufficiently large. Discriminant validity is
demonstrated by the divergence of the measure of interest from other measures not “measuring
the same variable or concept” (Heeler and Ray 1972, p. 362). For this consideration, the MTMM
approach uses three criteria. First, correlations in each cell of diagonal III should be greater than
the correlations in its column and row in the heterotrait-heteromethod cells (IV in Figure 3). This
minimum requirement simply means that the correlation between two different measures of the
74
same variable should be higher than the correlations “between that variable and any other
variable which has neither trait nor method in common” (Campbell and Fiske 1962, p. 82).
Second, the correlations in diagonal III should be greater than those in the heterotrait-
monomethod cells (II in Figure 3). This more stringent requirement suggests that the correlations
of different measures of a trait should be greater than correlations among traits that have methods
in common. That is, a variable should correlate more strongly with an independent effort to
measure the same trait than with measures designed to check different traits that just happen to
employ the same method. Third, if the matrix contains information on more than two traits, the
same pattern of trait interrelationship should appear in all heterotrait triangles, for both the
monomethod and the heteromethod blocks.
DATA
Data Sources
We obtained data from three sources: Compustat, Advertising Age, and Selling Power.
Compustat covers companies publicly listed in the United States or Canada; the “Compustat
North America Fundamentals Annual” data set comprises annual, worldwide, company-level
information on expenses such as SGA, advertising, and R&D, as well as on assets such as
goodwill and intangible assets. We obtained 18 years of data (1997–20143). To ensure the proper
application of the validation approach, we excluded all observations with zero or missing values
for our key variables of interest. It is very unlikely that any company has zero annual expenses on
SGA and advertising expenses; a zero value likely implies that either the company did not
disclose the value or Compustat failed to register it. Compustat reports a missing value (blank
cell) if it is unable to obtain a value (Standard and Poor’s 2016, personal correspondence).
3 At the time of submission, Advertising Age data were only available up to 2014, so, we used data from Compustat
till 2014 too.

75
Advertising Age and Selling Power provide benchmark data to judge the validity of the
SGA-based metrics. Advertising Age provides annual, company-level data on the marketing
expenses of 200 leading companies in the U.S. and 100 leading companies worldwide. Selling
Power tracks the 500 U.S.-based companies that employ the largest sales forces. It provides
annual, company-level information on the number of salespeople in the United States. These two
sources thus offer purer and less biased benchmark information on the variables of interest.4
For the construct validation, we needed to match the data across the different sources. We
started with 18,858 observations from Compustat and 1,800 observations from Advertising Age
(100 observations per year for 1997–2014). More than half of the companies listed in Advertising
Age (worldwide data set) are not listed in the U.S. or Canada and thus not included in Compustat,
even though they advertise in these countries. Due to missing or zero values on focal variables in
Compustat, matching the data from these two sources left us with 494 observations. After
removing extreme outliers,5 we retained 465 observations, which constitute Sample 1. It
represents 69 unique companies that spend heavily on marketing communication (a key criterion
for their inclusion in the Advertising Age database). The data range from one to eighteen years for
individual companies, with an average of about seven years for each company. In this sample of
active advertisers with high spending, advertising expenses account for about 23% of SGA.
Next, we matched the data from Sample 1 with data from Selling Power to obtain Sample
2. We started with 6,000 observations (500 observations per year for 2002–2013) from Selling
4We also considered other data sources (e.g., Ebiquity, PIMS, Hoover) of benchmark variables but found them
unsuitable. For example, Ebiquity reports data at the country level only, and its consultants advised us against
aggregating these country-level data to obtain worldwide data. PIMS provides information at the strategic business
unit level for participating companies, so it likewise is unsuitable. Hoover does not include any information related to
marketing spending but rather provides qualitative information about big players only. 5 Outliers can have significant influences on correlation coefficients, so extreme outliers should be removed
(Schwertman et al. 2004). We used Tukey’s (1977) formula: lower fence: Quartile 1 – 3*(Quartile 3 – Quartile 1);
upper fence: Quartile 3 + 3*(Quartile 3 – Quartile 1). All values outside the fences were removed, which reduced the
number of observations to 465. As we explain with our robustness checks, including these extreme outliers still
provided similar results.
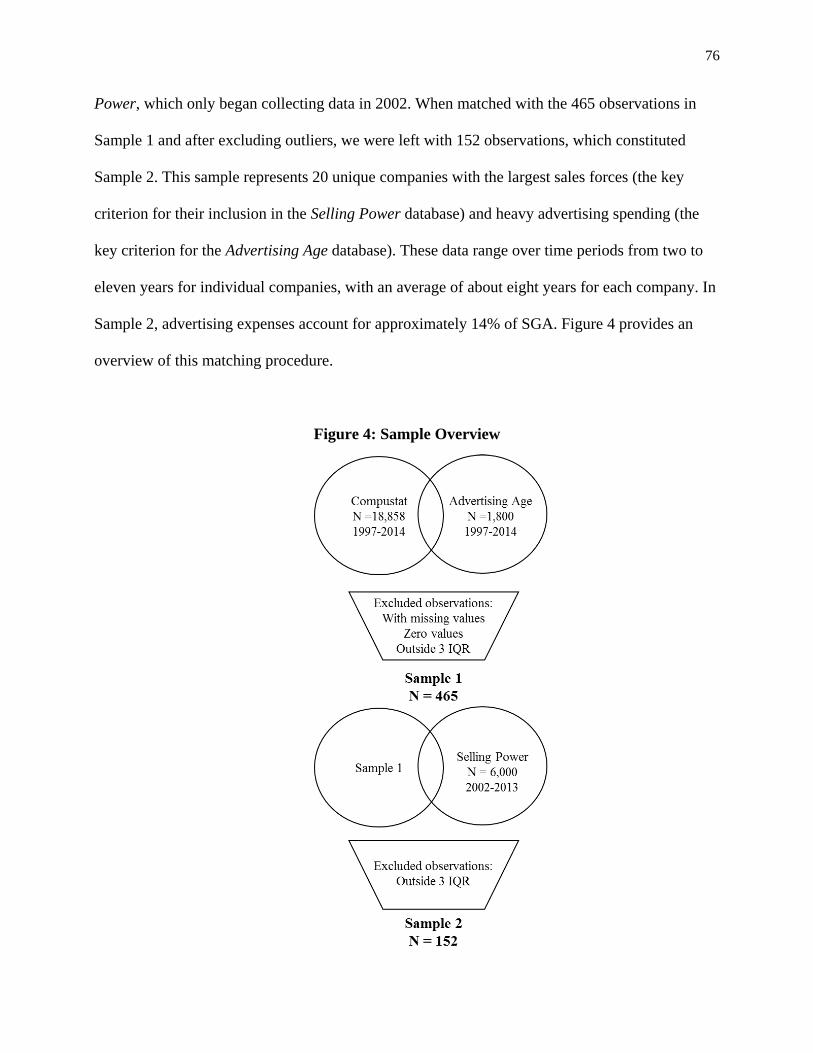
76
Power, which only began collecting data in 2002. When matched with the 465 observations in
Sample 1 and after excluding outliers, we were left with 152 observations, which constituted
Sample 2. This sample represents 20 unique companies with the largest sales forces (the key
criterion for their inclusion in the Selling Power database) and heavy advertising spending (the
key criterion for the Advertising Age database). These data range over time periods from two to
eleven years for individual companies, with an average of about eight years for each company. In
Sample 2, advertising expenses account for approximately 14% of SGA. Figure 4 provides an
overview of this matching procedure.
Figure 4: Sample Overview

77
Variables
The set of variables from Compustat used for construct operationalization includes
selling, general, and administrative expenses (SGA), advertising expenses (ADV), and research
and development expenses (R&D). These variables are the most frequently employed in
marketing literature, so they represent variables of interest in terms of construct validation. We
test them against the benchmark variables derived from Advertising Age, Selling Power, and
Compustat itself. The benchmark variables, as reliable alternative measures of specific
constructs, consist of measured media spending, estimated unmeasured spending, the number of
people employed in sales functions, total intangible assets, goodwill, and other intangible assets.
A list of the variables and their data sources is in Table 3. Beyond the definitions in Table 3, a
few additional notes are necessary in relation to selected variables. Specifically, measured media
spending spans 19 media channels and is reported at both the worldwide level (100 companies
every year) and the U.S. level (200 companies every year). A company must have “measured-
media spending in at least three of the four major regions—defined as the US and Canada; Asia
Pacific; Europe, Middle East, and Africa; and Latin America” to qualify for entry in the
worldwide list (Advertising Age 2016b). In addition, estimated unmeasured spending, or the
estimate of spending on sources that are not included in the measured media category
(Advertising Age 2016a), is reported only for the U.S. market (200 companies). To compare it
against the global Compustat data, we needed to obtain a worldwide measure of estimated
unmeasured spending. Therefore, we calculated the ratio of measured media spending of 100
companies at the worldwide level to their measured media spending in the United States. With
the assumption that this ratio should hold for estimated unmeasured spending too, we applied it to
obtain worldwide estimated unmeasured spending from the information available for the 100
U.S. companies. As we explain with our robustness checks subsequently, we allowed for

78
divergence of ±33% from these calculated values. Finally, the information on the estimated
number of salespeople refers to 500 U.S. companies (Selling Power 2016). This variable is
reported at the U.S. level only. To compare it with Compustat data at the worldwide level, we
referred to each company’s annual reports and other business publications between 2002 and
2013 to get information on their total sales (in U.S. dollars) worldwide and in the United States.
We calculated this ratio, then multiplied the number of U.S. salespeople with this number to
impute the number of salespeople worldwide. Similar to estimated unmeasured spending, we
again allowed for a divergence of up to ±33% from these calculated values.
The descriptive statistics for all the variables are in Table 4, Panels a (Sample 1) and b
(Sample 2).

79
Table 3: Data Sources, Variables, and Descriptions
Variable Description
Data source: Compustat
SGA (Selling, general, and
administrative expense)
All operating expenses (other than those directly related to
production) incurred in the regular course of business.
ADV (Advertising expense) The cost of advertising media (radio, TV, newspapers, and
periodicals) and promotional expenses. It does not include
other selling and marketing expenses.
R&D (Research and
development expense)
All costs related to the development of new products or
services. It does not include market research or market testing
activities, or routine or periodic alterations to existing
products, manufacturing processes, and other ongoing
operations.
Goodwill Value assigned to long-term perceptual assets (e.g., brand
name, client relationships, and employee morale), which
increase the earning potential of the company.
Other intangible assets Intellectual assets such as patents and rights, which have a
monetary value for the company.
Total intangible assets Sum of goodwill and other intangible assets
Data source: Advertising Age
(2016a, 2016b)
Measured media spending Estimated annual spending across 19 media: TV (broadcast
network TV, spot TV, syndicated TV, and network cable TV),
radio (network, national spot, and local), magazines
(consumer magazines, Sunday magazines, local magazines,
and B-to-B magazines), newspapers (local and national),
Spanish-language media (magazines, newspapers and TV
networks), outdoor, internet (excluding paid search and
broadband video), and free-standing inserts.
Estimated unmeasured
spending
Estimates of spending on direct marketing, promotion, co-op,
coupons, catalogs, product placement, events, and
unmeasured forms of digital media (e.g., display, paid search,
video, and social media).
Total marketing spending Sum of measured media spending and estimated unmeasured
spending
Data source: Selling Power
(2016)
Number of salespeople Estimated number of people employed in sales functions
Notes: These measures are in millions of dollars, except for number of salespeople, which is measured in
thousands. Definitions of the Compustat variables are available in Standard and Poor’s (2003).
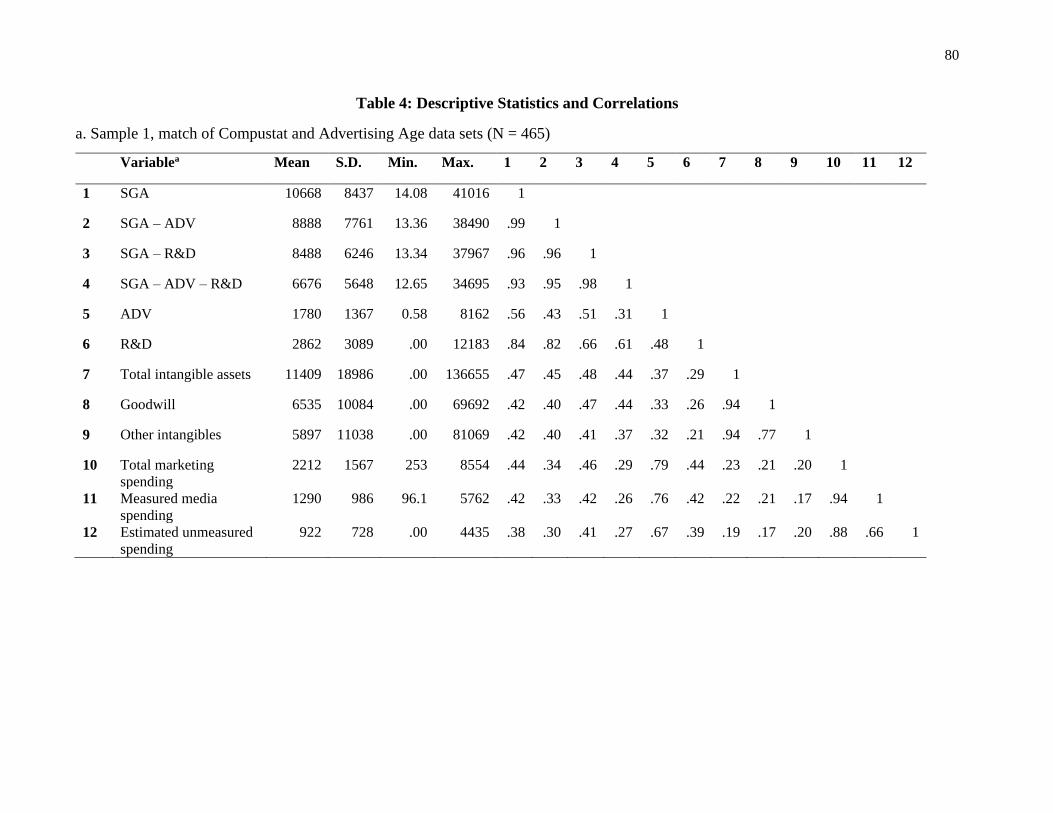
80
Table 4: Descriptive Statistics and Correlations
a. Sample 1, match of Compustat and Advertising Age data sets (N = 465)
Variablea Mean S.D. Min. Max. 1 2 3 4 5 6 7 8 9 10 11 12
1 SGA 10668 8437 14.08 41016 1
2 SGA – ADV 8888 7761 13.36 38490 .99 1
3 SGA – R&D 8488 6246 13.34 37967 .96 .96 1
4 SGA – ADV – R&D 6676 5648 12.65 34695 .93 .95 .98 1
5 ADV 1780 1367 0.58 8162 .56 .43 .51 .31 1
6 R&D 2862 3089 .00 12183 .84 .82 .66 .61 .48 1
7 Total intangible assets 11409 18986 .00 136655 .47 .45 .48 .44 .37 .29 1
8 Goodwill 6535 10084 .00 69692 .42 .40 .47 .44 .33 .26 .94 1
9 Other intangibles 5897 11038 .00 81069 .42 .40 .41 .37 .32 .21 .94 .77 1
10 Total marketing
spending
2212 1567 253 8554 .44 .34 .46 .29 .79 .44 .23 .21 .20 1
11 Measured media
spending
1290 986 96.1 5762 .42 .33 .42 .26 .76 .42 .22 .21 .17 .94 1
12 Estimated unmeasured
spending
922 728 .00 4435 .38 .30 .41 .27 .67 .39 .19 .17 .20 .88 .66 1
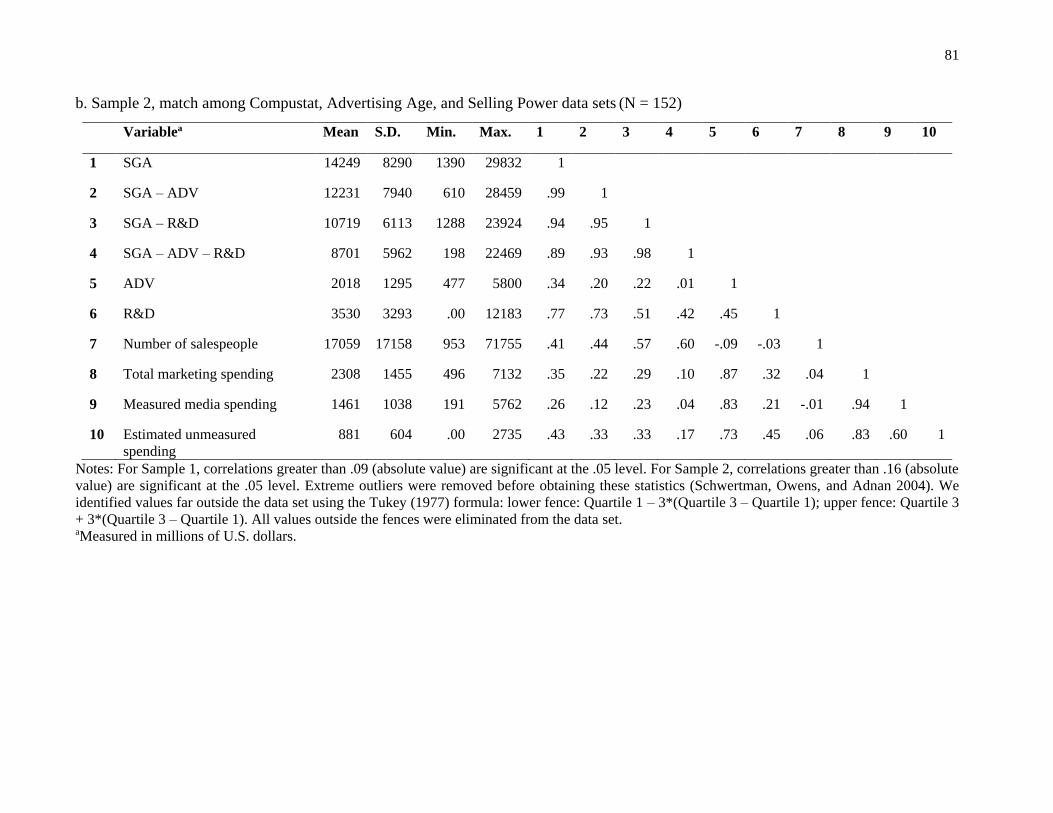
81
b. Sample 2, match among Compustat, Advertising Age, and Selling Power data sets (N = 152)
Variablea Mean S.D. Min. Max. 1 2 3 4 5 6 7 8 9 10
1 SGA 14249 8290 1390 29832 1
2 SGA – ADV 12231 7940 610 28459 .99 1
3 SGA – R&D 10719 6113 1288 23924 .94 .95 1
4 SGA – ADV – R&D 8701 5962 198 22469 .89 .93 .98 1
5 ADV 2018 1295 477 5800 .34 .20 .22 .01 1
6 R&D 3530 3293 .00 12183 .77 .73 .51 .42 .45 1
7 Number of salespeople 17059 17158 953 71755 .41 .44 .57 .60 -.09 -.03 1
8 Total marketing spending 2308 1455 496 7132 .35 .22 .29 .10 .87 .32 .04 1
9 Measured media spending 1461 1038 191 5762 .26 .12 .23 .04 .83 .21 -.01 .94 1
10 Estimated unmeasured
spending
881 604 .00 2735 .43 .33 .33 .17 .73 .45 .06 .83 .60 1
Notes: For Sample 1, correlations greater than .09 (absolute value) are significant at the .05 level. For Sample 2, correlations greater than .16 (absolute
value) are significant at the .05 level. Extreme outliers were removed before obtaining these statistics (Schwertman, Owens, and Adnan 2004). We
identified values far outside the data set using the Tukey (1977) formula: lower fence: Quartile 1 – 3*(Quartile 3 – Quartile 1); upper fence: Quartile 3
+ 3*(Quartile 3 – Quartile 1). All values outside the fences were eliminated from the data set. aMeasured in millions of U.S. dollars.
82
RESULTS
Our validation approach consists of both conceptual and empirical assessments.
Conceptual Assessment (Content Validity)
We apply the five decision rules to identify constructs that are conceptually aligned with
SGA (Table 5). As a construct, SGA provides a period-defined expense and thus could be
categorized as accounting in its domain and short-term in nature. The ease of tracking the various
components of SGA indicates a low level of abstraction and a high level of objectivity.
Moreover, SGA is tactical in business focus; its primary role is to support the firm’s overall
business activities.
The baseline construct spending thus is conceptually aligned with SGA, in that it
represents expenses and is composed of cash outflows on several items. However, SGA has only
moderate conceptual fit with assets. Tangible assets include property, plants, and equipment;
intangible assets refer to items such as customer loyalty, brand equity, and patents. Both types
can have tremendous impacts on firm performance. Although SGA and assets align on two
decision rules (domain of definition and level of abstraction), they exhibit less alignment on the
other three (time horizon, objectivity, and business focus). Thus, we apply an empirical analysis
to validate SGA as a measure of spending and assets. Regarding the five benchmark variables,
similar to SGA, three of the reference variables (measured media spending, estimated
unmeasured spending, and number of salespeople) seem conceptually well-aligned with
spending. Therefore, we use these variables to check the construct validity of spending. Two
reference variables (goodwill and other intangible assets from balance sheet information in
Compustat) instead are conceptually well-aligned with assets and thus serve as the reference
variables for the construct validity assessment of assets.
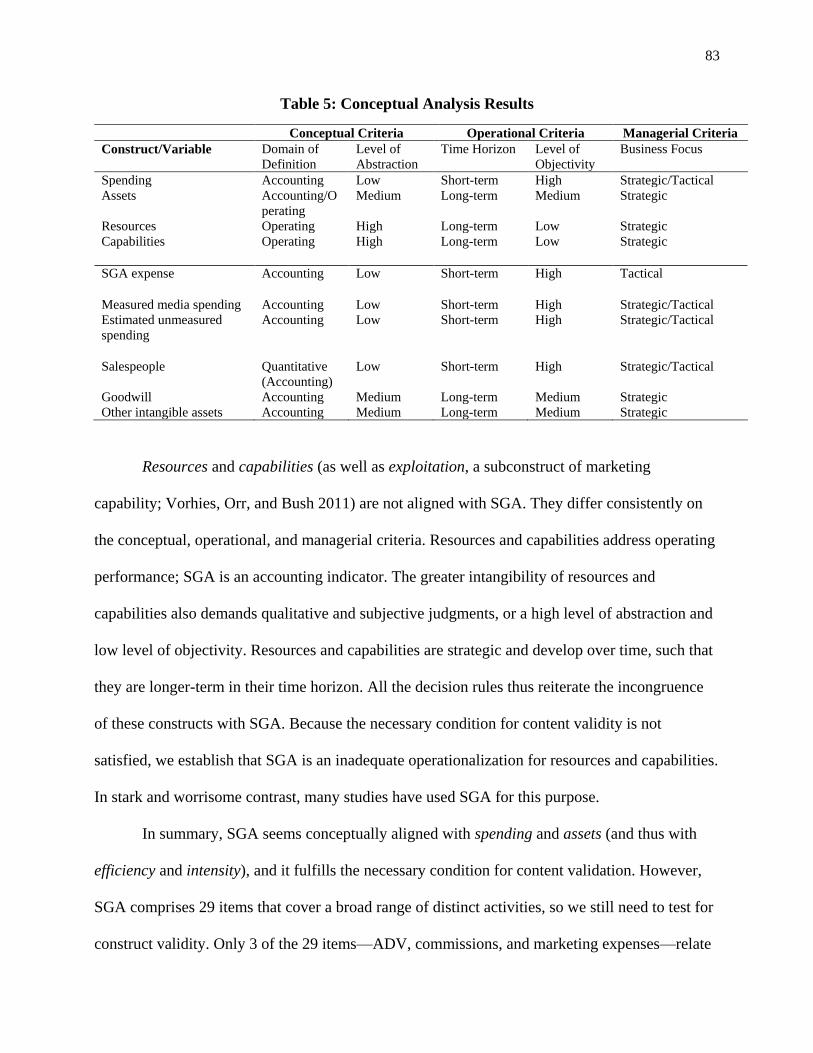
83
Table 5: Conceptual Analysis Results
Conceptual Criteria Operational Criteria Managerial Criteria
Construct/Variable Domain of
Definition Level of
Abstraction Time Horizon Level of
Objectivity Business Focus
Spending Accounting Low Short-term High Strategic/Tactical Assets Accounting/O
perating Medium Long-term Medium Strategic
Resources Operating High Long-term Low Strategic Capabilities Operating High Long-term Low Strategic
SGA expense Accounting Low Short-term High Tactical
Measured media spending Accounting Low Short-term High Strategic/Tactical Estimated unmeasured
spending Accounting Low Short-term High Strategic/Tactical
Salespeople Quantitative
(Accounting) Low Short-term High Strategic/Tactical
Goodwill Accounting Medium Long-term Medium Strategic
Other intangible assets Accounting Medium Long-term Medium Strategic
Resources and capabilities (as well as exploitation, a subconstruct of marketing
capability; Vorhies, Orr, and Bush 2011) are not aligned with SGA. They differ consistently on
the conceptual, operational, and managerial criteria. Resources and capabilities address operating
performance; SGA is an accounting indicator. The greater intangibility of resources and
capabilities also demands qualitative and subjective judgments, or a high level of abstraction and
low level of objectivity. Resources and capabilities are strategic and develop over time, such that
they are longer-term in their time horizon. All the decision rules thus reiterate the incongruence
of these constructs with SGA. Because the necessary condition for content validity is not
satisfied, we establish that SGA is an inadequate operationalization for resources and capabilities.
In stark and worrisome contrast, many studies have used SGA for this purpose.
In summary, SGA seems conceptually aligned with spending and assets (and thus with
efficiency and intensity), and it fulfills the necessary condition for content validation. However,
SGA comprises 29 items that cover a broad range of distinct activities, so we still need to test for
construct validity. Only 3 of the 29 items—ADV, commissions, and marketing expenses—relate
84
directly to selling and marketing cash outflows. Thus, we empirically examine the suitability of
SGA to measure these and other constructs next.6
Empirical Results
Using the results of the conceptual analysis, we developed Table 6 to offer an overview of
the remaining constructs, their operationalizations, and the validity testing procedures. If the
construct measure uses ratios, our analysis focuses only on the component (i.e., numerator or
denominator) that explicitly includes SGA. We employed MTMM methods to test the validity of
all constructs and subconstructs.
6 We note the difference between marketing and sales functions, which are often organized and executed in different
organizational departments and treated differently. Marketing involves activities to start and maintain a customer
relationship (van Triest et al. 2009), such as advertising and promotional efforts, which generate customer awareness
and establish brand preference. Sales seeks to stimulate actual purchases through sales force activities such as
negotiations over price and delivery (Kotler and Rackham 2006).
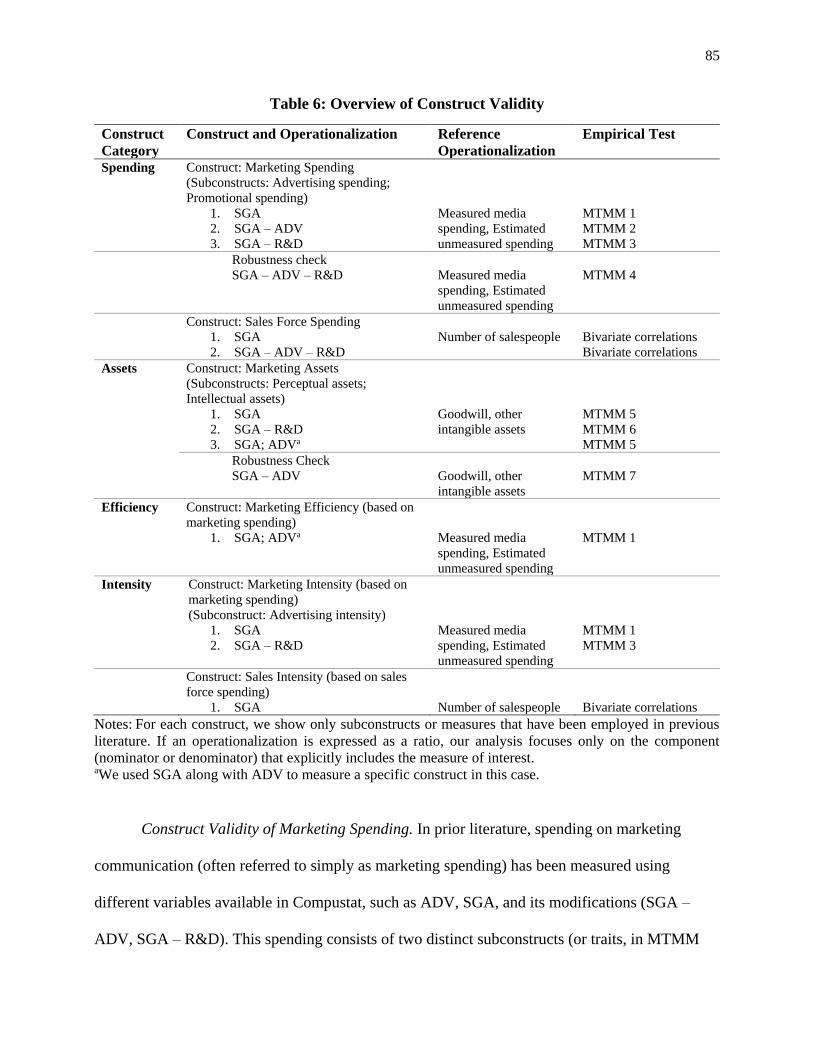
85
Table 6: Overview of Construct Validity
Construct
Category
Construct and Operationalization Reference
Operationalization
Empirical Test
Spending Construct: Marketing Spending
(Subconstructs: Advertising spending;
Promotional spending)
1. SGA
2. SGA – ADV
3. SGA – R&D
Measured media
spending, Estimated
unmeasured spending
MTMM 1
MTMM 2
MTMM 3
Robustness check
SGA – ADV – R&D
Measured media
spending, Estimated
unmeasured spending
MTMM 4
Construct: Sales Force Spending
1. SGA
2. SGA – ADV – R&D
Number of salespeople
Bivariate correlations
Bivariate correlations
Assets Construct: Marketing Assets
(Subconstructs: Perceptual assets;
Intellectual assets)
1. SGA
2. SGA – R&D
3. SGA; ADVa
Goodwill, other
intangible assets
MTMM 5
MTMM 6
MTMM 5
Robustness Check
SGA – ADV
Goodwill, other
intangible assets
MTMM 7
Efficiency Construct: Marketing Efficiency (based on
marketing spending)
1. SGA; ADVa
Measured media
spending, Estimated
unmeasured spending
MTMM 1
Intensity Construct: Marketing Intensity (based on
marketing spending)
(Subconstruct: Advertising intensity)
1. SGA
2. SGA – R&D
Measured media
spending, Estimated
unmeasured spending
MTMM 1
MTMM 3
Construct: Sales Intensity (based on sales
force spending)
1. SGA
Number of salespeople
Bivariate correlations
Notes: For each construct, we show only subconstructs or measures that have been employed in previous
literature. If an operationalization is expressed as a ratio, our analysis focuses only on the component
(nominator or denominator) that explicitly includes the measure of interest. aWe used SGA along with ADV to measure a specific construct in this case.
Construct Validity of Marketing Spending. In prior literature, spending on marketing
communication (often referred to simply as marketing spending) has been measured using
different variables available in Compustat, such as ADV, SGA, and its modifications (SGA –
ADV, SGA – R&D). This spending consists of two distinct subconstructs (or traits, in MTMM

86
nomenclature): advertising spending and promotional spending. We thus consider two different
scenarios for construct validation. In the first, we assume advertising spending is measured by
ADV and promotional spending is measured by SGA or one of its modifications. In the second
scenario, we switch them, such that promotional spending is measured by ADV and advertising
spending is measured by SGA or one of its modifications. We test these measures against two
references from Advertising Age, measured media spending and estimated unmeasured spending.
On the basis of its composition, measured media spending clearly captures advertising spending,
whereas estimated unmeasured spending captures promotional spending. We correlate these two
reference measures with ADV and SGA (or one of its modifications) in an MTMM format, which
yields 4 MTMM matrices in each scenario.7 In all these matrices, the Compustat data represent
method 1 for obtaining data, and the Advertising Age data represents method 2. The results for
the first MTMM matrix (ADV measures advertising spending and SGA measures promotional
spending) are in Table 7, Panel a.
For convergent validity, coefficients in the validity diagonal (i.e., monotrait-heteromethod
coefficients) should be significantly different from zero and high enough to warrant further
investigation. In MTMM 1, although both coefficients are statistically significant, coefficient for
trait 1, measured using ADV (.76), is much higher than the one for trait 2, measured using SGA
(.38) (see Table 7, Panel b). For discriminant validity, a validity coefficient should be higher than
the values in its column and row in the heterotrait-heteromethod cells. This condition is fulfilled
for trait 1 measured using ADV (.76 > .67; .76 > .42) but not for trait 2 measured using SGA (.38
7 In addition to the two common modifications of SGA (SGA – ADV, SGA – R&D), we test another modification
(SGA – ADV – R&D) to check if SGA has any significant marketing-related component, beyond ADV and R&D,
that may justify its use as a measure of marketing constructs. Thus, Scenario 1 includes four MTMM matrices:
advertising spending measured using ADV and promotional spending measured using SGA, SGA – ADV, SGA –
R&D, or SGA – ADV – R&D, respectively. Scenario 2 also uses four matrices, with promotional spending measured
as ADV and advertising spending measured using each of the four SGA-based metrics.
87
< .42; .38 < .67). Furthermore, the validity coefficient should be higher than all coefficients in the
heterotrait-monomethod cells. This condition is again fulfilled only for trait 1 measured using
ADV (.76 > .66; .76 > .56) and not for trait 2 measured using SGA (.38 < .56; .38 < .66). Overall,
the results suggest that only ADV fulfills the conditions of convergent and discriminant validity
for measuring advertising spending; SGA does not fulfill these conditions for measuring
promotional spending. The similar MTMM matrices for the modifications of SGA (i.e., SGA –
ADV, SGA – R&D, SGA – ADV – R&D) provide similar results (see Table 7, Panel b for results
of all four matrices 1–4). That is, none of the SGA-based measures fulfill any of the conditions of
construct validity to measure promotional spending.
In the second scenario, we switched the measures so that ADV measures promotional
spending and SGA measures advertising spending. Neither ADV nor SGA, or any of its
modifications, fulfills the conditions. Thus, ADV offers a good measure of advertising spending
and a partial measure of total marketing spending, but SGA fails to capture either subconstruct of
marketing spending. The conceptual relationship of spending with intensity and efficiency allows
us to extrapolate the results for marketing communication spending to marketing intensity and
efficiency too.

88
Table 7: Construct Validation for Marketing Communication Spending
a. MTMM 1 results
Method 1
(Compustat)
Method 2
(Advertising Age)
MTMM 1 (suitability of SGA to
measure promotional spending)
Trait 1
(Advertising
spending)
Trait 2
(Promotional
spending)
Trait 1
(Advertising
spending)
Trait 2
(Promotional
spending)
ADV SGA
Measured
media
spending
Estimated
unmeasured
spending
Method
1
Trait 1 ADV 1
Trait 2 SGA .56** 1
Method
2
Trait 1
Measured
media
spending
.76** .42** 1
Trait 2
Estimated
unmeasured
spending
.67** .38** .66** 1

89
b. Overview of results from MTMM matrices 1–4
Trait 1 Trait 2
MTMM 1 ADV SGA
Convergent validity .76**
.38** X
Discriminant validity
1st condition
2nd condition
.76 > .67
.38 < .42 X
.76 > .42 .38 < .67
.76 > .66
.38 < .56 X
.76 > .56 .38 < .66
MTMM 2 ADV SGA – ADV
Convergent validity .76**
.30** X
Discriminant validity
1st condition
2nd condition
.76 > .67
.30 < .33 X
.76 > .33 .30 < .67
.76 > .66
.30 < .43 X
.76 > .43 .30 < .66
MTMM 3 ADV SGA – R&D
Convergent validity .76**
.41** X
Discriminant validity
1st condition
2nd condition
.76 > .67
.41 < .42 X
.76 > .42 .41 < .67
.76 > .66
.41 < .51 X
.76 > .51 .41 < .66
MTMM 4 ADV SGA – ADV – R&D
Convergent validity .76**
.27** X
Discriminant validity
1st condition
2nd condition
.76 > .67
.27 > .26 X
.76 > .26 .27 < .67
.76 > .66
.27 < .31 X
.76 > .31 .27 < .66
**p < .01 (two-tailed).
Construct Validity of Marketing Assets. In line with our adopted definition of a marketing
asset (i.e., as noted previously, a “customer-focused measure of the value of the firm (and its
offerings) that may enhance the firm’s long-term value”; Rust et al. 2004, p. 78), marketing
usually focuses on intangible forms, such as customer relationships, brand equity, and patents.
We therefore subsume marketing investments under assets. Following accounting standards,
assets are recorded on the balance sheet, but commonly used measures of investments or assets,
such as ADV and SGA and its modifications (SGA – ADV, SGA – R&D), appear in the income
90
statement. We thus validate the measures from the income statement against two entries from the
balance sheet that capture intangible assets: goodwill and other intangible assets.
For validation purposes, the two subconstructs of assets are perceptual assets, such as
customer relationships and brand equity, and intellectual assets, such as property rights, including
“patents, trademarks, registered designs and copyrights” (Kristandl and Bontis 2007, p. 1519).
Similar to our tests of the validity of marketing spending measures, we consider two scenarios. In
the first, we assume perceptual assets are measured by ADV and intellectual assets are measured
by SGA or one of its modifications. In the second, we switch them, such that intellectual assets
are measured by ADV and perceptual assets are measured by SGA or one of its modifications.
We test these measures against goodwill and other intangible assets, as reported in the balance
sheet. Goodwill captures perceptual assets well; other intangible assets capture intellectual assets.
We correlate these two reference measures with ADV and SGA (or one of its modifications) in
an MTMM format, yielding a total of three MTMM matrices for each scenario.8 In all these
matrices, the income statement is designated method 1 for obtaining data, and the balance sheet is
method 2. The results of the first MTMM matrix (ADV measuring perceptual assets, SGA
measuring intellectual assets) are in Table 8, Panel a. Then in Panel b, we report the results for all
three matrices (5–7) in scenario 1. The convergent and discriminant validity analyses indicate
that neither ADV nor SGA-based measures from the income statement are valid measures of the
two subconstructs of marketing assets.
8For the three MTMM matrices in Scenario 1, perceptual assets are measured using ADV in each case, and
intellectual assets are measured using SGA, SGA – ADV, or SGA – R&D. Scenario 2 also includes three matrices in
which intellectual assets are always measured using ADV, and perceptual assets use the three SGA-based metrics.
91
Table 8: Construct Validation for Marketing Assets
a. MTMM 5 results
Method 1
(Income statement from
Compustat)
Method 2
(Balance sheet from
Compustat)
MTMM 5 (suitability of SGA to measure
intellectual assets)
Trait 1
(Perceptual
assets)
Trait 2
(Intellectual
assets)
Trait 1
(Perceptual
assets)
Trait 2
(Intellectual
assets)
ADV SGA Goodwill
Other
intangible
assets
Method
1
Trait 1 ADV 1
Trait 2 SGA .56** 1
Method
2
Trait 1 Goodwill .33** .42** 1
Trait 2 Other intangible assets .32** .42** .77** 1
b. Overview of results from MTMM matrices 5–7
Trait 1 Trait 2
MTMM 5 ADV SGA
Convergent validity .33**
.42**
Discriminant validity
1st condition
2nd condition
.33 > .32 X .42 > .32
.33 < .42 .42 ≈ .42
.33 < .77 X .42 < .56 X
.33 < .56 .42 < .77
MTMM 6 ADV SGA – ADV
Convergent validity .33**
.40**
Discriminant validity
1st condition
2nd condition
.33 > .32 X .40 = .40 X
.33 < .40 .40 > .32
.33 < .77 X .40 < .43 X
.33 < .43 .40 < .77
MTMM 7 ADV SGA – R&D
Convergent validity .33**
.41**
Discriminant validity
1st condition
2nd condition
.33 > .32 X .41 < .47 X
.33 < .47 .41 > .32
.33 < .77 X .41 < .42 X
.33 < .42 .41 < .77
Notes: None of the measures from the income statement are good measures of marketing assets. This
finding is consistent even if measures were switched, such that ADV measured intellectual assets and
SGA measured perceptual assets. The sample size of this analysis is 424 data points, because we excluded
observations with zero or missing values for other intangible assets.
**p < .01 (two-tailed).

92
Construct Validity of Sales Force Spending. Sources of data on sales force spending
usually do not split this construct into multiple traits, which makes it difficult to apply an MTMM
approach to validate this construct. We rely instead on simple bivariate correlations, which
“describe the degree of relationship between two variables” (Nunnally 1978, p. 121). Correlations
of the number of salespeople with ADV (−.09), measured media spending (−.01), and estimated
unmeasured spending (.06) are statistically non-significant (see Table 4, Panel b). However, its
correlation with SGA is positive and statistically significant. This correlation even increases
when we exclude R&D and ADV from SGA. Thus SGA and its modifications, especially SGA –
ADV – R&D, seem to represent sales force spending relatively well.
Robustness Checks
We conducted several checks to test the robustness of our results. First, the MTMM
methodology relies on arithmetic differences in the magnitudes of the correlation coefficients.
One might question the statistical significance of these differences. Using a method proposed by
Steiger (1980), we thus test for the statistical equality or inequality of correlation coefficients. To
check equality, we considered pairs of correlation coefficients in which two pairs share one
variable in common (Steiger 1980). These correlation coefficients were converted into z-scores,
using Fisher's r-to-z transformation, which we applied to compute the asymptotic covariance of
the estimates. These quantities were then used in an asymptotic z-test. The results for marketing
spending from Sample 1 indicate that ADV and SGA are not equally correlated with measured
media spending (z = 11.02, p < .01) or estimated unmeasured spending (z = 8.24, p < .01). In
addition, ADV and the various modifications of SGA were not equally correlated with measured
media spending or estimated unmeasured spending. Considering their pairwise correlation
coefficients, ADV appears to be an appropriate measure for marketing spending, but SGA and its
modifications are not. The results for sales force spending from Sample 2 further indicate that
93
ADV and SGA are not equally correlated with salespeople (z = 5.58, p < .01); ADV and the
various modifications of SGA are not equally correlated with salespeople either. The pairwise
correlation coefficients suggest that SGA – ADV – R&D represents sales force expenses well.
Second, we had removed extreme outliers from our samples (i.e., values above or below
three times the interquartile range; Dattero, White, and Janson 1991). To check whether retaining
the outliers would have led to different conclusions, we re-estimated all the MTMM matrices and
bivariate correlations with the full data set of 494 observations for Sample 1 and 158 observations
for Sample 2. The results remained substantively similar. Another argument suggests that even
moderate outliers might bias the conclusions, so we also re-estimated the matrices and bivariate
correlations after removing the moderate outliers (i.e., 1.5 times the interquartile range). The
results, based on 443 observations for Sample 1 and 138 observations for Sample 2, again were
substantively similar.
Third, differences in companies’ performance might influence how well the metrics from
Compustat reflect various constructs. Therefore, we performed several median splits of our data
set, according to high and low values of the ratios of various variables of interest: SGA to sales,
ADV to sales, R&D to sales, goodwill to sales, other intangibles to sales, and assets to sales. The
results across both high and low groups for almost all these splits remain substantively similar to
those based on the entire data set and strongly support our initial MTMM findings (see Table 9).
Fourth, our data did not provide worldwide values for estimated unmeasured spending or
number of salespeople, so we had to impute these values, and the imputations might not capture
the true values. To check the robustness of these results, as we noted previously, we allowed for a
divergence of up to ±33% the calculated values. For both variables, we generated three additional
series, at 20%, 25%, and 33% divergence levels. For example, for estimated unmeasured
spending, we allowed the imputed values to vary randomly in either direction by 20%, which
94
produced the first series. Then we used this series in our analysis, to determine if the results
changed significantly. We repeated this exercise for 25% and 33%, for both variables. The results
were substantively similar.
Fifth and finally, in addition to our validity analysis, we considered the reasoning used in
prior studies to justify the use of SGA and its modifications to measure marketing constructs. A
high correlation between ADV and SGA is the most common justification, yet without
appropriate conceptual and empirical assessment, this reasoning is not based on sound logic.
Table 10 provides an overview of correlations between SGA and some of its components,
available separately in the income statement. As this comparison shows, SGA is highly correlated
not only with ADV (.71) but also with other expenses, such as R&D (.66), rental expenses (.75),
and pension and retirement expenses (.67). It even is highly correlated with unrelated variables
reported in the income statement; for example, the correlation between SGA and the cost of
goods sold (COGS), which provides information about a company’s expenses for producing
goods and services, is .80. Going solely by the size of the correlations, if SGA is an appropriate
operationalization for advertising spending, it would be an even better operationalization of rental
expenses or COGS. These variables have little conceptual overlap with SGA though. Even if
these components were removed from SGA, the remainder still correlates highly with these
components. Thus, SGA cannot be considered an adequate proxy for every item represented by
its 29 components.
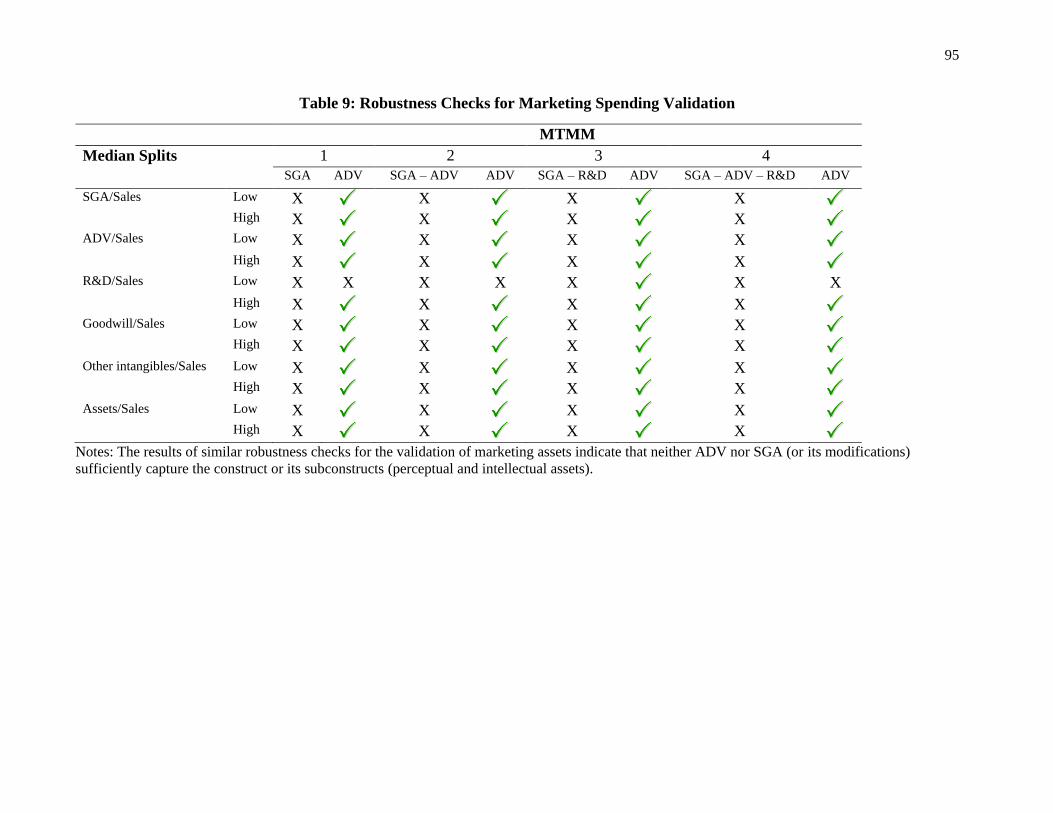
95
Table 9: Robustness Checks for Marketing Spending Validation
MTMM
Median Splits 1 2 3 4
SGA ADV SGA – ADV ADV SGA – R&D ADV SGA – ADV – R&D ADV
SGA/Sales Low X
X
X
X
High X
X
X
X
ADV/Sales Low X
X
X
X
High X
X
X
X
R&D/Sales Low X X X X X
X X
High X
X
X
X
Goodwill/Sales Low X
X
X
X
High X
X
X
X
Other intangibles/Sales Low X
X
X
X
High X
X
X
X
Assets/Sales Low X
X
X
X
High X
X
X
X
Notes: The results of similar robustness checks for the validation of marketing assets indicate that neither ADV nor SGA (or its modifications)
sufficiently capture the construct or its subconstructs (perceptual and intellectual assets).
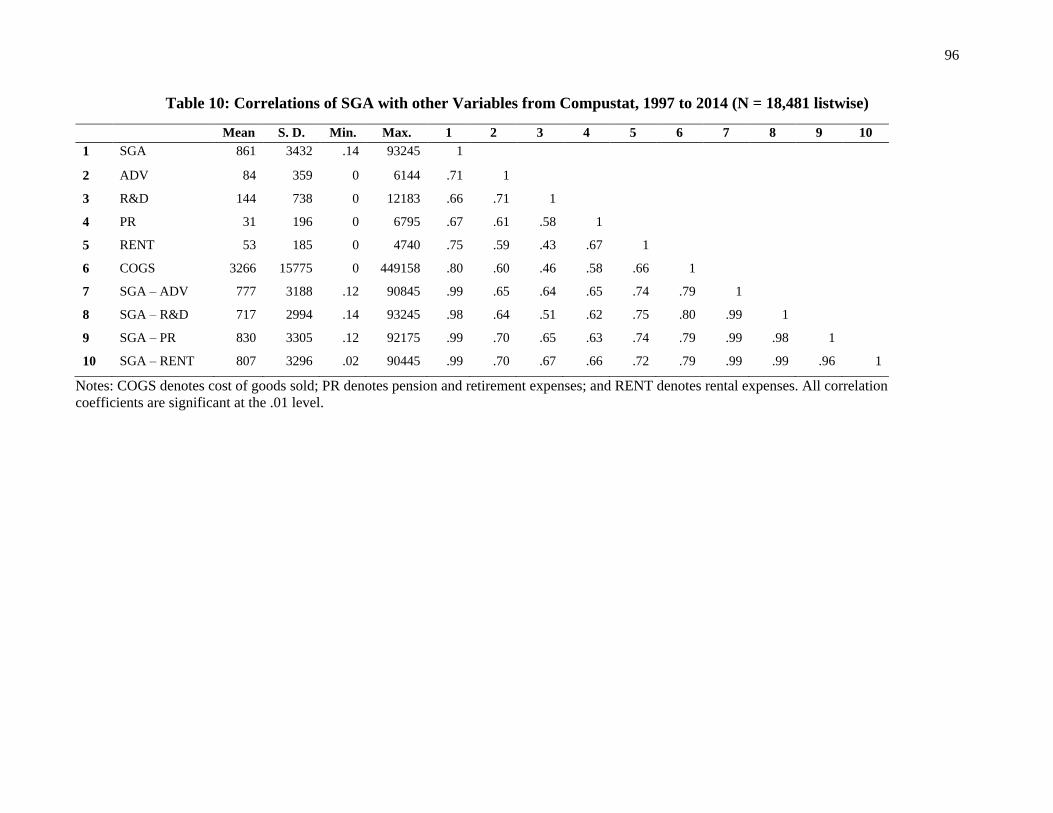
96
Table 10: Correlations of SGA with other Variables from Compustat, 1997 to 2014 (N = 18,481 listwise)
Mean S. D. Min. Max. 1 2 3 4 5 6 7 8 9 10
1 SGA 861 3432 .14 93245 1
2 ADV 84 359 0 6144 .71 1
3 R&D 144 738 0 12183 .66 .71 1
4 PR 31 196 0 6795 .67 .61 .58 1
5 RENT 53 185 0 4740 .75 .59 .43 .67 1
6 COGS 3266 15775 0 449158 .80 .60 .46 .58 .66 1
7 SGA – ADV 777 3188 .12 90845 .99 .65 .64 .65 .74 .79 1
8 SGA – R&D 717 2994 .14 93245 .98 .64 .51 .62 .75 .80 .99 1
9 SGA – PR 830 3305 .12 92175 .99 .70 .65 .63 .74 .79 .99 .98 1
10 SGA – RENT 807 3296 .02 90445 .99 .70 .67 .66 .72 .79 .99 .99 .96 1
Notes: COGS denotes cost of goods sold; PR denotes pension and retirement expenses; and RENT denotes rental expenses. All correlation
coefficients are significant at the .01 level.

97
DISCUSSION
A broad literature review of marketing and management journals reveals that SGA from
Compustat has been used to operationalize several marketing- and sales-related constructs. This
widespread, inconsistent use of SGA points to potential problems related to an inadequate
conceptualization and operationalization. With a measurement validation approach, we seek to
assess the level of congruence between the constructs and measures, using data from Compustat,
Advertising Age, and Selling Power.
Although a conscientious conceptualization is a prerequisite of construct validation,
research studies that rely on SGA frequently overlook this crucial step. Such gaps arise in other
areas of research too; for example, nine of ten studies of marketing performance fail to provide
clear conceptual definitions before attempting their operationalizations (Katsikeas et al. 2016).
Operationalization without proper conceptualization can result in over- or underestimates of the
effects of the focal constructs. The inconsistent use of SGA across multiple constructs also
challenges the validity of their estimated effect sizes. Identical operationalizations of different
constructs imply that the attribution of estimated effects to specific constructs may be erroneous
and lead to inaccurate managerial implications that hinder decision-making effectiveness. For
example, an erroneous allocation of budgets to marketing and sales activities could hinder the
effective use of various marketing and sales levers to improve firm performance.
Our empirical analysis shows that SGA is inadequate for a number of constructs that it is
commonly used to operationalize. Although a focal construct, marketing spending, is
conceptually aligned with SGA, our empirical results show that SGA and its modifications are
not valid operationalizations of marketing spending or its subconstructs. Marketing-related cash
outflows are only a small component of SGA. Thus, studies using SGA to measure marketing
98
communication spending or its subconstructs might have inferred incorrect influences of these
expenditures. Our results suggest that ADV from Compustat, which is equally easily available, is
a satisfactory measure of advertising spending and at least a partial measure of total marketing
spending. Furthermore, SGA is ill-suited to measure complex constructs such as marketing
capabilities, which instead require multidimensional, latent variable approaches to capture the
transformation of cash outflows into competitive advantages.
Regarding marketing assets, our conceptual and empirical results indicate that neither
ADV nor SGA (or any of its modifications) is satisfactory. Goodwill and other intangible assets,
two variables equally easily available from Compustat, are better measures. For sales force
spending, the results provide evidence of a strong overlap between the benchmark measure,
number of sales force employees, and SGA-based metrics, especially SGA – ADV – R&D.
Therefore, SGA appears valid for measuring sales force spending, in line with the general nature
of selling, general, and administrative cash outflows. The proportion of sales expenses, in terms
of commissions and salaries, constitutes a large component of SGA. Beyond validation, the
results affirm the expected distinction between marketing and sales constructs. Sales force
spending does not have a significant overlap with advertising or promotion spending, which are
key components of marketing communication spending. Thus, SGA is not an appropriate
operationalization for marketing and sales at the same time. We summarize the construct and
measure fits in Figure 5.
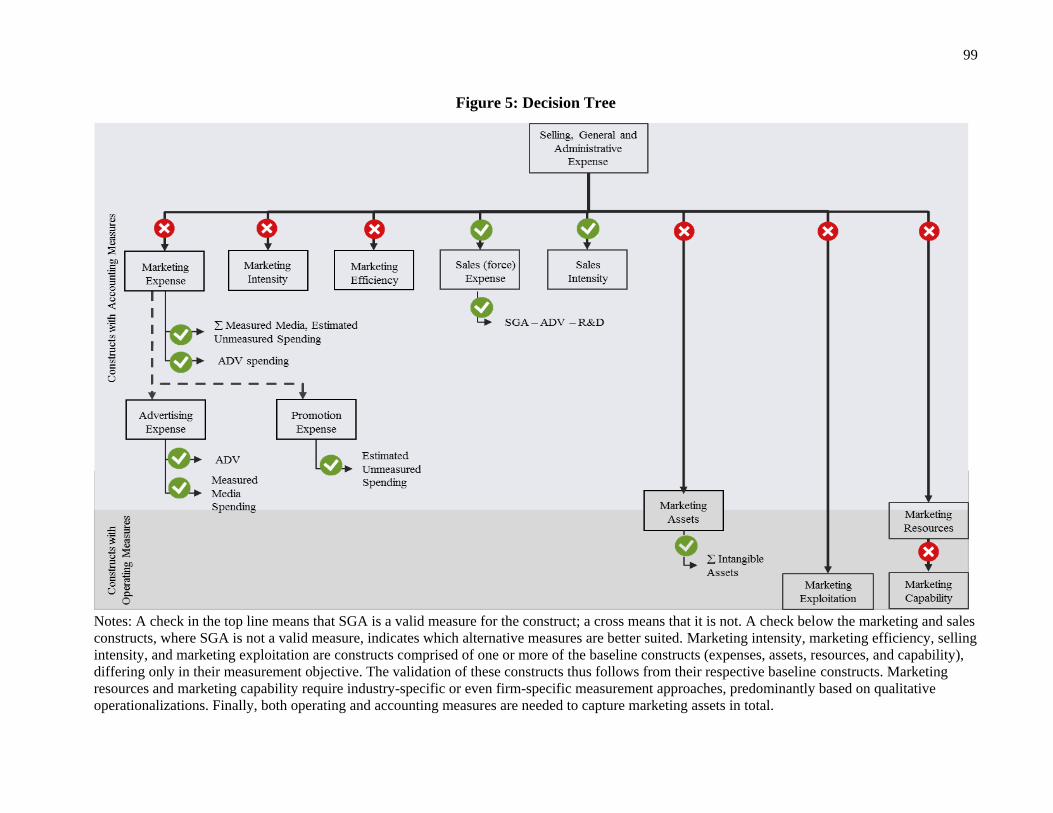
99
Figure 5: Decision Tree
Notes: A check in the top line means that SGA is a valid measure for the construct; a cross means that it is not. A check below the marketing and sales
constructs, where SGA is not a valid measure, indicates which alternative measures are better suited. Marketing intensity, marketing efficiency, selling
intensity, and marketing exploitation are constructs comprised of one or more of the baseline constructs (expenses, assets, resources, and capability),
differing only in their measurement objective. The validation of these constructs thus follows from their respective baseline constructs. Marketing
resources and marketing capability require industry-specific or even firm-specific measurement approaches, predominantly based on qualitative
operationalizations. Finally, both operating and accounting measures are needed to capture marketing assets in total.
100
Guidelines for Using SGA
From our theoretical and empirical analysis, we derive guidelines for researchers
interested in using SGA to operationalize marketing and sales constructs. These guidelines can
help build coherent knowledge about the conceptualization of constructs in general and their
operationalization using SGA in particular.
Ascertain Conceptual Congruence between Construct and Measure. Our review of
marketing and management literature reveals frequent subpar construct definitions. Studies often
fail to define or delineate constructs before operationalizing them, often based solely on cross-
references or contextual examples. The use of ambiguous definitions (i.e., defining a construct as
a consequence or cause of other concepts and constructs) or pseudo-definitions (i.e., specifying a
construct merely with an enumeration of examples) can lead to misspecifications (MacKenzie
2003). Imprecise or insufficient specification of the construct domain and content also may lead
to their over- or underestimation, causing potential errors in the effect estimates due to
incongruence between the construct and the measurement variable. This problem also makes the
results incomparable across studies and inhibits their synthesis, which is critical for cumulative
knowledge building (Katsikeas et al. 2016). Both the complexity of a construct and the required
adequacy of the measure to fit that complexity should be taken into account and be reflected in
the measurement variable. Any dissonance can severely bias the estimation results and their
inferences. Researchers thus would do well to derive precise definitions, embedding their focal
constructs into a broader (organizational) context. Then they can develop evaluative frameworks
to assess the validation of constructs on conceptual and operational levels. Such frameworks help
reveal which facets of a construct should be considered when choosing variables for its
operationalization in empirical research.

101
Avoid Using SGA as an All-Encompassing Measure and Test Immediately for Construct
Validity. Many of the 29 cash outflow items that occur over the regular course of business and
constitute SGA have little direct link to marketing functions. At a conceptual level, using SGA as
a measure of a construct reduces the multifaceted variable to one component; at an operational
level though, it necessarily remains an aggregate of 29 different items. This clear discrepancy
somehow takes a backseat when researchers use SGA or one of its modifications as an all-
encompassing measure for so many distinct constructs. Still, our results suggest that SGA can be
adapted to match some constructs relatively well, by removing certain outflow items such as
ADV and R&D. The removal of unrelated cash outflow items increases the variance explained
and can reduce estimation errors related to the focal construct. Even in this case, SGA and its
modifications should be tested for validity with respect to a benchmark variable before being
used to operationalize a construct. The benchmark variable can be obtained from a distinct data
source that provides relatively purer and unbiased information, sometimes even from Compustat
itself. For example, a benchmark variable that measures marketing assets already is available in
the balance sheet.
Avoid Justifications Based on Unavailable Data by Considering Alternative Sources.
Compustat in general and SGA in particular are popular sources, because of their clear
advantages: easy availability and cross-industry, firm-specific data across several time periods.
However, scholars cannot ignore their limitations. The variables are too broad to provide precise
measures, so they introduce measurement error, potential model misspecification, and biased
estimates. To suggest SGA is adequate for construct operationalization solely because valid
measures are not available is not appropriate or accordant with a measurement philosophy that
seeks to reduce errors and obtain precise estimates. Following precedents of inadequate
operationalizations in existing research simply passes on the measurement biases from one study

102
to the next. Instead, researchers should either redefine the construct, to bring it more in line with
available measures, or obtain an adequate measure from other data sources that provide less noisy
variables and better capture the focal construct. Either approach is preferable to forcing an
inadequate variable on a construct with which it is not sufficiently aligned. Admittedly, these
approaches may reduce sample sizes; compared with Compustat, the alternative sources such as
Advertising Age and Selling Power are limited in their coverage. However, their measures can
explain more of the variance of the focal construct, which leads to more precise measurements.
Overall, we believe that SGA has been utilized too liberally in marketing. Of course, researchers
always trade off the number of observations against the precision and quality of the measures
employed, based on their research goals. As we show though, for several marketing-related
constructs, more valid measures may be available within Compustat.
Following these guidelines can help improve measurement validity, on conceptual and
operational levels. Current literature is characterized by different operationalizations for the same
construct, as well as the same operationalization for different constructs. Our proposed guidelines
may help researchers determine the appropriateness of measures for underlying constructs, which
would improve conceptual completeness, operational consistency, estimations of true effect sizes,
and comparisons and replications of results. Overall, this study is a first step toward establishing
common knowledge about the use of accounting-based variables in marketing research.
Considering the critical importance of marketing and sales force–related decisions, this
study has implications for managers too. Marketing spending is a small component of SGA, so
decisions based on its use as a measure might lead to inappropriate marketing strategies and
misdirected budget allocations. The use of proper measures will provide true effect sizes and help
assess crucial performance indicators that provide a basis for strategic decisions. By using proper
measures, managers can better allocate their budgets and justify their decisions. They also gain a
103
reliable approach for benchmarking their performance, according to appropriately aligned
measures.
Limitations and Further Research
Although this research contributes to an enhanced understanding of the use of SGA-based
metrics to measure marketing and sales constructs, our empirical analysis features a few
limitations that suggest avenues for further study. First, our data come from multiple industries,
but we did not consider potential industry-specific differences. Compustat reveals some
differences in the composition of items included in SGA for specific industries. Continued
research could explore these differences, in terms of the construct validity across industries.
Studies that classify operating constructs using industry-specific characteristics would also enrich
fundamental marketing knowledge. Second, our study highlights several performance-related
constructs, such as capabilities and marketing exploitation that remain under-researched and
insufficiently defined, in terms of their conceptualization and operationalization. We confined our
study to baseline constructs and their accounting-based measures, but further research should
define more complex constructs and derive valid operationalizations for them. Third, the common
use of accounting data sources by marketing researchers suggests the need to build more
knowledge at the interface of these two domains. Variables from accounting need to be linked
clearly with marketing constructs. For example, coordination spending is a manifest construct
applied in marketing, but it is not consistently derived from Compustat. Additional research
might build on our approach to establish guidelines for establishing strong reasoning to support
such constructs and improve the consistency of their measurement. Fourth, we relied on an
MTMM approach for our empirical validation. This approach has some limitations though
including absence of clear standards to determine when a particular criterion has been met.

104
REFERENCES
Advertising Age (2016a), “Methodology for 200 Leading National Advertisers, 2016 ed.,”
(accessed July 6, 2016), [available at http://adage.com/article/datacenter/methodology-200-
leading-national-advertisers-2016-ed/304581/].
——— (2016b), “About Global Marketers 2015,” (accessed August 18, 2016), [available at
http://adage.com/datacenter/globalmarketers2015/].
Ambler, Tim, Flora Kokkinaki, Stefano Puntoni, and Debra Riley (2001), “Assesing Market
Performance: The Current State of Metrics,” Working Paper, 1–68.
Balsam, Steven, Guy D. Fernando, and Arindam Tripathy (2011), “The Impact of Firm Strategy
on Performance Measures Used in Executive Compensation,” Journal of Business Research,
64 (2), 187–93.
Barney, Jay (1991), “Firm Resources and Sustained Competitive Advantage,” Journal of
Management, 17 (1), 99–120.
——— and A. Arikan (2001), “The Resource-Based View: Origins and Implications,” in
Handbook of Strategic Management, M. Hitt, R. Freeman, and J. Harrison, eds., Oxford,
UK: Blackwell, 124–85.
Bharadwaj, Sundar G., Kapil R. Tuli, and Andre Bonfrer (2011), “The Impact of Brand Quality
on Shareholder Wealth,” Journal of Marketing, 75 (September), 88–104.
Bragg, Steven M. (2010), Cost Reduction Analysis: Tools and Strategies, (S. M. Bragg, ed.),
Hoboken, New Jersey: Wiley.
Brink, Douwe Van Den, Gaby Odekerken-Schröder, and Pieter Pauwels (2006), “The Effect of
Strategic and Tactical Cause-Related Marketing on Consumers’ Brand Loyalty,” Journal of
Consumer Marketing, 23 (1), 15–25.
Campbell, Donald T. and Donald W. Fiske (1962), “Convergent and Discriminant Validation by
the Multitrait-Multimethod Matrix,” Psychological Bulletin, 59 (2), 257–72.
Carton, Robert B. and Charles W. Hofer (2006), Measuring Organizational Performance, (R. B.
Carton and C. W. Hofer, eds.), Cheltenham: Edward Elgar.
Casadesus-Masanell, Ramon and Joan Enric Ricart (2010), “From Strategy to Business Models
and onto Tactics,” Long Range Planning, 43 (2–3), 195–215.
Churchill, Gilbert A., Jr. (1979), “A Paradigm for Developing Better Measures of Marketing
Constructs,” Journal of Marketing Research, 16 (1), 64–73.
Dattero, Ronald, Edna M. White, and Marius A. Janson (1991), “Methods for the Identification of
Data Outliers in Interactive SQL,” Journal of Database Administration, 2 (1), 7–18.
Day, G.S. (1994), “The Capabilities of Market-Driven Organizations,” Journal of Marketing, 58,
37–52.
DeVellis, Robert F. (2012), Scale Development, (R. F. DeVellis, ed.), SAGE Publications.
Dinner, Isaac M., Natalie Mizik, and Donald Lehmann (2009), “The Unappreciated Value of
105
Marketing: The Moderating Role of Changes in Marketing and R&D Spending on Valuation
of Earnings Reports,” Marketing Science Institute Special Report.
Dutta, Shantanu, Om Narasimhan, and Surendra Rajiv (1999), “Success in High-Technology
Markets: Is Marketing Capability Critical?,” Marketing Science, 18 (4), 547–68.
———, ———, and ——— (2005), “Conceptualizing and Measuring Capabilities:
Methodology and Empirical Application,” Strategic Management Journal, 26 (3), 277–85.
Emory, William and Donald R. Cooper (1991), Business Research Methods, (W. Emory and D.
R. Cooper, eds.), Homewood: IRWIN.
Gentry, Richard J. and Wei Shen (2010), “The Relationship between Accounting and Market
Measures of Firm Financial Performance: How Strong Is It?,” Journal of Managerial Issues.
Hansen, Don R. (1990), Management Accounting, Boston: PWS-KENT Publishing Company.
Hatip, A. and R. Strehlau (2000), “Kennzahlen im operativen Marketing Controlling,” in
Handbuch Marketing Controlling, M. P. Zerres, ed., Berlin et al.: Gabler, 251–65.
Heeler, Roger M. and Michael L. Ray (1972), “Measure Validation in Marketing,” Journal of
Marketing Research, 9 (4), 361–70.
Himme, Alexander (2009), “Gütekriterien der Messung: Reliabilität, Validität und
Generalisierbarkeit,” in Methodik der empirischen Forschung, S. Albers, D. Klapper, U.
Konradt, A. Walter, and J. Wolf, eds., Wiesbaden: Gabler, 485–500.
Katsikeas, Constantine S., Niel A. Morgan, Leonidas C. Leonidou, and G. Tomas M. Hult (2016),
“Assessing Performance Outcomes in Marketing,” Journal of Marketing, 80 (3), 1–20.
Kerlinger, Fred (1986), Foundations of Behavioral Research, (F. Kerlinger, ed.), Forth Worth:
Harcourt Brace Jovanovich.
Kotler, Philip and Neil Rackham (2006), “Ending the War Between Sales and Marketing,”
Harvard Business Review, 84 (4), 1–14.
Kozlenkova, Irina V., Stephen A. Samaha, and Robert W. Palmatier (2014), “Resource-Based
Theory in Marketing,” Journal of the Academy of Marketing Science, 42 (1), 1–21.
Krishnan, Hema A., Raghu Tadepalli, and Daewoo Park (2009), “R&D Intensity, Marketing
Intensity, and Organizational Performance,” Journal of Managerial Issues, 21 (2), 232–44.
Kristandl, Gerhard and Nick Bontis (2007), “Constructing a Definition for Intangibles Using the
Resource based View of the Firm,” Management Decision, 45 (9), 1510–24.
Kumar, V. (2016), “My Reflections on Publishing in Journal of Marketing,” Journal of
Marketing, 80 (1), 1–6.
Kurt, Didem and John Hulland (2013), “Aggressive Marketing Strategy Following Equity
Offerings and Firm Value: The Role of Relative Strategic Flexibility,” Journal of Marketing,
77 (9), 57–74.
Lin, Chinho, Hua-Ling Tsai, and Ju-Chuan Wu (2014), “Collaboration Strategy Decision-Making
Using the Miles and Snow Typology,” Journal of Business Research, 67 (9), 1979–90.

106
Luo, Xueming (2008), “When Marketing Strategy First Meets Wall Street: Marketing Spendings
and Firms’ Initial Public Offerings,” Journal of Marketing, 72 (4), 98–109.
Luo, Yadong, John Hongxin Zhao, and Jianjun Du (2005), “The Internationalization Speed of E-
Commerce Companies: An Empirical Analysis,” International Marketing Review, 22 (6),
693–709.
MacKenzie, Scott B. (2003), “The Dangers of Poor Construct Conceptualization,” Journal of the
Academy of Marketing Science, 31 (3), 323–26.
March, James G. (1991), “Exploration and Exploitation in Organizational Learning,”
Organization Science, 2 (1), 71–87.
MSI (2016), “2014-2016 Research Priorities,” (accessed May 5, 2016), [available at
http://www.msi.org/research/2014-2016-research-priorities/].
Narasimhan, Om, Surendra Rajiv, and Shantanu Dutta (2006), “Absorptive Capacity in High-
Technology Markets: The Competitive Advantage of the Haves,” Marketing Science, 25 (5),
510–24.
Nath, Prithwiraj, Subramanian Nachiappan, and Ramakrishnan Ramanathan (2010), “The Impact
of Marketing Capability, Operations Capability and Diversification Strategy on
Performance: A Resource-Based View,” Industrial Marketing Management, 39 (2), 317–29.
Nunnally, Jum C. (1978), Psychometric Theory, (R. R. Wright and M. Gardner, eds.), New York:
McGraw-Hill.
Peter, J. Paul (1981), “Construct Validity: A Review of Basic Issues and Marketing Practices,”
Journal of Marketing Research, 18 (2), 133–45.
Porter, M. E., & Millar, V. E. (1985). How Information Gives you Competitive Advantage.
Harvard Business Review, 63(4), 149–160.
Rust, Roland T., Tim Ambler, Gregory S. Carpenter, V. Kumar, and Rajendra K Srivastava
(2004), “Measuring Marketing Productivity: Current Knowledge and Future Directions,”
Journal of Marketing, 68 (10), 76–89.
Sarkees, Matthew, John Hulland, and Rabikar Chatterjee (2014), “Investments in Exploitation
and Exploration Capabilities: Balance Versus Focus,” Journal of Marketing Theory and
Practice, 22 (1), 7–23.
Selling Power (2016), “Selling Power 500 Largest Sales Forces,” (accessed September 23, 2016),
[available at http://www.sellingpower.com/content/article/index.php?a=10505/selling-
power-500/largest-sales-forces/2015&page=1].
Schwertman, Neil C., Margaret Ann Owens, and Robiah Adnan (2004), “A Simple More General
Boxplot Method for Identifying Outliers,” Computational Statistics and Data Analysis, 47
(1), 165–74.
Shapiro, Carl (1989), “The Theory of Business Strategy,” The RAND Journal of Economics, 20
(1), 125–37.
Standard and Poor (2013), “Standard and Poor’s Comupstat User’s Guide,” (accessed January 27,
107
2014), [available at http://www.batd.eu/debodt/downloads/compustat_user_all.pdf].
Steiger, J. H. (1980), “Tests for Comparing Elements of a Correlation Matrix,” Psychological
Bulletin, 245–51.
van Triest, Sander, Maurice J. G. Bun, Erik M. van Raaij, and Maarten J.A. Vernooij (2009),
“The Impact of Customer-Specific Marketing Expenses on Customer Retention and
Customer Profitability,” Marketing Letters, 20, 125–38.
Tukey, John W. (1977), Exploratory Data Analysis, (J. W. Tukey, ed.), Pearson.
Varadarajan, Rajan (2010), “Strategic Marketing and Marketing Strategy: Domain, Definition,
Fundamental Issues and Foundational Premises,” Journal of the Academy of Marketing
Science, 38 (2), 119–40.
Viswanathan, Madhu (2005), Measurement Error and Research Design, Thousand Oaks: SAGE
Publications.
Vorhies, Douglas W., Linda M. Orr, and Victoria D. Bush (2011), “Improving Customer-Focused
Marketing Capabilities and Firm Financial Performance via Marketing Exploration and
Exploitation,” Journal of the Academy of Marketing Science, 39 (5), 736–56.
Wharton (2016), “Fundamental Annuals Data List,” (accessed November 24, 2016), [available at
https://wrds- web.wharton.upenn.edu/wrds/ds/compm/funda/index.cfm?navId=84].
108
APPENDIX
Appendix 1: Uses of SGA Expenses in Marketing and Management Literature (1995–2016)
Concept/Construct Operationalization Authors
Marketing
investments/assets
SGA Balsam, Fernando, and Tripathy 2011
Banker, Mashruwala, and Tripathy 2014
Borah and Tellis 2014
Kotha, Rajgopal, and Rindova 2001
Hornig and Fischer 2013
SGA – R&D
SGA; ADV
Lee and Chang 2014
Hornig and Fischer 2013
Marketing expense SGA Bentley, Omer, and Sharp 2012 (Denominator:
Sales)
Dinner 2011
Dutta, Narasimhan, and Rajiv 1999, 2005
Sarkees, Hulland, and Chatterjee 2014
Corona 2009, 2014
Cook, Maulth, and Spaeth 2007
Habib 2017
Higgins, Omer, and Phillips 2015
Nam and Kannan 2014
Narasimhan, Rajiv, and Dutta 2006
Nath, Nachiappan, and Ramanathan 2010 (as one
operationalization variable)
Raassens, Wuyts, and Geyskens 2014
(Denominator: Assets)
Snyder 2009
Swaminathan and Moorman 2009
Kalaignanam et al. 2013
SGA – R&D Dinner, Mizik, and Lehmann 2009
Luo 2008
Kurt and Hulland 2013
Bharadwaj, Tuli, and Bonfrer 2011
Shin, Sakakibara, and Hanssens 2008
Sales (force)
expense
SGA Koku 2011
Kumar 1999
Wuyts, Dutta, and Stremersch 2004
Mhatre, Joo, and Lee 2014
Achrol and Seo 2011
Lin, Lee, and Hung 2006
Sarkees and Luchs 2011
SGA – ADV – R&D Kim and McAlister 2011
109
SGA expense SGA Achrol 2012
Ailawadi, Borin, and Farris 1995
Bayus, Erickson, and Jacobson 2003
Bell and Gordon 1999
Boulding and Christen 2008
Efendi et al. 2013
Foster and Gupta 1994
Huang, Seow, and Shangguan 2011
Kalwani and Narayandas 1995
Moorman, Du, and Mela 2005
Mottner and Smith 2009
Poston and Grabski 2001
Rangan and Bell 1998
Rego, Morgan, and Fornell 2013
Rust and Huang 2012
Advertising expense SGA Collins and Han 2004
Demerjian, Lev, and McVay 2012
Ding, Stolowy, and Tenenhaus 2007
Wiles 2007
Promotional expense SGA Vinod and Rao 2000
Marketing and
admn. expense
SGA Lévesque, Jogleklar, and Davies 2012
Sales and general
expense
SGA Mittal et al. 2005
Discretionary
expense
SGA + ADV + R&D Ho, Liu, and Ouyang 2012
Marketing capability SGA Bahadir, Bharadwaj, and Srivastava 2008
Patwardhan 2014
Cheng et al. 2008
Lee and Rugman 2011
Luo, Zhao, and Du 2005
Rugman and Sukpanich 2006
SGA – R&D Darroch and Miles 2011
Sales capability SGA Boyd and Brown 2012
Marketing resource SGA Cook, Moult, and Spaeth 2007 (Denominator:
Sales)
Marketing resource
intensity
SGA – R&D Raassens, Wuyts, and Geyskens 2014
(Denominator: Assets)
Marketing intensity SGA Krishnan, Tadepalli, and Park 2009
(Denominator: Sales)
SGA – R&D Raithel et al. 2012 (Denominator: Assets)

110
Dinner, Mizik, and Lehmann 2009 (Denominator:
Assets)
Mizik and Jacobson 2007 (Denominator: Assets)
Mizik 2010 (Denominator: Assets)
Sales intensity SGA Nair and Selover 2012 (Denominator: Sales)
Advertising intensity SGA Grubaugh 1987 (Denominator: Sales)
Marketing efficiency SGA Cook, Moult, and Spaeth 2007 (Denominator:
Sales)
Lin, Tsai, and Wu 2014 (Denominator: Sales)
SGA; ADV Morgan and Rego 2009 (Denominator: Sales)
Marketing
exploitation
SGA Sarkees, Hulland, and Chatterjee 2014
(Numerator: Sales)
Bentley, Omer, and Sharp 2013 (Denominator:
Sales)
Coordination
expense
SGA
SGA – R&D
Lee et al. 2014
Im, Grover, and Teng 2013
Fixed expense SGA Bruton, Keels, and Scifres 2002
Gaspar and Massa 2006

111
Appendix 2: Classification of 29 Items in SGA, according to Porter’s Value Chain Activities
Porter’s Value Chain Activity and Relevant SGA Items Average
Proportion of
SGA
Primary Activities
Inbound logisticsa
Operations
1. Operating expenses when a separate Cost of Goods Sold figure is
given and no Selling, General, and Administrative Expense figure is
reported
2. Research and development expense
3. Amortization of research and development costs
4. Research and development companies’ company-sponsored research
and development
Outbound logistics
5. Delivery expenses
6. Freight-out expense
Marketing and sales
7. Advertising expense
8. Commissions
9. Marketing expense
Servicea
16.69% (R&D
expense)
9.64% (advertising
expense)
Support Activities
Procurementa
Human resource management
10. Directors’ fees and remuneration
11. Financial service industries’ labor, occupancy and equipment, and
related expenses
12. Labor and related expenses (including salary, pension, retirement,
profit sharing, provision for bonus and stock options, employee
insurance, and other employee benefits when reported below a gross
profit figure)
13. Severance pay (when reported as a component of Selling, General
and Administrative Expenses)
14. Stock-based compensation when reported below a gross profit figure
Technological development
15. Engineering expense
Infrastructure
16. Accounting expense
17. Bad debt expense (provision for doubtful accounts)
18. Corporate expense
19. Foreign currency adjustments when included by the company
20. Indirect costs when a separate Cost of Goods Sold figure is given
21. Legal expense
22. Parent company charges for administrative services
23. Recovery of allowance for losses

112
24. State income tax when included by the company
25. Research revenue that is less than 50% of total revenues for 2 years
26. Strike expense
27. Extractive industries’ lease rentals or expense, delay rentals,
exploration expense, research and development expense, and
geological and geophysical expenses, drilling program marketing
expenses, and carrying charges on nonproducing properties
28. Restaurants’ preopening and closing costs
29. Retail companies’ preopening and closing costs and rent expense
4.29% (deferred
charges)
6.18% (rental
expense)
Notes: The average proportion of SGA is based on Compustat data from 1997–2014. Item-specific
supplementary information is available only for some items in Compustat, so we provide specific numbers
only for available items. aSGA contains no item that is relevant to this activity.
113
Appendix 3: Concepts, Constructs, and Variables
As noted in the main text, the differences among a concept, a construct, and a variable are
critical. A concept is “a bundle of meanings or characteristics associated with certain events,
objects, conditions, situations” (Emory and Cooper 1991 p. 51). A construct, which is relatively
more complex, is “an image or idea specifically invented for a given research and/or theory-
building purpose” (Emory and Cooper 1991, p. 51). Constructs combine two or more simple
concepts, especially if the idea or image intended “to convey is not directly subject to
observation” (Emory and Cooper 1991, p. 51). Precise definitions help clarify and measure both
concepts and constructs. Good definitions in turn must meet the criteria of specificity, clarity,
consistency, and distinctiveness (MacKenzie 2003). Specificity requires that the construct be
defined in “a sufficiently precise manner” (MacInnis 2011, p. 141). Clarity indicates that the
definition is unambiguous. Consistency and distinctiveness demand that the definition is aligned
with prior research and clearly separated from other constructs (MacKenzie 2003). However,
“there are few empirical referents by which to confirm that an operational definition really
measures what we hope it does,” such that “when measurements by two different definitions
correlate well, it supports the view that they are measuring the same concept” (Emory and
Cooper 1991, p. 54). Measurements by two different definitions do not correlate well if one or
both of them is not a true identifier or if different partial meanings of the concepts are being
measured (Emory and Cooper 1991). This caution holds for both concepts and constructs.
Although concepts and constructs are not sharply demarcated and are often used
interchangeably, they both differ markedly from variables. Concepts and constructs operate at the
theoretical level; variables operate at an empirical level. A variable “is a symbol to which
numerals or values are assigned” (Kerlinger 1986 p. 27 cf. Emory and Cooper 1991). Variables
can be manifest and thus directly observable or latent and hypothetical, such that they must be

114
approximated by manifest variables (Whiteley and Kite 2013). The measurement of constructs
that rely on latent variables thus may suffer from some measurement error due to the
approximation (DeVellis 2012). It is noteworthy that multiple labels may be used in different
contexts to refer to the same entity. As we noted in the main text, when it is referred to as a
construct, SGA conveys a broader sense of operating expenses measured by several manifest
variables. But when it is referred to as a variable, it represents a measure within Compustat that is
manifest in nature and applied to approximate, either partly or fully, one or more constructs.
115
APPENDIX REFERENCES
Achrol, Ravi S. (2012), “Slotting Allowances: A Time Series Analysis of Aggregate Effects
Over Three Decades,” Journal of the Academy of Marketing Science, 40 (5), 673–94.
——— and Joo Hwan Seo (2011), “Marketing Channel Theory and Slotting Allowances: An
Empirical Analysis Using Quantile Regression,” American Marketing Association
Conference Proceedings, 22, 286–95.
Ailawadi, Kusum L., Norm Borin, and Paul W. Farris (1995), “Market Power and
Performance: A Cross-Industry Analysis of Manufacturers and Retailers,” Journal of
Retailing, 71 (3), 211–48.
Bahadir, S. Cem, Sundar G. Bharadwaj, and Rajendra K. Srivastava (2008), “Financial Value
of Brands in Mergers and Acquisitions: Is Value in the Eye of the Beholder?,” Journal of
Marketing, 72 (6), 49–64.
Balsam, Steven, Guy D. Fernando, and Arindam Tripathy (2011), “The Impact of Firm
Strategy on Performance Measures Used in Executive Compensation,” Journal of
Business Research, 64 (2), 187–93.
Banker, Rajiv D., Raj Mashruwala, and Arindam Tripathy (2014), “Does a Differentiation
Strategy Lead to more Sustainable Financial Performance than a Cost Leadership
Strategy?,” Management Decision, 52 (5), 872–96.
Bayus, Barry L., Gary Erickson, and Robert Jacobson (2003), “The Financial Rewards of
New Product Introductions in the Personal Computer Industry,” Management Science,
49 (2), 197–210.
Bell, David E. and Dinny Starr Gordon (1999), “The King-Size Company,” Journal of
Interactive Marketing, 13 (I), 66–86.
Bentley, Kathleen A., Thomas C. Omer, and Nathan Y. Sharp (2012), “Business Strategy,
Financial Reporting Irregularities, and Audit Effort,” Working Paper, 1–59.
Bharadwaj, Sundar G., Kapil R. Tuli, and Andre Bonfrer (2011), “The Impact of Brand
Quality on Shareholder Wealth,” Journal of Marketing, 75 (September), 88–104.
Borah, Abhishek and Gerard J. Tellis (2014), “Make, Buy, or Ally? Choice of and Payoff
from Announcements of Alternate Strategies for Innovations,” Marketing Science, 33
(1), 114–33.
Boulding, William and Markus Christen (2008), “Disentangling Pioneering Cost Advantages
and Disadvantages,” Marketing Science, 27 (4), 699–716.
Boyd, D. Eric and Brian P. Brown (2012), “Marketing Control Rights and Their Distribution
Within Technology Licensing Agreements: A Real Options Perspective,” Journal of the
Academy of Marketing Science, 40 (5), 659–72.
Bruton, Garry D., J. Kay Keels, and Elton L. Scifres (2002), “Corporate Restructuring and
Performance: An Agency Perspective on the Complete Buyout Cycle,” Journal of
Business Research, 55 (9), 709–24.
Cheng, Meng-Yuh, Jer-Yan Lin, Tzy-Yih Hsiao, and Thomas W. Lin (2008), “Censoring
Model for Evaluating Intellectual Capital Value Drivers,” Journal of Intellectual Capital,
9 (4), 639–55.
116
Collins, Christopher J. and Jian Han (2004), “Exploring Applicant Pool Quantity and Quality:
The Effects of Early Recruitment Practice Strategies, Corporate Advertising, and Firm
Reputation,” Personnel Psychology, 57, 685–717.
Cook, Victor J., William Moult, and Jim Spaeth (2007), “Marketing Meets Finance,” Working
Paper, 1–48.
Corona, Ramon (2009), “Is Costco Better than Walmart? A Comparative Analysis based on
Enterprise Marketing Efficiency.”
——— (2014), “A Comparative Analysis of Major US Retailers based on Enterprise
Marketing Efficiency,” Global Journal of Business Research, 8 (4), 25–40.
Darroch, Jenny and Morgan P. Miles (2011), “A Research Note on Market Creation in the
Pharmaceutical Industry,” Journal of Business Research, 64 (7), 723–27.
Demerjian, Peter, Baruch Lev, and Sarah McVay (2012), “Quantifying Managerial Ability: A
New Measure and Validity Tests,” Management Science, 58 (7), 1229–48.
DeVellis, Robert F. (2012), Scale Development, (R. F. DeVellis, ed.), SAGE Publications.
Ding, Yuan, Hervé Stolowy, and Michel Tenenhaus (2007), “R&D Productivity: An
Exploratory International Study,” Review of Accounting and Finance, 6 (1), 86–101.
Dinner, Isaac M. (2011), “The Interpretation of Marketing Actions and Communications by
the Financial Markets,” Thesis, 1–152.
———, Natalie Mizik, and Donald Lehmann (2009), “The Unappreciated Value of
Marketing: The Moderating Role of Changes in Marketing and R & D Spending on
Valuation of Earnings Reports,” Marketing Science iIstitute Special Report.
Dutta, Shantanu, Om Narasimhan, and Surendra Rajiv (1999), “Success in High-Technology
Markets: Is Marketing Capability Critical?,” Marketing Science, 18 (4), 547–68.
———, ———, and ——— (2005), “Conceptualizing and Measuring Capabilities:
Methodology and Empirical Application,” Strategic Management Journal, 26 (3), 277–
85.
Efendi, Jap, Michael R. Kinney, Katherine Taken Smith, and L. Murphy Smith (2013),
“Marketing Supply Chain Using B2B Buy-Side E-Commerce Systems: Does Adoption
Impact Financial Performance,” Working Paper, 1–32.
Emory, William and Donald R. Cooper (1991), Business Research Methods, (W. Emory and
D. R. Cooper, eds.), Homewood: IRWIN.
Foster, George and Mahendra Gupta (1994), “Marketing , Cost Management and
Managenient Accounting,” Journal of Management Accounting Research, 6, 63–77.
Gaspar, José-Miguel and Massimo Massa (2006), “Idiosyncratic Volatility and Product
Market Competition,” The Journal of Business, 79 (6), 3125–52.
Grubaugh, Stephen G. (1987), “Determinants of Direct Foreign Investment,” The Review of
Economics and Statistics, 69 (1), 149–52.
Habib, Ahsan (2014), “Business Strategy, Overvalued Equities, and Stock Price Crash Risk.”
Higgins, Danielle, Thomas C. Omer, and John D. Phillips (2015), “The Influence of a Firm’s
Business Strategy on its Tax Aggressiveness,” Contemporary Accounting Research, 32
117
(2), 674–702.
Ho, Li-Chin Jennifer, Chao-Shin Liu, and Bo Ouyang (2012), “Bloated Balance Sheet,
Earnings Management, and Forecast Guidance,” Review of Accounting and Finance, 11
(2), 120–40.
Hornig, Tobias and Mark Fischer (2013), “Validating Financial Brand Equity Metrics: How
Useful Are Brand Valuation Methods?,” Dissertation Thesis, 103–56.
Huang, Rongbing, Gim S. Seow, and Joe Z. Shangguan (2011), “Intangible Investments and
the Pricing of Corporate SGA Expenses,” Journal of Business & Economic Studies, 17
(2), 67–77.
Im, Kun Shin, Varun Grover, and James T. C. Teng (2012), “Research Note - Do Large Firms
Become Smaller by Using Information Technology?,” Information Systems Research, 24
(2), 470–91.
Kalaignanam, K., T. Kushwaha, J.-B. E. M. Steenkamp, and K. R. Tuli (2013), “The Effect of
CRM Outsourcing on Shareholder Value: A Contingency Perspective,” Management
Science, 59 (3), 748–69.
Kalwani, Manohar U. and Narakesari Narayandas (1995), “Long-Term Manufacturer-
Supplier Relationships: Do They Pay off for Supplier Firms?,” Journal of Marketing, 59
(1), 1–16.
Kerlinger, Fred (1986), Foundations of Behavioral Research, (F. Kerlinger, ed.), Forth
Worth: Harcourt Brace Jovanovich.
Kim, Minchung and Leigh M. Mcalister (2011), “Stock Market Reaction to Unexpected
Growth in Marketing Expenditure: Negative for Sales Force, Contingent on Spending
Level for Advertising,” Journal of Marketing, 75 (7), 68–85.
Koku, Paul Sergius (2011), “On the Connection between R&D, Selling Expenditures, and
Profitability in the Pharmaceutical Industry Revisited,” Journal of Strategic Marketing,
19 (3), 273–83.
Kotha, Suresh, Shivaram Rajgopal, and Violina Rindova (2001), “Reputation Building and
Performance: An Empirical Analysis of the Top-50 Pure Internet Firms,” European
Management Journal, 19 (6), 571–86.
Krishnan, Hema A., Raghu Tadepalli, and Daewoo Park (2009), “R&D Intensity, Marketing
Intensity, and Organizational Performance,” Journal of Managerial Issues, 21 (2), 232–
44.
Kumar, Piyush (1999), “The Impact of Long-Term Client Relationships on the Performance
of Business Service Firms,” Journal of Service Research, 2 (4), 4–18.
Kurt, Didem and John Hulland (2013), “Aggressive Marketing Strategy Following Equity
Offerings and Firm Value: The Role of Relative Strategic Flexibility,” Journal of
Marketing, 77 (9), 57–74.
Lee, In Hyeock and Alan M. Rugman (2012), “Firm-Specific Advantages, Inward FDI
Origins, and Performance of Multinational Enterprises,” Journal of International
Management, 18 (2), 132–46.
Lee, Jongkuk and Young Bong Chang (2014), “Interplay between Internal Investment and
Alliance Specialization in R&D and Marketing,” Industrial Marketing Management, 43
118
(5), 813–25.
Lévesque, Moren, Nitin Joglekar, and Jane Davies (2012), “A Comparison of Revenue
Growth at Recent-IPO and Established Firms: The Influence of SG&A, R&D and
COGS,” Journal of Business Venturing, 27 (1), 47–61.
Lin, Bou W., Yikuan Lee, and Shih-Chang Hung (2006), “R&D Intensity and
Commercialization Orientation Effects on Financial Performance,” Journal of Business
Research, 59 (6), 679–85.
Lin, Chinho, Hua-Ling Tsai, and Ju-Chuan Wu (2014), “Collaboration Strategy Decision-
Making Using the Miles and Snow Typology,” Journal of Business Research, 67 (9),
1979–90.
Luo, Xueming (2008), “When Marketing Strategy First Meets Wall Street: Marketing
Spendings and Firms’ Initial Public Offerings,” Journal of Marketing, 72 (9), 98–109.
Luo, Yadong, John Hongxin Zhao, and Jianjun Du (2005), “The Internationalization Speed of
E-Commerce Companies: An Empirical Analysis,” International Marketing Review, 22
(6), 693–709.
MacInnis, Deborah J. (2011), “A Framework for Conceptual Contributions in Marketing,”
Journal of Marketing, 75 (4), 136–54.
MacKenzie, Scott B. (2003), “The Dangers of Poor Construct Conceptualization,” Journal of
the Academy of Marketing Science, 31 (3), 323–26.
Mhatre, Nehal, Seong-Jong Joo, and C. Christopher Lee (2014), “Benchmarking the
Performance of Department Stores within an Income Elasticity of Demand Perspective,”
Benchmarking: An International Journal, 21 (2), 205–17.
Mittal, Vikas, Eugene W. Anderson, Akin Sayrak, and Pandu Tadikamalla (2005), “Dual
Emphasis and the Long-Term Financial Impact of Customer Satisfaction,” Marketing
Science, 24 (4), 544–55.
Mizik, Natalie (2010), “The Theory and Practice of Myopic Management,” Journal of
Marketing Research, 47 (4), 594–611.
——— and Robert Jacobson (2007), “Myopic Marketing Management: Evidence of the
Phenomenon and Its Long-Term Performance Consequences in the SEO Context,”
Marketing Science, 26 (3), 361–79.
Moorman, Christine, Rex Du, and Carl F. Mela (2005), “The Effect of Standardized
Information on Firm Survival and Marketing Strategies,” Marketing Science, 24 (2),
263–74.
Morgan, Neil A. and Lopo L. Rego (2009), “Brand Portfolio Strategy and Firm Performance,”
Journal of Marketing, 73 (1), 59–74.
Mottner, Sandra and Steve Smith (2009), “Wal-Mart: Supplier Performance and Market
Power,” Journal of Business Research, 62 (5), 535–41.
Nair, Anil and David D. Selover (2012), “A Study of Competitive Dynamics,” Journal of
Business Research, 65 (3), 355–61.
Nam, Hyoryung and P. K. Kannan (2014), “Informational Value of Social Tagging
Networks,” Journal of Marketing, 78 (7), 21–40.
119
Narasimhan, Om, Surendra Rajiv, and Shantanu Dutta (2006), “Absorptive Capacity in High-
Technology Markets: The Competitive Advantage of the Haves,” Marketing Science, 25
(5), 510–24.
Nath, Prithwiraj, Subramanian Nachiappan, and Ramakrishnan Ramanathan (2010), “The
Impact of Marketing Capability, Operations Capability and Diversification Strategy on
Performance: A Resource-Based View,” Industrial Marketing Management, 39 (2), 317–
29.
Patwardhan, Abhijit M. (2014), “A Partial Theory of Holistic Firm-Level Marketing
Capability: An Empirical Investigation,” Journal of Management and Marketing
Research, 16 (8), 1–46.
Poston, R. and S. Grabski (2001), “Financial Impacts of Enterprise Resource Planning
Implementations,” International Journal of Accounting Information Systems, 2 (2), 271–
94.
Raassens, Néomie, Stefan Wuyts, and Inge Geyskens (2014), “The Performance Implications
of Outsourcing Customer Support to Service Providers in Emerging versus Established
Economies,” International Journal of Research in Marketing, 31 (3), 280–92.
Raithel, Sascha, Marko Sarstedt, Sebastian Scharf, and Manfred Schwaiger (2012), “On the
Value Relevance of Customer Satisfaction. Multiple Drivers and Multiple Markets,”
Journal of the Academy of Marketing Science, 40 (4), 509–25.
Rangan, V. Kasturi and Marie Bell (1998), “Dell Online,” Journal of Interactive Marketing,
12 (4), 63–86.
Rego, Lopo L., Neil A. Morgan, and Claes Fornell (2013), “Reexamining the Market Share-
Customer Satisfaction Relationship,” Journal of Marketing, 77 (9), 1–20.
Rugman, Alan and Nessara Sukpanich (2006), “Firm-Specific Advantages Intra-Regional
Sales and Performance of Multinational Enterprises,” The International Trade Journal,
20, 355–82.
Rust, Roland T. and Ming-Hui Huang (2012), “Optimizing Service Productivity,” Journal of
Marketing, 76 (2), 47–66.
Sarkees, Matthew, John Hulland, and Rabikar Chatterjee (2014), “Investments in Exploitation
and Exploration Capabilities: Balance Versus Focus,” Journal of Marketing Theory and
Practice, 22 (1), 7–23.
——— and Ryan Luchs (2011), “Stochastic Frontier Estimation in International Marketing
Research: Exploring Untapped Opportunities,” in Measurement and Research Methods
in International Marketing, Emerald Group Publishing Ltd, 99–114.
Shin, Hyun S., Mariko Sakakibara, and Dominique M. Hanssens (2008), “Marketing and
R&D Investment of Leader vs . Follower,” Working Paper, 1–39.
Snyder, Stephen (2009), “Marketing and R&D Complementarity in the Pharmaceutical
Industry,” Working Paper, 1–17.
Swaminathan, Vanitha and Christine Moorman (2009), “Marketing Alliances, Firm Networks,
and Firm Value Creation,” Journal of Marketing, 73 (9), 52–69.
Vinod, H. D. and P. M. Rao (2000), “R&D and Promotion in Pharmaceuticals: A Conceptual
Framework and Empirical Exploration,” Journal of Marketing Theory and Practice, 8

120
(4), 10–20.
Whitely, Bernard E. and Mary E. Jr. Kite (2013), Principles of Research in Behavioral
Science, (B. E. Whitely and M. E. J. Kite, eds.), New York and London: Routledge.
Wiles, Michael A. (2007), “The Effect of Customer Service on Retailers’ Shareholder Wealth:
The Role of Availability and Reputation Cues,” Journal of Retailing, 83 (1), 19–31.
Wuyts, Stefan, Shantanu Dutta, and Stefan Stremersch (2004), “Portfolios of Interfirm
Agreements in Technology-Intensive Markets: Consequences for Innovation and
Profitability,” Journal of Marketing, 68 (4), 88–100.
121
The Effect of Incongruency on Advertising Processing and its Underlying Mechanisms
By Annette Ptok
ABSTRACT
Nowadays marketing managers compete for consumer attention, while facing
declining levels of advertising effectiveness. Incongruent advertising content is a
predominantly used advertising strategy to successfully generate awareness and break through
the advertisement clutter. Since extant research found mixed effects of incongruency in
advertisements, it is important to understand the reasoning behind it. By integrating
individuals’ emotional and cognitive processing, this article opens the ‘black box’ of
information processing and decision making and contributes to develop a better understanding
of the underlying mechanisms of incongruent advertisements. Specifically, our findings
indicate that incongruency is supposed to work via three routes impacting consumer behavior.
First, it exhibits an indirect influence via the cognitive processing route, by increasing brand
attitude, through the familiarity mechanism. Second, incongruency is expected to have a
positive effect via emotional processing driven by the excitation-transfer mechanism. Third,
incongruency triggers an automatic mechanism due to the inevitably evoked schema-
discrepancy, which transfers into a negative predisposition toward the brand and purchase
behavior. These opposing mechanisms simultaneously drive individuals’ behavior. Depending
on the strength of each mechanism, incongruency positively or negatively influences purchase
intention. These findings offer first implications for marketing managers and advertising
content strategies.
Keywords: Incongruency, TV advertising, automatic, emotional and cognitive processing,
familiarity, excitation-transfer, and schema-discrepancy mechanism, serial mediation model
122
INTRODUCTION
Consumers are exposed to a mass of competing advertisements every day (Jurca and
Madlberger 2015). The so called advertising clutter leads to diminishing consumer attention
towards advertisements (ads) (Teixeira 2014). Hence, the decrease in advertising
effectiveness transfers into lower return on advertising investment, making budget
justifications even harder (Brown 2004; Jurca and Madlberger 2015). As an answer to the
decline in consumer attention, managers heavily rely on unorthodox advertising content
strategies to reach out for consumer attention (Halkias and Kokkinaki 2014). For example, a
household cleaner ad, shows a woman in a fairytale castle fighting against a dirty dragon.
When overwhelming the animal, the scene switches to a housewife cleaning the kitchen.
Many viewers may find such an ad irritating and unexpected. These strategies are deliberately
directed to trigger cognitive dissonance in order to gain consumer attention and break through
the ad clutter (Madden and Weinberger 1982). Cognitive dissonance is a result of a stimulus
that is incongruent with consumers’ expectations of the ad and the advertised brand. Beyond
grapping consumers’ attention, the overall aim is to create favorable responses towards the ad
and brand (Yoon 2013) and ultimately stimulate consumer behavior. The determinants of an
individual’s behavior rely inside the organism and represent internal processes and structures
operating in parallel and resulting in an either positive or negative response.
Previous research on ad incongruency has documented mixed and inconsistent effects
of incongruent ads on consumer behavior. Extant incongruency research predominantly
examined the relationship between incongruency and memory or between incongruency and
evaluation, taking into account different boundary conditions such as culture (Mostafa 2005)
or prior category attitude (Arias-Bolzmann, Chakraborty, and Mowen 2000). However, to the
best of our knowledge, it neglects the interplay of organismic processes, which represent the
driving force of conative outcomes such as purchase.
123
The research gap on ad incongruency is twofold. First, these studies suffer from some
limitations, because they do not treat the effect of incongruency on advertising persuasion and
subsequent response as a causal chain, but rather as a bilateral relationship, between stimulus
and outcome. Considering the stimulus-organism-response (SOR) paradigm (Mehrabian and
Russel 1974; Shimp and Gresham 1983), solely the stimulus-response linkage has been
investigated broadly, while omitting the mediating role of the processes being activated within
the organism. However, it is necessary to theoretically and empirically investigate the
underlying organismic processing routes that are triggered by an incongruent stimulus to
better explain the variation in results. That is, ‘how could a possible negative direct effect of
incongruency be explained and how can it be attenuated or reversed?’ The SOR-paradigm is
in line with Lavidge and Steiner's (1961) well established hierarchical-effects model on
advertising processing, which postulates that a stimulus activates a causal chain of processes,
resulting in consumer response towards the stimulus. In sum, the varying processes that are
stimulated determine the impact on overall conative outcome and not the exclusive
bidirectional relationship. Second, these studies primarily investigated the direct impact of
incongruent ads on several indirect outcome variables such as memorization or evaluation of
the brand, but research on conative outcomes such as ultimate purchase interest and behavior
is low. The lack of research on the processing chain of ad incongruency is surprising. To the
best of our knowledge, extant research has not investigated the preceding processing routes in
advertising persuasion of an incongruent stimulus on conative outcomes. Therefore, it is still
unclear, what are the underlying mechanisms for each processing route according to the SOR-
paradigm driving varying consumer responses and how do they impact ultimate consumer
behavior. Given that incongruency is a complex construct (Yoon 2013) and extant research
has not yet investigated the indirect effects on conative outcome, it is questionable if the
identified effects on the ‘selectively chosen’ effectiveness constructs can be likewise
anticipated on final purchase behavior. Or whether the effect of incongruency in ads needs

124
additional examination and explanation, because the big picture on advertising persuasion in
terms of conative constructs has been neglected so far. Consequently, mediating drivers
explaining the varying effects of incongruency on consumer response have been so far
omitted by extant research.
Our study aims at filling the gap in incongruency literature and advertising persuasion
theory. It provides an opportunity to advance the theoretical knowledge of advertising
processing and decision-making under the condition of incongruent stimuli. By conducting a
first exploratory study, we investigate the effect of different executional strategies using
incongruency. To do so, we link these strategies to the cognitive and affective drivers as well
as conative outcomes to advance the explanation of ultimate consumer behavior. In order to
address this research gap, the article examines the following research questions:
RQ1. What is the effect of incongruency on cognitive, affective and conative outcomes?
RQ2. What are the underlying mechanisms of incongruency on the advertising persuasion
process?
Relative to literature our contributions are the following. First, we do not only focus
on one form of incongruency (congruency versus incongruency), but we include two
prominent content strategies (humorous and absurd incongruency) of incongruency that are
frequently used in practice and compare their effects. Second, we examine the impact of these
different incongruency types on the black box of stimulus processing and link the underlying
mechanisms to the diverse cognitive, affective and conative outcomes. Third, we derive
managerial implications for practitioners. Understanding the underlying mechanisms that
drive the overall effect of incongruency, contributes to the theoretical understanding of
advertising effectiveness. It would help managers to choose between different types of
incongruency according to their respective advertising objectives.
The remainder of this article is organized as follows. First, we provide an overview on
consumer information processing and decision-making. Second, we present the design of the
125
exploratory research study to compare the effect of incongruency versus congruency in
advertising on behavior. This study serves as a first indicator to test the proposed organismic
persuasion processes. We examine the activated processing routes and the underlying
mechanisms of incongruency by linking participants’ information processing with decision-
making behavior. The results provide indication that incongruency operates according to three
major processing routes, i.e. the automatic, the emotional and the cognitive processing route,
which are driven by three opposing mechanisms that determine the overall effect of
incongruency. These mechanisms can be classified into the excitation-transfer mechanism, the
familiarity mechanism, and the schema-discrepancy mechanism. The effects of the excitation-
transfer and the familiarity mechanism are positive, whereas the effect of the schema-
discrepancy mechanism is negative. We assume that depending on the strength of each
mechanism, consumer behavior results in a positive or negative outcome.
Based on our findings we derive managerial implications, discuss the limitations of
our study and provide directions for future research.
THEORETICAL BACKGROUND
Stimulus Processing and Advertising Persuasion
Information processing of a stimulus activates either assimilation or accommodation
processes (Lee and Schumann 2004). “Advertising effectiveness depends on the degree to
which consumers process the information that is being conveyed” (Jurca and Madlberger
2015, p. 51). For advertising processing two aspects of psychological responses are important:
intensity and valance of processing, where intensity is linked to memorization and valance to
liking (Moorman, Neijens, and Smit 2002). This is in line with the theory of advertising
stimulus processing following two fundamental routes: the cognitive processing route and the
emotional processing route (Albers-Miller and Stafford 1999; Kotler and Armstrong 2016;
Stewart, Morris, and Grover 2009; Vakratsas and Ambler 1999). The emotional processing

126
route is activated by emotional appeals that aim to stir up negative or positive feelings
triggering consumer response. The cognitive processing route persuades the consumer by
rational inclusion of brand-related information in the individual’s consideration set, serving as
decision cues (Kotler and Armstrong 2016; Tellis 2004). Both routes follow the causal chain
of advertising persuasion. Depending on the strength of each route, one may dominate the
other and hence, impacting advertising persuasion and final consumer behavior. Lavidge and
Steiner (1961) identified a series of steps advertising persuasion must undergo in order to
favorably stimulate consumer behavior. In line with previous research, these steps can be
classified into four major causal linkages: (1) arousal, (2) cognition, (3) affect, and (4)
conative outcomes. Exposure to a stimulus triggers activation of the organism, i.e. arousal
that is the physiological activation of the automatic neural system towards a stimulus, which
is of limited capacity (Bagozzi, Gopinath, and Nyer 1999). Depending on the level of arousal,
cognition (i.e. memorization) is activated, which links the stimulus to prior knowledge
structures. It is defined as the “extent to which the information in working memory is
integrated with prior knowledge structures” (Yoon 2013, p. 365). However, memorization of
information does not necessarily transfer into persuasion (Chen, Yang, and Smith 2016).
Affect is defined as the perceived qualitative value provided by the object (quality perception)
and the resulting attitude towards the object. The perceived qualitative value is termed as “the
measure of any particular attribute a product has” (American Marketing Association 2017)
and serves as the foundation for attitude formation (Fishbein 1963). Attitude is “an
individual’s internal evaluation of an object” (Mitchell and Olson 1981, p. 318) being either
positive or negative (Moorman, Neijens, and Smit 2002) that energizes behavior (Mitchell
and Olson 1981). The ultimate causal step in advertising persuasion is called the conative
outcome (behavior). It is referred to the consumers’ response implicating an intentional or
behavioral disposition toward the stimulus (Brink, Odekerken-Schröder, and Pauwels 2006;
Jenkinson 2007).
127
The potential role of the routes of emotional and cognitive processing as mediators of
the incongruency advertising persuasion chain, would benefit from additional theoretical
development and empirical research. This would help to explain the contradicting outcomes
found in extant research of incongruency and consumer responses.
Incongruency in Advertising
Incongruity research in advertising deals with the effect of information content that
deviates from consumers established cognitive schemata. The terminology ‘schema’ refers to
the human’s mind being structured in concepts and categories to “encode, store, and decode
information” (Yoon 2013, p. 361), serving as a frame of reference to form judgements (Lee
and Schumann 2004; Mandler 1982). Piaget (1981) claims that the processing of intellectual
knowledge is manifested in four important concepts: (1) schema, (2) assimilation, (3)
accommodation, and (4) equilibration. Schemata are build up by cognitive development and
change over time by assimilation and accommodation processes of new stimuli causing a state
of cognitive disequilibrium to achieve cognitive equilibration. Assimilation is called the
process, where a new stimulus fits existing knowledge structures (schema-congruent
information). A stimulus that does not fit into established schemata (schema-incongruent
information), triggers accommodation processes. The stimulus can be processed by two ways.
Either existing schemata are modified or new schemata are build up to fit the stimulus (Lee
and Schumann 2004; Mandler 1982; Wadsworth 2004). Schema-incongruity theory goes back
to Mandler (1982). He developed a framework to understand the phenomenon of
incongruency and postulates that “schema incongruity is a case of interruption of expectations
and predictions” (Mandler 1982, p. 21), which activates an reflexive inner state of tension, so
called arousal (Singh and Churchill 1987). It is the physiological response to a stimulus and
plays a major role in emotion and cognition (Bagozzi, Gopinath, and Nyer 1999; Schachter
and Singer 1962). Arousal is defined as physiological activation along the dimension of sleep
and excitement (Mehrabian and Russel 1974), which is “responsible for the psychological and

128
motor activity of the organism” (Kroeber-Riel 1979, p. 241). It is assumed that each
emotional response is mediated by arousal, which is manifested in the neural system and
activated automatically (Bagozzi, Gopinath, and Nyer 1999). Arousal causes more intensive
elaborative processing of the stimulus (Heckler and Childers 1992). According to Festinger's
(1957) cognitive dissonance theory an incongruent stimulus that cannot be resolved by means
of accommodation is negatively evaluated. Successful accommodation, is followed by a
positive stimulus evaluation. The established schemata are “used to process and identify or
classify incoming stimuli” (Wadsworth 2004, p. 14) by schema assimilation and
accommodation (Mandler 1982). In sum, an incongruent stimulus is absorbed by either
assimilation or accommodation of the stimulus to the neural structures (Mandler 1982).
In practice, incongruency is prominent in two different execution strategies relying on
the same incongruity mechanism, i.e. humorous and absurd ads. Between 15% and 42% of
ads broadcasted in TV and radio extensively utilize humorous ad content (Madden and
Weinberger 1982) to trigger dissonance (Alden, Mukherjee, and Hoyer 2000). Beyond humor,
the literature stream on incongruency is devoted to a second prominent type of ad content,
which is absurd incongruency. In sum, significant effort has been made to understand, what is
the ultimate effect of ad incongruency on consumer response (e.g. Alden, Mukherjee, and
Hoyer 2000; Arias-Bolzmann, Chakraborty, and Mowen 2000; Dahlén et al. 2005, 2008;
Dahlén and Lange 2004; Gelbrich, Gäthke, and Westjohn 2012; Halkias and Kokkinaki 2014;
Madden and Weinberger 1982; Mostafa 2005). Our research focuses on these two execution
strategies and investigates processing routes and corresponding underlying mechanisms on
consumers’ decision making as well as the interrelation with cognitive, affective and conative
outcomes.
Incongruency Research in Advertising
Advertising scholars have investigated and debated the effect of incongruency in ads
on consumer response. Unfortunately, past attempts to understand and predict consumer
129
reactions towards incongruent stimuli have yielded heterogeneous results. Many studies
investigated the effect of incongruency versus congruency in ads on consumer responses.
Overall, extant research shows that recall of the brand is higher for incongruent ads (Gelbrich,
Gäthke, and Westjohn 2012; Heckler and Childers 1992; Houston, Childers, and Heckler
1987; Mostafa 2005). With regard to research on evaluative outcomes, prior studies show
mixed results. For example, Lee and Mason (1999) found partial support that incongruency
increased consumer’s attitude. Other scholars have suggested that incongruency as compared
to congruency in advertising negatively affects attitude toward the brand or ad and found
support for the positive effect of congruency on brand evaluation (Dahlén et al. 2005; Hong
and Zinkhan 1995; Kamins and Gupta 1994; Lalwani, Lwin, and Ling 2009; Lee and Mason
1999; MacInnis and Park 1991). Again other researchers could not find a significant main
effect of incongruency on attitude (Dahlén et al. 2008; Dahlén and Lange 2004) or a
significant difference in the effect of incongruent versus congruent ads on attitude (Moorman,
Neijens, and Smit 2002). Research has already productively investigated the boundary
conditions on incongruency, such as the moderating effect of comprehension (Halkias and
Kokkinaki 2014), brand familiarity (Lange and Dahlén 2003), prior product category attitude
(Arias-Bolzmann, Chakraborty, and Mowen 2000; Mai and Hutter 2014), surprise (Alden,
Mukherjee, and Hoyer 2000), and culture (Gelbrich, Gäthke, and Westjohn 2012) on
consumer responses. We propose that the heterogeneity of research findings may be caused
by the complex nature of incongruency and its organismic activation. Extant research is
limited on the understanding of the causal chain of processing an incongruent stimulus and
ultimately influence behavior. Since advertising persuasion is a cognitive and elaborative
process and not an independent outcome, it is necessary to investigate the underlying
mechanisms that drive the process of consumer decision-making. Two prominent processing
routes (emotional and cognitive) have been used in the context of theoretical frameworks
explaining advertising persuasion (Tellis 2004). Therefore, the explicit emotional and the
130
cognitive route of processing serve as important paths to explain the divergent outcomes in
consumer decision-making and develop a better understanding for consumer behavior.
Unfortunately, none of the studies, investigating incongruency in advertising, has provided a
comprehensive view of the different routes of persuasion. Although the advertising literature
describes the bidirectional relationship of incongruency, with cognitive or affective outcomes,
the topic of persuasion and processing routes has not been addressed formally in any rigorous
manner. Prior research studies do not provide insights on the relative impact of cognitive and
affective outcomes on overall purchase behavior. More research is needed in explaining the
psychological dynamics involved when being confronted with an incongruent stimulus and
the overall effect on conative outcome. Specially, research needs to go one step further and to
analyze the effect on conative outcomes, while linking the intermediary constructs. Getting an
overall picture on the interplay of incongruency with cognitive, affective and conative
outcomes helps to determine the long-run impact. Does the positive effect on memory
outweigh the negative induced affective outcome of incongruency? In total, what is the
impact of incongruency on advertising persuasion and does incongruency positively or
negatively induce purchase behavior? It offers the possibility to explain the multidimensional
effect of incongruency. This exploratory study uncovers three major processing routes, which
enforce but also weaken overall persuasion of an ad, in terms of purchasing behavior. That is,
incongruency in ads represent a double-edged sword with respect to the effectiveness of
advertising. To know what the routes of persuasion are and what mechanisms drive each
route, is beneficial when designing ads. Being aware of the direct effect of incongruency on
selected parts (either cognitive or affective outcomes) of overall advertising persuasion, does
not piece together the puzzle on incongruency and advertising effectiveness. So far, to the
best of our knowledge, no study has focused on these routes of persuasion. In the conceptual
framework shown in Figure 1 processing via emotional and cognitive route is hypothesized to
play a general role in the response towards ads. We assume that both processing routes have

131
an impact on advertising persuasion. Specifically, given the complex nature of incongruency,
it is assumed that the indirect effect of a stimulus is transferred via both routes following the
sequential chain of advertising persuasion, i.e. shaping expectations about product quality,
forming attitudes, and impacting final decision on the purchase intention.
Figure 1: Conceptual Framework
HYPOTHESES
The Mediating Role of Emotional and Cognitive Processing Routes
Based on the SOR framework, cognition and emotion represent intermediary states
between the stimulus and the response (Kim and Lennon 2013), which are independent of one
another (Batra and Ray 1986; Levonian 1964; Ray and Batra 1983). Hence, we propose that
an incongruent stimulus affects Lavidge and Steiner's (1961) causal chain of processing via
two crucial routes, i.e. the emotional and the cognitive route, which have an impact on the
perceived quality of the product, the attitude and finally on consumer behavior in terms of
purchase intention.

132
Effect of an incongruent stimulus on pleasure. Concerning emotional processing, the
overall emotional state is manifested in the degree of perceived pleasure, which is assumed to
play a fundamental role in every kind of approach behavior (Mehrabian and Russel 1974).
Pleasure describes the valence ranging from pleasant (positive) to unpleasant (negative)
(Kuppens et al. 2013), which serves as an intervening variable between a stimulus and
consumer approach behavior (Mehrabian and Russel 1974). Extant research showed clearly
that advertising triggers consumers’ perceptions of pleasure (Olney, Holbrook, and Batra
1991). Hence, it is considered to be an essential mediator in the advertising persuasion
process (Morris et al. 2002) and representing the driver of the emotional processing route. In
line with schema-incongruity theory, we argue that an incongruent stimulus will activate
consumers’ neural system (by higher arousal level) due to its perceived novelty and
discrepancy from established cognitive structures (Yoon 2013). This should lead to a greater
activation of arousal as compared to a congruent stimulus. An optimal level of arousal is
perceived as pleasant, which is different from consumer’s perceived preference and liking
(Mehrabian and Russel 1974). The consumer is motivated and challenged to resolve this
discrepancy (Dahlén et al. 2008), which transfers into feelings of pleasure.
H1: Pleasure mediates the effect of an incongruent stimulus on perceived quality.
The effect of an incongruent (vs. congruent) stimulus on pleasure is positive.
Pleasure has a positive effect on perceived quality.
Effect of an incongruent stimulus on cognition. Cognition is the mental, rational part
when processing a stimulus (Kotler and Armstrong 2016). Being confronted with an
incongruent ad causes a higher level of aroused mental attentiveness due to the discrepant
information being communicated (Goodstein 1993; Mai and Hutter 2014). Incongruency does
not conform predisposed expectations, which generates a high level of arousal and
consequently activates deeper processing of the stimulus. This results in stronger processing
and hence, strengthens the cognitive ties with the brand (Dahlén et al. 2008). That is, high

133
arousing stimuli are supposed to be stored in long-term memory as compared to low arousing
stimuli, which only enter short-term memory. Compared to this, congruent ads are consistent
with existing schemata and can be easily assimilated to the established cognitive structures.
Hence, without a certain amount of psychological dissonance, the ad is processed at a lower
arousal level. Consequently, it fails to extend or establish new cognitive structures impeding
long-term memory linkages between advertised product and the mindset (Heckler and
Childers 1992; Houston et al. 1987). Thus, for an incongruent stimulus the salience of the
brand in consumer memory is increased (Dahlén et al. 2005). A so called familiarity
mechanism, results out of the subconscious influence of incongruency on cognition. It is
defined as the mechanism driving the positive predisposition towards an object, based on the
mere effect of stronger cognitive associations causing subconscious familiarity (Esch et al.
2012; Zajonic 1980). The depth of cognitive storage is independent of the valence, i.e.
independent of perceived pleasure (Batra and Ray 1986; Levonian 1964; Ray and Batra
1983). The arousing elements in the ad serve later as retrieval cues from memory for the
brand (Riemer 2014).
H2: Cognition mediates the effect of incongruency on perceived quality. An
incongruent (vs. congruent) stimulus will increase consumer cognition.
Cognition positively affects perceived quality.
Effect of an incongruent stimulus on perceived quality. The perceived quality of a
brand serves as an important driver of the later evaluation process and purchase decision
(Aaker and Biel 1993). Quality perceptions are formed on the judgmental value of the brand’s
attributes and benefits as learned by the consumer from the ad (Fishbein 1963). Given the
high arousing nature of an incongruent advertising stimulus, consumers become distracted
from the advertised attributes and benefits, which are essential for quality perceptions. The
distraction by the nature of incongruency turns the consumer’s focus to the evoked
discrepancy. Hence, the individual cannot establish cues that support the utility of the

134
promoted brand and product (Aaker and Biel 1993), since the limited processing capacity is
used for the resolution of the incongruent schema-discrepancy (Kahneman 1973).
Furthermore, the perceived cognitive dissonance, i.e. the schema-discrepancy, reduces the
quality perception of a brand, because the consumer cannot make sense of the relationship
between the incongruency and the advertised brand.
H3: Perceived quality mediates the effect of incongruency on attitude. An
incongruent (vs. congruent) stimulus will decrease perceived quality. Perceived
quality positively impacts attitude.
Effect of an incongruent stimulus on attitude. In the literature two main theories
explain the formation of attitude. First, the explicit impact on attitude being either positive or
negative depends on the structural congruity between the stimulus and the recipient (Mandler
1982). Usually the assimilation of a stimulus leads to positive affect with low degree of
emotional intensity due to a low level of arousal. Whereas the disruption of a stimulus
towards existing schemata and subsequent accommodation of structures, causes a high arousal
level and hence, produces high degrees of emotional intensity being either positive or
negative (Mandler 1982). A negative affect occurs, when relevant structures are missing and
stimulus assimilation fails, which leads to negative attitude. The resulting negative state of
disequilibrium is deduced to the schema-discrepancy mechanism. Schema-discrepancy results
out of the interruption of expectations, which activates the autonomic nervous systems (ANS).
ANS in turn determines the “intensity of emotion and affect” (Mandler 1982, p. 21) and its
activation underlies an automatic process that is triggered by the discrepancy, such that the
physiological arousal level induced by the stimulus is out of the individual’s control. Most of
the times the evoked discrepancy between stimulus and established mental structures, will
result in negative affect due to missing structural congruity (Mandler 1982).
Second, the implicit impact on the formation of attitudes is explained by the
superiority of the pleasant hypothesis, which goes back to the excitation-transfer theory by
135
Zillmann (1971). In general, excitation-transfer theory postulates that the feeling of
pleasantness evoked by the ad will be generalized to the brand by some conditioning
processes, the so called excitation-transfer mechanism (Aaker and Bruzzone 1985). It is
referred to as the effect of arousal generated by a certain stimulus, having a direct effect on
postexposure evaluations and behavior (Bryant and Miron 2003; Mattes and Cantor 1982;;
Zillmann 1971). Extant literature relates arousal to pleasantness, stating that it serves as an
antecedent of affect and consequently attitude (Kuppens et al. 2013). Sanbonmatsu and
Kardes (1988) found a positive brand attitude effect for high arousing stimuli, concluding that
in high arousing conditions the amount of processing capacity used to elaborate a persuasive
message and thus, counterargumentation is reduced. This is in line with the assumption that
incongruent stimuli cause distraction (Bratu 2010; Erfgen, Zenker, and Sattler 2015).
On the one side, based on past literature, we conclude that for incongruent advertising
stimuli the ad message is processed higher, due to new, discrepant stimuli causing a high
arousal level. Thus, incongruency will satisfy the need of consumer variety seeking (Gelbrich,
Gäthke, and Westjohn 2012), because it diversifies from the mass of uniform advertisements
(Hammer, Riebe, and Kennedy 2009). On the other side, the inner discrepancy will be more
difficult to resolve, because existing schemata do not apply by either assimilation or
accommodation (Jung Grant, Campbell, and Jhang 2012; Mandler 1982). Consequently, the
lack of resolution, will lead to a negative attitude driven by the schema-discrepancy
mechanism. Advertisements that consist of congruent information with the subject’s
established schemata are easily understandable and linked to existing knowledge structures.
Hence, information congruity keeps the subject’s equilibrium state balanced and does not
activate strong assimilation or accommodation of existing knowledge structures.
H4: Attitude mediates the effect of incongruency on purchase intention. An
incongruent (vs. congruent) stimulus will decrease consumer’s attitude toward
the brand. Attitude positively impacts purchase intention.
136
Effect of an incongruent stimulus on purchase intention. In line with the excitation-
transfer theory (Bryant and Miron 2003; Zillmann 1971) and classical conditioning theory, the
perceived degree of pleasantness, which is stored in memory, is transferred to the consumer’s
overall evaluation of the brand. Consumers who experience a high arousal level are more
likely to polarize the affective response to a subsequent target (the brand) (Gorn et al. 2001).
The effect should depend on the perceived degree of pleasantness evoked by the ad. An
incongruent (vs. congruent) stimulus has a higher (lower) propensity to entertain the
consumer by its novelty and surprising nature, which should be transferred via cognition and
perceived value on the affective consumer response (excitation-transfer mechanism). Singh
and Churchill (1987) postulate that cognition mediates the effect of arousal on attitude. To
state it differently, whether arousal is perceived as pleasant or unpleasant directly impacts the
depth of memorization and the valence of memorization either as pleasant or unpleasant and
of high or low quality. This in turn indirectly transfers into consumer behavior. The overall
indirect effect of incongruency via the route of emotional processing will be positive.
Incongruency impedes the cognitive processing of the advertised brand in a way that it
distracts the consumer from the communicated attributes and benefits of the brand (Mai and
Hutter 2014; Meyers-Levy and Malaviya 1999). Consequently, the lack of information
storage, hinders the consumer to build up utility cues that serve as heuristics for ultimate
behavior. The distraction from active information processing, causes an overall insecurity on
the value of the brand, which is expected to transfer into a reversed predisposition and a
negative impact on consumer purchase behavior. The overall indirect effect of incongruency
via the route of cognitive processing will be negative.
H5a: The effect of an incongruent (vs. congruent) stimulus on purchase intention
will be serially mediated by pleasure, perceived quality, and attitude on
purchase intention.

137
H5b: The effect of an incongruent (vs. congruent) stimulus on purchase intention
will be serially mediated by cognition, perceived quality, and attitude on
purchase intention.
Because advertising research argues that both processing paths work in parallel
(Epstein 1993), affecting consumer persuasion and behavior, we test both paths separately.
STUDY
Method
This part of the study represents the behavioral data belonging to an overall
exploratory electroencephalography (EEG) study, which will not be addressed in this paper.
We had planned a later study on information processing and cognitive wear-in and wear-out
effects within EEG and therefore, especially the design of the study is aligned with the high
requirements of EEG data collection.9 The study on the corresponding behavioral data set
serves as a first indicator of the hypothesized serially mediated relationship among cognitive,
affective, and conative outcomes.
Design and stimuli. 45 healthy, right-handed participants (mean age 23 ± 2.4 years, 24
women) with normal or corrected-to-normal vision were recruited via ORSEE (Greiner 2015)
among the student population at the University of Cologne (Germany). We excluded non-
native speakers of German and persons with dietary restrictions that might have affected their
attitude towards chocolate bars and/or yogurts. All participants took part in two individual
sessions of approximately 120 minutes each, scheduled exactly one week apart. Participants
were compensated with a flat payment of 50 Euro, which they received at the end of the
second session. During the first session, in which the EEG measurement took place,
participants passively watched the advertisement spots embedded in a documentary. The
9 The parts of the EEG design and procedure are developed in cooperation with Sabine Hügelschäfer from the
University of Cologne.
138
second session consisted of an extensive questionnaire including a recall and recognition test
of the spots. The study was conducted in agreement with the ethical guidelines of the
American Psychological Association (APA) and the Declaration of Helsinki; all participants
signed an informed-consent document at the beginning of the first experimental session.
Given the within-subjects design, the final sample size consisted of 180 observations,
i.e. four observations per participant, because they viewed both ad categories, the congruent
as well as the incongruent ads, which were further subdivided in absurd incongruency versus
congruency and humorous incongruency versus congruency. The spots were selected to
compare overall incongruent ads against congruent ads. Additionally, we could split the data
into two equal sub-categories, comparing either absurd incongruency against congruency or
humorous incongruency against congruency. The cover story was short, stating only to watch
a documentation.
The sample selection of the advertisements is of high importance given the risk of
confounding effects, especially when conducting an EEG study. First, we need to choose
appropriate product categories that fulfill certain requirements. Specifically, the analyzed
product categories should be a) of low involvement, not requiring any specific expertise by
the participant and b) gender indifferent, which means that they are equally consumed by
females and males. This ensures that the participants do not belong to any specific target
group. Consequently, we choose to analyze the product categories chocolate bars and yoghurt.
Second, the brands in our sample should be of comparable quality and popularity. Consistent
with literature (MacInnis, Rao, and Weiss 2002), a sample of seven trained experts evaluated
the content of each ad. Before evaluating the ads, all experts are led through a two-day
training in which each variable is discussed and wording problems are clarified. After all TV
ads are rated, intercoder reliability is measured by Krippendorf’s alpha to ensure the quality of
measurement (Krippendorf 1980). The expert coding serves as a basis for this studies. The
classification of spots into the different degrees of incongruity is based on the experts’ coding.

139
The purpose of this pretest was to ensure that the manipulation of the incongruency stimulus
was objective. Seven trained coders evaluated the ads.
In order to test the effect of the different incongruent stimuli and not of any other
executional cues impacting advertising response (Percy and Rossiter 1992), we need to
exclude possible systematic confounds by varying ad characteristics. The elimination of
confounds has high restrictions to the sample such that the selected TV spots are not allowed
to significantly differ in other content and context variables than the incongruity dimension of
interest. Therefore, we controlled for the following variables: creativity, rational informative
value, negative framing, positive framing, other arousing variables, music integration, spot
length, visual complexity, verbal complexity, color dominance, the duration of the shown
brand logo and product, the number of times and the timing the logo and the product appeared
in the TV spot. To the best of our knowledge, this study is one of the first research projects
that imposes such high restrictions on the sample selection, which will validate our results.
Furthermore, we performed pre-tests to control for brand equity, brand distinctiveness, brand
attitude and brand parity to exclude any brand specific confound effects.
Procedure and measures. Participants took part in the first experimental session
individually assisted by two experimenters in the EEG laboratory of the University of
Cologne. Each participant was seated in a soundproof experimental chamber in front of a desk
with a computer monitor (19’’ monitor with 1024 x 768 pixels resolution) and speakers. The
experiment was run on a personal computer using Presentation® software 16.3
(Neurobehavioral Systems, Albany, CA). Stimuli were shown on the computer monitor
against a grey background at a distance of about 50 cm. After application of the electrodes,
the experimenter started the EEG recording and left the experimental chamber for the duration
of the experiment. Onscreen instructions informed the participant that his/her task consisted in
watching a documentary that included several commercial breaks for a total duration of about
60 min. Participants were additionally instructed to move as little as possible and to maintain
140
their gaze focused at the stimuli (i.e., the documentary and the advertisement spots) presented
in the center of the screen. Each participant was presented with a series of TV commercials
(see above), embedded in a documentary (entitled “Germany from above”, showing pictures
of German cities from a bird's eye view and providing corresponding information, 45 min
duration). Each of the 15 commercials of interest was presented three times, adding up to 45
commercial breaks, which were shown in three different pseudo-randomized orders
(counterbalanced between subjects) to avoid carryover effects or measurement error. In all
three counterbalance conditions, the order was chosen in a way that 1) the same stimulus
condition (e.g., congruency) was never presented two times in a row, 2) the same product
category (chocolate bar vs. yogurt) was never presented more than two times in a row, and 3)
the same spot was separated by at least three further spots before it was repeated. The 45
commercial breaks were roughly evenly distributed over the length of the documentary,
separated by around 40-60 seconds. We also included three filler spots at the beginning of the
documentary (i.e., before the first commercial of interest) as a warm-up and to make
participants familiar with the procedure. Before the start and after the end of the documentary,
we additionally recorded participants' resting-state EEG as a measure of baseline
electrocortical activity. When the experimental procedure was completed, the cap and external
electrodes were removed from the participant. The whole session lasted about 120 minutes.
Given that we used spots that have been exposed in 2012, the first session, was conducted to
partial out any predetermined brand effects regarding familiarity or already seen
advertisements. This should set up the baseline for a comparable set-up and avoid confounds
of prior brand or spot knowledge. Participants get familiar with the brands and the
commercials due to the three times of ad repetitions, which is common in practice (Krugman
1984). Usually, the time of being exposed to an ad and the subsequent buying process are
temporally two events, we decided to delay the questionnaire session for one week. The
second session was conducted individually, assisted by an experimenter, in the soundproof

141
experimental chamber of the EEG laboratory exactly one week after the first experimental
session. The questionnaire was implemented via Unipark, a tool for running online surveys.
Participants indicated their answers via keyboard and mouse. The questionnaire was designed
to measure participants’ cognitive capabilities and subjective conscious evaluations of each
ad. We measured cognition and provided the participants with hints by means of two static
scenes of the ad not showing the product or brand name. Additionally, the spots were shown
again, and for each brand we measured affective and behavioral outcomes. In order to avoid
measurement error, the spots were shown in a randomized order. At the end of the
questionnaire participants were asked for their TV watching, product and yoghurt
consumption as well as demographics. Whenever possible, we used multiple measures to
operationalize the constructs of our proposed advertising persuasion chain. These measures
were already established in previous studies. To verify the reliability, we calculated
cronbach’s alpha (α) for each operationalization. For all constructs we proved high internal
consistencies, with cronbach’s alpha values greater than the recommended threshold value of
.75 (Tan and Peng 2003; Westbrook 1987). The processing variables (pleasure and cognition)
are measured as follows: to check for participants’ feelings of pleasure, we asked them to rate
the commercial according to their perceived entertainment factor. Pleasure was
operationalized by a seven-point Likert-type scale, which comprised of five items (α = .96)
(Schlinger 1979). To obtain measures on the consumers’ memory structures, cognition was
measured as a continuous variable, indicating the absolute value of correctly recalled brands.
Doing so, participants were presented two scenes from the ad not showing the brand name or
the product and were asked to recall the brand name (Till and Baack 2005). Measurements on
the affective linkage between processing and outcome consist of the two constructs ‘perceived
quality’ and ‘attitude’. Perceived quality of a product was measured by a seven-point
semantic differentials used to quantify a person’s perception of the quality of a product. The
scale comprises of three items (α = .84) (Buchanan, Simmons, and Bickart 1999). Consumers’

142
attitude toward the brand was operationalized by a seven-point semantic differentials scale,
which comprised of three items (α = .90) (Aaker and Williams 1998). In terms of the
dependent variable on consumer behavior, consumers’ purchase intention buying the product
was indicated on a seven-point Likert-type scale. This scale is comprised of three statements
(α = .82) (Bower and Landreth 2001).
To account for participants experience with the brand and gender differences, we
include prior consumption and gender classification as control variables. For the full phrasing
of the measurement scales of our variables’ items and further robustness checks, see
Appendix 1.
Depending on the time the participant took for his/her answers, the whole session
lasted about 90 to 120 minutes. Finally, participants were thanked, paid, and debriefed.
Results and Discussion
The goal of this initial exploratory study was to get a first impression on the relevant
constructs and its theoretical interrelationships in advertising persuasion. Our final sample
consists of 45 participants, which of course has restrictions in terms of generalizability. In our
study, we tested the effect of overall incongruency versus congruency as well as the effect of
two specific types of incongruency, i.e. absurd incongruency and humorous incongruency
separately against congruency. In the first group, we test for the overall effect of
incongruency versus congruency in ads. Doing this, we assign the 180 observations (four
observation points per participant) on all spots into the two respective categories (Sample 1: N
= 180 / 2 = 90). For further analysis, we split the data in two subsamples (Sample 1a and
Sample 1b), testing either the condition of absurd incongruent or humorous incongruent spots
against congruent spots. Sample 1a includes only absurd incongruent spots versus congruent
spots, resulting in 90 observations, two data points per participant. The same pattern holds for
Sample 1b, testing only humorous incongruent spots against congruent spots (N = 90).
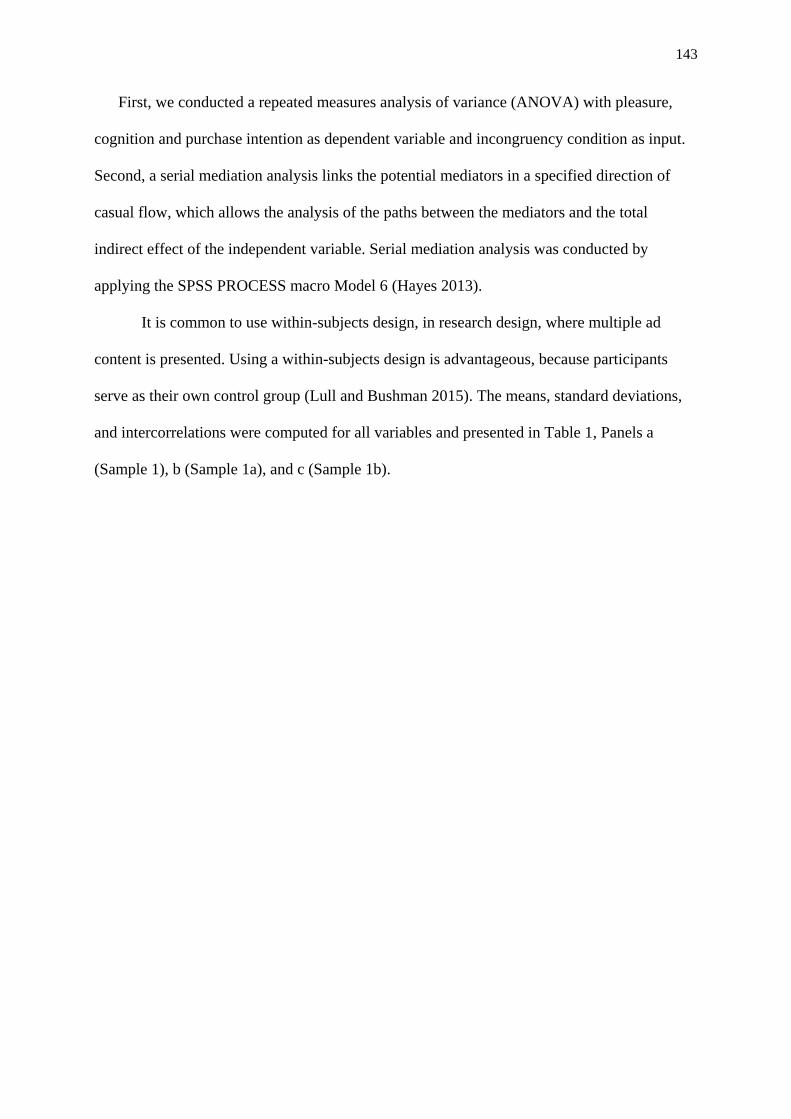
143
First, we conducted a repeated measures analysis of variance (ANOVA) with pleasure,
cognition and purchase intention as dependent variable and incongruency condition as input.
Second, a serial mediation analysis links the potential mediators in a specified direction of
casual flow, which allows the analysis of the paths between the mediators and the total
indirect effect of the independent variable. Serial mediation analysis was conducted by
applying the SPSS PROCESS macro Model 6 (Hayes 2013).
It is common to use within-subjects design, in research design, where multiple ad
content is presented. Using a within-subjects design is advantageous, because participants
serve as their own control group (Lull and Bushman 2015). The means, standard deviations,
and intercorrelations were computed for all variables and presented in Table 1, Panels a
(Sample 1), b (Sample 1a), and c (Sample 1b).
144
Table 1: Descriptive Statistics and Bivariate Correlations among Variables
a. Sample 1 Descriptive Statistics
N Minimum Maximum Mean Standard
Deviation Pleasure Cognition
Perceived
quality Attitude
Purchase
intention
Pleasure 90 1.00 6.23 3.48 1.21 1.00
Cognition 90 .00 8.00 4.83 2.21 .50** 1.00
Perceived quality 90 1.10 7.00 4.62 .99 .50** .02 1.00
Attitude 90 1.00 4.17 2.68 .73 -.43** -.06 -.78** 1.00
Purchase intention 90 1.00 5.14 2.91 1.04 .50** .11 .69** -.66** 1.00
b. Sample 1a
N Minimum Maximum Mean Standard
Deviation Pleasure Cognition Perceived quality Attitude
Purchase
intention
Pleasure 90 1.00 5.88 3.34 1.24 1.00
Cognition 90 .00 4.00 2.16 1.21 .44** 1.00
Perceived quality 90 1.17 7.00 4.56 1.02 .40** .03 1.00
Attitude 90 1.00 5.08 2.72 .83 .39** .11 .71** 1.00
Purchase intention 90 1.00 5.42 2.83 1.08 .41** .16 .66** .60** 1.00
c. Sample 1b
N Minimum Maximum Mean Standard
Deviation Pleasure Cognition
Perceived
quality Attitude
Purchase
intention
Pleasure 90 1.00 6.71 3.61 1.28 1.00
Cognition 90 .00 4.00 2.68 1.20 .46** 1.00
Perceived quality 90 1.00 7.00 4.61 1.05 .60** .08 1.00
Attitude 90 1.00 4.58 2.71 .77 .49** .08 .79** 1.00
Purchase intention 90 1.00 5.50 2.95 1.13 .52** .06 .69** .65** 1.00
* p < .05; ** p < .01; *** p < .001
145
Manipulation checks. Analyses of the manipulation-checks for our selection of
incongruent spots, showed that overall incongruency treatment, as well as absurd and
humorous treatment were successful. As a valid indicator of successful manipulation, we
asked participants to rate the ads according to their perceived absurd incongruency and
humorous incongruency. For the overall sample the incongruency condition shows strong
correlations coefficients for absurd incongruency (.66, p = .01) and humorous incongruency
(.72, p = .01). The same patterns hold for Sample 1a, where the incongruency condition is
significantly high correlated with perceived absurdity (.71, p = .01) and for Sample 1b, where
the incongruency condition is significantly high correlated with perceived humor (.71, p =
.01). The manipulation of incongruity according to objective coder assessment was verified
by participants’ subjective rating of the spots.
Preliminary analyses. The preliminary analyses check for the difference in the
conditions (congruency versus incongruency) on the proposed paths of processing (emotion
and cognition) and the ultimate outcome variable. We used a repeated measures ANOVA to
test for significant differences between conditions in a within-subject design. For overall
Sample 1, we found significant differences in pleasure between the congruency condition (M
= 2.66, SD = .83) relative to the incongruency condition (M = 4.29, SD = .95, Wilk’s λ= .18,
F(1, 44) = 207.53, p < .001, η2= .83), in cognition (Mcongruent = 3.18, SDcongruent = 1.68,
Mincongruent = 6.49 , SDincongruent = 1.20, Wilk’s λ= .17, F(1, 44) = 217.85, p < .001, η2 = .83)
and in purchase intention (Mcongruent = 2.74, SDcongruent = .98, Mincongruent = 3.09 , SDincongruent =
1.08, Wilk’s λ= .79, F(1, 44) = 11.67, p < .001, η2 = .21). Incongruency in ads increases the
level of perceived pleasure, stimulates cognitive processes as well as shows a higher level of
purchase interest. Thus, these variables need to be integrated for further analyses.
For Sample 1a, the results reveal a significant effect for pleasure (Mcongruent = 2.53,
SDcongruent = .87, Mincongruent = 4.16 , SDincongruent = 1.00,Wilk’s λ= .30, F(1, 44) = 104.19, p <
146
.0001, η2 = .70), for cognition (Mcongruent = 1.31, SDcongruent = .93, Mincongruent = 3.00,
SDincongruent = .80,Wilk’s λ= .25, F(1, 44) = 135.62, p < .0005, η2 = .76), and for purchase
intention (Mcongruent = 1.31, SDcongruent = .93, Mincongruent = 3.05, SDincongruent = 1.16,Wilk’s λ=
.81, F(1, 44) = 10.506, p < .0005, η2 = .19).
For Sample 1b, the findings showed a nearly similar pattern. We found a significant
effect for pleasure (Mcongruent = 2.79, SDcongruent = .89, Mincongruent = 4.42, SDincongruent = 1.09,
Wilk’s λ= .18, F (1, 44) = 205.08, p < .0005, η2 = .82), for cognition (Mcongruent = 1.87,
SDcongruent = 1.01, Mincongruent = 3.49, SDincongruent = .73, Wilk’s λ= .26, F (1, 44) = 122.38, p <
.0005, η2 = .74) and for purchase intention (Mcongruent = 2.76, SDcongruent = 1.11, Mincongruent =
3.14, SDincongruent = 1.13, Wilk’s λ= .83, F (1, 44) = 9.02, p < .0005, η2 = .17).
Being aware of the profound data restrictions of our study, we conducted a power
analysis using G*Power for all three samples. We base our analysis on the lowest η2 value,
which is .17 from Sample 1b testing significant differences in purchase intention. The
underlying assumption is that the lowest η2 value needs to exceed the threshold of .80 for
statistical power. If this is the case for the lowest η2 value, the statistical power is even higher
for the other η2values. The effect size in this study was .45 considered to be large using
Cohen's (1988) criteria. With an alpha = .05 and a sample size of N = 45, the expected
statistical power is approximately .83 for this simplest within subject comparison. Thus, our
proposed sample size of N = 45 satisfies the threshold of statistical power.
Serial mediation analyses. To test the underlying process of incongruency on ultimate
consumer-decision making, we performed a serial mediation analysis. We tested the causal
relationship of a four-step mediational chain of constructs. The incongruency condition
entered the model as the independent variable. Processing (pleasure or cognition), perceived
product quality, and attitude toward the brand (evoked by the ad), serve as serial mediators of
the effect of incongruency on purchase intention, which represents the dependent variable. In
order to account for the effect of the cognitive route of advertising processing, we included
147
cognition of the ad as a covariate, when investigating the serial mediation chain via emotional
processing. When testing the cognitive route of processing, we included pleasure as a
covariate. This should reduce spurious associations between the tested variables. Additionally,
we controlled for participants’ prior consumption of the advertised product and for gender
specific effects. To further investigate the causal direction between those variables, especially
the path of emotional as compared to cognitive processing, we run two serial mediation
analyses using PROCESS command and Model 6 according to Hayes (2013). The four-paths
model is depicted in Figure 2 and tested by the joint significance approach (MacKinnon et al.
2002, (Lachman and Agrigoroaei 2012; MacKinnon et al. 2002). This approach tests each
path in the mediational chain by using four separate regression models, one for each of the
outcome (mediator 1: processing variable, mediator 2: perceived quality, mediator 3: attitude,
and dependent variable: purchase intention). In line with Hayes (2013), we used the
bootstrapping method as it is considered the most powerful method, when testing under small
sample size. Bootstrapping does not depend on the normality assumption and is least
vulnerable to Type I error. It is an appropriate method to be used providing high confidence
on the results and yielding the highest statistical power (Fritz and Mackinnon 2007; Preacher
and Hayes 2004; Shrout and Bolger 2002; Zhao, Lynch, and Chen 2010). The statistical
significance on the conditional indirect effects is based on 10,000 bootstrap samples, using
95% confidence intervals and estimating the indirect effect as the mean out of theses 10,000
samples (Zhao, Lynch, and Chen 2010). This method is relatively invulnerable when
calculating inferences about indirect effects. Evidence for mediation is found, if the following
four paths are jointly significant: incongruency (𝑎1), processing path (𝑑21), perceived quality
(𝑑32), and attitude (𝑏4). The total, direct, and indirect effects of incongruency on purchase
intention were estimated by the PROCESS macro applying Model 6 (Hayes 2013), generating
percentile-based bootstrap confidence intervals (CI). “Confidence intervals for the indirect
effects are estimated in the usual way as the product of the path from the independent variable
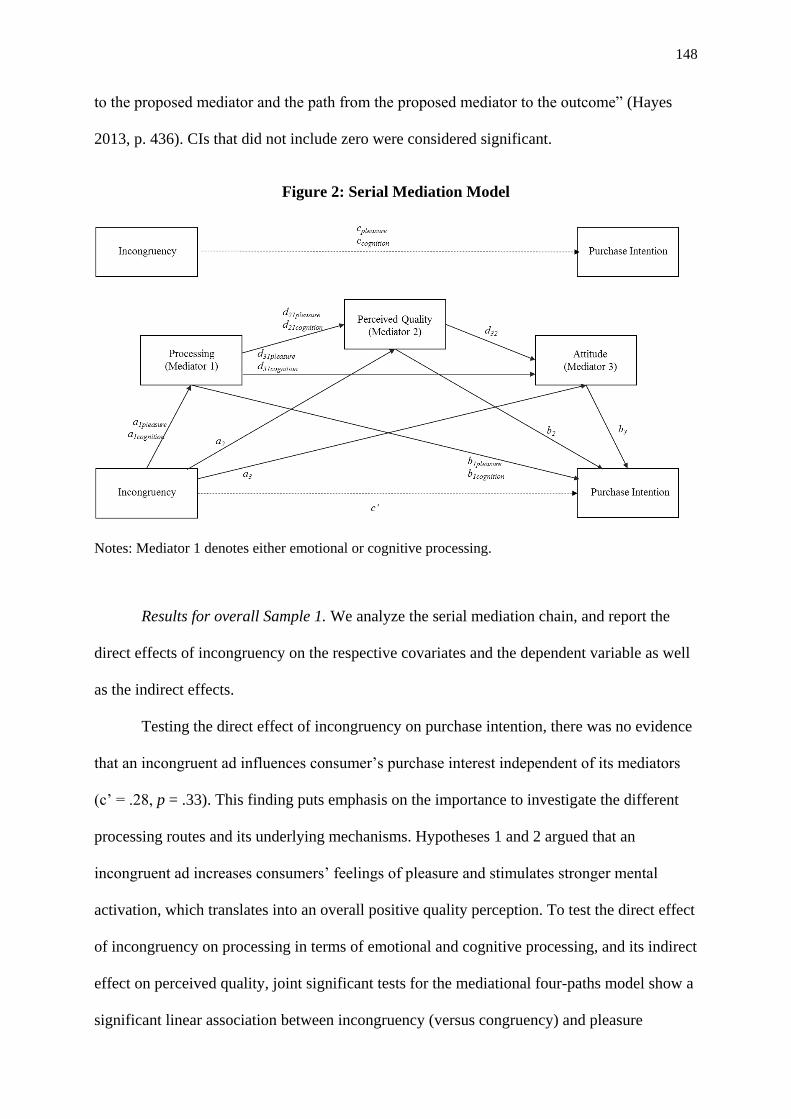
148
to the proposed mediator and the path from the proposed mediator to the outcome” (Hayes
2013, p. 436). CIs that did not include zero were considered significant.
Figure 2: Serial Mediation Model
Notes: Mediator 1 denotes either emotional or cognitive processing.
Results for overall Sample 1. We analyze the serial mediation chain, and report the
direct effects of incongruency on the respective covariates and the dependent variable as well
as the indirect effects.
Testing the direct effect of incongruency on purchase intention, there was no evidence
that an incongruent ad influences consumer’s purchase interest independent of its mediators
(c’ = .28, p = .33). This finding puts emphasis on the importance to investigate the different
processing routes and its underlying mechanisms. Hypotheses 1 and 2 argued that an
incongruent ad increases consumers’ feelings of pleasure and stimulates stronger mental
activation, which translates into an overall positive quality perception. To test the direct effect
of incongruency on processing in terms of emotional and cognitive processing, and its indirect
effect on perceived quality, joint significant tests for the mediational four-paths model show a
significant linear association between incongruency (versus congruency) and pleasure

149
[a1pleasure = 1.83, t(85) = 24.02, p < .001] and between incongruency and cognition [a1cognition =
3.60, t(85) = 32.41 , p < .001]. For pleasure and perceived quality the results reveal a
significant positive effect [d21pleasure = .57, t(84) = 13.38, p < .001]. The effect of cognition on
perceived quality was negative and nonsignificant [d21cognition = -.07, t(84) = 13.38, p = .25].
These findings confirm that an incongruent ad generates a higher level of pleasure than a
congruent ad, which translates into a positive effect on perceived quality. Likewise, an
incongruent ad represents a complex stimulus, which successfully triggers consumer’s mental
capacity as compared to a congruent ad. However, higher mental effort, which is supposed to
be directed towards the incongruent stimulus, comes at cost of lowered quality perceptions of
the product. Meaning, that incongruency is not compatible, when the manager’s ultimate goal
is to communicate favorable product attributes and benefits. In sum, we found direct effects of
incongruency on pleasure as well as on cognition and an indirect effect of incongruency on
perceived quality only mediated by pleasure, but not by cognition. As can be seen in Figure 3
and Table 2 the direct effect of incongruency on perceived quality was negative, meaning that
advertisements that are incongruent lead to poor perceived product quality (a2 = -.63, t(84) =
13.38, p < .001), because the evoked discrepancy does not fit the product’s value proposition
The results provide support for hypothesis 1 and partial support for hypothesis 2.
Hypothesis 3 argued that incongruent ads reduce the product’s perceived quality,
which in turn serves as a mediating variable in the serial advertising persuasion chain. The
higher the perceived quality, the stronger is the individual’s attitude toward the brand. In
support of hypothesis 3, the findings reveal a significant positive effect of perceived quality
on attitude [d32 = .48, t(83) = 28.07, p < .001], but a significant negative effect of
incongruency on quality [a2 = -.63, t(84) = 13.38, p <.001]. This finding points to the
necessity of communicating product quality in terms of attributes and benefits, because the
higher the product’s value as perceived by the individual, the higher is the overall evaluation
of the brand. However, an incongruent ad is not suitable to foster positive product quality
150
perceptions, due to the fact that the evoked discrepancy reduces the product value. In line with
hypothesis 3, the findings show that quality is supposed to serve as an important mediator of
overall evaluation, on which incongruency exerts a negative direct influence.
Hypothesis 4 stated that consumer’s overall attitude toward the brand determines the
overall purchase interest. Meaning, that a favorable overall evaluation converts into a higher
probability towards a final purchase, whereas, in line with the schema-discrepancy
mechanism, incongruency is expected to lower overall brand evaluation. According to the
results, attitude reveals a significant positive effect on purchase intention [b3 = .39, t(82) =
20.45, p <.05]. As opposed to this, the direct effect of incongruency on attitude was
significantly negative [a3 = -.62, t(83) = 28.07, p <.001], which puts emphasis on the
prominence of the schema-discrepancy mechanism over the excitation-transfer mechanism.
Additionally, the results show a significant negative indirect effect of incongruency on
purchase intention, mediated through the effect on attitude (a3 x b3 = -.24, bias-corrected
bootstrap CI based on 10,000 bootstrap sample did not include zero at the 95% level (lower-
level confidence interval [LLCI] = -.5524, upper-level confidence interval [ULCI = -.0587)),
which is consistent with the schema-discrepancy mechanism. The findings are in line with
hypothesis 4.
Testing hypothesis 5a, the total indirect effect of incongruency on purchase intention,
was mediated through the overall effect of pleasure (hypothesis 1), perceived quality
(hypothesis 3), and attitude (hypothesis 4) (a1pleasure x d21pleasure x d32 x b3 = .20, bias-corrected
bootstrap CI did not include zero at the 95% level (LLCI = .0501, ULCI = .4876)). These
findings provide initial evidence for the overall positive effect of the excitation-transfer
mechanisms triggered by an incongruent stimulus through emotional processing.
With regard to hypothesis 5b, testing the cognitive processing path, there was no
evidence for the indirect effect of incongruency on purchase intention, through the overall
serial effect of cognition (hypothesis 2), perceived quality (hypothesis 3), and attitude
151
(hypothesis 4) (a1cognition x d21cognition x d32 x b3 = -.05, bias-corrected bootstrap CI did include
zero at the 95% level (LLCI = -.2249, ULCI = .0335)). However, a significant positive
indirect effect of incongruency on purchase intention mediated through cognition and attitude
was found (a1cognition x d31cognition x b3 = .10, bias-corrected bootstrap CI was entirely above
zero (LLCI = .0152, ULCI = .3310)). The results suggest that cognitive processing is
activated by an incongruent stimulus, though perceived quality does not mediate the effect of
cognition on attitude. To state it differently, an incongruent ad is expected to lead to higher
awareness, stronger activation of consumer’s mental structures, and deeper processing. In line
with the familiarity mechanism, intense memorization subconsciously connects the brand with
the individual’s consideration set, independent of the promoted attributes and benefits and
positively stimulates attitude.
The direct effect of incongruency on purchase intention was c’ = .28 (LLCI = -.2887,
ULCI = .8521), but not significant. As opposed to this, the total effect of incongruency on
purchase intention10 was positive for the serial mediation through pleasure, perceived quality,
and attitude (cpleasure = .57, LLCI = .0299, ULCI = 1.1016) and negative for the serial
mediation through cognition, perceived quality, and attitude (ccognition = -.51, LLCI = -.9487,
ULCI = -.0784). 11
Given that this study is an exploratory analysis based on a small data set, we check the
robustness of our results by a statistical power analysis for sample size estimation, based on
our survey data (N = 90). The effect size for Sample 1 was f2 = 1.74, considered to be
extremely large using Cohen (1988) criteria. With an alpha = .05 and power = .08, the
projected sample size needed with this effect size is approximately 17. Thus, our sample size
10 We explored the existence of a curvilinear mediating relationship between pleasure respectively cognition and
purchase intention, but the results reveal a nonsignificant curvilinear effect (b21pleasure = -.073, p > .10; b2
1cognition =
.001, p > .10). Same results were found for the model fit and the variance explained, which did not increase
significantly (Hayes 2015). 11 We tested for the possibility of multicollinearity between the mediating variables, but variance inflation factors
were well below 10, concluding that multicollinearity did not impact the results.

152
of N = 90 seems to be appropriate for the multiple regression analysis. Checking the statistical
power of our multiple regression model, the power analysis reveals a value of 1.0, with an
alpha = .05, and seven predictors included in the model. The power value exceeds the
threshold value of .80, concluding the high statistical power of our model (Cohen 1988, Hunt
2015).
The results provide primary evidence that incongruency exhibits no direct effect on
consumer behavior, but several indirect effects. First, incongruency has a positive effect via
the emotional processing route. Supporting the existence of the excitation-transfer
mechanism, the positive effect on the perceived pleasure transfers into an overall positive
effect on purchase intention, serially mediated by perceived quality and attitude. Second,
incongruency exhibits a positive effect on purchase intention serially mediated by cognition
and attitude, which provides support for the existence of the familiarity mechanism and the
cognitive processing route. Third, both serial processing paths (emotional and cognitive
processing route) face the opposing effect of the schema-discrepancy mechanism (negative
effect of incongruency on purchase intention meditated by attitude toward the brand).
Consequently, we have three underlying mechanisms operating in parallel via three routes of
processing, depending on the strength of each mechanism, the overall effect of incongruency
on behavior will be positive or negative.
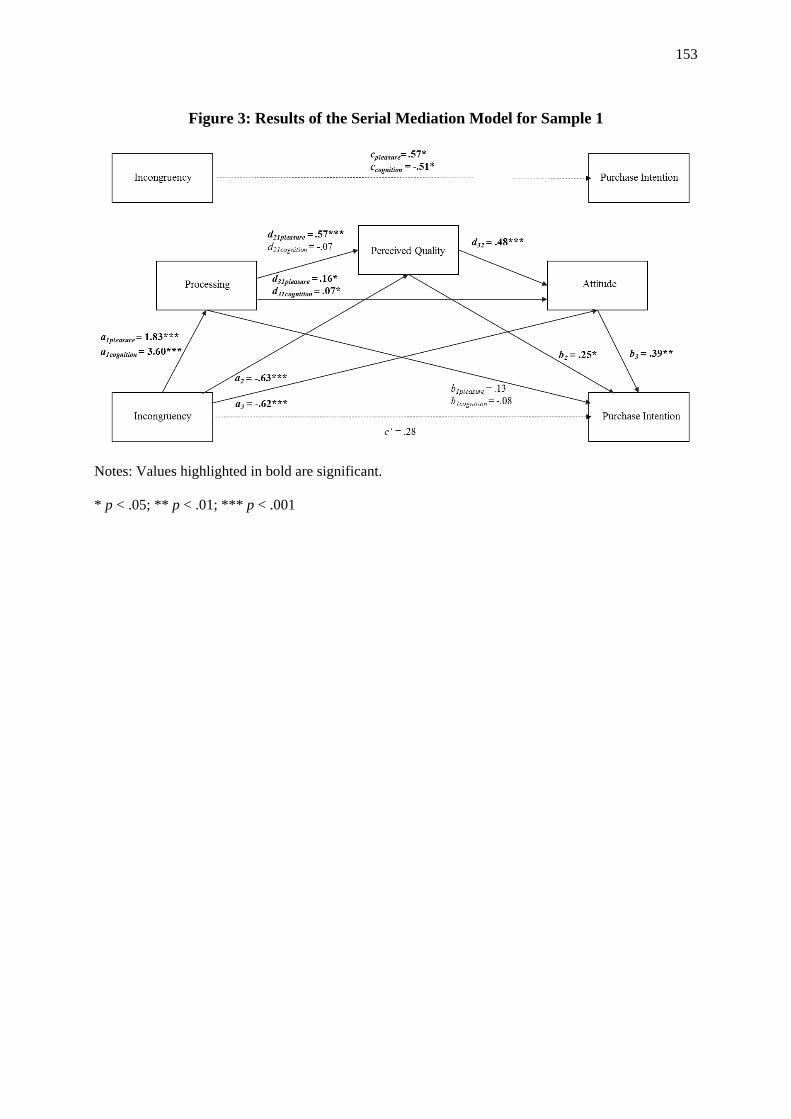
153
Figure 3: Results of the Serial Mediation Model for Sample 1
Notes: Values highlighted in bold are significant.
* p < .05; ** p < .01; *** p < .001
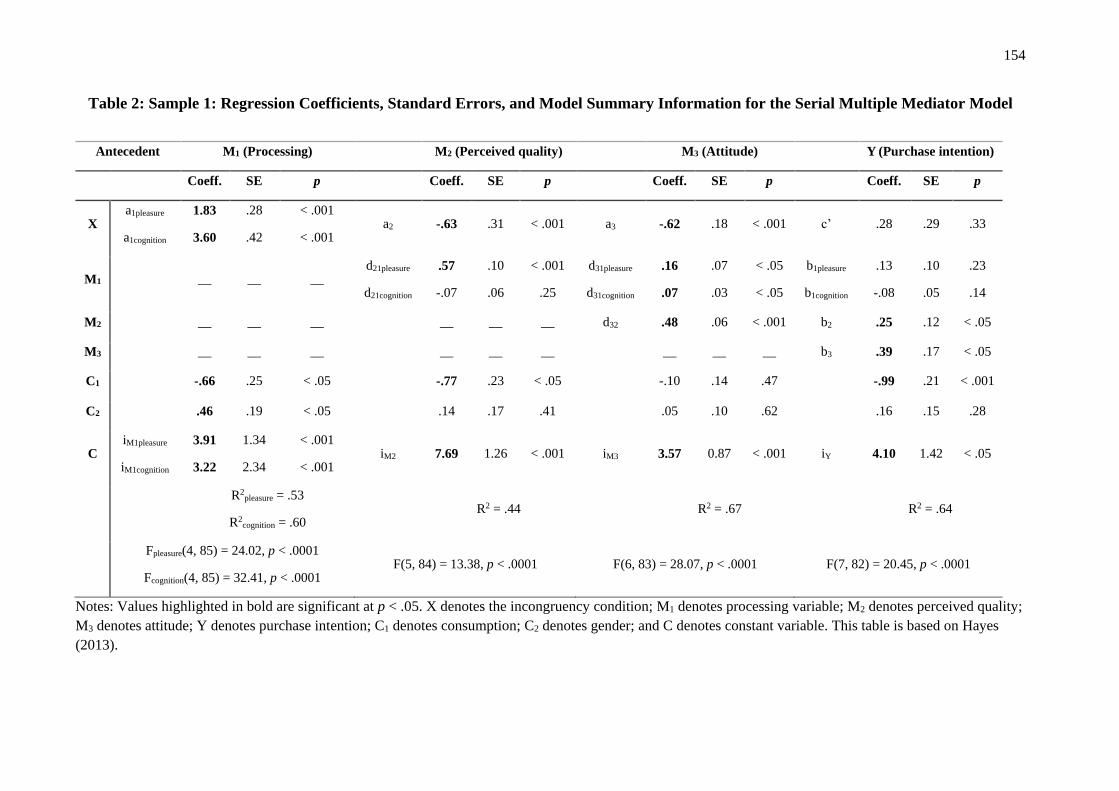
154
Table 2: Sample 1: Regression Coefficients, Standard Errors, and Model Summary Information for the Serial Multiple Mediator Model
Antecedent M1 (Processing) M2 (Perceived quality) M3 (Attitude) Y (Purchase intention)
Coeff. SE p Coeff. SE p Coeff. SE p Coeff. SE p
X a1pleasure
a1cognition
1.83
3.60
.28
.42
< .001
< .001 a2 -.63 .31 < .001 a3 -.62 .18 < .001 c’ .28 .29 .33
M1 __ __ __ d21pleasure
d21cognition
.57
-.07
.10
.06
< .001
.25
d31pleasure
d31cognition
.16
.07
.07
.03
< .05
< .05
b1pleasure
b1cognition
.13
-.08
.10
.05
.23
.14
M2 __ __ __ __ __ __ d32 .48 .06 < .001 b2 .25 .12 < .05
M3
__ __ __
__ __ __
__ __ __ b3 .39 .17 < .05
C1 -.66 .25 < .05 -.77 .23 < .05 -.10 .14 .47 -.99 .21 < .001
C2 .46 .19 < .05 .14 .17 .41 .05 .10 .62 .16 .15 .28
C iM1pleasure
iM1cognition
3.91
3.22
1.34
2.34
< .001
< .001 iM2 7.69 1.26 < .001 iM3 3.57 0.87 < .001 iY 4.10 1.42 < .05
R2
pleasure = .53
R2cognition = .60
R2 = .44 R2 = .67 R2 = .64
Fpleasure(4, 85) = 24.02, p < .0001
Fcognition(4, 85) = 32.41, p < .0001 F(5, 84) = 13.38, p < .0001 F(6, 83) = 28.07, p < .0001 F(7, 82) = 20.45, p < .0001
Notes: Values highlighted in bold are significant at p < .05. X denotes the incongruency condition; M1 denotes processing variable; M2 denotes perceived quality;
M3 denotes attitude; Y denotes purchase intention; C1 denotes consumption; C2 denotes gender; and C denotes constant variable. This table is based on Hayes
(2013).

155
Serial mediation model for absurd incongruency and humorous incongruency and
robustness checks. To test whether our findings are replicable for a specific type of
incongruency, we run the serial mediation model for absurd incongruent versus congruent ads
(Sample 1a) and humorous incongruent versus congruent ads (Sample 1b) separately. The
identical pattern of processing routes and underlying mechanisms across all three types of
grouping, serve as robustness check for our results. Therefore, we need to restructure the data
and disaggregate the spots on incongruency, in order to test the effect of absurd incongruency
and humorous incongruency on consumer behavior, separately.
Results for Sample 1a. Sample 1a consists of 90 observations, testing the effect of
absurd incongruency versus congruency. The results show similar pattern for hypothesis 1
(positive effect of incongruency on pleasure: a1pleasure = 1.82, t(85) = 21.19, p < .001;
mediating effect of pleasure on perceived quality d21pleasure = .40, t(84) = 9.68, p < .001).
Likewise, as for overall Sample 1, the results are replicable for hypothesis 2 (positive effect of
incongruency on cognition: a1cognition = 1.86, t(85) = 23.93, p < .001; nonsignificant mediating
effect of cognition on perceived quality d21cognition = -.10, t(84) = 9.68, p = .34) and for
hypothesis 3 (nonsignificant negative effect of incongruency on perceived quality a2 = -.43,
t(84) = 9.68, p = .17; mediating effect of perceived quality on attitude: d32 = .50, t(83) =
19.11, p < .001). Testing the effect of incongruency on attitude and its mediating role in
advertising persuasion, there is significant evidence for hypothesis 4 (negative significant
effect of incongruency on attitude: a3 = -.62, t(83) = 19.11, p < .005; positive significant
effect of attitude on purchase intention b3 = .34, t(82) = 19.46, p < .05, negative indirect of
incongruency on purchase intention mediated by attitude: a3 x b3 = -.21, LLCI = -.5233, ULCI
= -.0523). The results are summarized in Table 3. Examining the four-paths serial mediation
model, we found that the total effect of incongruency on purchase intention was positive for
the serial mediation through pleasure, perceived quality, and attitude (cpleasure = .49, LLCI =
.0020, ULCI = 0.9854) and negative, but not significant for the serial mediation through

156
cognition, perceived quality, and attitude (ccognition = -.16, LLCI = -.6131, ULCI = .2902). The
results replicate the findings for the overall incongruency sample and are consistent with
hypothesis 5a. Regarding hypothesis 5b, incongruency does not exhibit an impact through the
four-path cognitive processing route. However, in line with overall Sample 1, we found
evidence for the effect of incongruency on purchase intention via a three-paths model, where
cognition and attitude serve as significant serial mediators of the total indirect effect (a1cognition
x d31cognition x b3cognition = .10, LLCI = .0048, ULCI = .3115). Similar to the findings from the
overall incongruency sample, the two positive indirect effects of incongruency via cognitive
and emotional processing are opposed to the negative indirect effect of incongruency on
purchase intention mediated by attitude (a3 x b3 = -.21, LLCI = -.5233, ULCI = -.0523). The
results replicate the contrarian mechanisms, i.e. on the one hand, the positive effect through
excitation-transfer and familiarity mechanisms and on the other hand, the negative effect
through schema-discrepancy mechanism.

157
Table 3: Sample 1a: Regression Coefficients, Standard Errors, and Model Summary Information for the Serial Multiple Mediator Model
Antecedent M1 (Processing) M2 (Perceived quality) M3 (Attitude) Y (Purchase intention)
Coeff. SE p Coeff. SE p Coeff. SE p Coeff. SE p
X a1pleasure
a1cognition
1.82
1.86
.27
.24
< .001
< .001 a2 -.43 .31 .17 a3 -.62 .21 < .005 c’ .41 .25 .14
M1 __ __ __ d21pleasure
d21cognition
.40
-.10
.10
.11
< .001
.34
d31pleasure
d31cognition
.20
.15
.07
.07
< .05
< .05
b1pleasure
b1cognition
.02
-.10 .09…10
.82
.28
M2 __ __ __ __ __ __ d32 .50 .07 < .001 b2 .27 .11 < .05
M3 __ __ __
__ __ __
__ __ __ b3 .34 .14 < .05
C1 -.60 .27 < .05 -1.12 .26 < .001 -.01 .19 .98 -1.23 .23 < .001
C2 .49 .20 < .05 .20 .19 .30 .08 .13 .53 .26 .16 .10
C iM1pleasure
iM1cognition
3.32
1.15
1.45
1.40
< .05
.28 iM2 9.70 1.34 < .001 iM3 2.86 1.16 < .05 iY 5.44 2.50 < .005
R2
pleasure = .50
R2cognition = .53
R2 = .37 R2 = .58 R2 = .62
Fpleasure(4, 85) = 21.19, p < .0001
Fcognition(4, 85) = 23.93, p < .0001 F(5, 84) = 9.68, p < .0001 F(6, 83) = 19.11, p < .0001 F(7, 82) = 19.46, p < .0001
Notes: Values highlighted in bold are significant at p < .05. X denotes the incongruency condition; M1 denotes processing variable; M2 denotes perceived quality;
M3 denotes attitude; Y denotes purchase intention; C1 denotes consumption; C2 denotes gender; and C denotes constant variable. This table is based on Hayes
(2013).
158
Results for Sample 1b. Sample 1b consists of 90 observations, testing the effect of
humorous incongruency versus congruency. The results show similar pattern for hypotheses
1, 2, 3 and 4, which are presented in Table 4. For the humorous incongruency grouping, the
results provide evidence for hypothesis 1 that pleasure serves as a significant positive
mediator of the effect of incongruency on perceived quality (a1pleasure = 1.56, t(85) = 18.66, p
< .001; mediating effect of pleasure on perceived quality d21pleasure = .64, t(84) = 16.27, p <
.001). Similar as to the overall sample and the absurd incongruency grouping of spots, the
results for humorous incongruency partially support hypothesis 2. That is, a humorous
incongruent spot has a positive effect on individuals’ cognition (a1cognition = 1.62, t(85) =
21.39, p < .001), but deeper memorization does not impact consumers quality perceptions of
the product (nonsignificant mediating effect of cognition on perceived quality d21cognition =
-.11, t(84) = 16.27, p = .30). Quality perceptions significantly decreased for an incongruent
stimulus (a2 = -.71, t(84) = 16.27, p < .05). In turn a lower perceived product value transfers
into a lower attitudinal perception (d32 = .52, t(83) = 26.89, p < .001, which confirms
hypothesis 3. In line with hypothesis 4, incongruency and its evoked dissonance with
established schemata exhibit a negative effect on attitude (a3 = -.42, t(83) = 26.89, p < .005),
which in turn positively mediates the effect of incongruency on purchase intention (b3 = .39,
t(82) = 16.40, p < .05). In total, the indirect effect of incongruency through attitude is
significantly negative (a3 x b3 = -.16, LLCI = -.4113, ULCI = -.0382). Overall, the findings
depict a significant mediational linkage of incongruency through emotional processing, i.e.
perceived quality, attitude formation, and purchase intention (a1pleasure x d21pleasure x d32 x b3 =
.20, LLCI = .0470, ULCI = 0.4883). Conversely, the indirect effect of incongruency on
purchase intention mediated by cognition, perceived quality, and attitude formation was
nonsignificant (a1cognition x d21cognition x d32 x b3 = -.03, LLCI = -.1661, ULCI = .0295). We
conclude that humorous incongruency does not influence consumer behavior via the cognitive
processing route, but solely through emotional processing. When examining the total effect of

159
incongruency, we found opposing results as compared to Sample 1a. The total effect of
incongruency on purchase intention was positive, but not significant for the serial mediation
through pleasure, perceived quality, and attitude (cpleasure = .35, LLCI = -.2284, ULCI = .9358)
and significantly negative for the serial mediation through cognition, perceived quality, and
attitude (ccognition = -.74, LLCI = -1.2251, ULCI = -.2623).

160
Table 4: Sample 1b: Regression Coefficients, Standard Errors, and Model Summary Information for the Serial Multiple Mediator Model
Antecedent M1 (Processing) M2 (Perceived quality) M3 (Attitude) Y (Purchase intention)
Coeff. SE p Coeff. SE p Coeff. SE p Coeff. SE p
X a1pleasure
a1cognition
1.56
1.62
.28
.24
< .001
< .001 a2 -.71 .27 < .05 a3 -.42 .17 < .005 c’ .06 .28 .84
M1 __ __ __ d21pleasure
d21cognition
.64
-.11
.09
.10
< .001
.30
d31pleasure
d31cognition
.10
.08
.07
.06
.14
.19
b1pleasure
b1cognition
.16
-.16
.11
.10
.15
.11
M2 __ __ __ __ __ __ d32 .52 .07 < .001 b2 .29 .14 < .05
M3 __ __ __
__ __ __
__ __ __ b3 .39 .18 < .05
C1 -.52 .24 < .05 -.51 .19 < .05 -.08 .12 .52 -.69 .2 < .05
C2 .47 .21 < .05 .06 .17 .73 .02 .11 .82 .06 .17 .73
C iM1pleasure
iM1cognition
3.35
.87
1.28
1.28
< .05
.50 iM2 6.20 1.15 < .001 iM3 3.33 .81 < .005 iY 2.77 1.44 .06
R2
pleasure = .47
R2cognition = .50
R2 =.49 R2 = .66 R2 = .58
Fpleasure(4, 85) = 18.66, p < .0001
Fcognition(4, 85) = 21.39, p < .0001 F(5, 84) = 16.27, p < .0001 F(6, 83) = 26.89, p < .0001 F(7, 82) = 16.40, p < .0001
Notes: Values highlighted in bold are significant at p < .05. X denotes the incongruency condition; M1 denotes processing variable; M2 denotes perceived quality;
M3 denotes attitude; Y denotes purchase intention; C1 denotes consumption; C2 denotes gender; and C denotes constant variable. This table is based on Hayes
(2013).

161
In sum, the results of our exploratory study provide a first indication that incongruency
is expected to exhibit a positive significant direct effect on pleasure, cognition, and purchase
intention. However, for purchase intention the effect of incongruency was nonsignificant in
all three samples. For the perceived quality and brand attitude, incongruent ads have a
negative direct effect, meaning that incongruent spots as compared to congruent spots, lead to
a decrease in quality perceptions of the product and to negative evaluations of the brand. The
negative effect of incongruency on attitude was in all three samples significant.
For the indirect effect of incongruency on purchase intention, we found that both
processing routes (emotional and cognitive) serially mediate the effect of incongruency. That
is, for the emotional processing route we obtained a positive significant mediation of
incongruency on purchase intention through pleasure, perceived quality, and attitude.
Incongruency in advertising triggers an inner state of arousal due to the novel and surprising
stimulus, which does not confirm existing schemata. This in turn arouses a positive feeling of
pleasure, which is transferred on consumers’ overall evaluation and attitude toward the brand
(excitation-transfer-mechanism). The indirect effect of pleasure translates into higher
purchase intention.
For cognitive processing, the results reveal a significant serial mediation route of
incongruency on purchase intention through cognition and attitude, induced by the familiarity
mechanism. The perceived discrepancy caused by an incongruent stimulus, triggers
consumer’s mental structures and builds up stronger cognitive linkages with the brand in the
mindset. This turns into on overall indirect effect of incongruency. That is, the established
cognitive linkages lead to an overall positive evaluation, which influences purchase behavior,
because an implicit effect of incongruency through memory is transferred on attitude and final
purchase decision, so called familiarity mechanism. Given, that incongruency activates high
mental capacity, the stimulus is processed deeper and hence, rooted in the consideration set.
For purchase decisions the established cognitive structures serve as subconscious hints, which

162
induce buying intentions. This is in line with the established mere exposure or sleeping effect,
postulating the unconscious influence of brand familiarity (Lee and Mason 1999).
However, there is also evidence of a negative indirect effect of incongruency on
purchase intention mediated by attitude, which replicates to a given extent past research’s
findings. Incongruent as compared to congruent stimuli transfer into negative attitudinal
evaluations, due to the perceived cognitive dissonance, which negatively impacts decision-
making (schema-discrepancy mechanism). The negative effect of incongruency on attitude
resulting in a lower intention to purchase, is in line with previous literature on absurdity in
advertising. We find this effect also for humorous ads, concluding that the underlying
mechanism across different types of incongruency is the same. That is, consumers perceive a
certain degree of discrepancy induced by the incongruent stimulus, which results in a
prominent negative effect on attitude formation. The incongruent stimulus, does not fit the
individual’s established brand associations. Given the nature of incongruency as a stimulus
that automatically triggers physical arousal driven by the perceived schema-discrepancy
(Mandler 1982), the third mechanism is independent of either cognitive or emotional
processing route, but rather represents an additional automatic processing route. This is in
line with earlier postulations by Berkowitz (1993) and Malhotra (2005), stating that being
exposed to a stimulus, usually three different processes are triggered, i.e.: automatic (arousal),
cognitive, and emotional processes.
Hence, we conclude, that there are three major competing mechanisms affecting
ultimate consumer behavior. Depending on the dominance of one mechanism the overall
indirect effect of incongruency on purchase intention is positive or either negative. Of course,
the generalizability is limited due to data set restrictions. Controlling for the familiarity
mechanism, the results show, that feelings of pleasure and hence, the excitation-transfer
mechanism, dominate the evoked schema-discrepancy between the ad and the brand.
However, when controlling for pleasure and thus, the underlying excitation-transfer

163
mechanism, schema-discrepancy outweighs the positive effect of cognitive processing and the
familiarity mechanism. To state it differently, the generated memorial cues by an incongruent
ad, which transfer to a positive effect on attitude do not outweigh the evoked feelings of inner
discrepancy.
Given our findings, we demonstrate that the nature of incongruency is complex and
needs to take into consideration that it has both, positive and negative effects on behavior.
Designing an advertisement that is highly incongruent, we expect it to trigger deeper
cognitive activation, which causes a certain feeling of familiarity and affiliation. Nevertheless,
the ad may fail to positively induce consumer’s behavioral intentions, when the incongruent
stimulus does not sufficiently please and amuse the individual. Pleasure plays an important
role in turning an incongruent ad, and its evoked schema-discrepancy, into purchase intent.
This means that besides successfully creating awareness for the incongruent ad and standing
out from competition due to the evoked dissonance, a positive conative outcome is
predominantly driven by the level of pleasure. The double-edged sword of incongruency in
terms of negative schema-discrepancy mechanism and opposed familiarity mechanism, is
expected to be dominated by the mental disequilibrium.
Comparing the effects of absurd incongruency and humorous incongruency, we
replicated the mechanism of excitation-transfer and found a significant positive effect of
absurd incongruency on purchase intention through the route of emotional processing. This
effect was positive, but nonsignificant for humorous incongruency. We suggest that given our
experimental setting of showing each spot four times, the arousal triggered by humorous
incongruency is depleted for four exposures and not strong enough. This also explains the
dominance of the total negative effect on purchase intention. We assume that for humorous
incongruency after four exposures the positive effect through both, the familiarity and the
excitation-transfer mechanism of pleasure driven by surprise and novelty, shift into boredom
and tedium, which enforce the negative schema-discrepancy mechanism. The effect of
164
incongruency on pleasure remains prominent in the absurd sample. We conclude that absurd
incongruency is expected to exercise a stronger and long-lasting impact on overall ad
effectiveness.
GENERAL DISCUSSION
Summary and Conclusion
This article analyzed the activated organismic processes and underlying mechanisms
by an incongruent stimulus. Incongruency does not have a direct effect on purchase behavior,
but, we expect that both processing routes (emotional and cognitive) serially mediate the
effect of incongruency. To state it differently, our results show a positive significant
mediation of incongruency on purchase intention through pleasure, perceived quality, and
attitude, which is an indicator for the emotional processing route. For cognitive processing,
the findings reveal a significant serial mediation route of incongruency on purchase intention
through cognition and attitude, having a positive effect. However, there is also evidence of an
impulsive negative indirect effect of incongruency on purchase intention mediated by attitude.
Incongruent ads that are used to break through the ad clutter and generate attention through its
evoked discrepancy, automatically induce negative evaluations towards the brand.
Incongruency acts as a double-edged sword. On the one hand, incongruent ads are used to
stand out from competition by means of schema-discrepancy, which is negatively evaluated
by the individual. On the other hand, the schema-discrepancy leads to a stronger mental
activation and memorization, which subconsciously causes perceptions of familiarity with the
brand. This mechanism directly impacts positive evaluations of the brand, independent of the
consumer’s perceived value of the product’s quality. For products that do not differentiate
from competitors by superior attributes and benefits, incongruency serves as a promising
strategy to evoke favorable effects toward the brand regardless of the product quality.

165
However, the familiarity perceptions alone are not capable to dominate the overly
negative perceived disequilibrium. That is, the ad and the brand will be memorized stronger
as compared to congruent ads, likewise the overall brand evaluation will still be negatively
connoted. In order to outweigh this dominant self-acting negative effect, we found primary
evidence that pleasure plays a crucial role in reversing this negative outcome into a positive
effect. If the incongruent ad is perceived by the consumer as highly amusing and entertaining,
the inner discrepancy can be drown out by the positive feelings of pleasure, which increases
overall purchase interest. Thus, it is important to outbalance the schema-discrepancy, which is
primarily used by advertisers to generate attention, with enjoyable and diverting ad elements.
The net effect is supposed to depend on three aspects: the level of schema-discrepancy, the
level of pleasure, and the level of memorization. This implies that incongruent ads need to
fulfill a certain level of pleasure to increase ad effectiveness in terms of conative outcomes.
Further, we tested different content types of incongruency, but the underlying
mechanism of incongruency exerted on purchase intention are representative across all
samples. However, we found that for humorous incongruency the overall effect is dominated
by the incongruency-discrepancy mechanism, whereas for absurd incongruency the overall
effect is positive and driven by the excitation-transfer mechanism of pleasure. This finding
allows for the assumption that absurd incongruent ads are more effective in creating feelings
of pleasure for repeated exposures. We expect humorous incongruency to work for single
exposure, but considering repetitions of an ad, absurd incongruency is an effective marketing
strategy, because the excitation-transfer effect seems to be persistent over time.
Our work contributes to incongruency and advertising persuasion theory. To the best
of our knowledge, this is the first study to systematically examine the effects of incongruency
and its underlying mechanisms on information processing and consumer decision-making.
Particularly, this study sought to explore the effects of incongruency in advertising through
the mediating role of emotional and cognitive processing. We used real-life TV ads placed in
166
a documentary, such that the effects found on incongruency are likely to occur in a real-life
setting, which contributes within its limitations to a certain degree to the generalizability. We
provided initial evidence for the effects of incongruent advertisements on consumer decision-
making. As opposed to recent research, the results show that incongruency influences
purchase decision via three major mechanisms, which exert opposing effects on final
consumer response. Specifically, we have demonstrated that not taking into account the
different mediational effects of incongruency through pleasure and cognition, may bias the
effect of incongruency on attitude and hence, on purchase intention. Prior studies reporting a
negative evaluation of incongruent ads suffer from the bias due to the omission of pleasure as
significant mediator. This means, for incongruent ads that do not cause consumer pleasure the
direct effect on attitude and the subsequent effect on individual’s outcome behavior will be
negative. As opposed to this, incongruent ads that trigger pleasure transfer and outweigh the
negative schema-discrepancy mechanism, result in a positive effect on perceived quality,
attitude, and finally purchase intention. Prior literature argues that advertising persuasion
follows a causal chain of steps (Lavidge and Steiner 1961) by two prominent routes of
persuasion working in parallel (Albers-Miller and Stafford 1999; Kotler and Armstrong 2016;
Stewart, Morris, and Grover 2009). Consequently, the commonly used advertising persuasion
model needs to be extended, leading to a multiple serial chain of advertising persuasion (see
Figure 4) driven by three major processes.

167
Figure 4: Extended Framework on Advertising Persuasion
Managerial Implications
Advertising management needs to understand and leverage the effect of incongruency in
advertisements and the mediating effect of different processing routes, explaining ultimate
behavior. Our findings indicate that incongruent advertisements do not automatically transfer into
a positive or negative effect on consumer behavior, but rather underlie three major mechanisms.
Especially, the negative mechanism of incongruency on attitude should not be underestimated.
However, from our findings, we can conclude that generating a sufficiently high entertainment
level, outweighs the negative effect. As a result, advertising managers can be more confident that
pleasure plays a major role in the complex effect structure of incongruency on individuals’
responses and does not distract the consumer from the ad’s message. Managers using incongruent
ads to trigger consumer attention, should always consider a high entertainment factor evoked by
the ad. From our results, we suggest that for absurd incongruency the perceived pleasure level is
168
maintained over repeated exposures, which does not hold for humorous incongruency in ads. This
is supposed to be due to the decay in the pleasantness of humorous ads for repeated exposure.
Within our sample, we tested all effects after four repetitions. Humorous ads are expected not to
be funny anymore, because once the joke is understood the underlying incongruency is resolved.
Whereas absurd ads still entertain the consumer by a certain degree of novelty and the challenge
to resolve the incongruency. Mangers should pay attention to the pleasure factor, the evoked
incongruency-discrepancy, and the familiarization of the brand. If the pleasure factor is low, the
evoked schema-discrepancy mechanisms dominates and the initial novelty and surprise of the
stimulus may quickly diminish. If the schema-discrepancy is too low, managers may face the
general problem of lacking consumer attention.
Another finding is that incongruent ads are able to generate a strong impact on consumer
memory and can therefore increase advertisement’s reach and attention. That is, incongruent ads
that are displayed through viral media, have the potential to multiply consumer attention and
recall. If managers want to create brand awareness for established brands and change brand
image, incongruency can help to reposition the brand in consumers’ mind by changing existing
cognitive schemata. For example, a conservative brand that wants to create a more vivid brand
image, can use incongruency to surprise consumers and erode established expectations towards
the new positioning. However, we would suggest to carefully use incongruency for unfamiliar
brands, because individuals’ that have a low tolerance level for discrepancy and are not familiar
with the brand, may face the schema-discrepancy mechanism dominating. Similarly, we would
expect incongruency to work for hedonic products, which predominantly convince the consumer
by emotional appeals evoking positive feelings, whereas utilitarian products basically convince
the consumer through rational appeals, i.e. through favorable attributes and benefits. Using
169
incongruency for utilitarian products could have eroding negative effects such that individuals
refuse to buy products that do not match their rational expectations.
In sum, the study shed light on the underlying psychological processes of incongruency
that drive behavior. On the one hand incongruency can contribute to advertising effectiveness by
increasing cognitive linkages with the brand in the consideration set, and likewise amuse the
consumer which transfers into a favorable purchase interest. On the other hand, the perceived
schema-discrepancy, which causes an automatic organismic reaction, can be overly large, which
leads to an overall negative evaluation brand predisposition to the brand impeding purchase
interest. This helps managers to manipulate the main factors enhancing advertising effectiveness
and thus, impacting sales in the long-run.
Limitations and Further Research
Our work, especially the exploratory study, has several limitations that need
acknowledgement and require more attention in future research. First, we face restrictions with
regard to our experimental setting. Our exploratory study was used to uncover first indications on
the expected organismic processes. The sample size of our exploratory study is relatively small,
although still obtaining significant results, replicating the study with a larger sample size, would
contribute to the generalizability of our findings. Additionally, we used a within-subjects design,
which is applicable to test ad content. However, a between-subject design, showing similar
findings, would enhance the validity of our results.
Second, our incongruency treatment was based on spots that have already been
broadcasted in Germany. Even though we put great effort in eliminating confounds by making
great demands on the spot selection. This means, that we only included incongruent spots that do
not significantly vary in any other content dimension in order to partial out these uncontrollable
effects, when using real-world ads. We recommend for future research to design fictitious spots
170
that only differ in the humorous and absurd incongruency condition, while holding all other
dimensions such as brand, setting, spokesperson and ad story constant. This is advantageous,
because it controls for spot specific effects, but also eliminates biased effects due to prior brand
knowledge or consumption. As indicated in the literature, incongruency might have a curvilinear
effect (Mai and Hutter 2014), to test this assumption, different levels of incongruency can be
implemented in the design of fictitious spots. Furthermore, our sample focused on FMCG from
product categories yoghurt and chocolate, indicating low involvement purchase decision
behavior. In order to generalize our findings, other non-food FMCG product categories should be
tested. Moreover, with regard to high involvement products incongruent ads are expected to exert
a different effect. Consumers buying high involvement products have a different predisposition
towards the purchase process. They are prone to be more involved, having greater product
expectations, which may not be compatible with incongruency. It is supposed that the negative
indirect effect of incongruency mediated by attitude, will dominate. Future research could
examine the heterogeneity of the effect of incongruency for different product categories and
levels of involvement.
Third, our study analyzes the effect of incongruency on advertising effectiveness based on
consumer behavior. Therefore, we used implicitly self-reported measurements to capture the
processing routes. This measurement technique reflects consumer conscious perceptions. Future
research could replicate our findings by means of subconscious measurement techniques. Using
for example EEG methodology, enhances the representativeness of self-reported findings.
Additionally, a follow-up study could investigate the link between brain responses, consumer
behavior and the ultimate effect on sales.
Fourth, our research investigated the effect of incongruency over four exposures. We
could not identify the magnitude of the different processing paths across varying levels of
171
exposure. Exploring the wear-in and wear-out effects of incongruency on the underlying
mechanisms could provide insights into the relative strengths of each processing mechanism for
varying levels of exposure. This would shed light on the so far neglected moderating role of
repetition on the processing chain of an incongruent stimulus, i.e. how do different types and/or
levels of incongruity (humor and absurdity) impact consumer information processing as well as
affective, cognitive, and conative responses (Lee and Schumann 2004). By means of EEG
methodology, the wear-in and wear-out effects of an incongruent stimulus can be measured. EEG
methodology allows to track brain wave activity, which is linked to automatic, cognitive, and
emotional processes (Astolfi et al. 2008; Boksem and Smidts 2015; Kong, Zhao, and Hu 2013;
Ohme et al. 2009; Ohme, Matukin, and Szczurko 2010; Silberstein and Nield 2008; Smith and
Gevin 2004; Vecchiato et al. 2010, 2011; Young 2002). As compared to self-reporting data, this
method offers the possibility to compare the effect of repetition for a group of participants
(within-subject design), which is free of interviewer or social response bias. Understanding, the
wear-in and wear-out patterns, would help managers to optimize their advertising strategies, in
terms of deciding how many times humorous versus absurd ads should be broadcasted until a
wear-out effect is expected. This would help managers, to better calculate the number of
exposures for different content strategies. Additionally, it would shed light, on our suggestions
that humorous incongruent ads wear out faster than absurd ads.
172
REFERENCES
Aaker, David A. and Alexander Biel (1993), Brand Equity & Advertising: Advertising’s Role in
Building Strong Brands.
——— and Donald E. Bruzzone (1985), “Causes of Irritation in Advertising,” Journal of
Marketing, 49 (2), 47–57.
Aaker, Jennifer L. and Patti Williams (1998), “Empathy versus Pride: The Influence of
Emotional Appeals Across Cultures,” Journal of Consumer Research, 25 (3), 241–61.
Albers-Miller, Nancy D. and Marla Royne Stafford (1999), “An International Analysis of
Emotional and Rational Appeals in Services vs Goods Advertising,” Journal of Consumer
Marketing, 16 (1), 42–57.
Alden, Dana L., Ashesh Mukherjee, and Wayne D. Hoyer (2000), “The Effects of Incongruity,
Surprise and Positive Moderators on Perceived Humor in Television Advertising,” Journal
of Advertising, 29 (2), 1–15.
Arias-Bolzmann, Leopoldo, Goutam Chakraborty, and John C Mowen (2000), “Effects of
Absurdity in Advertising: The Moderating Role of Product Category Attitude and the
Mediating Role of Cognitive Responses,” Journal of Advertising, 29, 35–49.
American Marketing Association (2017), “Dictionary,” (accessed September 7, 2017), [available
at http://www.marketingpower.com/_layouts/Dictionary.aspx].
Astolfi, Laura, Fabrizio De Vico Fallani, Serenella Salinari, Febo Cincotti, Donatella Mattia,
Maria Grazia Marciani, Ramon Soranzo, and Fabio Babiloni (2008), “Brain Activity Related
to the Memorization of TV Commercials,” International Journal of Bioelectromagnetism,
10 (2), 77–86.
Bagozzi, Richard P., Mahesh Gopinath, and Prashanth U. Nyer (1999), “The Role of Emotions in
Marketing,” Journal of the Academy of Marketing Science, 27 (2), 184–206.
Batra, Rajeev and Michael L. Ray (1986), “Affective Responses Mediating Acceptance of
Advertising,” Journal of Consumer Research, 13 (2), 234–49.
Berkowitz, L. (1993), “Toward a General Theory of Anger and Emotional Aggressions:
Implications of the Cognitive-Neoassociationistic Perspective for the Analysis of Anger and
Other Emotions,” in Perspective on Anger and Emotion: Advances in Social Cognition, R.
S. Wyer and T. Krull, eds., Hilsdale, New Jersey: Erlbaum, 1–46.
Boksem, Maartem and Ale Smidts (2015), “Brain Responses to Movie-Trailers Predict Individual
Preferences for Movies and Their Population-Wide Commercial Success,” Journal of
Marketing Research, 52 (8), 1–28.
Bower, Amanda B. and Stacy Landreth (2001), “Is Beauty Best? Highly Versus Normally
Attractive Models in Advertising,” Journal of Advertising, 30 (1), 1–12.
Bratu, Sofia (2010), “The Phenomenon of Image Manipulation in Advertising,” Economics,
Management, and Financial Markets, 5 (2), 333–38.
173
Brink, Douwe Van Den, Gaby Odekerken-Schröder, and Pieter Pauwels (2006), “The Effect of
Strategic and Tactical Cause-Related Marketing on Consumers’ Brand Loyalty,” Journal of
Consumer Marketing, 23 (1), 15–25.
Brown, Stephen (2004), “O Customer, Where Art Thou?,” Business Horizons, 47 (4), 61–70.
Bryant, Jennings and Dorina Miron (2003), “Excitation-Transfer Theory and Three-Factor
Theory of Emotion,” in Communication and Emotion: Essays in Honor of Dolf Zillmann, J.
Bryant and D. Roskos-Ewoldsen, eds., New Jersey: Lawrence Erlbaum Associates, 31–60.
Buchanan, Lauranne, Carolyn J. Simmons, and Barbara A. Bickart (1999), “Brand Equity
Dilution: Retailer Display and Context Brand Effects,” Journal of Consumer Research, 36
(3), 345–55.
Chen, Jiemiao, Xiaojing Yang, and Robert E. Smith (2016), “The Effects of Creativity on
Advertising Wear-In and Wear-Out,” Journal of the Academy of Marketing Science, 44,
334–49.
Cohen, Jacob (1988), Statistical Power Analyis for the Behavioral Sciences, Hilsdale, New
Jersey: Lawrence Erlbaum Associates.
Dahlén, Micael and Fredrik Lange (2004), “To Challenge or Not to Challenge: Ad-brand
Incongruency and Brand Familarity,” Journal of Marketing Theory and Practice, 12 (3), 20–
35.
———, ———, Henrik Sjödin, and Fredrik Törn (2005), “Effects of Ad-Brand Incongruency,”
Journal of Current Issues and Research in Advertising, 27 (2), 1–12.
———, Sara Rosengren, Fredrik Törn, and Niclas Öhman (2008), “Could Placing Ads Wrong be
Right? Advertising Effects of Thematic Incongruence,” Journal of Advertising, 37 (3), 57–
67.
Epstein, Seymour (1993), “Implications of Cognitive-Experiential Self-Theory for Personality
and Developmental Psychology,” in Studying Lives through Time: Personality and
Development, D. C. Funder, R. D. Parke, C. Tomlinson-Keasey, and K. Widaman, eds.,
Washington DC: American Psychological Association, 399–438.
Erfgen, Carsten, Sebastian Zenker, and Henrik Sattler (2015), “The Vampire Effect: When Do
Celebrity Endorsers Harm Brand Recall?,” International Journal of Research in Marketing,
32 (2), 155–63.
Esch, Franz-Rudolf, Thorsten Möll, Bernd Schmitt, Christian E. Elger, Carolin Neuhaus, and
Bernd Weber (2012), “Brands on the Brain: Do Consumers Use Declarative Information or
Experienced Emotions to Evaluate Brands?,” Journal of Consumer Psychology, 22 (1), 75–
85.
Festinger, Leon (1957), A Theory of Cognitive Dissonance, California: Stanford University Press.
Fishbein, Martin (1963), “An Investigation of the Relationships Between Beliefs About an Object
and the Attitude Toward that Object,” Human Relations, 16 (3), 233–39.
Fritz, Matthew S. and David P. Mackinnon (2007), “Required Sample Size to Detect the
Mediated Effect,” Psychology Science, 18 (3), 233–39.

174
Gelbrich, Katja, Daniel Gäthke, and Stanford A. Westjohn (2012), “Effectiveness of Absurdity in
Advertising Across Cultures,” Journal of Promotion Management, 18 (4), 393–413.
Goodstein, Ronald C. (1993), “Category-Based Applications and Extensions in Advertising:
Motivating More Extensive Ad Processing,” Journal of Consumer Research, 20 (1), 87–99.
Gorn, Gerald, Michel Tuan Pham, Leo Yatming Sin, Michel Tuan Pham, and Leo Yatming Sin
(2001), “When Arousal Influences Ad Evaluation and Valence Does Not (and Vice Versa),”
Journal of Consumer Psychology, 11 (1), 43–55.
Greiner, Ben (2015), “Organizing Experiments with ORSEE,” Journal of the Economic Science
Association, 1 (1), 114–25.
Halkias, Georgios and Flora Kokkinaki (2014), “The Degree of Ad–Brand Incongruity and the
Distinction Between Schema-Driven and Stimulus-Driven Attitudes,” Journal of
Advertising, 43 (4), 397–409.
Hammer, Peter, Erica Riebe, and Rachel Kennedy (2009), “How Clutter Affects Advertising
Effectiveness,” Journal of Advertising Research, 49 (2), 159–63.
Hayes, Andrew F. (2013), Introduction to Mediation, Moderation, and Conditional Process
Analysis: A Regression-Based Approach, New York: The Guilford Press.
——— (2015), “Hacking PROCESS for Estimation and Probing of Linear Moderation of
Quadratic Effects and Quadratic Moderation of Linear Effects,” Working Paper, 1–18.
Heckler, Susan E. and Terry L. Childers (1992), “The Role of Expectancy and Relevancy in
Memory for Verbal and Visual Information: What is Incongruency?,” Journal of Consumer
Research, 18 (4), 475.
Hong, Jae W. and George M. Zinkhan (1995), “Advertising Effectiveness: The Influence of
Response Mode,” Psychlogy & Marketing, 12 (1), 53–77.
Houston, Michael J., Terry L. Childers, and Susan E. Heckler (1987), “Picture-Word Consistency
and the Elaborative Processing of Advertisements,” Journal of Marketing Research, 24 (4),
359–69.
Hunt, Anne (2015), "A Researcher’s Guide to Power Analysis," (accessed September 11, 2017),
[available at http://rgs.usu.edu/irb/wp-
content/uploads/sites/12/2015/08/A_Researchers_Guide_to_Power_Analysis_USU.pdf].
Jenkinson, Angus (2007), “Evolutionary Implications for Touchpoint Planning as a Result of
Neuroscience: A Practical Fusion of Database Marketing and Advertising,” Database
Marketing and Customer Strategy Management, 14 (3), 164–85.
Jung Grant, Susan, Margaret Campbell, and Ji Hoon Jhang (2012), “Get it? Got it! Good!
Enhancing New Product Acceptance by Facilitating Resolution of Extreme Incongruity,”
Journal of Marketing Research, 49 (April), 247–59.
Jurca, Maria Alina and Maria Madlberger (2015), “Ambient Advertising Characteristics and
Schema Incongruity as Drivers of Advertising Effectiveness,” Journal of Marketing
Communications, 21 (1), 48–64.
175
Kahneman, D. (1973), Attention and Effort, Englewood Cliffs: Prentice Hall.
Kamins, Michael A. and Kamal Gupta (1994), “Congruence between Spokesperson and Product
Type : A Matchup Hypothesis Perspective,” Psychology & Marketing, 11 (December), 569–
86.
Kim, Jiyoung and Sharron J. Lennon (2013), “Effects of Reputation and Website Quality on
Online Consumers’ Emotion, Perceived Risk and Purchase Intention Model,” Journal of
Interactive Marketing, 7 (1), 33–56.
Kong, Wanzeng, Xinxin Zhao, and Sanqing Hu (2013), “Electronic Evaluation for Video
Commercials by Impression Index,” Cognitive Neurodynamics, 7 (6), 531–35.
Kotler, Philip and Gary Armstrong (2016), Principles of Marketing, Boston: Pearson.
Krippendorf, Klaus (1980), Content Analysis: An Introduction to its Methodology, Beverly Hills,
CA: SAGE Publications.
Kroeber-Riel, Werner (1979), “Acitivation Research: Psychobiological Approaches in Consumer
Research,” Journal of Consumer Research, 5 (4), 240–50.
Krugman, Herbert E. (1984), “Why Three Exposures May Be Enough,” Journal of Advertising
Research, 24 (4), 15–18.
Kuppens, Peter, Francis Tuerlinckx, James A Russell, and Lisa Feldman Barrett (2013), “The
Relation Between Valence and Arousal in Subjective Experience,” Psychological Bulletin,
139 (4), 917–40.
Lachman, Margie E. and Stefan Agrigoroaei (2012), “Low Perceived Control as a Risk Factor for
Episodic Memory: The Mediational Role of Anxiety and Task Interference,” Memory &
Cognition, 40 (2), 287–96.
Lalwani, Asjok K., May O. Lwin, and Pee Beng Ling (2009), “Does Audiovisual Congruency in
Advertisements Increase Persuasion? The Role of Cultural Music and Products,” Journal of
Global Marketing, 22 (March), 139–53.
Lange, Fredrik and Micael Dahlén (2003), “Let’s Be Strange: Brand Familiarity and Ad‐Brand
Incongruency,” Journal of Product & Brand Management, 12 (7), 449–61.
Lavidge, Robert J. and Gary A. Steiner (1961), “A Model For Predictive Measurements of
Advertising Effectiveness,” Joournal of Marketing, 25 (6), 59–62.
Lee, Eun-Ju and David W. Schumann (2004), “Explaining the Special Case of Incongruity in
Advertising: Combining Classic Theoretical Approaches,” Marketing Theory, 4 (1), 59–90.
Lee, Yih Hwai and Charlotte Mason (1999), “Responses to Information Incongruency in
Advertising: The Role of Expectancy, Relevancy, and Humor,” Journal of Consumer
Research, 26 (2), 156–69.
Levonian, Edward (1964), “Retention of Information in Relation to Arousal During Continously-
Presented Material,” American Educational Research Journal, 4 (2), 103–16.
Lull, Robert B. and Brad J. Bushman (2015), “Do Sex and Violence Sell? A Meta-Analytic
Review of the Effects of Sexual and Violent Media and Ad Content on Memory, Attitudes,
176
and Buying Intentions.,” Psychological Bulletin, 141 (5), 1022–48.
MacInnis, Deborah J. and C. Whan Park (1991), “The Differential Role of Characteristics of
Music on High- and Low-Involvement Consumers’ Processing of Ads,” Journal of
Consumer Research, 18 (September), 161–73.
———, Ambar G. Rao, and Allen M. Weiss (2002), “Assessing When Increased Media Weight
of Real-World Advertisements Helps Sales,” Journal of Marketing Research, 39 (4), 391–
407.
MacKinnon, D. P., C. M. Lockwood, J. M. Hoffmann, S. G. West, and V. Sheets (2002), “A
Comparison of Methods to Test Mediation and Other Intervening Variable Effects,”
Psychological Methods, 7, 83–104.
Madden, Thomas J. and Marc G. Weinberger (1982), “The Effects of Humor on Attention in
Magazine Advertising,” Journal of Advertising, 11 (3), 8–14.
Mai, Robert and Katharina Hutter (2014), “Non-Linear Effects of Absurdity in Advertising,”
Working Paper.
Malhotra, Naresh K. (2005), “Attitude and Affect: New Frontiers of Research in the 21st
Century,” Journal of Business Research, 58, 477–82.
Mandler, George (1982), “The Structure of Value: Accounting for Taste,” in Affect and
Cognition: The Seventeenth Annual Carnegie Symposium on Cogntiion, M. S. Clark and S.
T. Fiske, eds., Hilsdale, New Jersey: Lawrance Erlbaum Associate, 3–36.
Mattes, John and Joanne Cantor (1982), “Enhancing Responses to Television Advertisements via
the Transfer of Residual Arousal from Prior Programming,” Journal of Broadcasting, 62 (2),
553–66.
Mehrabian, Albert and James A. Russel (1974), An Approach to Environmental Psychology,
Cambridge: MIT Press.
Meyers-Levy, J., and Malaviya, P. (1999), "Consumers’ Processing of Persuasive
Advertisements: An Integrative Framework of Persuasion Theories," Journal of Marketing,
63, 45–60.
Mitchell, Andrew A. and Jerry C. Olson (1981), “Are Product Attribute Beliefs the Only
Mediator of Advertising Effects on Brand Attitude?,” Journal of Marketing Research, 18
(3), 318–32.
Moorman, Marjolein, Peter C. Neijens, and Edith G. Smit (2002), “The Effects of Magazine-
Induced Psychological Responses and Thematic Congruence on Memory and Attitude
toward the Ad in a Real-Life Setting,” The Journal of Advertising, 31 (4), 27–40.
Morris, Jon D., Chongmoo Woo, James A. Geason, and Jooyoung Kim (2002), “The Power of
Affect: Predicting Intention,” Journal of Advertising Research, 42 (3), 7–17.
Mostafa, Mohamed M. (2005), “An Experimental Investigation of the Egyptian Consumers’
Attitudes towards Surrealism in Advertising,” International Journal of Consumer Studies,
29 (3), 216–31.

177
Ohme, Rafal, Michal Matukin, and Tomasz Szczurko (2010), “Neurophysiology Uncovers
Secrets of TV Commercials,” Der Markt, 49, 133–42.
———, Dorota Reykowska, Dawid Wiener, and Anna Choromanska (2009), “Analysis of
Neurophysiological Reactions to Advertising Stimuli by Means of EEG and Galvanic Skin
Response Measures,” Journal of Neuroscience, Psychology, and Economics, 2 (1), 21–31.
Olney, Thomas J., Morris B. Holbrook, and Rajeev Batra (1991), “Consumer Responses to
Advertising: The Effects of Ad Content, Emotions , and Attitude toward the Ad on Viewing
Time,” Journal of Consumer Research, 17 (4), 440–53.
Percy, Larry and John R. Rossiter (1992), “Advertising Stimulus Effects: A Review,” Journal of
Current Issues & Research in Advertising, 14 (1), 75–90.
Piaget, James (1981), Intelligence and Affectivity: Their Relationship During Child Development,
(T. A. Brown and C. E. Kaegie, eds.), Annual Reviews Monograph.
Preacher, Kristopher J. and Andrew F. Hayes (2004), “SPSS and SAS Procedures for Estimating
Indirect Effects in Simple Mediation Models,” Behavior Research Methods, Instruments, &
Computers, 36 (4), 717–31.
Ray, Michael L. and Rajeev Batra (1983), “Emotion and Persuasion in Advertising: What We Do
and Don’t Know about Affect,” in Advances in Consumer Research, R. P. Bagozzi and A.
M. Tybout, eds., Ann Arbor, 543–48.
Riemer, Hila (2014), “Will the Excitement Help You Remember ? The Impact of Ad Arousal on
Memory,” Advances in Consumer Research, 42, 649–52.
Sanbonmatsu, David M. and Frank R. Kardes (1988), “The Effects of Physiological Arousal on
Information Processing and Persuasion,” Journal of Consumer Research, 15 (3), 379–85.
Schachter, Stanley and Jerome E. Singer (1962), “Cognitive, Social, and Physiological
Determinants of Emotional State,” Psychological Review, 69 (5), 379–99.
Schlinger, Mary Jane (1979), “A Profile of Responses to Commercials,” Journal of Advertising
Research, 19 (2), 37–46.
Shimp, Terence A. and Larry G. Gresham (1983), “An Information-Processing Perspective on
Recent Advertising Literature,” Current Issues & Research in Advertising, 6 (2), 39–75.
Shrout, Patrick E. and Niall Bolger (2002), “Mediation in Experimental and Nonexperimental
Studies: New Procedures and Recommendations,” Psychological Methods, 7 (4), 422–45.
Silberstein, Richard B. and Geoffrey E. Nield (2008), “Brain Activity Correlates of Consumer
Brand Choice Shift Associated With Television Advertising,” International Journal of
Advertising, 27 (3), 359–80.
Singh, Surendra N. and Gilbert A. Churchill (1987), “Arousal and Advertising Effectiveness,”
Journal of Advertising, 16 (1), 4–40.
Smith, M.E. and A. Gevin (2004), “Attention and Brain Activity While Watching Television:
Components of Viewer Engagement,” Media Psychology, 6 (3), 285–305.
Stewart, David W., Jon Morris, and Aditi Grover (2009), “Emotions in Advertising,” in The
178
SAGE Handbook of Advertising, G. J. Tellis and T. Ambler, eds., London: SAGE
Publications, 120–34.
Tan, Justin and Mike W. Peng (2003), “Organizational Slack and Firm Performance During
Economic Transitions: Two Studies from an Emerging Economy,” Strategic Management
Journal, 24 (13), 1249–63.
Teixeira, Thales S. (2014), “The Rising Cost of Consumer Attention: Why You Should Care, and
What You Can Do about It,” HBS Working Paper.
Tellis, Gerard J. (2004), Effective Advertising - Understanding When, How and Why Advertising
Works, (G. J. Tellis, ed.), Thousand Oaks, California: SAGE Publications.
Till, Brian D. and Daniel W. Baack (2005), “Recall and Persuasion: Does Creative Advertising
Matter?,” Journal of Advertising, 34 (3), 47–57.
Vakratsas, Demetrios and Tim Ambler (1999), “How Advertising Works: What Do We Really
Know ?,” Journal of Marketing, 63 (1), 26–43.
Vecchiato, Giovanni, Laura Astolfi, Fabrizio De Vico Fallani, Febo Cincotti, Donatella Mattia,
Serenella Salinari, Ramon Soranzo, and Fabio Babiloni (2010), “Changes in Brain Activity
During the Observation of TV Commercials by Using EEG, GSR and HR Measurements,”
Brain Topography, 23 (2), 165–79.
———, Jlenia Toppi, Laura Astolfi, Fabrizio De Vico Fallani, Febo Cincotti, Donatella Mattia,
Francesco Bez, and Fabio Babiloni (2011), “Spectral EEG Frontal Asymmetries Correlate
With the Experienced Pleasantness of TV Commercial Advertisements,” Medical and
Biological Engineering and Computing, 49 (5), 579–83.
Wadsworth, Barry J. (2004), Piaget’s Theory of Cognitive and Affective Development, (A. E.
Burvikovs, ed.), Boston: Pearson.
Westbrook, Robert A. (1987), “Product/Consumption-Based Affective Responses and
Postpurchase Processes,” Journal of Marketing Research, 24 (3), 258–71.
Yoon, Hye Jin (2013), “Understanding Schema Incongruity as a Process in Advertising: Review
and Future Recommendations,” Journal of Marketing Communications, 19 (5), 360–76.
Young, Charles (2002), “Brain Waves, Picture Sorts, and Branding Moments,” Journal of
Advertising Research, 42 (4), 42–53.
Zajonic, R. B. (1980), “Feeling and Thinking: Preferences Need No Inferences,” The American
Psychologist, 32 (2), 151–75.
Zhao, Xinshu, John G. Lynch, and Qimei Chen (2010), “Reconsidering Baron and Kenny: Myths
and Truths about Mediation Analysis,” Journal of Consumer Research, 37 (2), 197–206.
Zillmann, Dolf (1971), “Excitation Transfer in Communication-Mediated Aggressive Behavior,”
Journal of Experimental Social Psychology, 7, 419–34.

179
APPENDIX
Appendix 1: Full Phrasing of Items and Scales and Cronbach’s Alpha Values for further Reliability Test
Variable Scale Endpoint Labels (range) Reference Cronbach’s
α
Humorous
incongruency
The ad was humorous.
The ad was amusing.
The ad was funny.
Not at all – Very much (1-7) Tellis 2004 0.94
Absurd
incongruency
The ad was illogical.
The ad was absurd.
The ad was unreal.
Not at all – Very much (1-7) Arias-Bolzmann,
Goutam, and Mowen
2000
0.90
Cognition Participants were presented two scenes from the ad not showing the
brand name or the product and were asked to recall the brand name.
Number of correctly recalled brand
names
Lane, Heckler, and
Houston 1998; Till and
Baack 2005
-
Attitude Please evaluate the brand according to the following characteristics: Not at all likeable – Likeable (1-7)
Not at all tasty – Tasty (1-7)
Bad – Good (1-7)
Aacker and Williams
1998
0.90
Perceived
quality
Please evaluate the product according to the following characteristics: Bad quality – Good quality (1-7)
Low Value – High value (1-7)
Usual – Unique (1-7)
Till and Baack 2005 0.84
Purchase
intention
I am eager to check out the product because of this advertisement.
I intend to try this product.
I would consider purchasing this product.
Not at all – Very much (1-7) Beatty and Talpade 1994 0.82
Pleasure The commercial was lots of fun to watch and listen to.
It’s the kind of commercial that keeps running through your mind after
you’ve seen it.
I just laughed at it, I thought it was very funny and good.
The ad wasn’t just selling the product – it was entertaining me. I
appreciated that.
The ad captures your attention.
I thought it was clever and quite entertaining.
Not at all – Very much (1-7) Schlinger 1979 0.96
Consumption Considering the last twelve months, how often have you consumed the
product?
On a daily basis (1)
Several times per week (2)
On a weekly basis (3)
On a monthly basis (4)
Several times per year (5)
Never (6)
-
180
APPENDIX REFERENCES
Aaker, Jennifer L. and Patti Williams (1998), “Empathy versus Pride: The Influence of
Emotional Appeals Across Cultures,” Journal of Consumer Research, 25 (3), 241–61.
Arias-Bolzmann, Leopoldo, Goutam Chakraborty, and John C Mowen (2000), “Effects of
Absurdity in Advertising: The Moderating Role of Product Category Attitude and the
Mediating Role of Cognitive Responses,” Journal of Advertising, 29, 35–49.
Beatty, Sharon E. and Salil Talpade (1994), “Adolescent Influence in Family Decision Making:
A Replication with Extension,” Journal of Consumer Research, 21 (2), 332–41.
Lane, Kevin, Susan E. Heckler, and Michael J. Houston (1998), “The Effects of Brand Name
Suggestiveness on Advertising Recall,” Journal of Marketing, 62 (1), 48–57.
Schlinger, Mary Jane (1979), “A Profile of Responses to Commercials,” Journal of Advertising
Research, 19 (2), 37–46.
Tellis, Gerard J. (2004), Effective Advertising - Understanding When, How and Why Advertising
Works, (G. J. Tellis, ed.), Thousand Oaks, California: SAGE Publications.
Till, Brian D. and Daniel W. Baack (2005), “Recall and Persuasion: Does Creative Advertising
Matter?,” Journal of Advertising, 34 (3), 47–57.

181
References
Aaker, David A. and Alexander Biel (1993), Brand Equity & Advertising: Advertising’s Role in
Building Strong Brands.
——— and Donald E. Bruzzone (1985), “Causes of Irritation in Advertising,” Journal of
Marketing, 49 (2), 47–57.
Aaker, Jennifer L. and Patti Williams (1998), “Empathy versus Pride: The Influence of
Emotional Appeals Across Cultures,” Journal of Consumer Research, 25 (3), 241–61.
Achrol, Ravi S. (2012), “Slotting Allowances: A Time Series Analysis of Aggregate Effects Over
Three Decades,” Journal of the Academy of Marketing Science, 40 (5), 673–94.
——— and Joo Hwan Seo (2011), “Marketing Channel Theory and Slotting Allowances: An
Empirical Analysis Using Quantile Regression,” American Marketing Association
Conference Proceedings, 22, 286–95.
Adjei, Mavis T., Stephanie M. Noble, and Charles H. Noble (2010), “The Influence of C2C
Communications in Online Brand Communities on Customer Purchase Behavior,” Journal
of the Academy of Marketing Science, 38 (5), 634–53.
Advertising Age (2016a), “Methodology for 200 Leading National Advertisers, 2016 ed.,”
(accessed July 6, 2016), [available at http://adage.com/article/datacenter/methodology-200-
leading-national-advertisers-2016-ed/304581/].
——— (2016b), “About Global Marketers 2015,” (accessed August 18, 2016), [available at
http://adage.com/datacenter/globalmarketers2015/].
AGOF (2012), “Mobile Facts 2012-II,” (accessed May 11, 2013), [available at
http://www.agof.de/aktuelle-studie.1022.de.html].
Ailawadi, Kusum L., Norm Borin, and Paul W. Farris (1995), “Market Power and Performance:
A Cross-Industry Analysis of Manufacturers and Retailers,” Journal of Retailing, 71 (3),
211–48.
Alba, Joseph, John Lynch, Barton Weitz, Chris Janiszewski, Richard Lutz, Alan Sawyer, and
Stacy Wood (1997), “Interactive Home Shopping: Consumer, Retailer, and Manufacturer
Incentive to Participate in Electronic Marketplaces,” Journal of Marketing, 61 (3), 38–53.
Albers-Miller, Nancy D. and Marla Royne Stafford (1999), “An International Analysis of
Emotional and Rational Appeals in Services vs Goods Advertising,” Journal of Consumer
Marketing, 16 (1), 42–57.
Alden, Dana L., Ashesh Mukherjee, and Wayne D. Hoyer (2000), “The Effects of Incongruity,
Surprise and Positive Moderators on Perceived Humor in Television Advertising,” Journal
of Advertising, 29 (2), 1–15.
Ambler, Tim, Flora Kokkinaki, Stefano Puntoni, and Debra Riley (2001), “Assesing Market
Performance: The Current State of Metrics,” Working Paper, 1–68.
Ansari, Asim, Skander Essegaier, and Rajeev Kohli (2000), “Internet Recommendation
Systems,” Journal of Marketing Research, 3 (2), 107–20.
182
Arias-Bolzmann, Leopoldo, Goutam Chakraborty, and John C Mowen (2000), “Effects of
Absurdity in Advertising: The Moderating Role of Product Category Attitude and the
Mediating Role of Cognitive Responses,” Journal of Advertising, 29, 35–49.
American Marketing Association (2017), “Dictionary,” (accessed September 7, 2017), [available
at http://www.marketingpower.com/_layouts/Dictionary.aspx].
Astolfi, Laura, Fabrizio De Vico Fallani, Serenella Salinari, Febo Cincotti, Donatella Mattia,
Maria Grazia Marciani, Ramon Soranzo, and Fabio Babiloni (2008), “Brain Activity Related
to the Memorization of TV Commercials,” International Journal of Bioelectromagnetism,
10 (2), 77–86.
Bagozzi, Richard P., Mahesh Gopinath, and Prashanth U. Nyer (1999), “The Role of Emotions in
Marketing,” Journal of the Academy of Marketing Science, 27 (2), 184–206.
Bahadir, S. Cem, Sundar G. Bharadwaj, and Rajendra K. Srivastava (2008), “Financial Value of
Brands in Mergers and Acquisitions: Is Value in the Eye of the Beholder?,” Journal of
Marketing, 72 (6), 49–64.
Bakos, Yannis (1997), “Reducing Buyer Search Costs: Implications for Electronic
Marketplaces,” Management Science, 43 (12), 1676–92.
——— (1998), “The Emerging Role of Electronic Marketplaces on the Internet,”
Communications of the ACM, 41 (8), 35–42.
Balsam, Steven, Guy D. Fernando, and Arindam Tripathy (2011), “The Impact of Firm Strategy
on Performance Measures Used in Executive Compensation,” Journal of Business Research,
64 (2), 187–93.
Banker, Rajiv D., Raj Mashruwala, and Arindam Tripathy (2014), “Does a Differentiation
Strategy Lead to more Sustainable Financial Performance than a Cost Leadership
Strategy?,” Management Decision, 52 (5), 872–96.
Barney, Jay (1991), “Firm Resources and Sustained Competitive Advantage,” Journal of
Management, 17 (1), 99–120.
——— and A. Arikan (2001), “The Resource-Based View: Origins and Implications,” in
Handbook of Strategic Management, M. Hitt, R. Freeman, and J. Harrison, eds., Oxford,
UK: Blackwell, 124–85.
Batra, Rajeev and Michael L. Ray (1986), “Affective Responses Mediating Acceptance of
Advertising,” Journal of Consumer Research, 13 (2), 234–49.
Bayus, Barry L., Gary Erickson, and Robert Jacobson (2003), “The Financial Rewards of New
Product Introductions in the Personal Computer Industry,” Management Science, 49 (2),
197–210.
Beatty, Sharon E. and Salil Talpade (1994), “Adolescent Influence in Family Decision Making:
A Replication with Extension,” Journal of Consumer Research, 21 (2), 332–41.
Bell, David E. and Dinny Starr Gordon (1999), “The King-Size Company,” Journal of Interactive
Marketing, 13 (I), 66–86.
Bendapudi, Neeli and Robert P. Leone (2003), “Psychological Implications of Customer

183
Participation in Co-Production,” Journal of Marketing, 67 (1), 14–28.
Bentley, Kathleen A., Thomas C. Omer, and Nathan Y. Sharp (2012), “Business Strategy,
Financial Reporting Irregularities, and Audit Effort,” Working Paper, 1–59.
Berkowitz, L. (1993), “Toward a General Theory of Anger and Emotional Aggressions:
Implications of the Cognitive-Neoassociationistic Perspective for the Analysis of Anger and
Other Emotions,” in Perspective on Anger and Emotion: Advances in Social Cognition, R.
S. Wyer and T. Krull, eds., Hilsdale, New Jersey: Erlbaum, 1–46.
Bharadwaj, Sundar G., Kapil R. Tuli, and Andre Bonfrer (2011), “The Impact of Brand Quality
on Shareholder Wealth,” Journal of Marketing, 75 (September), 88–104.
Bhasin, Hitesh (2016), “4 Major Challenges for Marketing Managers of 21st Century,” (accessed
September 7, 2017), [available at https://www.marketing91.com/challenges-for-marketing-
managers/].
Bickart, Barbara and Robert M. Schindler (2001), “Internet Forums as Influential Sources of
Consumer Information,” Journal of Interactive Marketing, 15 (3), 31–40.
Bitner, Mary Jo, Amy L. Ostrom, Matthew L. Meuter, and Anthony J. Clancy (2002),
“Implementing Successful Self-Service Technologies,” The Academy of Management
Executive, 16 (4), 96–109.
Blazevic, Vera and Annouk Lievens (2008), “Managing Innovation through Customer
Coproduced Knowledge in Electronic Services: An Exploratory Study,” Journal of the
Academy of Marketing Science, 36 (1), 138–51.
Boksem, Maartem and Ale Smidts (2015), “Brain Responses to Movie-Trailers Predict Individual
Preferences for Movies and Their Population-Wide Commercial Success,” Journal of
Marketing Research, 52 (8), 1–28.
Borah, Abhishek and Gerard J. Tellis (2014), “Make, Buy, or Ally? Choice of and Payoff from
Announcements of Alternate Strategies for Innovations,” Marketing Science, 33 (1), 114–
33.
Boulding, William and Markus Christen (2008), “Disentangling Pioneering Cost Advantages and
Disadvantages,” Marketing Science, 27 (4), 699–716.
Bower, Amanda B. and Stacy Landreth (2001), “Is Beauty Best? Highly Versus Normally
Attractive Models in Advertising,” Journal of Advertising, 30 (1), 1–12.
Boyd, D. Eric and Brian P. Brown (2012), “Marketing Control Rights and Their Distribution
Within Technology Licensing Agreements: A Real Options Perspective,” Journal of the
Academy of Marketing Science, 40 (5), 659–72.
Bragg, Steven M. (2010), Cost Reduction Analysis: Tools and Strategies, (S. M. Bragg, ed.),
Hoboken, New Jersey: Wiley.
Bratu, Sofia (2010), “The Phenomenon of Image Manipulation in Advertising,” Economics,
Management, and Financial Markets, 5 (2), 333–38.
Breithut, Jörg (2011), “Soziale Netzwerke: Pril Wettbewerb endet im PR-Debakel,” (accessed
September 20, 2013), [available at http://www.spiegel.de/netzwelt/netzpolitik/soziale-
184
netzwerke-pril-wettbewerb-endet-im-pr-debakel-a-763808.html].
Brink, Douwe Van Den, Gaby Odekerken-Schröder, and Pieter Pauwels (2006), “The Effect of
Strategic and Tactical Cause-Related Marketing on Consumers’ Brand Loyalty,” Journal of
Consumer Marketing, 23 (1), 15–25.
Brown, Stephen (2004), “O Customer, Where Art Thou?,” Business Horizons, 47 (4), 61–70.
Bruton, Garry D., J. Kay Keels, and Elton L. Scifres (2002), “Corporate Restructuring and
Performance: An Agency Perspective on the Complete Buyout Cycle,” Journal of Business
Research, 55 (9), 709–24.
Bryant, Jennings and Dorina Miron (2003), “Excitation-Transfer Theory and Three-Factor
Theory of Emotion,” in Communication and Emotion: Essays in Honor of Dolf Zillmann, J.
Bryant and D. Roskos-Ewoldsen, eds., New Jersey: Lawrence Erlbaum Associates, 31–60.
Buchanan, Lauranne, Carolyn J. Simmons, and Barbara A. Bickart (1999), “Brand Equity
Dilution: Retailer Display and Context Brand Effects,” Journal of Consumer Research, 36
(3), 345–55.
Buell, Ryan W., Dennis Campbell, and Frances X. Frei (2010), “Are Self-Service Customers
Satisfied or Stuck?,” Production and Operations Management, 19 (6), 679–97.
Campbell, Donald T. and Donald W. Fiske (1962), “Convergent and Discriminant Validation by
the Multitrait-Multimethod Matrix,” Psychological Bulletin, 59 (2), 257–72.
Carton, Robert B. and Charles W. Hofer (2006), Measuring Organizational Performance, (R. B.
Carton and C. W. Hofer, eds.), Cheltenham: Edward Elgar.
Casadesus-Masanell, Ramon and Joan Enric Ricart (2010), “From Strategy to Business Models
and onto Tactics,” Long Range Planning, 43 (2–3), 195–215.
Chen, Jiemiao, Xiaojing Yang, and Robert E. Smith (2016), “The Effects of Creativity on
Advertising Wear-In and Wear-Out,” Journal of the Academy of Marketing Science, 44,
334–49.
Chen, Yubo, QI Wang, and Jinhong Xie (2011), “Online Social Interactions: A Natural
Experiment on Word of Mouth versus Observational Learning,” Journal of Marketing
Research, 48 (2), 238–54.
Cheng, Meng-Yuh, Jer-Yan Lin, Tzy-Yih Hsiao, and Thomas W. Lin (2008), “Censoring Model
for Evaluating Intellectual Capital Value Drivers,” Journal of Intellectual Capital, 9 (4),
639–55.
Chevalier, Judith A. and Dina Mayzlin (2006), “The Effect of Word of Mouth on Sales: Online
Book Reviews,” Journal of Marketing Research, 43 (3), 345–54.
Churchill, Gilbert A., Jr. (1979), “A Paradigm for Developing Better Measures of Marketing
Constructs,” Journal of Marketing Research, 16 (1), 64–73.
Cohen, Jacob (1988), Statistical Power Analysis for the Behavioral Sciences, Hilsdale, New
Jersey: Lawrence Erlbaum Associates.
Collier, Joel E. and Daniel L. Sherrell (2009), “Examining the Influence of Control and
185
Convenience in a Self-Service Setting,” Journal of the Academy of Marketing Science, 38
(4), 490–509.
Collins, Christopher J. and Jian Han (2004), “Exploring Applicant Pool Quantity and Quality:
The Effects of Early Recruitment Practice Strategies, Corporate Advertising, and Firm
Reputation,” Personnel Psychology, 57, 685–717.
Cook, Victor J., William Moult, and Jim Spaeth (2007), “Marketing Meets Finance,” Working
Paper, 1–48.
Corona, Ramon (2009), “Is Costco Better than Walmart? A Comparative Analysis based on
Enterprise Marketing Efficiency.”
——— (2014), “A Comparative Analysis of Major US Retailers based on Enterprise Marketing
Efficiency,” Global Journal of Business Research, 8 (4), 25–40.
Culnan, Mary J., Patrick J. McHugh, and Jesus I. Zubillaga (2010), “How Large U.S. Companies
Can Use Twitter and Other Social Media to Gain Business Value,” MIS Quarterly
Executive, 9 (4), 243–60.
Dabholkar, Pratibha A. (1996), “Consumer Evaluations of New Technology-Based Self-Service
Options: An Investigation of Alternative Models of Service Quality,” International Journal
of Research in Marketing, 13 (1), 29–51.
Dahlén, Micael and Fredrik Lange (2004), “To Challenge or Not to Challenge: Ad-brand
Incongruency and Brand Familarity,” Journal of Marketing Theory and Practice, 12 (3), 20–
35.
———, ———, Henrik Sjödin, and Fredrik Törn (2005), “Effects of Ad-Brand Incongruency,”
Journal of Current Issues and Research in Advertising, 27 (2), 1–12.
———, Sara Rosengren, Fredrik Törn, and Niclas Öhman (2008), “Could Placing Ads Wrong be
Right? Advertising Effects of Thematic Incongruence,” Journal of Advertising, 37 (3), 57–
67.
Darroch, Jenny and Morgan P. Miles (2011), “A Research Note on Market Creation in the
Pharmaceutical Industry,” Journal of Business Research, 64 (7), 723–27.
Dattero, Ronald, Edna M. White, and Marius A. Janson (1991), “Methods for the Identification
of Data Outliers in Interactive SQL,” Journal of Database Administration, 2 (1), 7–18.
Day, G.S. (1994), “The Capabilities of Market-Driven Organizations,” Journal of Marketing, 58,
37–52.
Dellaert, Benedict G. C. and Stefan Stremersch (2005), “Marketing Mass-Customized Products:
Striking a Balance Between Utility and Complexity,” Journal of Marketing Research, 42
(May), 219–27.
Demerjian, Peter, Baruch Lev, and Sarah McVay (2012), “Quantifying Managerial Ability: A
New Measure and Validity Tests,” Management Science, 58 (7), 1229–48.
DeVellis, Robert F. (2012), Scale Development, (R. F. DeVellis, ed.), SAGE Publications.
Dholakia, Utpal M., Vera Blazevic, Caroline Wiertz, and René Algesheimer (2009), “Communal
186
Service Delivery: How Customers Benefit From Participation in Firm-Hosted Virtual P3
Communities,” Journal of Service Research, 12 (2), 208–26.
Ding, Yuan, Hervé Stolowy, and Michel Tenenhaus (2007), “R&D Productivity: An Exploratory
International Study,” Review of Accounting and Finance, 6 (1), 86–101.
Dinner, Isaac M. (2011), “The Interpretation of Marketing Actions and Communications by the
Financial Markets,” Thesis, 1–152.
———, Natalie Mizik, and Donald Lehmann (2009), “The Unappreciated Value of Marketing:
The Moderating Role of Changes in Marketing and R&D Spending on Valuation of
Earnings Reports,” Marketing Science Institute Special Report.
Dong, Beibei, Kenneth R. Evans, and Shaoming Zou (2007), “The Effects of Customer
Participation in Co-Created Service Recovery,” Journal of the Academy of Marketing
Science, 36 (1), 123–37.
Duan, W, B Gu, and A Whinston (2008), “The Dynamics of Online Word-of-Mouth and Product
Sales—An Empirical Investigation of the Movie Industry,” Journal of Retailing, 84 (2),
233–42.
Ducoffe, Robert H. and Eleonora Curlo (2000), “Advertising Value and Advertising Processing,”
Journal of Marketing Communications, 6 (4), 247–62.
Duncan, Tom and Sandra E. Moriarty (1998), “A Communication-Based Marketing Model for
Managing Relationships,” Journal of Marketing, 62 (2), 1–13.
Dutta, Shantanu, Om Narasimhan, and Surendra Rajiv (1999), “Success in High-Technology
Markets: Is Marketing Capability Critical?,” Marketing Science, 18 (4), 547–68.
———, ———, and ——— (2005a), “Conceptualizing and Measuring Capabilities:
Methodology and Empirical Application,” Strategic Management Journal, 26 (3), 277–85.
van Eck, Peter S., Wander Jager, and Peter S. H. Leeflang (2011), “Opinion Leaders’ Role in
Innovation Diffusion: A Simulation Study,” Journal of Product Innovation Management, 28
(2), 187–203.
Efendi, Jap, Michael R. Kinney, Katherine Taken Smith, and L. Murphy Smith (2013),
“Marketing Supply Chain Using B2B Buy-Side E-Commerce Systems: Does Adoption
Impact Financial Performance,” Working Paper, 1–32.
Emory, William and Donald R. Cooper (1991), Business Research Methods, (W. Emory and D.
R. Cooper, eds.), Homewood: IRWIN.
Epstein, Seymour (1993), “Implications of Cognitive-Experiential Self-Theory for Personality
and Developmental Psychology,” in Studying Lives through Time: Personality and
Development, D. C. Funder, R. D. Parke, C. Tomlinson-Keasey, and K. Widaman, eds.,
Washington DC: American Psychological Association, 399–438.
Erfgen, Carsten, Sebastian Zenker, and Henrik Sattler (2015), “The Vampire Effect: When Do
Celebrity Endorsers Harm Brand Recall?,” International Journal of Research in Marketing,
32 (2), 155–63.
Ernst, Holger, Wayne D. Hoyer, Manfred Krafft, and Katrin Krieger (2011), “Customer

187
Relationship Management and Company Performance—the Mediating Role of New Product
Performance,” Journal of the Academy of Marketing Science, 39 (2), 290–306.
Esch, Franz-Rudolf, Thorsten Möll, Bernd Schmitt, Christian E. Elger, Carolin Neuhaus, and
Bernd Weber (2012), “Brands on the Brain: Do Consumers Use Declarative Information or
Experienced Emotions to Evaluate Brands?,” Journal of Consumer Psychology, 22 (1), 75–
85.
Fang, Eric, Robert W. Palmatier, and Kenneth R. Evans (2008), “Influence of Customer
Participation on Creating and Sharing of New Product Value,” Journal of the Academy of
Marketing Science, 36 (3), 322–36.
Festinger, Leon (1957), A Theory of Cognitive Dissonance, California: Stanford University Press.
Fishbein, Martin (1963), “An Investigation of the Relationships Between Beliefs About an Object
and the Attitude Toward that Object,” Human Relations, 16 (3), 233–39.
Foster, George and Mahendra Gupta (1994), “Marketing , Cost Management and Managenient
Accounting,” Journal of Management Accounting Research, 6, 63–77.
Franke, Nikolaus, Peter Keinz, and Christoph J. Steger (2009), “Testing the Value of
Customization: When Do Customers Really Prefer Products Tailored to Their Preferences?,”
Journal of Marketing, 73 (5), 103–21.
——— and Frank Piller (2004), “Value Creation by Toolkits for User Innovation and Design:
The Case of the Watch Market,” The Journal of Product Innovation Management, 21 (6),
401–15.
——— and Martin Schreier (2008), “Product Uniqueness as a Driver of Customer Utility in
Mass Customization,” Marketing Letters, 19 (2), 93–107.
——— and ——— (2010), “Why Customers Value Self-Designed Products: The Importance of
Process Effort and Enjoyment,” Journal of Product Innovation Management, 27 (7), 1020–
31.
Fritz, Matthew S. and David P. Mackinnon (2007), “Required Sample Size to Detect the
Mediated Effect,” Psychology Science, 18 (3), 233–39.
Fuchs, Christoph, Emanuela Prandelli, and Martin Schreier (2010), “The Psychological Effects of
Empowerment Strategies on Consumers ’ Product Demand,” Journal of Marketing, 74 (1),
65–79.
Gaspar, José-Miguel and Massimo Massa (2006), “Idiosyncratic Volatility and Product Market
Competition,” The Journal of Business, 79 (6), 3125–52.
Gelbrich, Katja, Daniel Gäthke, and Stanford A. Westjohn (2012), “Effectiveness of Absurdity in
Advertising Across Cultures,” Journal of Promotion Management, 18 (4), 393–413.
Gentry, Richard J. and Wei Shen (2010), “The Relationship between Accounting and Market
Measures of Firm Financial Performance: How Strong Is It?,” Journal of Managerial Issues.
Goodstein, Ronald C. (1993), “Category-Based Applications and Extensions in Advertising:
Motivating More Extensive Ad Processing,” Journal of Consumer Research, 20 (1), 87–99.
188
Gorn, Gerald, Michel Tuan Pham, Leo Yatming Sin, Michel Tuan Pham, and Leo Yatming Sin
(2001), “When Arousal Influences Ad Evaluation and Valence Does Not (and Vice Versa),”
Journal of Consumer Psychology, 11 (1), 43–55.
Greiner, Ben (2015), “Organizing Experiments with ORSEE,” Journal of the Economic Science
Association, 1 (1), 114–25.
Grewal, Dhruv, Gopalkrishnan R. Iyer, R. Krishnan, and Arun Sharma (2003), “The Internet and
the Price–Value–Loyalty Chain,” Journal of Business Research, 56 (5), 391–98.
———, ———, and Michael Levy (2004), “Internet Retailing: Enablers, Limiters and Market
Consequences,” Journal of Business Research, 57 (7), 703–13.
Grubaugh, Stephen G. (1987), “Determinants of Direct Foreign Investment,” The Review of
Economics and Statistics, 69 (1), 149–52.
Gruen, Thomas W., Talai Osmonbekov, and Andrew J. Czaplewski (2007), “Customer-to-
Customer Exchange: Its MOA Antecedents and its Impact on Value Creation and Loyalty,”
Journal of the Academy of Marketing Science, 35 (4), 537–49.
Gruner, Kjell E. and Christian Homburg (2000), “Does Customer Interaction Enhance New
Product Success?,” Journal of Business Research, 49 (1), 1–14.
Habib, Ahsan (2014), “Business Strategy, Overvalued Equities, and Stock Price Crash Risk.”
Halkias, Georgios and Flora Kokkinaki (2014), “The Degree of Ad–Brand Incongruity and the
Distinction Between Schema-Driven and Stimulus-Driven Attitudes,” Journal of
Advertising, 43 (4), 397–409.
Hammer, Peter, Erica Riebe, and Rachel Kennedy (2009), “How Clutter Affects Advertising
Effectiveness,” Journal of Advertising Research, 49 (2), 159–63.
Hansen, Don R. (1990), Management Accounting, Boston: PWS-KENT Publishing Company.
Hatip, A. and R. Strehlau (2000), “Kennzahlen im operativen Marketing Controlling,” in
Handbuch Marketing Controlling, M. P. Zerres, ed., Berlin et al.: Gabler, 251–65.
Hayes, Andrew F. (2013), Introduction to Mediation, Moderation, and Conditional Process
Analysis: A Regression-Based Approach, New York: The Guilford Press.
——— (2015), “Hacking PROCESS for Estimation and Probing of Linear Moderation of
Quadratic Effects and Quadratic Moderation of Linear Effects,” Working Paper, 1–18.
Heckler, Susan E. and Terry L. Childers (1992), “The Role of Expectancy and Relevancy in
Memory for Verbal and Visual Information: What is Incongruency?,” Journal of Consumer
Research, 18 (4), 475.
Heeler, Roger M. and Michael L. Ray (1972), “Measure Validation in Marketing,” Journal of
Marketing Research, 9 (4), 361–70.
Higgins, Danielle, Thomas C. Omer, and John D. Phillips (2015), “The Influence of a Firm’s
Business Strategy on its Tax Aggressiveness,” Contemporary Accounting Research, 32 (2),
674–702.
189
Himme, Alexander (2009), “Gütekriterien der Messung: Reliabilität, Validität und
Generalisierbarkeit,” in Methodik der empirischen Forschung, S. Albers, D. Klapper, U.
Konradt, A. Walter, and J. Wolf, eds., Wiesbaden: Gabler, 485–500.
Ho, Li-Chin Jennifer, Chao-Shin Liu, and Bo Ouyang (2012), “Bloated Balance Sheet, Earnings
Management, and Forecast Guidance,” Review of Accounting and Finance, 11 (2), 120–40.
Hong, Jae W. and George M. Zinkhan (1995), “Advertising Effectiveness: The Influence of
Response Mode,” Psychlogy & Marketing, 12 (1), 53–77.
Hornig, Tobias and Mark Fischer (2013), “Validating Financial Brand Equity Metrics: How
Useful Are Brand Valuation Methods?,” Dissertation Thesis, 103–56.
Houston, Michael J., Terry L. Childers, and Susan E. Heckler (1987), “Picture-Word Consistency
and the Elaborative Processing of Advertisements,” Journal of Marketing Research, 24 (4),
359–69.
Hoyer, Wayne D., Rajesh Chandy, Matilda Dorotic, Manfred Krafft, and Siddharth S. Singh
(2010), “Consumer Cocreation in New Product Development,” Journal of Service Research,
13 (3), 283–96.
Huang, Rongbing, Gim S. Seow, and Joe Z. Shangguan (2011), “Intangible Investments and the
Pricing of Corporate SGA Expenses,” Journal of Business & Economic Studies, 17 (2), 67–
77.
Huffman, Cynthia and Barbara E Kahn (1998), “Variety for Sale : Mass Customization or Mass
Confusion ?,” Journal of Retailing, 74 (4), 491–513.
Hunt, Anne (2015), "A Researcher’s Guide to Power Analysis," (accessed September 11, 2017),
[available at http://rgs.usu.edu/irb/wp-
content/uploads/sites/12/2015/08/A_Researchers_Guide_to_Power_Analysis_USU.pdf].
Im, Kun Shin, Varun Grover, and James T. C. Teng (2012), “Research Note - Do Large Firms
Become Smaller by Using Information Technology?,” Information Systems Research, 24
(2), 470–91.
Jenkinson, Angus (2007), “Evolutionary Implications for Touchpoint Planning as a Result of
Neuroscience: A Practical Fusion of Database Marketing and Advertising,” Database
Marketing and Customer Strategy Management, 14 (3), 164–85.
Jeppesen, Lars Bo (2005), “User Toolkits for Innovation: Consumers Support Each Other,”
Journal of Product Innovation Management, 22 (4), 347–62.
Joshi, Ashwin W. and Sanjay Sharma (2004), “Customer Knowledge Development: Antecedents
and Impact on New Product Performance,” Journal of Marketing, 68 (4), 47–59.
Jung Grant, Susan, Margaret Campbell, and Ji Hoon Jhang (2012), “Get it? Got it! Good!
Enhancing New Product Acceptance by Facilitating Resolution of Extreme Incongruity,”
Journal of Marketing Research, 49 (April), 247–59.
Jurca, Maria Alina and Maria Madlberger (2015), “Ambient Advertising Characteristics and
Schema Incongruity as Drivers of Advertising Effectiveness,” Journal of Marketing

190
Communications, 21 (1), 48–64.
Kahneman, D. (1973), Attention and Effort, Englewood Cliffs: Prentice Hall.
Kalaignanam, K., T. Kushwaha, J.-B. E. M. Steenkamp, and K. R. Tuli (2013), “The Effect of
CRM Outsourcing on Shareholder Value: A Contingency Perspective,” Management
Science, 59 (3), 748–69.
Kalwani, Manohar U. and Narakesari Narayandas (1995), “Long-Term Manufacturer-Supplier
Relationships: Do They Pay off for Supplier Firms?,” Journal of Marketing, 59 (1), 1–16.
Kamins, Michael A. and Kamal Gupta (1994), “Congruence between Spokesperson and Product
Type : A Matchup Hypothesis Perspective,” Psychology & Marketing, 11 (December), 569–
86.
Katsikeas, Constantine S., Niel A. Morgan, Leonidas C. Leonidou, and G. Tomas M. Hult
(2016), “Assessing Performance Outcomes in Marketing,” Journal of Marketing, 80 (3), 1–
20.
Kerlinger, Fred (1986), Foundations of Behavioral Research, (F. Kerlinger, ed.), Forth Worth:
Harcourt Brace Jovanovich.
Kim, Jiyoung and Sharron J. Lennon (2013), “Effects of Reputation and Website Quality on
Online Consumers’ Emotion, Perceived Risk and Purchase Intention Model,” Journal of
Interactive Marketing, 7 (1), 33–56.
Kim, Minchung and Leigh M. Mcalister (2011), “Stock Market Reaction to Unexpected Growth
in Marketing Expenditure: Negative for Sales Force, Contingent on Spending Level for
Advertising,” Journal of Marketing, 75 (7), 68–85.
Koku, Paul Sergius (2011), “On the Connection between R&D, Selling Expenditures, and
Profitability in the Pharmaceutical Industry Revisited,” Journal of Strategic Marketing, 19
(3), 273–83.
Kong, Wanzeng, Xinxin Zhao, and Sanqing Hu (2013), “Electronic Evaluation for Video
Commercials by Impression Index,” Cognitive Neurodynamics, 7 (6), 531–35.
Kotha, Suresh, Shivaram Rajgopal, and Violina Rindova (2001), “Reputation Building and
Performance: An Empirical Analysis of the Top-50 Pure Internet Firms,” European
Management Journal, 19 (6), 571–86.
Kotler, Philip and Gary Armstrong (2016), Principles of Marketing, Boston: Pearson.
——— and Neil Rackham (2006), “Ending the War Between Sales and Marketing,” Harvard
Business Review, 84 (4), 1–14.
Kozlenkova, Irina V., Stephen A. Samaha, and Robert W. Palmatier (2014), “Resource-Based
Theory in Marketing,” Journal of the Academy of Marketing Science, 42 (1), 1–21.
Krippendorf, Klaus (1980), Content Analysis: An Introduction to its Methodology, Beverly Hills,
CA: SAGE Publications.
Krishnan, Hema A., Raghu Tadepalli, and Daewoo Park (2009), “R&D Intensity, Marketing

191
Intensity, and Organizational Performance,” Journal of Managerial Issues, 21 (2), 232–44.
Kristandl, Gerhard and Nick Bontis (2007), “Constructing a Definition for Intangibles Using the
Resource based View of the Firm,” Management Decision, 45 (9), 1510–24.
Kroeber-Riel, Werner (1979), “Acitivation Research: Psychobiological Approaches in Consumer
Research,” Journal of Consumer Research, 5 (4), 240–50.
Krugman, Herbert E. (1984), “Why Three Exposures May Be Enough,” Journal of Advertising
Research, 24 (4), 15–18.
Kumar, Piyush (1999), “The Impact of Long-Term Client Relationships on the Performance of
Business Service Firms,” Journal of Service Research, 2 (4), 4–18.
Kumar, V. (2016), “My Reflections on Publishing in Journal of Marketing,” Journal of
Marketing, 80 (1), 1–6.
Kuppens, Peter, Francis Tuerlinckx, James A Russell, and Lisa Feldman Barrett (2013), “The
Relation Between Valence and Arousal in Subjective Experience,” Psychological Bulletin,
139 (4), 917–40.
Kurt, Didem and John Hulland (2013), “Aggressive Marketing Strategy Following Equity
Offerings and Firm Value: The Role of Relative Strategic Flexibility,” Journal of
Marketing, 77 (9), 57–74.
Lachman, Margie E. and Stefan Agrigoroaei (2012), “Low Perceived Control as a Risk Factor for
Episodic Memory: The Mediational Role of Anxiety and Task Interference,” Memory &
Cognition, 40 (2), 287–96.
Lalwani, Asjok K., May O. Lwin, and Pee Beng Ling (2009), “Does Audiovisual Congruency in
Advertisements Increase Persuasion? The Role of Cultural Music and Products,” Journal of
Global Marketing, 22 (March), 139–53.
Lane, Kevin, Susan E. Heckler, and Michael J. Houston (1998), “The Effects of Brand Name
Suggestiveness on Advertising Recall,” Journal of Marketing, 62 (1), 48–57.
Lange, Fredrik and Micael Dahlén (2003), “Let’s Be Strange: Brand Familiarity and Ad‐Brand
Incongruency,” Journal of Product & Brand Management, 12 (7), 449–61.
Lavidge, Robert J. and Gary A. Steiner (1961), “A Model For Predictive Measurements of
Advertising Effectiveness,” Joournal of Marketing, 25 (6), 59–62.
Lee, Eun-Ju and David W. Schumann (2004), “Explaining the Special Case of Incongruity in
Advertising: Combining Classic Theoretical Approaches,” Marketing Theory, 4 (1), 59–90.
Lee, In Hyeock and Alan M. Rugman (2012), “Firm-Specific Advantages, Inward FDI Origins,
and Performance of Multinational Enterprises,” Journal of International Management, 18
(2), 132–46.
Lee, Jongkuk and Young Bong Chang (2014), “Interplay between Internal Investment and
Alliance Specialization in R&D and Marketing,” Industrial Marketing Management, 43 (5),
813–25.
Lee, Yih Hwai and Charlotte Mason (1999), “Responses to Information Incongruency in
192
Advertising: The Role of Expectancy, Relevancy, and Humor,” Journal of Consumer
Research, 26 (2), 156–69.
Lévesque, Moren, Nitin Joglekar, and Jane Davies (2012), “A Comparison of Revenue Growth at
Recent-IPO and Established Firms: The Influence of SG&A, R&D and COGS,” Journal of
Business Venturing, 27 (1), 47–61.
Levonian, Edward (1964), “Retention of Information in Relation to Arousal During Continously-
Presented Material,” American Educational Research Journal, 4 (2), 103–16.
Lilien, Gary L., Pamela D. Morrison, Kathleen Searls, Mary Sonnack, and Eric Von Hippel
(2002), “Performance Assessment of the Lead User Idea-Generation Process for New
Product Development,” Management Science, 48 (8), 1042–59.
Lin, Bou W., Yikuan Lee, and Shih-Chang Hung (2006), “R&D Intensity and Commercialization
Orientation Effects on Financial Performance,” Journal of Business Research, 59 (6), 679–
85.
Lin, Chinho, Hua-Ling Tsai, and Ju-Chuan Wu (2014), “Collaboration Strategy Decision-Making
Using the Miles and Snow Typology,” Journal of Business Research, 67 (9), 1979–90.
Lovelock, Christopher H. and Robert F. Young (1979), “Look to Consumers to Increase
Productivity,” Harvard Business Review, 57, 168–78.
Lull, Robert B. and Brad J. Bushman (2015), “Do Sex and Violence Sell? A Meta-Analytic
Review of the Effects of Sexual and Violent Media and Ad Content on Memory, Attitudes,
and Buying Intentions.,” Psychological Bulletin, 141 (5), 1022–48.
Luo, Xueming (2008a), “When Marketing Strategy First Meets Wall Street: Marketing Spendings
and Firms’ Initial Public Offerings,” Journal of Marketing, 72 (4), 98–109.
——— (2008b), “When Marketing Strategy First Meets Wall Street: Marketing Spendings and
Firms’ Initial Public Offerings,” Journal of Marketing, 72 (9), 98–109.
Luo, Yadong, John Hongxin Zhao, and Jianjun Du (2005), “The Internationalization Speed of E-
Commerce Companies: An Empirical Analysis,” International Marketing Review, 22 (6),
693–709.
Lusch, Robert F., Stephen L. Vargo, and Matthew O’Brien (2007), “Competing through Service:
Insights from Service-Dominant Logic,” Journal of Retailing, 83 (1), 5–18.
MacInnis, Deborah J. (2011), “A Framework for Conceptual Contributions in Marketing,”
Journal of Marketing, 75 (4), 136–54.
——— and C. Whan Park (1991), “The Differential Role of Characteristics of Music on High-
and Low-Involvement Consumers’ Processing of Ads,” Journal of Consumer Research, 18
(September), 161–73.
———, Ambar G. Rao, and Allen M. Weiss (2002), “Assessing When Increased Media Weight
of Real-World Advertisements Helps Sales,” Journal of Marketing Research, 39 (4), 391–
407.
MacKenzie, Scott B. (2003), “The Dangers of Poor Construct Conceptualization,” Journal of the
Academy of Marketing Science, 31 (3), 323–26.
193
MacKinnon, D. P., C. M. Lockwood, J. M. Hoffmann, S. G. West, and V. Sheets (2002), “A
Comparison of Methods to Test Mediation and Other Intervening Variable Effects,”
Psychological Methods, 7, 83–104.
Madden, Thomas J. and Marc G. Weinberger (1982), “The Effects of Humor on Attention in
Magazine Advertising,” Journal of Advertising, 11 (3), 8–14.
Mai, Robert and Katharina Hutter (2014), “Non-Linear Effects of Absurdity in Advertising,”
Working Paper.
Malhotra, Naresh K. (2005), “Attitude and Affect: New Frontiers of Research in the 21st
Century,” Journal of Business Research, 58, 477–82.
Mandler, George (1982), “The Structure of Value: Accounting for Taste,” in Affect and
Cognition: The Seventeenth Annual Carnegie Symposium on Cogntiion, M. S. Clark and S.
T. Fiske, eds., Hilsdale, New Jersey: Lawrance Erlbaum Associate, 3–36.
March, James G. (1991), “Exploration and Exploitation in Organizational Learning,”
Organization Science, 2 (1), 71–87.
Mathwick, Charla, Caroline Wiertz, and Ko de Ruyter (2008), “Social Capital Production in a
Virtual P3,” Journal of Consumer Research, 34 (6), 832–49.
Mattes, John and Joanne Cantor (1982), “Enhancing Responses to Television Advertisements via
the Transfer of Residual Arousal from Prior Programming,” Journal of Broadcasting, 62 (2),
553–66.
Mehrabian, Albert and James A. Russel (1974), An Approach to Environmental Psychology,
Cambridge: MIT Press.
Meuter, Matthew L. and Mary Jo Bitner (1998), “Self-Service Technologies: Extending Service
Frameworks and Identifying Issues for Research,” American Marketing Association, 9, 12–
19.
———, Amy L. Ostrom, Robert I. Roundtree, and Mary Jo Bitner (2000), “Self-Service
Technologies: Understanding Customer Satisfaction with Technology-Based Service
Encounters,” Journal of Marketing, 64 (3), 50–64.
Meyers-Levy, J., and Malaviya, P. (1999), "Consumers’ Processing of Persuasive
Advertisements: An Integrative Framework of Persuasion Theories," Journal of Marketing,
63, 45–60.
Mhatre, Nehal, Seong-Jong Joo, and C. Christopher Lee (2014), “Benchmarking the Performance
of Department Stores within an Income Elasticity of Demand Perspective,” Benchmarking:
An International Journal, 21 (2), 205–17.
Mitchell, Andrew A. and Jerry C. Olson (1981), “Are Product Attribute Beliefs the Only
Mediator of Advertising Effects on Brand Attitude?,” Journal of Marketing Research, 18
(3), 318–32.
Mittal, Vikas, Eugene W. Anderson, Akin Sayrak, and Pandu Tadikamalla (2005), “Dual
Emphasis and the Long-Term Financial Impact of Customer Satisfaction,” Marketing
194
Science, 24 (4), 544–55.
Mizik, Natalie (2010), “The Theory and Practice of Myopic Management,” Journal of Marketing
Research, 47 (4), 594–611.
——— and Robert Jacobson (2007), “Myopic Marketing Management: Evidence of the
Phenomenon and Its Long-Term Performance Consequences in the SEO Context,”
Marketing Science, 26 (3), 361–79.
Moeller, Sabine (2008), “Customer Integration — A Key to an Implementation Perspective of
Service Provision,” Journal of Service Research, 11 (2), 197–210.
Moorman, Christine, Rex Du, and Carl F. Mela (2005), “The Effect of Standardized Information
on Firm Survival and Marketing Strategies,” Marketing Science, 24 (2), 263–74.
Moorman, Marjolein, Peter C. Neijens, and Edith G. Smit (2002), “The Effects of Magazine-
Induced Psychological Responses and Thematic Congruence on Memory and Attitude
toward the Ad in a Real-Life Setting,” The Journal of Advertising, 31 (4), 27–40.
Morgan, Neil A. and Lopo L. Rego (2009), “Brand Portfolio Strategy and Firm Performance,”
Journal of Marketing, 73 (1), 59–74.
Morris, Jon D., Chongmoo Woo, James A. Geason, and Jooyoung Kim (2002), “The Power of
Affect: Predicting Intention,” Journal of Advertising Research, 42 (3), 7–17.
Mostafa, Mohamed M. (2005), “An Experimental Investigation of the Egyptian Consumers’
Attitudes towards Surrealism in Advertising,” International Journal of Consumer Studies,
29 (3), 216–31.
Mottner, Sandra and Steve Smith (2009), “Wal-Mart: Supplier Performance and Market Power,”
Journal of Business Research, 62 (5), 535–41.
MSI (2016), “2014-2016 Research Priorities,” (accessed May 5, 2016), [available at
http://www.msi.org/research/2014-2016-research-priorities/].
Nair, Anil and David D. Selover (2012), “A Study of Competitive Dynamics,” Journal of
Business Research, 65 (3), 355–61.
Nam, Hyoryung and P. K. Kannan (2014), “Informational Value of Social Tagging Networks,”
Journal of Marketing, 78 (7), 21–40.
Nambisan, Satish and Robert A Baron (2009), “Virtual Customer Environments: Testing a Model
of Voluntary Participation in Value Co-creation Activities,” Journal of Product Innovation
Management, 26 (4), 388–406.
Narasimhan, Om, Surendra Rajiv, and Shantanu Dutta (2006), “Absorptive Capacity in High-
Technology Markets: The Competitive Advantage of the Haves,” Marketing Science, 25 (5),
510–24.
Nath, Prithwiraj, Subramanian Nachiappan, and Ramakrishnan Ramanathan (2010), “The Impact
of Marketing Capability, Operations Capability and Diversification Strategy on
Performance: A Resource-Based View,” Industrial Marketing Management, 39 (2), 317–29.
Nielsen, AC (2005), “The Power of Private Label 2005.”

195
Nunnally, Jum C. (1978), Psychometric Theory, (R. R. Wright and M. Gardner, eds.), New York:
McGraw-Hill.
Ogawa, Susumu and Frank T. Piller (2006), “Reducing the Risks of New Product Development,”
MIT Sloan Managment Review, 47 (2), 65–71.
Ohme, Rafal, Michal Matukin, and Tomasz Szczurko (2010), “Neurophysiology Uncovers
Secrets of TV Commercials,” Der Markt, 49, 133–42.
———, Dorota Reykowska, Dawid Wiener, and Anna Choromanska (2009), “Analysis of
Neurophysiological Reactions to Advertising Stimuli by Means of EEG and Galvanic Skin
Response Measures,” Journal of Neuroscience, Psychology, and Economics, 2 (1), 21–31.
Olney, Thomas J., Morris B. Holbrook, and Rajeev Batra (1991), “Consumer Responses to
Advertising: The Effects of Ad Content, Emotions , and Attitude toward the Ad on Viewing
Time,” Journal of Consumer Research, 17 (4), 440–53.
Patwardhan, Abhijit M. (2014), “A Partial Theory of Holistic Firm-Level Marketing Capability:
An Empirical Investigation,” Journal of Management and Marketing Research, 16 (8), 1–
46.
Payne, Adrian F., Kaj Storbacka, and Pennie Frow (2008), “Managing the Co-Creation of
Value,” Journal of the Academy of Marketing Science, 36 (1), 83–96.
Percy, Larry and John R. Rossiter (1992), “Advertising Stimulus Effects: A Review,” Journal of
Current Issues & Research in Advertising, 14 (1), 75–90.
Peter, J. Paul (1981), “Construct Validity: A Review of Basic Issues and Marketing Practices,”
Journal of Marketing Research, 18 (2), 133–45.
Piaget, James (1981), Intelligence and Affectivity: Their Relationship During Child Development,
(T. A. Brown and C. E. Kaegie, eds.), Annual Reviews Monograph.
Pieters, Rik, Luk Warlop, and Michel Wedel (2002), “Breaking Through the Clutter: Benefits of
Advertisement Originality and Familiarity for Brand Attention and Memory,” Management
Science, 48 (6), 765–81.
Porter, Michael E. and Victor E. Millar (1985), “How Information Gives You Competitive
Advantage,” Harvard Business Review, 63 (4), 149–60.
Poston, R. and S. Grabski (2001), “Financial Impacts of Enterprise Resource Planning
Implementations,” International Journal of Accounting Information Systems, 2 (2), 271–94.
Prahalad, C. K. and Venkat Ramaswamy (2004), “Co-Creation Experiences: The Next Practice in
Value Creation,” Journal of Interactive Marketing, 18 (3), 5–14.
——— and Venkatram Ramaswamy (2000), “Co-Opting Customer Competence,” Harvard
Business Review, 78 (1), 79–87.
Preacher, Kristopher J. and Andrew F. Hayes (2004), “SPSS and SAS Procedures for Estimating
Indirect Effects in Simple Mediation Models,” Behavior Research Methods, Instruments, &
Computers, 36 (4), 717–31.
Raassens, Néomie, Stefan Wuyts, and Inge Geyskens (2014), “The Performance Implications of

196
Outsourcing Customer Support to Service Providers in Emerging versus Established
Economies,” International Journal of Research in Marketing, 31 (3), 280–92.
Raithel, Sascha, Marko Sarstedt, Sebastian Scharf, and Manfred Schwaiger (2012), “On the
Value Relevance of Customer Satisfaction. Multiple Drivers and Multiple Markets,” Journal
of the Academy of Marketing Science, 40 (4), 509–25.
Randall, Taylor, Christian Terwiesch, and Karl T. Ulrich (2007), “User Design of Customized
Products,” Marketing Science, 26 (2), 268–80.
Rangan, V. Kasturi and Marie Bell (1998), “Dell Online,” Journal of Interactive Marketing, 12
(4), 63–86.
Ray, Michael L. and Rajeev Batra (1983), “Emotion and Persuasion in Advertising: What We Do
and Don’t Know about Affect,” in Advances in Consumer Research, R. P. Bagozzi and A.
M. Tybout, eds., Ann Arbor, 543–48.
Rego, Lopo L., Neil A. Morgan, and Claes Fornell (2013), “Reexamining the Market Share-
Customer Satisfaction Relationship,” Journal of Marketing, 77 (9), 1–20.
Riemer, Hila (2014), “Will the Excitement Help You Remember ? The Impact of Ad Arousal on
Memory,” Advances in Consumer Research, 42, 649–52.
Rugman, Alan and Nessara Sukpanich (2006), “Firm-Specific Advantages Intra-Regional Sales
and Performance of Multinational Enterprises,” The International Trade Journal, 20, 355–
82.
Rust, Roland T., Tim Ambler, Gregory S. Carpenter, V. Kumar, and Rajendra K Srivastava
(2004), “Measuring Marketing Productivity: Current Knowledge and Future Directions,”
Journal of Marketing, 68 (10), 76–89.
——— and Ming-Hui Huang (2012), “Optimizing Service Productivity,” Journal of Marketing,
76 (2), 47–66.
Sanbonmatsu, David M. and Frank R. Kardes (1988), “The Effects of Physiological Arousal on
Information Processing and Persuasion,” Journal of Consumer Research, 15 (3), 379–85.
Sarkees, Matthew, John Hulland, and Rabikar Chatterjee (2014), “Investments in Exploitation
and Exploration Capabilities: Balance Versus Focus,” Journal of Marketing Theory and
Practice, 22 (1), 7–23.
——— and Ryan Luchs (2011), “Stochastic Frontier Estimation in International Marketing
Research: Exploring Untapped Opportunities,” in Measurement and Research Methods in
International Marketing, Emerald Group Publishing Ltd, 99–114.
Sawhney, Mohanbir, Gianmario Verona, and Emanuela Prandelli (2005), “Collaborating to
Create: The Internet as a Platform for Customer Engagement in Product Innovation,”
Journal of Interactive Marketing, 19 (4), 4–17.
Schachter, Stanley and Jerome E. Singer (1962), “Cognitive, Social, and Physiological
Determinants of Emotional State,” Psychological Review, 69 (5), 379–99.
Schlinger, Mary Jane (1979), “A Profile of Responses to Commercials,” Journal of Advertising
Research, 19 (2), 37–46.

197
Schlosser, Ann E., Tiffany Barnett White, and Susan M. Lloyd (2006), “Converting Web Site
Visitors into Buyers: How Web Site Investment and Online Purchase Intentions,” Journal of
Marketing, 70 (2), 133–48.
Schreier, Martin (2006), “The Value Increment of Mass-Customized Products: An Empirical
Assessment,” Journal of Consumer Behaviour, 5 (4), 317–27.
———, Christoph Fuchs, and Darren W. Dahl (2012), “The Innovation Effect of User Design:
Exploring Consumers’ Innovation Perceptions of Firms Selling Products Designed by
Users,” Journal of Marketing, 76 (5), 18–32.
Schwertman, Neil C., Margaret Ann Owens, and Robiah Adnan (2004), “A Simple More General
Boxplot Method for Identifying Outliers,” Computational Statistics and Data Analysis, 47
(1), 165–74.
Selling Power (2016), “Selling Power 500 Largest Sales Forces,” (accessed September 23, 2016),
[available at http://www.sellingpower.com/content/article/index.php?a=10505/selling-
power-500/largest-sales-forces/2015&page=1].
Selnes, Fred and Havard Hansen (2001), “The Potential Hazard of Self-Service in Developing
Customer Loyalty,” Journal of Service Research, 4 (2), 79–90.
Shankar, Venkatesh (2012), “Marketing Strategy and Firm Value,” in Handbook of Marketing
Strategy, V. Shankar and G. S. Carpenter, eds., Cheltenham: Edward Elgar, 415–39.
——— and Gregory S. Carpenter (2012), Handbook of Marketing Strategy, (V. Shankar and G.
S. Carpenter, eds.), Cheltenham: Edward Elgar.
Shapiro, Carl (1989), “The Theory of Business Strategy,” The RAND Journal of Economics, 20
(1), 125–37.
Sheth, Jagdish N., Rajendra S. Sisodia, and Arun Sharma (2000), “The Antecedents and
Consequences of Customer-Centric Marketing,” Journal of the Academy of Marketing
Science, 28 (1), 55–66.
Shimp, Terence A. and Larry G. Gresham (1983), “An Information-Processing Perspective on
Recent Advertising Literature,” Current Issues & Research in Advertising, 6 (2), 39–75.
Shin, Hyun S., Mariko Sakakibara, and Dominique M. Hanssens (2008), “Marketing and R&D
Investment of Leader vs . Follower,” Working Paper, 1–39.
Shrout, Patrick E. and Niall Bolger (2002), “Mediation in Experimental and Nonexperimental
Studies: New Procedures and Recommendations,” Psychological Methods, 7 (4), 422–45.
Silberstein, Richard B. and Geoffrey E. Nield (2008), “Brain Activity Correlates of Consumer
Brand Choice Shift Associated With Television Advertising,” International Journal of
Advertising, 27 (3), 359–80.
Singh, Surendra N. and Gilbert A. Churchill (1987), “Arousal and Advertising Effectiveness,”
Journal of Advertising, 16 (1), 4–40.
Sinha, Indrajit (2000), “Cost Transparency: The Net’s Real Threat to Prices and Brands,”
Harvard Business Review, 78 (2), 43–50.

198
Smith, M.E. and A. Gevin (2004), “Attention and Brain Activity While Watching Television:
Components of Viewer Engagement,” Media Psychology, 6 (3), 285–305.
Snyder, Stephen (2009), “Marketing and R&D Complementarity in the Pharmaceutical Industry,”
Working Paper, 1–17.
Standard and Poor (2013), “Standard and Poor’s Comupstat User’s Guide,” (accessed January 27,
2014), [available at http://www.batd.eu/debodt/downloads/compustat_user_all.pdf].
Steiger, J. H. (1980), “Tests for Comparing Elements of a Correlation Matrix,” Psychological
Bulletin, 245–51.
Stewart, David W. (2009), “Marketing Accountability: Linking Marketing Actions to Financial
Results,” Journal of Business Research, 62 (6), 636–43.
———, Jon Morris, and Aditi Grover (2009), “Emotions in Advertising,” in The SAGE
Handbook of Advertising, G. J. Tellis and T. Ambler, eds., London: SAGE Publications,
120–34.
Swaminathan, Vanitha and Christine Moorman (2009), “Marketing Alliances, Firm Networks,
and Firm Value Creation,” Journal of Marketing, 73 (9), 52–69.
Syam, N., P. Krishnamurthy, and James D. Hess (2008), “That’s What I Thought I Wanted?
Miswanting and Regret for a Standard Good in a Mass-Customized World,” Marketing
Science, 27 (3), 379–97.
Tan, Justin and Mike W. Peng (2003), “Organizational Slack and Firm Performance During
Economic Transitions: Two Studies from an Emerging Economy,” Strategic Management
Journal, 24 (13), 1249–63.
Teixeira, Thales S. (2014), “The Rising Cost of Consumer Attention: Why You Should Care, and
What You Can Do about It,” HBS Working Paper.
Tellis, Gerard J. (2004), Effective Advertising - Understanding When, How and Why Advertising
Works, (G. J. Tellis, ed.), Thousand Oaks, California: SAGE Publications.
Till, Brian D. and Daniel W. Baack (2005), “Recall and Persuasion: Does Creative Advertising
Matter?,” Journal of Advertising, 34 (3), 47–57.
van Triest, Sander, Maurice J. G. Bun, Erik M. van Raaij, and Maarten J.A. Vernooij (2009),
“The Impact of Customer-Specific Marketing Expenses on Customer Retention and
Customer Profitability,” Marketing Letters, 20, 125–38.
Troye, Sigurd Villads and Magne Supphellen (2012), “Consumer Participation in Coproduction: ‘
I Made It Myself ’ Effects on Consumers’ Sensory Perceptions and Evaluations of Outcome
and Input Product,” Journal of Marketing, 76 (2), 33–46.
Tukey, John W. (1977), Exploratory Data Analysis, (J. W. Tukey, ed.), Pearson.
Vakratsas, Demetrios and Tim Ambler (1999), “How Advertising Works: What Do We Really
Know ?,” Journal of Marketing, 63 (1), 26–43.
Varadarajan, Rajan (2010), “Strategic Marketing and Marketing Strategy: Domain, Definition,
Fundamental Issues and Foundational Premises,” Journal of the Academy of Marketing
199
Science, 38 (2), 119–40.
——— (2012), “Strategic Marketing and Marketing Strategy,” in Handbook of Marketing
Strategy, S. Venkatesh and G. S. Carpenter, eds., Cheltenham: Edward Elgar, 9–27.
Vecchiato, Giovanni, Laura Astolfi, Fabrizio De Vico Fallani, Febo Cincotti, Donatella Mattia,
Serenella Salinari, Ramon Soranzo, and Fabio Babiloni (2010), “Changes in Brain Activity
During the Observation of TV Commercials by Using EEG, GSR and HR Measurements,”
Brain Topography, 23 (2), 165–79.
———, Jlenia Toppi, Laura Astolfi, Fabrizio De Vico Fallani, Febo Cincotti, Donatella Mattia,
Francesco Bez, and Fabio Babiloni (2011), “Spectral EEG Frontal Asymmetries Correlate
With the Experienced Pleasantness of TV Commercial Advertisements,” Medical and
Biological Engineering and Computing, 49 (5), 579–83.
Verhoef, P. C., W. J. Reinartz, and M. Krafft (2010), “Customer Engagement as a New
Perspective in Customer Management,” Journal of Service Research, 13 (3), 247–52.
Vinod, H. D. and P. M. Rao (2000), “R&D and Promotion in Pharmaceuticals: A Conceptual
Framework and Empirical Exploration,” Journal of Marketing Theory and Practice, 8 (4),
10–20.
Viswanathan, Madhu (2005), Measurement Error and Research Design, Thousand Oaks: SAGE
Publications.
Vorhies, Douglas W., Linda M. Orr, and Victoria D. Bush (2011), “Improving Customer-Focused
Marketing Capabilities and Firm Financial Performance via Marketing Exploration and
Exploitation,” Journal of the Academy of Marketing Science, 39 (5), 736–56.
Wadsworth, Barry J. (2004), Piaget’s Theory of Cognitive and Affective Development, (A. E.
Burvikovs, ed.), Boston: Pearson.
Weiss, Allen M., Nicholas H. Lurie, and Deborah J. MacInnis (2008), “Listening to Strangers:
Whose Responses Are Valuable, How Valuable Are They, and Why?,” Journal of
Marketing Research, 45 (4), 425–36.
Westbrook, Robert A. (1987), “Product/Consumption-Based Affective Responses and
Postpurchase Processes,” Journal of Marketing Research, 24 (3), 258–71.
Wharton (2016), “Fundamental Annuals Data List,” (accessed November 24, 2016), [available at
https://wrds-web.wharton.upenn.edu/wrds/ds/compm/funda/index.cfm?navId=84].
Whitely, Bernard E. and Mary E. Jr. Kite (2013), Principles of Research in Behavioral Science,
(B. E. Whitely and M. E. J. Kite, eds.), New York and London: Routledge.
Wiles, Michael A. (2007), “The Effect of Customer Service on Retailers’ Shareholder Wealth:
The Role of Availability and Reputation Cues,” Journal of Retailing, 83 (1), 19–31.
Wind, Jerry and Arvind Rangaswamy (2001), “Customerization: The Next Revolution in Mass
Customization,” Journal of Interactive Marketing, 15 (1), 13–32.
Wuyts, Stefan, Shantanu Dutta, and Stefan Stremersch (2004), “Portfolios of Interfirm
Agreements in Technology-Intensive Markets: Consequences for Innovation and
Profitability,” Journal of Marketing, 68 (4), 88–100.
200
Xie, Chunyan, Richard P. Bagozzi, and Sigurd V. Troye (2008), “Trying to Prosume: Toward a
Theory of Consumers as Co-Creators of Value,” Journal of the Academy of Marketing
Science, 36 (1), 109–22.
Yoon, Hye Jin (2013), “Understanding Schema Incongruity as a Process in Advertising: Review
and Future Recommendations,” Journal of Marketing Communications, 19 (5), 360–76.
Young, Charles (2002), “Brain Waves, Picture Sorts, and Branding Moments,” Journal of
Advertising Research, 42 (4), 42–53.
Zajonic, R. B. (1980), “Feeling and Thinking: Preferences Need No Inferences,” The American
Psychologist, 32 (2), 151–75.
Zhao, Xinshu, John G. Lynch, and Qimei Chen (2010), “Reconsidering Baron and Kenny: Myths
and Truths about Mediation Analysis,” Journal of Consumer Research, 37 (2), 197–206.
Zhu, Zhen, Cheryl Nakata, K. Sivakumar, and Dhruv Grewal (2007), “Self-Service Technology
Effectiveness: The Role of Design Features and Individual Traits,” Journal of the Academy
of Marketing Science, 35 (4), 492–506.
Zillmann, Dolf (1971), “Excitation Transfer in Communication-Mediated Aggressive Behavior,”
Journal of Experimental Social Psychology, 7, 419–34.