Embed Size (px)
Citation preview

ISSN 1897-1695 (online), 1733-8387 (print) © 2018 M. Duval and L. Martin This work is licensed under the Creative Commons Attribution-NonCommercial-NoDerivatives 3.0 License.
GEOCHRONOMETRIA 46 (2019): 102–110 DOI 10.1515/geochr-2015-0105
Available online at https://content.sciendo.com/view/journals/geochr/geochr-overview.xml
ESR DATING OF FOSSIL TEETH: IN WHICH EXTENT THE THICKNESS OF ADJACENT TISSUES SHOULD BE TAKEN INTO ACCOUNT IN THE
EXTERNAL BETA DOSE RATE EVALUATION?
MATHIEU DUVAL1 and LOÏC MARTIN2 1Australian Research Centre for Human Evolution (ARCHE), Environmental futures Research Institute, Griffith University,
Nathan QLD 4111, Australia. 2Institut de Recherche sur les Archéomatériaux, UMR 5060 CNRS Université Bordeaux Montaigne, Centre de Recherche en Physique
Appliquée à l’Archéologie (CRP2A), Maison de l’archéologie, 33607 Pessac Cedex, France
Received 22 May 2018 Accepted 7 March 2019
Abstract: We used DosiVox to evaluate the impact of cement thickness on the dose effectively ab-sorbed by the enamel layer. Until now, the thickness of the dental tissues adjacent to the enamel layer was not considered by any of the most widely used combined US-ESR dating programs (DATA and USESR). Instead, if adjacent tissues are present, their thickness is by default assumed to be sufficient to fulfill the infinite matrix conditions. Our result suggest that such an assumption may represent in first instance a fair approximation of the reality, as even with a thickness of only 1 mm, the cement contributes to at least 98% of the beta dose rate coming from the outer side of the enamel layer. However, when cement is < 1 mm thick, DATA or USESR would overestimate the external beta dose rate and the value should be corrected accord-ingly by considering the relative contribution of the sediment. The impact of this correction on the to-tal dose rate may vary, as it is directly dependent on the radioactivity of the cement itself, as well as of the sediment or dentine. Our results show that a very thin cement layer (0.1 mm-thick) can signifi-cantly contribute to the beta dose rate and should therefore not be neglected. Consequently, based on these results, we recommend the systematic measurement of the thickness of the dental tissues adja-cent to the enamel layer during sample preparation, in order to proceed to beta dose rate corrections if necessary. Although this work has been especially focused on the case of fossil teeth showing cement, the conclusions stand for any other geometry involving different dental tissues adjacent to the enamel layer dated by ESR.
Keywords: DosiVox, dose rate modelling, external beta dose rate, fossil tooth, ESR dating.
1. INTRODUCTION
One of the main difficulties in Electron Spin Reso-nance (ESR) dating of fossil teeth lies in the complexity of the system that has to be considered for dose rate eval-uation. A tooth is indeed made by various dental tissues
of variable thicknesses, densities and radioelement con-centrations (Grün and Taylor, 1996; Rink and Hunter, 1997), which may all impact in more or less extent the amount of radiation dose absorbed by the enamel. If the initial and removed thickness of the enamel layer is usu-ally taken into consideration for the alpha and beta dose rate attenuation and self-absorption factors, the thickness of the adjacent tissues (dentine, cement) is in contrast very rarely considered in the dose rate evaluation. Actual-ly, the most widely used combined US-ESR age calcula-
Corresponding author: M. Duval e-mail: [email protected]
M. Duval and L. Martin
103
tion programs among the community, DATA (Grün, 2009) and USESR (Shao et al., 2014), assume by default that these tissues, if present, are thick enough (i.e., thicker than the 2 mm usually considered as a penetration range depth for beta particles) to provide 100% of the external beta dose rate to the enamel.
In order to evaluate to which extent this assumption is correct and how it may impact the external beta dose rate absorbed by the enamel layer, we used DosiVox, a Geant4-based software simulating the interactions of particles within a material for dosimetric purposes (Mar-tin et al., 2015a). With this software, it is now possible to model more complex geometries like fossil teeth, and we performed several simulations with an outer tissue thick-ness varying between 0 and 2 mm. Results are presented and discussed hereafter.
2. ESR DATING OF FOSSIL TOOTH ENAMEL
Basic considerations for dose rate evaluation A tooth is typically made of several tissues (mostly
dentine, enamel and cement) that differ in many aspects such as chemical composition, mineralization, density or thickness (see overviews in Driessens, 1980, Elliott, 2002; Hillson, 2012). Tooth structure and geometry is highly variable depending on the type and species con-sidered (Hillson, 2012), and the enamel layer dated by ESR may be surrounded by different materials, such as dental tissues and/or sediment. For example, enamel is the outermost layer in human tooth crown, which means that it is in direct contact with the sediment on its external side. In contrast, fossil equid teeth are notoriously famous for having cement capping the external side of the enamel layer. As a consequence, the sediment is not in direct contact with the enamel. Basically, these two situations
have different implications in terms of dose rate evalua-tion, and especially for the alpha and beta components.
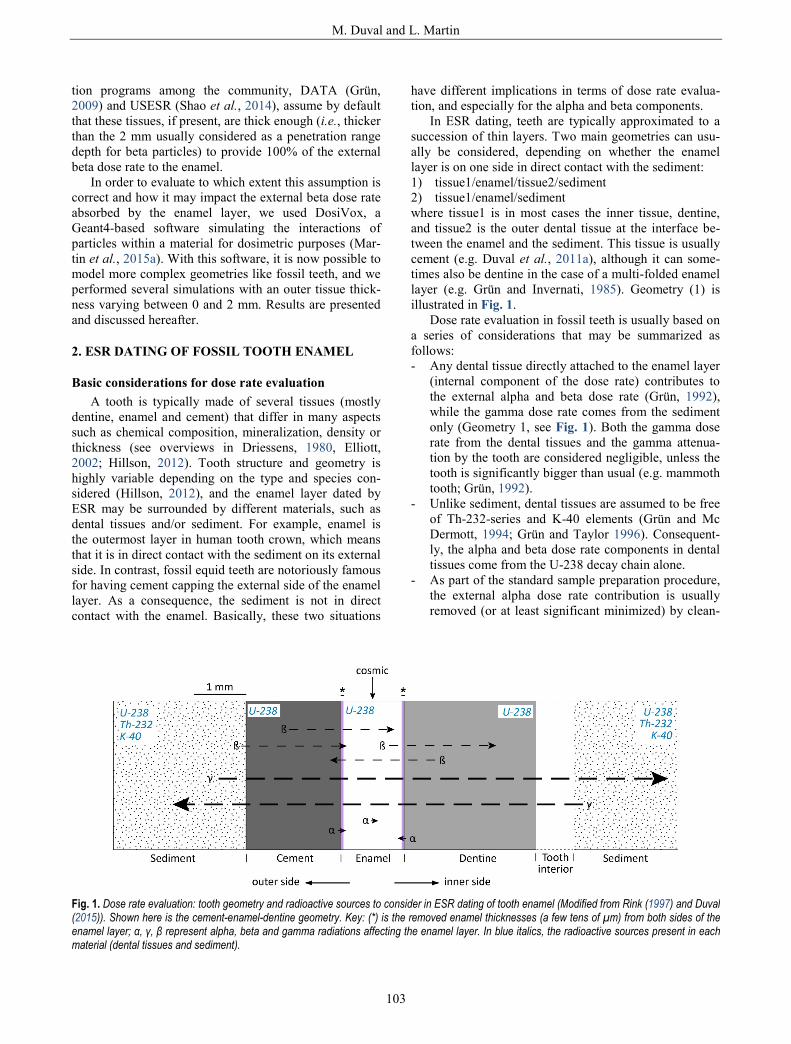
In ESR dating, teeth are typically approximated to a succession of thin layers. Two main geometries can usu-ally be considered, depending on whether the enamel layer is on one side in direct contact with the sediment: 1) tissue1/enamel/tissue2/sediment 2) tissue1/enamel/sediment where tissue1 is in most cases the inner tissue, dentine, and tissue2 is the outer dental tissue at the interface be-tween the enamel and the sediment. This tissue is usually cement (e.g. Duval et al., 2011a), although it can some-times also be dentine in the case of a multi-folded enamel layer (e.g. Grün and Invernati, 1985). Geometry (1) is illustrated in Fig. 1.
Dose rate evaluation in fossil teeth is usually based on a series of considerations that may be summarized as follows: - Any dental tissue directly attached to the enamel layer
(internal component of the dose rate) contributes to the external alpha and beta dose rate (Grün, 1992), while the gamma dose rate comes from the sediment only (Geometry 1, see Fig. 1). Both the gamma dose rate from the dental tissues and the gamma attenua-tion by the tooth are considered negligible, unless the tooth is significantly bigger than usual (e.g. mammoth tooth; Grün, 1992).
- Unlike sediment, dental tissues are assumed to be free of Th-232-series and K-40 elements (Grün and Mc Dermott, 1994; Grün and Taylor 1996). Consequent-ly, the alpha and beta dose rate components in dental tissues come from the U-238 decay chain alone.
- As part of the standard sample preparation procedure, the external alpha dose rate contribution is usually removed (or at least significant minimized) by clean-
Fig. 1. Dose rate evaluation: tooth geometry and radioactive sources to consider in ESR dating of tooth enamel (Modified from Rink (1997) and Duval (2015)). Shown here is the cement-enamel-dentine geometry. Key: (*) is the removed enamel thicknesses (a few tens of µm) from both sides of the enamel layer; α, γ, β represent alpha, beta and gamma radiations affecting the enamel layer. In blue italics, the radioactive sources present in each material (dental tissues and sediment).

IMPACT OF ADJACENT DENTAL TISSUE THICKNESS ON BETA DOSE RATE
104
ing the enamel layer on both side by > 20 µm (e.g. Duval et al., 2011a).
- In contrast, because the standard penetration depth of the beta particles (about 2 mm) is in the same order of magnitude of the usual thickness of dental tissues (typically around 1.0–1.5 mm), the beta dose rate component cannot be eliminated. Instead, the attenua-tion of the beta particles has to be considered, togeth-er with the thickness of the enamel layer removed on both sides.
- A succession of thin and homogeneous layers is con-sidered for the external beta dose rate evaluation. In order to meet the infinite matrix conditions, the thick-ness of the layers adjacent to the enamel is assumed to be > 2 mm, and an isotropic and homogeneous spatial distribution of U-238 series elements is typically as-sumed within each dental tissue.
- Dental tissues are known to behave as open systems for U-series elements (Grün and Mc Dermott, 1994). Disequilibrium in the U-238 decay chain is commonly observed in fossil teeth, and U-series have to be com-bined with ESR data to provide a single combined US-ESR age result for a given tooth (Grün et al., 1988). Further details about this approach may be found in Duval (2015) and references therein.
Current limitations of standard combined US-ESR age calculation programs
DATA (Grün, 2009) and USESR (Shao et al., 2014) are the most popular programs in the scientific communi-ty for combined US-ESR age calculations. They, howev-er, do not take into consideration the thickness of the tissues adjacent to the enamel layer in the beta dose rate evaluation. These two programs offer only 2 options: either (i) the enamel layer is surrounded on both sides by dental tissues thick enough (> 2 mm) to ensure that they produce 100% of the external beta dose rate (Geometry 1 from Fig. 1), or (ii) there is no tissue on one side (typical-ly the outer side of the enamel layer) and the beta dose rate derived for this side of the enamel comes from the sediment only. These two geometries may actually pro-duce very different beta dose rate values given the exist-ing difference in the radioelement concentrations between the sediment (usually a few ppm of U-238, Th-232 and % of K-40) and dental tissues (typically, several tens of ppm of U-238). Consequently, the choice of either option 1 or 2 may have a non-negligible impact on the calculated age, depending on whether dental tissues carry a signifi-cant weight in the total dose rate. This weight may vary between <10% in Late Pleistocene cave sites (Richard et al., 2017) to 75% in Early Pleistocene open-air sites (Du-val et al., 2011a). For example, tooth sample 3546B from Khok Sung locality, Thailand, showed an external dental tissue attached to the enamel layer and a combined US-ESR age was calculated assuming a geometry cement /
enamel / dentine (Duval et al., submitted). Now, assum-ing a geometry sediment / enamel / dentine instead (i.e., the beta dose rate contribution from the outer side of the enamel layer comes from the sediment only), the result-ing age would get older by 70 ka (+37%). This briefly illustrates the potential impact of the tooth geometry considered for the sample that is being dated.
As mentioned above, if the enamel layer is surround-ed on both sides by other dental tissues, these adjacent tissues are assumed by DATA and USESR to be thick enough (>2 mm) to meet the infinite matrix conditions. However, this assumption may sometimes be wrong. For example, the thickness of the cement layer in equid teeth is known to be highly variable depending on the type of tooth, the age at the death of the animal, as well as longi-tudinally, from the occlusal surface to the roots (e.g. Burke and Castanet, 1995). Consequently, it is not unu-sual to have an outer adjacent dental tissue with a thick-ness of < 2 mm. However, it is simply unknown in which extent it may impact the final age result. Considering a thickness that fulfills the infinite matrix conditions would lead to the calculation of an overestimated beta dose rate value (and thus an underestimated US-ESR age) if the tissue thickness is thinner than 2 mm. In contrast, consid-ering no dental tissue on the outer side of the enamel layer would underestimate the true beta dose rate and yield thus an overestimated US-ESR age. In first in-stance, the true age of the sample would be located somewhere in between those two calculations. Conse-quently, the use of Geometry 1 and 2 may be used in first instance to roughly estimate the impact of a thin (< 2 mm) adjacent tissue on the final age results. Howev-er, this evaluation cannot be considered as fully satisfac-tory given the magnitude of the uncertainty involved (see example above with sample 3546B).
Modelling beta dose rates is in first instance not so straightforward, as complex beta emitter spectra derived from K-40 as well as progeny of U-238 and Th-232 have to be considered (see Guérin et al., 2012; Martin, 2015). The mean path length of electrons emitted by these ele-ments depends on the environment considered, and is influenced by different parameters such as water content and chemical composition of the materials. The reader may refer to Grün (1986), Cross et al. (1992), Brennan et al. (1997), Martin et al. (2015b) for a discussion on these questions. The recent development of DosiVox (Martin et al., 2015a) enables now to model dose rates for complex geometries and environments by using Geant4, a platform for the simulation of particle interactions with matter using Monte Carlo methods. In our case, it offers the possibility to properly evaluate in which extent the pres-ence of an outer dental tissue with variable thickness may impact the external beta dose rate. Five different simula-tions were performed using a cement thickness varying between 0 and 2 mm.
M. Duval and L. Martin
105
3. MATERIAL AND METHODS
Beta dose rate modelling was carried out with DosiVox program (version 1.04; Martin et al., 2015a), using version 10.1p01 of Geant4 (Allison et al., 2016) and the beta emitter spectra at secular equilibrium from Guérin (2011) and Martin (2015), which are based on NuDat online database (version nov. 2009; Kinsey et al., 1996) from the NNDC (Brookhaven National Laboratory, USA). With DosiVox, simulations are performed in a three dimensional (3D) grid divided in a series of voxels whose resolution and size may differ along the three axis (see details in Martin et al., 2015a).
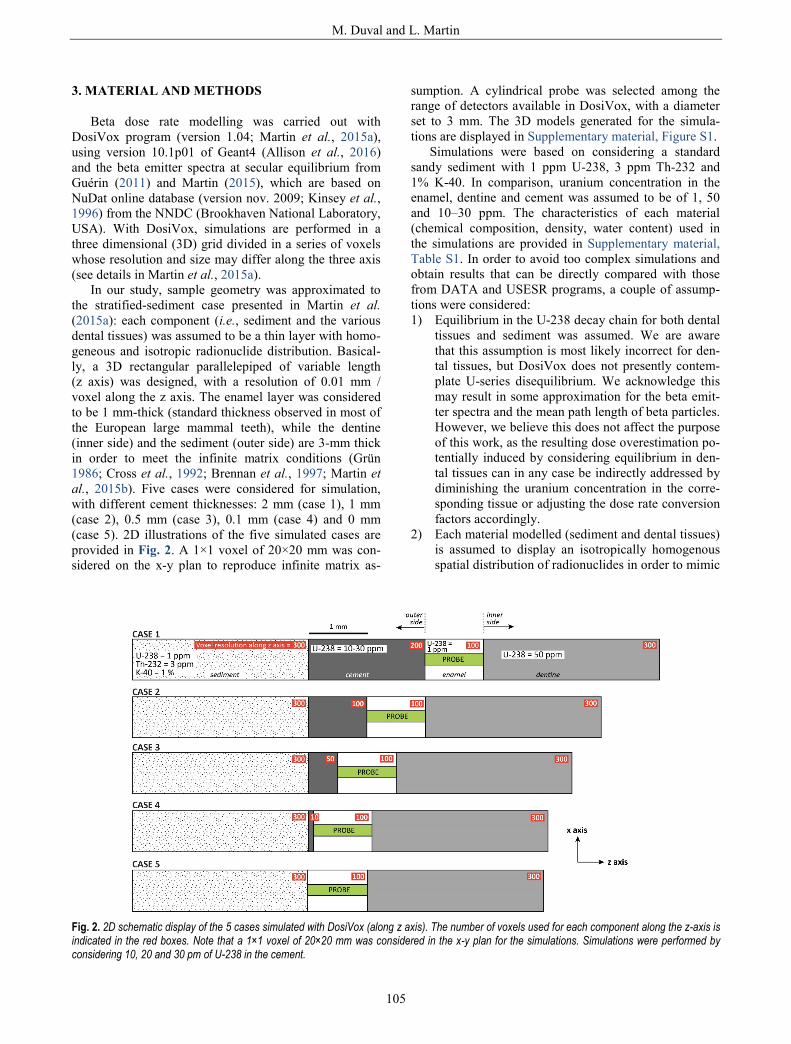
In our study, sample geometry was approximated to the stratified-sediment case presented in Martin et al. (2015a): each component (i.e., sediment and the various dental tissues) was assumed to be a thin layer with homo-geneous and isotropic radionuclide distribution. Basical-ly, a 3D rectangular parallelepiped of variable length (z axis) was designed, with a resolution of 0.01 mm / voxel along the z axis. The enamel layer was considered to be 1 mm-thick (standard thickness observed in most of the European large mammal teeth), while the dentine (inner side) and the sediment (outer side) are 3-mm thick in order to meet the infinite matrix conditions (Grün 1986; Cross et al., 1992; Brennan et al., 1997; Martin et al., 2015b). Five cases were considered for simulation, with different cement thicknesses: 2 mm (case 1), 1 mm (case 2), 0.5 mm (case 3), 0.1 mm (case 4) and 0 mm (case 5). 2D illustrations of the five simulated cases are provided in Fig. 2. A 1×1 voxel of 20×20 mm was con-sidered on the x-y plan to reproduce infinite matrix as-
sumption. A cylindrical probe was selected among the range of detectors available in DosiVox, with a diameter set to 3 mm. The 3D models generated for the simula-tions are displayed in Supplementary material, Figure S1.
Simulations were based on considering a standard sandy sediment with 1 ppm U-238, 3 ppm Th-232 and 1% K-40. In comparison, uranium concentration in the enamel, dentine and cement was assumed to be of 1, 50 and 10–30 ppm. The characteristics of each material (chemical composition, density, water content) used in the simulations are provided in Supplementary material, Table S1. In order to avoid too complex simulations and obtain results that can be directly compared with those from DATA and USESR programs, a couple of assump-tions were considered: 1) Equilibrium in the U-238 decay chain for both dental
tissues and sediment was assumed. We are aware that this assumption is most likely incorrect for den-tal tissues, but DosiVox does not presently contem-plate U-series disequilibrium. We acknowledge this may result in some approximation for the beta emit-ter spectra and the mean path length of beta particles. However, we believe this does not affect the purpose of this work, as the resulting dose overestimation po-tentially induced by considering equilibrium in den-tal tissues can in any case be indirectly addressed by diminishing the uranium concentration in the corre-sponding tissue or adjusting the dose rate conversion factors accordingly.
2) Each material modelled (sediment and dental tissues) is assumed to display an isotropically homogenous spatial distribution of radionuclides in order to mimic
Fig. 2. 2D schematic display of the 5 cases simulated with DosiVox (along z axis). The number of voxels used for each component along the z-axis is indicated in the red boxes. Note that a 1×1 voxel of 20×20 mm was considered in the x-y plan for the simulations. Simulations were performed by considering 10, 20 and 30 pm of U-238 in the cement.

IMPACT OF ADJACENT DENTAL TISSUE THICKNESS ON BETA DOSE RATE
106
the conditions offered by both DATA and USESR. We are aware the reality is undoubtedly more com-plex (e.g. Duval et al., 2011b), but investigating this question is beyond the scope of the present work and is the subject of another study (Martin et al., 2019).
For each case, U-238, Th-232 and K-40 beta spectra were simulated, and a total beta dose rate distribution was calculated according to the conversion factors from Guérin et al. (2011). Individual contributions from the sediment, dentine and cement could be extracted (Fig. 3A) and then summed to obtain a total external beta dose rate (Fig. 3B). Note that although the individual (internal) contribution of the enamel was modeled, it was not in-corporated in the external beta dose rate evaluation. Some of the pilot files created for the present study are availa-ble in Supplementary material so that anyone can run the simulations in DosiVox.
Fig. 3 shows the mean path length of beta particles within the enamel layer (grey band). An asymmetric U-shape attenuation of the beta dose rate within the enamel layer may be observed, as the result of a higher U-238 concentration from the inner side (dentine). How-ever, because ESR data are not spatially resolved (the whole volume of the enamel layer is powdered and meas-ured by ESR), beta dose rate in the enamel have to be considered as a bulk value. Consequently, a pseudo-bulk estimate of the external beta dose rate absorbed by the 1-mm thick enamel layer was calculated by averaging the beta dose rate values obtained for each voxel over the total thickness of the enamel layer (1 mm) minus the external 30 µm on each (inner and outer) side, in order to mimic the standard sample preparation procedure in ESR dating.
4. RESULTS
Total external beta dose rate Numerical values extracted for the enamel layer and
derived from the 5 sets of simulations are provided in Supplementary material, Table S2 and graphically dis-played in Fig. 4.
Fig. 4A shows the relative increase of the external to-tal beta dose rate as a function of cement thickness (from 0 to 2 mm) and radioactivity (10 to 30 ppm). The follow-ing observations can be made: - the values may increase by ~9 to ~45% for 0 to 2 mm-
thick cement with 10 and 30 ppm of U-238, respec-tively.
- for a cement with uranium concentration > 20 ppm, the relative increase in the total dose rate is already significant (5 to 10 %) with only a 0.1 mm-thick ce-ment. These simulation shows the non-negligible weight of
a thin layer (i.e., < 2 mm) of cement located at the inter-face between enamel and sediment. The thicker is the cement layer, the higher is the dose absorbed by the enamel (see also Fig. 2B). This result was expected, giv-en that cement has a significantly higher uranium concen-tration compared with sediment.
The different components of the external beta dose rate Logically, the relative contribution of the cement to
the total beta dose rate increases with the thickness and reaches a maximum at 2 mm (Fig. 4B). It may then repre-sent 30% of the total beta dose rate in case its uranium concentration is of 20 ppm. By definition, the relative
Fig. 3. Variation along the z axis of the beta dose rate values derived from the DosiVox simulations. The high frequency variability (“saw-tooth" shape) that may locally be observed are artifacts of the Geant4 “cut in range” process for secondary particle simulations. This does not affect the calculation of average dose rate values nor the general shape of the curves. A: example of case 3 (0.5 mm-thick cement with a uranium concentra-tion of 30 ppm). The individual contributions from the dentine, cement and sediment are shown. B: Total beta dose rate values (for a given case obtained from the sum of each individual contribution displayed in A) obtained for the 5 scenarios. To facilitate data visualization, data were aligned to the right.

M. Duval and L. Martin
107
weight of the cement is directly dependent on the radioel-ement concentration of the dental tissues and sediment. Nevertheless, previous observations made on horse teeth dated by ESR showed that is the large majority of the cases (88%) the cement displays lower uranium concen-tration values than in the corresponding dentine of a giv-en tooth (Duval et al., 2012). Consequently, it is very unlikely that the relative contribution of the cement to the total beta dose rate will ever exceed 50%.
In contrast, the relative contribution of the sediment is minimum (1.3%) as soon as the cement has a thickness > 0.5 mm. U-238 concentrations of 10 and 30 ppm in cement would have virtually no impact on this relative contribution: it would remain within 1.1–1.4 % for a 0.5 mm-thick cement.
Impact of the “Reflection algorithm” We also tested the impact of a “particle reflection” al-
gorithm process on the simulated dose rates with a modi-fied version of DosiVox (Martin, 2015). This algorithm was specifically designed to ensure infinite matrix condi-tions during the simulations: basically, the beta particles are emitted homogeneously and isotopically, and they are reflected in the opposite direction (i.e., like a mirror) if they ever reach the edge of the parallelepiped. This idea first came from Guérin and Mercier (2012), who used a similar algorithm to simulate infinite matrix condition for gamma particles. In our case, it creates here an infinite medium in x- and y- axis directions and allows to take into account the energy of long-range particles (mostly X-rays from the beta interaction with matter) that would simply exit the simulated volume without particle reflec-tion. Additionally, it offers an improved statistical accu-racy of the results by increasing the ratio of the number of particles interacting inside the probe detector vs. the number of simulated particles.
Using this algorithm, resulting beta dose rate no long-er display those edge effects, i.e. the depletion of the values at the border of the parallelepiped (see comparison in Fig. 5A). Numerical values derived for the enamel layer show a slight but systematic increase of the calcu-lated dose rate depending on the cement thickness (Fig. 5B): from +0.9% for a 2-mm thick cement to 2.1% with no cement. The largest difference is observed when the cement is absent. These values may be used as correc-tions factors for the dose values displayed in Supplemen-tary material, Table S2. However, it should also be men-tioned that the use of the ‘Reflection algorithm’ as virtu-ally no impact (< 1%) on the magnitude of the relative contribution of the cement to the total dose rate as a func-tion of its thickness.
As mentioned by Guérin and Mercier (2012), one of the main interests of the ‘Reflection algorithm’ is the increased statistical counting by avoiding the loss of beta particle beyond the edge of the parallelepiped. As a con-sequence, it may thus lead to a significant decrease of calculation times. However, one may be aware that the use of this algorithm results in the creation of a virtual infinite matrix by reflection. Consequently, it can only be applied to planar geometries and must be employed with caution in other cases for which the reflected geometry at the edges of the considered volume would result asym-metrical (considering the range of the beta particles).
5. DISCUSSION
The DosiVox simulations show that there is a clear correlation between the cement thickness and the amount of beta dose absorbed by the enamel layer. However, in which extent cement thickness significantly impact the dose rate evaluation?
Fig. 4. Variation of the different components of the beta dose rate depending on cement thickness and uranium concentration (derived from numeri-cal values displayed in Table S1). A: Variation of the total beta dose rate. To facilitate comparisons, values have been normalized to that correspond-ing to 0 mm-thick cement (Case 5). B: Variation of the relative contribution of each component to the total beta dose rate (values corresponding to 20 ppm U-238 in cement).

IMPACT OF ADJACENT DENTAL TISSUE THICKNESS ON BETA DOSE RATE
108
Fig. 6A shows the relative contribution of the cement to the beta dose rate from the outer side (sediment + ce-ment) as a function of cement thickness and uranium concentration. Results indicate that a 0.1 mm-thick ce-ment with 10 ppm of uranium cement contributes to at least of 40%. This value reaches 90% for a 0.5 mm-thick cement layer. Based on these data, one may reasonably conclude that the relative contribution of the sediment becomes negligible (<1.6% of the beta dose rate from the outer side) as soon as the cement is at least 1-mm thick. At 2 mm, the cement contributes to > 99.8% of the beta dose rate from the outer side, confirming the conditions very close to the infinite matrix assumption.
Finally, Fig. 6B displays the respective proportions of cement and sediment components in the beta dose rate from the outer side of the enamel layer. Note these values are independent of U-238 concentration in cement, but
depends only on its thickness. For a 2-mm thick cement, infinite matrix conditions are met and 100% of the dose rate from the outer side comes from the cement. This is the situation considered by default by DATA and USESR programs. In contrast, no cement would make that 100% of the dose rate from the outer side comes from the sedi-ment. One may observe that a 0.5-mm thick cement would produce 71% of the maximum dose, while 1 mm would make 91% of the infinite matrix dose (Fig. 6B). In other words, the sediment would contribute to 29% and 9% of the outer beta dose rate for a cement with a thick-ness of 0.5 mm and 1 mm, respectively. Based on these results, a cement beta dose rate value may be obtained from DATA or USESR with an infinite matrix assump-tion based on a 2-mm thick tissue, and then corrected accordingly based on the thickness of the cement that has been experimentally measured in a given tooth.
Fig. 5. Impact of the Reflection algorithm on the simulated dose rate values. A: comparison of the total external beta dose rates obtained with and without the reflection algorithm (example of Case #4). B: Relative increase of the total beta dose rate due to the use of the reflection algorithm (com-pared to values from Supplementary material, Table S2) as a function of cement thickness (from 0 to 2 mm, case #5 to #1).
Fig. 6. A: relative contribution of the cement to the beta dose rate from the outer side (sediment + cement) as a function of cement thickness and uranium concentration; B: respective proportions of cement and sediment components in the beta dose rate from the outer side of the enamel layer.

M. Duval and L. Martin
109
6. CONCLUSION
This work illustrates the great potential of DosiVox to address very simple questions that may be of importance in ESR or Luminescence dating, but require some model-ling. Until now, the thickness of the dental tissues adja-cent to the enamel layer was not considered. When pre-sent, adjacent tissues were assumed to be sufficient to fulfill the infinite matrix conditions. Our result suggests that in first instance such an assumption may represent a fair approximation of the reality, as even with a thickness of only 1 mm, the cement contributes to at least 98% of the beta dose rate coming from the outer side of the enamel layer. When cement is < 1 mm thick, the beta dose rate derived from DATA or USESR should be cor-rected accordingly by considering the additional contribu-tion of the sediment. The correction factors may be found in Fig. 6B. The impact of this correction on the total dose rate may vary, as it is directly dependent on the radioac-tivity of the cement itself, as well as of the sediment or dentine. Our results show that a very thin cement layer (0.1 mm-thick) can significantly contribute to the beta dose rate and should therefore not be neglected. Conse-quently, based on these results, we recommend the sys-tematic measurement of the thickness of the dental tissues adjacent to the enamel layer during sample preparation, in order to proceed to beta dose rate corrections if necessary.
Finally, DosiVox simulations were performed with a given set of experimental conditions, and we do acknowledge that reality is, as per usual, more complex than the modelled scenarios. The values of some parame-ters such as water content, density, chemical composi-tions of the sediment and dental tissues may vary among tooth samples and sites, which would have in more or less extent an impact on the modelled beta dose rate val-ues. These aspects will be further investigated in the future in order to quantify the resulting uncertainty.
Although the work has been especially focused on the case of fossil teeth showing cement, the conclusions of this work stand for any other geometry involving differ-ent dental tissues adjacent to the enamel layer dated by ESR. Sometimes, multi-folded inner enamel layers may indeed be surrounded by a succession thin dentine and enamel layers (e.g. Grün et al., 1999; Debuyst et al., 2000), resulting thus in somewhat complex beta dose rate evaluation. Finally, we provide in Supplementary materi-al the Excel spreadsheet with the beta dose rate spectra produced for this study, in which the radioelement con-centrations, and dose rate conversion factors can be ad-justed to anyone’s needs.
ACKNOWLEDGEMENTS
This research has been funded by an Australian Re-search Council Future Fellowship (FT150100215) grant-ed to M. Duval. The comments made by one anonymous
reviewer contributed to significantly improve the quality of the manuscript.
SUPPLEMENTARY MATERIAL
Here we provide the pilot text files (for the U-238 on-ly) that were created for the simulations, as well as the beta dose rate spectra (Excel spreadsheet) for the 5 cases. By adjusting the concentrations and dose rate conversion factors (yellow cells) in the specific spreadsheet of each case, the resulting beta dose rate spectra (given in Gy/ka, orange columns) will be modified accordingly.
REFERENCES
Allison J, Amako K, Apostolakis J, Arce P, Asai M, Aso T, Bagli E, Bagulya A, Banerjee S, Barrand G, Beck BR, Bogdanov AG, Brandt D, Brown, JMC, Burkhardt H, Canal, Ph., Cano-Ott D, Chauvie S, Cho K, Cirrone, GAP, Cooperman G, Cortés-Giraldo MA, Cosmo G, Cuttone G, Depaola G, Desorgher L, Dong X, Dot-ti A, Elvira VD, Folger G, Francis, Z, Galoyan A, Garnier L, Gay-er M, Genser KL, Grichine VM, Guatelli S, Guèye P, Gumplinger P, Howard AS, Hřivnáčová I, Hwang S, Incerti S, Ivanchenko A, Ivanchenko, VN, Jones FW, Jun SY, Kaitaniemi P, Karakatsanis N, Karamitros M, Kelsey M, Kimura A, Koi T, Kurashige H, Lechner A, Lee SB, Longo F, Maire M, Mancusi D, Mantero A, Mendoza E, Morgan B, Murakami K, Nikitina T, Pandola L, Pap-rocki P, Perl J, Petrović I, Pia MG, Pokorski W, Quesada JM, Raine M, Reis MA, Ribon A, Ristić Fira A, Romano F, Russo G, Santin G, Sasaki T, Sawkey D, Shin JI, Strakovsky II, Taborda A, Tanaka S, Tomé B, Toshito T, Tran HN, Truscott PR, Urban L, Uzhinsky V, Verbeke JM, Verderi M, Wendt BL, Wenzel H, Wright DH, Wright DM, Yamashita T, Yarba J, and Yoshida H, 2016. Recent developments in GEANT4. Nuclear Instruments and Methods in Physics Research A 835, 186–225, DOI 10.1016/j.nima.2016.06.125.
Brennan BJ, Rink WJ, McGuirl EL, Schwarcz HP and Prestwich WV, 1997. Beta doses in tooth enamel by “one-group” theory and the ROSY ESR dating software. Radiation Measurements 27(2): 307–314, DOI 10.1016/S1350-4487(96)00132-1.
Burke A and Castanet J, 1995. Histological Observations of Cementum Growth in Horse Teeth and their Application to Archaeology. Journal of Archaeological Science 22(4): 479–493, DOI 10.1006/jasc.1995.0047.
Cross WG, Freedman NO and Wong PY, 1992. Tables of beta-ray dose distributions in water. Technical Report AECL-10521, Chalk Riv-er Laboratoris, Chalk River, Onario.
Debuyst R, Callens F, Frechen M and Dejehet F, 2000. ESR Study of elephant tooth enamel from the Kärlich-Seeufer site in Germany. Applied Radiation and Isotopes 52(5): 1327–1336, DOI 10.1016/S0969-8043(00)00091-9.
Driessens FC, 1980. The mineral in bone, dentin and tooth enamel. Bulletin des Sociétés Chimiques Belges 89: 663–689, DOI 10.1002/bscb.19800890811.
Duval M, 2015. Electron Spin Resonance (ESR) Dating of Fossil Tooth Enamel. Encyclopedia of Scientific Dating Methods. W. J. Rink and J. W. Thompson, Springer Netherlands: pp 239–246.
Duval M, Falguères C, Bahain J-J, Grün R, Shao Q, Aubert M, Hell-strom J, Dolo J-M, Agusti J, Martínez-Navarro B, Palmqvist P and Toro-Moyano I, 2011a. The challenge of dating Early Pleistocene fossil teeth by the combined uranium series–electron spin reso-nance method: the Venta Micena palaeontological site (Orce, Spain). Journal of Quaternary Science 26(6): 603–615, DOI 10.1002/jqs.1476.
Duval M, Aubert M, Hellstrom J and Grün R, 2011b. High resolution LA-ICP-MS mapping of U and Th isotopes in an early Pleistocene equid tooth from Fuente Nueva-3 (Orce, Andalusia, Spain). Qua-

IMPACT OF ADJACENT DENTAL TISSUE THICKNESS ON BETA DOSE RATE
110
ternary Geochronology 6(5): 458–467, DOI 10.1016/j.quageo.2011.04.002.
Duval M, Falguères C and Bahain J-J, 2012. Age of the oldest hominin settlements in Spain: Contribution of the combined U-series/ESR dating method applied to fossil teeth. Quaternary Geochronology 10(0): 412–417, DOI 10.1016/j.quageo.2012.02.025.
Elliott JC, 2002. Calcium Phosphate Biominerals. Reviews in Mineralo-gy and Geochemistry 48: 427–453, DOI 10.2138/rmg.2002.48.11.
Grün R, 1986. Beta attenuation in thin layers. Ancient TL 4: 1–8. Grün R, 1992. Suggestions for minimum requirements for reporting
ESR age estimates. Ancient TL 10(3): 37–41. Grün R, 2009. The DATA program for the calculation of ESR age
estimates on tooth enamel. Quaternary Geochronology 4(3): 231–232, DOI 10.1016/j.quageo.2008.12.005.
Grün R and Invernati C, 1985. Uranium accumulation in teeth and its effect on ESR dating — A detailed study of a mammoth tooth. Nu-clear Tracks and Radiation Measurements 10(4–6): 869–877, DOI 10.1016/0735-245X(85)90102-4.
Grün R and McDermott F, 1994. Open system modelling for U-series and ESR dating of teeth. Quaternary Science Reviews 13(2): 121–125, DOI 10.1016/0277-3791(94)90037-X.
Grün R and Taylor L, 1996. Uranium and Thorium in the Constituents of Fossil Teeth. Ancient TL 14(1): 21–25.
Grün R, Schwarcz HP and Chadam J, 1988. ESR dating of tooth enam-el: Coupled correction for U-uptake and U-series disequilibrium. Nuclear Tracks and Radiation Measurements 14(1–2): 237–241.
Grün R, Yan G, McCulloch MT and Mortimer G, 1999. Detailed Mass Spectrometric U-series Analyses of Two Teeth from the Archaeo-logical Site of Pech de l'Aze II: Implications for Uranium Migra-tion and Dating. Journal of Archaeological Science 26(10): 1301–1310, DOI 10.1006/jasc.1998.0371.
Guérin G, 2011. Modélisation et simulations numériques des effets dosimétriques dans les sédiments quaternaires: application aux méthodes de datation par luminescence. Doctoral thesis in Physique des archéomatériaux, Bordeaux, université Michel de Montaigne Bordeaux3, 242p.
Guérin G, Mercier N and Adamiec G, 2011. Dose-rate conversion factors: update. Ancient TL 29(1): 5–8.
Guérin G and Mercier N, 2012. Preliminary insight into dose deposition processes in sedimentary media on a scale of single grains: Monte Carlo modelling of the effect of water on the gamma dose rate.
Radiation Measurements 47(7): 541–547, DOI 10.1016/j.radmeas.2012.05.004.
Guérin G, Mercier N, Nathan R, Adamiec G and Lefrais Y, 2012. On the use of the infinite matrix assumption and associated concepts: A critical review. Radiation Measurements 47(9): 778–785, DOI 10.1016/j.radmeas.2012.04.004.
Hillson S, 2012. Teeth. Cambridge University Press. Kinsey RR, Dunford CL, Tuli JK and Burrows TW, 1996. The
NUDAT/PCNUDAT Program for Nuclear Data, paper submitted to the 9th International Symposium of Capture Gamma-Ray Spec-troscopy and Related Topics. Budapest, Hungary, October 1996.
Martin L, 2015. Caractérisation et modélisation d’objets archéologiques en vue de leur datation par des méthodes paléo-dosimétriques; simulation de paramètres dosimétriques sous Geant4. Doctoral thesis in Physique des archéomatériaux, Bordeaux, university Bordeaux-Montaigne, 304p.
Martin L, Incerti S and Mercier N, 2015a. DosiVox: Implementing Geant 4-based software for dosimetry simulations relevant to lu-minescence and ESR dating techniques. Ancient TL 33(1): 1–10.
Martin L, Incerti S and Mercier N, 2015b. Comparison of DosiVox simulation results with tabulated data and standard calculations. Ancient TL 33(2): 1–9.
Martin L, Duval M and Grün R, 2019. DosiESR: a Geant4 based soft-ware for dose rate and age calculation in complex tooth samples. DLED2018 Conference, Beatenberg, Switzerland, 23–25 Novem-ber 2018.
Richard M, Falguères C, Pons-Branchu E, Ghaleb B, Valladas H, Mercier N, Richter D, Bahain J-J and Conard NJ, 2017. Datation par les méthodes ESR/U-Th combinées de sites du Pléistocène supérieur: méthodologie et application en contexte karstique. L’Anthropologie 121 (2017) 63–72.
Rink WJ, 1997. Electron spin resonance (ESR) dating and ESR applica-tions in quaternary science and archaeometry. Radiation Meas-urements 27(5–6): 975–1025, DOI 10.1016/S1350-4487(97)00219-9.
Rink WJ and Hunter VA, 1997. Densities of modern and fossil dental tissues: significance to ESR dating of tooth enamel. Ancient TL 15(2–3): 20–27.
Shao Q, Bahain J-J, Dolo J-M and Falguères C, 2014. Monte Carlo approach to calculate US-ESR age and age uncertainty for tooth enamel. Quaternary Geochronology 22: 99–106, DOI 10.1016/j.quageo.2014.03.003.