Embed Size (px)
Citation preview

Esquimalt Graving Dock Waterlot Remediation Project – Risk Management, Contingency, and Financial Management Presented by Amy Corp, Anchor QEA, LLC; Andrew Mylly, PWGSC; and Dan Berlin, Anchor QEA, LLC 16 April 2014

2 2
Presentation Overview
• Site description and project background • Project management system — Integration and
tracking tools • Work Breakdown Structure (WBS) • Cost Estimate — Integration Workbook • Risk Management Plan (RMP) • Schedule • Monthly Financial Tracking Report (MFTR) • System outputs • Lessons learned

3 3
Site Description and Project Background
Remediation Area
Waterlot Boundary
Legend:
Phase 1 Remediation Area
Phase 2 Remediation Area
Source: Google 2011

4 4
• Multiple-phase project (2011/12 to 2015/16) – Phase 1A – Under-pier Erosion Protection System
($7M) – Phase 1B – Open-water Remediation
($50M) – Phase 1C – Habitat Compensation
($4M) – Phase 2 – Under-pier Remediation
($26M)
• Separate design and construction contracts for each phase
Site Description and Project Background (cont.)

5 5
• Work Breakdown Structure • Cost Estimate — Integration Workbook • Risk Management Plan • Schedule • Monthly Financial Tracking Report
Project Management System: Integration and Tracking Tools

6 6
EVR = Earned Value Report NPMS = National Project Management System OTOBOS = On-Time On-Budget On-Schedule
INPUTS OUTPUTS
Feedback Loop
RMP (NPMS)
WBS (NPMS)
Tasks
Cost Estimate/ Integration Workbook
Monthly OTOBOS/SIGMA Reporting, FCSAP Funding
Requests/Updates, Liability Reporting,
etc.
Risks
Predicted Costs
Contracts, Change Orders, Monthly Progress Reports,
SIGMA
Schedule
Monthly Financial Tracking
Report/EVR
Actual Costs

7 7
• For initial planning and future fiscal year (FY) estimates – Identify tasks and associated costs per FY
• Construction: use design estimate/work breakdown and project schedule
• Consultants: subdivide tasks for various consultants, use project schedule
• PWGSC: estimate human resources needs and disbursements
• Contingency: include risk management contingency (RMC) from RMP
Work Breakdown Structure

8 8
• For current FY – Update tasks and associated costs per FY
• Construction: use contract unit price breakdown after award, change orders, and estimate at completion (EAC) from MFTR
• Consultants: update monthly with new work plan tasks/costs and EAC from MFTR
• PWGSC: update human resources needs and disbursements from MFTR
• Contingency: update with current RMC from RMP
Work Breakdown Structure (cont.)

9 9
• Incorporate costs from various sources – WBS sheets from each FY – RMC amounts from RMP and Pre-Approved Amount
for Anticipated Amendments (PAAA) sheets – Construction
• Forecast: unit-price tables and volumes from design estimates
• Actual: tender amount and change orders
– MFTR: feedback loop to update estimates with actual costs
• Plans and tracks all costs for entire project over multiple FYs
Cost Estimate – Integration Workbook
10 10
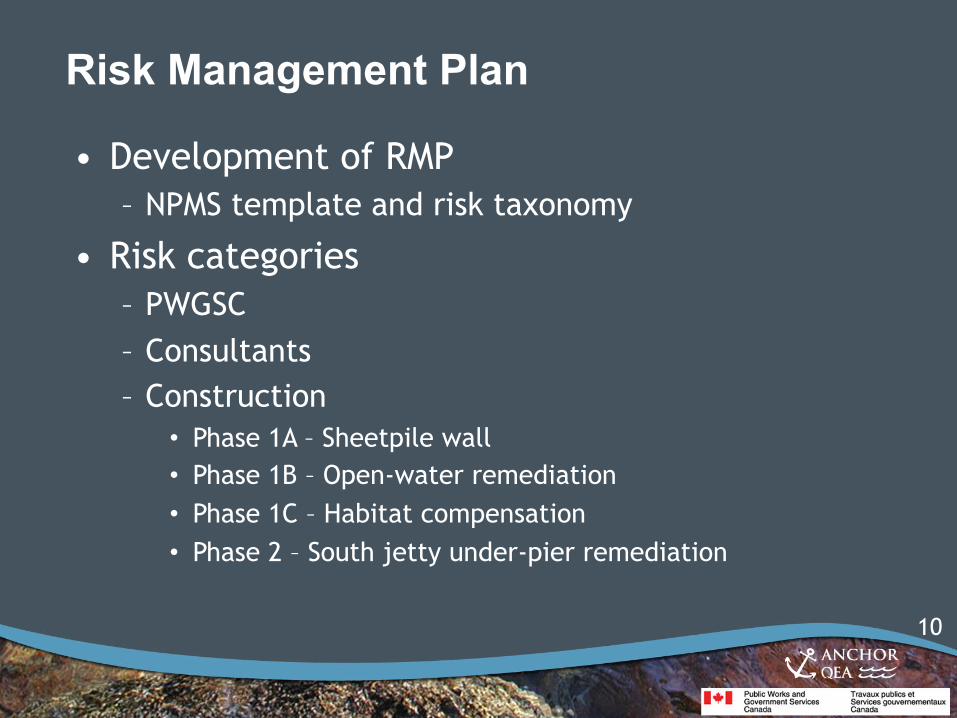
• Development of RMP – NPMS template and risk taxonomy
• Risk categories – PWGSC – Consultants – Construction
• Phase 1A – Sheetpile wall • Phase 1B – Open-water remediation • Phase 1C – Habitat compensation • Phase 2 – South jetty under-pier remediation
Risk Management Plan

11 11
• Identify risks and potential consequences • Likelihood and impact
– Schedule, functionality, and quality effect – Determines overall risk grading
Risk Management Plan (cont.)

12 12
Risk Management Plan (cont.)
Manage, mitigate, and monitor risks
Accept, but monitor risks
High (we couldn’t function or our mandate would have
to change)
Medium (we could still function)
Low (normal)
Considerable management and
monitoring required
Risk may be worth accepting with
monitoring
Accept risks
Low (normal or unlikely)
Medium (likely)
High (very likely)
Manage and monitor risks (inform senior
management)
Management effort worthwhile, mitigate
and monitor risks
Extensive management (extensive senior
management involvement)
Must manage and monitor risk (inform senior management)
Impa
ct (
cons
eque
nce/
seve
rity
)
Risk Assessment Matrix (3x3)
Likelihood (probability/frequency)
Source: Public Works and Government Services Canada, Risk Management Template

13 13
• Inherent risk allowance – Quantifies cost if risk took place – Engineer’s estimates for construction risks
• Risk response – Avoidance – Prevention – Reduction – Transfer/share – Acceptance
Risk Management Plan (cont.)

14 14
• Controls and risk response strategy • Risk allowance percentage
– Based on likelihood, impact, and response
• Residual risk estimate • Calculation of RMC
– For each phase of construction (PAAA) – Included in WBS
Risk Management Plan (cont.)

15 15
Risk Management Plan – Example Risk
Likelihood Impact Inherent
Allowance Response Response Strategy % Residual Estimate
Medium High Pre-tender $4,769,762
Post-tender $3,179,842
Total
$7,949,604
Reduction • Monitor facilities and market pricing
• Cost contingencies included to protect against impacts of change in market pricing
• Timely completion of work
80%
75%
Pre-tender $3,815,810
Post-tender $2,384,880
Total
$6,200,690
• Phase 1B – Changes in transport and disposal costs – Price could increase due to changes in market
conditions after tender, or due to changes in regulatory requirements or facility availability

16 16
Risk Management Plan – Contingency Over Time

17 17
Schedule
• Development – Identify project phasing, tasks, durations, and
milestones with sufficient detail over multiple FYs – Integration with the FCSAP cycle
• Maintenance – Monthly review and updates based on design and
consultant/contractor schedules – FY task changes are reflected in the WBS through
the feedback loop

18 18
Monthly Financial Tracking Report
• Inputs: Consultant monthly progress reports, contract and contract change order data, and SIGMA commitments and actuals
• Outputs: OTOBOS metrics, value of work done, year-to-date invoiced (actual), and EAC (forecast)
Physical Progress Complete
(%)
Total Commitment
(SIGMA)
Updated Budget Cost
at Completion
(BAC) (from WBS)
YTD Expenditure – Estimated
Value of Work Done (VWD) –
Actual Cost for Work Performed
(ACWP)
YTD Amount Invoiced (SIGMA)
Financial Progress VWD/BAC
(%)
Updated Forecast –
(EAC)
Financial Variance at Completion (BAC-EAC)
Financial Variance at Completion (BAC-EAC)/
BAC (%)
Totals 91% 47,518,703 47,875,186 42,151,295 38,843,077 88% 44,970,481 2,904,705 6.1%
Total Funding 47,243,000 47,243,000 47,243,000 47,243,000 47,243,000
Total Budget Variance (275,703) (632,186) 5,091,705 8,399,924 2,272,519 4.8%

19 19
Monthly Financial Tracking Report (cont.)
• Contract Earned Value Reporting – Inputs: Contractor cash flow forecast (baseline)
based on contract unit price breakdown, Contractor Progress Claims, Contractor Schedule
– Outputs: Cost variance, schedule variance, EAC, earned value, and estimated completion date

20 20
Monthly Financial Tracking Report (cont.)

21 21
System Outputs
• FCSAP funding submission • Annual liability estimates for TB public accounts • Annual Federal Contaminated Sites Inventory update • Project approval: PCRA, IIP, IMB, RPIB, EPA • NPMS deliverables: Project Management Plan • FCSAP reporting: expenditures/forecasts • Banking day submissions: quarterly • Project monitoring board review: quarterly • Monthly SIGMA OTOBOS report • FY end expenditure forecasts

22 22
• Regular updates to RMP are essential to financial tracking
• Improve integration with internal financial systems - SIGMA
• Identifying human resources required • Adapting NPMS tools to meet project needs • Achieving consistency between tools • Financial tracking system critical for project
success and reporting requirements
Lessons Learned