Embed Size (px)
Citation preview
ESN Analyser
Investment Research
Page 1 of 69
Produced & Distributed by the Members of ESN (see last page of this report)
ESN Analyser
Investment Research
27 October 2016
ESN Top Picks
Roadshows
Corporate Events
Tactical Sector Views
RECOMMENDATION CHANGES
UniCredit downgraded to Accumulate from Buy Possible liability management exercise?
Nordea downgraded to Neutral from Accumulate Increased certainty about dividend but 2017 earnings under pressure
Bittium Corporation downgraded to Accumulate from Buy Q3 preview: Will the Mexsat design project alter H2 profitability?
Vaisala upgraded to Buy from Accumulate Profitability heading towards the target of 15%
Cramo upgraded to Accumulate from Neutral Convincingly controlled earnings growth
Fcc downgraded to Neutral from Accumulate EBITDA and working capital recovering
NEWS BY SECTOR
AEROSPACE & DEFENSE
Lisi (Accumulate) Q3-2016 sales: a gradual increase in growth
AUTOMOBILES & PARTS
Bittium Corporation (Accumulate) Q3 preview: Will the Mexsat design project alter H2 profitability?
ElringKlinger (Neutral) Acquisition of a minority stake in hofer AG
BANKS
Sector News Portuguese Banks: Exposure to Mozambique
Banco Sabadell (Buy) 3Q’16 forecasts: EUR215m (-5.4% Y/Y)
BBVA (Buy) 9M 16 earnings: EUR2,797m (-0.6% adjusted)
BPI (Neutral) 9M16 results: Positive results (NII in Angola and provisions/asset quality in Portugal). ROE at 10.5%
BPI (Neutral) GSM to vote on the sale of 2% of BFA (Angola) to Unitel
CaixaBank (Neutral) 3Q’16 results preview: EUR930m (-6.7% Y/Y)
Deutsche Bank (Neutral) Q3 results above expectations due to lower one-offs
Mediobanca (Accumulate) Q1 results preview
Nordea (Neutral) Increased certainty about dividend but 2017 earnings under pressure
UniCredit (Accumulate) Possible liability management exercise?
BASIC RESOURCES
Acerinox (Buy) Comments from 3Q’16 results presentation
Ence (Buy) 9m’16 results
Europac (Accumulate) Good 9m’16 results
CHEMICALS
Kemira (Accumulate) Defending the margins

ESN Analyser
Investment Research
Page 2 of 69
Produced & Distributed by the Members of ESN (see last page of this report)
ELECTRONIC & ELECTRICAL EQUIPMENT
Kontron (Buy) Weak Q4 guidance but restructuring in focus
Vaisala (Buy) Profitability heading towards the target of 15%
FINANCIAL SERVICES
FinecoBank (Buy) The new cyborg advisory platform became fully operational
FOOD & BEVERAGE
Atria (Accumulate) Q3 results fell short of forecasts, the acquisition price of Well Beef Ltd very cheap
Ebro Foods (Neutral) Good 9m’16 results and 2016 close anticipated
Rémy Cointreau (Neutral) Small acquisition in premium whiskey
FOOD & DRUG RETAILERS
Kesko (Neutral) Earnings outlook improved, a good selling price for grocery trade in Russia
GENERAL INDUSTRIALS
Arcadis (Neutral) CEO steps down; trading update disappointing
Huhtamäki (Accumulate) Earnings missed expectations – focus remains on growth
HEALTHCARE
Amplifon (Accumulate) 9M 16 results: sales and profitability better than expected
Recordati (Accumulate) 9M 16 results preview
INDUSTRIAL ENGINEERING
Kone (Neutral) Alleviation to concerns related to China
Konecranes (Neutral) Weak orders, savings advancing
INSURANCE
Banca Mediolanum (Accumulate) ECB against Fininvest’s significant stake in BMED
MATERIALS, CONSTRUCTION & INFRASTRUCTURE
Abertis (Accumulate) Better profitability and good traffic growth
Cramo (Accumulate) Convincingly controlled earnings growth
Fcc (Neutral) EBITDA and working capital recovering
Ferrovial (Accumulate) Neutral results
MEDIA
Gruppo Ed. L'Espresso (Accumulate) 9m 2016 Post: surprising advertising growth in Q3
Ipsos (Buy) Confirmation of the return to growth with a good Q3-16
Mediaset Espana (Buy) Weak 3Q results, but cost guidance improved
OIL & GAS PRODUCERS
Eni (Buy) Q3 2016 preview: one-offs are due to affect production
Repsol (Buy) Agreement in Bolivia
OIL SERVICES
Technip (Buy) Q3 results better than expected, 2016 outlook raised
Vopak (Buy) Updates estimates and target + VTTI deal read through

ESN Analyser
Investment Research
Page 3 of 69
Produced & Distributed by the Members of ESN (see last page of this report)
SOFTWARE & COMPUTER SERVICES
Altran (Buy) Q3-2016 revenue in line
ICT Group (Accumulate) Ongoing good revenue growth, guidance reiterated
SUPPORT SERVICES
Ei Towers (Accumulate) Q3 2016 Pre: uneventful quarter in sight
Lassila & Tikanoja (Accumulate) Stability is essential
TECHNOLOGY HARDWARE & EQUIPMENT
ASM International (Buy) Q3 numbers ok; outlook weakish
Besi (Neutral) Another strong quarter
Ingenico (Buy) Mixed trends with no improvement in the outlook
SLM Solutions (Buy) Fundamentals now in focus
STMicroelectronics (Neutral) Q3 & 9M 16 release: positive results
TELECOMMUNICATIONS
KPN Telecom (Buy) 3Q16: EBITDA increases YoY but FCF disappoints
Telefonica (Accumulate) Dividend reduced. Results: acceptable
TRAVEL & LEISURE
Int. Airlines Group (Buy) Agreement in principle of the NAPS
UTILITIES
EDP Renováveis (Buy) 9M16 results preview: comparisons affected by positives one offs in the previous year and
increase in financial costs
Terna (Neutral) Not on the seaside this summer
ESN Top Picks
Page 4 of 69
Produced & Distributed by the Members of ESN (see last page of this report)
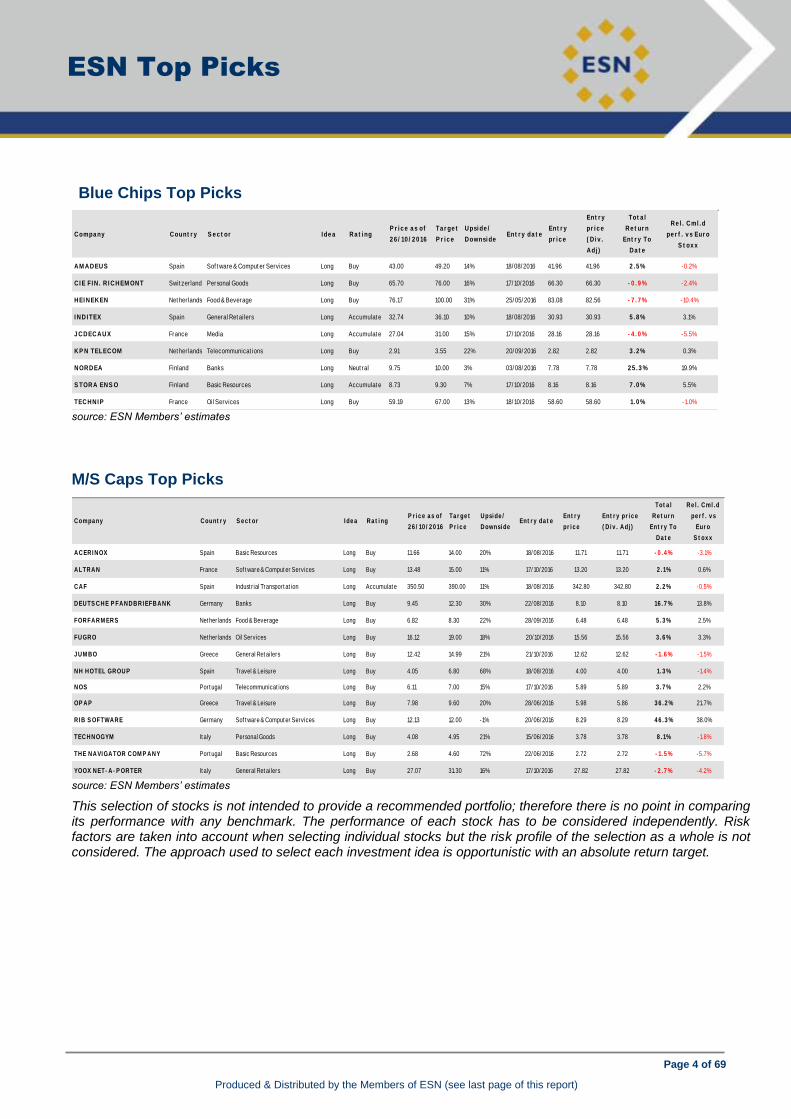
Blue Chips Top Picks
Compa ny Count r y S e c t or I de a Ra t i ngP r i c e a s of
2 6 / 10 / 2 0 16
Ta r ge t
P r i c e
Upsi de /
Downsi deEnt r y da t e
Ent r y
pr i c e
Ent r y
pr i c e
( D i v .
Adj )
Tot a l
Re t ur n
Ent r y To
Da t e
Re l . Cml . d
pe r f . v s Eur o
S t ox x
AM ADEUS Spain Sof t ware & Comput er Services Long Buy 43.00 49.20 14% 18/ 08/ 2016 41.96 41.96 2 . 5 % -0.2%
CI E FI N . R I CHEM ONT Swit zerland Personal Goods Long Buy 65.70 76.00 16% 17/ 10/ 2016 66.30 66.30 - 0 . 9 % -2.4%
HEI NEKEN Net herlands Food & Beverage Long Buy 76.17 100.00 31% 25/ 05/ 2016 83.08 82.56 - 7 . 7 % -10.4%
I NDI TEX Spain General Ret ailers Long Accumulat e 32.74 36.10 10% 18/ 08/ 2016 30.93 30.93 5 . 8 % 3.1%
J CDECAUX France Media Long Accumulat e 27.04 31.00 15% 17/ 10/ 2016 28.16 28.16 - 4 . 0 % -5.5%
KP N TELECOM Net herlands Telecommunicat ions Long Buy 2.91 3.55 22% 20/ 09/ 2016 2.82 2.82 3 . 2 % 0.3%
NORDEA Finland Banks Long Neut ral 9.75 10.00 3% 03/ 08/ 2016 7.78 7.78 2 5 . 3 % 19.9%
S TORA ENS O Finland Basic Resources Long Accumulat e 8.73 9.30 7% 17/ 10/ 2016 8.16 8.16 7 . 0 % 5.5%
TECHNI P France Oil Services Long Buy 59.19 67.00 13% 18/ 10/ 2016 58.60 58.60 1. 0 % -1.0% source: ESN Members’ estimates
M/S Caps Top Picks
Compa ny Count r y S e c t or I de a Ra t i ngP r i c e a s of
2 6 / 10 / 2 0 16
Ta r ge t
P r i c e
Upsi de /
Downsi deEnt r y da t e
Ent r y
pr i c e
Ent r y pr i c e
( D i v . Adj )
Tot a l
Re t ur n
Ent r y To
Da t e
Re l . Cml . d
pe r f . v s
Eur o
S t ox x
ACERI NOX Spain Basic Resources Long Buy 11.66 14.00 20% 18/ 08/ 2016 11.71 11.71 - 0 . 4 % -3.1%
ALTRAN France Sof t ware & Comput er Services Long Buy 13.48 15.00 11% 17/ 10/ 2016 13.20 13.20 2 . 1% 0.6%
CAF Spain Indust r ial Transport at ion Long Accumulat e 350.50 390.00 11% 18/ 08/ 2016 342.80 342.80 2 . 2 % -0.5%
DEUTS CHE P FANDBRI EFBANK Germany Banks Long Buy 9.45 12.30 30% 22/ 08/ 2016 8.10 8.10 16 . 7 % 13.8%
FORFARM ERS Net herlands Food & Beverage Long Buy 6.82 8.30 22% 28/ 09/ 2016 6.48 6.48 5 . 3 % 2.5%
FUGRO Net herlands Oil Services Long Buy 16.12 19.00 18% 20/ 10/ 2016 15.56 15.56 3 . 6 % 3.3%
J UM BO Greece General Ret ailers Long Buy 12.42 14.99 21% 21/ 10/ 2016 12.62 12.62 - 1. 6 % -1.5%
NH HOTEL GROUP Spain Travel & Leisure Long Buy 4.05 6.80 68% 18/ 08/ 2016 4.00 4.00 1. 3 % -1.4%
NOS Port ugal Telecommunicat ions Long Buy 6.11 7.00 15% 17/ 10/ 2016 5.89 5.89 3 . 7 % 2.2%
OP AP Greece Travel & Leisure Long Buy 7.98 9.60 20% 28/ 06/ 2016 5.98 5.86 3 6 . 2 % 21.7%
RI B S OFTWARE Germany Sof t ware & Comput er Services Long Buy 12.13 12.00 -1% 20/ 06/ 2016 8.29 8.29 4 6 . 3 % 38.0%
TECHNOGYM It aly Personal Goods Long Buy 4.08 4.95 21% 15/ 06/ 2016 3.78 3.78 8 . 1% -1.8%
THE NAVI GATOR COM P ANY Port ugal Basic Resources Long Buy 2.68 4.60 72% 22/ 06/ 2016 2.72 2.72 - 1. 5 % -5.7%
YOOX NET- A- P ORTER It aly General Ret ailers Long Buy 27.07 31.30 16% 17/ 10/ 2016 27.82 27.82 - 2 . 7 % -4.2%
source: ESN Members’ estimates
This selection of stocks is not intended to provide a recommended portfolio; therefore there is no point in comparing its performance with any benchmark. The performance of each stock has to be considered independently. Risk factors are taken into account when selecting individual stocks but the risk profile of the selection as a whole is not considered. The approach used to select each investment idea is opportunistic with an absolute return target.

Roadshows
Page 5 of 69
Produced & Distributed by the Members of ESN (see last page of this report)
SUBJECT LOCATION EVENT DATE
EDENRED Geneva Cross-country Company Roadshow 09/11/2016
EDENRED Zurich Cross-country Company Roadshow 10/11/2016
Mediaset España Madrid Local Company Roadshow 10/11/2016
Kemira Lisboa Cross-country Company Roadshow 11/11/2016

Corporate Events
Page 6 of 69
Produced & Distributed by the Members of ESN (see last page of this report)
Corporate Events today
Source: Precise
CompanyBloomberg
codeDate Event Type Description
ALTRAN ALT FP 27/10/16 Trading Update Q3 2016 Sales conference call
ARCADIS ARCAD NA 27/10/16 Trading Update Q3 2016 Trading statement conference call
AREVA AREVA FP 27/10/16 Trading Update Q3 2016 Sales
ASM INTERNATIONAL ASM NA 27/10/16 Results Q3 2016 Earnings conference call / Webcast
ASPO ASPO FH 27/10/16 Results Q3 2016 Press conference
BBVA BBVA SM 27/10/16 Results Q3 2016 Webcast
BESI BESI NA 27/10/16 Results Q3 2016 Earnings conference call / Webcast
CORP. FINANCIERA ALBA ALB SM 27/10/16 Ex Dividend Date Interim 2016 Ex-dividend date EUR 0.50
ELISA ELISA FH 27/10/16 Capital Markets Day Capital Markets Day
ENCE ENC SM 27/10/16 Results Q3 2016 Earnings conference call / Webcast
IMERYS NK FP 27/10/16 Results Q3 2016 Results
KESKO KESBV FH 27/10/16 Results Q3 2016 Press & analyst meeting / Webcast
LEMMINKÄINEN LEM1S FH 27/10/16 Analyst Meeting Q3 2016 Press & analyst meeting
NATUREX NRX FP 27/10/16 Analyst Meeting Capital Markets Day
NOKIA NOKIA FH 27/10/16 Results Q3 2016 Earnings conference call / Webcast
NORDEA NDA1V FH 27/10/16 Analyst Meeting Q3 2016 Analyst meeting
PKC GROUP PKC1V FH 27/10/16 Results Q3 2016 Press conference
RECORDATI REC IM 27/10/16 Results Q3 2016 Earnings conference call
SCHNEIDER ELECTRIC SE SU FP 27/10/16 Trading Update Q3 2016 Earnings conference call
SU FP 27/10/16 Analyst Meeting Investor Day
STMICROELECTRONICS STM IM 27/10/16 Results Q3 2016 Earnings conference call / Webcast
STM IM 27/10/16 Results Q3 2016 Results
TECHNIP TEC FP 27/10/16 Results Q3 2016 Results
TEC FP 27/10/16 Results Q3 2016 Earnings conference call / Webcast
TELEFONICA TEF SM 27/10/16 Results Q3 2016 Earnings conference call / Webcast
TF1 TFI FP 27/10/16 Results Q3 2016 Earnings conference call / Webcast
VALMET VALMT FH 27/10/16 Results Q3 2016 Earnings conference call / Webcast {simultaneous}
VALMT FH 27/10/16 Analyst Meeting Q3 2016 Press & analyst meeting
VISCOFAN VIS SM 27/10/16 Results Q3 2016 Results
YIT YTY1V FH 27/10/16 Analyst Meeting Q3 2016 Press & analyst meeting {English}
YTY1V FH 27/10/16 Results Q3 2016 Earnings conference call / Webcast {simultaneous}
ESN Tactical Sector Views
Page 7 of 69
Produced & Distributed by the Members of ESN (see last page of this report)
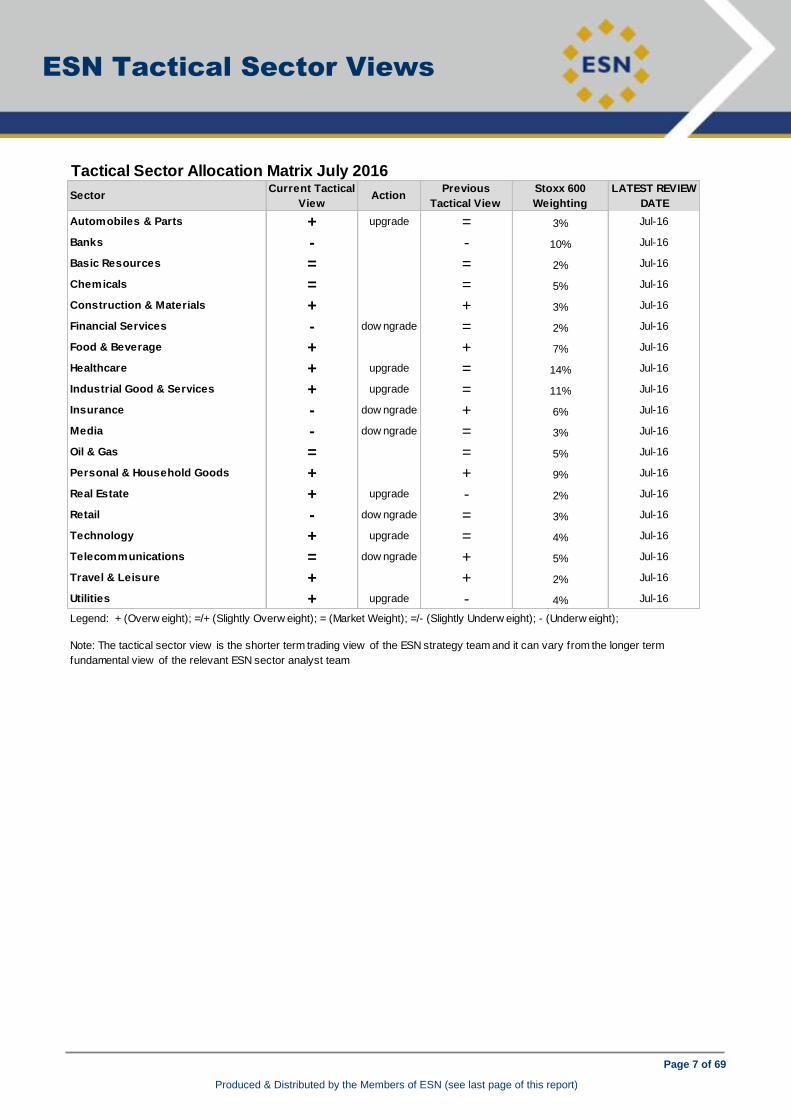
Tactical Sector Allocation Matrix July 2016
SectorCurrent Tactical
ViewAction
Previous
Tactical View
Stoxx 600
Weighting
LATEST REVIEW
DATE
Automobiles & Parts + upgrade = 3% Jul-16
Banks - - 10% Jul-16
Basic Resources = = 2% Jul-16
Chemicals = = 5% Jul-16
Construction & Materials + + 3% Jul-16
Financial Services - dow ngrade = 2% Jul-16
Food & Beverage + + 7% Jul-16
Healthcare + upgrade = 14% Jul-16
Industrial Good & Services + upgrade = 11% Jul-16
Insurance - dow ngrade + 6% Jul-16
Media - dow ngrade = 3% Jul-16
Oil & Gas = = 5% Jul-16
Personal & Household Goods + + 9% Jul-16
Real Estate + upgrade - 2% Jul-16
Retail - dow ngrade = 3% Jul-16
Technology + upgrade = 4% Jul-16
Telecommunications = dow ngrade + 5% Jul-16
Travel & Leisure + + 2% Jul-16
Utilities + upgrade - 4% Jul-16
Legend: + (Overw eight); =/+ (Slightly Overw eight); = (Market Weight); =/- (Slightly Underw eight); - (Underw eight);
Note: The tactical sector view is the shorter term trading view of the ESN strategy team and it can vary from the longer term
fundamental view of the relevant ESN sector analyst team
Page 8 of 69
Produced & Distributed by the Members of ESN (see last page of this report)
Lisi
France/Aerospace & Defense Analyser
AEROSPACE & DEFENSE
Lisi (Accumulate) Q3-2016 sales: a gradual increase in growth
Q3-2016 sales: a gradual increase in growth
The facts: Q3-2016 sales: EUR379m, +12% (of which organic growth +6.9%).
Aerospace: Q3 sales: EUR236m (+8.9%, of which organic growth +8.5%)
Auto: Q3 sales: EUR109m (+4.6%, of which organic growth +4.8%)
Medical: Q3 sales: EUR35m (+90%, organic growth +1%).
Our analysis: Sales in the first nine months came out at EUR1,174m, up 7.2% (of
which organic growth +4.6%). Q3 therefore brought an increase in organic growth
after a slow start to 2016. Recap of sales performance in 2016: Q1 +1.8; Q2 +5.4%.
AERO: A sharp ramp-up for the A350 (EUR1m/jet) and in parts for Leap.
Continued decline for Boeing: not yet back to normative levels. Acceleration
and operational efforts in relation to structural components, no halt in
recruitment, settlement of machines: development costs until mid-2017. Q4
and 2017 are both set to be strong periods.
AUTO: Began the year in decline, but Europe now shows growth. New
products: +10%, a record quarter, with a ramp-up in production anticipated for
several prototypes, and order intake to be converted to manufacturing stage.
Confirmation of recovery thanks to the hardware plan. Normative margin of 7%
targeted, which is higher than that mentioned in the report (4%) prepared to
determine an intrinsic value of EUR28.
Medical: First quarter with Remele complete, and new orders, therefore
extension of the Minneapolis plan authorised, while the Caen plant is faring
well.
Conclusion & Action: A very good third quarter, and Q4 and 2017 are set to
show even better results.
A quality stock, whose price has naturally corrected.
Bear in mind that one year ago, sales were falling by -3.1%, and there was a small
adjustment of forecasts.
This year the situation has completely turned around.
Analyst(s):
Agnès Blazy, CM - CIC Market Solutions
+33 1 53 48 80 67
Accumulate
27.05
closing price as of 26/10/2016
28.00
Target Price unchanged
Recommendation unchanged
Target price: EUR
Share price: EUR
Reuters/Bloomberg GFII.PA/FII FP
Market capitalisation (EURm) 1,461
Current N° of shares (m) 54
Free float 30%
Daily avg. no. trad. sh. 12 mth 13
Daily avg. trad. vol. 12 mth (m) 477
Price high 12 mth (EUR) 27.15
Price low 12 mth (EUR) 19.04
Abs. perf. 1 mth 12.64%
Abs. perf. 3 mth 21.25%
Abs. perf. 12 mth 14.91%
Key financials (EUR) 12/15 12/16e 12/17e
Sales (m) 1,458 1,531 1,608
EBITDA (m) 204 222 247
EBITDA margin 14.0% 14.5% 15.4%
EBIT (m) 146 157 176
EBIT margin 10.0% 10.2% 10.9%
Net Profit (adj.)(m) 82 93 105
ROCE 9.7% 9.9% 10.6%
Net debt/(cash) (m) 157 138 109
Net Debt/Equity 0.2 0.2 0.1
Debt/EBITDA 0.8 0.6 0.4
Int. cover(EBITDA/Fin. int) 33.1 49.8 66.1
EV/Sales 1.1 1.1 1.0
EV/EBITDA 7.6 7.4 6.5
EV/EBITDA (adj.) 7.6 7.4 6.5
EV/EBIT 10.5 10.4 9.1
P/E (adj.) 16.5 15.7 13.9
P/BV 1.7 1.7 1.5
OpFCF yield 3.4% 1.6% 2.3%
Dividend yield 1.4% 1.5% 1.7%
EPS (adj.) 1.52 1.73 1.94
BVPS 14.66 16.00 17.54
DPS 0.39 0.42 0.45
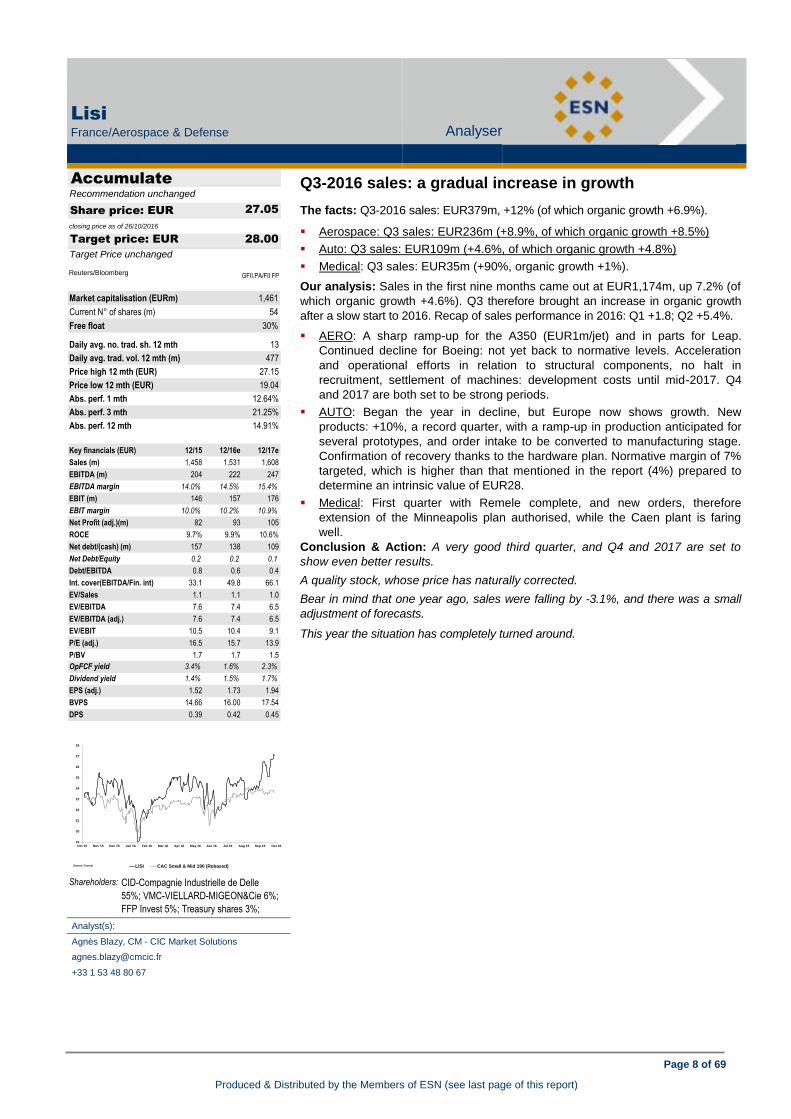
19
20
21
22
23
24
25
26
27
28
Oct 15 Nov 15 Dec 15 Jan 16 Feb 16 Mar 16 Apr 16 May 16 Jun 16 Jul 16 Aug 16 Sep 16 Oct 16
vvdsvdvsdy
LISI CAC Small & Mid 190 (Rebased)Source: Factset
Shareholders: CID-Compagnie Industrielle de Delle
55%; VMC-VIELLARD-MIGEON&Cie 6%;
FFP Invest 5%; Treasury shares 3%;
Employees 1.24%;
Page 9 of 69
Produced & Distributed by the Members of ESN (see last page of this report)
Bittium Group
Q3 2015a
M€ OP Cons. Diff. OP Cons. Diff.
Sales 14.8 12.9 15% 0 11.1 0 64 64 0%
EBIT 1.3 0.4 280% # 0.0 0 4 3 28%
EBIT margin 9.0 % 2.7 % 0.0 % # 0.0 % # 6.3 % 4.9 %
PTP 1.5 0.5 240% 0 0.1 0 4.6 3.8 20%
EPS 0.04 0.01 291% 0.00 0.12 0.10 19%
DPS 0.30 0.30 # 0.03 # 0.06 0.07 -12%
Source: OP and FactSet
2016eQ3 2016e
Bittium Corporation
Finland/Automobiles & Parts Analyser
AUTOMOBILES & PARTS
Bittium Corporation (Accumulate) Q3-2016 sales: a gradual increase in growth
Q3 preview: Will the Mexsat design project alter H2 profitability?
The facts: Bittium will report its Q3 figures on Thursday, 3 November at 7.00 am
CET. Bittium expects 2016 sales to be above the level of 2015 (EUR 56.8m). It
has no profitability guidance, which the company justifies by its ongoing strategy
process as well as the transaction at the turn of the year concerning tactical
communication systems. The schedule of the transaction is not yet certain.
Our analysis: Bittium's share price has been depressed by the company's
release on the possible impact of the reduced cooperation with Ericsson. Bittium
estimates that if the measures planned by Ericsson are realised in full, the
measures may have a negative impact on Bittium's 2017 sales and EBIT. We do
not expect the decline in the share of Ericsson to have a significant impact on
Bittium's growth drivers. Revenues of over EUR 10m from the design project
concerning Mexsat devices will be recognised this year. The cash flow of design
projects is typically back-end loaded, which is why we expect the project to
support H2. After the termination of the design project, actual deliveries of
equipment will start in 2017. We estimate that the biggest impact from the tactical
communication system deliveries will in any case be seen in 2017 irrespective of
the publication date of the transaction.
In the future, communication systems in the public safety markets will be based
on commercial mobile network technology. We believe that Bittium stands to gain
from this development trend as it has long experience from designing mobile
network solutions. Bittium's potential deals will be large in proportion to its size,
and an individual quarter will therefore be of minor importance in terms of the
future outlook. In quarterly comparison one should that Bittium's earnings are
highly volatile.
Conclusion & Action: Our target price is based on DCF (70%) and peer
company (30%) valuation (P/E and EV/EBITDA). We are assigning more weight
to DCF because the potential arising from large projects is beyond our present
forecast horizon. We have made no changes to our 2017–2018 forecasts and
maintain our target price of EUR 6.60. Due to the share price rise, our
recommendation falls to Accumulate (from Buy).
Analyst(s):
Hannu Rauhala, OP Corporate Bank
+358 10 252 4392
Accumulate
5.97
closing price as of 26/10/2016
6.60
Target Price unchanged
from Buy
Target price: EUR
Share price: EUR
Reuters/Bloomberg BITTI.HE/BITTI FH
Market capitalisation (EURm) 213
Current N° of shares (m) 36
Free float 86%
Daily avg. no. trad. sh. 12 mth 97
Daily avg. trad. vol. 12 mth (m) 228
Price high 12 mth (EUR) 7.54
Price low 12 mth (EUR) 5.17
Abs. perf. 1 mth -11.03%
Abs. perf. 3 mth 9.14%
Abs. perf. 12 mth 1.53%
Key financials (EUR) 12/15 12/16e 12/17e
Sales (m) 57 64 69
EBITDA (m) 8 10 11
EBITDA margin 13.2% 15.1% 16.6%
EBIT (m) 2 4 7
EBIT margin 4.1% 6.3% 9.6%
Net Profit (adj.)(m) 536 4 6
ROCE 10.2% 10.0% 15.0%
Net debt/(cash) (m) (122) (110) (110)
Net Debt/Equity -0.9 -0.8 -0.8
Debt/EBITDA -16.2 -11.5 -9.6
Int. cover(EBITDA/Fin. int) high high high
EV/Sales 2.2 1.6 1.5
EV/EBITDA 17.0 10.6 8.8
EV/EBITDA (adj.) 17.0 10.6 8.8
EV/EBIT 55.4 25.4 15.1
P/E (adj.) 0.5 nm 32.9
P/BV 1.8 1.5 1.5
OpFCF yield 3.8% -4.3% 1.0%
Dividend yield 5.0% 1.0% 1.5%
EPS (adj.) 15.06 0.12 0.18
BVPS 3.86 3.92 4.04
DPS 0.30 0.06 0.09
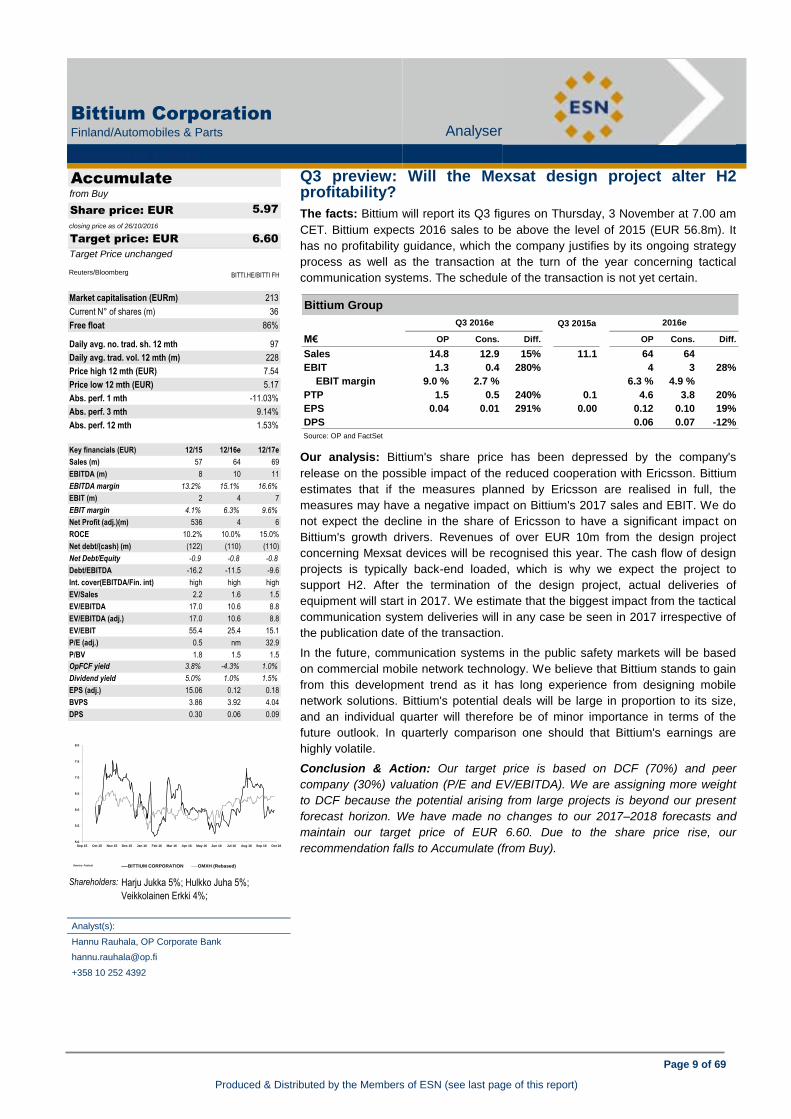
5.0
5.5
6.0
6.5
7.0
7.5
8.0
Sep 15 Oct 15 Nov 15 Dec 15 Jan 16 Feb 16 Mar 16 Apr 16 May 16 Jun 16 Jul 16 Aug 16 Sep 16 Oct 16
vvdsvdvsdy
BITTIUM CORPORATION OMXH (Rebased)Source: Factset
Shareholders: Harju Jukka 5%; Hulkko Juha 5%;
Veikkolainen Erkki 4%;

Page 10 of 69
Produced & Distributed by the Members of ESN (see last page of this report)
ElringKlinger
Germany/Automobiles & Parts Analyser
AUTOMOBILES & PARTS
ElringKlinger (Neutral) Q3 preview: Will the Mexsat design project alter H2 profitability?
Acquisition of a minority stake in hofer AG
The facts: ElringKlinger has announced this morning that it has acquired a
strategic 27% minority stake in the engineering company hofer AG. Additionally,
the transaction includes the acquisition of a 53% stake in hofer’s subisidiary
powertrain products GmbH. The price of the transaction is in the double digit EUR
million range. Closing will be in 2017.
Our analysis: hofer AG is an engineering services company, specialised in
powertrain development, mainly for small series production for sports and luxury
cars.
powertrain products GmbH is a production company, which produces the
developments of the mother company in small series production.
The strategic rationale behind the deal makes sense in our view, as it helps
ElringKlinger in getting better and earlier insides into the development of new
powertrain solutions. This is especially important as the company’s product
portfolio is heavily skewed towards products which are not necessary in electrical
cars anymore.
The deal is strategic and will not add much to the P&L in the short term. No
fundamentals were disclosed, but according to the Bundesanzeiger, hofer AG
recorded revenues of EUR 47.7m in FY 2014 and showed an operating result of
EUR 0.4m.
We estimate the price of the transaction to be around EUR 20m, which would
clearly be a strategic price.
Conclusion & Action: We believe that the transaction makes sense for
ElringKlinger. Nonetheless, it will not add much to the P&L in the short term and
also reminds us how important it is for the company to manage the transition
towards electrical drivetrains.
Analyst(s):
Tim Schuldt, CFA, equinet Bank
+49 69 5899 7433
Neutral
15.01
closing price as of 26/10/2016
17.00
Target Price unchanged
Recommendation unchanged
Target price: EUR
Share price: EUR
Reuters/Bloomberg ZILGn.DE/ZIL2 GR
Market capitalisation (EURm) 951
Current N° of shares (m) 63
Free float 48%
Daily avg. no. trad. sh. 12 mth 216
Daily avg. trad. vol. 12 mth (m) 2,404
Price high 12 mth (EUR) 24.09
Price low 12 mth (EUR) 14.92
Abs. perf. 1 mth -2.22%
Abs. perf. 3 mth -5.03%
Abs. perf. 12 mth -23.48%
Key financials (EUR) 12/15 12/16e 12/17e
Sales (m) 1,507 1,570 1,649
EBITDA (m) 222 239 265
EBITDA margin 14.7% 15.2% 16.1%
EBIT (m) 135 146 169
EBIT margin 9.0% 9.3% 10.2%
Net Profit (adj.)(m) 95 99 116
ROCE 5.4% 5.4% 6.0%
Net debt/(cash) (m) 487 511 494
Net Debt/Equity 0.6 0.6 0.5
Debt/EBITDA 2.2 2.1 1.9
Int. cover(EBITDA/Fin. int) 34.2 29.8 35.4
EV/Sales 1.4 1.0 1.0
EV/EBITDA 9.6 6.8 6.1
EV/EBITDA (adj.) 9.6 6.8 6.1
EV/EBIT 15.7 11.2 9.6
P/E (adj.) 15.6 9.6 8.2
P/BV 1.8 1.1 1.0
OpFCF yield -4.5% 1.1% 5.5%
Dividend yield 3.7% 3.3% 4.0%
EPS (adj.) 1.51 1.57 1.83
BVPS 12.97 14.02 15.34
DPS 0.55 0.50 0.60
14
15
16
17
18
19
20
21
22
23
24
25
Sep 15 Okt 15 Nov 15 Dez 15 Jan 16 Feb 16 Mrz 16 Apr 16 Mai 16 Jun 16 Jul 16 Aug 16 Sep 16 Okt 16
vvdsvdvsdy
ELRINGKLINGER Stoxx Automobiles & Parts (Rebased)Source: Factset
Shareholders: Lechler Family 52%;
Page 11 of 69
Produced & Distributed by the Members of ESN (see last page of this report)
Portuguese Banks
Analyser
BANKS
Acquisition of a minority stake in hofer AG Portuguese Banks: Exposure to Mozambique
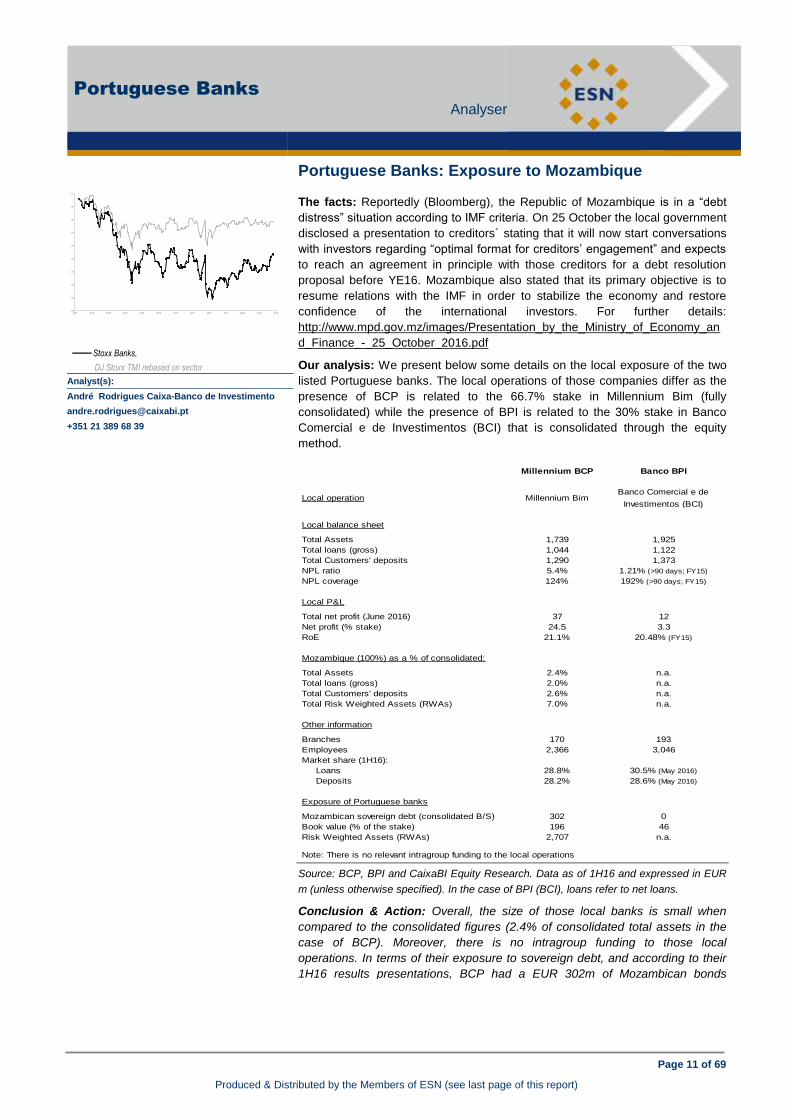
110
120
130
140
150
160
170
180
190
200
out 15 nov 15 dez 15 jan 16 fev 16 mar 16 abr 16 mai 16 jun 16 jul 16 ago 16 set 16 out 16
vvdsvdvsdy
The facts: Reportedly (Bloomberg), the Republic of Mozambique is in a “debt
distress” situation according to IMF criteria. On 25 October the local government
disclosed a presentation to creditors´ stating that it will now start conversations
with investors regarding “optimal format for creditors’ engagement” and expects
to reach an agreement in principle with those creditors for a debt resolution
proposal before YE16. Mozambique also stated that its primary objective is to
resume relations with the IMF in order to stabilize the economy and restore
confidence of the international investors. For further details:
http://www.mpd.gov.mz/images/Presentation_by_the_Ministry_of_Economy_an
d_Finance_-_25_October_2016.pdf
Our analysis: We present below some details on the local exposure of the two
listed Portuguese banks. The local operations of those companies differ as the
presence of BCP is related to the 66.7% stake in Millennium Bim (fully
consolidated) while the presence of BPI is related to the 30% stake in Banco
Comercial e de Investimentos (BCI) that is consolidated through the equity
method.
Source: BCP, BPI and CaixaBI Equity Research. Data as of 1H16 and expressed in EUR
m (unless otherwise specified). In the case of BPI (BCI), loans refer to net loans.
Conclusion & Action: Overall, the size of those local banks is small when
compared to the consolidated figures (2.4% of consolidated total assets in the
case of BCP). Moreover, there is no intragroup funding to those local
operations. In terms of their exposure to sovereign debt, and according to their
1H16 results presentations, BCP had a EUR 302m of Mozambican bonds
(available for sale portfolio) while BPI did not report any exposure.
---------- Stoxx Banks,
DJ Stoxx TMI rebased on sector
Analyst(s):
André Rodrigues Caixa-Banco de Investimento
+351 21 389 68 39
Millennium BCP Banco BPI
Local operation Millennium BimBanco Comercial e de
Investimentos (BCI)
Local balance sheet
Total Assets 1,739 1,925
Total loans (gross) 1,044 1,122
Total Customers' deposits 1,290 1,373
NPL ratio 5.4% 1.21% (>90 days; FY15)
NPL coverage 124% 192% (>90 days; FY15)
Local P&L
Total net profit (June 2016) 37 12
Net profit (% stake) 24.5 3.3
RoE 21.1% 20.48% (FY15)
Mozambique (100%) as a % of consolidated:
Total Assets 2.4% n.a.
Total loans (gross) 2.0% n.a.
Total Customers' deposits 2.6% n.a.
Total Risk Weighted Assets (RWAs) 7.0% n.a.
Other information
Branches 170 193
Employees 2,366 3,046
Market share (1H16):
Loans 28.8% 30.5% (May 2016)
Deposits 28.2% 28.6% (May 2016)
Exposure of Portuguese banks
Mozambican sovereign debt (consolidated B/S) 302 0
Book value (% of the stake) 196 46
Risk Weighted Assets (RWAs) 2,707 n.a.
Note: There is no relevant intragroup funding to the local operations
Page 12 of 69
Produced & Distributed by the Members of ESN (see last page of this report)
Banco Sabadell
Spain/Banks Analyser
BANKS
Banco Sabadell (Buy) Portuguese Banks: Exposure to Mozambique
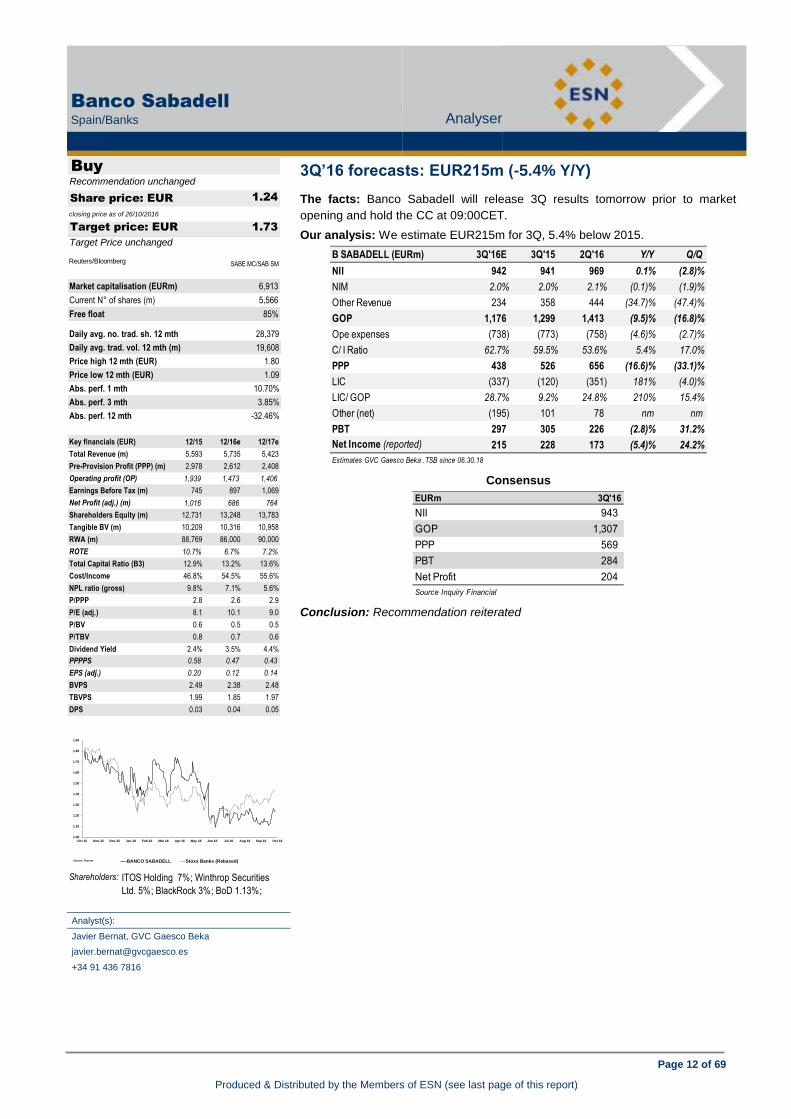
3Q’16 forecasts: EUR215m (-5.4% Y/Y)
The facts: Banco Sabadell will release 3Q results tomorrow prior to market
opening and hold the CC at 09:00CET.
Our analysis: We estimate EUR215m for 3Q, 5.4% below 2015.
Consensus
Conclusion: Recommendation reiterated
Analyst(s):
Javier Bernat, GVC Gaesco Beka
+34 91 436 7816
Buy
1.24
closing price as of 26/10/2016
1.73
Target Price unchanged
Recommendation unchanged
Target price: EUR
Share price: EUR
Reuters/Bloomberg SABE.MC/SAB SM
Market capitalisation (EURm) 6,913
Current N° of shares (m) 5,566
Free float 85%
Daily avg. no. trad. sh. 12 mth 28,379
Daily avg. trad. vol. 12 mth (m) 19,608
Price high 12 mth (EUR) 1.80
Price low 12 mth (EUR) 1.09
Abs. perf. 1 mth 10.70%
Abs. perf. 3 mth 3.85%
Abs. perf. 12 mth -32.46%
Key financials (EUR) 12/15 12/16e 12/17e
Total Revenue (m) 5,593 5,735 5,423
Pre-Provision Profit (PPP) (m) 2,978 2,612 2,408
Operating profit (OP) 1,939 1,473 1,406
Earnings Before Tax (m) 745 897 1,069
Net Profit (adj.) (m) 1,016 686 764
Shareholders Equity (m) 12,731 13,248 13,783
Tangible BV (m) 10,209 10,316 10,958
RWA (m) 88,769 86,000 90,000
ROTE 10.7% 6.7% 7.2%
Total Capital Ratio (B3) 12.9% 13.2% 13.6%
Cost/Income 46.8% 54.5% 55.6%
NPL ratio (gross) 9.8% 7.1% 5.6%
P/PPP 2.8 2.6 2.9
P/E (adj.) 8.1 10.1 9.0
P/BV 0.6 0.5 0.5
P/TBV 0.8 0.7 0.6
Dividend Yield 2.4% 3.5% 4.4%
PPPPS 0.58 0.47 0.43
EPS (adj.) 0.20 0.12 0.14
BVPS 2.49 2.38 2.48
TBVPS 1.99 1.85 1.97
DPS 0.03 0.04 0.05
B SABADELL (EURm) 3Q'16E 3Q'15 2Q'16 Y/Y Q/Q
NII 942 941 969 0.1% (2.8)%
NIM 2.0% 2.0% 2.1% (0.1)% (1.9)%
Other Revenue 234 358 444 (34.7)% (47.4)%
GOP 1,176 1,299 1,413 (9.5)% (16.8)%
Ope expenses (738) (773) (758) (4.6)% (2.7)%
C/ I Ratio 62.7% 59.5% 53.6% 5.4% 17.0%
PPP 438 526 656 (16.6)% (33.1)%
LIC (337) (120) (351) 181% (4.0)%
LIC/ GOP 28.7% 9.2% 24.8% 210% 15.4%
Other (net) (195) 101 78 nm nm
PBT 297 305 226 (2.8)% 31.2%
Net Income (reported) 215 228 173 (5.4)% 24.2%
Estimates GVC Gaesco Beka .TSB since 06.30.18
EURm 3Q'16
NII 943
GOP 1,307
PPP 569
PBT 284
Net Profit 204
Source Inquiry Financial
1.00
1.10
1.20
1.30
1.40
1.50
1.60
1.70
1.80
1.90
Oct 15 Nov 15 Dec 15 Jan 16 Feb 16 Mar 16 Apr 16 May 16 Jun 16 Jul 16 Aug 16 Sep 16 Oct 16
vvdsvdvsdy
BANCO SABADELL Stoxx Banks (Rebased)Source: Factset
Shareholders: ITOS Holding 7%; Winthrop Securities
Ltd. 5%; BlackRock 3%; BoD 1.13%;
Page 13 of 69
Produced & Distributed by the Members of ESN (see last page of this report)
BBVA
Spain/Banks Analyser
BANKS
BBVA (Buy) 3Q’16 forecasts: EUR215m (-5.4% Y/Y)
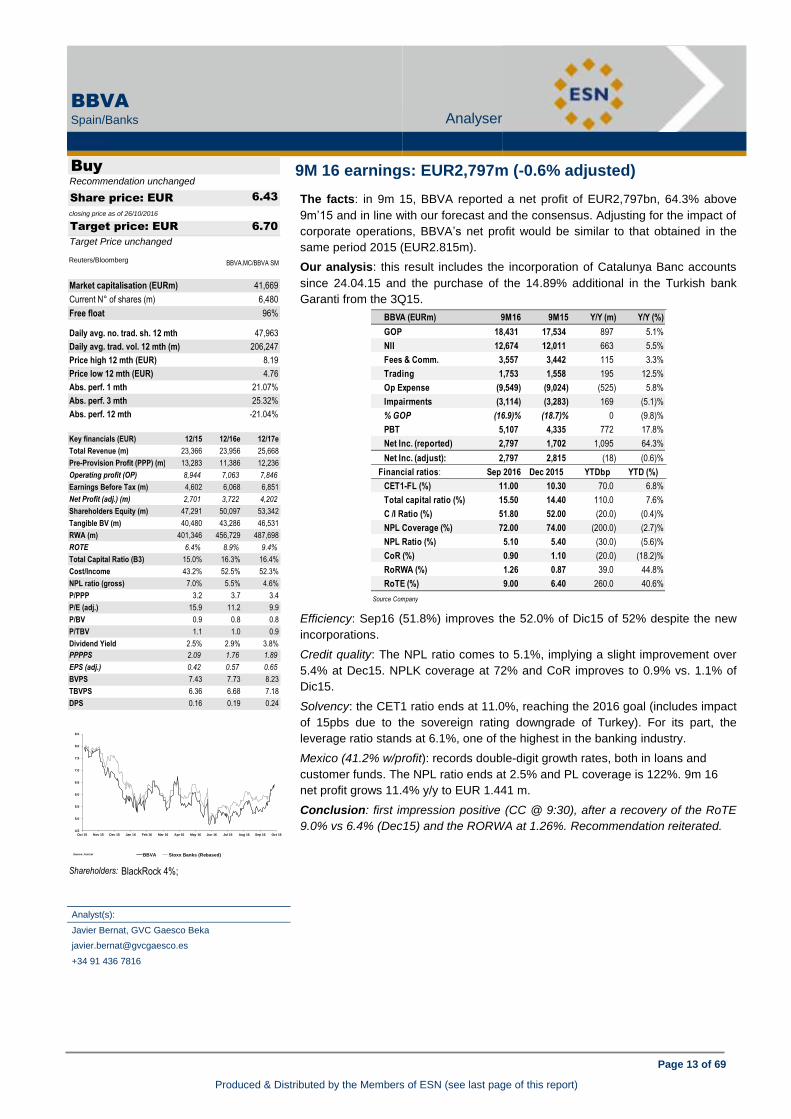
9M 16 earnings: EUR2,797m (-0.6% adjusted)
The facts: in 9m 15, BBVA reported a net profit of EUR2,797bn, 64.3% above
9m’15 and in line with our forecast and the consensus. Adjusting for the impact of
corporate operations, BBVA’s net profit would be similar to that obtained in the
same period 2015 (EUR2.815m).
Our analysis: this result includes the incorporation of Catalunya Banc accounts
since 24.04.15 and the purchase of the 14.89% additional in the Turkish bank
Garanti from the 3Q15.
Efficiency: Sep16 (51.8%) improves the 52.0% of Dic15 of 52% despite the new
incorporations.
Credit quality: The NPL ratio comes to 5.1%, implying a slight improvement over
5.4% at Dec15. NPLK coverage at 72% and CoR improves to 0.9% vs. 1.1% of
Dic15.
Solvency: the CET1 ratio ends at 11.0%, reaching the 2016 goal (includes impact
of 15pbs due to the sovereign rating downgrade of Turkey). For its part, the
leverage ratio stands at 6.1%, one of the highest in the banking industry.
Mexico (41.2% w/profit): records double-digit growth rates, both in loans and
customer funds. The NPL ratio ends at 2.5% and PL coverage is 122%. 9m 16
net profit grows 11.4% y/y to EUR 1.441 m.
Conclusion: first impression positive (CC @ 9:30), after a recovery of the RoTE
9.0% vs 6.4% (Dec15) and the RORWA at 1.26%. Recommendation reiterated.
Analyst(s):
Javier Bernat, GVC Gaesco Beka
+34 91 436 7816
Buy
6.43
closing price as of 26/10/2016
6.70
Target Price unchanged
Recommendation unchanged
Target price: EUR
Share price: EUR
Reuters/Bloomberg BBVA.MC/BBVA SM
Market capitalisation (EURm) 41,669
Current N° of shares (m) 6,480
Free float 96%
Daily avg. no. trad. sh. 12 mth 47,963
Daily avg. trad. vol. 12 mth (m) 206,247
Price high 12 mth (EUR) 8.19
Price low 12 mth (EUR) 4.76
Abs. perf. 1 mth 21.07%
Abs. perf. 3 mth 25.32%
Abs. perf. 12 mth -21.04%
Key financials (EUR) 12/15 12/16e 12/17e
Total Revenue (m) 23,366 23,956 25,668
Pre-Provision Profit (PPP) (m) 13,283 11,386 12,236
Operating profit (OP) 8,944 7,063 7,846
Earnings Before Tax (m) 4,602 6,068 6,851
Net Profit (adj.) (m) 2,701 3,722 4,202
Shareholders Equity (m) 47,291 50,097 53,342
Tangible BV (m) 40,480 43,286 46,531
RWA (m) 401,346 456,729 487,698
ROTE 6.4% 8.9% 9.4%
Total Capital Ratio (B3) 15.0% 16.3% 16.4%
Cost/Income 43.2% 52.5% 52.3%
NPL ratio (gross) 7.0% 5.5% 4.6%
P/PPP 3.2 3.7 3.4
P/E (adj.) 15.9 11.2 9.9
P/BV 0.9 0.8 0.8
P/TBV 1.1 1.0 0.9
Dividend Yield 2.5% 2.9% 3.8%
PPPPS 2.09 1.76 1.89
EPS (adj.) 0.42 0.57 0.65
BVPS 7.43 7.73 8.23
TBVPS 6.36 6.68 7.18
DPS 0.16 0.19 0.24
BBVA (EURm) 9M16 9M15 Y/Y (m) Y/Y (%)
GOP 18,431 17,534 897 5.1%
NII 12,674 12,011 663 5.5%
Fees & Comm. 3,557 3,442 115 3.3%
Trading 1,753 1,558 195 12.5%
Op Expense (9,549) (9,024) (525) 5.8%
Impairments (3,114) (3,283) 169 (5.1)%
% GOP (16.9)% (18.7)% 0 (9.8)%
PBT 5,107 4,335 772 17.8%
Net Inc. (reported) 2,797 1,702 1,095 64.3%
Net Inc. (adjust): 2,797 2,815 (18) (0.6)%
Financial ratios: Sep 2016 Dec 2015 YTDbp YTD (%)
CET1-FL (%) 11.00 10.30 70.0 6.8%
Total capital ratio (%) 15.50 14.40 110.0 7.6%
C /I Ratio (%) 51.80 52.00 (20.0) (0.4)%
NPL Coverage (%) 72.00 74.00 (200.0) (2.7)%
NPL Ratio (%) 5.10 5.40 (30.0) (5.6)%
CoR (%) 0.90 1.10 (20.0) (18.2)%
RoRWA (%) 1.26 0.87 39.0 44.8%
RoTE (%) 9.00 6.40 260.0 40.6%
Source Company
4.5
5.0
5.5
6.0
6.5
7.0
7.5
8.0
8.5
Oct 15 Nov 15 Dec 15 Jan 16 Feb 16 Mar 16 Apr 16 May 16 Jun 16 Jul 16 Aug 16 Sep 16 Oct 16
vvdsvdvsdy
BBVA Stoxx Banks (Rebased)Source: Factset
Shareholders: BlackRock 4%;
Page 14 of 69
Produced & Distributed by the Members of ESN (see last page of this report)
BPI
Portugal/Banks Analyser
BANKS
BPI (Neutral) 9M 16 earnings: EUR2,797m (-0.6% adjusted)
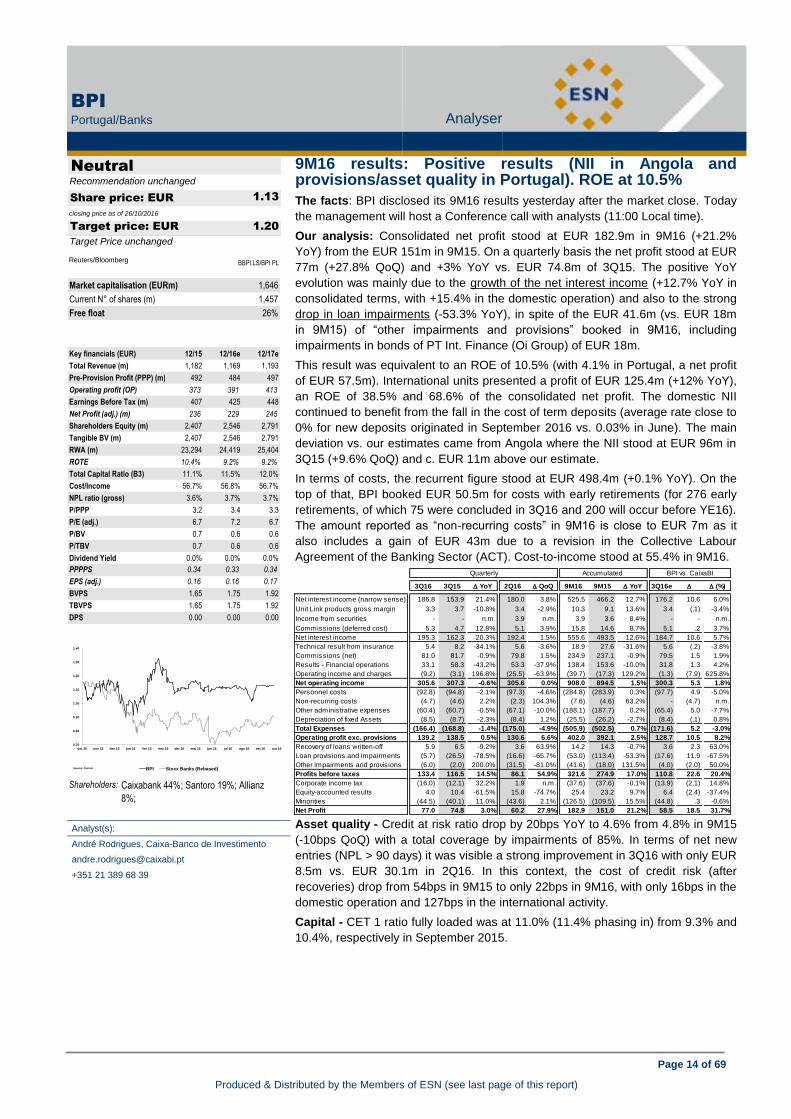
9M16 results: Positive results (NII in Angola and provisions/asset quality in Portugal). ROE at 10.5%
The facts: BPI disclosed its 9M16 results yesterday after the market close. Today
the management will host a Conference call with analysts (11:00 Local time).
Our analysis: Consolidated net profit stood at EUR 182.9m in 9M16 (+21.2%
YoY) from the EUR 151m in 9M15. On a quarterly basis the net profit stood at EUR
77m (+27.8% QoQ) and +3% YoY vs. EUR 74.8m of 3Q15. The positive YoY
evolution was mainly due to the growth of the net interest income (+12.7% YoY in
consolidated terms, with +15.4% in the domestic operation) and also to the strong
drop in loan impairments (-53.3% YoY), in spite of the EUR 41.6m (vs. EUR 18m
in 9M15) of “other impairments and provisions” booked in 9M16, including
impairments in bonds of PT Int. Finance (Oi Group) of EUR 18m.
This result was equivalent to an ROE of 10.5% (with 4.1% in Portugal, a net profit
of EUR 57.5m). International units presented a profit of EUR 125.4m (+12% YoY),
an ROE of 38.5% and 68.6% of the consolidated net profit. The domestic NII
continued to benefit from the fall in the cost of term deposits (average rate close to
0% for new deposits originated in September 2016 vs. 0.03% in June). The main
deviation vs. our estimates came from Angola where the NII stood at EUR 96m in
3Q15 (+9.6% QoQ) and c. EUR 11m above our estimate.
In terms of costs, the recurrent figure stood at EUR 498.4m (+0.1% YoY). On the
top of that, BPI booked EUR 50.5m for costs with early retirements (for 276 early
retirements, of which 75 were concluded in 3Q16 and 200 will occur before YE16).
The amount reported as “non-recurring costs” in 9M16 is close to EUR 7m as it
also includes a gain of EUR 43m due to a revision in the Collective Labour
Agreement of the Banking Sector (ACT). Cost-to-income stood at 55.4% in 9M16.
Asset quality - Credit at risk ratio drop by 20bps YoY to 4.6% from 4.8% in 9M15
(-10bps QoQ) with a total coverage by impairments of 85%. In terms of net new
entries (NPL > 90 days) it was visible a strong improvement in 3Q16 with only EUR
8.5m vs. EUR 30.1m in 2Q16. In this context, the cost of credit risk (after
recoveries) drop from 54bps in 9M15 to only 22bps in 9M16, with only 16bps in the
domestic operation and 127bps in the international activity.
Capital - CET 1 ratio fully loaded was at 11.0% (11.4% phasing in) from 9.3% and
10.4%, respectively in September 2015.
Overall, 3Q16 should note be a trigger for BPI. In any case, we have a positive first
impression on these results. NII continued to evolve positively (and above our
estimate), recurrent costs stood stable YoY and loan impairments (namely in
Portugal) were a positive surprise in a context of a FL CET1 ratio of 11.0%. More
details after today’s Conference call.
Analyst(s):
André Rodrigues, Caixa-Banco de Investimento
+351 21 389 68 39
Neutral
1.13
closing price as of 26/10/2016
1.20
Target Price unchanged
Recommendation unchanged
Target price: EUR
Share price: EUR
Reuters/Bloomberg BBPI.LS/BPI PL
Market capitalisation (EURm) 1,646
Current N° of shares (m) 1,457
Free float 26%
Key financials (EUR) 12/15 12/16e 12/17e
Total Revenue (m) 1,182 1,169 1,193
Pre-Provision Profit (PPP) (m) 492 484 497
Operating profit (OP) 373 391 413
Earnings Before Tax (m) 407 425 448
Net Profit (adj.) (m) 236 229 245
Shareholders Equity (m) 2,407 2,546 2,791
Tangible BV (m) 2,407 2,546 2,791
RWA (m) 23,294 24,419 25,404
ROTE 10.4% 9.2% 9.2%
Total Capital Ratio (B3) 11.1% 11.5% 12.0%
Cost/Income 56.7% 56.8% 56.7%
NPL ratio (gross) 3.6% 3.7% 3.7%
P/PPP 3.2 3.4 3.3
P/E (adj.) 6.7 7.2 6.7
P/BV 0.7 0.6 0.6
P/TBV 0.7 0.6 0.6
Dividend Yield 0.0% 0.0% 0.0%
PPPPS 0.34 0.33 0.34
EPS (adj.) 0.16 0.16 0.17
BVPS 1.65 1.75 1.92
TBVPS 1.65 1.75 1.92
DPS 0.00 0.00 0.00
0.70
0.80
0.90
1.00
1.10
1.20
1.30
1.40
out 15 nov 15 dez 15 jan 16 fev 16 mar 16 abr 16 mai 16 jun 16 jul 16 ago 16 set 16 out 16
vvdsvdvsdy
BPI Stoxx Banks (Rebased)Source: Factset
Shareholders: Caixabank 44%; Santoro 19%; Allianz
8%;
3Q16 3Q15 D YoY 2Q16 D QoQ 9M16 9M15 D YoY 3Q16e D D (%)
Net interest income (narrow sense) 186.8 153.9 21.4% 180.0 3.8% 525.5 466.2 12.7% 176.2 10.6 6.0%
Unit Link products gross margin 3.3 3.7 -10.8% 3.4 -2.9% 10.3 9.1 13.6% 3.4 (.1) -3.4%
Income from securities - - n.m. 3.9 n.m. 3.9 3.6 8.4% - - n.m.
Commissions (deferred cost) 5.3 4.7 12.8% 5.1 3.9% 15.8 14.6 8.7% 5.1 .2 3.7%
Net interest income 195.3 162.3 20.3% 192.4 1.5% 555.6 493.5 12.6% 184.7 10.6 5.7%
Technical result from insurance 5.4 8.2 -34.1% 5.6 -3.6% 18.9 27.6 -31.6% 5.6 (.2) -3.8%
Commissions (net) 81.0 81.7 -0.9% 79.8 1.5% 234.9 237.1 -0.9% 79.5 1.5 1.9%
Results - Financial operations 33.1 58.3 -43.2% 53.3 -37.9% 138.4 153.6 -10.0% 31.8 1.3 4.2%
Operating income and charges (9.2) (3.1) 196.8% (25.5) -63.9% (39.7) (17.3) 129.2% (1.3) (7.9) 625.8%
Net operating income 305.6 307.3 -0.6% 305.6 0.0% 908.0 894.5 1.5% 300.3 5.3 1.8%
Personnel costs (92.8) (94.8) -2.1% (97.3) -4.6% (284.8) (283.9) 0.3% (97.7) 4.9 -5.0%
Non-recurring costs (4.7) (4.6) 2.2% (2.3) 104.3% (7.6) (4.6) 63.2% - (4.7) n.m.
Other administrative expenses (60.4) (60.7) -0.5% (67.1) -10.0% (188.1) (187.7) 0.2% (65.4) 5.0 -7.7%
Depreciation of fixed Assets (8.5) (8.7) -2.3% (8.4) 1.2% (25.5) (26.2) -2.7% (8.4) (.1) 0.8%
Total Expenses (166.4) (168.8) -1.4% (175.0) -4.9% (505.9) (502.5) 0.7% (171.6) 5.2 -3.0%
Operating profit exc. provisions 139.2 138.5 0.5% 130.6 6.6% 402.0 392.1 2.5% 128.7 10.5 8.2%
Recovery of loans written-off 5.9 6.5 -9.2% 3.6 63.9% 14.2 14.3 -0.7% 3.6 2.3 63.0%
Loan provisions and impairments (5.7) (26.5) -78.5% (16.6) -65.7% (53.0) (113.4) -53.3% (17.6) 11.9 -67.5%
Other impairments and provisions (6.0) (2.0) 200.0% (31.5) -81.0% (41.6) (18.0) 131.5% (4.0) (2.0) 50.0%
Profits before taxes 133.4 116.5 14.5% 86.1 54.9% 321.6 274.9 17.0% 110.8 22.6 20.4%
Corporate income tax (16.0) (12.1) 32.2% 1.9 n.m. (37.6) (37.6) -0.1% (13.9) (2.1) 14.8%
Equity-accounted results 4.0 10.4 -61.5% 15.8 -74.7% 25.4 23.2 9.7% 6.4 (2.4) -37.4%
Minorities (44.5) (40.1) 11.0% (43.6) 2.1% (126.5) (109.5) 15.5% (44.8) .3 -0.6%
Net Profit 77.0 74.8 3.0% 60.2 27.9% 182.9 151.0 21.2% 58.5 18.5 31.7%
Accumulated BPI vs. CaixaBIQuarterly
Page 15 of 69
Produced & Distributed by the Members of ESN (see last page of this report)
BPI
Portugal/Banks Analyser
BANKS
BPI (Neutral) 9M16 results: Positive results (NII in Angola and provisions/asset quality in Portugal). ROE at 10.5%
Neutral
1,13
closing price as of 26/10/2016
1,20
Target Price unchanged
Recommendation unchanged
Target price: EUR
Share price: EUR
Reuters/Bloomberg BBPI.LS/BPI PL
Market capitalisation (EURm) 1.646
Current N° of shares (m) 1.457
Free float 26%
Daily avg. no. trad. sh. 12 mth 2.301
Daily avg. trad. vol. 12 mth (m) 772
Price high 12 mth (EUR) 1,33
Price low 12 mth (EUR) 0,91
Abs. perf. 1 mth 0,00%
Abs. perf. 3 mth 1,71%
Abs. perf. 12 mth 3,29%
Key financials (EUR) 12/15 12/16e 12/17e
Total Revenue (m) 1.182 1.169 1.193
Pre-Provision Profit (PPP) (m) 492 484 497
Operating profit (OP) 373 391 413
Earnings Before Tax (m) 407 425 448
Net Profit (adj.) (m) 236 229 245
Shareholders Equity (m) 2.407 2.546 2.791
Tangible BV (m) 2.407 2.546 2.791
RWA (m) 23.294 24.419 25.404
ROTE 10,4% 9,2% 9,2%
Total Capital Ratio (B3) 11,1% 11,5% 12,0%
Cost/Income 56,7% 56,8% 56,7%
NPL ratio (gross) 3,6% 3,7% 3,7%
P/PPP 3,2 3,4 3,3
P/E (adj.) 6,7 7,2 6,7
P/BV 0,7 0,6 0,6
P/TBV 0,7 0,6 0,6
Dividend Yield 0,0% 0,0% 0,0%
PPPPS 0,34 0,33 0,34
EPS (adj.) 0,16 0,16 0,17
BVPS 1,65 1,75 1,92
TBVPS 1,65 1,75 1,92
DPS 0,00 0,00 0,00
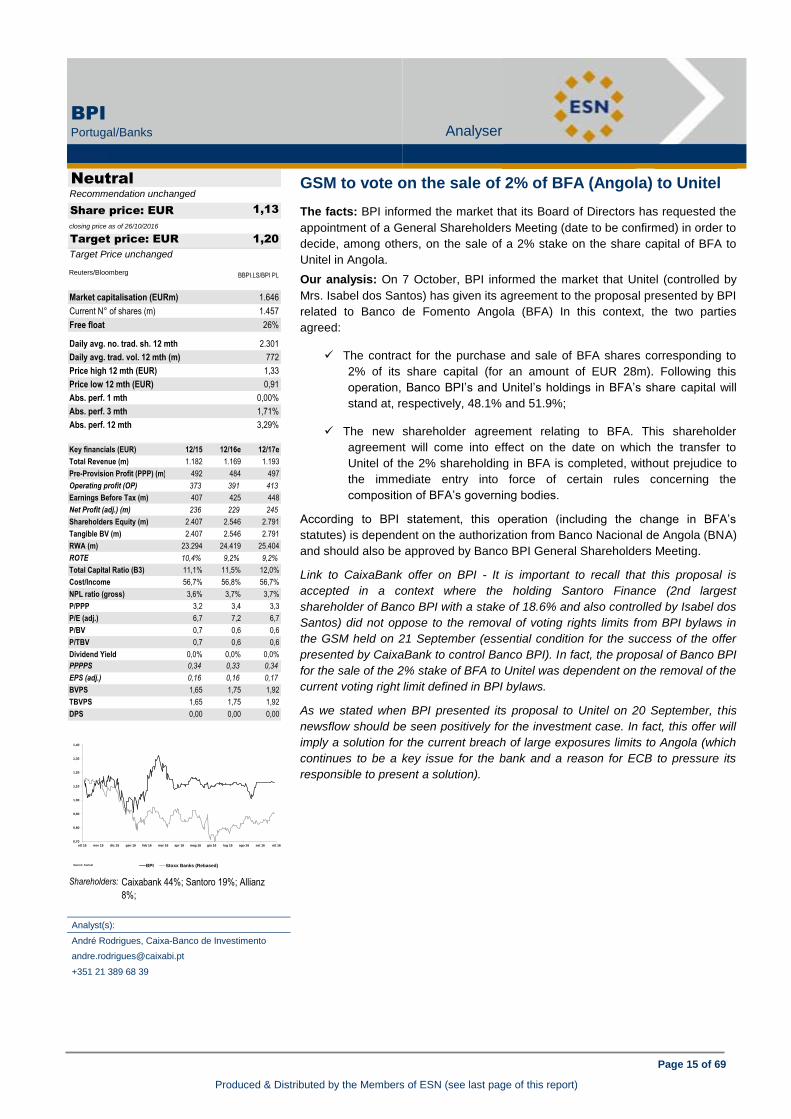
GSM to vote on the sale of 2% of BFA (Angola) to Unitel
The facts: BPI informed the market that its Board of Directors has requested the
appointment of a General Shareholders Meeting (date to be confirmed) in order to
decide, among others, on the sale of a 2% stake on the share capital of BFA to
Unitel in Angola.
Our analysis: On 7 October, BPI informed the market that Unitel (controlled by
Mrs. Isabel dos Santos) has given its agreement to the proposal presented by BPI
related to Banco de Fomento Angola (BFA) In this context, the two parties
agreed:
The contract for the purchase and sale of BFA shares corresponding to
2% of its share capital (for an amount of EUR 28m). Following this
operation, Banco BPI’s and Unitel’s holdings in BFA’s share capital will
stand at, respectively, 48.1% and 51.9%;
The new shareholder agreement relating to BFA. This shareholder
agreement will come into effect on the date on which the transfer to
Unitel of the 2% shareholding in BFA is completed, without prejudice to
the immediate entry into force of certain rules concerning the
composition of BFA’s governing bodies.
According to BPI statement, this operation (including the change in BFA’s
statutes) is dependent on the authorization from Banco Nacional de Angola (BNA)
and should also be approved by Banco BPI General Shareholders Meeting.
Link to CaixaBank offer on BPI - It is important to recall that this proposal is
accepted in a context where the holding Santoro Finance (2nd largest
shareholder of Banco BPI with a stake of 18.6% and also controlled by Isabel dos
Santos) did not oppose to the removal of voting rights limits from BPI bylaws in
the GSM held on 21 September (essential condition for the success of the offer
presented by CaixaBank to control Banco BPI). In fact, the proposal of Banco BPI
for the sale of the 2% stake of BFA to Unitel was dependent on the removal of the
current voting right limit defined in BPI bylaws.
As we stated when BPI presented its proposal to Unitel on 20 September, this
newsflow should be seen positively for the investment case. In fact, this offer will
imply a solution for the current breach of large exposures limits to Angola (which
continues to be a key issue for the bank and a reason for ECB to pressure its
responsible to present a solution).
0,70
0,80
0,90
1,00
1,10
1,20
1,30
1,40
ott 15 nov 15 dic 15 gen 16 feb 16 mar 16 apr 16 mag 16 giu 16 lug 16 ago 16 set 16 ott 16
vvdsvdvsdy
BPI Stoxx Banks (Rebased)Source: Factset Shareholders: Caixabank 44%; Santoro 19%; Allianz
8%;
Analyst(s):
André Rodrigues, Caixa-Banco de Investimento
+351 21 389 68 39
Page 16 of 69
Produced & Distributed by the Members of ESN (see last page of this report)
CaixaBank
Spain/Banks Analyser
BANKS
CaixaBank (Neutral) GSM to vote on the sale of 2% of BFA (Angola) to Unitel
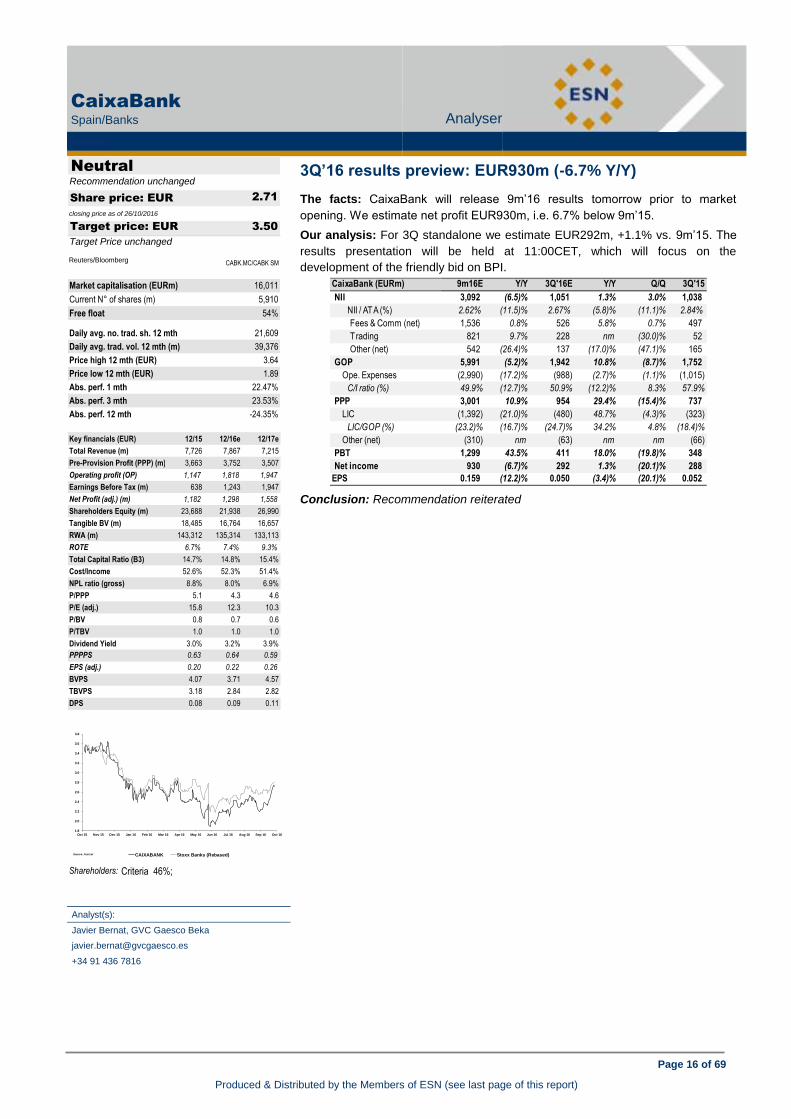
3Q’16 results preview: EUR930m (-6.7% Y/Y)
The facts: CaixaBank will release 9m’16 results tomorrow prior to market
opening. We estimate net profit EUR930m, i.e. 6.7% below 9m’15.
Our analysis: For 3Q standalone we estimate EUR292m, +1.1% vs. 9m’15. The
results presentation will be held at 11:00CET, which will focus on the
development of the friendly bid on BPI.
Conclusion: Recommendation reiterated
Analyst(s):
Javier Bernat, GVC Gaesco Beka
+34 91 436 7816
Neutral
2.71
closing price as of 26/10/2016
3.50
Target Price unchanged
Recommendation unchanged
Target price: EUR
Share price: EUR
Reuters/Bloomberg CABK.MC/CABK SM
Market capitalisation (EURm) 16,011
Current N° of shares (m) 5,910
Free float 54%
Daily avg. no. trad. sh. 12 mth 21,609
Daily avg. trad. vol. 12 mth (m) 39,376
Price high 12 mth (EUR) 3.64
Price low 12 mth (EUR) 1.89
Abs. perf. 1 mth 22.47%
Abs. perf. 3 mth 23.53%
Abs. perf. 12 mth -24.35%
Key financials (EUR) 12/15 12/16e 12/17e
Total Revenue (m) 7,726 7,867 7,215
Pre-Provision Profit (PPP) (m) 3,663 3,752 3,507
Operating profit (OP) 1,147 1,818 1,947
Earnings Before Tax (m) 638 1,243 1,947
Net Profit (adj.) (m) 1,182 1,298 1,558
Shareholders Equity (m) 23,688 21,938 26,990
Tangible BV (m) 18,485 16,764 16,657
RWA (m) 143,312 135,314 133,113
ROTE 6.7% 7.4% 9.3%
Total Capital Ratio (B3) 14.7% 14.8% 15.4%
Cost/Income 52.6% 52.3% 51.4%
NPL ratio (gross) 8.8% 8.0% 6.9%
P/PPP 5.1 4.3 4.6
P/E (adj.) 15.8 12.3 10.3
P/BV 0.8 0.7 0.6
P/TBV 1.0 1.0 1.0
Dividend Yield 3.0% 3.2% 3.9%
PPPPS 0.63 0.64 0.59
EPS (adj.) 0.20 0.22 0.26
BVPS 4.07 3.71 4.57
TBVPS 3.18 2.84 2.82
DPS 0.08 0.09 0.11
CaixaBank (EURm) 9m16E Y/Y 3Q'16E Y/Y Q/Q 3Q'15
NII 3,092 (6.5)% 1,051 1.3% 3.0% 1,038
NII / ATA (%) 2.62% (11.5)% 2.67% (5.8)% (11.1)% 2.84%
Fees & Comm (net) 1,536 0.8% 526 5.8% 0.7% 497
T rading 821 9.7% 228 nm (30.0)% 52
Other (net) 542 (26.4)% 137 (17.0)% (47.1)% 165
GOP 5,991 (5.2)% 1,942 10.8% (8.7)% 1,752
Ope. Expenses (2,990) (17.2)% (988) (2.7)% (1.1)% (1,015)
C/I ratio (%) 49.9% (12.7)% 50.9% (12.2)% 8.3% 57.9%
PPP 3,001 10.9% 954 29.4% (15.4)% 737
LIC (1,392) (21.0)% (480) 48.7% (4.3)% (323)
LIC/GOP (%) (23.2)% (16.7)% (24.7)% 34.2% 4.8% (18.4)%
Other (net) (310) nm (63) nm nm (66)
PBT 1,299 43.5% 411 18.0% (19.8)% 348
Net income 930 (6.7)% 292 1.3% (20.1)% 288
EPS 0.159 (12.2)% 0.050 (3.4)% (20.1)% 0.052
1.8
2.0
2.2
2.4
2.6
2.8
3.0
3.2
3.4
3.6
3.8
Oct 15 Nov 15 Dec 15 Jan 16 Feb 16 Mar 16 Apr 16 May 16 Jun 16 Jul 16 Aug 16 Sep 16 Oct 16
vvdsvdvsdy
CAIXABANK Stoxx Banks (Rebased)Source: Factset
Shareholders: Criteria 46%;
Page 17 of 69
Produced & Distributed by the Members of ESN (see last page of this report)
Deutsche Bank
Germany/Banks Analyser
BANKS
Deutsche Bank (Neutral) 3Q’16 results preview: EUR930m (-6.7% Y/Y)
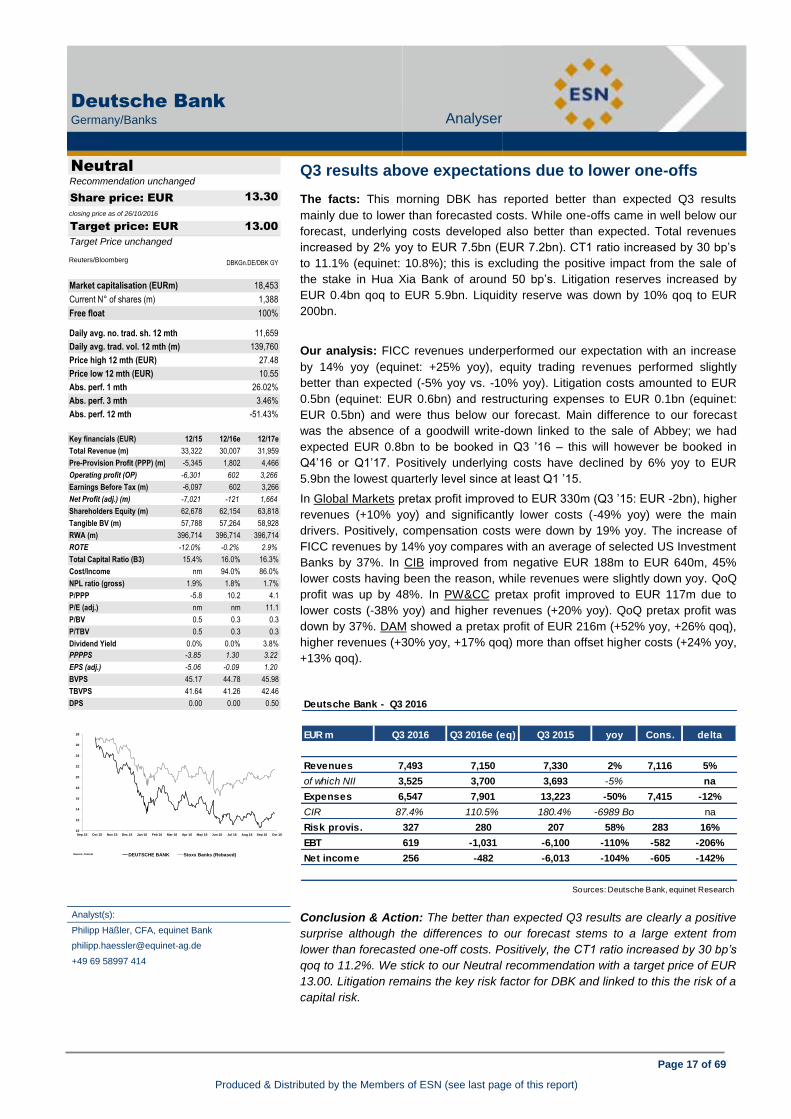
Q3 results above expectations due to lower one-offs
The facts: This morning DBK has reported better than expected Q3 results
mainly due to lower than forecasted costs. While one-offs came in well below our
forecast, underlying costs developed also better than expected. Total revenues
increased by 2% yoy to EUR 7.5bn (EUR 7.2bn). CT1 ratio increased by 30 bp’s
to 11.1% (equinet: 10.8%); this is excluding the positive impact from the sale of
the stake in Hua Xia Bank of around 50 bp’s. Litigation reserves increased by
EUR 0.4bn qoq to EUR 5.9bn. Liquidity reserve was down by 10% qoq to EUR
200bn.
Our analysis: FICC revenues underperformed our expectation with an increase
by 14% yoy (equinet: +25% yoy), equity trading revenues performed slightly
better than expected (-5% yoy vs. -10% yoy). Litigation costs amounted to EUR
0.5bn (equinet: EUR 0.6bn) and restructuring expenses to EUR 0.1bn (equinet:
EUR 0.5bn) and were thus below our forecast. Main difference to our forecast
was the absence of a goodwill write-down linked to the sale of Abbey; we had
expected EUR 0.8bn to be booked in Q3 ’16 – this will however be booked in
Q4’16 or Q1’17. Positively underlying costs have declined by 6% yoy to EUR
5.9bn the lowest quarterly level since at least Q1 ’15.
In Global Markets pretax profit improved to EUR 330m (Q3 ’15: EUR -2bn), higher
revenues (+10% yoy) and significantly lower costs (-49% yoy) were the main
drivers. Positively, compensation costs were down by 19% yoy. The increase of
FICC revenues by 14% yoy compares with an average of selected US Investment
Banks by 37%. In CIB improved from negative EUR 188m to EUR 640m, 45%
lower costs having been the reason, while revenues were slightly down yoy. QoQ
profit was up by 48%. In PW&CC pretax profit improved to EUR 117m due to
lower costs (-38% yoy) and higher revenues (+20% yoy). QoQ pretax profit was
down by 37%. DAM showed a pretax profit of EUR 216m (+52% yoy, +26% qoq),
higher revenues (+30% yoy, +17% qoq) more than offset higher costs (+24% yoy,
+13% qoq).
Conclusion & Action: The better than expected Q3 results are clearly a positive
surprise although the differences to our forecast stems to a large extent from
lower than forecasted one-off costs. Positively, the CT1 ratio increased by 30 bp’s
qoq to 11.2%. We stick to our Neutral recommendation with a target price of EUR
13.00. Litigation remains the key risk factor for DBK and linked to this the risk of a
capital risk.
Analyst(s):
Philipp Häßler, CFA, equinet Bank
+49 69 58997 414
Neutral
13.30
closing price as of 26/10/2016
13.00
Target Price unchanged
Recommendation unchanged
Target price: EUR
Share price: EUR
Reuters/Bloomberg DBKGn.DE/DBK GY
Market capitalisation (EURm) 18,453
Current N° of shares (m) 1,388
Free float 100%
Daily avg. no. trad. sh. 12 mth 11,659
Daily avg. trad. vol. 12 mth (m) 139,760
Price high 12 mth (EUR) 27.48
Price low 12 mth (EUR) 10.55
Abs. perf. 1 mth 26.02%
Abs. perf. 3 mth 3.46%
Abs. perf. 12 mth -51.43%
Key financials (EUR) 12/15 12/16e 12/17e
Total Revenue (m) 33,322 30,007 31,959
Pre-Provision Profit (PPP) (m) -5,345 1,802 4,466
Operating profit (OP) -6,301 602 3,266
Earnings Before Tax (m) -6,097 602 3,266
Net Profit (adj.) (m) -7,021 -121 1,664
Shareholders Equity (m) 62,678 62,154 63,818
Tangible BV (m) 57,788 57,264 58,928
RWA (m) 396,714 396,714 396,714
ROTE -12.0% -0.2% 2.9%
Total Capital Ratio (B3) 15.4% 16.0% 16.3%
Cost/Income nm 94.0% 86.0%
NPL ratio (gross) 1.9% 1.8% 1.7%
P/PPP -5.8 10.2 4.1
P/E (adj.) nm nm 11.1
P/BV 0.5 0.3 0.3
P/TBV 0.5 0.3 0.3
Dividend Yield 0.0% 0.0% 3.8%
PPPPS -3.85 1.30 3.22
EPS (adj.) -5.06 -0.09 1.20
BVPS 45.17 44.78 45.98
TBVPS 41.64 41.26 42.46
DPS 0.00 0.00 0.50
10
12
14
16
18
20
22
24
26
28
Sep 15 Oct 15 Nov 15 Dec 15 Jan 16 Feb 16 Mar 16 Apr 16 May 16 Jun 16 Jul 16 Aug 16 Sep 16 Oct 16
vvdsvdvsdy
DEUTSCHE BANK Stoxx Banks (Rebased)Source: Factset
Shareholders:
Deutsche Bank - Q3 2016
EUR m Q3 2016 Q3 2016e (eq) Q3 2015 yoy Cons. delta
Revenues 7,493 7,150 7,330 2% 7,116 5%
of which NII 3,525 3,700 3,693 -5% na
Expenses 6,547 7,901 13,223 -50% 7,415 -12%
CIR 87.4% 110.5% 180.4% -6989 Bo na
Risk provis. 327 280 207 58% 283 16%
EBT 619 -1,031 -6,100 -110% -582 -206%
Net income 256 -482 -6,013 -104% -605 -142%
Sources: Deutsche Bank, equinet Research

Page 18 of 69
Produced & Distributed by the Members of ESN (see last page of this report)
Mediobanca
Italy/Banks Analyser
BANKS
Mediobanca (Accumulate) Q3 results above expectations due to lower one-offs
Q1 results preview
The facts: Mediobanca is due to publish and present (conference call at 8.45am)
Q1 results of the 2016/17 financial year and hold the AGM on 28Th
Oct.
Our analysis: We summarize our preview in the following table:
(EUR m) Q1 16/17E Q1 15/16A Y/Y Q4 15/16A Q/Q
Revenues 521 507 2.8% 528 -1.3%
Operating costs -213 -197 8.1% -249 -14.5%
GOP 308 310 -0.6% 279 10.4%
Loan provisions -105 -115 -8.7% -100 5.0%
Net Profit 156 244 nm 162 -3.7%
Mediobanca finalised the acquisition of Barclays Italian retail operations over the
summer and consolidates them for just one month in Q1, with a limited impact of
approx. EUR 8m both on revenues (ca. EUR 5m NII and EUR 3m net
commissions) and operating costs.
Although figures are not fully comparable with previous quarters, we forecast total
revenues increasing 2.8% Y/Y to EUR 521m, driven by a 9% rise in net
commissions to EUR 105m thanks to a recovery in CIB and higher contribution
from Che Banca! The trading income is estimated at EUR 32m vs. 26m one year
ago, while the NII is seen up 1.6% Y/Y to EUR 307.5m. On the other hand, the
associates’ contribution (mainly Generali) is anticipated down 7% Y/Y to EUR
77m.
Operating costs are expected to increase 8% Y/Y to EUR 213m, fuelled by
continuous hiring and the Barclays retail consolidation, leading to a gross
operating profit (GOP) almost flat Y/Y at EUR 308m, with a C/I ratio of roughly
41%.
Loan impairments are seen down almost 9% Y/Y to EUR 105m thanks to a
benign credit cycle in consumer credit.
The expected net profit of EUR 156m is not comparable with EUR 244m booked
one year ago, which included EUR 88.5m capital gains from the disposal of the
stake held in Pirelli.
The CET1 ratio was 12.1% phased-in and 12.6% fully-loaded last June and the
Barclays retail acquisition is expected to absorb ca. 20bps.
Conclusion & Action. We expect Mediobanca’s top mgmt. to reiterate a
confident and positive message on the bank’s prospects ahead of the business
plan presentation expected next month. We stick to Accumulate with EUR 7.5
target price.
Analyst(s):
Luigi Tramontana, Banca Akros
+39 02 4344 4239
Accumulate
6.88
closing price as of 26/10/2016
7.50
Target Price unchanged
Recommendation unchanged
Target price: EUR
Share price: EUR
Reuters/Bloomberg MDBI.MI/MB IM
Market capitalisation (EURm) 5,992
Current N° of shares (m) 871
Free float 69%
Daily avg. no. trad. sh. 12 mth 4,456
Daily avg. trad. vol. 12 mth (m) 23,269
Price high 12 mth (EUR) 9.35
Price low 12 mth (EUR) 4.63
Abs. perf. 1 mth 15.92%
Abs. perf. 3 mth 17.61%
Abs. perf. 12 mth -24.64%
Key financials (EUR) 06/16 06/17e 06/18e
Total Revenue (m) 2,047 2,163 2,270
Pre-Provision Profit (PPP) (m) 1,155 1,242 1,318
Operating profit (OP) 736 824 901
Earnings Before Tax (m) 736 794 871
Net Profit (adj.) (m) 588 637 684
Shareholders Equity (m) 8,922 9,283 9,026
Tangible BV (m) 8,518 8,879 8,622
RWA (m) 53,862 55,862 57,362
ROTE 6.6% 7.0% 7.5%
Total Capital Ratio (B3) 15.3% 15.4% 15.6%
Cost/Income 43.6% 42.6% 41.9%
NPL ratio (gross) 0.0% 0.0% 0.0%
P/PPP 3.9 4.8 4.5
P/E (adj.) 7.6 9.4 8.8
P/BV 0.5 0.6 0.7
P/TBV 0.5 0.7 0.7
Dividend Yield 3.9% 4.4% 5.1%
PPPPS 1.33 1.43 1.51
EPS (adj.) 0.68 0.73 0.79
BVPS 10.24 10.66 10.36
TBVPS 9.78 10.19 9.90
DPS 0.27 0.30 0.35
4.5
5.0
5.5
6.0
6.5
7.0
7.5
8.0
8.5
9.0
9.5
Sep 15 Oct 15 Nov 15 Dec 15 Jan 16 Feb 16 Mar 16 Apr 16 May 16 Jun 16 Jul 16 Aug 16 Sep 16 Oct 16
vvdsvdvsdy
MEDIOBANCA Stoxx Banks (Rebased)Source: Factset
Shareholders: Shareholder Pact 31%;
Page 19 of 69
Produced & Distributed by the Members of ESN (see last page of this report)
Nordea
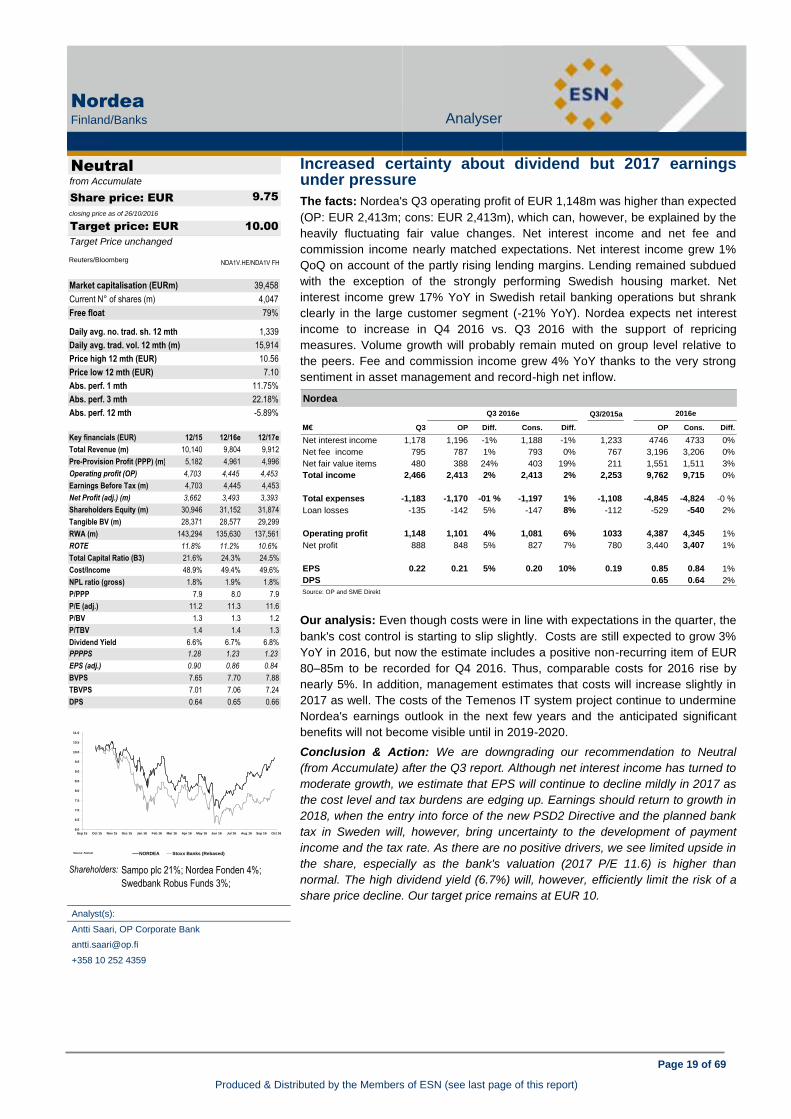
Q3/2015a
M€ Q3 OP Diff. Cons. Diff. OP Cons. Diff.
Net interest income 1,178 1,196 -1% 1,188 -1% 1,233 4746 4733 0%
Net fee income 795 787 1% 793 0% 767 3,196 3,206 0%
Net fair value items 480 388 24% 403 19% 211 1,551 1,511 3%
Total income 2,466 2,413 2% 2,413 2% 2,253 9,762 9,715 0%
Total expenses -1,183 -1,170 -01 % -1,197 1% -1,108 -4,845 -4,824 -0 %
Loan losses -135 -142 5% -147 8% -112 -529 -540 2%
Operating profit 1,148 1,101 4% 1,081 6% 1033 4,387 4,345 1%
Net profit 888 848 5% 827 7% 780 3,440 3,407 1%
EPS 0.22 0.21 5% 0.20 10% 0.19 0.85 0.84 1%
DPS 0.00 0% 0.00 0.00 0.65 0.64 2%
Source: OP and SME Direkt
Q3 2016e 2016e
Nordea
Finland/Banks Analyser
BANKS
Nordea (Neutral) Q1 results preview
Increased certainty about dividend but 2017 earnings under pressure
The facts: Nordea's Q3 operating profit of EUR 1,148m was higher than expected
(OP: EUR 2,413m; cons: EUR 2,413m), which can, however, be explained by the
heavily fluctuating fair value changes. Net interest income and net fee and
commission income nearly matched expectations. Net interest income grew 1%
QoQ on account of the partly rising lending margins. Lending remained subdued
with the exception of the strongly performing Swedish housing market. Net
interest income grew 17% YoY in Swedish retail banking operations but shrank
clearly in the large customer segment (-21% YoY). Nordea expects net interest
income to increase in Q4 2016 vs. Q3 2016 with the support of repricing
measures. Volume growth will probably remain muted on group level relative to
the peers. Fee and commission income grew 4% YoY thanks to the very strong
sentiment in asset management and record-high net inflow.
Our analysis: Even though costs were in line with expectations in the quarter, the
bank's cost control is starting to slip slightly. Costs are still expected to grow 3%
YoY in 2016, but now the estimate includes a positive non-recurring item of EUR
80–85m to be recorded for Q4 2016. Thus, comparable costs for 2016 rise by
nearly 5%. In addition, management estimates that costs will increase slightly in
2017 as well. The costs of the Temenos IT system project continue to undermine
Nordea's earnings outlook in the next few years and the anticipated significant
benefits will not become visible until in 2019-2020.
Conclusion & Action: We are downgrading our recommendation to Neutral
(from Accumulate) after the Q3 report. Although net interest income has turned to
moderate growth, we estimate that EPS will continue to decline mildly in 2017 as
the cost level and tax burdens are edging up. Earnings should return to growth in
2018, when the entry into force of the new PSD2 Directive and the planned bank
tax in Sweden will, however, bring uncertainty to the development of payment
income and the tax rate. As there are no positive drivers, we see limited upside in
the share, especially as the bank's valuation (2017 P/E 11.6) is higher than
normal. The high dividend yield (6.7%) will, however, efficiently limit the risk of a
share price decline. Our target price remains at EUR 10.
Analyst(s):
Antti Saari, OP Corporate Bank
+358 10 252 4359
Neutral
9.75
closing price as of 26/10/2016
10.00
Target Price unchanged
from Accumulate
Target price: EUR
Share price: EUR
Reuters/Bloomberg NDA1V.HE/NDA1V FH
Market capitalisation (EURm) 39,458
Current N° of shares (m) 4,047
Free float 79%
Daily avg. no. trad. sh. 12 mth 1,339
Daily avg. trad. vol. 12 mth (m) 15,914
Price high 12 mth (EUR) 10.56
Price low 12 mth (EUR) 7.10
Abs. perf. 1 mth 11.75%
Abs. perf. 3 mth 22.18%
Abs. perf. 12 mth -5.89%
Key financials (EUR) 12/15 12/16e 12/17e
Total Revenue (m) 10,140 9,804 9,912
Pre-Provision Profit (PPP) (m) 5,182 4,961 4,996
Operating profit (OP) 4,703 4,445 4,453
Earnings Before Tax (m) 4,703 4,445 4,453
Net Profit (adj.) (m) 3,662 3,493 3,393
Shareholders Equity (m) 30,946 31,152 31,874
Tangible BV (m) 28,371 28,577 29,299
RWA (m) 143,294 135,630 137,561
ROTE 11.8% 11.2% 10.6%
Total Capital Ratio (B3) 21.6% 24.3% 24.5%
Cost/Income 48.9% 49.4% 49.6%
NPL ratio (gross) 1.8% 1.9% 1.8%
P/PPP 7.9 8.0 7.9
P/E (adj.) 11.2 11.3 11.6
P/BV 1.3 1.3 1.2
P/TBV 1.4 1.4 1.3
Dividend Yield 6.6% 6.7% 6.8%
PPPPS 1.28 1.23 1.23
EPS (adj.) 0.90 0.86 0.84
BVPS 7.65 7.70 7.88
TBVPS 7.01 7.06 7.24
DPS 0.64 0.65 0.66
6.0
6.5
7.0
7.5
8.0
8.5
9.0
9.5
10.0
10.5
11.0
Sep 15 Oct 15 Nov 15 Dec 15 Jan 16 Feb 16 Mar 16 Apr 16 May 16 Jun 16 Jul 16 Aug 16 Sep 16 Oct 16
vvdsvdvsdy
NORDEA Stoxx Banks (Rebased)Source: Factset
Shareholders: Sampo plc 21%; Nordea Fonden 4%;
Swedbank Robus Funds 3%;
Page 20 of 69
Produced & Distributed by the Members of ESN (see last page of this report)
UniCredit
Italy/Banks Analyser
BANKS
UniCredit (Accumulate) Increased certainty about dividend but 2017 earnings under pressure
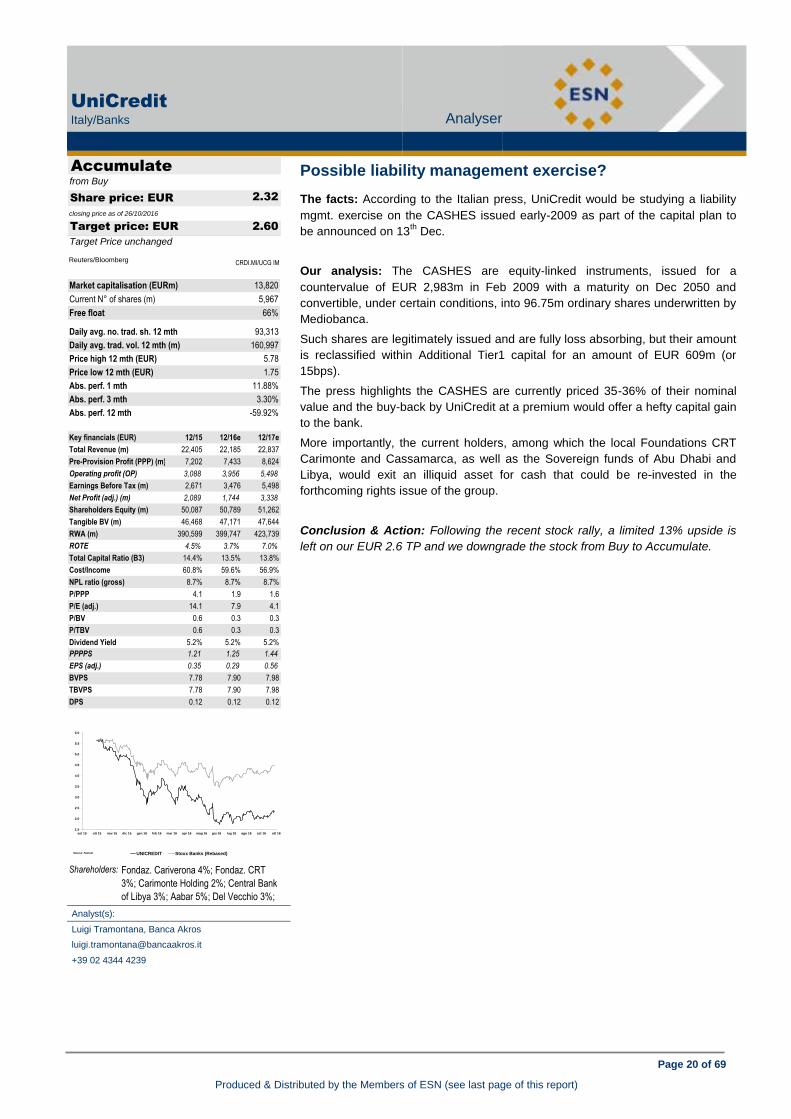
Possible liability management exercise?
The facts: According to the Italian press, UniCredit would be studying a liability
mgmt. exercise on the CASHES issued early-2009 as part of the capital plan to
be announced on 13th
Dec.
Our analysis: The CASHES are equity-linked instruments, issued for a
countervalue of EUR 2,983m in Feb 2009 with a maturity on Dec 2050 and
convertible, under certain conditions, into 96.75m ordinary shares underwritten by
Mediobanca.
Such shares are legitimately issued and are fully loss absorbing, but their amount
is reclassified within Additional Tier1 capital for an amount of EUR 609m (or
15bps).
The press highlights the CASHES are currently priced 35-36% of their nominal
value and the buy-back by UniCredit at a premium would offer a hefty capital gain
to the bank.
More importantly, the current holders, among which the local Foundations CRT
Carimonte and Cassamarca, as well as the Sovereign funds of Abu Dhabi and
Libya, would exit an illiquid asset for cash that could be re-invested in the
forthcoming rights issue of the group.
Conclusion & Action: Following the recent stock rally, a limited 13% upside is
left on our EUR 2.6 TP and we downgrade the stock from Buy to Accumulate.
Analyst(s):
Luigi Tramontana, Banca Akros
+39 02 4344 4239
Accumulate
2.32
closing price as of 26/10/2016
2.60
Target Price unchanged
from Buy
Target price: EUR
Share price: EUR
Reuters/Bloomberg CRDI.MI/UCG IM
Market capitalisation (EURm) 13,820
Current N° of shares (m) 5,967
Free float 66%
Daily avg. no. trad. sh. 12 mth 93,313
Daily avg. trad. vol. 12 mth (m) 160,997
Price high 12 mth (EUR) 5.78
Price low 12 mth (EUR) 1.75
Abs. perf. 1 mth 11.88%
Abs. perf. 3 mth 3.30%
Abs. perf. 12 mth -59.92%
Key financials (EUR) 12/15 12/16e 12/17e
Total Revenue (m) 22,405 22,185 22,837
Pre-Provision Profit (PPP) (m) 7,202 7,433 8,624
Operating profit (OP) 3,088 3,956 5,498
Earnings Before Tax (m) 2,671 3,476 5,498
Net Profit (adj.) (m) 2,089 1,744 3,338
Shareholders Equity (m) 50,087 50,789 51,262
Tangible BV (m) 46,468 47,171 47,644
RWA (m) 390,599 399,747 423,739
ROTE 4.5% 3.7% 7.0%
Total Capital Ratio (B3) 14.4% 13.5% 13.8%
Cost/Income 60.8% 59.6% 56.9%
NPL ratio (gross) 8.7% 8.7% 8.7%
P/PPP 4.1 1.9 1.6
P/E (adj.) 14.1 7.9 4.1
P/BV 0.6 0.3 0.3
P/TBV 0.6 0.3 0.3
Dividend Yield 5.2% 5.2% 5.2%
PPPPS 1.21 1.25 1.44
EPS (adj.) 0.35 0.29 0.56
BVPS 7.78 7.90 7.98
TBVPS 7.78 7.90 7.98
DPS 0.12 0.12 0.12
1.5
2.0
2.5
3.0
3.5
4.0
4.5
5.0
5.5
6.0
set 15 ott 15 nov 15 dic 15 gen 16 feb 16 mar 16 apr 16 mag 16 giu 16 lug 16 ago 16 set 16 ott 16
vvdsvdvsdy
UNICREDIT Stoxx Banks (Rebased)Source: Factset
Shareholders: Fondaz. Cariverona 4%; Fondaz. CRT
3%; Carimonte Holding 2%; Central Bank
of Libya 3%; Aabar 5%; Del Vecchio 3%;
Page 21 of 69
Produced & Distributed by the Members of ESN (see last page of this report)
Acerinox
Spain/Basic Resources Analyser
BASIC RESOURCES
Acerinox (Buy) Possible liability management exercise?
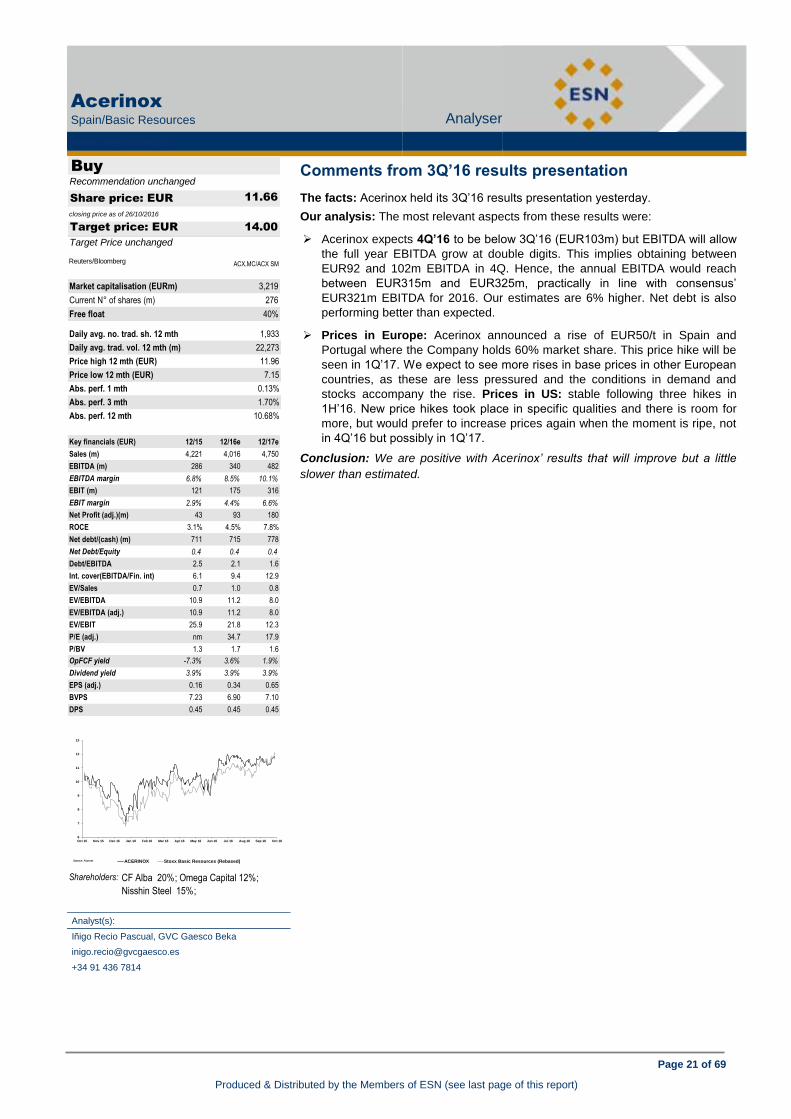
Comments from 3Q’16 results presentation
The facts: Acerinox held its 3Q’16 results presentation yesterday.
Our analysis: The most relevant aspects from these results were:
Acerinox expects 4Q’16 to be below 3Q’16 (EUR103m) but EBITDA will allow
the full year EBITDA grow at double digits. This implies obtaining between
EUR92 and 102m EBITDA in 4Q. Hence, the annual EBITDA would reach
between EUR315m and EUR325m, practically in line with consensus’
EUR321m EBITDA for 2016. Our estimates are 6% higher. Net debt is also
performing better than expected.
Prices in Europe: Acerinox announced a rise of EUR50/t in Spain and
Portugal where the Company holds 60% market share. This price hike will be
seen in 1Q’17. We expect to see more rises in base prices in other European
countries, as these are less pressured and the conditions in demand and
stocks accompany the rise. Prices in US: stable following three hikes in
1H’16. New price hikes took place in specific qualities and there is room for
more, but would prefer to increase prices again when the moment is ripe, not
in 4Q’16 but possibly in 1Q’17.
Conclusion: We are positive with Acerinox’ results that will improve but a little
slower than estimated.
Analyst(s):
Iñigo Recio Pascual, GVC Gaesco Beka
+34 91 436 7814
Buy
11.66
closing price as of 26/10/2016
14.00
Target Price unchanged
Recommendation unchanged
Target price: EUR
Share price: EUR
Reuters/Bloomberg ACX.MC/ACX SM
Market capitalisation (EURm) 3,219
Current N° of shares (m) 276
Free float 40%
Daily avg. no. trad. sh. 12 mth 1,933
Daily avg. trad. vol. 12 mth (m) 22,273
Price high 12 mth (EUR) 11.96
Price low 12 mth (EUR) 7.15
Abs. perf. 1 mth 0.13%
Abs. perf. 3 mth 1.70%
Abs. perf. 12 mth 10.68%
Key financials (EUR) 12/15 12/16e 12/17e
Sales (m) 4,221 4,016 4,750
EBITDA (m) 286 340 482
EBITDA margin 6.8% 8.5% 10.1%
EBIT (m) 121 175 316
EBIT margin 2.9% 4.4% 6.6%
Net Profit (adj.)(m) 43 93 180
ROCE 3.1% 4.5% 7.8%
Net debt/(cash) (m) 711 715 778
Net Debt/Equity 0.4 0.4 0.4
Debt/EBITDA 2.5 2.1 1.6
Int. cover(EBITDA/Fin. int) 6.1 9.4 12.9
EV/Sales 0.7 1.0 0.8
EV/EBITDA 10.9 11.2 8.0
EV/EBITDA (adj.) 10.9 11.2 8.0
EV/EBIT 25.9 21.8 12.3
P/E (adj.) nm 34.7 17.9
P/BV 1.3 1.7 1.6
OpFCF yield -7.3% 3.6% 1.9%
Dividend yield 3.9% 3.9% 3.9%
EPS (adj.) 0.16 0.34 0.65
BVPS 7.23 6.90 7.10
DPS 0.45 0.45 0.45
6
7
8
9
10
11
12
13
Oct 15 Nov 15 Dec 15 Jan 16 Feb 16 Mar 16 Apr 16 May 16 Jun 16 Jul 16 Aug 16 Sep 16 Oct 16
vvdsvdvsdy
ACERINOX Stoxx Basic Resources (Rebased)Source: Factset
Shareholders: CF Alba 20%; Omega Capital 12%;
Nisshin Steel 15%;
Page 22 of 69
Produced & Distributed by the Members of ESN (see last page of this report)
Ence
Spain/Basic Resources Analyser
BASIC RESOURCES
Ence (Buy) Comments from 3Q’16 results presentation
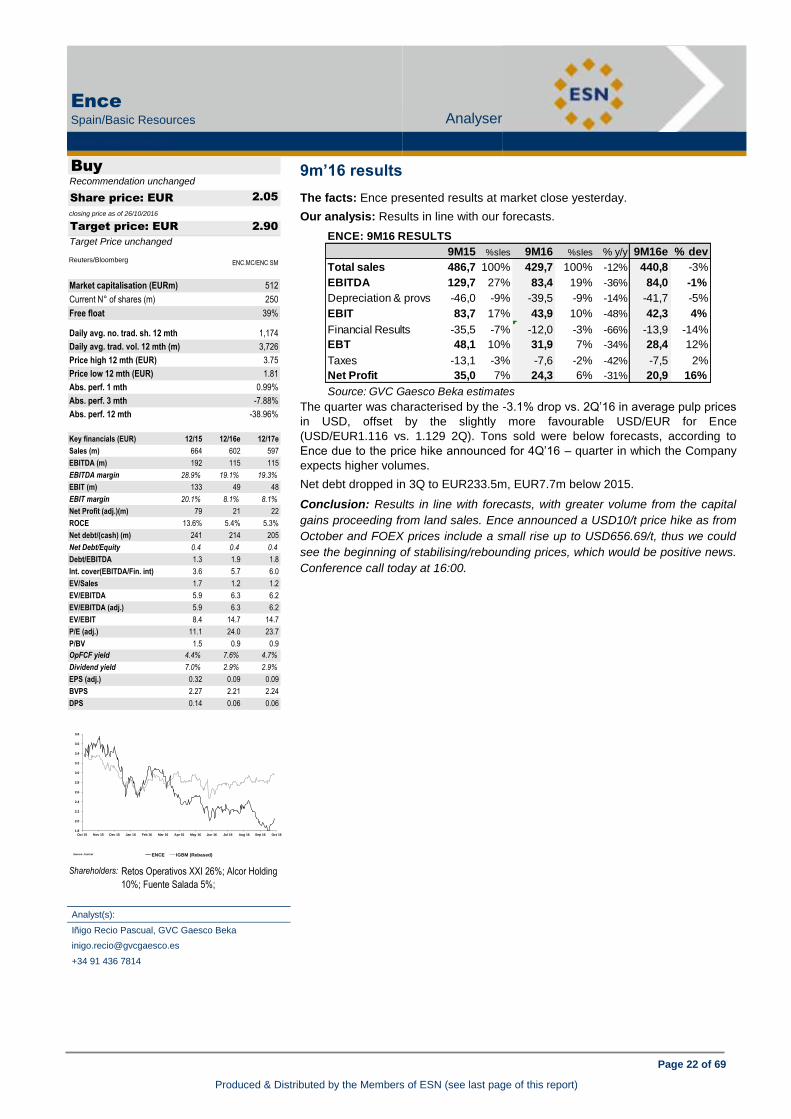
9m’16 results
The facts: Ence presented results at market close yesterday.
Our analysis: Results in line with our forecasts.
The quarter was characterised by the -3.1% drop vs. 2Q’16 in average pulp prices
in USD, offset by the slightly more favourable USD/EUR for Ence
(USD/EUR1.116 vs. 1.129 2Q). Tons sold were below forecasts, according to
Ence due to the price hike announced for 4Q’16 – quarter in which the Company
expects higher volumes.
Net debt dropped in 3Q to EUR233.5m, EUR7.7m below 2015.
Conclusion: Results in line with forecasts, with greater volume from the capital
gains proceeding from land sales. Ence announced a USD10/t price hike as from
October and FOEX prices include a small rise up to USD656.69/t, thus we could
see the beginning of stabilising/rebounding prices, which would be positive news.
Conference call today at 16:00.
Analyst(s):
Iñigo Recio Pascual, GVC Gaesco Beka
+34 91 436 7814
Buy
2.05
closing price as of 26/10/2016
2.90
Target Price unchanged
Recommendation unchanged
Target price: EUR
Share price: EUR
Reuters/Bloomberg ENC.MC/ENC SM
Market capitalisation (EURm) 512
Current N° of shares (m) 250
Free float 39%
Daily avg. no. trad. sh. 12 mth 1,174
Daily avg. trad. vol. 12 mth (m) 3,726
Price high 12 mth (EUR) 3.75
Price low 12 mth (EUR) 1.81
Abs. perf. 1 mth 0.99%
Abs. perf. 3 mth -7.88%
Abs. perf. 12 mth -38.96%
Key financials (EUR) 12/15 12/16e 12/17e
Sales (m) 664 602 597
EBITDA (m) 192 115 115
EBITDA margin 28.9% 19.1% 19.3%
EBIT (m) 133 49 48
EBIT margin 20.1% 8.1% 8.1%
Net Profit (adj.)(m) 79 21 22
ROCE 13.6% 5.4% 5.3%
Net debt/(cash) (m) 241 214 205
Net Debt/Equity 0.4 0.4 0.4
Debt/EBITDA 1.3 1.9 1.8
Int. cover(EBITDA/Fin. int) 3.6 5.7 6.0
EV/Sales 1.7 1.2 1.2
EV/EBITDA 5.9 6.3 6.2
EV/EBITDA (adj.) 5.9 6.3 6.2
EV/EBIT 8.4 14.7 14.7
P/E (adj.) 11.1 24.0 23.7
P/BV 1.5 0.9 0.9
OpFCF yield 4.4% 7.6% 4.7%
Dividend yield 7.0% 2.9% 2.9%
EPS (adj.) 0.32 0.09 0.09
BVPS 2.27 2.21 2.24
DPS 0.14 0.06 0.06
ENCE: 9M16 RESULTS
9M15 %sles 9M16 %sles % y/y 9M16e % dev
Total sales 486,7 100% 429,7 100% -12% 440,8 -3%
EBITDA 129,7 27% 83,4 19% -36% 84,0 -1%
Depreciation & provs -46,0 -9% -39,5 -9% -14% -41,7 -5%
EBIT 83,7 17% 43,9 10% -48% 42,3 4%
Financial Results -35,5 -7% -12,0 -3% -66% -13,9 -14%
EBT 48,1 10% 31,9 7% -34% 28,4 12%
Taxes -13,1 -3% -7,6 -2% -42% -7,5 2%
Net Profit 35,0 7% 24,3 6% -31% 20,9 16%
Source: GVC Gaesco Beka estimates
1.8
2.0
2.2
2.4
2.6
2.8
3.0
3.2
3.4
3.6
3.8
Oct 15 Nov 15 Dec 15 Jan 16 Feb 16 Mar 16 Apr 16 May 16 Jun 16 Jul 16 Aug 16 Sep 16 Oct 16
vvdsvdvsdy
ENCE IGBM (Rebased)Source: Factset
Shareholders: Retos Operativos XXI 26%; Alcor Holding
10%; Fuente Salada 5%;
Page 23 of 69
Produced & Distributed by the Members of ESN (see last page of this report)
Europac
Spain/Basic Resources Analyser
BASIC RESOURCES
Europac (Accumulate) 9m’16 results
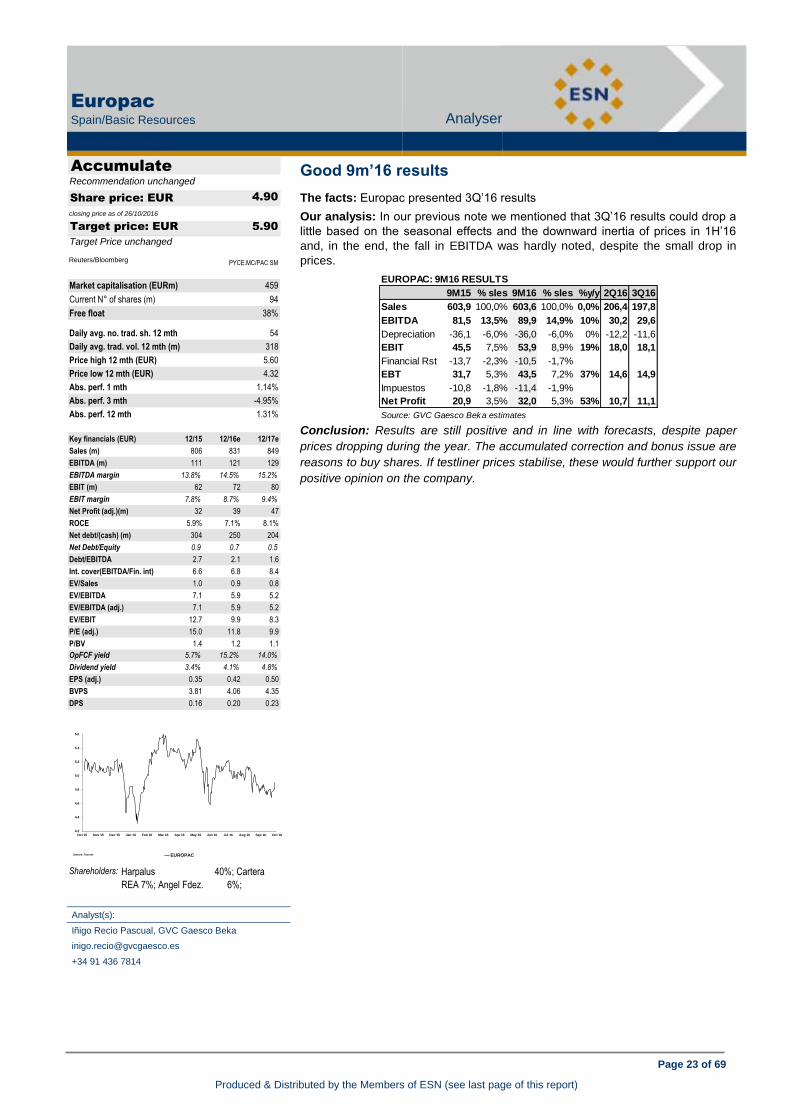
Good 9m’16 results
The facts: Europac presented 3Q’16 results
Our analysis: In our previous note we mentioned that 3Q’16 results could drop a
little based on the seasonal effects and the downward inertia of prices in 1H’16
and, in the end, the fall in EBITDA was hardly noted, despite the small drop in
prices.
Conclusion: Results are still positive and in line with forecasts, despite paper
prices dropping during the year. The accumulated correction and bonus issue are
reasons to buy shares. If testliner prices stabilise, these would further support our
positive opinion on the company.
Analyst(s):
Iñigo Recio Pascual, GVC Gaesco Beka
+34 91 436 7814
Accumulate
4.90
closing price as of 26/10/2016
5.90
Target Price unchanged
Recommendation unchanged
Target price: EUR
Share price: EUR
Reuters/Bloomberg PYCE.MC/PAC SM
Market capitalisation (EURm) 459
Current N° of shares (m) 94
Free float 38%
Daily avg. no. trad. sh. 12 mth 54
Daily avg. trad. vol. 12 mth (m) 318
Price high 12 mth (EUR) 5.60
Price low 12 mth (EUR) 4.32
Abs. perf. 1 mth 1.14%
Abs. perf. 3 mth -4.95%
Abs. perf. 12 mth 1.31%
Key financials (EUR) 12/15 12/16e 12/17e
Sales (m) 806 831 849
EBITDA (m) 111 121 129
EBITDA margin 13.8% 14.5% 15.2%
EBIT (m) 62 72 80
EBIT margin 7.8% 8.7% 9.4%
Net Profit (adj.)(m) 32 39 47
ROCE 5.9% 7.1% 8.1%
Net debt/(cash) (m) 304 250 204
Net Debt/Equity 0.9 0.7 0.5
Debt/EBITDA 2.7 2.1 1.6
Int. cover(EBITDA/Fin. int) 6.6 6.8 8.4
EV/Sales 1.0 0.9 0.8
EV/EBITDA 7.1 5.9 5.2
EV/EBITDA (adj.) 7.1 5.9 5.2
EV/EBIT 12.7 9.9 8.3
P/E (adj.) 15.0 11.8 9.9
P/BV 1.4 1.2 1.1
OpFCF yield 5.7% 15.2% 14.0%
Dividend yield 3.4% 4.1% 4.8%
EPS (adj.) 0.35 0.42 0.50
BVPS 3.81 4.06 4.35
DPS 0.16 0.20 0.23
EUROPAC: 9M16 RESULTS
9M15 % sles 9M16 % sles %y/y 2Q16 3Q16
Sales 603,9 100,0% 603,6 100,0% 0,0% 206,4 197,8
EBITDA 81,5 13,5% 89,9 14,9% 10% 30,2 29,6
Depreciation -36,1 -6,0% -36,0 -6,0% 0% -12,2 -11,6
EBIT 45,5 7,5% 53,9 8,9% 19% 18,0 18,1
Financial Rst -13,7 -2,3% -10,5 -1,7%
EBT 31,7 5,3% 43,5 7,2% 37% 14,6 14,9
Impuestos -10,8 -1,8% -11,4 -1,9%
Net Profit 20,9 3,5% 32,0 5,3% 53% 10,7 11,1
Source: GVC Gaesco Beka estimates
4.2
4.4
4.6
4.8
5.0
5.2
5.4
5.6
Oct 15 Nov 15 Dec 15 Jan 16 Feb 16 Mar 16 Apr 16 May 16 Jun 16 Jul 16 Aug 16 Sep 16 Oct 16
vvdsvdvsdy
EUROPACSource: Factset
Shareholders: Harpalus 40%; Cartera
REA 7%; Angel Fdez. 6%;
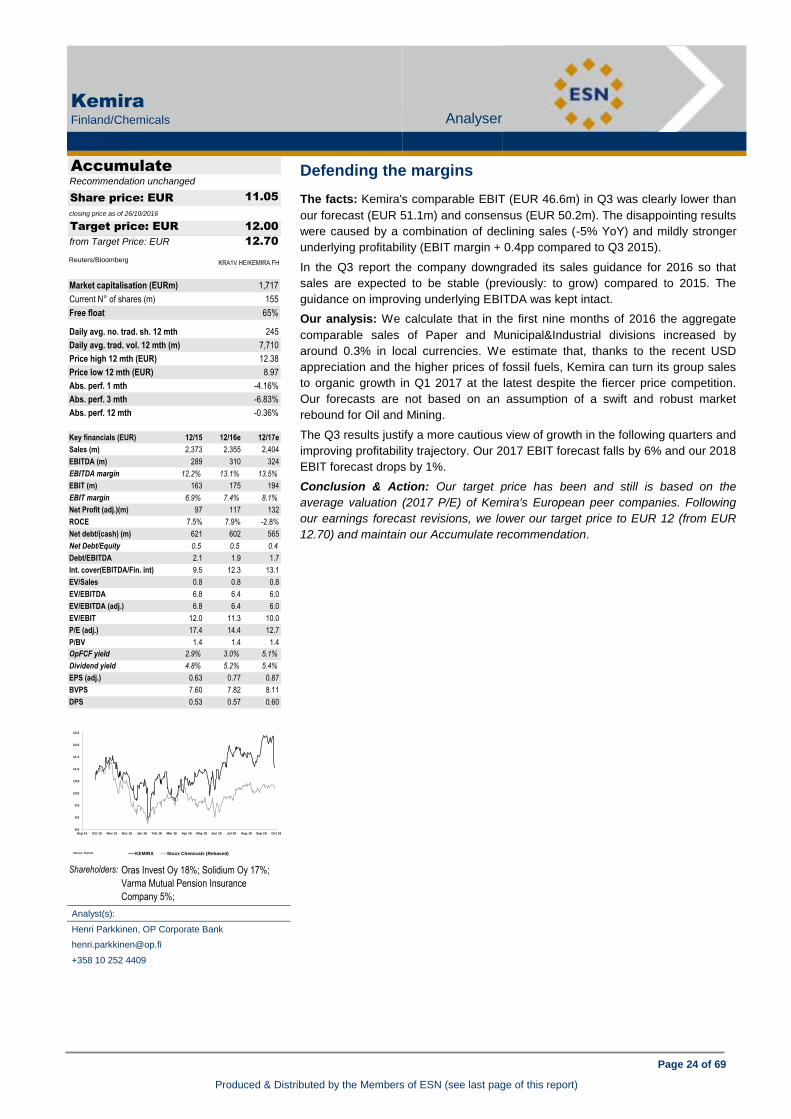
Page 24 of 69
Produced & Distributed by the Members of ESN (see last page of this report)
Kemira
Finland/Chemicals Analyser
CHEMICALS
Kemira (Accumulate) Good 9m’16 results
Defending the margins
The facts: Kemira's comparable EBIT (EUR 46.6m) in Q3 was clearly lower than
our forecast (EUR 51.1m) and consensus (EUR 50.2m). The disappointing results
were caused by a combination of declining sales (-5% YoY) and mildly stronger
underlying profitability (EBIT margin + 0.4pp compared to Q3 2015).
In the Q3 report the company downgraded its sales guidance for 2016 so that
sales are expected to be stable (previously: to grow) compared to 2015. The
guidance on improving underlying EBITDA was kept intact.
Our analysis: We calculate that in the first nine months of 2016 the aggregate
comparable sales of Paper and Municipal&Industrial divisions increased by
around 0.3% in local currencies. We estimate that, thanks to the recent USD
appreciation and the higher prices of fossil fuels, Kemira can turn its group sales
to organic growth in Q1 2017 at the latest despite the fiercer price competition.
Our forecasts are not based on an assumption of a swift and robust market
rebound for Oil and Mining.
The Q3 results justify a more cautious view of growth in the following quarters and
improving profitability trajectory. Our 2017 EBIT forecast falls by 6% and our 2018
EBIT forecast drops by 1%.
Conclusion & Action: Our target price has been and still is based on the
average valuation (2017 P/E) of Kemira's European peer companies. Following
our earnings forecast revisions, we lower our target price to EUR 12 (from EUR
12.70) and maintain our Accumulate recommendation.
Analyst(s):
Henri Parkkinen, OP Corporate Bank
+358 10 252 4409
Accumulate
11.05
closing price as of 26/10/2016
12.00
12.70from Target Price: EUR
Recommendation unchanged
Target price: EUR
Share price: EUR
Reuters/Bloomberg KRA1V.HE/KEMIRA FH
Market capitalisation (EURm) 1,717
Current N° of shares (m) 155
Free float 65%
Daily avg. no. trad. sh. 12 mth 245
Daily avg. trad. vol. 12 mth (m) 7,710
Price high 12 mth (EUR) 12.38
Price low 12 mth (EUR) 8.97
Abs. perf. 1 mth -4.16%
Abs. perf. 3 mth -6.83%
Abs. perf. 12 mth -0.36%
Key financials (EUR) 12/15 12/16e 12/17e
Sales (m) 2,373 2,355 2,404
EBITDA (m) 289 310 324
EBITDA margin 12.2% 13.1% 13.5%
EBIT (m) 163 175 194
EBIT margin 6.9% 7.4% 8.1%
Net Profit (adj.)(m) 97 117 132
ROCE 7.5% 7.9% -2.8%
Net debt/(cash) (m) 621 602 565
Net Debt/Equity 0.5 0.5 0.4
Debt/EBITDA 2.1 1.9 1.7
Int. cover(EBITDA/Fin. int) 9.5 12.3 13.1
EV/Sales 0.8 0.8 0.8
EV/EBITDA 6.8 6.4 6.0
EV/EBITDA (adj.) 6.8 6.4 6.0
EV/EBIT 12.0 11.3 10.0
P/E (adj.) 17.4 14.4 12.7
P/BV 1.4 1.4 1.4
OpFCF yield 2.9% 3.0% 5.1%
Dividend yield 4.8% 5.2% 5.4%
EPS (adj.) 0.63 0.77 0.87
BVPS 7.60 7.82 8.11
DPS 0.53 0.57 0.60
8.5
9.0
9.5
10.0
10.5
11.0
11.5
12.0
12.5
Sep 15 Oct 15 Nov 15 Dec 15 Jan 16 Feb 16 Mar 16 Apr 16 May 16 Jun 16 Jul 16 Aug 16 Sep 16 Oct 16
vvdsvdvsdy
KEMIRA Stoxx Chemicals (Rebased)Source: Factset
Shareholders: Oras Invest Oy 18%; Solidium Oy 17%;
Varma Mutual Pension Insurance
Company 5%;
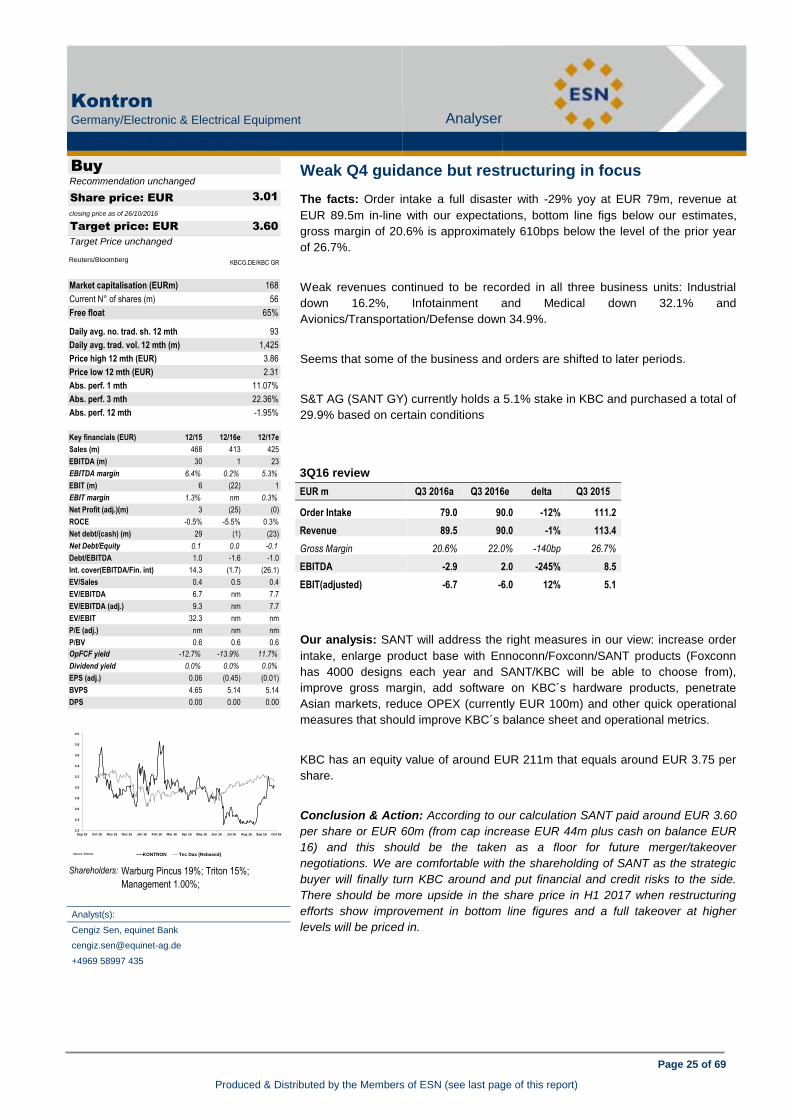
Page 25 of 69
Produced & Distributed by the Members of ESN (see last page of this report)
Kontron
Germany/Electronic & Electrical Equipment Analyser
ELECTRONIC & ELECTRICAL EQUIPMENT
Kontron (Buy) Defending the margins
Weak Q4 guidance but restructuring in focus
The facts: Order intake a full disaster with -29% yoy at EUR 79m, revenue at
EUR 89.5m in-line with our expectations, bottom line figs below our estimates,
gross margin of 20.6% is approximately 610bps below the level of the prior year
of 26.7%.
Weak revenues continued to be recorded in all three business units: Industrial
down 16.2%, Infotainment and Medical down 32.1% and
Avionics/Transportation/Defense down 34.9%.
Seems that some of the business and orders are shifted to later periods.
S&T AG (SANT GY) currently holds a 5.1% stake in KBC and purchased a total of
29.9% based on certain conditions
3Q16 review
EUR m Q3 2016a Q3 2016e delta Q3 2015
Order Intake 79.0 90.0 -12% 111.2
Revenue 89.5 90.0 -1% 113.4
Gross Margin 20.6% 22.0% -140bp 26.7%
EBITDA -2.9 2.0 -245% 8.5
EBIT(adjusted) -6.7 -6.0 12% 5.1
Our analysis: SANT will address the right measures in our view: increase order
intake, enlarge product base with Ennoconn/Foxconn/SANT products (Foxconn
has 4000 designs each year and SANT/KBC will be able to choose from),
improve gross margin, add software on KBC´s hardware products, penetrate
Asian markets, reduce OPEX (currently EUR 100m) and other quick operational
measures that should improve KBC´s balance sheet and operational metrics.
KBC has an equity value of around EUR 211m that equals around EUR 3.75 per
share.
Conclusion & Action: According to our calculation SANT paid around EUR 3.60
per share or EUR 60m (from cap increase EUR 44m plus cash on balance EUR
16) and this should be the taken as a floor for future merger/takeover
negotiations. We are comfortable with the shareholding of SANT as the strategic
buyer will finally turn KBC around and put financial and credit risks to the side.
There should be more upside in the share price in H1 2017 when restructuring
efforts show improvement in bottom line figures and a full takeover at higher
levels will be priced in.
Analyst(s):
Cengiz Sen, equinet Bank
+4969 58997 435
Buy
3.01
closing price as of 26/10/2016
3.60
Target Price unchanged
Recommendation unchanged
Target price: EUR
Share price: EUR
Reuters/Bloomberg KBCG.DE/KBC GR
Market capitalisation (EURm) 168
Current N° of shares (m) 56
Free float 65%
Daily avg. no. trad. sh. 12 mth 93
Daily avg. trad. vol. 12 mth (m) 1,425
Price high 12 mth (EUR) 3.86
Price low 12 mth (EUR) 2.31
Abs. perf. 1 mth 11.07%
Abs. perf. 3 mth 22.36%
Abs. perf. 12 mth -1.95%
Key financials (EUR) 12/15 12/16e 12/17e
Sales (m) 468 413 425
EBITDA (m) 30 1 23
EBITDA margin 6.4% 0.2% 5.3%
EBIT (m) 6 (22) 1
EBIT margin 1.3% nm 0.3%
Net Profit (adj.)(m) 3 (25) (0)
ROCE -0.5% -5.5% 0.3%
Net debt/(cash) (m) 29 (1) (23)
Net Debt/Equity 0.1 0.0 -0.1
Debt/EBITDA 1.0 -1.6 -1.0
Int. cover(EBITDA/Fin. int) 14.3 (1.7) (26.1)
EV/Sales 0.4 0.5 0.4
EV/EBITDA 6.7 nm 7.7
EV/EBITDA (adj.) 9.3 nm 7.7
EV/EBIT 32.3 nm nm
P/E (adj.) nm nm nm
P/BV 0.6 0.6 0.6
OpFCF yield -12.7% -13.9% 11.7%
Dividend yield 0.0% 0.0% 0.0%
EPS (adj.) 0.06 (0.45) (0.01)
BVPS 4.65 5.14 5.14
DPS 0.00 0.00 0.00
2.2
2.4
2.6
2.8
3.0
3.2
3.4
3.6
3.8
4.0
Sep 15 Oct 15 Nov 15 Dec 15 Jan 16 Feb 16 Mar 16 Apr 16 May 16 Jun 16 Jul 16 Aug 16 Sep 16 Oct 16
vvdsvdvsdy
KONTRON Tec Dax (Rebased)Source: Factset
Shareholders: Warburg Pincus 19%; Triton 15%;
Management 1.00%;

Page 26 of 69
Produced & Distributed by the Members of ESN (see last page of this report)
Vaisala
Q3 2015a
EURm Q3a OP Cons.
Sales
Weather 53.4 53.1 0 58.4
Controlled Environment 28.4 26.5 0 23.4
Sales 81.8 79.6 78.5 81.7
EBIT
Weather -3.3 -3.6 0 8.2
Controlled Environment 7.4 6.4 0 6.1
Other 1.2 0.0 0 -0.2
EBIT 5.3 2.8 11.3 14.0
Margin 6.5 % 3.5 % 14.3 % 17.3 %
PTP 4.6 4.0 1.0 14.0
EPS 0.21 0.15 0.50 0.58
DPS
Source: OP and Factset
Q3 2016e
Vaisala
Finland/Electronic & Electrical Equipment Analyser
ELECTRONIC & ELECTRICAL EQUIPMENT
Vaisala (Buy) Weak Q4 guidance but restructuring in focus
Profitability heading towards the target of 15%
The facts: Vaisala’s sales and operating profit excluding non-recurring items
exceed forecasts. Vaisala’s sales were EUR 81.8m and EBIT EUR 15.8m.
Vaisala’s reported EBIT of EUR 5.3m includes a writedown of EUR 10.5m related
to the goodwill generated by the acquisitions of Second Wind Systems and
3TIER. In addition, Vaisala recorded EUR 2.7m of non-recurring costs for Q3 due
to the discontinuation of the U.S.AWOS system and cost savings totalling EUR
1.3m for the Weather Business Area.
Our analysis: Vaisala repeats its guidance and estimates that its sales in 2016
will be EUR 310–330m and EBIT EUR 18–28m including the writedown of EUR
10.5m. On the basis of the guidance, the company’s sales in Q4 will be EUR 84–
104m and EBIT EUR 10.3– 20.3m.. We assume that the Weather Business
Area’s EBIT in Q4 will improve as a result of cost savings implemented in the US.
According to the company, the demand for weather radars has been weak
globally and it estimates that the slower demand will also continue in Q4. Vaisala
expects that the activities in the Controlled Environment Business Area will
continue at a good level. The greatest uncertainty towards the end of the year is
related to the seasonality of the Weather Business Area in Q4.
Conclusion & Action: Vaisala’s profitability in 2017 is supported by cost savings
in the US and the positive outlook of the Controlled Environment Business Area.
Vaisala’s long-term (2014–2018) target is an EBIT margin of 15% at the end of
the strategy period and an average increase in sales of 5% during the strategy
period. The ongoing trends support the increase in the need for measuring. Our
forecasts were slightly upgraded for 2016– 2018. The price indicated by the DCF
model increased by EUR 1.5 to EUR 41.5, and the price indications according to
the 10-year median of P/E and EV/EBIT multiples are EUR 38 and EUR 36. The
foundation for Vaisala’s business operations is relatively unchanged, which in our
opinion justifies the use of long-term multiples. The average on the basis of the
above-mentioned methods rose to EUR 38 (prev. EUR 35). Our recommendation
is upgraded to Buy (prev. Accumulate).
Analyst(s):
Hannu Rauhala, OP Corporate Bank
+358 10 252 4392
Buy
29.60
closing price as of 26/10/2016
38.00
35.00from Target Price: EUR
from Accumulate
Target price: EUR
Share price: EUR
Reuters/Bloomberg VAIAS.HE/VAIAS FH
Market capitalisation (EURm) 534
Current N° of shares (m) 18
Free float 100%
Daily avg. no. trad. sh. 12 mth 8
Daily avg. trad. vol. 12 mth (m) 214
Price high 12 mth (EUR) 34.42
Price low 12 mth (EUR) 22.23
Abs. perf. 1 mth -7.87%
Abs. perf. 3 mth -5.22%
Abs. perf. 12 mth 20.28%
Key financials (EUR) 12/15 12/16e 12/17e
Sales (m) 319 327 348
EBITDA (m) 45 42 60
EBITDA margin 14.0% 12.8% 17.3%
EBIT (m) 30 27 46
EBIT margin 9.3% 8.4% 13.3%
Net Profit (adj.)(m) 26 19 34
ROCE 19.3% 18.9% 31.9%
Net debt/(cash) (m) (52) (61) (77)
Net Debt/Equity -0.3 -0.3 -0.4
Debt/EBITDA -1.2 -1.5 -1.3
Int. cover(EBITDA/Fin. int) (12.4) 20.9 (37.7)
EV/Sales 1.2 1.4 1.3
EV/EBITDA 8.2 11.1 7.4
EV/EBITDA (adj.) 8.2 11.1 7.4
EV/EBIT 12.5 16.8 9.6
P/E (adj.) 16.6 28.6 15.5
P/BV 2.4 2.9 2.7
OpFCF yield 7.9% 4.7% 6.4%
Dividend yield 3.0% 3.4% 3.7%
EPS (adj.) 1.44 1.03 1.91
BVPS 9.98 10.13 11.05
DPS 0.90 1.00 1.10
20
22
24
26
28
30
32
34
36
Sep 15 Oct 15 Nov 15 Dec 15 Jan 16 Feb 16 Mar 16 Apr 16 May 16 Jun 16 Jul 16 Aug 16 Sep 16 Oct 16
vvdsvdvsdy
VAISALA OMXH (Rebased)Source: Factset
Shareholders: Novametor Oy 10%; Suomalainen
Tiedeakatemia ry 6%; Mandatum
Henkivakuutusosakeyhtiö 4%;

Page 27 of 69
Produced & Distributed by the Members of ESN (see last page of this report)
FinecoBank
Italy/Financial Services Analyser
FINANCIAL SERVICES
FinecoBank (Buy) Profitability heading towards the target of 15%
The new cyborg advisory platform became fully operational
The facts: According to Fineco’s press release, the new cyborg advisory platform
became fully operational with the launch of a number of new features based on
the bank’s leading digital retail technology.
Our analysis: the new technological platform (X-Net), internally developed by the
bank, ought to offer to Fineco’s PFAs an integrated solution, simplifying their work
and strengthening customers’ relationships. The platform allows advisors to
translate life goals, risk appetite and time horizon of their clients into investment
choices, helping them also to manage all the relationship aspects. Advisors can
use the tool to organize their activities and time, allowing them to focus on the
financial advisory, which is core in the current market environment. Its key
features include: 1) the investment needs tool, which is an innovative function
that enables advisors to share with clients their potential financial gaps connected
to own life goals, from pension to children’s education, and the consequent need
to identify an investment strategy to meet these goals; 2) co-browsing, which
enables advisors to share their screen remotely with the client allowing them to
analyse together the financial situation, to work more efficiently and build a closer
relationship; 3) personalised homepage, which is the gateway to the platform,
containing all the information needed by advisors to plan and monitor their work,
including budget targets, total assets, the composition of their clients’ portfolio
and their agenda.
Conclusion & Action: this news confirms Fineco’s efforts in developing its
technological platform to support its network and push on the future advisory
model, which is going to be the best practice, due to Mifid II (2017), in the sector.
The cyborg advisory approach enhances the role of the consultants which can
rely on the fundamental support of the technology in their day by day work. We
stick to Buy and we confirm our target price (EUR 5.75). Fineco will be still
consolidated by Unicredit, preserving its strong capital position (CET1 c. 22% at
the end of 1H16) and its net interest margin. The development of the financial
advisor network and the clear focus on commercial efforts on the more value
added products will drive the strategy in the following years. Compared to peers,
Fineco has a less risky business model with a growth we deem is more
sustainable, due to the lack of non-recurring items such as performance fees and
to the lower margins and more convenient prices, which can, together with the
high quality services, allow stronger potential growth in the number of clients. The
quality of earnings is also better than peers, thanks to the “cleaner” tax structure.
Analyst(s):
Enrico Esposti, CIIA, Banca Akros
+39 02 4344 4022
Buy
5.35
closing price as of 26/10/2016
5.75
Target Price unchanged
Recommendation unchanged
Target price: EUR
Share price: EUR
Reuters/Bloomberg FBK.MI/FBK IM
Market capitalisation (EURm) 3,260
Current N° of shares (m) 609
Free float 32%
Daily avg. no. trad. sh. 12 mth 1,807
Daily avg. trad. vol. 12 mth (m) 11,656
Price high 12 mth (EUR) 7.63
Price low 12 mth (EUR) 4.79
Abs. perf. 1 mth 5.42%
Abs. perf. 3 mth -6.06%
Abs. perf. 12 mth -21.90%
Key financials (EUR) 12/15 12/16e 12/17e
Total Revenue (m) 544 545 557
Pre-Provision Profit (PPP) (m) 296 299 303
Operating profit (OP) 289 293 297
Earnings Before Tax (m) 289 293 297
Net Profit (adj.) (m) 195 199 202
Shareholders Equity (m) 633 670 707
Tangible BV (m) 543 580 617
RWA (m) 1,828 2,006 2,095
ROTE 32.8% 30.6% 29.3%
Total Capital Ratio (B3) 21.4% 21.1% 22.0%
Cost/Income 42.7% 42.2% 41.9%
P/PPP 15.7 10.9 10.8
P/E (adj.) 23.9 16.4 16.2
P/BV 7.3 4.9 4.6
P/TBV 8.6 5.6 5.3
Dividend Yield 4.8% 4.9% 5.0%
PPPPS 0.49 0.49 0.50
EPS (adj.) 0.32 0.33 0.33
BVPS 1.04 1.10 1.16
TBVPS 0.89 0.95 1.01
DPS 0.26 0.26 0.27
4.5
5.0
5.5
6.0
6.5
7.0
7.5
8.0
Sep 15 Oct 15 Nov 15 Dec 15 Jan 16 Feb 16 Mar 16 Apr 16 May 16 Jun 16 Jul 16 Aug 16 Sep 16 Oct 16
vvdsvdvsdy
FINECOBANK FTSE Italy All Share (Rebased)Source: Factset
Shareholders: Unicredit 56%; Threadneedle AM 2%;
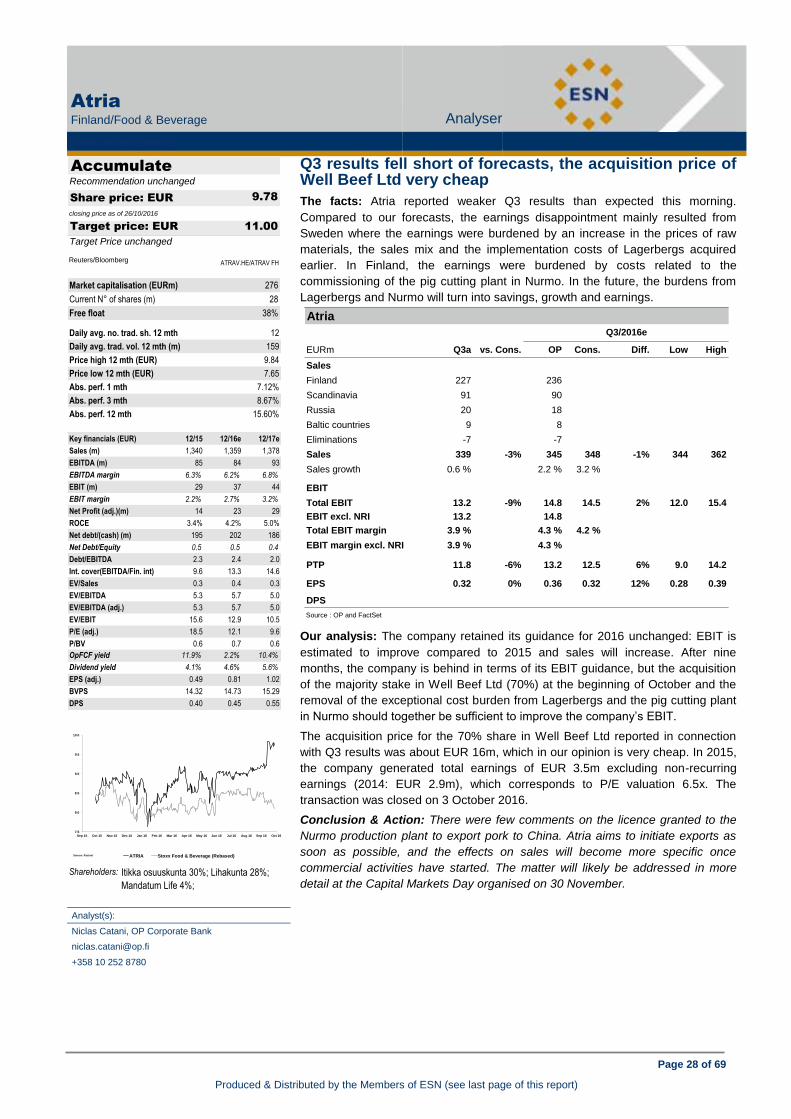
Page 28 of 69
Produced & Distributed by the Members of ESN (see last page of this report)
Atria
EURm Q3a vs. Cons. OP Cons. Diff. Low High
Sales
Finland 227 #DIV/0! 236 #DIV/0!
Scandinavia 91 #DIV/0! 90 #DIV/0!
Russia 20 #DIV/0! 18 #DIV/0!
Baltic countries 9 #DIV/0! 8 #DIV/0!
Eliminations -7 #DIV/0! -7 #DIV/0!
Sales 339 -3% 345 348 -1% 344 362
Sales growth 0.6 % 2.2 % 3.2 %
EBIT
Total EBIT 13.2 -9% 14.8 14.5 2% 12.0 15.4
EBIT excl. NRI 13.2 14.8
Total EBIT margin 3.9 % 4.3 % 4.2 %
EBIT margin excl. NRI 3.9 % 4.3 %
PTP 11.8 -6% 13.2 12.5 6% 9.0 14.2
EPS 0.32 0% 0.36 0.32 12% 0.28 0.39
DPS
Source : OP and FactSet
Q3/2016e
Atria
Finland/Food & Beverage Analyser
FOOD & BEVERAGE
Atria (Accumulate) The new cyborg advisory platform became fully operational
Q3 results fell short of forecasts, the acquisition price of Well Beef Ltd very cheap
The facts: Atria reported weaker Q3 results than expected this morning.
Compared to our forecasts, the earnings disappointment mainly resulted from
Sweden where the earnings were burdened by an increase in the prices of raw
materials, the sales mix and the implementation costs of Lagerbergs acquired
earlier. In Finland, the earnings were burdened by costs related to the
commissioning of the pig cutting plant in Nurmo. In the future, the burdens from
Lagerbergs and Nurmo will turn into savings, growth and earnings.
Our analysis: The company retained its guidance for 2016 unchanged: EBIT is
estimated to improve compared to 2015 and sales will increase. After nine
months, the company is behind in terms of its EBIT guidance, but the acquisition
of the majority stake in Well Beef Ltd (70%) at the beginning of October and the
removal of the exceptional cost burden from Lagerbergs and the pig cutting plant
in Nurmo should together be sufficient to improve the company’s EBIT.
The acquisition price for the 70% share in Well Beef Ltd reported in connection
with Q3 results was about EUR 16m, which in our opinion is very cheap. In 2015,
the company generated total earnings of EUR 3.5m excluding non-recurring
earnings (2014: EUR 2.9m), which corresponds to P/E valuation 6.5x. The
transaction was closed on 3 October 2016.
Conclusion & Action: There were few comments on the licence granted to the
Nurmo production plant to export pork to China. Atria aims to initiate exports as
soon as possible, and the effects on sales will become more specific once
commercial activities have started. The matter will likely be addressed in more
detail at the Capital Markets Day organised on 30 November.
Analyst(s):
Niclas Catani, OP Corporate Bank
+358 10 252 8780
Accumulate
9.78
closing price as of 26/10/2016
11.00
Target Price unchanged
Recommendation unchanged
Target price: EUR
Share price: EUR
Reuters/Bloomberg ATRAV.HE/ATRAV FH
Market capitalisation (EURm) 276
Current N° of shares (m) 28
Free float 38%
Daily avg. no. trad. sh. 12 mth 12
Daily avg. trad. vol. 12 mth (m) 159
Price high 12 mth (EUR) 9.84
Price low 12 mth (EUR) 7.65
Abs. perf. 1 mth 7.12%
Abs. perf. 3 mth 8.67%
Abs. perf. 12 mth 15.60%
Key financials (EUR) 12/15 12/16e 12/17e
Sales (m) 1,340 1,359 1,378
EBITDA (m) 85 84 93
EBITDA margin 6.3% 6.2% 6.8%
EBIT (m) 29 37 44
EBIT margin 2.2% 2.7% 3.2%
Net Profit (adj.)(m) 14 23 29
ROCE 3.4% 4.2% 5.0%
Net debt/(cash) (m) 195 202 186
Net Debt/Equity 0.5 0.5 0.4
Debt/EBITDA 2.3 2.4 2.0
Int. cover(EBITDA/Fin. int) 9.6 13.3 14.6
EV/Sales 0.3 0.4 0.3
EV/EBITDA 5.3 5.7 5.0
EV/EBITDA (adj.) 5.3 5.7 5.0
EV/EBIT 15.6 12.9 10.5
P/E (adj.) 18.5 12.1 9.6
P/BV 0.6 0.7 0.6
OpFCF yield 11.9% 2.2% 10.4%
Dividend yield 4.1% 4.6% 5.6%
EPS (adj.) 0.49 0.81 1.02
BVPS 14.32 14.73 15.29
DPS 0.40 0.45 0.55
7.5
8.0
8.5
9.0
9.5
10.0
Sep 15 Oct 15 Nov 15 Dec 15 Jan 16 Feb 16 Mar 16 Apr 16 May 16 Jun 16 Jul 16 Aug 16 Sep 16 Oct 16
vvdsvdvsdy
ATRIA Stoxx Food & Beverage (Rebased)Source: Factset
Shareholders: Itikka osuuskunta 30%; Lihakunta 28%;
Mandatum Life 4%;

Page 29 of 69
Produced & Distributed by the Members of ESN (see last page of this report)
Ebro Foods
Spain/Food & Beverage Analyser
FOOD & BEVERAGE
Ebro Foods (Neutral) Q3 results fell short of forecasts, the acquisition price of Well Beef Ltd very cheap
Good 9m’16 results and 2016 close anticipated
The facts: Ebro Foods released 9m’16 results as well as year-end forecasts.
Our analysis: At the consolidated level, sales increased +1.7% (organic -1.3%)
leaning on the changes to the perimeter (EUR54m). EBITDA +16.7% (+13.7%
organic) despite the +12% rise in advertising. Net profit increased +25.3%.
Per divisions:
Rice: despite the divestment in Puerto Rico sales increased +0.7% leaning
on good quality harvests in Europe and US, allowing stable prices. EBITDA
+15.3%, and EBITDA margin increased +190bp to 15.2% (levels seen in
9m’10).
Pasta: sales +3.4% and EBITDA +18.2% up to EUR112m. EBITDA margins
increased +150bp to 12.4%. Wheat harvests were affected by the rains
(Europe and US) which reduced the amount apt for pasta production, allowing
a small rise in prices (EUR200/tn vs. EUR250/tn.
Net Debt: Reduced by EUR28m vs. 9m’15 (EUR420m).
2016 pre-close: The company expects to end the year with flat consolidated
sales leaning on the change in perimeter (organic -1.8%). EBITDA +8.3%
with margins improving +1pp (13.8% vs. 12.8%). Lastly ND of EUR395m, -
7.3% vs. 2015 despite the various acquisitions during the year (Riso Scotti,
Celnat, Harinas Santa Rita).
Conclusion: Good results. We will revise our forecasts, but at the moment
maintain our Neutral recommendation.
Analyst(s):
Rafael Bonardell, GVC Gaesco Beka
+34 91 436 78 171
Victor Peiro Pérez GVC Gaesco Beka
+34 91 436 7812
Neutral
20.67
closing price as of 26/10/2016
18.50
Target Price unchanged
Recommendation unchanged
Target price: EUR
Share price: EUR
Reuters/Bloomberg EBRO.MC/EBRO SM
Market capitalisation (EURm) 3,180
Current N° of shares (m) 154
Free float 52%
Daily avg. no. trad. sh. 12 mth 365
Daily avg. trad. vol. 12 mth (m) 5,127
Price high 12 mth (EUR) 21.20
Price low 12 mth (EUR) 16.88
Abs. perf. 1 mth 0.19%
Abs. perf. 3 mth -1.69%
Abs. perf. 12 mth 13.14%
Key financials (EUR) 12/15 12/16e 12/17e
Sales (m) 2,462 2,488 2,542
EBITDA (m) 315 317 344
EBITDA margin 12.8% 12.8% 13.5%
EBIT (m) 241 248 273
EBIT margin 9.8% 10.0% 10.7%
Net Profit (adj.)(m) 145 165 183
ROCE 6.2% 6.5% 7.1%
Net debt/(cash) (m) 421 360 288
Net Debt/Equity 0.2 0.2 0.2
Debt/EBITDA 1.3 1.1 0.8
Int. cover(EBITDA/Fin. int) 54.7 58.5 77.1
EV/Sales 1.3 1.4 1.4
EV/EBITDA 10.4 11.3 10.2
EV/EBITDA (adj.) 10.4 11.3 10.2
EV/EBIT 13.6 14.4 12.8
P/E (adj.) 19.3 19.2 17.4
P/BV 1.4 1.8 1.7
OpFCF yield 3.5% 5.4% 5.9%
Dividend yield 3.3% 3.5% 3.7%
EPS (adj.) 0.94 1.07 1.19
BVPS 12.78 11.45 11.87
DPS 0.69 0.72 0.76
Ebro Foods
(EUR m) 9M15 9M16 Y/Y 2016e EBRO 2016e
Sales 1,789.8 1,820.3 1.7% 2,488.0 2,471.2
Rice 951.7 958.5 0.7% 1,282.2
Pasta 877.7 907.3 3.4% 1,243.3
Adjust. -39.6 -45.5 -54.3
Advertising 65.7 73.8 12.3% 104.0
EBITDA 214.4 250.3 16.7% 317.0 340.7
% margin 12.0% 13.7% 1.8 p.p. 13.8%
RIce 126.6 146.0 15.3% 193.4
% margin 13.3% 15.2% 1.9 p.p. 15.1%
Pasta 94.8 112.1 18.2% 157.9
% margin 10.8% 12.4% 1.5 p.p. 12.7%
EBIT 165.1 193.9 17.5% 263.1
% margin 9.2% 10.7% 1.4 p.p. 10.6%
EBT 155.6 195.5 25.6% 259.9
Net profit 101.6 127.3 25.3% 154.0 167.6Source: Ebro Food & GVC Gaesco Beka
15
16
17
18
19
20
21
22
Oct 15 Nov 15 Dec 15 Jan 16 Feb 16 Mar 16 Apr 16 May 16 Jun 16 Jul 16 Aug 16 Sep 16 Oct 16
vvdsvdvsdy
EBRO FOODS Stoxx Food & Beverage (Rebased)Source: Factset
Shareholders: Hernández family 16%; C.F.Alba 10%;
SEPI 10%; DAMM 10%; Trenor family
7%;
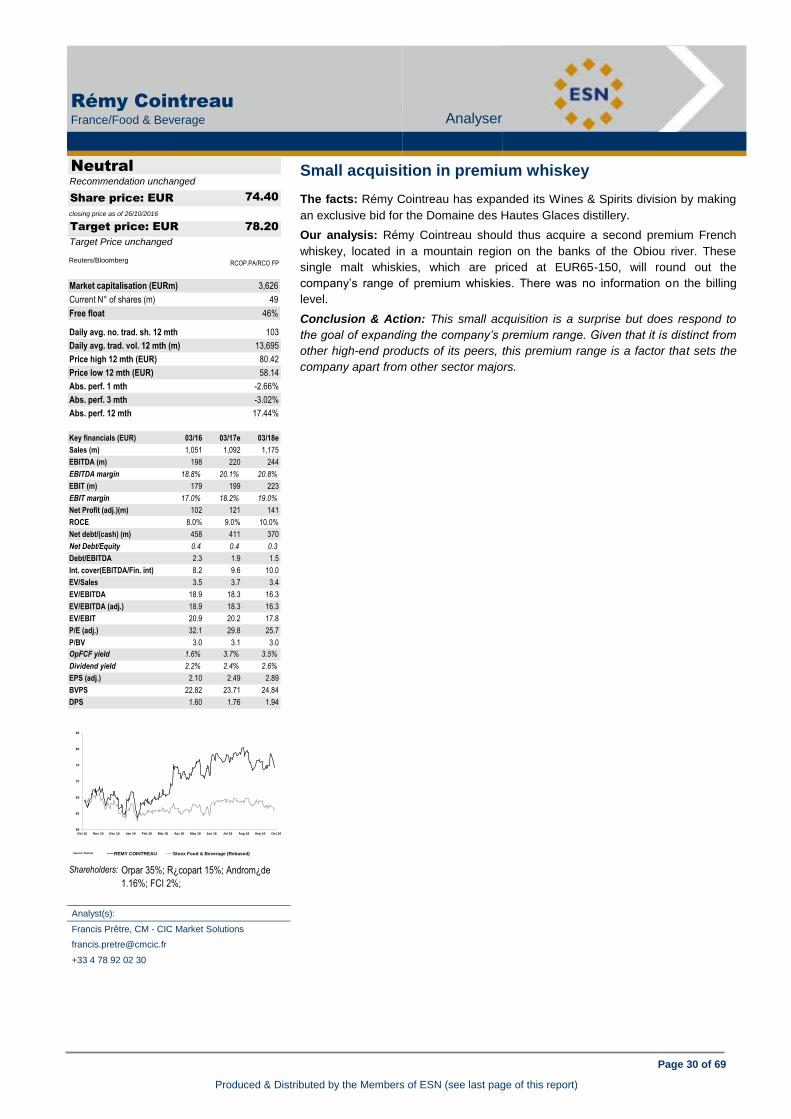
Page 30 of 69
Produced & Distributed by the Members of ESN (see last page of this report)
Rémy Cointreau
France/Food & Beverage Analyser
FOOD & BEVERAGE
Rémy Cointreau (Neutral) Good 9m’16 results and 2016 close anticipated
Small acquisition in premium whiskey
The facts: Rémy Cointreau has expanded its Wines & Spirits division by making
an exclusive bid for the Domaine des Hautes Glaces distillery.
Our analysis: Rémy Cointreau should thus acquire a second premium French
whiskey, located in a mountain region on the banks of the Obiou river. These
single malt whiskies, which are priced at EUR65-150, will round out the
company’s range of premium whiskies. There was no information on the billing
level.
Conclusion & Action: This small acquisition is a surprise but does respond to
the goal of expanding the company’s premium range. Given that it is distinct from
other high-end products of its peers, this premium range is a factor that sets the
company apart from other sector majors.
Analyst(s):
Francis Prêtre, CM - CIC Market Solutions
+33 4 78 92 02 30
Neutral
74.40
closing price as of 26/10/2016
78.20
Target Price unchanged
Recommendation unchanged
Target price: EUR
Share price: EUR
Reuters/Bloomberg RCOP.PA/RCO FP
Market capitalisation (EURm) 3,626
Current N° of shares (m) 49
Free float 46%
Daily avg. no. trad. sh. 12 mth 103
Daily avg. trad. vol. 12 mth (m) 13,695
Price high 12 mth (EUR) 80.42
Price low 12 mth (EUR) 58.14
Abs. perf. 1 mth -2.66%
Abs. perf. 3 mth -3.02%
Abs. perf. 12 mth 17.44%
Key financials (EUR) 03/16 03/17e 03/18e
Sales (m) 1,051 1,092 1,175
EBITDA (m) 198 220 244
EBITDA margin 18.8% 20.1% 20.8%
EBIT (m) 179 199 223
EBIT margin 17.0% 18.2% 19.0%
Net Profit (adj.)(m) 102 121 141
ROCE 8.0% 9.0% 10.0%
Net debt/(cash) (m) 458 411 370
Net Debt/Equity 0.4 0.4 0.3
Debt/EBITDA 2.3 1.9 1.5
Int. cover(EBITDA/Fin. int) 8.2 9.6 10.0
EV/Sales 3.5 3.7 3.4
EV/EBITDA 18.9 18.3 16.3
EV/EBITDA (adj.) 18.9 18.3 16.3
EV/EBIT 20.9 20.2 17.8
P/E (adj.) 32.1 29.8 25.7
P/BV 3.0 3.1 3.0
OpFCF yield 1.6% 3.7% 3.5%
Dividend yield 2.2% 2.4% 2.6%
EPS (adj.) 2.10 2.49 2.89
BVPS 22.82 23.71 24.84
DPS 1.60 1.76 1.94
55
60
65
70
75
80
85
Oct 15 Nov 15 Dec 15 Jan 16 Feb 16 Mar 16 Apr 16 May 16 Jun 16 Jul 16 Aug 16 Sep 16 Oct 16
vvdsvdvsdy
REMY COINTREAU Stoxx Food & Beverage (Rebased)Source: Factset
Shareholders: Orpar 35%; R¿copart 15%; Androm¿de
1.16%; FCI 2%;
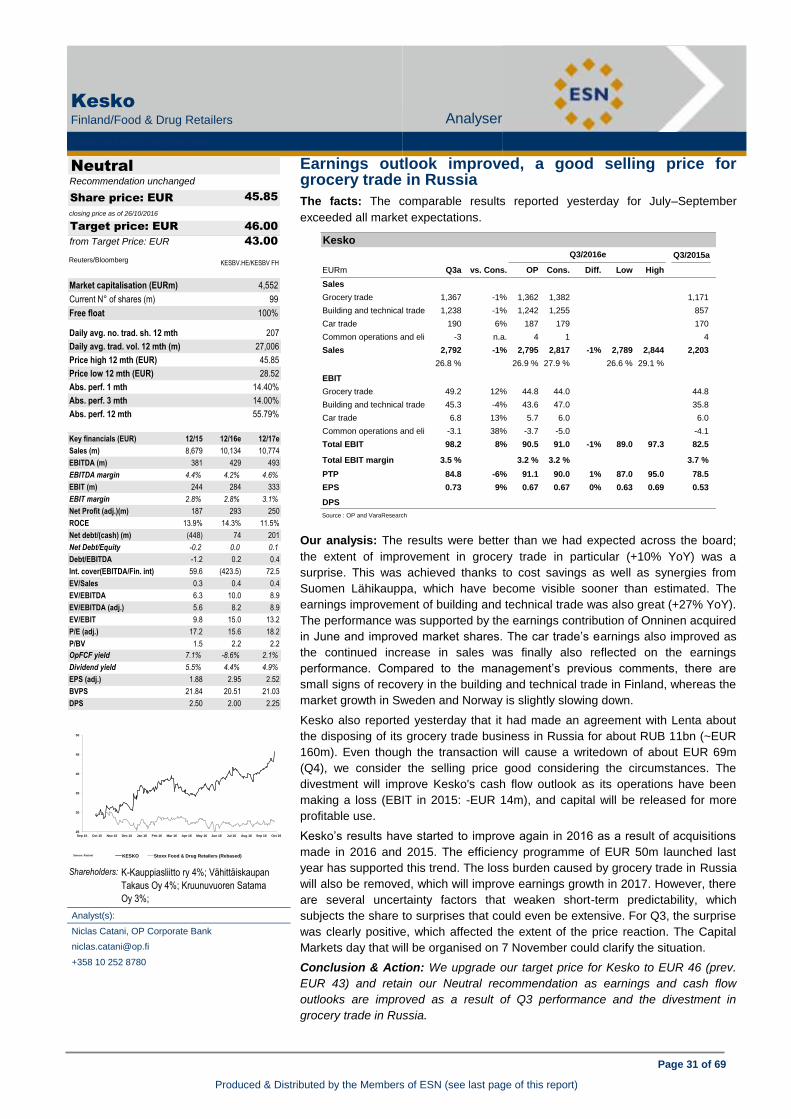
Page 31 of 69
Produced & Distributed by the Members of ESN (see last page of this report)
Kesko
Q3/2015a
EURm Q3a vs. Cons. OP Cons. Diff. Low High
Sales
Grocery trade 1,367 -1% 1,362 1,382 #DIV/0! 1,171
Building and technical trade 1,238 -1% 1,242 1,255 #DIV/0! 857
Car trade 190 6% 187 179 #DIV/0! 170
Common operations and eliminations-3 n.a. 4 1 #DIV/0! 4
Sales 2,792 -1% 2,795 2,817 -1% 2,789 2,844 2,203
26.8 % 26.9 % 27.9 % 26.6 % 29.1 %
EBIT
Grocery trade 49.2 12% 44.8 44.0 #DIV/0! 44.8
Building and technical trade 45.3 -4% 43.6 47.0 #DIV/0! 35.8
Car trade 6.8 13% 5.7 6.0 #DIV/0! 6.0
Common operations and eliminations-3.1 38% -3.7 -5.0 #DIV/0! -4.1
Total EBIT 98.2 8% 90.5 91.0 -1% 89.0 97.3 82.5
Total EBIT margin 3.5 % 3.2 % 3.2 % 3.7 %
PTP 84.8 -6% 91.1 90.0 1% 87.0 95.0 78.5
EPS 0.73 9% 0.67 0.67 0% 0.63 0.69 0.53
DPS
Source : OP and VaraResearch
Q3/2016e
Kesko
Finland/Food & Drug Retailers Analyser
FOOD & DRUG RETAILERS
Kesko (Neutral) Small acquisition in premium whiskey
Earnings outlook improved, a good selling price for grocery trade in Russia
The facts: The comparable results reported yesterday for July–September
exceeded all market expectations.
Our analysis: The results were better than we had expected across the board;
the extent of improvement in grocery trade in particular (+10% YoY) was a
surprise. This was achieved thanks to cost savings as well as synergies from
Suomen Lähikauppa, which have become visible sooner than estimated. The
earnings improvement of building and technical trade was also great (+27% YoY).
The performance was supported by the earnings contribution of Onninen acquired
in June and improved market shares. The car trade’s earnings also improved as
the continued increase in sales was finally also reflected on the earnings
performance. Compared to the management’s previous comments, there are
small signs of recovery in the building and technical trade in Finland, whereas the
market growth in Sweden and Norway is slightly slowing down.
Kesko also reported yesterday that it had made an agreement with Lenta about
the disposing of its grocery trade business in Russia for about RUB 11bn (~EUR
160m). Even though the transaction will cause a writedown of about EUR 69m
(Q4), we consider the selling price good considering the circumstances. The
divestment will improve Kesko's cash flow outlook as its operations have been
making a loss (EBIT in 2015: -EUR 14m), and capital will be released for more
profitable use.
Kesko’s results have started to improve again in 2016 as a result of acquisitions
made in 2016 and 2015. The efficiency programme of EUR 50m launched last
year has supported this trend. The loss burden caused by grocery trade in Russia
will also be removed, which will improve earnings growth in 2017. However, there
are several uncertainty factors that weaken short-term predictability, which
subjects the share to surprises that could even be extensive. For Q3, the surprise
was clearly positive, which affected the extent of the price reaction. The Capital
Markets day that will be organised on 7 November could clarify the situation.
Conclusion & Action: We upgrade our target price for Kesko to EUR 46 (prev.
EUR 43) and retain our Neutral recommendation as earnings and cash flow
outlooks are improved as a result of Q3 performance and the divestment in
grocery trade in Russia.
Analyst(s):
Niclas Catani, OP Corporate Bank
+358 10 252 8780
Neutral
45.85
closing price as of 26/10/2016
46.00
43.00from Target Price: EUR
Recommendation unchanged
Target price: EUR
Share price: EUR
Reuters/Bloomberg KESBV.HE/KESBV FH
Market capitalisation (EURm) 4,552
Current N° of shares (m) 99
Free float 100%
Daily avg. no. trad. sh. 12 mth 207
Daily avg. trad. vol. 12 mth (m) 27,006
Price high 12 mth (EUR) 45.85
Price low 12 mth (EUR) 28.52
Abs. perf. 1 mth 14.40%
Abs. perf. 3 mth 14.00%
Abs. perf. 12 mth 55.79%
Key financials (EUR) 12/15 12/16e 12/17e
Sales (m) 8,679 10,134 10,774
EBITDA (m) 381 429 493
EBITDA margin 4.4% 4.2% 4.6%
EBIT (m) 244 284 333
EBIT margin 2.8% 2.8% 3.1%
Net Profit (adj.)(m) 187 293 250
ROCE 13.9% 14.3% 11.5%
Net debt/(cash) (m) (448) 74 201
Net Debt/Equity -0.2 0.0 0.1
Debt/EBITDA -1.2 0.2 0.4
Int. cover(EBITDA/Fin. int) 59.6 (423.5) 72.5
EV/Sales 0.3 0.4 0.4
EV/EBITDA 6.3 10.0 8.9
EV/EBITDA (adj.) 5.6 8.2 8.9
EV/EBIT 9.8 15.0 13.2
P/E (adj.) 17.2 15.6 18.2
P/BV 1.5 2.2 2.2
OpFCF yield 7.1% -8.6% 2.1%
Dividend yield 5.5% 4.4% 4.9%
EPS (adj.) 1.88 2.95 2.52
BVPS 21.84 20.51 21.03
DPS 2.50 2.00 2.25
25
30
35
40
45
50
Sep 15 Oct 15 Nov 15 Dec 15 Jan 16 Feb 16 Mar 16 Apr 16 May 16 Jun 16 Jul 16 Aug 16 Sep 16 Oct 16
vvdsvdvsdy
KESKO Stoxx Food & Drug Retailers (Rebased)Source: Factset
Shareholders: K-Kauppiasliitto ry 4%; Vähittäiskaupan
Takaus Oy 4%; Kruunuvuoren Satama
Oy 3%;
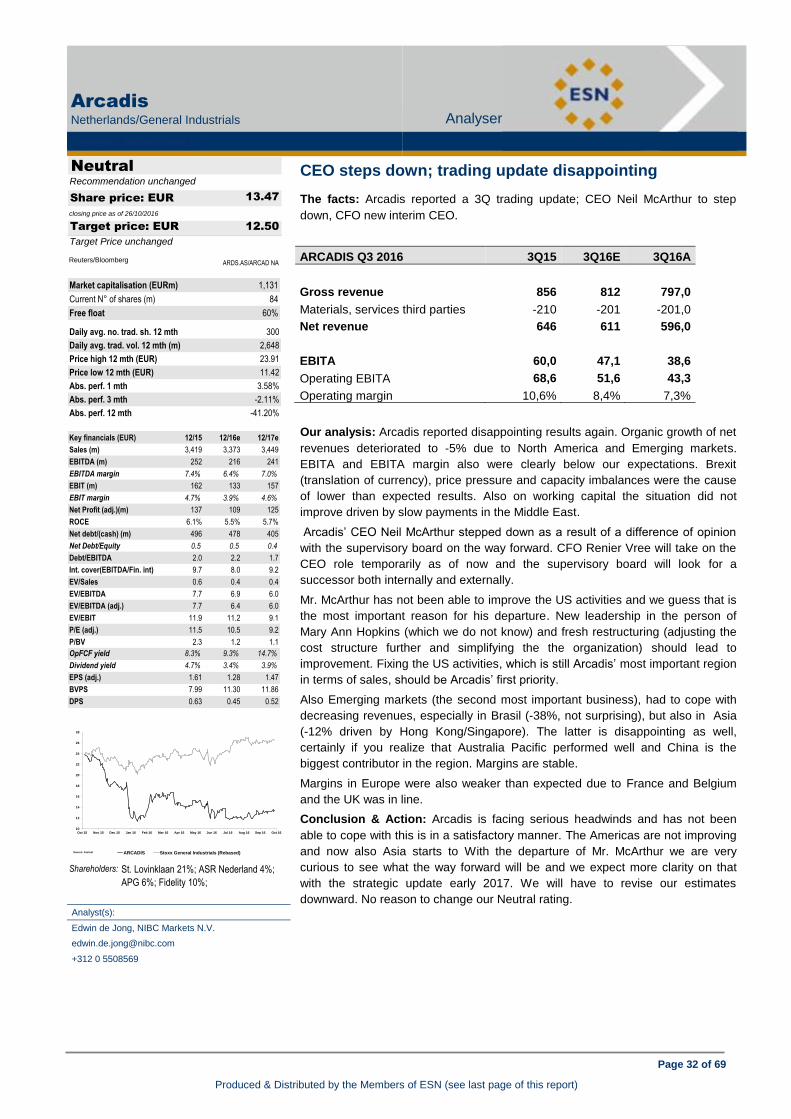
Page 32 of 69
Produced & Distributed by the Members of ESN (see last page of this report)
Arcadis
Netherlands/General Industrials Analyser
GENERAL INDUSTRIALS
Arcadis (Neutral) Earnings outlook improved, a good selling price for grocery trade in Russia
Neutral
13.47
closing price as of 26/10/2016
12.50
Target Price unchanged
Recommendation unchanged
Target price: EUR
Share price: EUR
Reuters/Bloomberg ARDS.AS/ARCAD NA
Market capitalisation (EURm) 1,131
Current N° of shares (m) 84
Free float 60%
Daily avg. no. trad. sh. 12 mth 300
Daily avg. trad. vol. 12 mth (m) 2,648
Price high 12 mth (EUR) 23.91
Price low 12 mth (EUR) 11.42
Abs. perf. 1 mth 3.58%
Abs. perf. 3 mth -2.11%
Abs. perf. 12 mth -41.20%
Key financials (EUR) 12/15 12/16e 12/17e
Sales (m) 3,419 3,373 3,449
EBITDA (m) 252 216 241
EBITDA margin 7.4% 6.4% 7.0%
EBIT (m) 162 133 157
EBIT margin 4.7% 3.9% 4.6%
Net Profit (adj.)(m) 137 109 125
ROCE 6.1% 5.5% 5.7%
Net debt/(cash) (m) 496 478 405
Net Debt/Equity 0.5 0.5 0.4
Debt/EBITDA 2.0 2.2 1.7
Int. cover(EBITDA/Fin. int) 9.7 8.0 9.2
EV/Sales 0.6 0.4 0.4
EV/EBITDA 7.7 6.9 6.0
EV/EBITDA (adj.) 7.7 6.4 6.0
EV/EBIT 11.9 11.2 9.1
P/E (adj.) 11.5 10.5 9.2
P/BV 2.3 1.2 1.1
OpFCF yield 8.3% 9.3% 14.7%
Dividend yield 4.7% 3.4% 3.9%
EPS (adj.) 1.61 1.28 1.47
BVPS 7.99 11.30 11.86
DPS 0.63 0.45 0.52
CEO steps down; trading update disappointing
The facts: Arcadis reported a 3Q trading update; CEO Neil McArthur to step
down, CFO new interim CEO.
ARCADIS Q3 2016 3Q15 3Q16E 3Q16A
Gross revenue 856 812 797,0
Materials, services third parties -210 -201 -201,0
Net revenue 646 611 596,0
EBITA 60,0 47,1 38,6
Operating EBITA 68,6 51,6 43,3
Operating margin 10,6% 8,4% 7,3%
Our analysis: Arcadis reported disappointing results again. Organic growth of net
revenues deteriorated to -5% due to North America and Emerging markets.
EBITA and EBITA margin also were clearly below our expectations. Brexit
(translation of currency), price pressure and capacity imbalances were the cause
of lower than expected results. Also on working capital the situation did not
improve driven by slow payments in the Middle East.
Arcadis’ CEO Neil McArthur stepped down as a result of a difference of opinion
with the supervisory board on the way forward. CFO Renier Vree will take on the
CEO role temporarily as of now and the supervisory board will look for a
successor both internally and externally.
Mr. McArthur has not been able to improve the US activities and we guess that is
the most important reason for his departure. New leadership in the person of
Mary Ann Hopkins (which we do not know) and fresh restructuring (adjusting the
cost structure further and simplifying the the organization) should lead to
improvement. Fixing the US activities, which is still Arcadis’ most important region
in terms of sales, should be Arcadis’ first priority.
Also Emerging markets (the second most important business), had to cope with
decreasing revenues, especially in Brasil (-38%, not surprising), but also in Asia
(-12% driven by Hong Kong/Singapore). The latter is disappointing as well,
certainly if you realize that Australia Pacific performed well and China is the
biggest contributor in the region. Margins are stable.
Margins in Europe were also weaker than expected due to France and Belgium
and the UK was in line.
Conclusion & Action: Arcadis is facing serious headwinds and has not been
able to cope with this is in a satisfactory manner. The Americas are not improving
and now also Asia starts to With the departure of Mr. McArthur we are very
curious to see what the way forward will be and we expect more clarity on that
with the strategic update early 2017. We will have to revise our estimates
downward. No reason to change our Neutral rating.
10
12
14
16
18
20
22
24
26
28
Oct 15 Nov 15 Dec 15 Jan 16 Feb 16 Mar 16 Apr 16 May 16 Jun 16 Jul 16 Aug 16 Sep 16 Oct 16
vvdsvdvsdy
ARCADIS Stoxx General Industrials (Rebased)Source: Factset Shareholders: St. Lovinklaan 21%; ASR Nederland 4%;
APG 6%; Fidelity 10%;
Analyst(s):
Edwin de Jong, NIBC Markets N.V.
+312 0 5508569
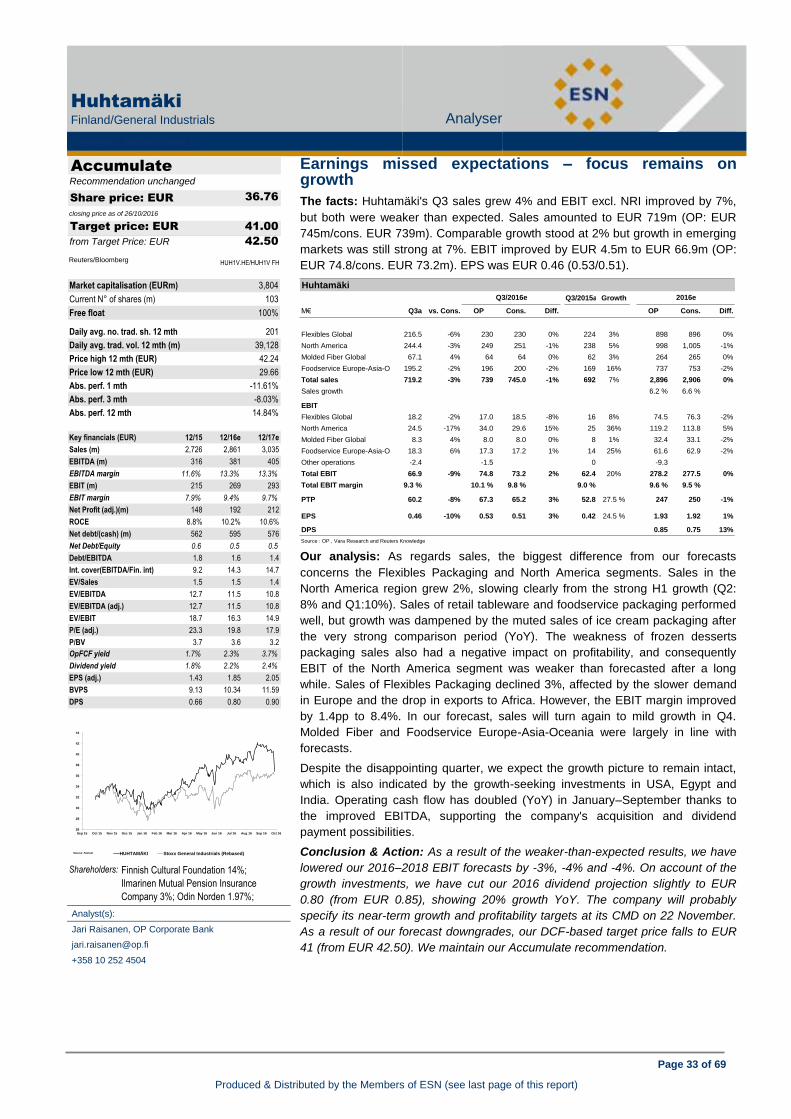
Page 33 of 69
Produced & Distributed by the Members of ESN (see last page of this report)
Huhtamäki
Q3/2015a Growth
M€ Q3a vs. Cons. OP Cons. Diff. OP Cons. Diff.
Flexibles Global 216.5 -6% 230 230 0% 224 3% 898 896 0%
North America 244.4 -3% 249 251 -1% 238 5% 998 1,005 -1%
Molded Fiber Global 67.1 4% 64 64 0% 62 3% 264 265 0%
Foodservice Europe-Asia-Oceania195.2 -2% 196 200 -2% 169 16% 737 753 -2%
Total sales 719.2 -3% 739 745.0 -1% 692 7% 2,896 2,906 0%
Sales growth 6.2 % 6.6 %
EBIT
Flexibles Global 18.2 -2% 17.0 18.5 -8% 16 8% 74.5 76.3 -2%
North America 24.5 -17% 34.0 29.6 15% 25 36% 119.2 113.8 5%
Molded Fiber Global 8.3 4% 8.0 8.0 0% 8 1% 32.4 33.1 -2%
Foodservice Europe-Asia-Oceania18.3 6% 17.3 17.2 1% 14 25% 61.6 62.9 -2%
Other operations -2.4 #DIV/0! -1.5 #DIV/0! 0 #DIV/0! -9.3 #DIV/0!
Total EBIT 66.9 -9% 74.8 73.2 2% 62.4 20% 278.2 277.5 0%
Total EBIT margin 9.3 % 10.1 % 9.8 % 9.0 % 9.6 % 9.5 %#DIV/0!
PTP 60.2 -8% 67.3 65.2 3% 52.8 27.5 % 247 250 -1%
EPS 0.46 -10% 0.53 0.51 3% 0.42 24.5 % 1.93 1.92 1%#DIV/0!
DPS #DIV/0! 0.85 0.75 13%
Source : OP , Vara Research and Reuters Knowledge
Q3/2016e 2016e
Huhtamäki
Finland/General Industrials Analyser
GENERAL INDUSTRIALS
Huhtamäki (Accumulate) CEO steps down; trading update disappointing
Earnings missed expectations – focus remains on growth
The facts: Huhtamäki's Q3 sales grew 4% and EBIT excl. NRI improved by 7%,
but both were weaker than expected. Sales amounted to EUR 719m (OP: EUR
745m/cons. EUR 739m). Comparable growth stood at 2% but growth in emerging
markets was still strong at 7%. EBIT improved by EUR 4.5m to EUR 66.9m (OP:
EUR 74.8/cons. EUR 73.2m). EPS was EUR 0.46 (0.53/0.51).
Our analysis: As regards sales, the biggest difference from our forecasts
concerns the Flexibles Packaging and North America segments. Sales in the
North America region grew 2%, slowing clearly from the strong H1 growth (Q2:
8% and Q1:10%). Sales of retail tableware and foodservice packaging performed
well, but growth was dampened by the muted sales of ice cream packaging after
the very strong comparison period (YoY). The weakness of frozen desserts
packaging sales also had a negative impact on profitability, and consequently
EBIT of the North America segment was weaker than forecasted after a long
while. Sales of Flexibles Packaging declined 3%, affected by the slower demand
in Europe and the drop in exports to Africa. However, the EBIT margin improved
by 1.4pp to 8.4%. In our forecast, sales will turn again to mild growth in Q4.
Molded Fiber and Foodservice Europe-Asia-Oceania were largely in line with
forecasts.
Despite the disappointing quarter, we expect the growth picture to remain intact,
which is also indicated by the growth-seeking investments in USA, Egypt and
India. Operating cash flow has doubled (YoY) in January–September thanks to
the improved EBITDA, supporting the company's acquisition and dividend
payment possibilities.
Conclusion & Action: As a result of the weaker-than-expected results, we have
lowered our 2016–2018 EBIT forecasts by -3%, -4% and -4%. On account of the
growth investments, we have cut our 2016 dividend projection slightly to EUR
0.80 (from EUR 0.85), showing 20% growth YoY. The company will probably
specify its near-term growth and profitability targets at its CMD on 22 November.
As a result of our forecast downgrades, our DCF-based target price falls to EUR
41 (from EUR 42.50). We maintain our Accumulate recommendation.
Analyst(s):
Jari Raisanen, OP Corporate Bank
+358 10 252 4504
Accumulate
36.76
closing price as of 26/10/2016
41.00
42.50from Target Price: EUR
Recommendation unchanged
Target price: EUR
Share price: EUR
Reuters/Bloomberg HUH1V.HE/HUH1V FH
Market capitalisation (EURm) 3,804
Current N° of shares (m) 103
Free float 100%
Daily avg. no. trad. sh. 12 mth 201
Daily avg. trad. vol. 12 mth (m) 39,128
Price high 12 mth (EUR) 42.24
Price low 12 mth (EUR) 29.66
Abs. perf. 1 mth -11.61%
Abs. perf. 3 mth -8.03%
Abs. perf. 12 mth 14.84%
Key financials (EUR) 12/15 12/16e 12/17e
Sales (m) 2,726 2,861 3,035
EBITDA (m) 316 381 405
EBITDA margin 11.6% 13.3% 13.3%
EBIT (m) 215 269 293
EBIT margin 7.9% 9.4% 9.7%
Net Profit (adj.)(m) 148 192 212
ROCE 8.8% 10.2% 10.6%
Net debt/(cash) (m) 562 595 576
Net Debt/Equity 0.6 0.5 0.5
Debt/EBITDA 1.8 1.6 1.4
Int. cover(EBITDA/Fin. int) 9.2 14.3 14.7
EV/Sales 1.5 1.5 1.4
EV/EBITDA 12.7 11.5 10.8
EV/EBITDA (adj.) 12.7 11.5 10.8
EV/EBIT 18.7 16.3 14.9
P/E (adj.) 23.3 19.8 17.9
P/BV 3.7 3.6 3.2
OpFCF yield 1.7% 2.3% 3.7%
Dividend yield 1.8% 2.2% 2.4%
EPS (adj.) 1.43 1.85 2.05
BVPS 9.13 10.34 11.59
DPS 0.66 0.80 0.90
26
28
30
32
34
36
38
40
42
44
Sep 15 Oct 15 Nov 15 Dec 15 Jan 16 Feb 16 Mar 16 Apr 16 May 16 Jun 16 Jul 16 Aug 16 Sep 16 Oct 16
vvdsvdvsdy
HUHTAMÄKI Stoxx General Industrials (Rebased)Source: Factset
Shareholders: Finnish Cultural Foundation 14%;
Ilmarinen Mutual Pension Insurance
Company 3%; Odin Norden 1.97%;
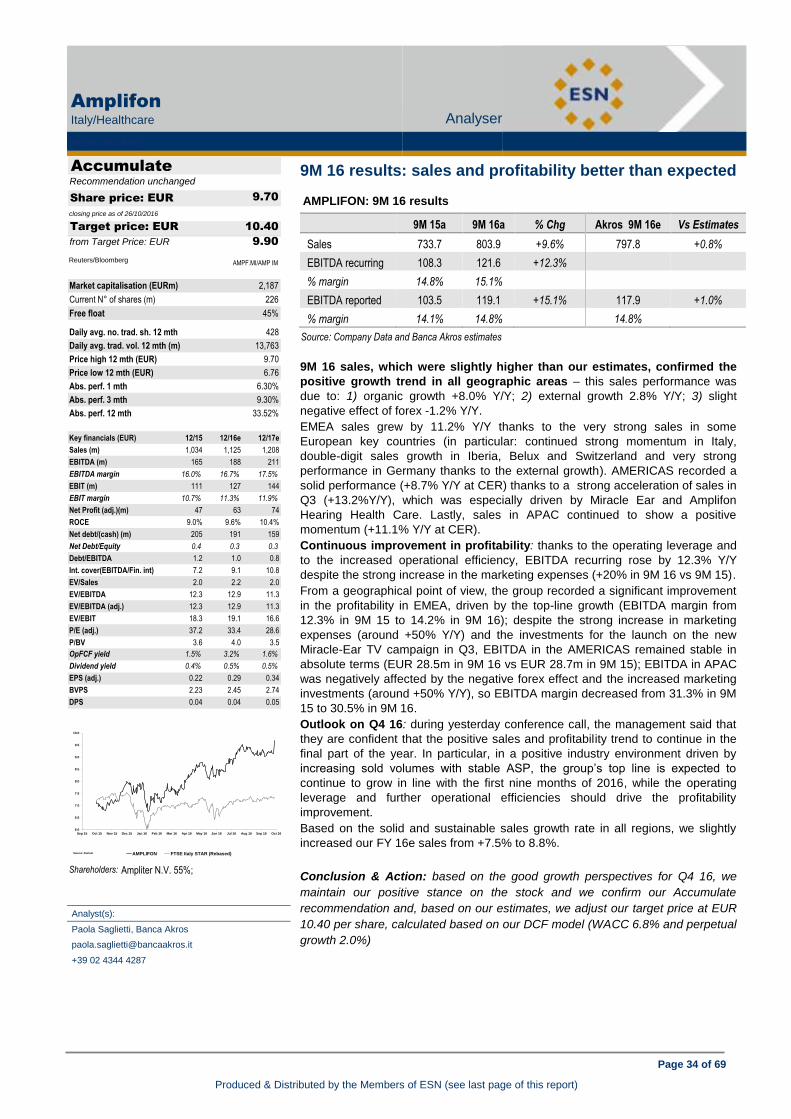
Page 34 of 69
Produced & Distributed by the Members of ESN (see last page of this report)
Amplifon
Italy/Healthcare Analyser
HEALTHCARE
Amplifon (Accumulate) Earnings missed expectations – focus remains on growth
9M 16 results: sales and profitability better than expected
AMPLIFON: 9M 16 results
9M 15a 9M 16a % Chg Akros 9M 16e Vs Estimates
Sales 733.7 803.9 +9.6% 797.8 +0.8%
EBITDA recurring 108.3 121.6 +12.3%
% margin 14.8% 15.1%
EBITDA reported 103.5 119.1 +15.1% 117.9 +1.0%
% margin 14.1% 14.8% 14.8%
Source: Company Data and Banca Akros estimates
9M 16 sales, which were slightly higher than our estimates, confirmed the
positive growth trend in all geographic areas – this sales performance was
due to: 1) organic growth +8.0% Y/Y; 2) external growth 2.8% Y/Y; 3) slight
negative effect of forex -1.2% Y/Y.
EMEA sales grew by 11.2% Y/Y thanks to the very strong sales in some
European key countries (in particular: continued strong momentum in Italy,
double-digit sales growth in Iberia, Belux and Switzerland and very strong
performance in Germany thanks to the external growth). AMERICAS recorded a
solid performance (+8.7% Y/Y at CER) thanks to a strong acceleration of sales in
Q3 (+13.2%Y/Y), which was especially driven by Miracle Ear and Amplifon
Hearing Health Care. Lastly, sales in APAC continued to show a positive
momentum (+11.1% Y/Y at CER).
Continuous improvement in profitability: thanks to the operating leverage and
to the increased operational efficiency, EBITDA recurring rose by 12.3% Y/Y
despite the strong increase in the marketing expenses (+20% in 9M 16 vs 9M 15).
From a geographical point of view, the group recorded a significant improvement
in the profitability in EMEA, driven by the top-line growth (EBITDA margin from
12.3% in 9M 15 to 14.2% in 9M 16); despite the strong increase in marketing
expenses (around +50% Y/Y) and the investments for the launch on the new
Miracle-Ear TV campaign in Q3, EBITDA in the AMERICAS remained stable in
absolute terms (EUR 28.5m in 9M 16 vs EUR 28.7m in 9M 15); EBITDA in APAC
was negatively affected by the negative forex effect and the increased marketing
investments (around +50% Y/Y), so EBITDA margin decreased from 31.3% in 9M
15 to 30.5% in 9M 16.
Outlook on Q4 16: during yesterday conference call, the management said that
they are confident that the positive sales and profitability trend to continue in the
final part of the year. In particular, in a positive industry environment driven by
increasing sold volumes with stable ASP, the group’s top line is expected to
continue to grow in line with the first nine months of 2016, while the operating
leverage and further operational efficiencies should drive the profitability
improvement.
Based on the solid and sustainable sales growth rate in all regions, we slightly
increased our FY 16e sales from +7.5% to 8.8%.
Conclusion & Action: based on the good growth perspectives for Q4 16, we
maintain our positive stance on the stock and we confirm our Accumulate
recommendation and, based on our estimates, we adjust our target price at EUR
10.40 per share, calculated based on our DCF model (WACC 6.8% and perpetual
growth 2.0%)
Analyst(s):
Paola Saglietti, Banca Akros
+39 02 4344 4287
Accumulate
9.70
closing price as of 26/10/2016
10.40
9.90from Target Price: EUR
Recommendation unchanged
Target price: EUR
Share price: EUR
Reuters/Bloomberg AMPF.MI/AMP IM
Market capitalisation (EURm) 2,187
Current N° of shares (m) 226
Free float 45%
Daily avg. no. trad. sh. 12 mth 428
Daily avg. trad. vol. 12 mth (m) 13,763
Price high 12 mth (EUR) 9.70
Price low 12 mth (EUR) 6.76
Abs. perf. 1 mth 6.30%
Abs. perf. 3 mth 9.30%
Abs. perf. 12 mth 33.52%
Key financials (EUR) 12/15 12/16e 12/17e
Sales (m) 1,034 1,125 1,208
EBITDA (m) 165 188 211
EBITDA margin 16.0% 16.7% 17.5%
EBIT (m) 111 127 144
EBIT margin 10.7% 11.3% 11.9%
Net Profit (adj.)(m) 47 63 74
ROCE 9.0% 9.6% 10.4%
Net debt/(cash) (m) 205 191 159
Net Debt/Equity 0.4 0.3 0.3
Debt/EBITDA 1.2 1.0 0.8
Int. cover(EBITDA/Fin. int) 7.2 9.1 10.8
EV/Sales 2.0 2.2 2.0
EV/EBITDA 12.3 12.9 11.3
EV/EBITDA (adj.) 12.3 12.9 11.3
EV/EBIT 18.3 19.1 16.6
P/E (adj.) 37.2 33.4 28.6
P/BV 3.6 4.0 3.5
OpFCF yield 1.5% 3.2% 1.6%
Dividend yield 0.4% 0.5% 0.5%
EPS (adj.) 0.22 0.29 0.34
BVPS 2.23 2.45 2.74
DPS 0.04 0.04 0.05
6.0
6.5
7.0
7.5
8.0
8.5
9.0
9.5
10.0
Sep 15 Oct 15 Nov 15 Dec 15 Jan 16 Feb 16 Mar 16 Apr 16 May 16 Jun 16 Jul 16 Aug 16 Sep 16 Oct 16
vvdsvdvsdy
AMPLIFON FTSE Italy STAR (Rebased)Source: Factset
Shareholders: Ampliter N.V. 55%;

Page 35 of 69
Produced & Distributed by the Members of ESN (see last page of this report)
Recordati
Italy/Healthcare Analyser
HEALTHCARE
Recordati (Accumulate) 9M 16 results: sales and profitability better than expected
9M 16 results preview
The facts: 9M 16 results are due out today (Conference call at 4:00 pm CET).
Our analysis: as in H1 16, we expect a positive sales growth trend in Q3 16
thanks to the continuous positive performance of core products and rare diseases
division and to the contribution of Italchimici acquired at the end of May.
We forecast 9M 16 profitability to benefit from the expected positive sales trend.
The following table shows our sales and profitability forecast.
RECORDATI: 9M 16e preview
9M 15a 9M 16e %Chg. FY 16 guidance
Sales 784.4 852.8 +8.7% ~ 1,140 m
EBIT 213.0 243.5 +14.3% ~ 325 m
EBIT margin 27.2% 28.6% ~ 28.5%
Source: Company Data and BANCA AKROS estimates
Conclusion & Action: we confirm our Accumulate recommendation and our
target price of EUR 31.10 per share.
Analyst(s):
Paola Saglietti, Banca Akros
+39 02 4344 4287
Accumulate
26.60
closing price as of 26/10/2016
31.10
Target Price unchanged
Recommendation unchanged
Target price: EUR
Share price: EUR
Reuters/Bloomberg RECI.MI/REC IM
Market capitalisation (EURm) 5,563
Current N° of shares (m) 209
Free float 44%
Daily avg. no. trad. sh. 12 mth 380
Daily avg. trad. vol. 12 mth (m) 14,401
Price high 12 mth (EUR) 29.36
Price low 12 mth (EUR) 19.43
Abs. perf. 1 mth -6.44%
Abs. perf. 3 mth -8.18%
Abs. perf. 12 mth 25.06%
Key financials (EUR) 12/15 12/16e 12/17e
Sales (m) 1,048 1,139 1,218
EBITDA (m) 317 364 395
EBITDA margin 30.3% 31.9% 32.4%
EBIT (m) 278 323 346
EBIT margin 26.6% 28.4% 28.4%
Net Profit (adj.)(m) 199 230 246
ROCE 18.7% 18.8% 19.8%
Net debt/(cash) (m) 89 130 27
Net Debt/Equity 0.1 0.1 0.0
Debt/EBITDA 0.3 0.4 0.1
Int. cover(EBITDA/Fin. int) 24.2 23.2 23.5
EV/Sales 5.0 5.1 4.6
EV/EBITDA 16.4 15.8 14.3
EV/EBITDA (adj.) 16.4 15.8 14.3
EV/EBIT 18.7 17.8 16.4
P/E (adj.) 25.3 24.2 22.6
P/BV 5.8 5.7 5.1
OpFCF yield 4.2% 1.5% 4.2%
Dividend yield 2.3% 2.4% 2.4%
EPS (adj.) 0.95 1.10 1.18
BVPS 4.16 4.66 5.20
DPS 0.60 0.63 0.65
14
16
18
20
22
24
26
28
30
Sep 15 Oct 15 Nov 15 Dec 15 Jan 16 Feb 16 Mar 16 Apr 16 May 16 Jun 16 Jul 16 Aug 16 Sep 16 Oct 16
vvdsvdvsdy
RECORDATI FTSE Italy All Share (Rebased)Source: Factset
Shareholders: Recordati Family 56%;
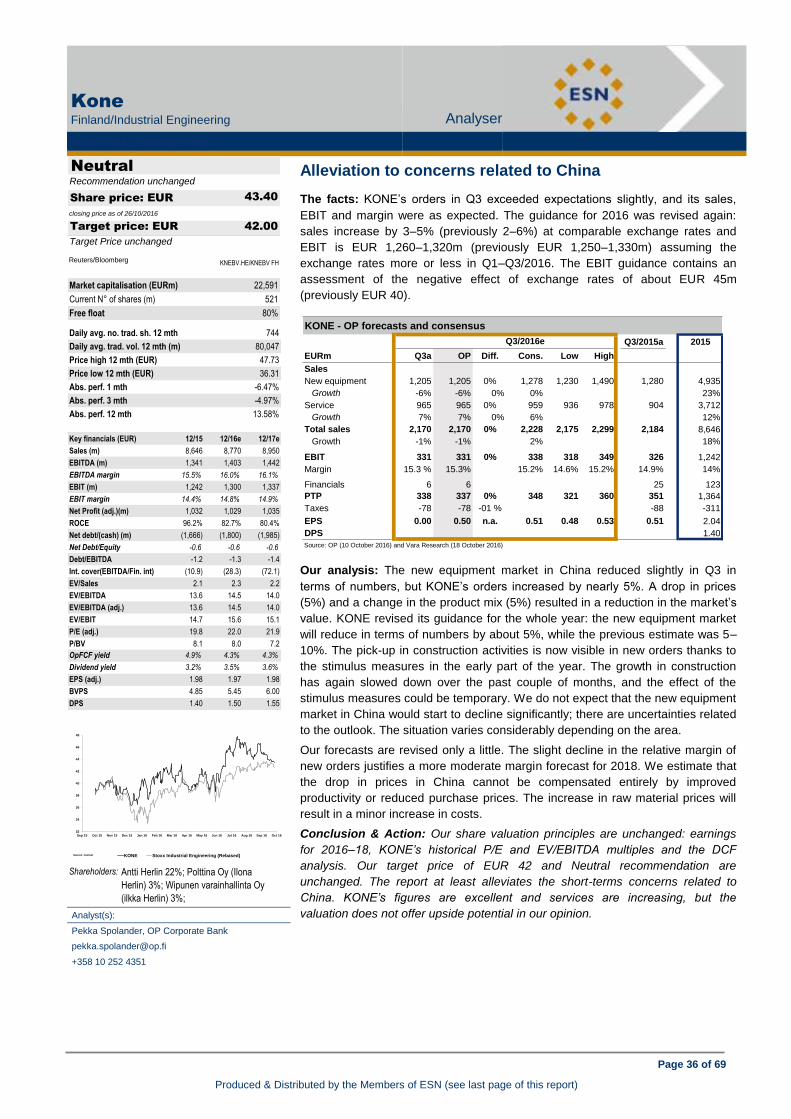
Page 36 of 69
Produced & Distributed by the Members of ESN (see last page of this report)
KONE - OP forecasts and consensus
Q3/2015a 2015
EURm Q3a OP Diff. Cons. Low High
Sales
New equipment 1,205 1,205 0% 1,278 1,230 1,490 1,280 4,935
Growth -6% -6% 0% 0% 23%
Service 965 965 0% 959 936 978 904 3,712
Growth 7% 7% 0% 6% 12%
Total sales 2,170 2,170 0% 2,228 2,175 2,299 2,184 8,646
Growth -1% -1% 2% 18%
EBIT 331 331 0% 338 318 349 326 1,242
Margin 15.3 % 15.3% 15.2% 14.6% 15.2% 14.9% 14%
Financials 6 6 0% 25 123
PTP 338 337 0% 348 321 360 351 1,364
Taxes -78 -78 -01 % -88 -311
EPS 0.00 0.50 n.a. 0.51 0.48 0.53 0.51 2.04
DPS 0.00 1.40
Source: OP (10 October 2016) and Vara Research (18 October 2016)
Q3/2016e
Kone
Finland/Industrial Engineering Analyser
INDUSTRIAL ENGINEERING
Kone (Neutral) 9M 16 results preview
Alleviation to concerns related to China
The facts: KONE’s orders in Q3 exceeded expectations slightly, and its sales,
EBIT and margin were as expected. The guidance for 2016 was revised again:
sales increase by 3–5% (previously 2–6%) at comparable exchange rates and
EBIT is EUR 1,260–1,320m (previously EUR 1,250–1,330m) assuming the
exchange rates more or less in Q1–Q3/2016. The EBIT guidance contains an
assessment of the negative effect of exchange rates of about EUR 45m
(previously EUR 40).
Our analysis: The new equipment market in China reduced slightly in Q3 in
terms of numbers, but KONE’s orders increased by nearly 5%. A drop in prices
(5%) and a change in the product mix (5%) resulted in a reduction in the market’s
value. KONE revised its guidance for the whole year: the new equipment market
will reduce in terms of numbers by about 5%, while the previous estimate was 5–
10%. The pick-up in construction activities is now visible in new orders thanks to
the stimulus measures in the early part of the year. The growth in construction
has again slowed down over the past couple of months, and the effect of the
stimulus measures could be temporary. We do not expect that the new equipment
market in China would start to decline significantly; there are uncertainties related
to the outlook. The situation varies considerably depending on the area.
Our forecasts are revised only a little. The slight decline in the relative margin of
new orders justifies a more moderate margin forecast for 2018. We estimate that
the drop in prices in China cannot be compensated entirely by improved
productivity or reduced purchase prices. The increase in raw material prices will
result in a minor increase in costs.
Conclusion & Action: Our share valuation principles are unchanged: earnings
for 2016–18, KONE’s historical P/E and EV/EBITDA multiples and the DCF
analysis. Our target price of EUR 42 and Neutral recommendation are
unchanged. The report at least alleviates the short-terms concerns related to
China. KONE’s figures are excellent and services are increasing, but the
valuation does not offer upside potential in our opinion.
Analyst(s):
Pekka Spolander, OP Corporate Bank
+358 10 252 4351
Neutral
43.40
closing price as of 26/10/2016
42.00
Target Price unchanged
Recommendation unchanged
Target price: EUR
Share price: EUR
Reuters/Bloomberg KNEBV.HE/KNEBV FH
Market capitalisation (EURm) 22,591
Current N° of shares (m) 521
Free float 80%
Daily avg. no. trad. sh. 12 mth 744
Daily avg. trad. vol. 12 mth (m) 80,047
Price high 12 mth (EUR) 47.73
Price low 12 mth (EUR) 36.31
Abs. perf. 1 mth -6.47%
Abs. perf. 3 mth -4.97%
Abs. perf. 12 mth 13.58%
Key financials (EUR) 12/15 12/16e 12/17e
Sales (m) 8,646 8,770 8,950
EBITDA (m) 1,341 1,403 1,442
EBITDA margin 15.5% 16.0% 16.1%
EBIT (m) 1,242 1,300 1,337
EBIT margin 14.4% 14.8% 14.9%
Net Profit (adj.)(m) 1,032 1,029 1,035
ROCE 96.2% 82.7% 80.4%
Net debt/(cash) (m) (1,666) (1,800) (1,985)
Net Debt/Equity -0.6 -0.6 -0.6
Debt/EBITDA -1.2 -1.3 -1.4
Int. cover(EBITDA/Fin. int) (10.9) (28.3) (72.1)
EV/Sales 2.1 2.3 2.2
EV/EBITDA 13.6 14.5 14.0
EV/EBITDA (adj.) 13.6 14.5 14.0
EV/EBIT 14.7 15.6 15.1
P/E (adj.) 19.8 22.0 21.9
P/BV 8.1 8.0 7.2
OpFCF yield 4.9% 4.3% 4.3%
Dividend yield 3.2% 3.5% 3.6%
EPS (adj.) 1.98 1.97 1.98
BVPS 4.85 5.45 6.00
DPS 1.40 1.50 1.55
32
34
36
38
40
42
44
46
48
Sep 15 Oct 15 Nov 15 Dec 15 Jan 16 Feb 16 Mar 16 Apr 16 May 16 Jun 16 Jul 16 Aug 16 Sep 16 Oct 16
vvdsvdvsdy
KONE Stoxx Industrial Engineering (Rebased)Source: Factset
Shareholders: Antti Herlin 22%; Polttina Oy (Ilona
Herlin) 3%; Wipunen varainhallinta Oy
(ilkka Herlin) 3%;

Page 37 of 69
Produced & Distributed by the Members of ESN (see last page of this report)
Konecranes - OP and consensus estimates
Q3/2015a 2015
EURm Q3a OP Diff. Cons. Low High
Total sales 518 511 1% 509 502 514 507 2,126
Growth 2% 1% 0% 2% 6%
Total EBIT excl. NRI 37.9 39 -2% 38 35 41 33 118
Margin 7.3 % 7.5% 0.0% 7.5% 6.6% 5.5%
Total EBIT 25.0 41 -38% 36 33 39 4 63
Margin 4.8% 7.9 % 7.1 % 0.8% 3.0%
Financials (net) -4 -2 -80,0 % -2 -7
PTP 21.3 39 -45% 36 30 48 2 56
Taxes -5.4 -12 -1 -25
EPS 0.27 0.45 -41% 0.41 0.36 0.53 0.02 0.52
EPS excl. NRI 0.35 0.43 -19% 0.43 0.37 0.53 0.37 1.29
DPS 1.05
Source: OP (10 October 2016) and Vara Research (19 October 2016)
Q3/2016e
Konecranes
Finland/Industrial Engineering Analyser
INDUSTRIAL ENGINEERING
Konecranes (Neutral) Alleviation to concerns related to China
Weak orders, savings advancing
The facts: Q3 sales and EBIT matched expectations, but orders were somewhat
lower than forecasted. Profitability of Equipment improved when the impact of
cost savings started to show. Guidance was reiterated: sales approximately at the
2015 level, adjusted EBIT expected to improve.
Our analysis: Overall, demand has remained rather stable, and the comments on
the outlook remained intact. Customers are cautious when making decisions on
big projects, and the order for delivering automated loading cranes to the US for
over EUR 200m announced by Konecranes is an exception.
The savings arising from efficiency programmes amounted to around EUR 22 in
January–September. Konecranes estimates that savings will exceed EUR 25–
30m (running rate) at the end of 2016.
Our forecasts include the Terex MHPS business from 2017 onwards and STAHL
will be excluded at the same time. Our estimates of the acquired business are
cautious and indicative because Terex has not reported the figures for equipment
and services separately. The divestment of the highly profitable STAHL weighs on
the profitability of Konecranes' equipment but will make financing the acquisition
considerably lighter.
Conclusion & Action: Our valuation principles are unchanged: 2017–2019
earnings, the sector’s long-term multiples (P/E and EV/EBITDA) and our DCF
model. Thus, our analysis does not include 2016. We have revised our forecasts
for Konecranes only slightly and will adjust our forecasts for Terex MHPS when
Terex publishes its Q3 report on 1 November. We also maintain our target price
of EUR 30 and our Neutral recommendation. The transaction offers Konecranes
significant potential which the share price already greatly reflects. On our 2017–
18 forecasts we do not find the valuation attractive enough relative to the
uncertainties.
Analyst(s):
Pekka Spolander, OP Corporate Bank
+358 10 252 4351
Neutral
30.64
closing price as of 26/10/2016
30.00
Target Price unchanged
Recommendation unchanged
Target price: EUR
Share price: EUR
Reuters/Bloomberg KCR1V.HE/KCR1V FH
Market capitalisation (EURm) 1,845
Current N° of shares (m) 60
Free float 89%
Daily avg. no. trad. sh. 12 mth 209
Daily avg. trad. vol. 12 mth (m) 5,765
Price high 12 mth (EUR) 32.25
Price low 12 mth (EUR) 18.13
Abs. perf. 1 mth -0.10%
Abs. perf. 3 mth 16.63%
Abs. perf. 12 mth 24.81%
Key financials (EUR) 12/15 12/16e 12/17e
Sales (m) 2,126 2,115 3,270
EBITDA (m) 117 167 274
EBITDA margin 5.5% 7.9% 8.4%
EBIT (m) 63 109 164
EBIT margin 3.0% 5.2% 5.0%
Net Profit (adj.)(m) 62 86 112
ROCE 11.3% 14.1% 7.4%
Net debt/(cash) (m) 203 158 690
Net Debt/Equity 0.4 0.3 0.6
Debt/EBITDA 1.7 0.9 2.5
Int. cover(EBITDA/Fin. int) 15.8 10.0 5.7
EV/Sales 0.7 0.9 0.9
EV/EBITDA 13.1 11.7 11.3
EV/EBITDA (adj.) 8.9 9.9 9.7
EV/EBIT 24.3 17.9 18.8
P/E (adj.) 22.6 21.7 22.0
P/BV 3.1 4.1 2.3
OpFCF yield 2.6% 4.2% -42.5%
Dividend yield 3.4% 2.6% 2.6%
EPS (adj.) 1.01 1.41 1.39
BVPS 7.49 7.47 13.53
DPS 1.05 0.80 0.80
18
20
22
24
26
28
30
32
34
Sep 15 Oct 15 Nov 15 Dec 15 Jan 16 Feb 16 Mar 16 Apr 16 May 16 Jun 16 Jul 16 Aug 16 Sep 16 Oct 16
vvdsvdvsdy
KONECRANES Stoxx Industrial Engineering (Rebased)Source: Factset
Shareholders: HTT KCR Holding Oy Ab 11%; Stig
Gustavson and family 3%; Varma Mutual
Pension Insurance Company 1.90%;

Page 38 of 69
Produced & Distributed by the Members of ESN (see last page of this report)
Banca Mediolanum
Italy/Insurance Analyser
INSURANCE
Banca Mediolanum (Accumulate) Weak orders, savings advancing
ECB against Fininvest’s significant stake in BMED
The facts: According to Reuters and as anticipated by Milano Finanza some days
ago, the ECB took position against Fininvest’s ownership of a significant stake in
Banca Mediolanum.
Our analysis: We remind readers that, in October 2014, the Bank of Italy ordered
Fininvest, Berlusconi Family’s holding which owns c. 30% in Mediolanum, to sell a
stake of just over 20 percent because Mr Berlusconi was no longer considered fit
to own more than 10 percent of a financial company after being convicted for tax
fraud. However, an Italian appeals court later ruled in favour of Fininvest's request
to cancel the forced sale.
Conclusion & Action: this could be negative news, which the market already
priced in yesterday. Fininvest is likely to reject the ECB stance and it would act to
protect its interests like in the past. That said, the overhang risk could increase
again and the uncertainty weigh on the stock. Anyway, like in the previous
litigation, we believe the 20% is unlikely to be placed on the market. In the past,
we remind readers that Mr Ennio Doris confirmed he could consider buying a few
percentage points (up to a maximum of 5%) of the stake to be potentially
disposed of by Fininvest. Doris’ Family stake is actually around 40%. However,
we deem that the stake could be sold through a private placement, with a limited
impact on the share price.
Analyst(s):
Enrico Esposti, CIIA, Banca Akros
+39 02 4344 4022
Accumulate
6.31
closing price as of 26/10/2016
7.20
Target Price unchanged
Recommendation unchanged
Target price: EUR
Share price: EUR
Reuters/Bloomberg BMED.MI/BMED IM
Market capitalisation (EURm) 4,642
Current N° of shares (m) 736
Free float 30%
Daily avg. no. trad. sh. 12 mth 1,499
Daily avg. trad. vol. 12 mth (m) 7,047
Price high 12 mth (EUR) 7.91
Price low 12 mth (EUR) 5.32
Abs. perf. 1 mth 9.55%
Abs. perf. 3 mth -1.41%
Abs. perf. 12 mth -13.97%
Key financials (EUR) 12/15 12/16e 12/17e
Life Gross premiums (m) 2,283 2,243 2,143
Non-Life Gross prem.(m) 0 0 0
Total Net Revenues (m) 3,939 3,766 3,693
EBIT (m) 561 384 397
Net Profit (adj.) (m) 470 311 321
Shareholders Equity (m) 2,070 2,049 2,046
ANAV (m) 1,876 1,855 1,852
ROE (adj.) (%) 25.5 16.0 16.5
Combined ratio (%) 0.0 0.0 0.0
Solvency Ratio 128.0% 119.2% 120.1%
P/E (adj.) 11.5 14.9 14.4
P/BV 2.6 2.3 2.3
P/ANAV 2.9 2.5 2.5
P/EbV 1.6 1.3 1.3
Dividend Yield 4.8% 4.4% 4.5%
EPS (adj.) 0.64 0.42 0.44
BVPS 2.81 2.79 2.78
ANAVPS 2.55 2.52 2.52
EbVPS 4.65 4.69 4.76
DPS 0.30 0.28 0.28
5.0
5.5
6.0
6.5
7.0
7.5
8.0
Sep 15 Oct 15 Nov 15 Dec 15 Jan 16 Feb 16 Mar 16 Apr 16 May 16 Jun 16 Jul 16 Aug 16 Sep 16 Oct 16
vvdsvdvsdy
BANCA MEDIOLANUM Stoxx Insurance (Rebased)Source: Factset
Shareholders: Doris family 40%; Fininvest 30%;

Page 39 of 69
Produced & Distributed by the Members of ESN (see last page of this report)
Abertis
Spain/Materials, Construction & Infrastructure Analyser
MATERIALS, CONSTRUCTION & INFRASTRUCTURE
Abertis (Accumulate) ECB against Fininvest’s significant stake in BMED
Better profitability and good traffic growth
The facts: Abertis released 9m’16 results, in line with consensus in terms of
EBITDA and net profit. We highlight the good performance in traffic and improving
margins.
Our analysis: Traffic was positive in Spain (5.5% vs. 5.1% 1H ; 6.1% 2015),
above Abertis’ 4% target and above our estimates (3.5 – 4.9%). Traffic in France
was more moderate 8+1.6% vs. 1.2% 1H and 1.8% 2015) due to strikes and
other extraordinary events. Abertis’ points to 1.5% vs. Our estimated 1.9%. Traffic
in Chile increased 6.7% (3 – 3.8% estimated; ABE’s 3.5%) and Brazil drops -3.1%
(-2.4% to -4.2% estimated; vs. ABE’s -2.5%).
EBITDA increased 13% and in comparative terms 7.6%. EBITDA margin
improved from 64% to 66.6% and toll roads from 64.5% to 67.2%, especially in
France (from 65% to 67.3%) and Spain (80.4% vs. 82.4%). These improves are
above forecasts, although we are yet to perceive an improve in Brazil’s margins.
Debt increased EUR1,665m, 13.2% (up to EUR14,219m) due to the acquisition of
Autopista Central (EUR1,413m including debt) and other concepts (EUR265m)
and has EUR358m free cash flow.
Net profit is distorted by a one-off EUR248m proceeding from updating 50% of
the book value on Autopista Central held. In comparative terms the rise is of 10%.
Abertis is studying the acquisition of M-6 in UK, a toll road in Mexico and another
asset. The Company does not plan to amortise treasury stock in the short term
and may be in the future sell more activity in Chile.
Conclusion: Good results, in which the fruits of improving efficiency are
beginning to show. We maintain our positive outlook on the stock. The main focus
point is the dispute on the AP7 agreement that will not be resolved in the short
term and Abertis’ capacity to find attractive investments.
Analyst(s):
Rafael Fernández de Heredia, GVC Gaesco Beka
+34 91 436 78 08
Accumulate
13.64
closing price as of 26/10/2016
14.75
Target Price unchanged
Recommendation unchanged
Target price: EUR
Share price: EUR
Reuters/Bloomberg ABE.MC/ABE SM
Market capitalisation (EURm) 13,509
Current N° of shares (m) 990
Free float 58%
Daily avg. no. trad. sh. 12 mth 4,253
Daily avg. trad. vol. 12 mth (m) 68,478
Price high 12 mth (EUR) 14.64
Price low 12 mth (EUR) 11.64
Abs. perf. 1 mth -0.91%
Abs. perf. 3 mth -1.91%
Abs. perf. 12 mth -7.51%
Key financials (EUR) 12/15 12/16e 12/17e
Sales (m) 4,379 4,726 4,953
EBITDA (m) 2,692 3,055 3,225
EBITDA margin 61.5% 64.6% 65.1%
EBIT (m) (65) 1,840 1,970
EBIT margin nm 38.9% 39.8%
Net Profit (adj.)(m) 517 655 722
ROCE -0.3% 7.1% 7.8%
Net debt/(cash) (m) 12,554 13,638 12,688
Net Debt/Equity 2.3 2.5 2.2
Debt/EBITDA 4.7 4.5 3.9
Int. cover(EBITDA/Fin. int) 3.6 4.2 4.2
EV/Sales 6.0 6.0 5.6
EV/EBITDA 9.7 9.3 8.6
EV/EBITDA (adj.) 9.7 9.3 8.6
EV/EBIT nm 15.4 14.0
P/E (adj.) 25.0 20.6 18.7
P/BV 4.6 4.8 4.7
OpFCF yield 7.4% 13.7% 18.6%
Dividend yield 5.1% 5.3% 5.6%
EPS (adj.) 0.55 0.66 0.73
BVPS 3.00 2.87 2.90
DPS 0.69 0.72 0.76
9M15 9M16 %
Telecom 157.0 171.0 8.9%
Toll roads 3,170.0 3,439.0 8.5%
Holding 1.0 2.0 100.0%
SALES 3,328.0 3,612.0 8.5%
9M15 9M16 %
Telecom 133.0 134.0 0.8%
Toll roads 2,044.0 2,311.0 13.1%
Holding -48.0 -38.0 -20.8%
EBITDA 2,129.0 2,407.0 13.1%
9M15 9M16 %
Amortisations/other -2,487.0 -932.0 -62.5%
Financial result -571.0 -548.0 -4.0%
Associates -52.0 6.0 -111.5%
Other -318.0 211.0 -166.4%
Ordinary Result -1,299.0 1,144.0 -188.1%
Taxes/other 3,096.4 -426.0 -113.8%
Net Income 1,797 718.0 -60.1%
Source: Abertis
11.5
12.0
12.5
13.0
13.5
14.0
14.5
15.0
Oct 15 Nov 15 Dec 15 Jan 16 Feb 16 Mar 16 Apr 16 May 16 Jun 16 Jul 16 Aug 16 Sep 16 Oct 16
vvdsvdvsdy
ABERTIS Stoxx Construction & Materials (Rebased)Source: Factset
Shareholders: Caixa Bank 24%; Capital 10%; Treasury
stock 8%;
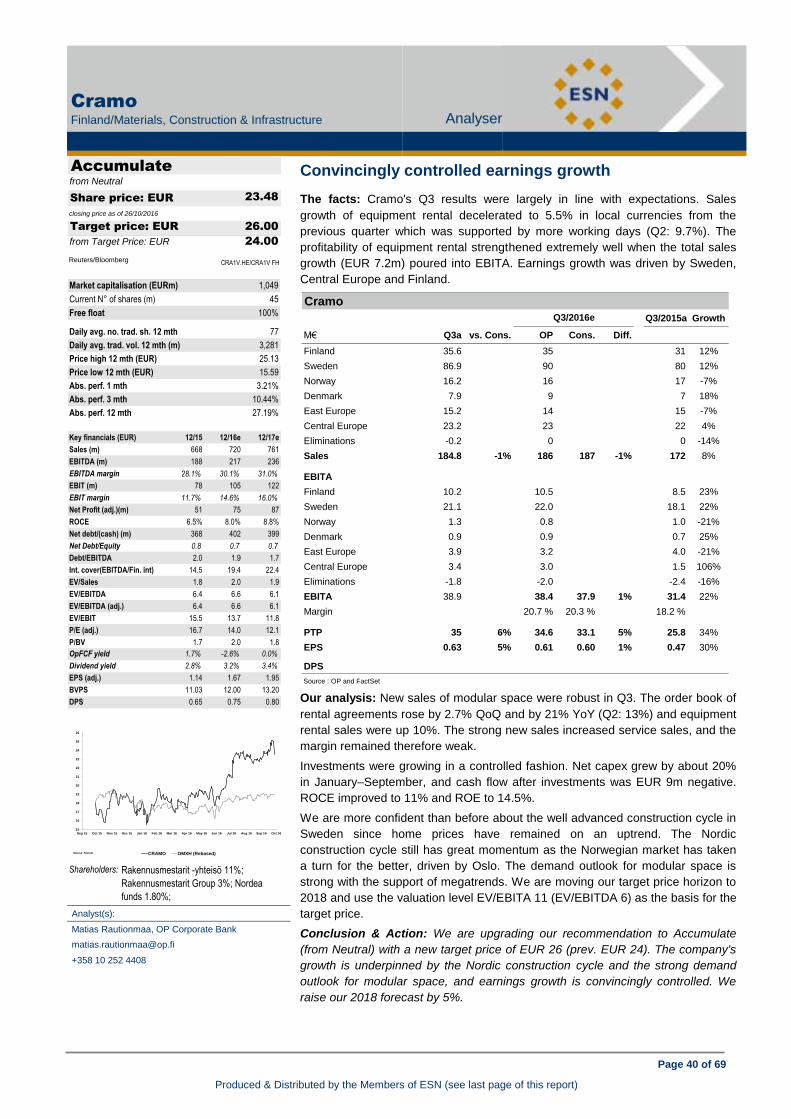
Page 40 of 69
Produced & Distributed by the Members of ESN (see last page of this report)
Cramo
Q3/2015a Growth
M€ Q3a vs. Cons. OP Cons. Diff.
Finland 35.6 #DIV/0! 35 #DIV/0! 31 12%
Sweden 86.9 #DIV/0! 90 #DIV/0! 80 12%
Norway 16.2 #DIV/0! 16 #DIV/0! 17 -7%
Denmark 7.9 #DIV/0! 9 #DIV/0! 7 18%
East Europe 15.2 #DIV/0! 14 #DIV/0! 15 -7%
Central Europe 23.2 #DIV/0! 23 #DIV/0! 22 4%
Eliminations -0.2 #DIV/0! 0 #DIV/0! 0 -14%
Sales 184.8 -1% 186 187 -1% 172 8%
EBITA
Finland 10.2 #DIV/0! 10.5 8.5 23%
Sweden 21.1 #DIV/0! 22.0 18.1 22%
Norway 1.3 #DIV/0! 0.8 1.0 -21%
Denmark 0.9 #DIV/0! 0.9 #DIV/0! 0.7 25%
East Europe 3.9 #DIV/0! 3.2 #DIV/0! 4.0 -21%
Central Europe 3.4 #DIV/0! 3.0 #DIV/0! 1.5 106%
Eliminations -1.8 #DIV/0! -2.0 #DIV/0! -2.4 -16%
EBITA 38.9 38.4 37.9 1% 31.4 22%
Margin #DIV/0! 20.7 % 20.3 % 18.2 %#DIV/0!
PTP 35 6% 34.6 33.1 5% 25.8 34%
EPS 0.63 5% 0.61 0.60 1% 0.47 30%#DIV/0!
DPS #DIV/0!
Source : OP and FactSet
Q3/2016e
Cramo
Finland/Materials, Construction & Infrastructure Analyser
MATERIALS, CONSTRUCTION & INFRASTRUCTURE
Cramo (Accumulate) Better profitability and good traffic growth
Convincingly controlled earnings growth
The facts: Cramo's Q3 results were largely in line with expectations. Sales
growth of equipment rental decelerated to 5.5% in local currencies from the
previous quarter which was supported by more working days (Q2: 9.7%). The
profitability of equipment rental strengthened extremely well when the total sales
growth (EUR 7.2m) poured into EBITA. Earnings growth was driven by Sweden,
Central Europe and Finland.
Our analysis: New sales of modular space were robust in Q3. The order book of
rental agreements rose by 2.7% QoQ and by 21% YoY (Q2: 13%) and equipment
rental sales were up 10%. The strong new sales increased service sales, and the
margin remained therefore weak.
Investments were growing in a controlled fashion. Net capex grew by about 20%
in January–September, and cash flow after investments was EUR 9m negative.
ROCE improved to 11% and ROE to 14.5%.
We are more confident than before about the well advanced construction cycle in
Sweden since home prices have remained on an uptrend. The Nordic
construction cycle still has great momentum as the Norwegian market has taken
a turn for the better, driven by Oslo. The demand outlook for modular space is
strong with the support of megatrends. We are moving our target price horizon to
2018 and use the valuation level EV/EBITA 11 (EV/EBITDA 6) as the basis for the
target price.
Conclusion & Action: We are upgrading our recommendation to Accumulate
(from Neutral) with a new target price of EUR 26 (prev. EUR 24). The company's
growth is underpinned by the Nordic construction cycle and the strong demand
outlook for modular space, and earnings growth is convincingly controlled. We
raise our 2018 forecast by 5%.
Analyst(s):
Matias Rautionmaa, OP Corporate Bank
+358 10 252 4408
Accumulate
23.48
closing price as of 26/10/2016
26.00
24.00from Target Price: EUR
from Neutral
Target price: EUR
Share price: EUR
Reuters/Bloomberg CRA1V.HE/CRA1V FH
Market capitalisation (EURm) 1,049
Current N° of shares (m) 45
Free float 100%
Daily avg. no. trad. sh. 12 mth 77
Daily avg. trad. vol. 12 mth (m) 3,281
Price high 12 mth (EUR) 25.13
Price low 12 mth (EUR) 15.59
Abs. perf. 1 mth 3.21%
Abs. perf. 3 mth 10.44%
Abs. perf. 12 mth 27.19%
Key financials (EUR) 12/15 12/16e 12/17e
Sales (m) 668 720 761
EBITDA (m) 188 217 236
EBITDA margin 28.1% 30.1% 31.0%
EBIT (m) 78 105 122
EBIT margin 11.7% 14.6% 16.0%
Net Profit (adj.)(m) 51 75 87
ROCE 6.5% 8.0% 8.8%
Net debt/(cash) (m) 368 402 399
Net Debt/Equity 0.8 0.7 0.7
Debt/EBITDA 2.0 1.9 1.7
Int. cover(EBITDA/Fin. int) 14.5 19.4 22.4
EV/Sales 1.8 2.0 1.9
EV/EBITDA 6.4 6.6 6.1
EV/EBITDA (adj.) 6.4 6.6 6.1
EV/EBIT 15.5 13.7 11.8
P/E (adj.) 16.7 14.0 12.1
P/BV 1.7 2.0 1.8
OpFCF yield 1.7% -2.6% 0.0%
Dividend yield 2.8% 3.2% 3.4%
EPS (adj.) 1.14 1.67 1.95
BVPS 11.03 12.00 13.20
DPS 0.65 0.75 0.80
15
16
17
18
19
20
21
22
23
24
25
26
Sep 15 Oct 15 Nov 15 Dec 15 Jan 16 Feb 16 Mar 16 Apr 16 May 16 Jun 16 Jul 16 Aug 16 Sep 16 Oct 16
vvdsvdvsdy
CRAMO OMXH (Rebased)Source: Factset
Shareholders: Rakennusmestarit -yhteisö 11%;
Rakennusmestarit Group 3%; Nordea
funds 1.80%;
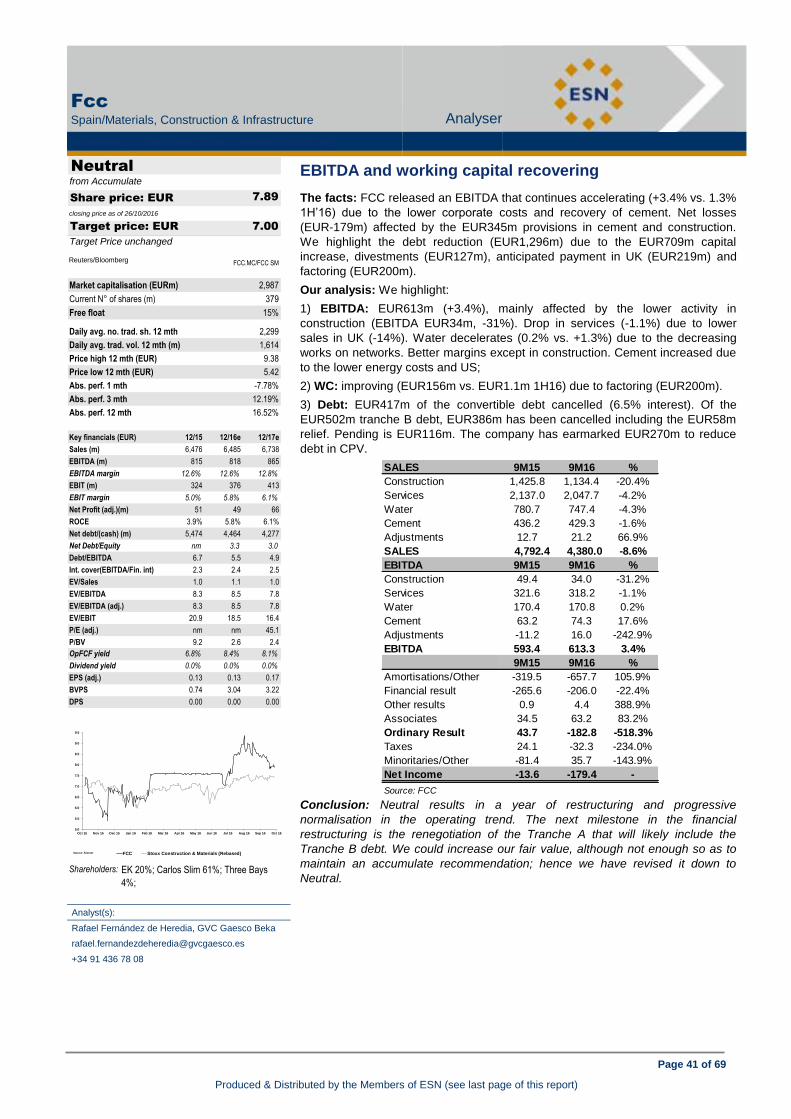
Page 41 of 69
Produced & Distributed by the Members of ESN (see last page of this report)
Fcc
Spain/Materials, Construction & Infrastructure Analyser
MATERIALS, CONSTRUCTION & INFRASTRUCTURE
Fcc (Neutral) Convincingly controlled earnings growth
EBITDA and working capital recovering
The facts: FCC released an EBITDA that continues accelerating (+3.4% vs. 1.3%
1H’16) due to the lower corporate costs and recovery of cement. Net losses
(EUR-179m) affected by the EUR345m provisions in cement and construction.
We highlight the debt reduction (EUR1,296m) due to the EUR709m capital
increase, divestments (EUR127m), anticipated payment in UK (EUR219m) and
factoring (EUR200m).
Our analysis: We highlight:
1) EBITDA: EUR613m (+3.4%), mainly affected by the lower activity in
construction (EBITDA EUR34m, -31%). Drop in services (-1.1%) due to lower
sales in UK (-14%). Water decelerates (0.2% vs. +1.3%) due to the decreasing
works on networks. Better margins except in construction. Cement increased due
to the lower energy costs and US;
2) WC: improving (EUR156m vs. EUR1.1m 1H16) due to factoring (EUR200m).
3) Debt: EUR417m of the convertible debt cancelled (6.5% interest). Of the
EUR502m tranche B debt, EUR386m has been cancelled including the EUR58m
relief. Pending is EUR116m. The company has earmarked EUR270m to reduce
debt in CPV.
Conclusion: Neutral results in a year of restructuring and progressive
normalisation in the operating trend. The next milestone in the financial
restructuring is the renegotiation of the Tranche A that will likely include the
Tranche B debt. We could increase our fair value, although not enough so as to
maintain an accumulate recommendation; hence we have revised it down to
Neutral.
Analyst(s):
Rafael Fernández de Heredia, GVC Gaesco Beka
+34 91 436 78 08
Neutral
7.89
closing price as of 26/10/2016
7.00
Target Price unchanged
from Accumulate
Target price: EUR
Share price: EUR
Reuters/Bloomberg FCC.MC/FCC SM
Market capitalisation (EURm) 2,987
Current N° of shares (m) 379
Free float 15%
Daily avg. no. trad. sh. 12 mth 2,299
Daily avg. trad. vol. 12 mth (m) 1,614
Price high 12 mth (EUR) 9.38
Price low 12 mth (EUR) 5.42
Abs. perf. 1 mth -7.78%
Abs. perf. 3 mth 12.19%
Abs. perf. 12 mth 16.52%
Key financials (EUR) 12/15 12/16e 12/17e
Sales (m) 6,476 6,485 6,738
EBITDA (m) 815 818 865
EBITDA margin 12.6% 12.6% 12.8%
EBIT (m) 324 376 413
EBIT margin 5.0% 5.8% 6.1%
Net Profit (adj.)(m) 51 49 66
ROCE 3.9% 5.8% 6.1%
Net debt/(cash) (m) 5,474 4,464 4,277
Net Debt/Equity nm 3.3 3.0
Debt/EBITDA 6.7 5.5 4.9
Int. cover(EBITDA/Fin. int) 2.3 2.4 2.5
EV/Sales 1.0 1.1 1.0
EV/EBITDA 8.3 8.5 7.8
EV/EBITDA (adj.) 8.3 8.5 7.8
EV/EBIT 20.9 18.5 16.4
P/E (adj.) nm nm 45.1
P/BV 9.2 2.6 2.4
OpFCF yield 6.8% 8.4% 8.1%
Dividend yield 0.0% 0.0% 0.0%
EPS (adj.) 0.13 0.13 0.17
BVPS 0.74 3.04 3.22
DPS 0.00 0.00 0.00
SALES 9M15 9M16 %
Construction 1,425.8 1,134.4 -20.4%
Services 2,137.0 2,047.7 -4.2%
Water 780.7 747.4 -4.3%
Cement 436.2 429.3 -1.6%
Adjustments 12.7 21.2 66.9%
SALES 4,792.4 4,380.0 -8.6%
EBITDA 9M15 9M16 %
Construction 49.4 34.0 -31.2%
Services 321.6 318.2 -1.1%
Water 170.4 170.8 0.2%
Cement 63.2 74.3 17.6%
Adjustments -11.2 16.0 -242.9%
EBITDA 593.4 613.3 3.4%
9M15 9M16 %
Amortisations/Other -319.5 -657.7 105.9%
Financial result -265.6 -206.0 -22.4%
Other results 0.9 4.4 388.9%
Associates 34.5 63.2 83.2%
Ordinary Result 43.7 -182.8 -518.3%
Taxes 24.1 -32.3 -234.0%
Minoritaries/Other -81.4 35.7 -143.9%
Net Income -13.6 -179.4 -
Source: FCC
5.0
5.5
6.0
6.5
7.0
7.5
8.0
8.5
9.0
9.5
Oct 15 Nov 15 Dec 15 Jan 16 Feb 16 Mar 16 Apr 16 May 16 Jun 16 Jul 16 Aug 16 Sep 16 Oct 16
vvdsvdvsdy
FCC Stoxx Construction & Materials (Rebased)Source: Factset
Shareholders: EK 20%; Carlos Slim 61%; Three Bays
4%;

Page 42 of 69
Produced & Distributed by the Members of ESN (see last page of this report)
Ferrovial
Spain/Materials, Construction & Infrastructure Analyser
MATERIALS, CONSTRUCTION & INFRASTRUCTURE
Ferrovial (Accumulate) EBITDA and working capital recovering
Neutral results
The facts: Ferrovial released 9m’16 results yesterday afternoon. We highlight the
407 ETR and Heathrow performances, progressive recovery in traffic and
managed lines. On the negative side are the weak services performance in UK
and construction.
Our analysis: 1) 407 ETR: EBITDA +14.9% thanks to tariffs +9.3% and traffic’s
+4.4% growths. 2) HR: Good EBITDA (+4.4%) due to +0.7% traffic, +7.7% retail
passenger revenues and lower costs (-3.4%). 3) Dividends: Growing +5.4% in
407 ETR and flat in HR. 4) Services: EBITDA dropped (-25.1% LFL) due to Amey
(EUR24m, -61% LFL in EBITDA). 5) Brexit. 7% EBITDA in 1H came from UK.
The Company has hedged GBP368m to front the dividends received (GBP105m)
and cash in pounds. A rise in inflation benefits the Company as do lower rates.
The lower GDP could affect HR (although it is fairly resistant) and non-regulated
airports, Amey, construction (4% sales) and toll roads based on availability (M8).
6) Construction (-23% LFL) due to the lower activity in Spain and Webber. 7)
Cintra: EBITDA in NTE EUR41m, +53% (76.7% margin). 8) WC: Eroding
EUR475m. 9) Cash in the holding (EUR300m vs. EUR1,514m Dec’15) due to
Broadspectrum (EUR934m).
Conclusion: Neutral results. Good performance of HR, 407 ETR and managed
lines, damped by the weaker construction and working capital (expected to
recovery in 2H). Regarding services in UK the situation is worse than expected,
although the possible impact on our fair value would be limited (2%). Positive
outlook reiterated.
Analyst(s):
Rafael Fernández de Heredia, GVC Gaesco Beka
+34 91 436 78 08
Accumulate
18.59
closing price as of 26/10/2016
22.10
Target Price unchanged
Recommendation unchanged
Target price: EUR
Share price: EUR
Reuters/Bloomberg FER.MC/FER SM
Market capitalisation (EURm) 13,615
Current N° of shares (m) 732
Free float 65%
Daily avg. no. trad. sh. 12 mth 3,222
Daily avg. trad. vol. 12 mth (m) 27,074
Price high 12 mth (EUR) 23.28
Price low 12 mth (EUR) 15.96
Abs. perf. 1 mth 2.40%
Abs. perf. 3 mth 0.22%
Abs. perf. 12 mth -20.28%
Key financials (EUR) 12/15 12/16e 12/17e
Sales (m) 9,698 9,353 9,646
EBITDA (m) 1,024 980 973
EBITDA margin 10.6% 10.5% 10.1%
EBIT (m) 899 1,021 725
EBIT margin 9.3% 10.9% 7.5%
Net Profit (adj.)(m) 718 657 440
ROCE 8.0% 9.4% 6.5%
Net debt/(cash) (m) 4,542 4,574 4,746
Net Debt/Equity 0.7 0.7 0.7
Debt/EBITDA 4.4 4.7 4.9
Int. cover(EBITDA/Fin. int) 2.0 2.2 2.1
EV/Sales 1.2 1.1 1.0
EV/EBITDA 11.4 10.2 10.4
EV/EBITDA (adj.) 11.4 10.2 10.4
EV/EBIT 13.0 9.8 13.9
P/E (adj.) 21.3 20.7 30.9
P/BV 2.5 2.2 2.2
OpFCF yield 3.3% 4.2% 5.3%
Dividend yield 3.8% 3.9% 4.0%
EPS (adj.) 0.98 0.90 0.60
BVPS 8.27 8.44 8.29
DPS 0.71 0.73 0.75
SALES 9M15 9M16 Var
Construction 3,233.0 3,033.0 -6.2%
Highways 389.0 361.0 -7.2%
Services 3,621.0 4,314.0 19.1%
Adjustments -10.0 -12.0 20.0%
TOTAL 7,233.0 7,696.0 6.4%
EBITDA 9M15 9M16 Var
Construction 295.0 226.0 -23.4%
Highways 261.0 228.0 -12.6%
Services 264.0 209.0 -20.8%
Adjustments -5.0 -13.0 160.0%
TOTAL 815.0 650.0 -20.2%
ACCOUNT 9M15 9M16 Var
Amortisation/Other -166.0 34.0 -120.5%
Operating result 648.0 684.0 5.6%
Financial Result -321.0 -284.0 -11.5%
Associates 204.0 56.0 -72.5%
Ordinary Result 531.0 457.0 -13.9%
Taxes -71.0 -175.0 146.5%
Minoritaries/other 22.0 -3.0 -113.6%
Net Income 483.0 279.0 -42.2%
Source: Ferrovial
15
16
17
18
19
20
21
22
23
24
Oct 15 Nov 15 Dec 15 Jan 16 Feb 16 Mar 16 Apr 16 May 16 Jun 16 Jul 16 Aug 16 Sep 16 Oct 16
vvdsvdvsdy
FERROVIAL Stoxx Construction & Materials (Rebased)Source: Factset
Shareholders: Del Pino Family 36%;
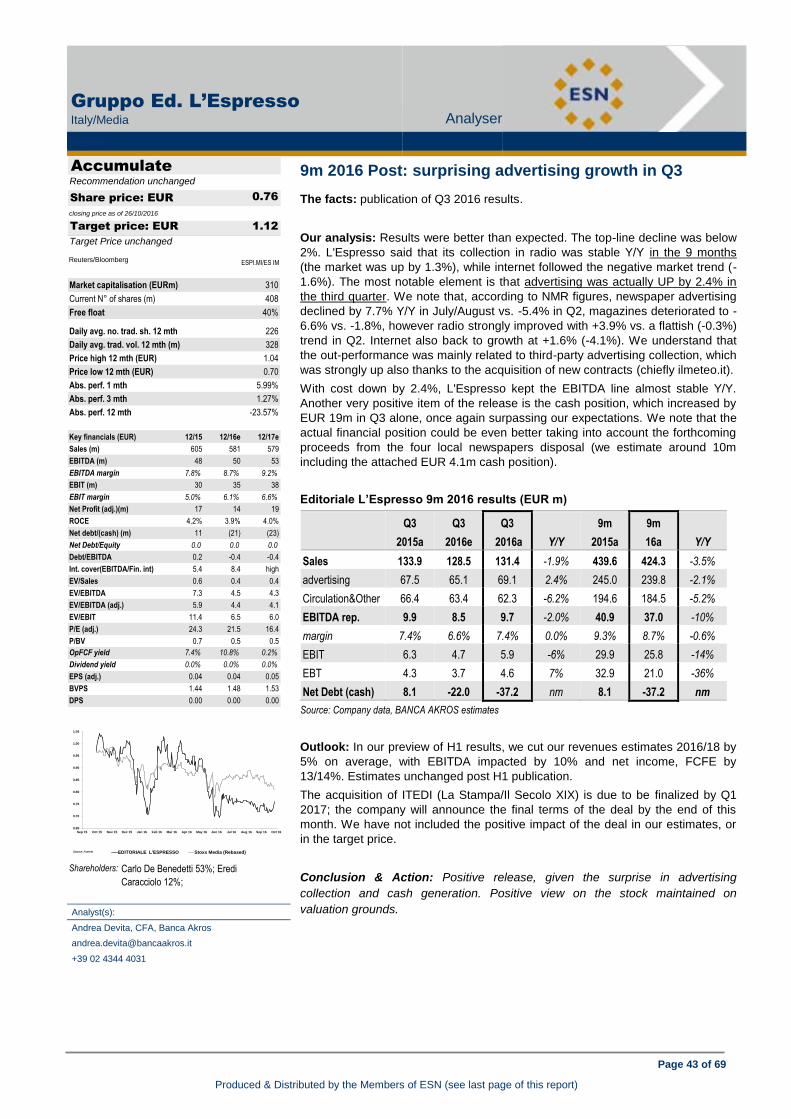
Page 43 of 69
Produced & Distributed by the Members of ESN (see last page of this report)
Gruppo Ed. L’Espresso
Italy/Media Analyser
MEDIA
Gruppo Ed. L'Espresso (Accumulate) Neutral results
9m 2016 Post: surprising advertising growth in Q3
The facts: publication of Q3 2016 results.
Our analysis: Results were better than expected. The top-line decline was below
2%. L'Espresso said that its collection in radio was stable Y/Y in the 9 months
(the market was up by 1.3%), while internet followed the negative market trend (-
1.6%). The most notable element is that advertising was actually UP by 2.4% in
the third quarter. We note that, according to NMR figures, newspaper advertising
declined by 7.7% Y/Y in July/August vs. -5.4% in Q2, magazines deteriorated to -
6.6% vs. -1.8%, however radio strongly improved with +3.9% vs. a flattish (-0.3%)
trend in Q2. Internet also back to growth at +1.6% (-4.1%). We understand that
the out-performance was mainly related to third-party advertising collection, which
was strongly up also thanks to the acquisition of new contracts (chiefly ilmeteo.it).
With cost down by 2.4%, L'Espresso kept the EBITDA line almost stable Y/Y.
Another very positive item of the release is the cash position, which increased by
EUR 19m in Q3 alone, once again surpassing our expectations. We note that the
actual financial position could be even better taking into account the forthcoming
proceeds from the four local newspapers disposal (we estimate around 10m
including the attached EUR 4.1m cash position).
Editoriale L’Espresso 9m 2016 results (EUR m)
Q3
2015a
Q3
2016e
Q3
2016a Y/Y
9m
2015a
9m
16a Y/Y
Sales 133.9 128.5 131.4 -1.9% 439.6 424.3 -3.5%
advertising 67.5 65.1 69.1 2.4% 245.0 239.8 -2.1%
Circulation&Other 66.4 63.4 62.3 -6.2% 194.6 184.5 -5.2%
EBITDA rep. 9.9 8.5 9.7 -2.0% 40.9 37.0 -10%
margin 7.4% 6.6% 7.4% 0.0% 9.3% 8.7% -0.6%
EBIT 6.3 4.7 5.9 -6% 29.9 25.8 -14%
EBT 4.3 3.7 4.6 7% 32.9 21.0 -36%
Net Debt (cash) 8.1 -22.0 -37.2 nm 8.1 -37.2 nm
Source: Company data, BANCA AKROS estimates
Outlook: In our preview of H1 results, we cut our revenues estimates 2016/18 by
5% on average, with EBITDA impacted by 10% and net income, FCFE by
13/14%. Estimates unchanged post H1 publication.
The acquisition of ITEDI (La Stampa/Il Secolo XIX) is due to be finalized by Q1
2017; the company will announce the final terms of the deal by the end of this
month. We have not included the positive impact of the deal in our estimates, or
in the target price.
Conclusion & Action: Positive release, given the surprise in advertising
collection and cash generation. Positive view on the stock maintained on
valuation grounds.
Analyst(s):
Andrea Devita, CFA, Banca Akros
+39 02 4344 4031
Accumulate
0.76
closing price as of 26/10/2016
1.12
Target Price unchanged
Recommendation unchanged
Target price: EUR
Share price: EUR
Reuters/Bloomberg ESPI.MI/ES IM
Market capitalisation (EURm) 310
Current N° of shares (m) 408
Free float 40%
Daily avg. no. trad. sh. 12 mth 226
Daily avg. trad. vol. 12 mth (m) 328
Price high 12 mth (EUR) 1.04
Price low 12 mth (EUR) 0.70
Abs. perf. 1 mth 5.99%
Abs. perf. 3 mth 1.27%
Abs. perf. 12 mth -23.57%
Key financials (EUR) 12/15 12/16e 12/17e
Sales (m) 605 581 579
EBITDA (m) 48 50 53
EBITDA margin 7.8% 8.7% 9.2%
EBIT (m) 30 35 38
EBIT margin 5.0% 6.1% 6.6%
Net Profit (adj.)(m) 17 14 19
ROCE 4.2% 3.9% 4.0%
Net debt/(cash) (m) 11 (21) (23)
Net Debt/Equity 0.0 0.0 0.0
Debt/EBITDA 0.2 -0.4 -0.4
Int. cover(EBITDA/Fin. int) 5.4 8.4 high
EV/Sales 0.6 0.4 0.4
EV/EBITDA 7.3 4.5 4.3
EV/EBITDA (adj.) 5.9 4.4 4.1
EV/EBIT 11.4 6.5 6.0
P/E (adj.) 24.3 21.5 16.4
P/BV 0.7 0.5 0.5
OpFCF yield 7.4% 10.8% 0.2%
Dividend yield 0.0% 0.0% 0.0%
EPS (adj.) 0.04 0.04 0.05
BVPS 1.44 1.48 1.53
DPS 0.00 0.00 0.00
0.65
0.70
0.75
0.80
0.85
0.90
0.95
1.00
1.05
Sep 15 Oct 15 Nov 15 Dec 15 Jan 16 Feb 16 Mar 16 Apr 16 May 16 Jun 16 Jul 16 Aug 16 Sep 16 Oct 16
vvdsvdvsdy
EDITORIALE L'ESPRESSO Stoxx Media (Rebased)Source: Factset
Shareholders: Carlo De Benedetti 53%; Eredi
Caracciolo 12%;

Page 44 of 69
Produced & Distributed by the Members of ESN (see last page of this report)
Ipsos
France/Media Analyser
MEDIA
Ipsos (Buy) 9m 2016 Post: surprising advertising growth in Q3
Confirmation of the return to growth with a good Q3-16
The facts: Q3-16 revenues were EUR431.7m (+0.9%), reflecting organic growth
of +3.2%, higher than our forecast (EUR426m, +2.0% org.) and the consensus
(EUR428m, +2.2% org.). Over 9M, org. growth is +3.3%, with revenues of
EUR1,265.3m (+0.3%). The company reiterated its goal of an underlying EBIT
margin of 10% in 2016. Company contact.
Our analysis: 1) Ipsos has maintained its momentum after a Q1-16 at +3.7% and
a Q2-16 at 3.0%. The forex impact continues to be negative: -3.8% over 9M; 2) by
market, Ipsos recorded an improvement in emerging markets (+4.1%) and in
developed markets (+2.9%); by region, EMEA (+2.5%) continued growing in Q3-
16 (+4.4%), the Americas (+3%) are driven by the US (Q3-16 +2.7%) and Asia-
Pacific (+6%) is still buoyant despite high comps in Q3-16 (+1.5%); 3) by division,
Ipsos Connect, which had experienced problems, reached breakeven over 9M,
i.e. a Q3-16 that marked a return to growth. The performance is very good on
Ipsos Marketing at +5% thanks to large clients that adopted less of a wait-and-
see attitude; 4) the new services are up 24% over 9M, i.e. 11% of group
revenues; and 5) other factors that require no comment (EBIT margin in line with
targets, gearing down to 55.6% vs. 67.9% at end-September 2015). Outlook: the
2016 targets are confirmed at the upper end of the range with a Q4-16 seen up by
around 3.3% vs. previous guidance of implicit growth of 0.8-4.6% and an EBIT
margin stable in 2016 at 10%, which includes EUR10m in costs tied to the ‘New
Way’ plan and higher provisions for bonuses. We have raised our org. growth
forecasts to 3.3% in 2016 vs. +2.0% and +3.0% in 2017 and 2018 vs +2.0%
Conclusion & Action: This is the third straight quarter in which Ipsos has turned
in surprisingly positive figures. The new services are growing apace, both
emerging markets and mature countries are in good shape overall and Ipsos
Connect moved into the black in Q3-16. Our entry point has been raised to
EUR28 vs EUR26, built on assumptions of 3% growth from 2017 (vs +2.0%) and
a normalised EBIT margin of 11.1%.
Analyst(s):
Emmanuel Chevalier, CM - CIC Market Solutions
+33 1 53 48 80 72
Buy
28.37
closing price as of 26/10/2016
32.00
30.00from Target Price: EUR
Recommendation unchanged
Target price: EUR
Share price: EUR
Reuters/Bloomberg ISOS.PA/IPS FP
Market capitalisation (EURm) 1,286
Current N° of shares (m) 45
Free float 70%
Daily avg. no. trad. sh. 12 mth 92
Daily avg. trad. vol. 12 mth (m) 1,378
Price high 12 mth (EUR) 30.00
Price low 12 mth (EUR) 17.08
Abs. perf. 1 mth 0.46%
Abs. perf. 3 mth 5.46%
Abs. perf. 12 mth 53.02%
Key financials (EUR) 12/15 12/16e 12/17e
Sales (m) 1,785 1,795 1,849
EBITDA (m) 187 219 217
EBITDA margin 10.5% 12.2% 11.7%
EBIT (m) 156 186 183
EBIT margin 8.7% 10.3% 9.9%
Net Profit (adj.)(m) 98 110 121
ROCE 7.6% 7.7% 8.2%
Net debt/(cash) (m) 557 467 386
Net Debt/Equity 0.6 0.4 0.3
Debt/EBITDA 3.0 2.1 1.8
Int. cover(EBITDA/Fin. int) 7.2 9.4 10.7
EV/Sales 0.9 1.0 0.9
EV/EBITDA 8.4 8.3 8.0
EV/EBITDA (adj.) 7.7 8.7 7.8
EV/EBIT 10.1 9.8 9.5
P/E (adj.) 9.9 11.8 10.8
P/BV 1.0 1.2 1.1
OpFCF yield 16.2% 9.8% 9.3%
Dividend yield 2.8% 3.0% 3.2%
EPS (adj.) 2.14 2.40 2.63
BVPS 20.41 23.75 25.48
DPS 0.80 0.85 0.90
14
16
18
20
22
24
26
28
30
Oct 15 Nov 15 Dec 15 Jan 16 Feb 16 Mar 16 Apr 16 May 16 Jun 16 Jul 16 Aug 16 Sep 16 Oct 16
vvdsvdvsdy
IPSOS Stoxx Media (Rebased)Source: Factset
Shareholders: LT participations 26%; Treasury stock
0.09%; employees 1.43%; SG capital
developpement 1.14%; Salvepar 1.45%;

Page 45 of 69
Produced & Distributed by the Members of ESN (see last page of this report)
Mediaset Espana
Spain/Media Analyser
MEDIA
Mediaset Espana (Buy) Confirmation of the return to growth with a good Q3-16
Weak 3Q results, but cost guidance improved
The facts: MSE released results at market close and held the CC at 18:00CET.
Our analysis: EBITDA and net profit above our forecasts and consensus.
Weak quarterly results and positive in the accumulated period.
Top-line, below forecasts. Share below forecasts (+0.4pp 3Q, +44.2%)
even despite having paid an attractive price for the rights on the Eurocup and
the satisfactory results in terms of audience and targets. On the positive
side, the Company maintained its lead in share lost in 1Q’16. Good c/GRP
+1.2% and GRPs +1% bearing in mind the +22.2% rise in inventories.
Regarding “other advertising revenues with third parties” we saw a -29.9%
contraction for 9M’16 due to the cancellation of DTS’ contract in 2015 partially
offset by TNT/13TV new agreements. This fact was already discounted and
included in our estimates (-EUR12m y/y est).
Opex affected by cost contention (as usual, -24.7% since 9m’2010 pro-
forma) and extraordinaries from the FTA Eurocup (partial between 2 and
3Q). The positive surprise was in the downward revision of annual
costs, from EUR780 to 770m (guidance prior to the Eurocup). We expect
opex 2017e to drop as a premium event is not considered.
Strong CF in 9m (+21.3% Y/Y, CAGR 9m’13 – 9m’16 +214%).
Net cash position recovery (EUR118.4m, +81% t/t, -42.4% y/y) due to the
high remuneration policy implemented (Pay-out 100.7%, EUR167.4m) and
buy-back of 150mEUR.
Conclusion: Weak results and not very representative at the annual level.
The advertising market is in deceleration again partly explained by political
uncertainty. In the case of MSE, Eurocup didn’t perform as expected.
We are optimistic regarding the 4T16e (also MSE in its c.c.; without quantifying
the advertising market except October that said it will be flat/slightly positive) as
we observed a similar effect when campaigns were delayed between Dec-15 and
Jan-16 (Feb-16 grew above 20%). Added to this is the final government’s
formation, the less demanding comparative base (last year there were General
Elections in Dec-15 and TV advertising market grew slightly +2.8% y/y) and good
prospects ahead the Christmas season with high retail sales indicators.
Analyst(s):
Eduardo Garcia Arguelles, GVC Gaesco Beka
+34 914 367 810
Buy
10.30
closing price as of 26/10/2016
14.10
Target Price unchanged
Recommendation unchanged
Target price: EUR
Share price: EUR
Reuters/Bloomberg TL5.MC/TL5 SM
Market capitalisation (EURm) 3,467
Current N° of shares (m) 337
Free float 50%
Daily avg. no. trad. sh. 12 mth 1,711
Daily avg. trad. vol. 12 mth (m) 10,704
Price high 12 mth (EUR) 12.01
Price low 12 mth (EUR) 8.26
Abs. perf. 1 mth -1.72%
Abs. perf. 3 mth -2.88%
Abs. perf. 12 mth -1.44%
Key financials (EUR) 12/15 12/16e 12/17e
Sales (m) 972 1,026 1,043
EBITDA (m) 223 244 262
EBITDA margin 22.9% 23.8% 25.1%
EBIT (m) 205 226 244
EBIT margin 21.1% 22.0% 23.4%
Net Profit (adj.)(m) 166 181 203
ROCE 20.2% 18.7% 19.6%
Net debt/(cash) (m) (198) (141) (150)
Net Debt/Equity -0.2 -0.1 -0.1
Debt/EBITDA -0.9 -0.6 -0.6
Int. cover(EBITDA/Fin. int) (211.1) (147.7) (106.2)
EV/Sales 3.4 3.1 3.0
EV/EBITDA 14.9 13.0 12.1
EV/EBITDA (adj.) 14.9 13.0 12.1
EV/EBIT 16.2 14.1 13.0
P/E (adj.) 21.0 19.1 17.1
P/BV 3.3 2.9 2.8
OpFCF yield 5.5% 5.8% 7.6%
Dividend yield 4.7% 4.7% 5.3%
EPS (adj.) 0.48 0.54 0.60
BVPS 3.06 3.55 3.66
DPS 0.48 0.48 0.54
7.5
8.0
8.5
9.0
9.5
10.0
10.5
11.0
11.5
12.0
12.5
Oct 15 Nov 15 Dec 15 Jan 16 Feb 16 Mar 16 Apr 16 May 16 Jun 16 Jul 16 Aug 16 Sep 16 Oct 16
vvdsvdvsdy
MEDIASET ESPANA IBEX 35 (Rebased)Source: Factset
Shareholders: Mediaset S.p.A. 50%; Treasury Stocks
0.05%;
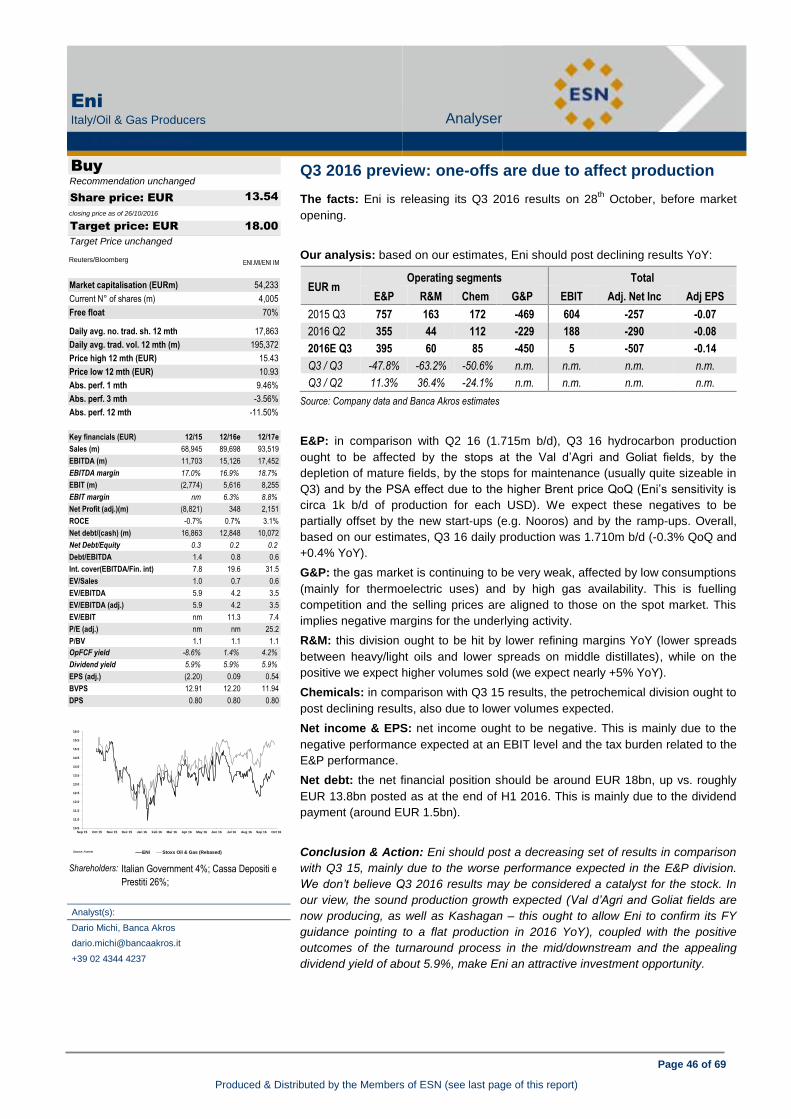
Page 46 of 69
Produced & Distributed by the Members of ESN (see last page of this report)
Eni
Italy/Oil & Gas Producers Analyser
OIL & GAS PRODUCERS
Eni (Buy) Weak 3Q results, but cost guidance improved
Q3 2016 preview: one-offs are due to affect production
The facts: Eni is releasing its Q3 2016 results on 28th
October, before market
opening.
Our analysis: based on our estimates, Eni should post declining results YoY:
EUR m Operating segments Total
E&P R&M Chem G&P EBIT Adj. Net Inc Adj EPS
2015 Q3 757 163 172 -469 604 -257 -0.07
2016 Q2 355 44 112 -229 188 -290 -0.08
2016E Q3 395 60 85 -450 5 -507 -0.14
Q3 / Q3 -47.8% -63.2% -50.6% n.m. n.m. n.m. n.m.
Q3 / Q2 11.3% 36.4% -24.1% n.m. n.m. n.m. n.m.
Source: Company data and Banca Akros estimates
E&P: in comparison with Q2 16 (1.715m b/d), Q3 16 hydrocarbon production
ought to be affected by the stops at the Val d’Agri and Goliat fields, by the
depletion of mature fields, by the stops for maintenance (usually quite sizeable in
Q3) and by the PSA effect due to the higher Brent price QoQ (Eni’s sensitivity is
circa 1k b/d of production for each USD). We expect these negatives to be
partially offset by the new start-ups (e.g. Nooros) and by the ramp-ups. Overall,
based on our estimates, Q3 16 daily production was 1.710m b/d (-0.3% QoQ and
+0.4% YoY).
G&P: the gas market is continuing to be very weak, affected by low consumptions
(mainly for thermoelectric uses) and by high gas availability. This is fuelling
competition and the selling prices are aligned to those on the spot market. This
implies negative margins for the underlying activity.
R&M: this division ought to be hit by lower refining margins YoY (lower spreads
between heavy/light oils and lower spreads on middle distillates), while on the
positive we expect higher volumes sold (we expect nearly +5% YoY).
Chemicals: in comparison with Q3 15 results, the petrochemical division ought to
post declining results, also due to lower volumes expected.
Net income & EPS: net income ought to be negative. This is mainly due to the
negative performance expected at an EBIT level and the tax burden related to the
E&P performance.
Net debt: the net financial position should be around EUR 18bn, up vs. roughly
EUR 13.8bn posted as at the end of H1 2016. This is mainly due to the dividend
payment (around EUR 1.5bn).
Conclusion & Action: Eni should post a decreasing set of results in comparison
with Q3 15, mainly due to the worse performance expected in the E&P division.
We don’t believe Q3 2016 results may be considered a catalyst for the stock. In
our view, the sound production growth expected (Val d’Agri and Goliat fields are
now producing, as well as Kashagan – this ought to allow Eni to confirm its FY
guidance pointing to a flat production in 2016 YoY), coupled with the positive
outcomes of the turnaround process in the mid/downstream and the appealing
dividend yield of about 5.9%, make Eni an attractive investment opportunity.
Analyst(s):
Dario Michi, Banca Akros
+39 02 4344 4237
Buy
13.54
closing price as of 26/10/2016
18.00
Target Price unchanged
Recommendation unchanged
Target price: EUR
Share price: EUR
Reuters/Bloomberg ENI.MI/ENI IM
Market capitalisation (EURm) 54,233
Current N° of shares (m) 4,005
Free float 70%
Daily avg. no. trad. sh. 12 mth 17,863
Daily avg. trad. vol. 12 mth (m) 195,372
Price high 12 mth (EUR) 15.43
Price low 12 mth (EUR) 10.93
Abs. perf. 1 mth 9.46%
Abs. perf. 3 mth -3.56%
Abs. perf. 12 mth -11.50%
Key financials (EUR) 12/15 12/16e 12/17e
Sales (m) 68,945 89,698 93,519
EBITDA (m) 11,703 15,126 17,452
EBITDA margin 17.0% 16.9% 18.7%
EBIT (m) (2,774) 5,616 8,255
EBIT margin nm 6.3% 8.8%
Net Profit (adj.)(m) (8,821) 348 2,151
ROCE -0.7% 0.7% 3.1%
Net debt/(cash) (m) 16,863 12,848 10,072
Net Debt/Equity 0.3 0.2 0.2
Debt/EBITDA 1.4 0.8 0.6
Int. cover(EBITDA/Fin. int) 7.8 19.6 31.5
EV/Sales 1.0 0.7 0.6
EV/EBITDA 5.9 4.2 3.5
EV/EBITDA (adj.) 5.9 4.2 3.5
EV/EBIT nm 11.3 7.4
P/E (adj.) nm nm 25.2
P/BV 1.1 1.1 1.1
OpFCF yield -8.6% 1.4% 4.2%
Dividend yield 5.9% 5.9% 5.9%
EPS (adj.) (2.20) 0.09 0.54
BVPS 12.91 12.20 11.94
DPS 0.80 0.80 0.80
10.5
11.0
11.5
12.0
12.5
13.0
13.5
14.0
14.5
15.0
15.5
16.0
Sep 15 Oct 15 Nov 15 Dec 15 Jan 16 Feb 16 Mar 16 Apr 16 May 16 Jun 16 Jul 16 Aug 16 Sep 16 Oct 16
vvdsvdvsdy
ENI Stoxx Oil & Gas (Rebased)Source: Factset
Shareholders: Italian Government 4%; Cassa Depositi e
Prestiti 26%;

Page 47 of 69
Produced & Distributed by the Members of ESN (see last page of this report)
Repsol
Spain/Oil & Gas Producers Analyser
OIL & GAS PRODUCERS
Repsol (Buy) Q3 2016 preview: one-offs are due to affect production
Agreement in Bolivia
The facts: Repsol’s chairman and Bolivia’s president have agreed to increase the
exploitation contract on Caipipendi, in the south of Bolivia. The new contract is for
another 15 years, from 2031 to 2046. The Caipipendi consortium is formed by
Repsol (37.5% and operator); Shell (37.5%) and PAE (25%), within the contract
subscribed with Yacimientos Petrolíferos Fiscales Bolivianos (YPFB).
Our analysis: Positive news (Bolivia now contributes 6% production and 6%
reserves to the Grou). With this agreement Repsol and its partners have
committed to invest $0.5bn during the next five years, to confirm the presence of
gas and accelerate hydrocarbon production in operating areas already identified
in the area (specifically Boyuy and Boicobo Sur, in the south and north of
Caipipendi). If successful, the new gas could also be offered to the country via the
existing installations which currently has available capacity. The studies realised
by Repsol have identified resources in the areas of up to 3 Tcf following the
seismic labour carried out.
To sum up, it implies extending an important concession in Bolivia and does not
demand a very high investment commitment (around $40m/year for Repsol,
which is fits with the less intensive capex phase). More so, it is not a high risk
investment within the area as it is well known to Repsol, having identified
resources, and does not require additional investments in midstream assets to
employ the potentially extracted gas.
Conclusion: Good news for the stock and an example of contained investments
and low risk profile, compatible with the Group’s priorities to manage cash
generation and protect the investment grade.
Analyst(s):
Sonia Ruiz De Garibay, GVC Gaesco Beka
+34 91 436 7841
Buy
12.91
closing price as of 26/10/2016
15.50
Target Price unchanged
Recommendation unchanged
Target price: EUR
Share price: EUR
Reuters/Bloomberg REP.MC/REP SM
Market capitalisation (EURm) 18,921
Current N° of shares (m) 1,466
Free float 73%
Daily avg. no. trad. sh. 12 mth 11,203
Daily avg. trad. vol. 12 mth (m) 64,898
Price high 12 mth (EUR) 13.07
Price low 12 mth (EUR) 8.02
Abs. perf. 1 mth 9.04%
Abs. perf. 3 mth 11.82%
Abs. perf. 12 mth 11.97%
Key financials (EUR) 12/15 12/16e 12/17e
Sales (m) 41,460 36,990 44,262
EBITDA (m) 5,013 5,014 5,861
EBITDA margin 12.1% 13.6% 13.2%
EBIT (m) 1,806 2,044 2,650
EBIT margin 4.4% 5.5% 6.0%
Net Profit (adj.)(m) 1,860 1,717 1,940
ROCE 3.0% 3.6% 4.7%
Net debt/(cash) (m) 11,934 8,403 6,471
Net Debt/Equity 0.4 0.3 0.2
Debt/EBITDA 2.4 1.7 1.1
Int. cover(EBITDA/Fin. int) (21.5) 11.1 13.8
EV/Sales 0.6 0.7 0.5
EV/EBITDA 4.6 4.9 3.9
EV/EBITDA (adj.) 4.6 4.9 3.9
EV/EBIT 12.9 12.0 8.5
P/E (adj.) 7.6 11.0 9.8
P/BV 0.5 0.6 0.6
OpFCF yield 11.0% 3.8% 5.9%
Dividend yield 6.2% 6.2% 7.7%
EPS (adj.) 1.33 1.17 1.32
BVPS 20.32 20.45 21.49
DPS 0.80 0.80 1.00
8
9
10
11
12
13
14
Oct 15 Nov 15 Dec 15 Jan 16 Feb 16 Mar 16 Apr 16 May 16 Jun 16 Jul 16 Aug 16 Sep 16 Oct 16
vvdsvdvsdy
REPSOL Stoxx Oil & Gas (Rebased)Source: Factset
Shareholders: CaixaBank 10%; Sacyr Vallehermoso
8%; Temasek 5%;

Page 48 of 69
Produced & Distributed by the Members of ESN (see last page of this report)
Technip
France/Oil Services Analyser
OIL SERVICES
Technip (Buy) Agreement in Bolivia
Q3 results better than expected, 2016 outlook raised
The facts: Technip has reported Q3-2016 revenue of EUR2,919m (-6.1%), an
adjusted operating profit of EUR285m (-2.5%), representing an operating margin
of 9.7% (9.4%) and attributable net income of EUR184m (+12.4%). With order
intake of EUR1.5bn over the quarter, unchanged vs the previous quarter,
Technip’s backlog stands at EUR12.3bn (EUR17.5bn at end Q3-2015).
Our analysis: These results largely beat the consensus (revenue EUR2.7bn,
operating profit EUR222m, operating margin 8.2%, attributable net income
EUR139m) and our expectations (EUR2,845m, EUR265m, EUR173m) due to an
excellent operating performance in Subsea, with an operating margin of 16.4% vs
15% in Q3-2015 (our estimate) and the consensus forecast of 13.8%. Onshore
Offshore reported an operating margin of 4.6%, similar to Q3-2015 (4.8%), in line
with the consensus (4.7%), but slightly below our expectations. Cost-cutting
measures will deliver EUR900m over the year.
Strong operational project execution, particularly in Subsea, with the final delivery
of many of them (including Stones), has prompted Technip to raise its 2016
guidance slightly (Subsea revenue > EUR5bn and operating profit roughly
EUR700m, vs EUR4.7bn-5bn and roughly EUR680m). For 2017 and beyond,
quarterly order intake is stable, but Technip cites an upsurge in customer interest,
notably in Subsea, for long distance field connections to reduce investment costs.
Thus, Technip, which will have many Subsea projects in delivery phase in 2017,
expects to maintain its level of Subsea margins next year on a decline in revenue
(we are forecasting a 10% decline in revenue and an operating margin of 15%, vs
14.87% in 9M-2016), and to increase its Onshore Offshore operating margin, on
revenue down slightly (we are forecasting revenue down 5% and a 6% operating
margin).
Conclusion & Action: Technip’s outlook, with the merger with FMC set to close
in January 2017, remains very bright. Technip remains our top pick in the sector.
Analyst(s):
Jean-Luc Romain, CM - CIC Market Solutions
+33 1 53 48 80 66
Buy
59.19
closing price as of 26/10/2016
67.00
Target Price unchanged
Recommendation unchanged
Target price: EUR
Share price: EUR
Reuters/Bloomberg TECF.PA/TEC FP
Market capitalisation (EURm) 7,415
Current N° of shares (m) 125
Free float 85%
Daily avg. no. trad. sh. 12 mth 996
Daily avg. trad. vol. 12 mth (m) 49,383
Price high 12 mth (EUR) 62.28
Price low 12 mth (EUR) 36.13
Abs. perf. 1 mth 15.81%
Abs. perf. 3 mth 20.35%
Abs. perf. 12 mth 24.89%
Key financials (EUR) 12/15 12/16e 12/17e
Sales (m) 12,209 11,193 10,368
EBITDA (m) 627 1,191 1,205
EBITDA margin 5.1% 10.6% 11.6%
EBIT (m) 331 900 921
EBIT margin 2.7% 8.0% 8.9%
Net Profit (adj.)(m) 559 565 587
ROCE 2.5% 14.9% 15.3%
Net debt/(cash) (m) (24) (356) (697)
Net Debt/Equity 0.0 -0.1 -0.1
Debt/EBITDA 0.0 -0.3 -0.6
Int. cover(EBITDA/Fin. int) 7.4 14.1 16.7
EV/Sales 0.4 0.6 0.6
EV/EBITDA 8.6 5.7 5.3
EV/EBITDA (adj.) 8.6 5.7 5.3
EV/EBIT 16.3 7.5 7.0
P/E (adj.) 10.2 13.1 12.6
P/BV 1.4 1.7 1.6
OpFCF yield 9.9% 8.0% 8.3%
Dividend yield 3.5% 3.7% 3.9%
EPS (adj.) 4.46 4.51 4.69
BVPS 33.20 35.60 38.09
DPS 2.10 2.21 2.32
35
40
45
50
55
60
65
Oct 15 Nov 15 Dec 15 Jan 16 Feb 16 Mar 16 Apr 16 May 16 Jun 16 Jul 16 Aug 16 Sep 16 Oct 16
vvdsvdvsdy
TECHNIP CAC 40 (Rebased)Source: Factset
Shareholders: Oppenheimer Funds 5%; ING Group NV
5%; Employees 1.90%; Treasury stock
3%;

Page 49 of 69
Produced & Distributed by the Members of ESN (see last page of this report)
Vopak
Netherlands/Oil Services Analyser
OIL SERVICES
Vopak (Buy) Q3 results better than expected, 2016 outlook raised Buy
46.08
closing price as of 26/10/2016
52.00
51.00from Target Price: EUR
Recommendation unchanged
Target price: EUR
Share price: EUR
Reuters/Bloomberg VOPA.AS/VPK NA
Market capitalisation (EURm) 5,982
Current N° of shares (m) 130
Free float 33%
Daily avg. no. trad. sh. 12 mth 345
Daily avg. trad. vol. 12 mth (m) 13,234
Price high 12 mth (EUR) 48.89
Price low 12 mth (EUR) 35.05
Abs. perf. 1 mth 0.16%
Abs. perf. 3 mth 2.63%
Abs. perf. 12 mth 24.19%
Key financials (EUR) 12/15 12/16e 12/17e
Sales (m) 1,492 1,389 1,417
EBITDA (m) 755 723 732
EBITDA margin 50.6% 52.1% 51.7%
EBIT (m) 495 464 469
EBIT margin 33.2% 33.4% 33.1%
Net Profit (adj.)(m) 282 381 404
ROCE 11.6% 16.1% 16.0%
Net debt/(cash) (m) 2,296 1,642 1,320
Net Debt/Equity 1.1 0.7 0.5
Debt/EBITDA 3.0 2.3 1.8
Int. cover(EBITDA/Fin. int) 7.2 8.9 10.2
EV/Sales 5.5 6.1 5.8
EV/EBITDA 11.0 11.7 11.2
EV/EBITDA (adj.) 10.2 9.9 9.4
EV/EBIT 16.7 18.3 17.4
P/E (adj.) 18.1 15.7 14.8
P/BV 2.6 2.6 2.2
OpFCF yield 4.6% 7.7% 8.4%
Dividend yield 1.7% 2.2% 2.4%
EPS (adj.) 2.19 2.94 3.11
BVPS 15.54 18.06 20.64
DPS 0.77 1.03 1.09
Updates estimates and target + VTTI deal read through
The facts: We have updated our estimates leading to modest upward revisions,
which also applies to our DCF model with updated estimates and assumptions for
certain variables. This leads to our price target going from EUR 51 per share to
EUR 52 per share.
Apart from the tweaking of our model, we note the proposed transaction between
Buckeye Partners LP and VTTI bv, the MLP that owns and manages liquid bulk
terminals in 13 terminals on 5 continents with a total capacity of 8.6m cbm.
Buckeye is offering USD 1.15bn for 50% of VTTI bv, which implies an EV/EBITDA
for FY17 of around 11x. This is more or less confirmed by Buckeye which states
in the presentation that the anticipated long term acquisition multiple is below 10x.
Given the growth of VTTI in the past (capacity increased by CAGR of 40% in last
10 years, not all organic).
Our analysis: In the last 12 months June 2016, Vopak generated proportionate
EBITDA of EUR 919m. If we adjust that EBITDA for divestments (UK) and then
apply the 11x multiple of the Buckeye VTTI transaction and deduct net debt of
EUR 1.8bn (1H16), we get to an equity value of around EUR 8.1bn or around
EUR 64 per share.
We realize that VTTI is an MLP with certain fiscal advantages (no corporate tax
applies) that make it an attractive vehicle leading to higher than normal multiples.
We also realize that valuations in the US are per definition between 5-10% higher
than in Europe. However, even taking all of that into account, this transaction
shows that Vopak at the moment is undervalued.
Vopak will report 3Q16 earnings on November 4th
.
Conclusion & Action: The twisting and tweaking of our model results in a
modest uptick to our price target, which moves from EUR 51 to EUR 52 per
share. The Buckeye – VTTI transaction shows that the valuation of Vopak at the
moment is still undemanding and leaves material upside. Especially if Vopak is
able to add new projects or expands existing projects, which we think the
company will be able to do given market characteristics and its own track record.
30
32
34
36
38
40
42
44
46
48
50
Oct 15 Nov 15 Dec 15 Jan 16 Feb 16 Mar 16 Apr 16 May 16 Jun 16 Jul 16 Aug 16 Sep 16 Oct 16
vvdsvdvsdy
VOPAK Midkap (Rebased)Source: Factset Shareholders: HAL 47%; ING 5%; Aviva 5%; ASR
0.00%;
Analyst(s):
Martijn den Drijver, NIBC Markets N.V.
+312 0 5508636

Page 50 of 69
Produced & Distributed by the Members of ESN (see last page of this report)
Altran
France/Software & Computer Services Analyser
SOFTWARE & COMPUTER SERVICES
Altran (Buy) Updates estimates and target + VTTI deal read through
Q3-2016 revenue in line
The facts: Altran has reported Q3-2016 revenue of EUR501m, with organic
growth of 3.7% (+5.1% economic), in line (CMCIC: EUR509m; consensus:
EUR504m).
Our analysis: By geography, momentum remained strong in France, where
business continued to grow at a sustained pace (+5.8% economic, +4.6% total)
despite a negative trading day effect (-0.9%). In Northern Europe, business
increased slightly (+1.3% economic), but was backed by the German
restructuring, which seems to be paying off gradually. The trend remains strong in
Southern Europe (+7.4% economic), despite being below the double-digit growth
observed in the last 12 months. Altran reported a “one-time business context” in
Italy, with more information likely in the conference call. Lastly, the rest of the
world delivered sharp growth (+29.2%; +8.8% economic) driven notably by India.
The group also reported an increase in billing rates from 87.2% to 87.5% in Q3-
2016 vs Q3-2015 (+30bp), a better-than-expected improvement (87.3%), which
should boost profitability. For the record, billing rates had stabilised since Q3-
2015 after rising strongly. This no doubt illustrates the improvement of the
German situation, which weighed heavily on this indicator.
Conclusion & Action: These numbers in line with expectations and with no
major trends announced confirm the investment case of our 14 October report.
We will wait for this morning’s conference call at 9am to look further into the
performance by geography, and above all to look at the restructuring in Germany,
which so far seems to be going in the right direction, judging by the recent
acquisitions of Benteler and Swell.
Analyst(s):
Kévin Woringer, CM - CIC Market Solutions
+33 1 53 48 80 69
Buy
13.48
closing price as of 26/10/2016
15.00
Target Price unchanged
Recommendation unchanged
Target price: EUR
Share price: EUR
Reuters/Bloomberg ALTR.PA/ALT FP
Market capitalisation (EURm) 2,359
Current N° of shares (m) 175
Free float 76%
Daily avg. no. trad. sh. 12 mth 237
Daily avg. trad. vol. 12 mth (m) 1,745
Price high 12 mth (EUR) 13.73
Price low 12 mth (EUR) 9.87
Abs. perf. 1 mth 0.37%
Abs. perf. 3 mth 5.60%
Abs. perf. 12 mth 21.29%
Key financials (EUR) 12/15 12/16e 12/17e
Sales (m) 1,945 2,136 2,285
EBITDA (m) 181 220 240
EBITDA margin 9.3% 10.3% 10.5%
EBIT (m) 155 193 212
EBIT margin 8.0% 9.0% 9.3%
Net Profit (adj.)(m) 122 144 158
ROCE 11.2% 11.5% 12.2%
Net debt/(cash) (m) 191 251 189
Net Debt/Equity 0.2 0.3 0.2
Debt/EBITDA 1.1 1.1 0.8
Int. cover(EBITDA/Fin. int) 16.8 18.4 21.4
EV/Sales 1.2 1.2 1.1
EV/EBITDA 13.0 11.9 10.6
EV/EBITDA (adj.) 11.3 10.9 9.8
EV/EBIT 15.2 13.5 12.0
P/E (adj.) 17.7 16.4 14.9
P/BV 2.7 2.7 2.4
OpFCF yield 3.7% 3.9% 4.4%
Dividend yield 1.1% 1.4% 1.8%
EPS (adj.) 0.70 0.82 0.90
BVPS 4.54 5.07 5.63
DPS 0.15 0.19 0.24
9.5
10.0
10.5
11.0
11.5
12.0
12.5
13.0
13.5
14.0
Oct 15 Nov 15 Dec 15 Jan 16 Feb 16 Mar 16 Apr 16 May 16 Jun 16 Jul 16 Aug 16 Sep 16 Oct 16
vvdsvdvsdy
ALTRAN Stoxx Software & Computer Services (Rebased)Source: Factset
Shareholders: Altrafin Participations (Apax Partners)
16%; Alexis KNIAZEFF 4%; Hubert
MARTIGNY 4%; Managers 0.20%;
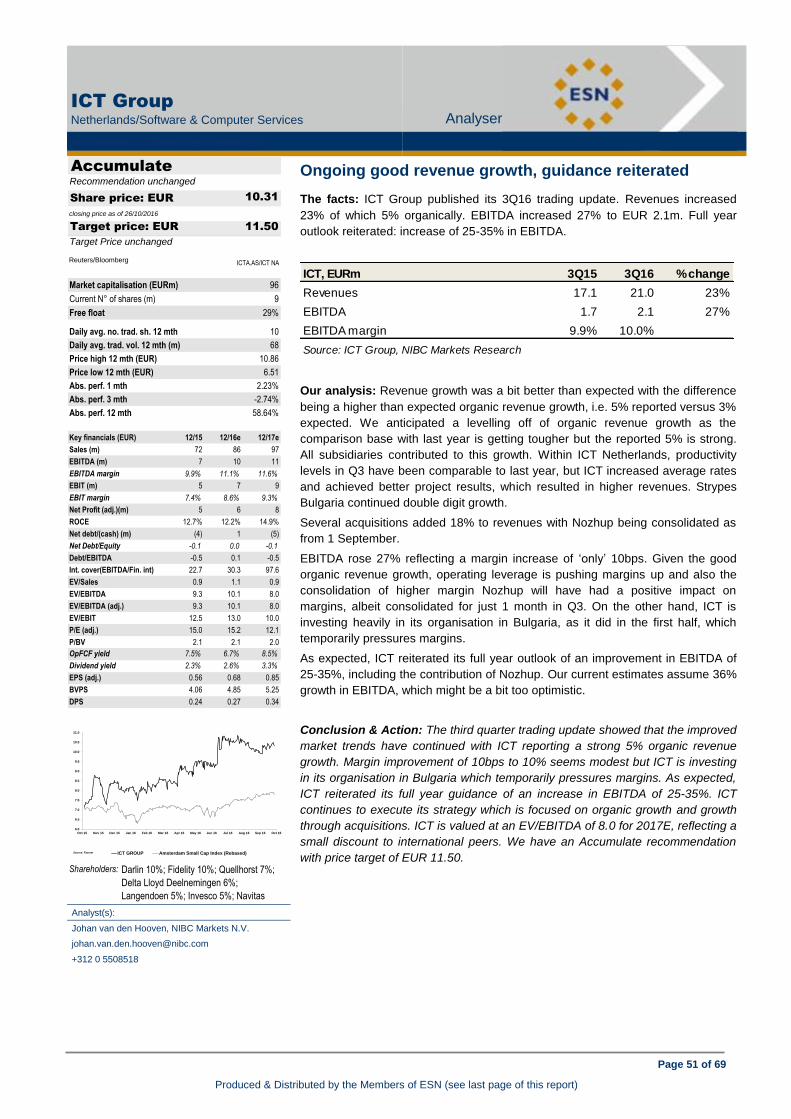
Page 51 of 69
Produced & Distributed by the Members of ESN (see last page of this report)
ICT Group
Netherlands/Software & Computer Services Analyser
SOFTWARE & COMPUTER SERVICES
ICT Group (Accumulate) Q3-2016 revenue in line Accumulate
10.31
closing price as of 26/10/2016
11.50
Target Price unchanged
Recommendation unchanged
Target price: EUR
Share price: EUR
Reuters/Bloomberg ICTA.AS/ICT NA
Market capitalisation (EURm) 96
Current N° of shares (m) 9
Free float 29%
Daily avg. no. trad. sh. 12 mth 10
Daily avg. trad. vol. 12 mth (m) 68
Price high 12 mth (EUR) 10.86
Price low 12 mth (EUR) 6.51
Abs. perf. 1 mth 2.23%
Abs. perf. 3 mth -2.74%
Abs. perf. 12 mth 58.64%
Key financials (EUR) 12/15 12/16e 12/17e
Sales (m) 72 86 97
EBITDA (m) 7 10 11
EBITDA margin 9.9% 11.1% 11.6%
EBIT (m) 5 7 9
EBIT margin 7.4% 8.6% 9.3%
Net Profit (adj.)(m) 5 6 8
ROCE 12.7% 12.2% 14.9%
Net debt/(cash) (m) (4) 1 (5)
Net Debt/Equity -0.1 0.0 -0.1
Debt/EBITDA -0.5 0.1 -0.5
Int. cover(EBITDA/Fin. int) 22.7 30.3 97.6
EV/Sales 0.9 1.1 0.9
EV/EBITDA 9.3 10.1 8.0
EV/EBITDA (adj.) 9.3 10.1 8.0
EV/EBIT 12.5 13.0 10.0
P/E (adj.) 15.0 15.2 12.1
P/BV 2.1 2.1 2.0
OpFCF yield 7.5% 6.7% 8.5%
Dividend yield 2.3% 2.6% 3.3%
EPS (adj.) 0.56 0.68 0.85
BVPS 4.06 4.85 5.25
DPS 0.24 0.27 0.34
Ongoing good revenue growth, guidance reiterated
The facts: ICT Group published its 3Q16 trading update. Revenues increased
23% of which 5% organically. EBITDA increased 27% to EUR 2.1m. Full year
outlook reiterated: increase of 25-35% in EBITDA.
ICT, EURm 3Q15 3Q16 % change
Revenues 17.1 21.0 23%
EBITDA 1.7 2.1 27%
EBITDA margin 9.9% 10.0%
Source: ICT Group, NIBC Markets Research
Our analysis: Revenue growth was a bit better than expected with the difference
being a higher than expected organic revenue growth, i.e. 5% reported versus 3%
expected. We anticipated a levelling off of organic revenue growth as the
comparison base with last year is getting tougher but the reported 5% is strong.
All subsidiaries contributed to this growth. Within ICT Netherlands, productivity
levels in Q3 have been comparable to last year, but ICT increased average rates
and achieved better project results, which resulted in higher revenues. Strypes
Bulgaria continued double digit growth.
Several acquisitions added 18% to revenues with Nozhup being consolidated as
from 1 September.
EBITDA rose 27% reflecting a margin increase of ‘only’ 10bps. Given the good
organic revenue growth, operating leverage is pushing margins up and also the
consolidation of higher margin Nozhup will have had a positive impact on
margins, albeit consolidated for just 1 month in Q3. On the other hand, ICT is
investing heavily in its organisation in Bulgaria, as it did in the first half, which
temporarily pressures margins.
As expected, ICT reiterated its full year outlook of an improvement in EBITDA of
25-35%, including the contribution of Nozhup. Our current estimates assume 36%
growth in EBITDA, which might be a bit too optimistic.
Conclusion & Action: The third quarter trading update showed that the improved
market trends have continued with ICT reporting a strong 5% organic revenue
growth. Margin improvement of 10bps to 10% seems modest but ICT is investing
in its organisation in Bulgaria which temporarily pressures margins. As expected,
ICT reiterated its full year guidance of an increase in EBITDA of 25-35%. ICT
continues to execute its strategy which is focused on organic growth and growth
through acquisitions. ICT is valued at an EV/EBITDA of 8.0 for 2017E, reflecting a
small discount to international peers. We have an Accumulate recommendation
with price target of EUR 11.50.
6.0
6.5
7.0
7.5
8.0
8.5
9.0
9.5
10.0
10.5
11.0
Oct 15 Nov 15 Dec 15 Jan 16 Feb 16 Mar 16 Apr 16 May 16 Jun 16 Jul 16 Aug 16 Sep 16 Oct 16
vvdsvdvsdy
ICT GROUP Amsterdam Small Cap Index (Rebased)Source: Factset Shareholders: Darlin 10%; Fidelity 10%; Quellhorst 7%;
Delta Lloyd Deelnemingen 6%;
Langendoen 5%; Invesco 5%; Navitas
5%; M. van Wettum 5%;
Analyst(s):
Johan van den Hooven, NIBC Markets N.V.
+312 0 5508518
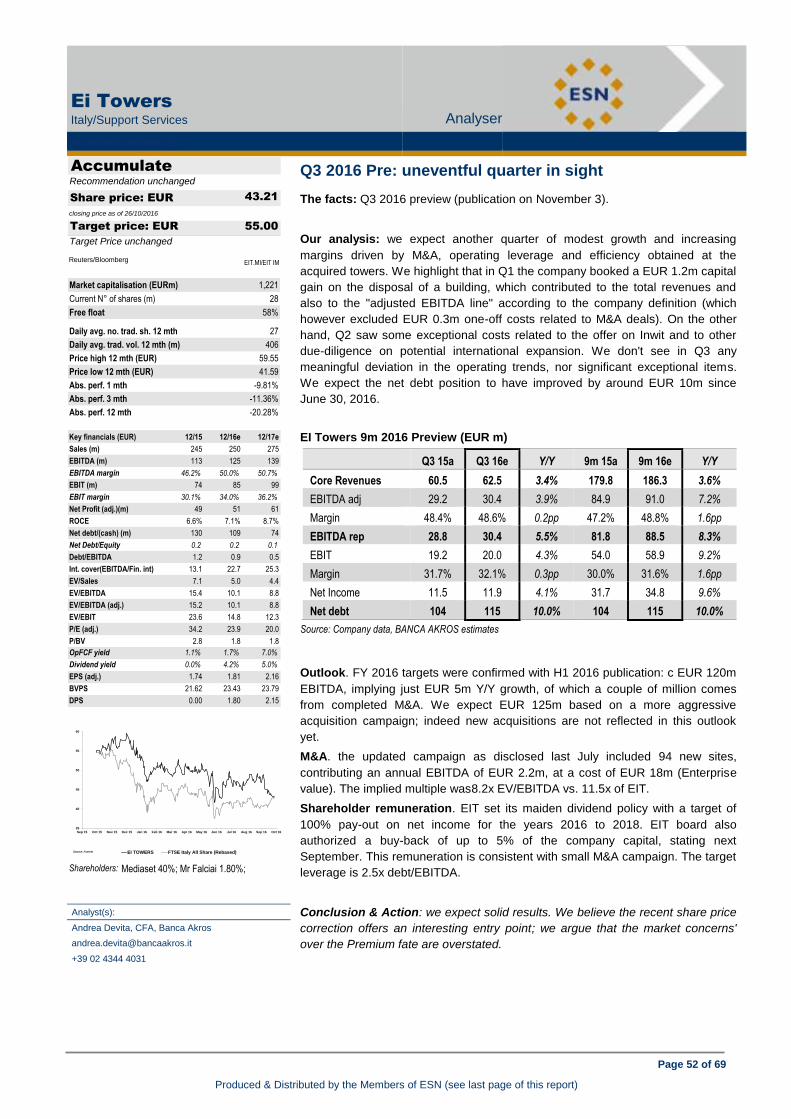
Page 52 of 69
Produced & Distributed by the Members of ESN (see last page of this report)
Ei Towers
Italy/Support Services Analyser
SUPPORT SERVICES
Ei Towers (Accumulate) Ongoing good revenue growth, guidance reiterated
Q3 2016 Pre: uneventful quarter in sight
The facts: Q3 2016 preview (publication on November 3).
Our analysis: we expect another quarter of modest growth and increasing
margins driven by M&A, operating leverage and efficiency obtained at the
acquired towers. We highlight that in Q1 the company booked a EUR 1.2m capital
gain on the disposal of a building, which contributed to the total revenues and
also to the "adjusted EBITDA line" according to the company definition (which
however excluded EUR 0.3m one-off costs related to M&A deals). On the other
hand, Q2 saw some exceptional costs related to the offer on Inwit and to other
due-diligence on potential international expansion. We don't see in Q3 any
meaningful deviation in the operating trends, nor significant exceptional items.
We expect the net debt position to have improved by around EUR 10m since
June 30, 2016.
EI Towers 9m 2016 Preview (EUR m)
Q3 15a Q3 16e Y/Y 9m 15a 9m 16e Y/Y
Core Revenues 60.5 62.5 3.4% 179.8 186.3 3.6%
EBITDA adj 29.2 30.4 3.9% 84.9 91.0 7.2%
Margin 48.4% 48.6% 0.2pp 47.2% 48.8% 1.6pp
EBITDA rep 28.8 30.4 5.5% 81.8 88.5 8.3%
EBIT 19.2 20.0 4.3% 54.0 58.9 9.2%
Margin 31.7% 32.1% 0.3pp 30.0% 31.6% 1.6pp
Net Income 11.5 11.9 4.1% 31.7 34.8 9.6%
Net debt 104 115 10.0% 104 115 10.0%
Source: Company data, BANCA AKROS estimates
Outlook. FY 2016 targets were confirmed with H1 2016 publication: c EUR 120m
EBITDA, implying just EUR 5m Y/Y growth, of which a couple of million comes
from completed M&A. We expect EUR 125m based on a more aggressive
acquisition campaign; indeed new acquisitions are not reflected in this outlook
yet.
M&A. the updated campaign as disclosed last July included 94 new sites,
contributing an annual EBITDA of EUR 2.2m, at a cost of EUR 18m (Enterprise
value). The implied multiple was8.2x EV/EBITDA vs. 11.5x of EIT.
Shareholder remuneration. EIT set its maiden dividend policy with a target of
100% pay-out on net income for the years 2016 to 2018. EIT board also
authorized a buy-back of up to 5% of the company capital, stating next
September. This remuneration is consistent with small M&A campaign. The target
leverage is 2.5x debt/EBITDA.
Conclusion & Action: we expect solid results. We believe the recent share price
correction offers an interesting entry point; we argue that the market concerns'
over the Premium fate are overstated.
Analyst(s):
Andrea Devita, CFA, Banca Akros
+39 02 4344 4031
Accumulate
43.21
closing price as of 26/10/2016
55.00
Target Price unchanged
Recommendation unchanged
Target price: EUR
Share price: EUR
Reuters/Bloomberg EIT.MI/EIT IM
Market capitalisation (EURm) 1,221
Current N° of shares (m) 28
Free float 58%
Daily avg. no. trad. sh. 12 mth 27
Daily avg. trad. vol. 12 mth (m) 406
Price high 12 mth (EUR) 59.55
Price low 12 mth (EUR) 41.59
Abs. perf. 1 mth -9.81%
Abs. perf. 3 mth -11.36%
Abs. perf. 12 mth -20.28%
Key financials (EUR) 12/15 12/16e 12/17e
Sales (m) 245 250 275
EBITDA (m) 113 125 139
EBITDA margin 46.2% 50.0% 50.7%
EBIT (m) 74 85 99
EBIT margin 30.1% 34.0% 36.2%
Net Profit (adj.)(m) 49 51 61
ROCE 6.6% 7.1% 8.7%
Net debt/(cash) (m) 130 109 74
Net Debt/Equity 0.2 0.2 0.1
Debt/EBITDA 1.2 0.9 0.5
Int. cover(EBITDA/Fin. int) 13.1 22.7 25.3
EV/Sales 7.1 5.0 4.4
EV/EBITDA 15.4 10.1 8.8
EV/EBITDA (adj.) 15.2 10.1 8.8
EV/EBIT 23.6 14.8 12.3
P/E (adj.) 34.2 23.9 20.0
P/BV 2.8 1.8 1.8
OpFCF yield 1.1% 1.7% 7.0%
Dividend yield 0.0% 4.2% 5.0%
EPS (adj.) 1.74 1.81 2.16
BVPS 21.62 23.43 23.79
DPS 0.00 1.80 2.15
35
40
45
50
55
60
Sep 15 Oct 15 Nov 15 Dec 15 Jan 16 Feb 16 Mar 16 Apr 16 May 16 Jun 16 Jul 16 Aug 16 Sep 16 Oct 16
vvdsvdvsdy
EI TOWERS FTSE Italy All Share (Rebased)Source: Factset
Shareholders: Mediaset 40%; Mr Falciai 1.80%;
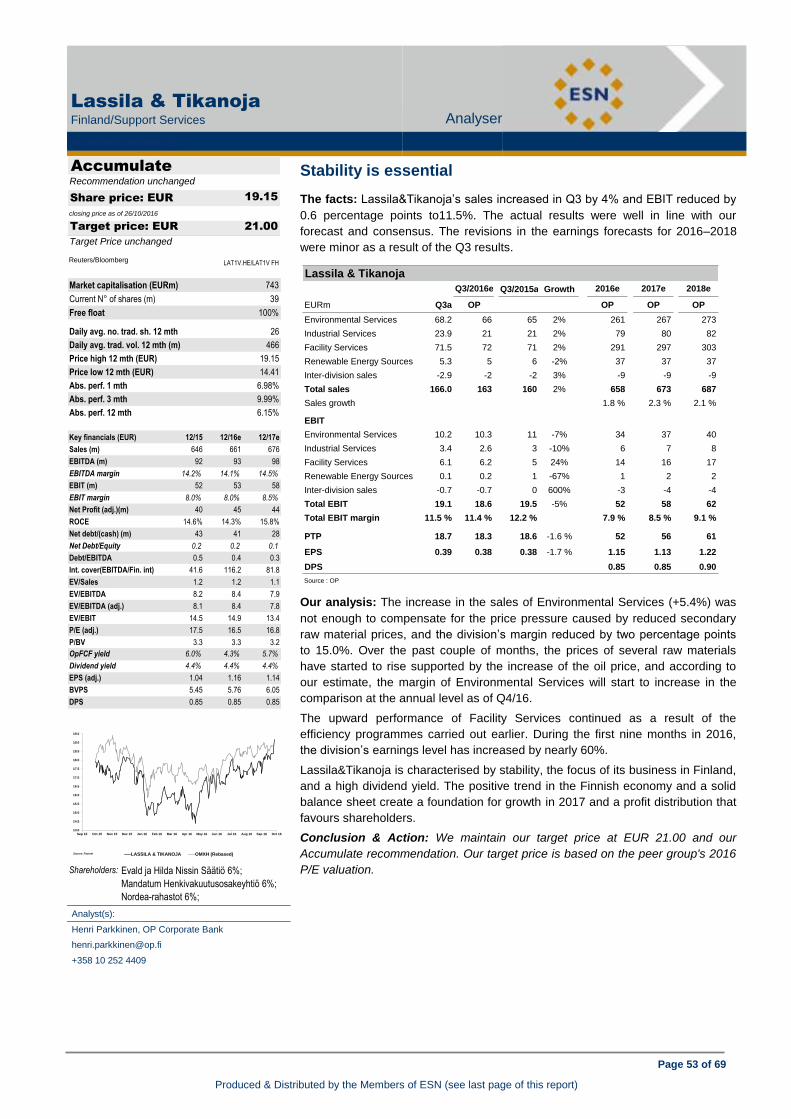
Page 53 of 69
Produced & Distributed by the Members of ESN (see last page of this report)
Lassila & Tikanoja
Q3/2015a Growth
EURm Q3a OP OP OP OP
Environmental Services 68.2 66 65 2% 261 267 273
Industrial Services 23.9 21 21 2% 79 80 82
Facility Services 71.5 72 71 2% 291 297 303
Renewable Energy Sources 5.3 5 6 -2% 37 37 37
Inter-division sales -2.9 -2 -2 3% -9 -9 -9
Total sales 166.0 163 160 2% 658 673 687
Sales growth 1.8 % 2.3 % 2.1 %
EBIT
Environmental Services 10.2 10.3 11 -7% 34 37 40
Industrial Services 3.4 2.6 3 -10% 6 7 8
Facility Services 6.1 6.2 5 24% 14 16 17
Renewable Energy Sources 0.1 0.2 1 -67% 1 2 2
Inter-division sales -0.7 -0.7 0 600% -3 -4 -4
Total EBIT 19.1 18.6 19.5 -5% 52 58 62
Total EBIT margin 11.5 % 11.4 % 12.2 % 7.9 % 8.5 % 9.1 %#DIV/0!
PTP 18.7 18.3 18.6 -1.6 % 52 56 61
EPS 0.39 0.38 0.38 -1.7 % 1.15 1.13 1.22#DIV/0!
DPS #DIV/0! 0.85 0.85 0.90
Source : OP
2017eQ3/2016e 2016e 2018e
Lassila & Tikanoja
Finland/Support Services Analyser
SUPPORT SERVICES
Lassila & Tikanoja (Accumulate) Q3 2016 Pre: uneventful quarter in sight
Stability is essential
The facts: Lassila&Tikanoja’s sales increased in Q3 by 4% and EBIT reduced by
0.6 percentage points to11.5%. The actual results were well in line with our
forecast and consensus. The revisions in the earnings forecasts for 2016–2018
were minor as a result of the Q3 results.
Our analysis: The increase in the sales of Environmental Services (+5.4%) was
not enough to compensate for the price pressure caused by reduced secondary
raw material prices, and the division’s margin reduced by two percentage points
to 15.0%. Over the past couple of months, the prices of several raw materials
have started to rise supported by the increase of the oil price, and according to
our estimate, the margin of Environmental Services will start to increase in the
comparison at the annual level as of Q4/16.
The upward performance of Facility Services continued as a result of the
efficiency programmes carried out earlier. During the first nine months in 2016,
the division’s earnings level has increased by nearly 60%.
Lassila&Tikanoja is characterised by stability, the focus of its business in Finland,
and a high dividend yield. The positive trend in the Finnish economy and a solid
balance sheet create a foundation for growth in 2017 and a profit distribution that
favours shareholders.
Conclusion & Action: We maintain our target price at EUR 21.00 and our
Accumulate recommendation. Our target price is based on the peer group's 2016
P/E valuation.
Analyst(s):
Henri Parkkinen, OP Corporate Bank
+358 10 252 4409
Accumulate
19.15
closing price as of 26/10/2016
21.00
Target Price unchanged
Recommendation unchanged
Target price: EUR
Share price: EUR
Reuters/Bloomberg LAT1V.HE/LAT1V FH
Market capitalisation (EURm) 743
Current N° of shares (m) 39
Free float 100%
Daily avg. no. trad. sh. 12 mth 26
Daily avg. trad. vol. 12 mth (m) 466
Price high 12 mth (EUR) 19.15
Price low 12 mth (EUR) 14.41
Abs. perf. 1 mth 6.98%
Abs. perf. 3 mth 9.99%
Abs. perf. 12 mth 6.15%
Key financials (EUR) 12/15 12/16e 12/17e
Sales (m) 646 661 676
EBITDA (m) 92 93 98
EBITDA margin 14.2% 14.1% 14.5%
EBIT (m) 52 53 58
EBIT margin 8.0% 8.0% 8.5%
Net Profit (adj.)(m) 40 45 44
ROCE 14.6% 14.3% 15.8%
Net debt/(cash) (m) 43 41 28
Net Debt/Equity 0.2 0.2 0.1
Debt/EBITDA 0.5 0.4 0.3
Int. cover(EBITDA/Fin. int) 41.6 116.2 81.8
EV/Sales 1.2 1.2 1.1
EV/EBITDA 8.2 8.4 7.9
EV/EBITDA (adj.) 8.1 8.4 7.8
EV/EBIT 14.5 14.9 13.4
P/E (adj.) 17.5 16.5 16.8
P/BV 3.3 3.3 3.2
OpFCF yield 6.0% 4.3% 5.7%
Dividend yield 4.4% 4.4% 4.4%
EPS (adj.) 1.04 1.16 1.14
BVPS 5.45 5.76 6.05
DPS 0.85 0.85 0.85
14.0
14.5
15.0
15.5
16.0
16.5
17.0
17.5
18.0
18.5
19.0
19.5
Sep 15 Oct 15 Nov 15 Dec 15 Jan 16 Feb 16 Mar 16 Apr 16 May 16 Jun 16 Jul 16 Aug 16 Sep 16 Oct 16
vvdsvdvsdy
LASSILA & TIKANOJA OMXH (Rebased)Source: Factset
Shareholders: Evald ja Hilda Nissin Säätiö 6%;
Mandatum Henkivakuutusosakeyhtiö 6%;
Nordea-rahastot 6%;
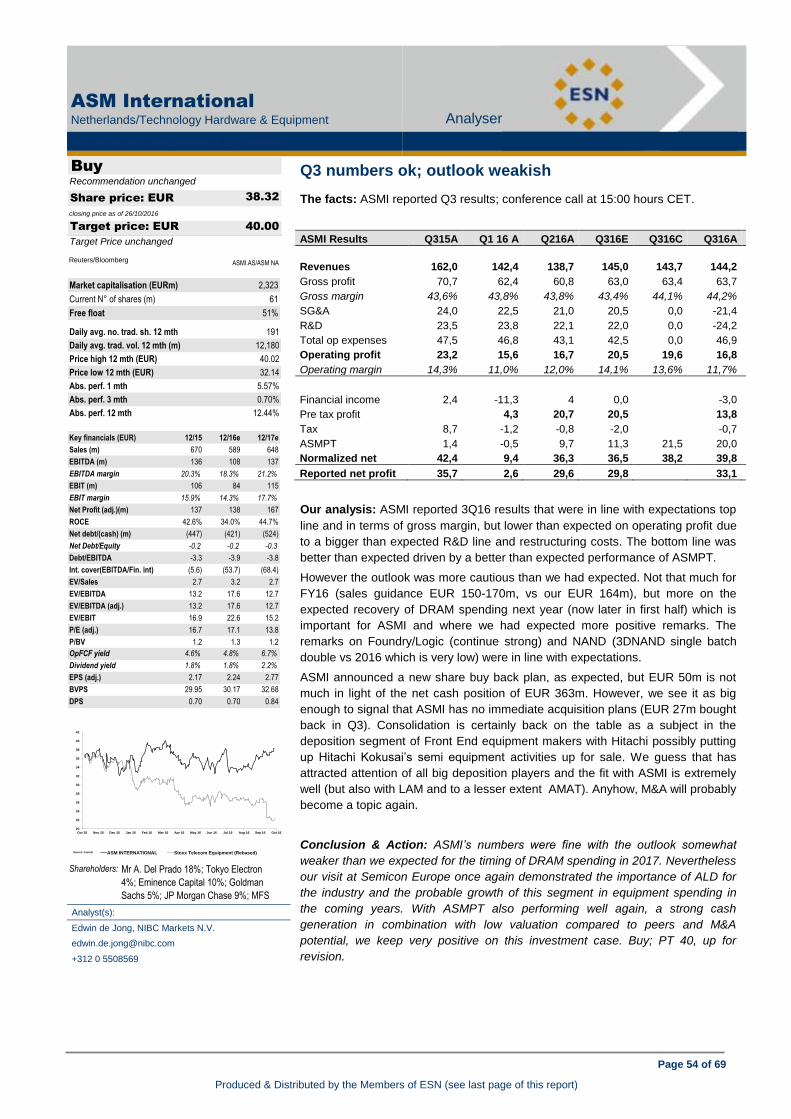
Page 54 of 69
Produced & Distributed by the Members of ESN (see last page of this report)
ASM International
Netherlands/Technology Hardware & Equipment Analyser
TECHNOLOGY HARDWARE & EQUIPMENT
ASM International (Buy) Stability is essential Buy
38.32
closing price as of 26/10/2016
40.00
Target Price unchanged
Recommendation unchanged
Target price: EUR
Share price: EUR
Reuters/Bloomberg ASMI.AS/ASM NA
Market capitalisation (EURm) 2,323
Current N° of shares (m) 61
Free float 51%
Daily avg. no. trad. sh. 12 mth 191
Daily avg. trad. vol. 12 mth (m) 12,180
Price high 12 mth (EUR) 40.02
Price low 12 mth (EUR) 32.14
Abs. perf. 1 mth 5.57%
Abs. perf. 3 mth 0.70%
Abs. perf. 12 mth 12.44%
Key financials (EUR) 12/15 12/16e 12/17e
Sales (m) 670 589 648
EBITDA (m) 136 108 137
EBITDA margin 20.3% 18.3% 21.2%
EBIT (m) 106 84 115
EBIT margin 15.9% 14.3% 17.7%
Net Profit (adj.)(m) 137 138 167
ROCE 42.6% 34.0% 44.7%
Net debt/(cash) (m) (447) (421) (524)
Net Debt/Equity -0.2 -0.2 -0.3
Debt/EBITDA -3.3 -3.9 -3.8
Int. cover(EBITDA/Fin. int) (5.6) (53.7) (68.4)
EV/Sales 2.7 3.2 2.7
EV/EBITDA 13.2 17.6 12.7
EV/EBITDA (adj.) 13.2 17.6 12.7
EV/EBIT 16.9 22.6 15.2
P/E (adj.) 16.7 17.1 13.8
P/BV 1.2 1.3 1.2
OpFCF yield 4.6% 4.8% 6.7%
Dividend yield 1.8% 1.8% 2.2%
EPS (adj.) 2.17 2.24 2.77
BVPS 29.95 30.17 32.68
DPS 0.70 0.70 0.84
Q3 numbers ok; outlook weakish
The facts: ASMI reported Q3 results; conference call at 15:00 hours CET.
ASMI Results Q315A Q1 16 A Q216A Q316E Q316C Q316A Q416E
Revenues 162,0 142,4 138,7 145,0 143,7 144,2 164,0
Gross profit 70,7 62,4 60,8 63,0 63,4 63,7 69,5
Gross margin 43,6% 43,8% 43,8% 43,4% 44,1% 44,2% 42,3%
SG&A 24,0 22,5 21,0 20,5 0,0 -21,4 19,7
R&D 23,5 23,8 22,1 22,0 0,0 -24,2 20,5
Total op expenses 47,5 46,8 43,1 42,5 0,0 46,9 39,7
Operating profit 23,2 15,6 16,7 20,5 19,6 16,8 35,2
Operating margin 14,3% 11,0% 12,0% 14,1% 13,6% 11,7% 21,4%
Financial income 2,4 -11,3 4 0,0 -3,0 9,3
Pre tax profit 4,3 20,7 20,5 13,8 40,8
Tax 8,7 -1,2 -0,8 -2,0 -0,7 -7,5
ASMPT 1,4 -0,5 9,7 11,3 21,5 20,0 -7,5
Normalized net 42,4 9,4 36,3 36,5 38,2 39,8 0,6
Reported net profit 35,7 2,6 29,6 29,8 33,1 29,6
Our analysis: ASMI reported 3Q16 results that were in line with expectations top
line and in terms of gross margin, but lower than expected on operating profit due
to a bigger than expected R&D line and restructuring costs. The bottom line was
better than expected driven by a better than expected performance of ASMPT.
However the outlook was more cautious than we had expected. Not that much for
FY16 (sales guidance EUR 150-170m, vs our EUR 164m), but more on the
expected recovery of DRAM spending next year (now later in first half) which is
important for ASMI and where we had expected more positive remarks. The
remarks on Foundry/Logic (continue strong) and NAND (3DNAND single batch
double vs 2016 which is very low) were in line with expectations.
ASMI announced a new share buy back plan, as expected, but EUR 50m is not
much in light of the net cash position of EUR 363m. However, we see it as big
enough to signal that ASMI has no immediate acquisition plans (EUR 27m bought
back in Q3). Consolidation is certainly back on the table as a subject in the
deposition segment of Front End equipment makers with Hitachi possibly putting
up Hitachi Kokusai’s semi equipment activities up for sale. We guess that has
attracted attention of all big deposition players and the fit with ASMI is extremely
well (but also with LAM and to a lesser extent AMAT). Anyhow, M&A will probably
become a topic again.
Conclusion & Action: ASMI’s numbers were fine with the outlook somewhat
weaker than we expected for the timing of DRAM spending in 2017. Nevertheless
our visit at Semicon Europe once again demonstrated the importance of ALD for
the industry and the probable growth of this segment in equipment spending in
the coming years. With ASMPT also performing well again, a strong cash
generation in combination with low valuation compared to peers and M&A
potential, we keep very positive on this investment case. Buy; PT 40, up for
revision.
20
22
24
26
28
30
32
34
36
38
40
42
Oct 15 Nov 15 Dec 15 Jan 16 Feb 16 Mar 16 Apr 16 May 16 Jun 16 Jul 16 Aug 16 Sep 16 Oct 16
vvdsvdvsdy
ASM INTERNATIONAL Stoxx Telecom Equipment (Rebased)Source: Factset Shareholders: Mr A. Del Prado 18%; Tokyo Electron
4%; Eminence Capital 10%; Goldman
Sachs 5%; JP Morgan Chase 9%; MFS
5%; ING 3%; Schroders 3%;
Analyst(s):
Edwin de Jong, NIBC Markets N.V.
+312 0 5508569

Page 55 of 69
Produced & Distributed by the Members of ESN (see last page of this report)
Besi
Netherlands/Technology Hardware & Equipment Analyser
TECHNOLOGY HARDWARE & EQUIPMENT
Besi (Neutral) Q3 numbers ok; outlook weakish Neutral
31.79
closing price as of 20/10/2016
25.00
Target Price unchanged
Recommendation unchanged
Target price: EUR
Share price: EUR
Reuters/Bloomberg BESI.AS/BESI NA
Market capitalisation (EURm) 1,188
Current N° of shares (m) 37
Free float 72%
Daily avg. no. trad. sh. 12 mth 219
Daily avg. trad. vol. 12 mth (m) 3,218
Price high 12 mth (EUR) 32.02
Price low 12 mth (EUR) 16.04
Abs. perf. 1 mth 10.38%
Abs. perf. 3 mth 21.34%
Abs. perf. 12 mth 98.38%
Key financials (EUR) 12/15 12/16e 12/17e
Sales (m) 349 370 407
EBITDA (m) 73 88 83
EBITDA margin 20.8% 23.8% 20.5%
EBIT (m) 58 73 67
EBIT margin 16.6% 19.6% 16.5%
Net Profit (adj.)(m) 49 64 59
ROCE 22.4% 26.2% 23.4%
Net debt/(cash) (m) (136) (117) (127)
Net Debt/Equity -0.4 -0.4 -0.4
Debt/EBITDA -1.9 -1.3 -1.5
EV/Sales 1.6 2.9 2.6
EV/EBITDA 7.8 12.2 12.8
EV/EBITDA (adj.) 7.8 12.2 12.8
EV/EBIT 9.8 14.8 15.9
P/E (adj.) 14.4 18.7 20.4
P/BV 2.1 3.6 3.4
OpFCF yield 9.4% 3.9% 4.0%
Dividend yield 3.8% 3.1% 3.3%
EPS (adj.) 1.29 1.70 1.56
BVPS 8.72 8.79 9.31
DPS 1.20 1.00 1.04
Another strong quarter
The facts: Besi reported Q3 results; conference call at 16:00 hours CET.
Besi key figures 15Q3 16Q2E 16Q2A 16Q3E 16Q3A
Revenue 72,1 98,8 109,0 92,7 94,3
Gross profit 35,1 48,2 55,5 46,0 47,6
Gross margin 48,7% 48,8% 50,9% 49,6% 50,5%
Total opex -28,7 -30,1 -29,1 -28,4 -28,2
Operating income 6,4 18,1 26,3 17,6 19,5
Operating margin 8,9% 18,3% 24,2% 19,0% 20,7%
Financial result 0,8 -0,1 -0,5 -0,1 -0,9
EBT 7,3 18,0 25,8 17,5 18,6
Tax -1,0 -2,0 -1,8 -1,9 -2,1
Tax rate -13,3% -11,0% -6,9% -11,0% -11,3%
Net income (loss) 6,3 16,0 24,0 15,6 16,6
Our analysis: Besi reported strong results again. Revenues came in ahead of
guidance and margins were better than expected as well. Mobile and Automotive
were the most important drivers. Demand for advanced packaging equipment is
on the rise and Besi has a very strong proposition especially in parts of the
market that are growing fastest. Fan out wafer level packaging was the buzz word
in 2016, also at Semicon Europe the last few days, and Besi has a dominant
position in this type of equipment. Biggest clients in the quarter were Taiwanese
and Chinese subcontractors buying Die attach systems (especially epoxy borders
for fingerprint sensor).
Besi initiates a new share purchase plan for 1m shares in addition to the current
program (3.7m shares) that runs to oktober 2017. The comfortable net cash
position of EUR 132m (Q2 EUR 111m) provides more than enough headroom to
return money to shareholders.
Revenue guidance is below our expectations (-10-15%), where we saw a more
sable development, while gross margins will be in the 49-51% range again, in line
with estimates. 2016 was well ahead of industry expectations and 2017 is also
expected to be strong. In general terms also at Semicon Europe it became clear
that the Back End is getting more and more important vs the still dominant Front
End.
Conclusion & Action: Again a very strong quarter for Besi. While the Q4 outlook
is somewhat weaker than expected in revenue terms, we look forward to another
strong year for the back end equipment industry in 2017 and Besi will certainly
benefit from that. We still have to adjust our numbers and PT, but have become
much more positive in the last months. For now, we have a Neutral rating and PT
of EUR 25.
12
14
16
18
20
22
24
26
28
30
32
34
Sep 15 Oct 15 Nov 15 Dec 15 Jan 16 Feb 16 Mar 16 Apr 16 May 16 Jun 16 Jul 16 Aug 16 Sep 16 Oct 16
vvdsvdvsdy
BESI Stoxx Telecom Equipment (Rebased)Source: Factset Shareholders: D. Lindenbergh 3%; Darlin 6%; Via Finis
3%; Kempen Oranje Participaties 6%; JP
Morgan 3%; UBS 3%; LSV 3%; Analyst(s):
Edwin de Jong, NIBC Markets N.V.
+312 0 5508569

Page 56 of 69
Produced & Distributed by the Members of ESN (see last page of this report)
Ingenico
France/Technology Hardware & Equipment Analyser
TECHNOLOGY HARDWARE & EQUIPMENT
Ingenico (Buy) Another strong quarter
Mixed trends with no improvement in the outlook
The facts: Ingenico published 2016 Q3 revenue yesterday evening, which came
out at EUR570m, with organic growth of +7%, higher than our anticipations and
those of the consensus (EUR560m/EUR550m respectively).
Our analysis: The company shows very mixed trends, with the US in freefall at -
31% while Europe at +22% and the ePayment activity at +22% both turned in
exceptional performances. The outlook for the end of the year has not improved
for all that, with the growth guidance unchanged at +7%.
North America: no sign of an improvement and revenue coming out well
below expectations for the region. An improvement is not expected before
2017 due to a less challenging comparison base and the potential resumption
of migration in H2 ahead of the new liability shift on 1 April 2018.
Latin America: down 24% over the quarter, the region remains paralysed by
Brazil, even if there has been a very slight improvement in trend (-27% in Q2).
The trend towards stabilisation is likely to continue and to benefit from a
favourable comparison base in Q2-17.
Europe & Africa: up by a sharp +22%, driven by the migration of terminals to
PCI V1 to V3 in the UK and in the Nordic countries. This trend is expected to
decline as migration progresses (PCI V1 HS in 2017).
ePayment: this activity benefited significantly from new contracts, notably
the Alipay contract. Up by +22%, the activity was also driven by sharp growth
in transaction volumes, which can be seen as a one-off factor.
Conclusion & Action: Although this publication is better than expected, the
outlook shows no improvement. Q4 is likely to see a sharp slowdown, as
anticipated. Although the risk of a downward revision for 2017 remains, we feel
the share is undervalued at present (PER 2016/17 of 18.5x and 15.5x vs.
historical level of 25x).
Analyst(s):
Kévin Woringer, CM - CIC Market Solutions
+33 1 53 48 80 69
Buy
75.17
closing price as of 26/10/2016
112.00
Target Price unchanged
Recommendation unchanged
Target price: EUR
Share price: EUR
Reuters/Bloomberg INGC.PA/ING FP
Market capitalisation (EURm) 4,585
Current N° of shares (m) 61
Free float 83%
Daily avg. no. trad. sh. 12 mth 277
Daily avg. trad. vol. 12 mth (m) 20,955
Price high 12 mth (EUR) 121.30
Price low 12 mth (EUR) 70.14
Abs. perf. 1 mth -3.55%
Abs. perf. 3 mth -31.57%
Abs. perf. 12 mth -28.10%
Key financials (EUR) 12/15 12/16e 12/17e
Sales (m) 2,197 2,296 2,514
EBITDA (m) 436 404 478
EBITDA margin 19.8% 17.6% 19.0%
EBIT (m) 381 346 415
EBIT margin 17.3% 15.1% 16.5%
Net Profit (adj.)(m) 268 252 300
ROCE 13.5% 12.1% 14.6%
Net debt/(cash) (m) 252 129 (86)
Net Debt/Equity 0.2 0.1 0.0
Debt/EBITDA 0.6 0.3 -0.2
Int. cover(EBITDA/Fin. int) 28.1 32.3 41.7
EV/Sales 3.3 2.1 1.8
EV/EBITDA 16.8 11.7 9.4
EV/EBITDA (adj.) 16.5 11.6 9.3
EV/EBIT 19.2 13.6 10.8
P/E (adj.) 26.3 18.2 15.3
P/BV 4.8 2.9 2.6
OpFCF yield 3.9% 5.1% 6.4%
Dividend yield 1.7% 1.7% 2.0%
EPS (adj.) 4.42 4.12 4.91
BVPS 24.21 26.20 29.22
DPS 1.30 1.25 1.52
60
70
80
90
100
110
120
130
Oct 15 Nov 15 Dec 15 Jan 16 Feb 16 Mar 16 Apr 16 May 16 Jun 16 Jul 16 Aug 16 Sep 16 Oct 16
vvdsvdvsdy
INGENICO Stoxx Telecom Equipment (Rebased)Source: Factset
Shareholders: BPI France Participations 5%; Allianz
Global Investors 6%; Jupiter 5%;
Treasury shares 0.45%;
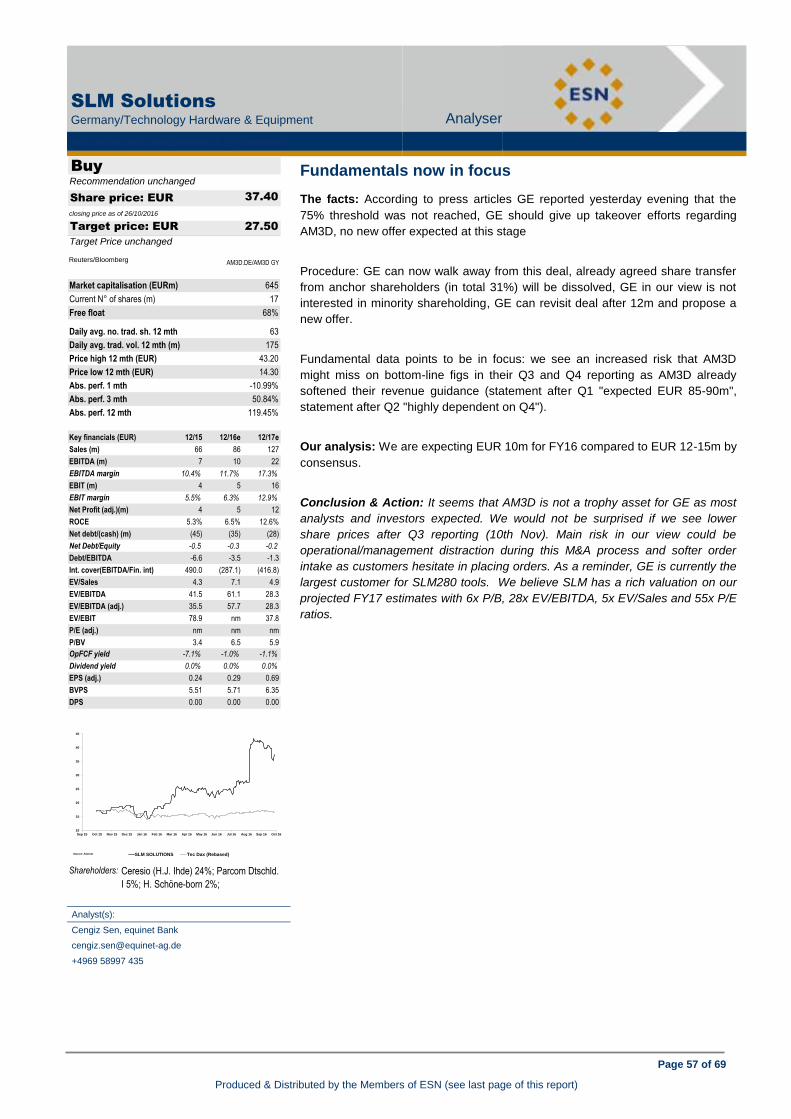
Page 57 of 69
Produced & Distributed by the Members of ESN (see last page of this report)
SLM Solutions
Germany/Technology Hardware & Equipment Analyser
TECHNOLOGY HARDWARE & EQUIPMENT
SLM Solutions (Buy) Mixed trends with no improvement in the outlook
Fundamentals now in focus
The facts: According to press articles GE reported yesterday evening that the
75% threshold was not reached, GE should give up takeover efforts regarding
AM3D, no new offer expected at this stage
Procedure: GE can now walk away from this deal, already agreed share transfer
from anchor shareholders (in total 31%) will be dissolved, GE in our view is not
interested in minority shareholding, GE can revisit deal after 12m and propose a
new offer.
Fundamental data points to be in focus: we see an increased risk that AM3D
might miss on bottom-line figs in their Q3 and Q4 reporting as AM3D already
softened their revenue guidance (statement after Q1 "expected EUR 85-90m",
statement after Q2 "highly dependent on Q4").
Our analysis: We are expecting EUR 10m for FY16 compared to EUR 12-15m by
consensus.
Conclusion & Action: It seems that AM3D is not a trophy asset for GE as most
analysts and investors expected. We would not be surprised if we see lower
share prices after Q3 reporting (10th Nov). Main risk in our view could be
operational/management distraction during this M&A process and softer order
intake as customers hesitate in placing orders. As a reminder, GE is currently the
largest customer for SLM280 tools. We believe SLM has a rich valuation on our
projected FY17 estimates with 6x P/B, 28x EV/EBITDA, 5x EV/Sales and 55x P/E
ratios.
Analyst(s):
Cengiz Sen, equinet Bank
+4969 58997 435
Buy
37.40
closing price as of 26/10/2016
27.50
Target Price unchanged
Recommendation unchanged
Target price: EUR
Share price: EUR
Reuters/Bloomberg AM3D.DE/AM3D GY
Market capitalisation (EURm) 645
Current N° of shares (m) 17
Free float 68%
Daily avg. no. trad. sh. 12 mth 63
Daily avg. trad. vol. 12 mth (m) 175
Price high 12 mth (EUR) 43.20
Price low 12 mth (EUR) 14.30
Abs. perf. 1 mth -10.99%
Abs. perf. 3 mth 50.84%
Abs. perf. 12 mth 119.45%
Key financials (EUR) 12/15 12/16e 12/17e
Sales (m) 66 86 127
EBITDA (m) 7 10 22
EBITDA margin 10.4% 11.7% 17.3%
EBIT (m) 4 5 16
EBIT margin 5.5% 6.3% 12.9%
Net Profit (adj.)(m) 4 5 12
ROCE 5.3% 6.5% 12.6%
Net debt/(cash) (m) (45) (35) (28)
Net Debt/Equity -0.5 -0.3 -0.2
Debt/EBITDA -6.6 -3.5 -1.3
Int. cover(EBITDA/Fin. int) 490.0 (287.1) (416.8)
EV/Sales 4.3 7.1 4.9
EV/EBITDA 41.5 61.1 28.3
EV/EBITDA (adj.) 35.5 57.7 28.3
EV/EBIT 78.9 nm 37.8
P/E (adj.) nm nm nm
P/BV 3.4 6.5 5.9
OpFCF yield -7.1% -1.0% -1.1%
Dividend yield 0.0% 0.0% 0.0%
EPS (adj.) 0.24 0.29 0.69
BVPS 5.51 5.71 6.35
DPS 0.00 0.00 0.00
10
15
20
25
30
35
40
45
Sep 15 Oct 15 Nov 15 Dec 15 Jan 16 Feb 16 Mar 16 Apr 16 May 16 Jun 16 Jul 16 Aug 16 Sep 16 Oct 16
vvdsvdvsdy
SLM SOLUTIONS Tec Dax (Rebased)Source: Factset
Shareholders: Ceresio (H.J. Ihde) 24%; Parcom Dtschld.
I 5%; H. Schöne-born 2%;
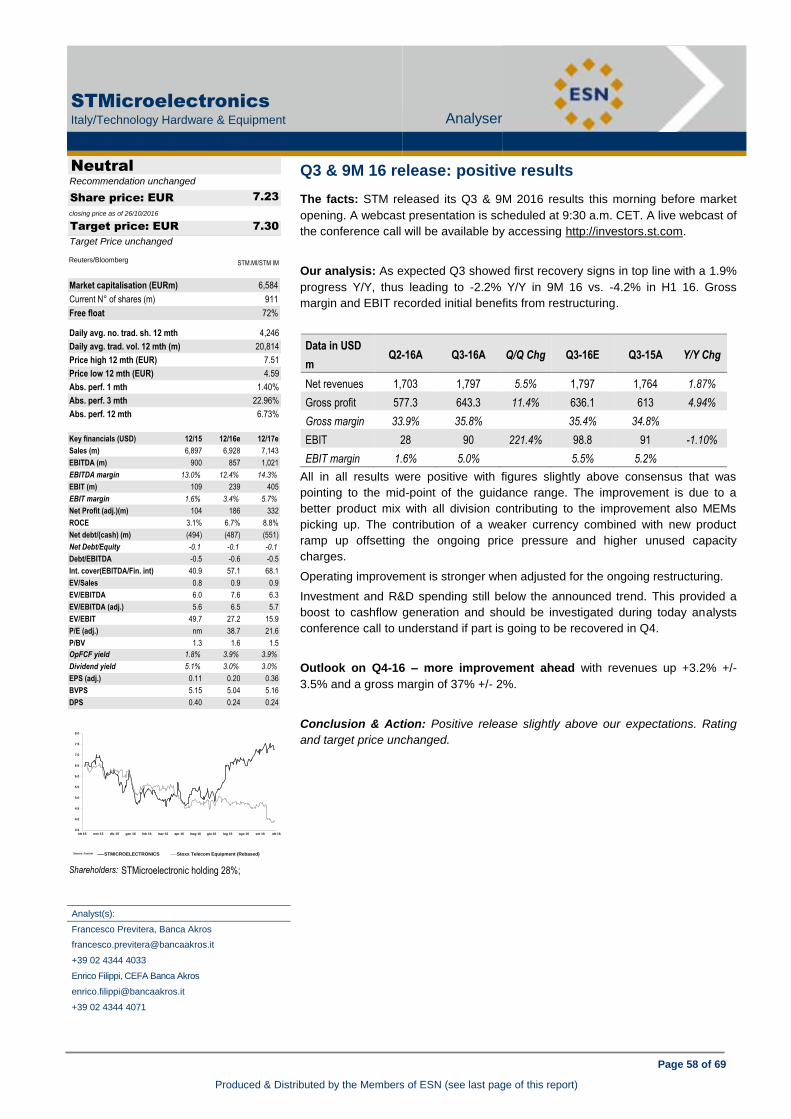
Page 58 of 69
Produced & Distributed by the Members of ESN (see last page of this report)
STMicroelectronics
Italy/Technology Hardware & Equipment Analyser
TECHNOLOGY HARDWARE & EQUIPMENT
STMicroelectronics (Neutral) Fundamentals now in focus
Q3 & 9M 16 release: positive results
The facts: STM released its Q3 & 9M 2016 results this morning before market
opening. A webcast presentation is scheduled at 9:30 a.m. CET. A live webcast of
the conference call will be available by accessing http://investors.st.com.
Our analysis: As expected Q3 showed first recovery signs in top line with a 1.9%
progress Y/Y, thus leading to -2.2% Y/Y in 9M 16 vs. -4.2% in H1 16. Gross
margin and EBIT recorded initial benefits from restructuring.
Data in USD
m Q2-16A Q3-16A Q/Q Chg Q3-16E Q3-15A Y/Y Chg
Net revenues 1,703 1,797 5.5% 1,797 1,764 1.87%
Gross profit 577.3 643.3 11.4% 636.1 613 4.94%
Gross margin 33.9% 35.8%
35.4% 34.8%
EBIT 28 90 221.4% 98.8 91 -1.10%
EBIT margin 1.6% 5.0%
5.5% 5.2%
All in all results were positive with figures slightly above consensus that was
pointing to the mid-point of the guidance range. The improvement is due to a
better product mix with all division contributing to the improvement also MEMs
picking up. The contribution of a weaker currency combined with new product
ramp up offsetting the ongoing price pressure and higher unused capacity
charges.
Operating improvement is stronger when adjusted for the ongoing restructuring.
Investment and R&D spending still below the announced trend. This provided a
boost to cashflow generation and should be investigated during today analysts
conference call to understand if part is going to be recovered in Q4.
Outlook on Q4-16 – more improvement ahead with revenues up +3.2% +/-
3.5% and a gross margin of 37% +/- 2%.
Conclusion & Action: Positive release slightly above our expectations. Rating
and target price unchanged.
Analyst(s):
Francesco Previtera, Banca Akros
+39 02 4344 4033
Enrico Filippi, CEFA Banca Akros
+39 02 4344 4071
Neutral
7.23
closing price as of 26/10/2016
7.30
Target Price unchanged
Recommendation unchanged
Target price: EUR
Share price: EUR
Reuters/Bloomberg STM.MI/STM IM
Market capitalisation (EURm) 6,584
Current N° of shares (m) 911
Free float 72%
Daily avg. no. trad. sh. 12 mth 4,246
Daily avg. trad. vol. 12 mth (m) 20,814
Price high 12 mth (EUR) 7.51
Price low 12 mth (EUR) 4.59
Abs. perf. 1 mth 1.40%
Abs. perf. 3 mth 22.96%
Abs. perf. 12 mth 6.73%
Key financials (USD) 12/15 12/16e 12/17e
Sales (m) 6,897 6,928 7,143
EBITDA (m) 900 857 1,021
EBITDA margin 13.0% 12.4% 14.3%
EBIT (m) 109 239 405
EBIT margin 1.6% 3.4% 5.7%
Net Profit (adj.)(m) 104 186 332
ROCE 3.1% 6.7% 8.8%
Net debt/(cash) (m) (494) (487) (551)
Net Debt/Equity -0.1 -0.1 -0.1
Debt/EBITDA -0.5 -0.6 -0.5
Int. cover(EBITDA/Fin. int) 40.9 57.1 68.1
EV/Sales 0.8 0.9 0.9
EV/EBITDA 6.0 7.6 6.3
EV/EBITDA (adj.) 5.6 6.5 5.7
EV/EBIT 49.7 27.2 15.9
P/E (adj.) nm 38.7 21.6
P/BV 1.3 1.6 1.5
OpFCF yield 1.8% 3.9% 3.9%
Dividend yield 5.1% 3.0% 3.0%
EPS (adj.) 0.11 0.20 0.36
BVPS 5.15 5.04 5.16
DPS 0.40 0.24 0.24
3.5
4.0
4.5
5.0
5.5
6.0
6.5
7.0
7.5
8.0
ott 15 nov 15 dic 15 gen 16 feb 16 mar 16 apr 16 mag 16 giu 16 lug 16 ago 16 set 16 ott 16
vvdsvdvsdy
STMICROELECTRONICS Stoxx Telecom Equipment (Rebased)Source: Factset
Shareholders: STMicroelectronic holding 28%;

Page 59 of 69
Produced & Distributed by the Members of ESN (see last page of this report)
KPN Telecom
Netherlands/Telecommunications Analyser
TELECOMMUNICATIONS
KPN Telecom (Buy) Q3 & 9M 16 release: positive results Buy
2.91
closing price as of 26/10/2016
3.55
Target Price unchanged
Recommendation unchanged
Target price: EUR
Share price: EUR
Reuters/Bloomberg KPN.AS/KPN NA
Market capitalisation (EURm) 12,408
Current N° of shares (m) 4,260
Free float 65%
Daily avg. no. trad. sh. 12 mth 12,020
Daily avg. trad. vol. 12 mth (m) 46,344
Price high 12 mth (EUR) 3.69
Price low 12 mth (EUR) 2.77
Abs. perf. 1 mth -1.99%
Abs. perf. 3 mth -5.30%
Abs. perf. 12 mth -14.45%
Key financials (EUR) 12/15 12/16e 12/17e
Sales (m) 7,008 6,873 6,807
EBITDA (m) 2,324 2,392 2,401
EBITDA margin 33.2% 34.8% 35.3%
EBIT (m) 708 806 856
EBIT margin 10.1% 11.7% 12.6%
Net Profit (adj.)(m) 503 758 501
ROCE 7.4% 9.5% 10.3%
Net debt/(cash) (m) 7,679 6,498 5,928
Net Debt/Equity 1.5 1.1 1.0
Debt/EBITDA 3.3 2.7 2.5
Int. cover(EBITDA/Fin. int) 22.1 7.3 9.0
EV/Sales 2.9 2.4 2.4
EV/EBITDA 8.7 6.9 6.7
EV/EBITDA (adj.) 8.7 6.9 6.7
EV/EBIT 28.6 20.6 18.7
P/E (adj.) 29.6 16.4 24.8
P/BV 3.0 2.2 2.1
OpFCF yield 6.1% 18.3% 9.5%
Dividend yield 3.9% 11.6% 3.9%
EPS (adj.) 0.12 0.18 0.12
BVPS 1.17 1.35 1.36
DPS 0.11 0.34 0.11
3Q16: EBITDA increases YoY but FCF disappoints
The facts: KPN has just reported its 3Q16 earnings, of which the key metrics are
shown below. KPN reiterated its guidance for the full year with an additional
qualification for FCF due to one-off elements. The Simplification program
achieved run-rate annual savings of EUR 405m, a key element in the target of
growing EBITDA.
KPN 3Q15Adj
NIBC
markets
3Q16E
KPN
consensus
3Q16
KPN
actual
2Q16
Sales adj 1,764 1,710 1,707 1,711
EBITDA adjusted 640 624 631 662
EBITDA margin (%) 36.3% 36.5% 37.0% 38.7%
Sales NL 1,551 1,501 1,506 1,518
EBITDA NL 646 620 623 657
EBITDA margin NL 41.7% 41.3% 41.4% 43.3%
Net income 87 39 45
FCF 213 246 146
Source: Company info, NIBC Markets
Our analysis: Due to price increases and installed base growth in post-paid and
fixed mobile bundles, revenue for the key Dutch division declined by only 1.9%,
the smallest decline in the last 4 quarters. However, key metrics such as net adds
in broadband and IPTV weakened considerably versus previous quarters
although they did remain in positive territory. Post-paid net adds were better
sequentially (+36k versus +23k in 2Q16) but if we look at the last 5 quarters, there
is a substantial weakening visible in this metric as well. Fixed mobile bundles
grew to 40% of the post-paid base, which provides a strong defence against
competition from Tele2 and Ziggo/Vodafone.
Due to the effects of the Simplification program and sales mix (Consumer
margins advanced by 110 basis points), adjusted EBITDA increased for the Dutch
division by 1.8% to EUR 657m, the first time that EBITDA increased year over
year in over 10 quarters! With more savings to come from Simplification and
further progress in Business, that bodes well for EBITDA.
FCF in 3Q16 disappointed looking at the headline numbers. KPN used EUR 23m
in additional cash for accrued interest on bonds tendered and EUR 40m to obtain
special discounts from suppliers in exchange for shorter payment terms. But even
if we adjust for those elements, FCF disappoints. As usual, KPN uses capex
phasing as an explanation but this is the 3rd
quarter in a row that we hear that
phrase.
Guidance for the full year remains unchanged with EBITDA in line with FY15
(year to date -0.8%), capex of around EUR 1.2bn and FCF > EUR 650m,
excluding one-off effects of the 3rd
quarter (EUR 52m net).
Conclusion & Action: A strong performance for KPN in the 3rd
quarter with
EBITDA of the key Dutch division finally improving after more than 10 quarters of
declines due to sales mix changes and the Simplification program. FCF
disappointed in 3Q16 but as the full year guidance is maintained, KPN’s FCF is
still set to improve considerably YoY, which is a key part of our investment case
which assumes strong growth in shareholder remuneration. KPN also continues
to be undervalued versus its peers while it should be trading at a modest
premium due to de-risking (pensions) and network investments.
2.4
2.6
2.8
3.0
3.2
3.4
3.6
3.8
Oct 15 Nov 15 Dec 15 Jan 16 Feb 16 Mar 16 Apr 16 May 16 Jun 16 Jul 16 Aug 16 Sep 16 Oct 16
vvdsvdvsdy
KPN TELECOM Stoxx Telecommunications (Rebased)Source: Factset Shareholders: America Moviles 20%; Norges Bank 3%;
Paulson 3%; Franklin Mutual 4%; UBS
2%; Analyst(s):
Martijn den Drijver, NIBC Markets N.V.
+312 0 5508636
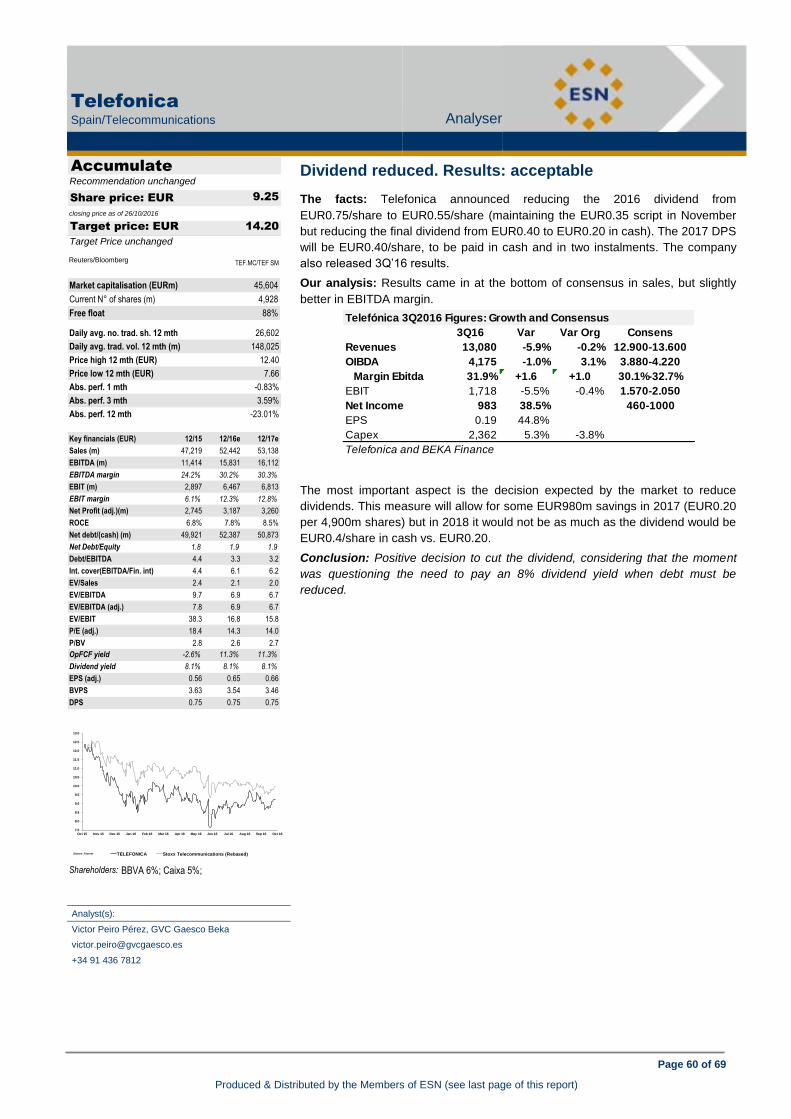
Page 60 of 69
Produced & Distributed by the Members of ESN (see last page of this report)
Telefonica
Spain/Telecommunications Analyser
TELECOMMUNICATIONS
Telefonica (Accumulate) 3Q16: EBITDA increases YoY but FCF disappoints
Dividend reduced. Results: acceptable
The facts: Telefonica announced reducing the 2016 dividend from
EUR0.75/share to EUR0.55/share (maintaining the EUR0.35 script in November
but reducing the final dividend from EUR0.40 to EUR0.20 in cash). The 2017 DPS
will be EUR0.40/share, to be paid in cash and in two instalments. The company
also released 3Q’16 results.
Our analysis: Results came in at the bottom of consensus in sales, but slightly
better in EBITDA margin.
The most important aspect is the decision expected by the market to reduce
dividends. This measure will allow for some EUR980m savings in 2017 (EUR0.20
per 4,900m shares) but in 2018 it would not be as much as the dividend would be
EUR0.4/share in cash vs. EUR0.20.
Conclusion: Positive decision to cut the dividend, considering that the moment
was questioning the need to pay an 8% dividend yield when debt must be
reduced.
Analyst(s):
Victor Peiro Pérez, GVC Gaesco Beka
+34 91 436 7812
Accumulate
9.25
closing price as of 26/10/2016
14.20
Target Price unchanged
Recommendation unchanged
Target price: EUR
Share price: EUR
Reuters/Bloomberg TEF.MC/TEF SM
Market capitalisation (EURm) 45,604
Current N° of shares (m) 4,928
Free float 88%
Daily avg. no. trad. sh. 12 mth 26,602
Daily avg. trad. vol. 12 mth (m) 148,025
Price high 12 mth (EUR) 12.40
Price low 12 mth (EUR) 7.66
Abs. perf. 1 mth -0.83%
Abs. perf. 3 mth 3.59%
Abs. perf. 12 mth -23.01%
Key financials (EUR) 12/15 12/16e 12/17e
Sales (m) 47,219 52,442 53,138
EBITDA (m) 11,414 15,831 16,112
EBITDA margin 24.2% 30.2% 30.3%
EBIT (m) 2,897 6,467 6,813
EBIT margin 6.1% 12.3% 12.8%
Net Profit (adj.)(m) 2,745 3,187 3,260
ROCE 6.8% 7.8% 8.5%
Net debt/(cash) (m) 49,921 52,387 50,873
Net Debt/Equity 1.8 1.9 1.9
Debt/EBITDA 4.4 3.3 3.2
Int. cover(EBITDA/Fin. int) 4.4 6.1 6.2
EV/Sales 2.4 2.1 2.0
EV/EBITDA 9.7 6.9 6.7
EV/EBITDA (adj.) 7.8 6.9 6.7
EV/EBIT 38.3 16.8 15.8
P/E (adj.) 18.4 14.3 14.0
P/BV 2.8 2.6 2.7
OpFCF yield -2.6% 11.3% 11.3%
Dividend yield 8.1% 8.1% 8.1%
EPS (adj.) 0.56 0.65 0.66
BVPS 3.63 3.54 3.46
DPS 0.75 0.75 0.75
Telefónica 3Q2016 Figures: Growth and Consensus
3Q16 Var Var Org Consens
Revenues 13,080 -5.9% -0.2% 12.900-13.600
OIBDA 4,175 -1.0% 3.1% 3.880-4.220
Margin Ebitda 31.9% +1.6 +1.0 30.1%-32.7%
EBIT 1,718 -5.5% -0.4% 1.570-2.050
Net Income 983 38.5% 460-1000
EPS 0.19 44.8%
Capex 2,362 5.3% -3.8%
Telefonica and BEKA Finance
7.5
8.0
8.5
9.0
9.5
10.0
10.5
11.0
11.5
12.0
12.5
13.0
Oct 15 Nov 15 Dec 15 Jan 16 Feb 16 Mar 16 Apr 16 May 16 Jun 16 Jul 16 Aug 16 Sep 16 Oct 16
vvdsvdvsdy
TELEFONICA Stoxx Telecommunications (Rebased)Source: Factset
Shareholders: BBVA 6%; Caixa 5%;

Page 61 of 69
Produced & Distributed by the Members of ESN (see last page of this report)
Int. Airlines Group
Spain/Travel & Leisure Analyser
TRAVEL & LEISURE
Int. Airlines Group (Buy) Dividend reduced. Results: acceptable
Agreement in principle of the NAPS
The facts: British Airways has signed an agreement in principle with the trustees
of its New Airways Pension Scheme (NAPS) on the scheme's regular triennial
valuation. The valuation is based on the scheme's funding position as at March
31, 2015. The main terms of the agreement are:
A technical deficit of GBP 2.8 bn (compared to GBP 2.7 bn at March 31,
2012, which was the basis for the last deficit recovery plan).
British Airways will make fixed deficit contributions of GBP 300 m/year until
2027.
The agreement provides British Airways with the flexibility to make dividend
payments to IAG. It also caps the level of additional contributions the airline
makes, based on its March 31 cash balance in any year, at GBP 150
m/year.
The slight increase in NAPS deficit between March 2012 and March 2015 is due
to a reduction in the interest rates used to discount the scheme's liabilities, partly
offset by contributions and investment returns.
Discussions on the actuarial valuation of the airline's Airways Pension Scheme
(APS) will resume once its current legal case has concluded.
Our analysis: Although there has been a slight increase in the technical deficit,
the difference is not very relevant, so we value positively the news as a relevant
uncertainty has been cleared up. The GBP 100m increase vs. an estimated
OPCF (post WCR) of EUR 18bn for 2016-20 is not a substantial impact.
There is still pending the revision of the APS (which at March 2012 had a
technical deficit of GBP 600m, being the combined one of both plans GBP
3.300m). We may have to slightly raise our estimated annual contributions to
both plans now accounting to EUR 1.9bn in our cash flow projections during
2016-20, but in any case compatible with the two main targets in cash
generation: sustained dividends and financial deleverage. We expect to annually
surpass a contribution of EUR 400/year vs. current range EUR 341-437m/year.
Conclusion and Action: Since we started coverage on IAG the stock has
raised +12% but it is still an attractive value option trading at 2017e EV/EBITDA
<3x vs. sector’s average c. 5x. Tomorrow IAG will release results and on
November 4 hold the CMD.
Analyst(s):
Sonia Ruiz De Garibay, GVC Gaesco Beka
+34 91 436 7841
Buy
4.74
closing price as of 26/10/2016
5.80
Target Price unchanged
Recommendation unchanged
Target price: EUR
Share price: EUR
Reuters/Bloomberg ICAG.MC/IAG SM
Market capitalisation (EURm) 10,112
Current N° of shares (m) 2,133
Free float 48%
Daily avg. no. trad. sh. 12 mth 6,398
Daily avg. trad. vol. 12 mth (m) 34,348
Price high 12 mth (EUR) 8.69
Price low 12 mth (EUR) 4.03
Abs. perf. 1 mth 4.24%
Abs. perf. 3 mth -0.65%
Abs. perf. 12 mth -43.99%
Key financials (EUR) 12/15 12/16e 12/17e
Sales (m) 22,858 23,154 23,166
EBITDA (m) 3,642 3,894 4,043
EBITDA margin 15.9% 16.8% 17.5%
EBIT (m) 2,335 2,582 2,702
EBIT margin 10.2% 11.2% 11.7%
Net Profit (adj.)(m) 1,539 1,833 1,963
ROCE 12.2% 13.3% 13.7%
Net debt/(cash) (m) 2,774 1,784 925
Net Debt/Equity 0.5 0.3 0.1
Debt/EBITDA 0.8 0.5 0.2
Int. cover(EBITDA/Fin. int) 14.5 15.0 18.0
EV/Sales 0.9 0.5 0.5
EV/EBITDA 5.5 3.1 2.8
EV/EBITDA (adj.) 5.5 3.1 2.8
EV/EBIT 8.6 4.7 4.2
P/E (adj.) 11.0 5.5 5.2
P/BV 3.2 1.5 1.2
OpFCF yield 1.8% 16.9% 16.6%
Dividend yield 4.2% 4.5% 5.0%
EPS (adj.) 0.75 0.86 0.92
BVPS 2.56 3.13 3.84
DPS 0.20 0.21 0.24
4.0
4.5
5.0
5.5
6.0
6.5
7.0
7.5
8.0
8.5
9.0
Oct 15 Nov 15 Dec 15 Jan 16 Feb 16 Mar 16 Apr 16 May 16 Jun 16 Jul 16 Aug 16 Sep 16 Oct 16
vvdsvdvsdy
INT. AIRLINES GROUP IBEX 35 (Rebased)Source: Factset
Shareholders: Qatar Airways 20%; Lansdowne 7%;
Standard Life Investment 6%;
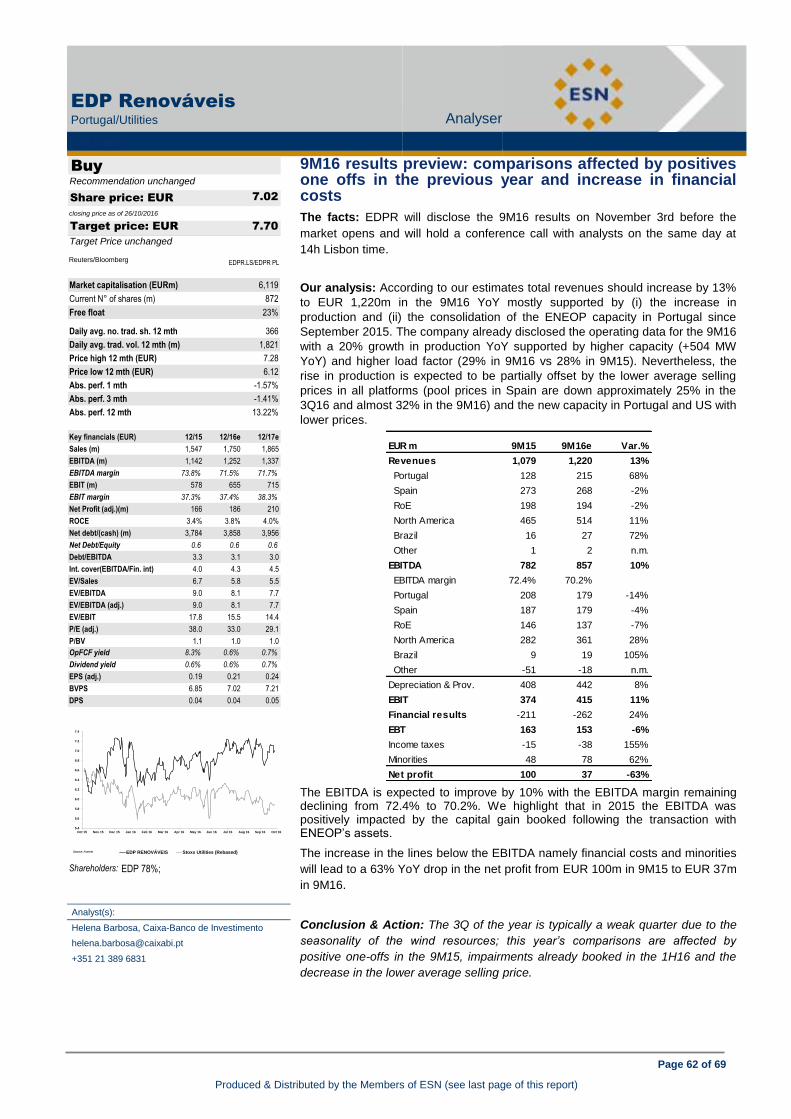
Page 62 of 69
Produced & Distributed by the Members of ESN (see last page of this report)
EDP Renováveis
Portugal/Utilities Analyser
UTILITIES
EDP Renováveis (Buy) Agreement in principle of the NAPS
9M16 results preview: comparisons affected by positives one offs in the previous year and increase in financial costs
The facts: EDPR will disclose the 9M16 results on November 3rd before the
market opens and will hold a conference call with analysts on the same day at
14h Lisbon time.
Our analysis: According to our estimates total revenues should increase by 13%
to EUR 1,220m in the 9M16 YoY mostly supported by (i) the increase in
production and (ii) the consolidation of the ENEOP capacity in Portugal since
September 2015. The company already disclosed the operating data for the 9M16
with a 20% growth in production YoY supported by higher capacity (+504 MW
YoY) and higher load factor (29% in 9M16 vs 28% in 9M15). Nevertheless, the
rise in production is expected to be partially offset by the lower average selling
prices in all platforms (pool prices in Spain are down approximately 25% in the
3Q16 and almost 32% in the 9M16) and the new capacity in Portugal and US with
lower prices.
The EBITDA is expected to improve by 10% with the EBITDA margin remaining declining from 72.4% to 70.2%. We highlight that in 2015 the EBITDA was positively impacted by the capital gain booked following the transaction with ENEOP’s assets.
The increase in the lines below the EBITDA namely financial costs and minorities
will lead to a 63% YoY drop in the net profit from EUR 100m in 9M15 to EUR 37m
in 9M16.
Conclusion & Action: The 3Q of the year is typically a weak quarter due to the
seasonality of the wind resources; this year’s comparisons are affected by
positive one-offs in the 9M15, impairments already booked in the 1H16 and the
decrease in the lower average selling price.
Analyst(s):
Helena Barbosa, Caixa-Banco de Investimento
+351 21 389 6831
Buy
7.02
closing price as of 26/10/2016
7.70
Target Price unchanged
Recommendation unchanged
Target price: EUR
Share price: EUR
Reuters/Bloomberg EDPR.LS/EDPR PL
Market capitalisation (EURm) 6,119
Current N° of shares (m) 872
Free float 23%
Daily avg. no. trad. sh. 12 mth 366
Daily avg. trad. vol. 12 mth (m) 1,821
Price high 12 mth (EUR) 7.28
Price low 12 mth (EUR) 6.12
Abs. perf. 1 mth -1.57%
Abs. perf. 3 mth -1.41%
Abs. perf. 12 mth 13.22%
Key financials (EUR) 12/15 12/16e 12/17e
Sales (m) 1,547 1,750 1,865
EBITDA (m) 1,142 1,252 1,337
EBITDA margin 73.8% 71.5% 71.7%
EBIT (m) 578 655 715
EBIT margin 37.3% 37.4% 38.3%
Net Profit (adj.)(m) 166 186 210
ROCE 3.4% 3.8% 4.0%
Net debt/(cash) (m) 3,784 3,858 3,956
Net Debt/Equity 0.6 0.6 0.6
Debt/EBITDA 3.3 3.1 3.0
Int. cover(EBITDA/Fin. int) 4.0 4.3 4.5
EV/Sales 6.7 5.8 5.5
EV/EBITDA 9.0 8.1 7.7
EV/EBITDA (adj.) 9.0 8.1 7.7
EV/EBIT 17.8 15.5 14.4
P/E (adj.) 38.0 33.0 29.1
P/BV 1.1 1.0 1.0
OpFCF yield 8.3% 0.6% 0.7%
Dividend yield 0.6% 0.6% 0.7%
EPS (adj.) 0.19 0.21 0.24
BVPS 6.85 7.02 7.21
DPS 0.04 0.04 0.05
EUR m 9M15 9M16e Var.%
Revenues 1,079 1,220 13%
Portugal 128 215 68%
Spain 273 268 -2%
RoE 198 194 -2%
North America 465 514 11%
Brazil 16 27 72%
Other 1 2 n.m.
EBITDA 782 857 10%
EBITDA margin 72.4% 70.2%
Portugal 208 179 -14%
Spain 187 179 -4%
RoE 146 137 -7%
North America 282 361 28%
Brazil 9 19 105%
Other -51 -18 n.m.
Depreciation & Prov. 408 442 8%
EBIT 374 415 11%
Financial results -211 -262 24%
EBT 163 153 -6%
Income taxes -15 -38 155%
Minorities 48 78 62%
Net profit 100 37 -63%
5.4
5.6
5.8
6.0
6.2
6.4
6.6
6.8
7.0
7.2
7.4
Oct 15 Nov 15 Dec 15 Jan 16 Feb 16 Mar 16 Apr 16 May 16 Jun 16 Jul 16 Aug 16 Sep 16 Oct 16
vvdsvdvsdy
EDP RENOVÁVEIS Stoxx Utilities (Rebased)Source: Factset
Shareholders: EDP 78%;

Page 63 of 69
Produced & Distributed by the Members of ESN (see last page of this report)
Terna
Italy/Utilities Analyser
UTILITIES
Terna (Neutral) 9M16 results preview: comparisons affected by positives one offs in the previous year and increase in financial costs
Not on the seaside this summer
The facts: according to the press, State Grid International Development of Hong
Kong has made the highest offer for ADMIE.
Our analysis: we remind readers that a consortium made of Terna and F2i had
submitted a binding offer for the acquisition of 24% of the capital of ADMIE, in
compliance with the tender procedure launched on 12 July 2016 by Public Power
Corporation (PPC), the owner of ADMIE.
ADMIE is the Hellenic electricity transmission system operator and it owns and
operates the national interconnected electricity transmission system, composed
by 11,529 km of transmission lines with a voltage of 66 – 400 kV and 310 high
voltage substations.
According to “Il Sole 24 Ore”, the offer made by the Italian consortium was in the
range of EUR 200m, which meant around EUR 100m capital commitment for
Terna.
According to the press, State Grid International Development of Hong Kong
offered around EUR 320m for the 24% of ADMIE.
Conclusion & Action: according to the press the offer made by the Chinese
group is the highest received by PPC, and thus the Italian consortium ought to be
out of the game. The timetable for the sale entails the choice of the buyer by the
end of October, while the closing is expected in Q1 17. The acquisition of a stake
in the Grrek TSO would be consistent with Terna’s goal to improve its
international presence in a rigorous manner. We remind readers that Terna’s
2016-2019 business plan foresees a financial commitment of around EUR
150/200m to pursue international projects able to support growth and value
creation in the long-term. We confirm our neutral stance on the stock.
Analyst(s):
Dario Michi, Banca Akros
+39 02 4344 4237
Neutral
4.45
closing price as of 26/10/2016
4.90
Target Price unchanged
Recommendation unchanged
Target price: EUR
Share price: EUR
Reuters/Bloomberg TRN.MI/TRN IM
Market capitalisation (EURm) 8,944
Current N° of shares (m) 2,010
Free float 70%
Daily avg. no. trad. sh. 12 mth 7,106
Daily avg. trad. vol. 12 mth (m) 20,072
Price high 12 mth (EUR) 5.08
Price low 12 mth (EUR) 4.25
Abs. perf. 1 mth -2.33%
Abs. perf. 3 mth -7.87%
Abs. perf. 12 mth -2.84%
Key financials (EUR) 12/15 12/16e 12/17e
Sales (m) 2,082 2,097 2,185
EBITDA (m) 1,539 1,517 1,604
EBITDA margin 73.9% 72.4% 73.4%
EBIT (m) 1,022 987 1,055
EBIT margin 49.1% 47.0% 48.3%
Net Profit (adj.)(m) 596 574 637
ROCE 5.5% 5.1% 5.5%
Net debt/(cash) (m) 8,003 8,306 8,438
Net Debt/Equity 2.4 2.4 2.3
Debt/EBITDA 5.2 5.5 5.3
Int. cover(EBITDA/Fin. int) 10.9 13.7 13.7
EV/Sales 8.6 8.4 8.1
EV/EBITDA 11.6 11.6 11.0
EV/EBITDA (adj.) 11.6 11.6 11.0
EV/EBIT 17.5 17.8 16.8
P/E (adj.) 16.1 15.6 14.0
P/BV 2.9 2.6 2.4
OpFCF yield 0.2% 1.1% 3.2%
Dividend yield 4.5% 4.6% 4.8%
EPS (adj.) 0.30 0.29 0.32
BVPS 1.65 1.74 1.85
DPS 0.20 0.21 0.21
3.8
4.0
4.2
4.4
4.6
4.8
5.0
5.2
set 15 ott 15 nov 15 dic 15 gen 16 feb 16 mar 16 apr 16 mag 16 giu 16 lug 16 ago 16 set 16 ott 16
vvdsvdvsdy
TERNA Stoxx Utilities (Rebased)Source: Factset
Shareholders: Cassa Depositi e Prestiti 30%;

Page 64 of 69
Produced & Distributed by the Members of ESN (see last page of this report)
European Coverage of the Members of ESN
A ero space & D efense M em(*) Bcp CBI Kemira OPG Corbion NIBC
Airbus Group CIC Bnp Paribas CIC Linde EQB Danone CIC
Dassault Aviation CIC Bper BAK Tikkurila OPG Ebro Foods GVC
Latecoere CIC Bpi CBIElectro nic & Electrical
EquipmentM em(*) Enervit BAK
Leonardo BAK Caixabank GVC Alstom CIC Fleury M ichon CIC
Lisi CIC Commerzbank EQB Areva CIC Forfarmers NIBC
M tu EQB Credem BAK Euromicron Ag EQB Heineken NIBC
Ohb Se EQB Credit Agrico le Sa CIC Kontron EQB Hkscan OPG
Safran CIC Creval BAK Legrand CIC La Doria BAK
Thales CIC Deutsche Bank EQB Neways Electronics NIBC Lanson-Bcc CIC
Zodiac Aerospace CIC Deutsche Pfandbriefbank EQB Nexans CIC Laurent Perrier CIC
A irlines M em(*) Eurobank IBG Pkc Group OPG Ldc CIC
Air France Klm CIC Ing Group NIBC Rexel CIC Naturex CIC
Finnair OPG Intesa Sanpaolo BAK Schneider Electric Se CIC Olvi OPG
Lufthansa EQB M ediobanca BAK Vaisala OPG Parmalat BAK
A uto mo biles & P arts M em(*) M erkur Bank EQB Viscom EQB Pernod Ricard CIC
Bittium Corporation OPG National Bank Of Greece IBG F inancial Services M em(*) Raisio OPG
Bmw EQB Natixis CIC Anima BAK Refresco Group NIBC
Brembo BAK Nordea OPG Athex Group IBG Remy Cointreau CIC
Continental EQB Piraeus Bank IBG Azimut BAK Vidrala GVC
Daimler Ag EQB Poste Italiane BAK Banca Generali BAK Vilmorin CIC
Elringklinger EQB Societe Generale CIC Banca Ifis BAK Viscofan GVC
Faurecia CIC Ubi Banca BAK Banca Sistema BAK Vranken Pommery M onopole CIC
Ferrari BAK Unicredit BAK Bb Biotech EQB Wessanen NIBC
Fiat Chrysler Automobiles BAK B asic R eso urces M em(*) Binckbank NIBC F o o d & D rug R etailers M em(*)
Landi Renzo BAK Acerinox GVC Bolsas Y M ercados Espanoles Sa GVC Ahold NIBC
Leoni EQB Altri CBI Capman OPG Carrefour CIC
M ichelin CIC Arcelormittal GVC Christian Dior CIC Casino Guichard-Perrachon CIC
Nokian Tyres OPG Corticeira Amorim CBI Cir BAK Dia GVC
Norma Group EQB Ence GVC Comdirect EQB Jeronimo M artins CBI
Piaggio BAK Europac GVC Corp. Financiera Alba GVC Kesko OPG
Plastic Omnium CIC M etka IBG Deutsche Boerse EQB M arr BAK
Sogefi BAK M etsä Board OPG Deutsche Forfait EQB M etro CIC
Stern Groep NIBC M ytilineos IBG Eq OPG Sligro NIBC
Valeo CIC Outokumpu OPG Euronext CIC Sonae CBI
Volkswagen EQB Semapa CBI Ferratum EQB General Industria ls M em(*)
B anks M em(*) Ssab OPG Finecobank BAK 2G Energy EQB
Aareal Bank EQB Stora Enso OPG Grenke EQB Aalberts NIBC
Abn Amro Group Nv NIBC Surteco EQB Hypoport Ag EQB Accell Group NIBC
Aktia OPG The Navigator Company CBI M lp EQB Ahlstrom OPG
Alpha Bank IBG Tubacex GVC Ovb Holding Ag EQB Arcadis NIBC
Banca Carige BAK Upm-Kymmene OPG Patrizia Ag EQB Aspo OPG
Banca M ps BAK B io techno lo gy M em(*) Rallye CIC Huhtamäki OPG
Banco Popolare BAK 4Sc EQB Unipol Gruppo Finanziario BAK Kendrion NIBC
Banco Popular GVC Cytotools Ag EQB F o o d & B everage M em(*) Nedap NIBC
Banco Sabadell GVC Epigenomics Ag EQB Acomo NIBC Pöyry OPG
Banco Santander GVC Wilex EQB Atria OPG Prelios BAK
Bankia GVC C hemicals M em(*) Bonduelle CIC Rubis CIC
Bankinter GVC Air Liquide CIC Campari BAK Saf-Holland EQB
Bbva GVC Holland Colours NIBC Coca Cola Hbc Ag IBG Serge Ferrari Group CIC
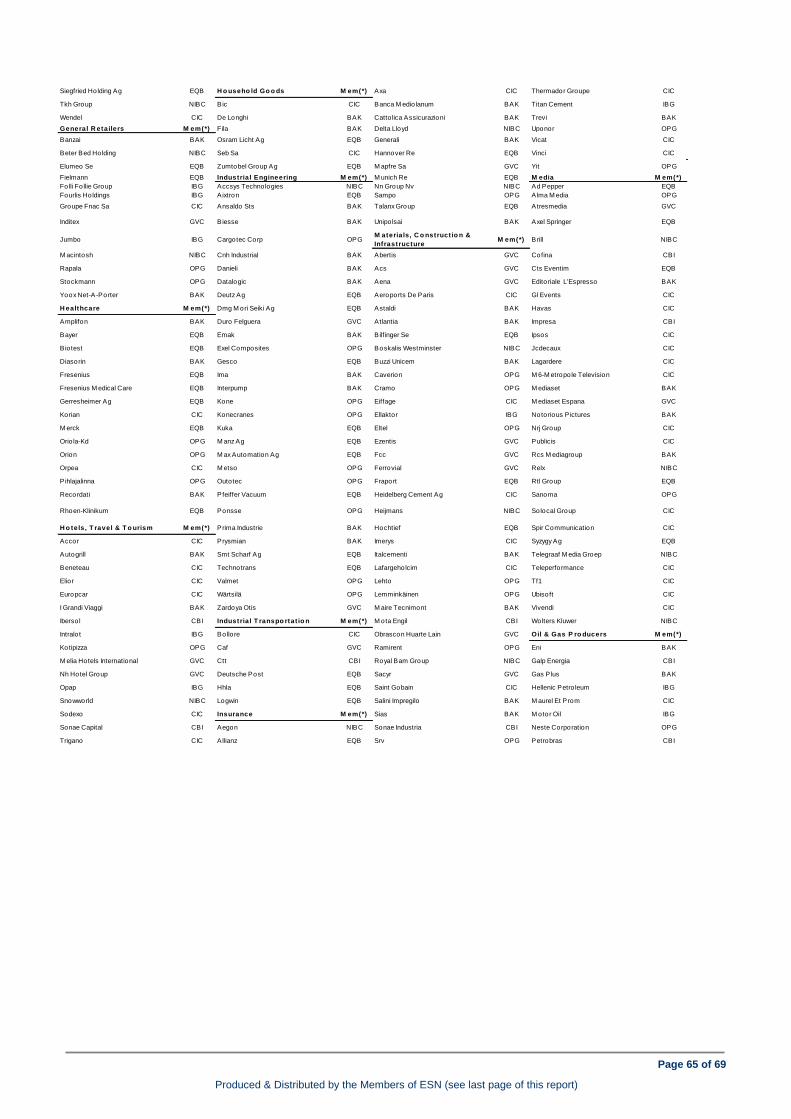
Page 65 of 69
Produced & Distributed by the Members of ESN (see last page of this report)
Siegfried Holding Ag EQB H o useho ld Go o ds M em(*) Axa CIC Thermador Groupe CIC
Tkh Group NIBC Bic CIC Banca M edio lanum BAK Titan Cement IBG
Wendel CIC De Longhi BAK Catto lica Assicurazioni BAK Trevi BAK
General R etailers M em(*) Fila BAK Delta Lloyd NIBC Uponor OPG
Banzai BAK Osram Licht Ag EQB Generali BAK Vicat CIC
Beter Bed Holding NIBC Seb Sa CIC Hannover Re EQB Vinci CIC
Elumeo Se EQB Zumtobel Group Ag EQB M apfre Sa GVC Yit OPG
Fielmann EQB Industria l Engineering M em(*) M unich Re EQB M edia M em(*)
Folli Fo llie Group IBG Accsys Technologies NIBC Nn Group Nv NIBC Ad Pepper EQB
Fourlis Holdings IBG Aixtron EQB Sampo OPG Alma M edia OPG
Groupe Fnac Sa CIC Ansaldo Sts BAK Talanx Group EQB Atresmedia GVC
Inditex GVC Biesse BAK Unipolsai BAK Axel Springer EQB
Jumbo IBG Cargotec Corp OPGM aterials, C o nstruct io n &
InfrastructureM em(*) Brill NIBC
M acintosh NIBC Cnh Industrial BAK Abertis GVC Cofina CBI
Rapala OPG Danieli BAK Acs GVC Cts Eventim EQB
Stockmann OPG Datalogic BAK Aena GVC Editoriale L'Espresso BAK
Yoox Net-A-Porter BAK Deutz Ag EQB Aeroports De Paris CIC Gl Events CIC
H ealthcare M em(*) Dmg M ori Seiki Ag EQB Astaldi BAK Havas CIC
Amplifon BAK Duro Felguera GVC Atlantia BAK Impresa CBI
Bayer EQB Emak BAK Bilfinger Se EQB Ipsos CIC
Biotest EQB Exel Composites OPG Boskalis Westminster NIBC Jcdecaux CIC
Diasorin BAK Gesco EQB Buzzi Unicem BAK Lagardere CIC
Fresenius EQB Ima BAK Caverion OPG M 6-M etropole Television CIC
Fresenius M edical Care EQB Interpump BAK Cramo OPG M ediaset BAK
Gerresheimer Ag EQB Kone OPG Eiffage CIC M ediaset Espana GVC
Korian CIC Konecranes OPG Ellaktor IBG Notorious Pictures BAK
M erck EQB Kuka EQB Eltel OPG Nrj Group CIC
Orio la-Kd OPG M anz Ag EQB Ezentis GVC Publicis CIC
Orion OPG M ax Automation Ag EQB Fcc GVC Rcs M ediagroup BAK
Orpea CIC M etso OPG Ferrovial GVC Relx NIBC
Pihlajalinna OPG Outotec OPG Fraport EQB Rtl Group EQB
Recordati BAK Pfeiffer Vacuum EQB Heidelberg Cement Ag CIC Sanoma OPG
Rhoen-Klinikum EQB Ponsse OPG Heijmans NIBC Solocal Group CIC
H o tels, T ravel & T o urism M em(*) Prima Industrie BAK Hochtief EQB Spir Communication CIC
Accor CIC Prysmian BAK Imerys CIC Syzygy Ag EQB
Autogrill BAK Smt Scharf Ag EQB Italcementi BAK Telegraaf M edia Groep NIBC
Beneteau CIC Technotrans EQB Lafargeholcim CIC Teleperformance CIC
Elior CIC Valmet OPG Lehto OPG Tf1 CIC
Europcar CIC Wärtsilä OPG Lemminkäinen OPG Ubisoft CIC
I Grandi Viaggi BAK Zardoya Otis GVC M aire Tecnimont BAK Vivendi CIC
Iberso l CBI Industria l T ranspo rtat io n M em(*) M ota Engil CBI Wolters Kluwer NIBC
Intralo t IBG Bollore CIC Obrascon Huarte Lain GVC Oil & Gas P ro ducers M em(*)
Kotipizza OPG Caf GVC Ramirent OPG Eni BAK
M elia Hotels International GVC Ctt CBI Royal Bam Group NIBC Galp Energia CBI
Nh Hotel Group GVC Deutsche Post EQB Sacyr GVC Gas Plus BAK
Opap IBG Hhla EQB Saint Gobain CIC Hellenic Petro leum IBG
Snowworld NIBC Logwin EQB Salini Impregilo BAK M aurel Et Prom CIC
Sodexo CIC Insurance M em(*) Sias BAK M otor Oil IBG
Sonae Capital CBI Aegon NIBC Sonae Industria CBI Neste Corporation OPG
Trigano CIC Allianz EQB Srv OPG Petrobras CBI
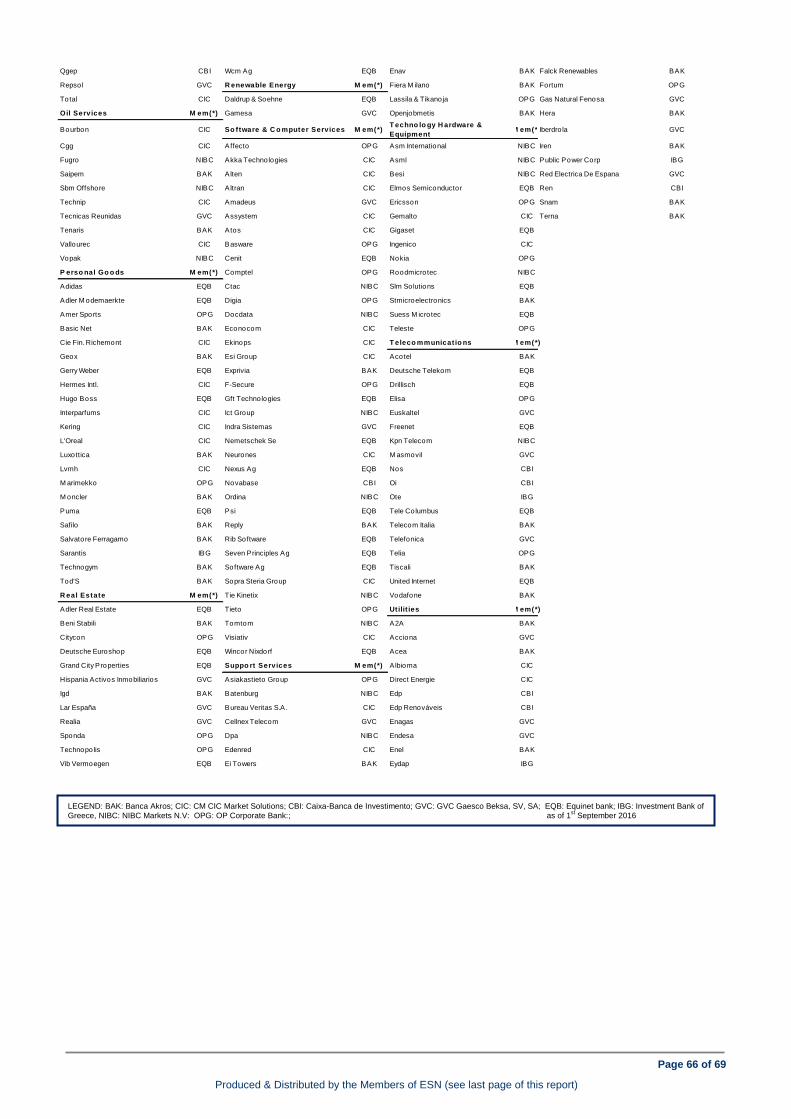
Page 66 of 69
Produced & Distributed by the Members of ESN (see last page of this report)
Qgep CBI Wcm Ag EQB Enav BAK Falck Renewables BAK
Repsol GVC R enewable Energy M em(*) Fiera M ilano BAK Fortum OPG
Total CIC Daldrup & Soehne EQB Lassila & Tikanoja OPG Gas Natural Fenosa GVC
Oil Services M em(*) Gamesa GVC Openjobmetis BAK Hera BAK
Bourbon CIC So ftware & C o mputer Services M em(*)T echno lo gy H ardware &
EquipmentM em(*)Iberdro la GVC
Cgg CIC Affecto OPG Asm International NIBC Iren BAK
Fugro NIBC Akka Technologies CIC Asml NIBC Public Power Corp IBG
Saipem BAK Alten CIC Besi NIBC Red Electrica De Espana GVC
Sbm Offshore NIBC Altran CIC Elmos Semiconductor EQB Ren CBI
Technip CIC Amadeus GVC Ericsson OPG Snam BAK
Tecnicas Reunidas GVC Assystem CIC Gemalto CIC Terna BAK
Tenaris BAK Atos CIC Gigaset EQB
Vallourec CIC Basware OPG Ingenico CIC
Vopak NIBC Cenit EQB Nokia OPG
P erso nal Go o ds M em(*) Comptel OPG Roodmicrotec NIBC
Adidas EQB Ctac NIBC Slm Solutions EQB
Adler M odemaerkte EQB Digia OPG Stmicroelectronics BAK
Amer Sports OPG Docdata NIBC Suess M icrotec EQB
Basic Net BAK Econocom CIC Teleste OPG
Cie Fin. Richemont CIC Ekinops CIC T eleco mmunicat io ns M em(*)
Geox BAK Esi Group CIC Acotel BAK
Gerry Weber EQB Exprivia BAK Deutsche Telekom EQB
Hermes Intl. CIC F-Secure OPG Drillisch EQB
Hugo Boss EQB Gft Technologies EQB Elisa OPG
Interparfums CIC Ict Group NIBC Euskaltel GVC
Kering CIC Indra Sistemas GVC Freenet EQB
L'Oreal CIC Nemetschek Se EQB Kpn Telecom NIBC
Luxottica BAK Neurones CIC M asmovil GVC
Lvmh CIC Nexus Ag EQB Nos CBI
M arimekko OPG Novabase CBI Oi CBI
M oncler BAK Ordina NIBC Ote IBG
Puma EQB Psi EQB Tele Columbus EQB
Safilo BAK Reply BAK Telecom Italia BAK
Salvatore Ferragamo BAK Rib Software EQB Telefonica GVC
Sarantis IBG Seven Principles Ag EQB Telia OPG
Technogym BAK Software Ag EQB Tiscali BAK
Tod'S BAK Sopra Steria Group CIC United Internet EQB
R eal Estate M em(*) Tie Kinetix NIBC Vodafone BAK
Adler Real Estate EQB Tieto OPG Utilit ies M em(*)
Beni Stabili BAK Tomtom NIBC A2A BAK
Citycon OPG Visiativ CIC Acciona GVC
Deutsche Euroshop EQB Wincor Nixdorf EQB Acea BAK
Grand City Properties EQB Suppo rt Services M em(*) Albioma CIC
Hispania Activos Inmobiliarios GVC Asiakastieto Group OPG Direct Energie CIC
Igd BAK Batenburg NIBC Edp CBI
Lar España GVC Bureau Veritas S.A. CIC Edp Renováveis CBI
Realia GVC Cellnex Telecom GVC Enagas GVC
Sponda OPG Dpa NIBC Endesa GVC
Technopolis OPG Edenred CIC Enel BAK
Vib Vermoegen EQB Ei Towers BAK Eydap IBG
LEGEND: BAK: Banca Akros; CIC: CM CIC Market Solutions; CBI: Caixa-Banca de Investimento; GVC: GVC Gaesco Beksa, SV, SA; EQB: Equinet bank; IBG: Investment Bank of
Greece, NIBC: NIBC Markets N.V: OPG: OP Corporate Bank:; as of 1st September 2016

Page 67 of 69
Produced & Distributed by the Members of ESN (see last page of this report)
List of ESN Analysts (**)
Ari Agopyan CIC +33 1 53 48 80 63 [email protected] Victoria Kruchevska (CFA,FRM) EQB +49 69 5 89 97 416 [email protected]
Artur Amaro CBI +351 213 89 6822 [email protected] Jean-Christophe Lefèvre-Moulenq CIC +33 1 53 48 80 65 [email protected]
Helena Barbosa CBI +351 21 389 6831 [email protected] Konstantinos Manolopoulos IBG +30 210 817 3388 [email protected]
Javier Bernat GVC +34 91 436 7816 jav [email protected] Dario Michi BAK +39 02 4344 4237 [email protected]
Dimitris Birbos IBG +30 210 81 73 392 [email protected] Marietta Miemietz CFA EQB +49-69-58997-439 [email protected]
Agnès Blazy CIC +33 1 53 48 80 67 [email protected] José Mota Freitas, CFA CBI +351 22 607 09 31 [email protected]
Charles Edouard Boissy CIC +33 01 53 48 80 81 [email protected] Henri Parkkinen OPG +358 10 252 4409 [email protected]
Rafael Bonardell GVC +34 91 436 78 171 [email protected] Victor Peiro Pérez GVC +34 91 436 7812 [email protected]
Louise Boyer CIC +33 1 53 48 80 68 [email protected] Francis Prêtre CIC +33 4 78 92 02 30 [email protected]
Giada Cabrino, CIIA BAK +39 02 4344 4092 [email protected] Francesco Previtera BAK +39 02 4344 4033 francesco.prev [email protected]
Arnaud Cadart CIC +33 1 53 48 80 86 [email protected] Jari Raisanen OPG +358 10 252 4504 [email protected]
Niclas Catani OPG +358 10 252 8780 [email protected] Hannu Rauhala OPG +358 10 252 4392 [email protected]
Pierre Chedeville CIC +33 1 53 48 80 97 [email protected] Matias Rautionmaa OPG +358 10 252 4408 [email protected]
Emmanuel Chevalier CIC +33 1 53 48 80 72 [email protected] Eric Ravary CIC +33 1 53 48 80 71 [email protected]
David Consalvo CIC +33 1 53 48 80 64 [email protected] Iñigo Recio Pascual GVC +34 91 436 7814 [email protected]
Edwin de Jong NIBC +312 0 5508569 [email protected] Gerard Rijk NIBC + 31 (0)20 550 8572 [email protected]
Martijn den Drijver NIBC +312 0 5508636 [email protected] André Rodrigues CBI +351 21 389 68 39 [email protected]
Christian Devismes CIC +33 1 53 48 80 85 [email protected] Jean-Luc Romain CIC +33 1 53 48 80 66 [email protected]
Andrea Devita, CFA BAK +39 02 4344 4031 [email protected] Jochen Rothenbacher, CEFA EQB +49 69 58997 415 [email protected]
Sebastian Droste EQB +49 69 58 99 74 34 [email protected] Vassilis Roumantzis IBG +30 2108173394 [email protected]
Enrico Esposti, CIIA BAK +39 02 4344 4022 [email protected] Sonia Ruiz De Garibay GVC +34 91 436 7841 [email protected]
Rafael Fernández de Heredia GVC +34 91 436 78 08 [email protected] Antti Saari OPG +358 10 252 4359 [email protected]
Enrico Filippi, CEFA BAK +39 02 4344 4071 [email protected] Paola Saglietti BAK +39 02 4344 4287 [email protected]
Gabriele Gambarova BAK +39 02 43 444 289 [email protected] Francesco Sala BAK +39 02 4344 4240 [email protected]
Eduardo Garcia Arguelles GVC +34 914 367 810 [email protected] Holger Schmidt, CEFA EQB +49 69 58 99 74 32 [email protected]
Alexandre Gérard CIC +33 1 53 48 80 93 [email protected] Cengiz Sen EQB +4969 58997 435 [email protected]
Philipp Häßler, CFA EQB +49 69 58997 414 [email protected] Pekka Spolander OPG +358 10 252 4351 [email protected]
Simon Heilmann EQB +49 69 58 997 413 [email protected] Kimmo Stenvall OPG +358 10 252 4561 [email protected]
Dr. Knud Hinkel EQB + 49 69 58997 419 [email protected] Natalia Svyrou-Svyriadi IBG +30 210 81 73 384 [email protected]
Marcell Houben NIBC +31 20 550 8649 [email protected] Luigi Tramontana BAK +39 02 4344 4239 [email protected]
Carlos Jesus CBI +351 21 389 6812 [email protected] Johan van den Hooven NIBC +312 0 5508518 [email protected]
Mark Josefson EQB +4969-58997-437 [email protected] Kévin Woringer CIC +33 1 53 48 80 69 [email protected]
(**) excluding: strategists, macroeconomists, heads of research not covering specific stocks, credit analysts, technical analysts

Page 68 of 69
Produced & Distributed by the Members of ESN (see last page of this report)
ESN Recommendation System The ESN Recommendation System is Absolute. It means that each stock is rated on the basis of
a total return, measured by the upside potential (including dividends and capital reimbursement)
over a 12 month time horizon.
The ESN spectrum of recommendations (or ratings) for each stock comprises 5 categories: Buy
(B), Accumulate (A), Neutral (N), Reduce (R) and Sell (S).
Furthermore, in specific cases and for a limited period of time, the analysts are allowed to rate the
stocks as Rating Suspended (RS) or Not Rated (NR), as explained below.
Meaning of each recommendation or rating:
Buy: the stock is expected to generate total return of over 15% during the next 12 months time horizon
Accumulate: the stock is expected to generate total return of 5% to 15% during the next 12 months time horizon
Neutral: the stock is expected to generate total return of -5% to +5% during the next 12 months time horizon
Reduce: the stock is expected to generate total return of -5% to -15% during the next 12 months time horizon
Sell: the stock is expected to generate total return under -15% during the next 12 months time horizon
Rating Suspended: the rating is suspended due to a change of analyst covering the stock or a capital operation (take-over bid, SPO, …) where the issuer of the document (a partner of ESN) or a related party of the issuer is or could be involved
Not Rated: there is no rating for a company being floated (IPO) by the issuer of the document (a partner of ESN) or a related party of the issuer
Certain flexibility on the limits of total return bands is permitted especially during higher phases of volatility on the markets
ESN Ratings Breakdown
Date and time of production: 27th October 2016 9 :10am CET First date and time of dissemination: 27th October 2016 9 :12am CET
Disclaimer: These reports have been prepared and issued by the Members of
European Securities Network LLP (‘ESN’). ESN, its Members and their
affiliates (and any director, officer or employee thereof), are neither liable
for the proper and complete transmission of these reports nor for any
delay in their receipt. Any unauthorised use, disclosure, copying,
distribution, or taking of any action in reliance on these reports is strictly
prohibited. The views and expressions in the reports are expressions of
opinion and are given in good faith, but are subject to change without
notice. These reports may not be reproduced in whole or in part or passed
to third parties without permission. The information herein was obtained
from various sources. ESN, its Members and their affiliates (and any
director, officer or employee thereof) do not guarantee their accuracy or
completeness, and neither ESN, nor its Members, nor its Members’
affiliates (nor any director, officer or employee thereof) shall be liable in
respect of any errors or omissions or for any losses or consequential
losses arising from such errors or omissions. Neither the information
contained in these reports nor any opinion expressed constitutes an offer,
or an invitation to make an offer, to buy or sell any securities or any
options, futures or other derivatives related to such securities (‘related
investments’). These reports are prepared for the clients of the Members
of ESN only. They do not have regard to the specific investment
objectives, financial situation and the particular needs of any specific
person who may receive any of these reports. Investors should seek
financial advice regarding the appropriateness of investing in any
securities or investment strategies discussed or recommended in these
reports and should understand that statements regarding future prospects
may not be realised. Investors should note that income from such
securities, if any, may fluctuate and that each security’s price or value may
rise or fall. Accordingly, investors may receive back less than originally
invested. Past performance is not necessarily a guide to future
performance. Foreign currency rates of exchange may adversely affect the
value, price or income of any security or related investment mentioned in
these reports. In addition, investors in securities such as ADRs, whose
value are influenced by the currency of the underlying security, effectively
assume currency risk. ESN, its Members and their affiliates may submit a
pre-publication draft (without mentioning neither the recommendation nor
the target price/fair value) of its reports for review to the Investor Relations
Department of the issuer forming the subject of the report, solely for the
purpose of correcting any inadvertent material inaccuracies. Like all
members employees, analysts receive compensation that is impacted by
overall firm profitability For further details about the analyst certification,
the specific risks of the company and about the valuation methods used to
determine the price targets included in this report/note, please refer to the
specific disclaimer pages prepared by the ESN Members. In the case of a
short note please refer to the latest relevant published research on single
stock or contact the analyst named on the front of the report/note for
detailed information on the valuation methods, earning estimates and
risks. A full description of all the organisational and administrative
measures taken by the Members of ESN to manage interest and conflicts
of interest are available on the website of the Members. Research is
available through the ESN Members sales representative. ESN will
provide periodic updates on companies or sectors based on company-
specific developments or announcements, market conditions or any other
publicly available information. Unless agreed in writing with an ESN
Member, this research is intended solely for internal use by the recipient.
Neither this document nor any copy of it may be taken or transmitted into
Australia, Canada or Japan or distributed, directly or indirectly, in
Australia, Canada or Japan or to any resident thereof. This document is
for distribution in the U.K. Only to persons who have professional
experience in matters relating to investments and fall within article 19(5) of
the financial services and markets act 2000 (financial promotion) order
2005 (the “order”) or (ii) are persons falling within article 49(2)(a) to (d) of
the order, namely high net worth companies, unincorporated associations
etc (all such persons together being referred to as “relevant persons”).
This document must not be acted on or relied upon by persons who are
not relevant persons. Any investment or investment activity to which this
document relates is available only to relevant persons and will be engaged
in only with relevant persons. The distribution of this document in other
jurisdictions or to residents of other jurisdictions may also be restricted by
law, and persons into whose possession this document comes should
inform themselves about, and observe, any such restrictions. By accepting
this report you agree to be bound by the foregoing instructions. You shall
indemnify ESN, its Members and their affiliates (and any director, officer or
employee thereof) against any damages, claims, losses, and detriments
resulting from or in connection with the unauthorized use of this document.
For disclosure upon “conflicts of interest” on the companies under
coverage by all the ESN Members and on each “company
recommendation history”, please visit the ESN website
(www.esnpartnership.eu) or refer to the ESN Members website. Additional
information is always available upon request. For additional information
and individual disclaimers please refer to www.esnpartnership.eu and
to each ESN Member websites:
www.bancaakros.it regulated by the CONSOB - Commissione Nazionale per le Società e la Borsa
www.caixabi.pt regulated by the CMVM - Comissão do Mercado de Valores Mobiliários
www.cmcicms.com regulated by the AMF - Autorité des marchés financiers
www.equinet-ag.de regulated by the BaFin - Bundesanstalt für Finanzdienstleistungsaufsicht
www.ibg.gr regulated by the HCMC - Hellenic Capital Market Commission
www.nibcmarkets.com regulated by the AFM - Autoriteit Financiële Markten
www.op.fi regulated by the Financial Supervision Authority
www.valores.gvcgaesco.es regulated by CNMV - Comisión Nacional del Mercado de Valores
Members of ESN (European Securities Network LLP)
Caixa-Banco de Investimento
Rua Barata Salgueiro, nº 33
1269-057 Lisboa
Portugal
Phone: +351 21 313 73 00
Fax: +351 21 389 68 98
GVC Gaesco Beka, SV, SA
C/ Marques de Villamagna 3
28001 Madrid
Spain
Phone: +34 91 436 7813
Investment Bank of Greece
32 Aigialeias Str & Paradissou,
151 25 Maroussi,
Greece
Tel: +30 210 81 73 383
Banca Akros S.p.A.
Viale Eginardo, 29
20149 MILANO
Italy
Phone: +39 02 43 444 389
Fax: +39 02 43 444 302
NIBC Markets N.V.
Nieuwezijds Voorburgwal 162
P.O.Box 235
1000 AE Amsterdam
The Netherlands
Phone: +31 20 550 8500
Fax: +31 20 626 8064
CM - CIC Market Solutions
6, avenue de Provence
75441 Paris
Cedex 09
France
Phone: +33 1 53 48 80 78
Fax: +33 1 53 48 82 25
equinet Bank AG
Gräfstraße 97
60487 Frankfurt am Main
Germany
Phone:+49 69 – 58997 – 212
Fax:+49 69 – 58997 – 299
OP Corporate Bank plc
P.O.Box 308
Teollisuuskatu 1, 00013 Helsinki
Finland
Phone: +358 10 252 011
Fax: +358 10 252 2703