Embed Size (px)
Citation preview

Eskom Overview & National Development Plan SIPs
2013 CESA Annual Conference – 12/11/2013
Poobie Govender, General Manager, Strategic Projects, Eskom

In support of
Agenda
2
1. Eskom at a Glance
1.1 About Eskom
1.2 Eskom Capital Programme
1.3 Our Approach to Project Management
2. National Development Plan & SIPs
2.1 National Development Plan and Government’s Infrastructure Plan
2.2 PICC Governance
2.3 SIP Overview & Eskom Role
3. SIP 01
3.1 Overview
3.2 Progress
3.3 Impact
3.4 Challenges
4. Making a Real Difference on the Ground

In support of
• Strategic 100% state-owned electricity utility
• Top-15 electricity utility, Africa’s largest electricity utility
• Supplies approximately 95% of South Africa’s electricity
• Operate and maintain 27 power stations with a capacity
of 43.5 GW
• Electricity price ranked 4th lowest by NUS consulting
• Electricity sales of 216 561GWh (2012:224 785GWh) and
electricity revenues of R126.7 billion (2012: R113.0 billion)
[year ending 31 March 2013]
• As at 31 March 2013 :
• 46 266 group employees (2012: 43 473)
• 5.0 million customers (2012: 4.9 million)
• Net maximum generating capacity of 41.9GW (2012:
41.6GW)
• 373 280km of cables and power lines
• 17.1GW of new generation capacity by 30 September
2018; 6.0GW already commissioned
• Voted one of the most desired companies to work for in
2013 Sunday Times survey
• R300 billion new build program has created 35 000+
direct jobs; 45% filled by local to site workers
Eskom Generation Capacity – FY 2013
Nuclear
Gas
Coal
Hydro
Pumped Storage
Eskom Electricity Sales by Customer for FY 2013
Compared to Previous Year End
About Eskom
In support of
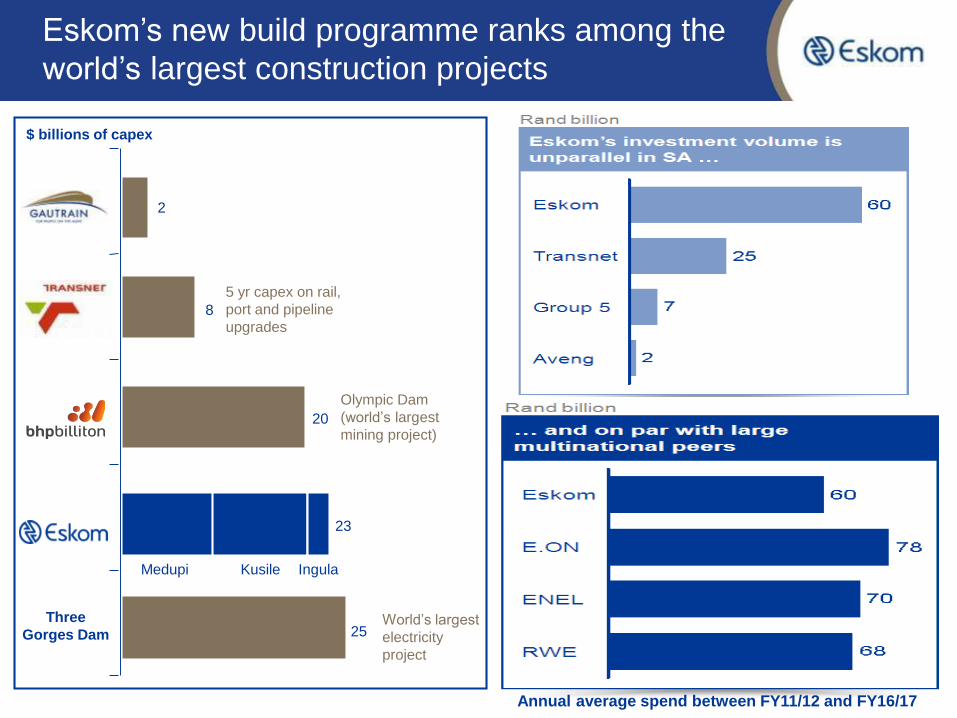
Eskom’s new build programme ranks among the
world’s largest construction projects
Annual average spend between FY11/12 and FY16/17
$ billions of capex
KusileMedupi Ingula
Olympic Dam
(world’s largest
mining project)
25
23
2
20
8
5 yr capex on rail,
port and pipeline
upgrades
Three
Gorges DamWorld’s largest
electricity
project

In support of
Source: Eskom Group Capital Division (Construction Management)
5
Km line
MVAs
Megawatts
Substations
Transmission
Total
MW of capacity
FY
2004/5
FY
2005/6
FY
2009/10
FY
2008/9
FY
2007/8
FY
2006/7
FY
2010/11
FY
2011/12
1,630
1,0001,090
1,3751,355
5,940
5,280 20,195
2,525
237430
480418.30
600.30
3,899.3
443.40
659
631.3
1,351
1,043
1,770
5,756
315
2900
452
FY
2012/13
535261
787
3,580
6,137
5,197.3
24 ,065
FY
2013/14
120*
YE Target:
3,790 MVA
YE Target:
770 km
YE Target:
100 MW
511
290
STRICTLY CONFIDENTIAL
Much construction work has been completed

In support of
Eskom’s capital projects journey thus far
62006/07 2008/09 2010/11 2012/13
Lessons learnt
Focus on savings,
assurance and local
content required
Lessons learnt
Uniform processes/
systems across
projects required
Lessons learnt
Eskom to become
a more professional
and action owner
▪ Initiated fast project start
▪ Negotiated local content
into main contracts
Major projects running
▪ Rationalise resource
allocation at portfolio level
▪ Negotiated and placed all
remaining contracts
▪ Initiated auditing process
▪ Started onsite construction
▪ Drove major cost saving
efforts
Enabled execution▪ Consolidated major new
build activities in GC
▪ Benchmarking and best
practices
▪ Initiated harmonised
systems/ processes
▪ Accelerated execution
▪ Improved FEL
▪ Set up capital efficiency
▪ Group level capital
monitoring
Built group wide EPC(M) ▪ Continued with
processes & PO set
up
▪ PM training in place
▪ Finalised and
piloted Mega and
repeatable projects
systems
▪ Become a more
active/involved
owner
▪ Share experiences
internationally
Closing the gap to
world performance

In support of
Portfolio-level capital allocation
Project lifecycle management
Enablers
• Effective project ‘scrubbing’ methodology
• Project ranking methodology
• Scrubbed and ranked projects have to be clearly prioritised, using fact-based
considerations of delivery constraints
• Project development and engineering
• Contracting and procurement
• Construction
• Contractor management
• Commissioning
• Safety, Health, Environment and Quality
• Project Controls
• Project Tools and systems
• Project Management Office
• Organisational structure
• Capabilities
Lessons learned are structured around three pillars; more than 500 lessons recorded since inception of Eskom build programme

In support of
Eskom’s project management framework
DATA
People
Process SystemConfiguration
• Complete
• Accurate
• Relevant
• Accessible
• Timely
ESKOM eHPUMIntegrated, standardised and aligned
Project Management practices and
organisation
Project Lifecycle Model (PLCM)
Operating Model
One PM operating model - eHPUM
Business Processes
Standardised 22 PCMs PM capability based
Organisation
One standard PM structure reference – 20 PM
positions with standardised curriculums
Systems
Standard system platforms – SAP, Primavera, Prism
Assurance
One uniform assurance review approach

In support of
Agenda
9
1. Eskom at a Glance
1.1 About Eskom
1.2 Eskom Capital Programme
1.3 Our Approach to Project Management
2. National Development Plan & SIPs
2.1 National Development Plan and Government’s Infrastructure Plan
2.2 PICC Governance
2.3 SIP Overview & Eskom Role
3. SIP 01
3.1 Overview
3.2 Progress
3.3 Impact
3.4 Challenges
4. Making a Real Difference on the Ground

In support of
National Development Plan
“The National Development Plan aims to eliminate poverty and reduce inequality by 2030. South Africa can realisethese goals by drawing on the energies of its people, growing an inclusive economy, building capabilities, enhancing the capacity of the state, and promoting
leadership and partnerships throughout society.”
Source: National Development Plan Executive Summary
10

In support of
• Government recently adopted an Infrastructure Plan that is intended to transform the economic landscape of South Africa, create a significant numbers of new jobs, strengthen the delivery of basic services to the people of South Africa and support the integration of African economies.
• The aim of the infrastructure plan is to construct new infrastructure, to expedite current projects, to enable and support economic and social development and to improve the maintenance of existing infrastructure.
• In July 2011 Cabinet then decided to establish a body to integrate and coordinate the long term infrastructure build, namely the Presidential Infrastructure Coordinating Commission (PICC) with its supporting management structures.
• An Infrastructure Book was compiled, which contains information about infrastructure projects across the country
• The PICC then developed and approved eighteen Strategic Integrated Projects (SIPs) to support economic development
• Each SIP comprise of a large number of specific infrastructure projects.
11
Government’s Infrastructure Plan

In support of
PICC governance structure
12
The PICC does not displace the role of the implementing agencies. The individual departments, provinces, municipalities and state owned entities are still responsible for the implementation of the relevant projects
PICC Council
PICC MANCO
Technical Task Teams
PICC Secretariat
A Minister appointed to
chair each SIP
SIP 01 SIP 18
Chair: Minister of Rural Development and Land
Reform
Role: Unblocking challenges, monitoring
development plan, ensure coordinated
regulatory approvals
Chair: President of South Africa
Members: Various ministers, premiers and
executive mayors
Chair: Minister of the Economic Development
Department
Role: Oversee day-to-day work of the Technical
Task Team
Comprises various resources from public
agencies and government
Role: Ensure reporting to the PICC Secretariat
and assurance of information
Cabinet

In support of
Overview of the 18 SIPs
13
5 Geographically-focused SIPs
Spatial SIPs
Energy SIPs
Social Infrastructure
Knowledge SIPs
Regional Integration SIP
One Water & Sanitation Masterplan SIP
3
3
3
2
1
1

In support of
Role of SOCs in the PICC
• The PICC has appointed a State Owned Company (SOC) to lead each SIP, the intent being to:
• Ensure project focus
• Improve project co-ordination and quality (development and construction) through the use of standardised and proven methods and tools
• Improve progress tracking through the use of standardised dashboards and common information technology systems
• Raise decisions required to unblock progress to a ministerial and presidential level
• The creation of the asset remains the accountability of the asset owner e.g. transmission infrastructure remains with Eskom, rail with Transnet Freight Rail and water with Department of Water Affairs.

In support of
• Presidential Infrastructure
Coordination Committee
(PICC) is established
following Jul 2011 Cabinet
Lekgotla
• SOE Projects are clustered
into 18 SIPs covering
transportation,
telecommunication, energy,
health and education and
water and sanitation
Jul 2011
Eskom’s PICC journey
• Minister of Public
Enterprises mandates
Eskom on the 29th Sept
2012 to lead the SIP 1
programme integration and
coordination role and
develop a common
monitoring platform
• The creation and funding of
assets remains the
responsibility of assets
owners
DPE & PICC Mandate to
Eskom
• Eskom Exco approves the
Strategic Project
Department (SPD) structure
within the Office of Chief
Executive on 26th Oct 2012
to house functions to fulfil
the DPE & PICC mandate
Eskom starts mandate
implementation
• Integrated team formed
with most government
entities represented
• Business plan finalised and
presented to the PICC
• Project progress reported
quarterly to PICC
• Common tool for Project
Monitoring developed
• Meetings with business on-
going
• DPE mandated Eskom for
integration and
coordination of SIPs 9 and
10 (as of Aug. 2013)
SIP 01 Programme
Office OperationalPICC is Established
July 2011 Sept 2012 Oct 2012 & Nov 2012 Nov 2012 to date

In support of
Eskom will lead three SIPs and will also have Eskom-related projects in all 18 SIPs
16
SIP Programme Co-
ordination
Eskom related projects
Table Legend

In support of
Agenda
17
1. Eskom at a Glance
1.1 About Eskom
1.2 Eskom Capital Programme
1.3 Our Approach to Project Management
2. National Development Plan & SIPs
2.1 National Development Plan and Government’s Infrastructure Plan
2.2 PICC Governance
2.3 SIP Overview & Eskom Role
3. SIP 01
3.1 Overview
3.2 Progress
3.3 Impact
3.4 Challenges
4. Making a Real Difference on the Ground

In support of
SIP 01: Unlocking the country’s Northern mineral belt & rejuvenating the mining sector
• SIP 01 is the largest of the 18 SIPs by project value and is estimated at R803 billion to 2025.
• The scope of projects extends into the Limpopo, Mpumalanga, Gauteng and KwaZuluNatal provinces.
• A wide range of government departments and State Owned Companies (SOCs) are involved; these include Eskom, Transnet, DWA, TCTA, SANRAL and the DoT.
• Approximately 48 projects have been identified ranging from water to energy to rail to port to road development.
• As at Dec 2012, 8 projects where in procurement and construction. The approximate value of these projects is R115 billion and the direct jobs introduced estimated at 28 000.
SIP 01
• Unlock mineral resources
• Rail, water pipelines, energy
generation and transmission
infrastructure
• Thousands of direct jobs across
the areas unlocked
• Urban development in Waterberg
– first major post-apartheid new
urban centre will be a “green”
development project
• Rail capacity to Mpumalanga and
Richards Bay
• Shift from road to rail in
Mpumalanga
• Logistics corridor to connect
Mpumalanga and Gauteng

In support of
Challenges to be overcome
Expedited
Approvals
Effective
Communication
Active
Coordination &
Capacity building
Regulatory approvals for items such as water use licenses, land andrights and others impacting infrastructure projects must be expedited.
On-going communication must be channelled across spheres of government to
communities and business, making them aware of progress and activitiesin their area.
Bulk cut across provinces and all government entities must integrate and
coordinated plans. Capacity building in government and businesses must be
proactively managed to plan procure and execute projects
Urban Planning
Municipalities must make provision for additional resources and
strengthen local services to accommodate pressure from the mass
influx of out-of-town workers and new residents including new businesses.
Methods to improve access to land for servitudes required
Ethical Conduct
Underpinning the success of government’s infrastructure plan is honesty,
fair practice and avoiding corrupt behaviour.
The working together of national, provincial, local government business and
communities is central to successfully delivering on the Infrastructure Plan
24

In support of
We set up a PMO in Eskom to programmeintegrate, coordinate and report on the SIP
20
PMO Integration
Data and
Support
Systems
Eskom
Coordination
and Reporting
Support
Strategic
Projects
Department
Project Management
Integration and Co-
ordination across
different entities
Common information
platform
Quality and
Assurance for
External & PICC
Reporting
Programme
Management
Admin Support
Schedule Integrator
Spatial Planner
Business Analyst
Business Case
Developers
Quality/Compliance
Manager
Document and
Records Officers
Collaboration with
DHET, IDC, DPE,
PICC, BLSA
participants, SOCs
Localisation
Resource Estimation
Tool for early
identification of skills
and localisation
opportunities

In support of
DPE Mandate for Programme Management of SIP 01 received on 29th September 2012
Business plan completed and submitted to shareholder and PICC in Dec 2012
Multiple government entities meet monthly to report project progress and collaborate ( includes DPE, DoE,
DoT, Limpopo Premiere Office, DWA, TCTA, Transnet, SANRAL, DEA, Eskom, IDC)
20
All relevant SOEs represented in the SIP01 SOEteam in monthly collaboration & progress sessions

In support of
Waterberg
Development
Steelpoort
Development
Export
Logistics
Mpumalanga
Bottleneck
Reduction
Moloto
CorridorThe Moloto corridor will provide
safe and reliable passenger
transport from the rural
communities of Nkangala and
Sekhukhune to Tshwane
Investment in water
infrastructure inTubatse will
unlock the region’s rich mineral
resources and uplift 2 million
people living in dire socio-
economic conditions
Mpumalanga hosts the largest
number of coal-fired power
stations in the country, reliable
future coal supply to these
power stations will ensure the
security of SA’s power supply
International demand for coal is
expected to remain high over the
long term. This project will
increase export opportunities by
establishing a more direct route
to Swaziland, the Port of Maputo
and the Richards Bay Coal
Terminal
The Waterberg coal complex
in Lephalale is amongst the
richest untapped mineral
resources in the country and
is a source for future coal for
energy generation in
Limpopo, Mpumalanga and
for export to international
markets
7
As a team we aligned on the scope of SIP 01

In support of
Execution Progress► In this year:
► The Komati Water Scheme project has been
official opened
► The De Hoop dam construction is largely
complete
► R10.2 bn (5 projects) have moved into
procurement and execution
Programme Integration, Coordination and
Information► An integrated plan and regulatory approval sequence
for the Waterberg is completed
► Priority issues are escalated for PICC resolution
► The Department of Environmental Affairs is working on
streamlining environmental and water permit
approvals.
► Common project monitoring tool for tracking progress
on all SIPs has been piloted and proven
► 4th Construction Report prepared for PICC
18
We have made real progress this year

In support of
Urban Planning:
►Platform to start collaboration with
municipality, province and business started
Skills, Commodities and Localisation► Resource Demand Estimation Tool to support
upfront strategic planning around skills planning
and materials and equipment for infrastructure
developed.
► This has been joint effort with BLSA, SOCs and
Government departments
19
We have made real progress this year
In support of
1.2
1.9
1.41.1
5.0
1.5
0.0
2.6
0.7
1.31.0
0.7
2.9
2.32.0 2.1
1.3 1.3
0.8 0.9
0
1
2
3
4
5
6
2015-2019 2020-2024 2025-2030 Average over entire period
% c
ha
ng
e f
rom
ba
se
Private consumption Gross fixed capital formation Exports Imports GDP at market prices
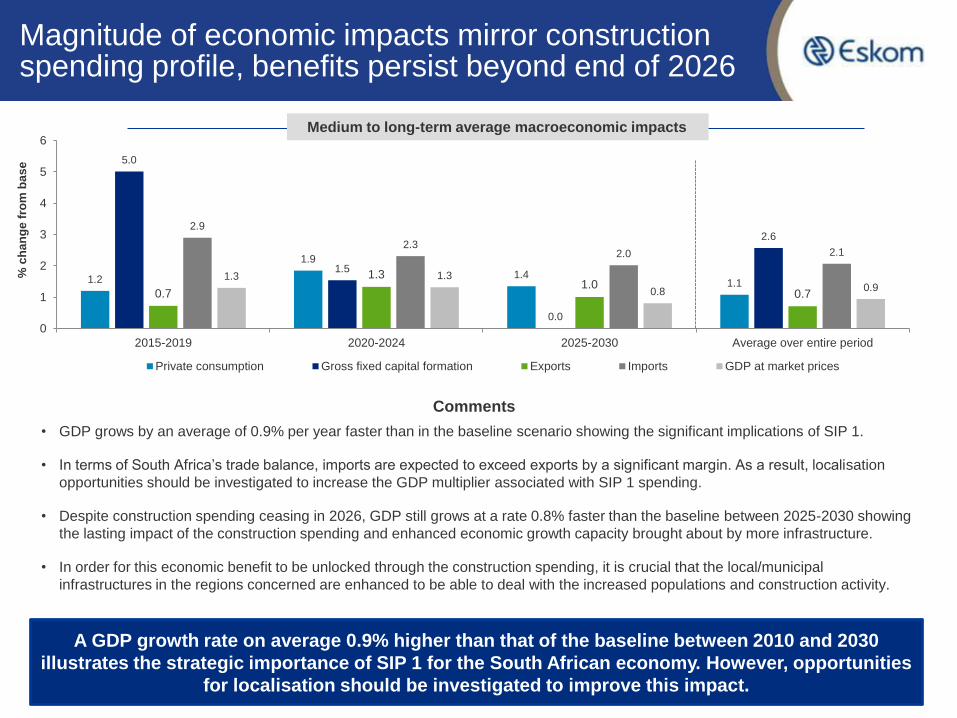
Comments
• GDP grows by an average of 0.9% per year faster than in the baseline scenario showing the significant implications of SIP 1.
• In terms of South Africa’s trade balance, imports are expected to exceed exports by a significant margin. As a result, localisation
opportunities should be investigated to increase the GDP multiplier associated with SIP 1 spending.
• Despite construction spending ceasing in 2026, GDP still grows at a rate 0.8% faster than the baseline between 2025-2030 showing
the lasting impact of the construction spending and enhanced economic growth capacity brought about by more infrastructure.
• In order for this economic benefit to be unlocked through the construction spending, it is crucial that the local/municipal
infrastructures in the regions concerned are enhanced to be able to deal with the increased populations and construction activity.
Medium to long-term average macroeconomic impacts
A GDP growth rate on average 0.9% higher than that of the baseline between 2010 and 2030
illustrates the strategic importance of SIP 1 for the South African economy. However, opportunities
for localisation should be investigated to improve this impact.
Magnitude of economic impacts mirror construction spending profile, benefits persist beyond end of 2026

In support of
• Employment opportunities increase mostly for individuals falling within the informal or semi- & unskilled categories given the model
assumptions and the nature of construction labour resource requirements. (Skilled and highly skilled individuals are more likely to
benefit from wage increases rather than an increase in the number of individuals employed).
• After 2020-2024 there will be mass demobilisation of workers. Sustainable solutions will need to be developed to pre-empt this.
• It should be noted that the above figures do not include the additional job opportunities that will be created once these infrastructure
projects are completed and move into the operational phases.
Employment Benefits - SIP 1 Construction Phase
Comments
Employment benefits are realised even after the investment in construction has ended. These
opportunities however are not large enough to prevent the need to demobilise construction
workers once construction projects are completed
It is expected that the Limpopo and surrounding areas will benefit greatly from the estimated 53,200 job opportunities created for semi- and unskilled workers
Significant fall in the
demand for SIP 1
construction workers
17.0
63.2
76.5
46.953.2
2.3
0.6
0.2
0.1
0
10
20
30
40
50
60
70
80
90
2010-2014 2015-2019 2020-2024 2025-2030 Average over entire period
Em
ply
me
nt
pe
r ye
ar
(‘0
00
)
Highly skilled
Skilled
Semi & Unskilled
15

In support of
• The SIP 01 progamme is estimated to cost around R 803 billion
• 34% of the projects have funding (excl. Project Mafutha)
*Includes Mafutha which is on hold and privately funded (R 234 bn)
Numbers exclude Interest during construction
*
34%
66%
Funded Unfunded
Excluding Mafutha
11
34% of SIP 01 are already funded

In support of
We have made progress on SIP 01 but still have further to go
Expedited
Approvals
Effective
Communication
Active
Coordination &
Capacity building
Integrated regulatory sequence
Focus is currently on alignment within government entities
Integrated project plans in place and resource estimation tool
developed to inform skills gaps and localisation opportunities
Urban PlanningConversation to assess impacts of large infrastructure projects and
people influx has started
Ethical ConductVigilant
Working together within the PICC framework, we are bringing together national,
provincial, local government, business and communities to deliver on infrastructure
24

In support of
Agenda
29
1. Eskom at a Glance
1.1 About Eskom
1.2 Eskom Capital Programme
1.3 Our Approach to Project Management
2. National Development Plan & SIPs
2.1 National Development Plan and Government’s Infrastructure Plan
2.2 PICC Governance
2.3 SIP Overview & Eskom Role
3. SIP 01
3.1 Overview
3.2 Progress
3.3 Impact
3.4 Challenges
4. Making a Real Difference on the Ground

In support of
Communities need to feel benefits and to become involved in protecting these developments
Job Opportunities
Basic Services
Schools
Clinics
Recreational Centres
28

In support of
Key Area Achievement
Local to Site
Procurement
• Contracts worth R2.1bn placed with Limpopo based suppliers
• Eskom alone placed contracts worth R800m with Limpopo suppliers
• 68% of these contracts are with companies owned by black women
Job Creation • On-site employment at end June 2013 was 16 006 people
• 42.4% of the workforce are Lephalale residents
• 70.9% of unskilled and semi skilled are from Limpopo province
• 6% of the construction workers and 80% of the supporting services are women
• 95% of the workforce are South African
• 53% of the Workforce are youth (<35yrs old)
Skills and
Entrepreneurship
development
• Contractors committed to train 2128 skills development candidates
• 1536 already trained
• Large number of those are employed by the project
• Hitachi invested R24m in the Tlhahlong Training Centre to produce 700 artisans
as part of its ASGISA contractual obligations
• 404 Artisans are qualified and are employed by Murray and Roberts
• 65% of the artisans are from Limpopo
• Women constitute 17% of the 404 artisans.
Eskom Funded
Infrastructure
Development
• Eskom invested over R40m in sewage and electrical distribution systems in
Lephalale.
• Six mobile schools, teachers and equipment funded
• R3bn spent on procurement, housing, electricity, roads, sewerage plants and
related infrastructure in Lephalale since 2007 30
Medupi has achieved successes in four key areas

In support of
Komati Water Scheme opened
• Komati Water Scheme Augmentation Project is the construction of a new
pipeline and pump station from Rietfontein Pump Station to Duvha
power station to augment the increase in water demands on the Komati
Scheme.
• The project was launched by the Minister of Water and Environmental
Affairs, Edna Molewa, on 19 March for National Water Week 2013.

In support of
De Hoop Dam largely completed
33
Construction of the 88m
high De Hoop Dam and
related infrastructure will
supply water to domestic
and industrial users in the
middle Olifants river
catchment area

In support of
Nelson Mandela Road
31
Upgrades to roads

In support of
More than 1000 housing units have been completed and 2500+ even have
been designed for future projectsConfidential
36
New employee housing units

In support of
The purpose of this project is to upgrade the current taxi rank in Wells street to the benefit of the entire community
Sponsors
37
Taxi rank upgrade

In support of
• Paarl WWTW has an installed treatment capacity of 10Ml/d
• Plants are experiencing capacity constraints – operational issues are being addressed as a matter of urgency
• There is a need to install an additional 10ML/day treatment plant
• Construction is expected to commence post Feb 2015
38
Paarl Waste Water Treatment Works

In support of
Confidential39
Eskom Medupi – ED, CSI, SED and skills development

In support of
39 40
“Our intention on this project is to empower
the local community – Murray and Roberts
wants to leave a lasting legacy in Lephalale
and implement a project that will go a long
way towards addressing the skills shortage in
the area. We want to see young people
become qualified artisans who will be able to
support themselves, their families, and
contribute meaningfully to the economic
growth of this country”
says de Villiers
Skills development at Medupi

In support of
PROJECT NAME VALUE Rm COMMENTS1 Water from Mokolo dam – MCWAP1 (LLM impact) 2 100 000 000 In progress
2 Expansion of Zeeland WTW 87 000 000 Completed
3 Marapong Supply Zone 8ML Reservoir 6 000 000 Completed
4 Water Pipeline Zeeland to Onverwacht (750mm) 300 000 000 In progress
5 Lephalale Sewer Treatment plant Paarl (New:10Ml) 55 000 000 Completed
6Upgrading: internal sewer network ( 4 pump stations) 9 000 000 Completed
7 Sewer treatment plant Marapong upgrade 13 000 000 Completed
8 Refurbish of Paarl Treatment Works 14 500 000 Completed
9 Increase main station capacity (5 MVA Transformer) 11 000 000Funded by LLM –Completed
10 New Main Sub Station (120 MVA) (Funding LG & H) 220 000 000 In progress: COD 4/2015
11 Upgrade Mini-Subs 2 & 3 (Switch gear) 4 000 000Funded by LLM –Completed
12 Marapong internal roads upgrade (5.5km) Phase 1 (Funding: R5,3m Exxaro; R3,5m LLM)
8 800 000 Completed
13 Marapong internal roads upgrade (5.5km) Phase 2 (Funding: R3,3m Exxaro; R3,5m LLM; R14,8m MIG)
21 600 000 Completed
14 Ring Road 2 700 000 Completed
TOTAL (Rm) Excluding MCWAP1 752 600 000
Water
Waste Water
Electricity
Roads
41
Historical Capital Projects facilitated up to 2012

In support of
Confidential43
Exxaro CSI

In support of
• Multi Purpose Community Centre in Steenbokpan
• Upgrading of school in Steenbokpan
Current clinic facility…
Confidential44
Sasol – Steenbokpan

In support of
Infrastructure development
43
A school born out of love is a beacon of progress for Lephalale
Hitachi Power Africa invested a total of R1,25m to Segwati Pre School which was initially
used for its construction and the purchase of educational toys. “Helen (the principal) is the
reason that school is still standing strong - she is innovative and a beacon of what can be
achieved. It is important not only for us, but for the country to work with champions like
Helen who are able to take what little they have and get and run with it”, says Pamela
Radebe, HPA head of Enterprise Development

In support of
• Business and operational plans are being finalised
• Funding and studio space are required – being facilitated
87.8 FM
Reg.# 088-726 NPO
“The frequency beyond the Bushveld”
Icasa Licence #: Class/Com/R164/Oct/11
46
Lephalale FM

In support of
Other Projects
1
Truck Stop – temporary and permanent:
• Temporary truck stop authorized
• preparation almost complete and on time for use from
July/Aug 2013.
• Further development of permanent truck stop ongoing
2Skills development plan:
Task team developing skills development plan for Lephalale
3Lephalale university campus:
Included as part of skills development plan & MLI
4
Lephalale Tourism:
Lephalale tourism strategy being developed for area to
becomes preferred tourism destination
5
LED issues:
LAC & Tourism being addressed separately, incubator and
Industrial Park included as part of SEZ
6
Environmental Sustainability issues:
Efforts underway to green the town - negotiations regarding
landfill site, recycling, backyard composting, food gardens
7
Social Services issues: Waste/recycling awareness,
Safety/security forums, Marapong clinic take-over,
Steenbokpan MPCC
47
Other projects planned for Lephalale

In support of
We need to work together to build a better and stronger
community29
Accelerated growth in the area brings about a wealth of opportunity but with growth comes challenges
• SIP 01 investment brings about a wealth of opportunity and social upliftment.
• Access to job opportunities
• Basic services
• Community developments such as schools, clinics, hospitals and
recreational centres
• New business opportunities will open up through the hype of economic
activity in the area and it is open for entrepreneurs to exploit
• With opportunity comes a number of challenges and we require support from
community members.
• Welcome out-of-town workers and new residents
• Patience in providing infrastructure such as water, sanitation, roads etc.
These developments take time and cannot be completed overnight
• Work with government and business to avoid strike action where
possible. Extended strike action hinders progress in the area
• Assist with family relocation to help prevent progress delays
• Land access to build infrastructure

In support of
48
A brighter future is only possible with your patience and support

In support of
Thank you
SIP 01 Programme Lead: Poobie Govender (General Manager in Office of the
Chief Executive)
SIP 01 Eskom Executive Sponsor: Kannan Lakmeeharan (Divisional Executive in
Office of the Chief Executive)
Contact details: [email protected]

In support of
49
Overview of the 18 SIPs: Geographic SIPSE
skom
Tra
nsnet

In support of
50
TC
TA
IDC
SA
NR
AL
Overview of the 18 SIPs: Geographic SIPS

In support of
51
Overview of the 18 SIPs: Energy SIPSID
C
ES
KO
M
ES
KO
M

In support of
52
Overview of the 18 SIPs: Spatial SIPSD
BS
A
MIS
A
AR
C

In support of
53
Overview of the 18 SIPs: Social Infrastructure SIPSE
?
DB
SA
CS
IR

In support of
54
Overview of the 18 SIPs: Knowledge SIPSS
KA
Bro
adband I
nfr
aco

In support of
55
Overview of the 18 SIPs: Regional SIP?