Embed Size (px)
DESCRIPTION
Philadelphia housing market show strong increase in the second quarter of 2013.
Citation preview
Econsult Solutions, Inc. | 1435 Walnut Street, Ste. 300 | Philadelphia, PA 19102
215-717-2777 | econsultsolutions.com
ECONSULT SOLUTIONS, INC.
PHILADELPHIA HOUSING
INDEX (PHI) - 2013 Q2
TABLE OF CONTENTS
Quarterly Index
Sales by Price per Square Foot
Sales Volume by Price Range Statistics by District
Quarterly Index by Subregion
Major Markets Comparison Background and Notes
...................................... 1
............. 2
............... 3
.................................. 4
............... 5
................ 6-7 .......................... 8
Low High
Price per Square Foot
Econsult Solutions, Inc. | 1435 Walnut Street, Ste. 300 | Philadelphia, PA 19102
215-717-2777 | econsultsolutions.com
ECONSULT SOLUTIONS, INC.
PHILADELPHIA HOUSING
INDEX - 2013 Q2
QUARTERLY INDEX
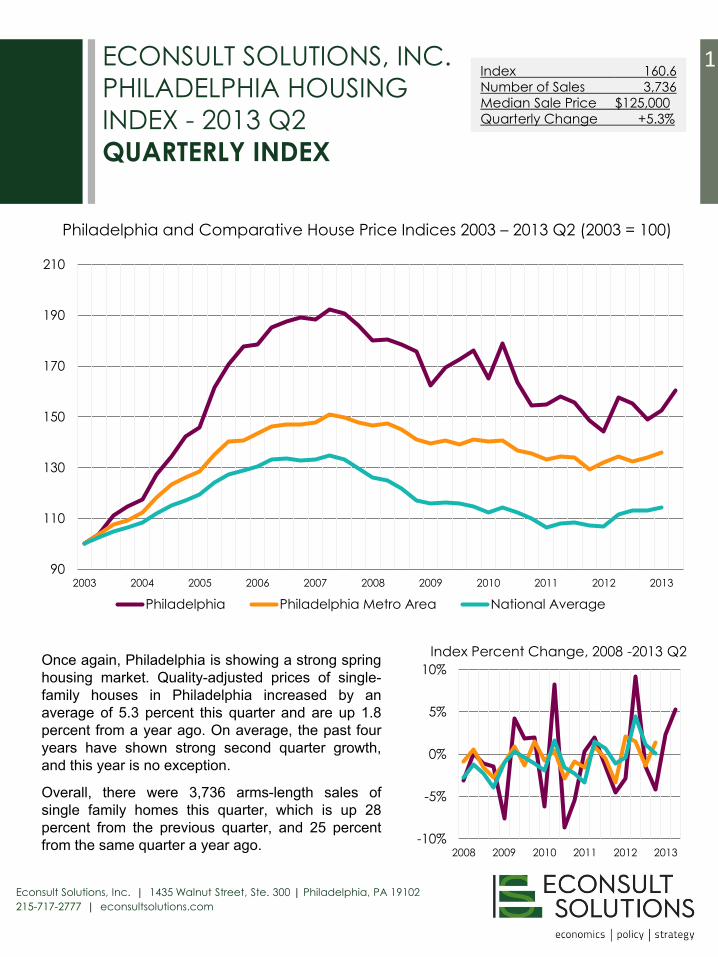
Once again, Philadelphia is showing a strong spring
housing market. Quality-adjusted prices of single-
family houses in Philadelphia increased by an
average of 5.3 percent this quarter and are up 1.8
percent from a year ago. On average, the past four
years have shown strong second quarter growth,
and this year is no exception.
Overall, there were 3,736 arms-length sales of
single family homes this quarter, which is up 28
percent from the previous quarter, and 25 percent
from the same quarter a year ago.
Philadelphia and Comparative House Price Indices 2003 – 2013 Q2 (2003 = 100)
1
Index Percent Change, 2008 -2013 Q2
Index 160.6
Number of Sales 3,736
Median Sale Price $125,000
Quarterly Change +5.3%
90
110
130
150
170
190
210
2003 2004 2005 2006 2007 2008 2009 2010 2011 2012 2013
Philadelphia Philadelphia Metro Area National Average
-10%
-5%
0%
5%
10%
2008 2009 2010 2011 2012 2013
Econsult Solutions, Inc. | 1435 Walnut Street, Ste. 300 | Philadelphia, PA 19102
215-717-2777 | econsultsolutions.com
More than $200
$150 to $200
$101 to $150
$51 to $100
$26 to $50
$25 or Less
477
426
830
1029
438
514
ECONSULT SOLUTIONS, INC.
PHILADELPHIA HOUSING
INDEX - 2013 Q2
SALES BY PRICE PER
SQUARE FOOT
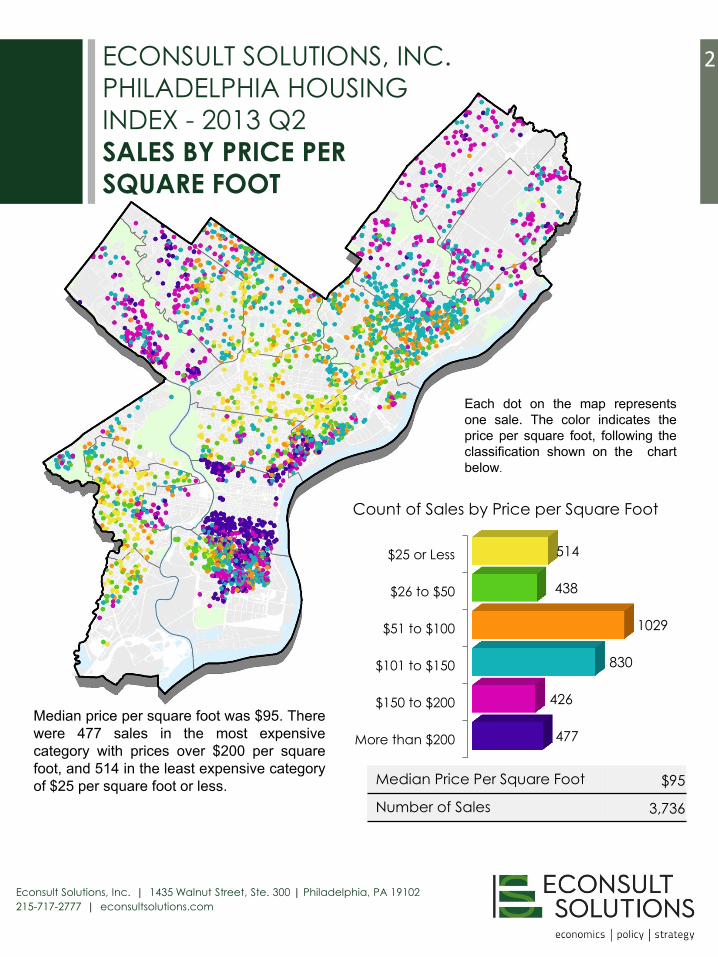
Median price per square foot was $95. There
were 477 sales in the most expensive
category with prices over $200 per square
foot, and 514 in the least expensive category
of $25 per square foot or less.
Each dot on the map represents
one sale. The color indicates the
price per square foot, following the
classification shown on the chart
below.
2
Median Price Per Square Foot $95
Number of Sales 3,736
Count of Sales by Price per Square Foot
Econsult Solutions, Inc. | 1435 Walnut Street, Ste. 300 | Philadelphia, PA 19102
215-717-2777 | econsultsolutions.com
ECONSULT SOLUTIONS, INC.
PHILADELPHIA HOUSING
INDEX - 2013 Q2
SALES VOLUME BY PRICE RANGE
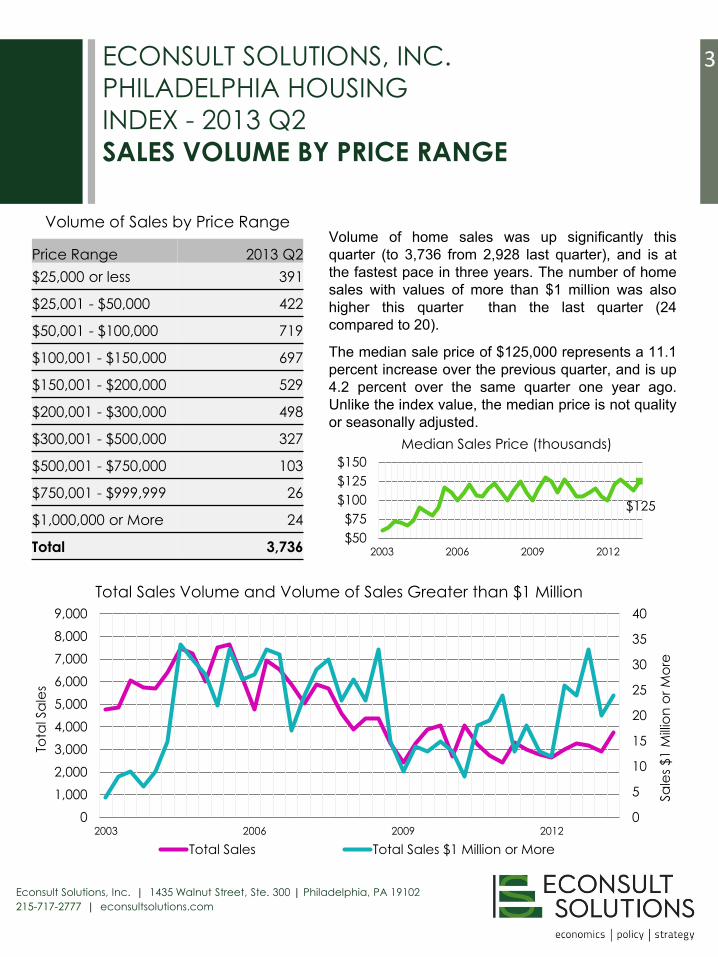
Volume of home sales was up significantly this
quarter (to 3,736 from 2,928 last quarter), and is at
the fastest pace in three years. The number of home
sales with values of more than $1 million was also
higher this quarter than the last quarter (24
compared to 20).
The median sale price of $125,000 represents a 11.1
percent increase over the previous quarter, and is up
4.2 percent over the same quarter one year ago.
Unlike the index value, the median price is not quality
or seasonally adjusted.
Price Range 2013 Q2
$25,000 or less 391
$25,001 - $50,000 422
$50,001 - $100,000 719
$100,001 - $150,000 697
$150,001 - $200,000 529
$200,001 - $300,000 498
$300,001 - $500,000 327
$500,001 - $750,000 103
$750,001 - $999,999 26
$1,000,000 or More 24
Total 3,736
Total Sales Volume and Volume of Sales Greater than $1 Million
Volume of Sales by Price Range
3
Median Sales Price (thousands)
$125
$50
$75
$100
$125
$150
2003 2006 2009 2012
0
5
10
15
20
25
30
35
40
0
1,000
2,000
3,000
4,000
5,000
6,000
7,000
8,000
9,000
2003 2006 2009 2012
Sa
les
$1
Mill
ion
or
Mo
re
Tota
l Sa
les
Total Sales Total Sales $1 Million or More
Econsult Solutions, Inc. | 1435 Walnut Street, Ste. 300 | Philadelphia, PA 19102
215-717-2777 | econsultsolutions.com
ECONSULT SOLUTIONS, INC.
PHILADELPHIA HOUSING
INDEX - 2013 Q2
STATISTICS BY DISTRICT
*Districts are identical to Philadelphia City Planning Districts except where noted with an asterisk. See Definitions and Notes on page 8 for details.
4
District Index Sales
Median
Sale Price
Quarterly
Change
Annual
Change
1 Upper Far Northeast 127.6 126 $221,500 0.5% -0.9%
2 Lower Far Northeast 147.2 157 $175,000 1.0% -2.6%
3 Central Northeast 133.9 175 $149,000 -0.5% -1.1%
4 North Delaware 114.0 356 $108,550 -0.1% -7.0%
5 Upper Northwest 156.2 209 $160,000 3.6% 3.0%
6 Upper North 162.2 247 $77,500 1.6% -7.7%
7 Lower Northeast 126.7 223 $70,000 -0.3% -4.0%
8 Lower Northwest 150.3 194 $213,550 0.6% 3.0%
9 North 127.5 207 $27,000 -0.2% -6.5%
10 River Wards 208.3 287 $99,900 0.1% 6.5%
11 West Park 180.5 67 $100,000 -2.6% 5.0%
12 Lower North 205.9 167 $68,000 3.6% 25.2%
13 West/Southwest* 93.2 225 $35,000 -1.8% 0.0%
14 University* 222.6 56 $248,000 0.7% 3.8%
15 Central 152.6 337 $409,900 3.1% 6.0%
16 Lower Southwest 157.7 70 $35,750 -4.2% -2.7%
17 Combined South* 250.1 633 $142,000 3.7% 13.0%
X Citywide 160.6 3,736 $125,000 5.3% 1.8%
Econsult Solutions, Inc. | 1435 Walnut Street, Ste. 300 | Philadelphia, PA 19102
215-717-2777 | econsultsolutions.com
ECONSULT SOLUTIONS, INC.
PHILADELPHIA HOUSING
INDEX - 2013 Q2
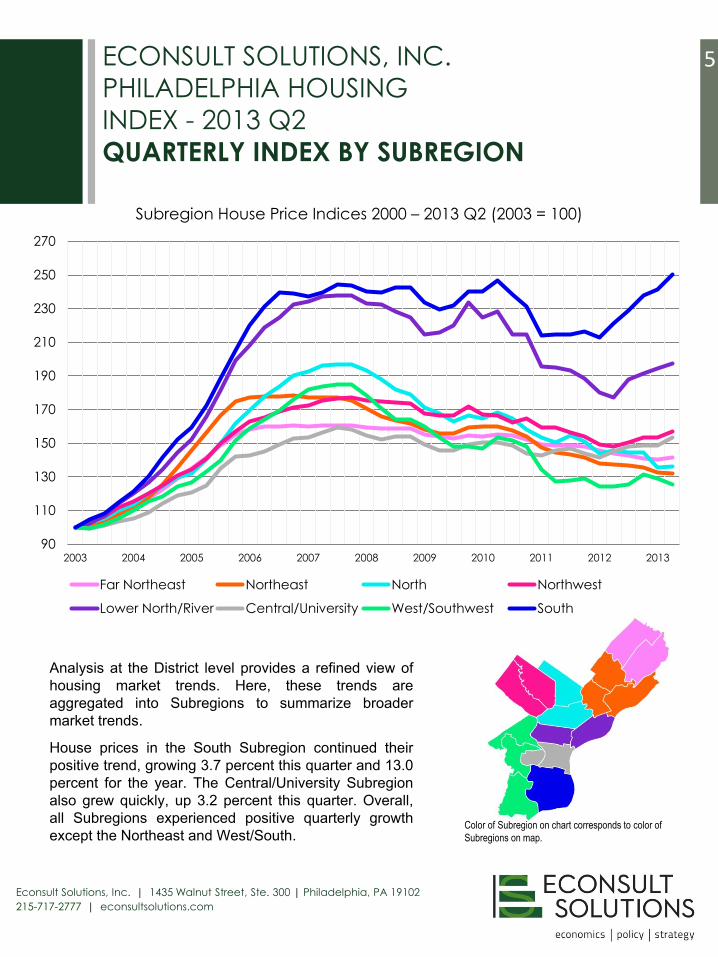
QUARTERLY INDEX BY SUBREGION
Analysis at the District level provides a refined view of
housing market trends. Here, these trends are
aggregated into Subregions to summarize broader
market trends.
House prices in the South Subregion continued their
positive trend, growing 3.7 percent this quarter and 13.0
percent for the year. The Central/University Subregion
also grew quickly, up 3.2 percent this quarter. Overall,
all Subregions experienced positive quarterly growth
except the Northeast and West/South.
Subregion House Price Indices 2000 – 2013 Q2 (2003 = 100)
5
Color of Subregion on chart corresponds to color of
Subregions on map.
90
110
130
150
170
190
210
230
250
270
2003 2004 2005 2006 2007 2008 2009 2010 2011 2012 2013
Far Northeast Northeast North Northwest
Lower North/River Central/University West/Southwest South
Econsult Solutions, Inc. | 1435 Walnut Street, Ste. 300 | Philadelphia, PA 19102
215-717-2777 | econsultsolutions.com
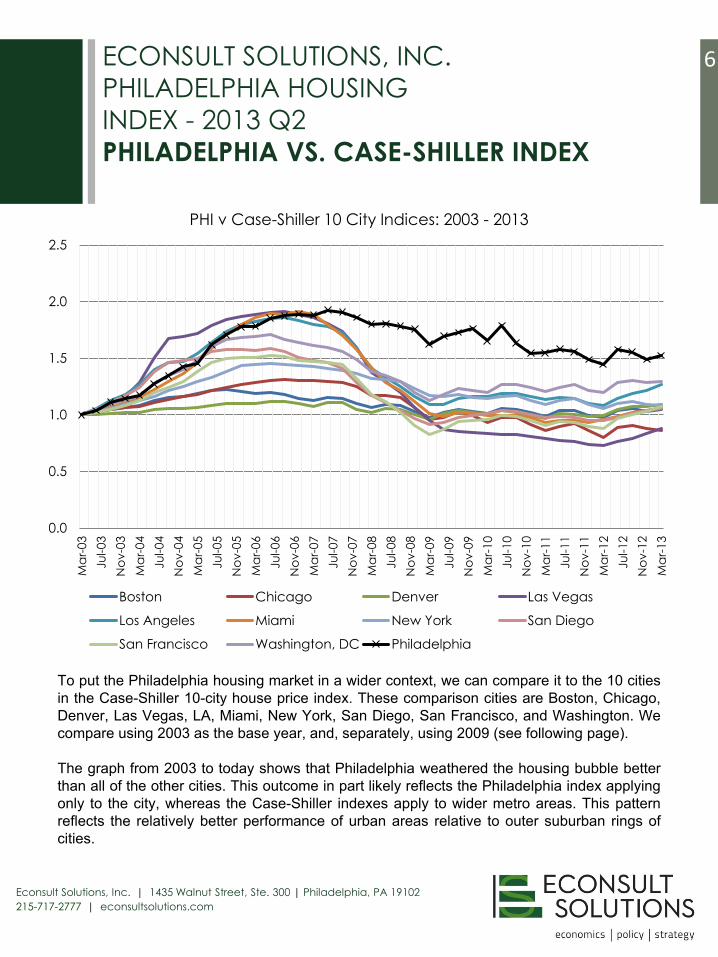
To put the Philadelphia housing market in a wider context, we can compare it to the 10 cities
in the Case-Shiller 10-city house price index. These comparison cities are Boston, Chicago,
Denver, Las Vegas, LA, Miami, New York, San Diego, San Francisco, and Washington. We
compare using 2003 as the base year, and, separately, using 2009 (see following page).
The graph from 2003 to today shows that Philadelphia weathered the housing bubble better
than all of the other cities. This outcome in part likely reflects the Philadelphia index applying
only to the city, whereas the Case-Shiller indexes apply to wider metro areas. This pattern
reflects the relatively better performance of urban areas relative to outer suburban rings of
cities.
ECONSULT SOLUTIONS, INC.
PHILADELPHIA HOUSING
INDEX - 2013 Q2
PHILADELPHIA VS. CASE-SHILLER INDEX
6
0.0
0.5
1.0
1.5
2.0
2.5
Ma
r-03
Ju
l-03
No
v-0
3
Ma
r-04
Ju
l-04
No
v-0
4
Ma
r-05
Ju
l-05
No
v-0
5
Ma
r-06
Ju
l-06
No
v-0
6
Ma
r-07
Ju
l-07
No
v-0
7
Ma
r-08
Ju
l-08
No
v-0
8
Ma
r-09
Ju
l-09
No
v-0
9
Ma
r-10
Ju
l-10
No
v-1
0
Ma
r-11
Ju
l-11
No
v-1
1
Ma
r-12
Ju
l-12
No
v-1
2
Ma
r-13
PHI v Case-Shiller 10 City Indices: 2003 - 2013
Boston Chicago Denver Las Vegas
Los Angeles Miami New York San Diego
San Francisco Washington, DC Philadelphia
Econsult Solutions, Inc. | 1435 Walnut Street, Ste. 300 | Philadelphia, PA 19102
215-717-2777 | econsultsolutions.com
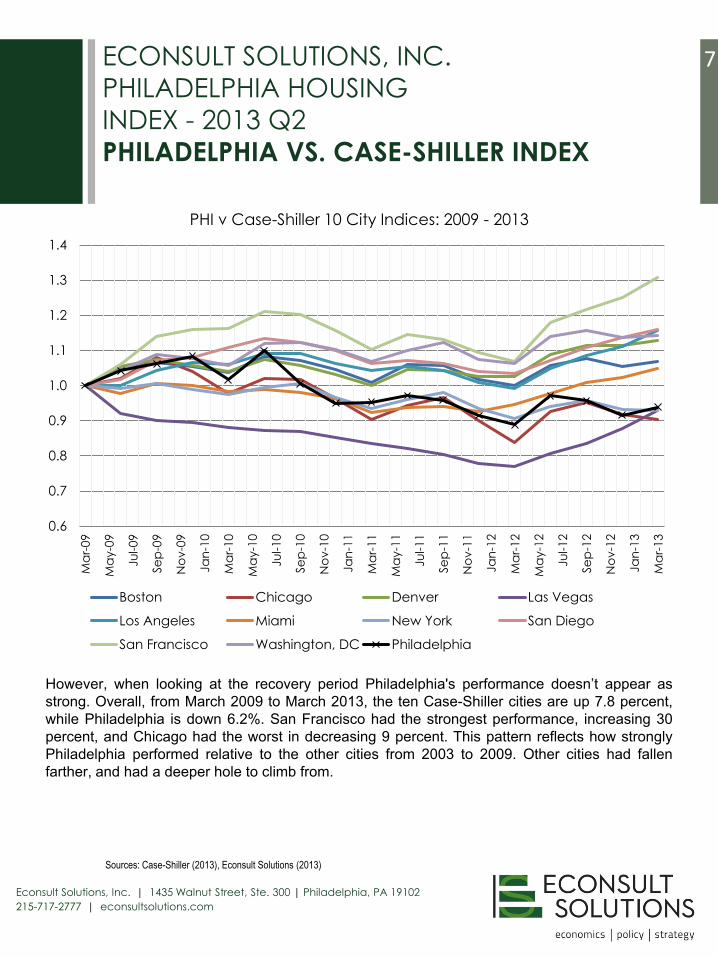
However, when looking at the recovery period Philadelphia's performance doesn’t appear as
strong. Overall, from March 2009 to March 2013, the ten Case-Shiller cities are up 7.8 percent,
while Philadelphia is down 6.2%. San Francisco had the strongest performance, increasing 30
percent, and Chicago had the worst in decreasing 9 percent. This pattern reflects how strongly
Philadelphia performed relative to the other cities from 2003 to 2009. Other cities had fallen
farther, and had a deeper hole to climb from.
ECONSULT SOLUTIONS, INC.
PHILADELPHIA HOUSING
INDEX - 2013 Q2
PHILADELPHIA VS. CASE-SHILLER INDEX
7
Sources: Case-Shiller (2013), Econsult Solutions (2013)
0.6
0.7
0.8
0.9
1.0
1.1
1.2
1.3
1.4
Ma
r-09
Ma
y-0
9
Ju
l-09
Se
p-0
9
No
v-0
9
Ja
n-1
0
Ma
r-10
Ma
y-1
0
Ju
l-10
Se
p-1
0
No
v-1
0
Ja
n-1
1
Ma
r-11
Ma
y-1
1
Ju
l-11
Se
p-1
1
No
v-1
1
Ja
n-1
2
Ma
r-12
Ma
y-1
2
Ju
l-12
Se
p-1
2
No
v-1
2
Ja
n-1
3
Ma
r-13
PHI v Case-Shiller 10 City Indices: 2009 - 2013
Boston Chicago Denver Las Vegas
Los Angeles Miami New York San Diego
San Francisco Washington, DC Philadelphia
Econsult Solutions, Inc. | 1435 Walnut Street, Ste. 300 | Philadelphia, PA 19102
215-717-2777 | econsultsolutions.com
ECONSULT SOLUTIONS, INC.
PHILADELPHIA HOUSING
INDEX - 2013 Q2
BACKGROUND AND NOTES
8
Background and Contact
Econsult Solutions, Inc. (ESI) provides the Philadelphia Housing Index (PHI) free of charge to the public. Thanks to Azavea
and the Office of Property Assessment for providing some of the data used in our analysis.
Sales are arms-length transactions of single-family homes only. The price indexes are estimated by Econsult Solutions,
Inc. using a quality controlled measure of average sale appreciation using hedonic regression analysis.
Questions and press inquiries should be directed to Econsult Solutions, Inc. President Richard P. Voith at
Notes
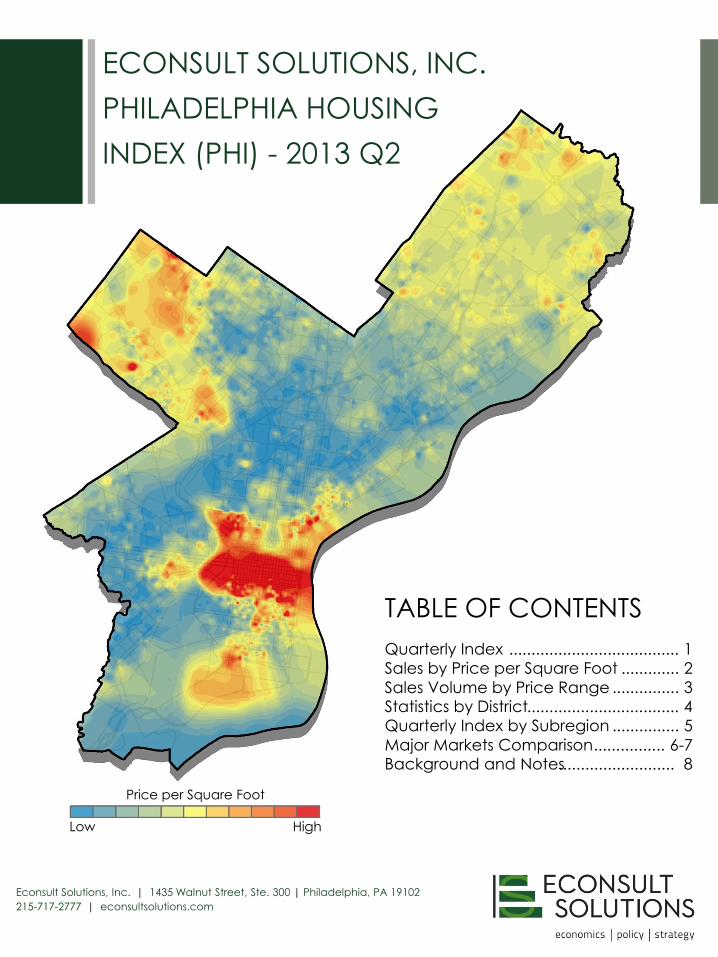
Cover: Map displays interpolated (inverse-distance weighted) cost surface based on price per square foot of sales. Lower
values of price per square foot are deep blue; higher values are red; yellow and green shades are in the middle. The image
is provided for illustrative purposes only and does not represent predictions of home values.
Page 1: National and Philadelphia Metro Indexes are from the Seasonally Adjusted Purchase Only Series from the Federal
Housing Finance Agency. Philadelphia Metro refers to the Pennsylvania Division of the Metropolitan Statistical Area,
which includes the Philadelphia, Bucks, Chester, Delaware, and Montgomery counties.
Page 4: Econsult Solutions, Inc. Districts are identical to those used by the Philadelphia City Planning Commission (PCPC)
except: PCPC’s “Lower South” is included in “South”; University City is carved out from PCPC’s “University/SouthWest”,
and the remaining Southwest is combined with West to form “West/Southwest”.
Pages 4 and 5: District and Subregion indexes are smoothed to reduce volatility and capture underlying market trends. The
smoothing means that overall district and subregion prices tend to reflect overall citywide price changes with a slight lag.
Page 5: For ease of presentation, Districts are further aggregated into “Subregions,” as shown on the map.
Page 6 & 7: 10 City Indices courtesy of Case-Shiller


![Highlights of ESI[truck] North America ESI[truck] North](https://img.pdfslide.us/doc/110x75/628b4a9ff91dad22754155f1/highlights-of-esitruck-north-america-esitruck-north-.jpg)