Embed Size (px)
Citation preview
16/29/2021
1
ESG & EQT: Path Towards Differentiation and Sustainable Value Creation
June 30, 2021
22
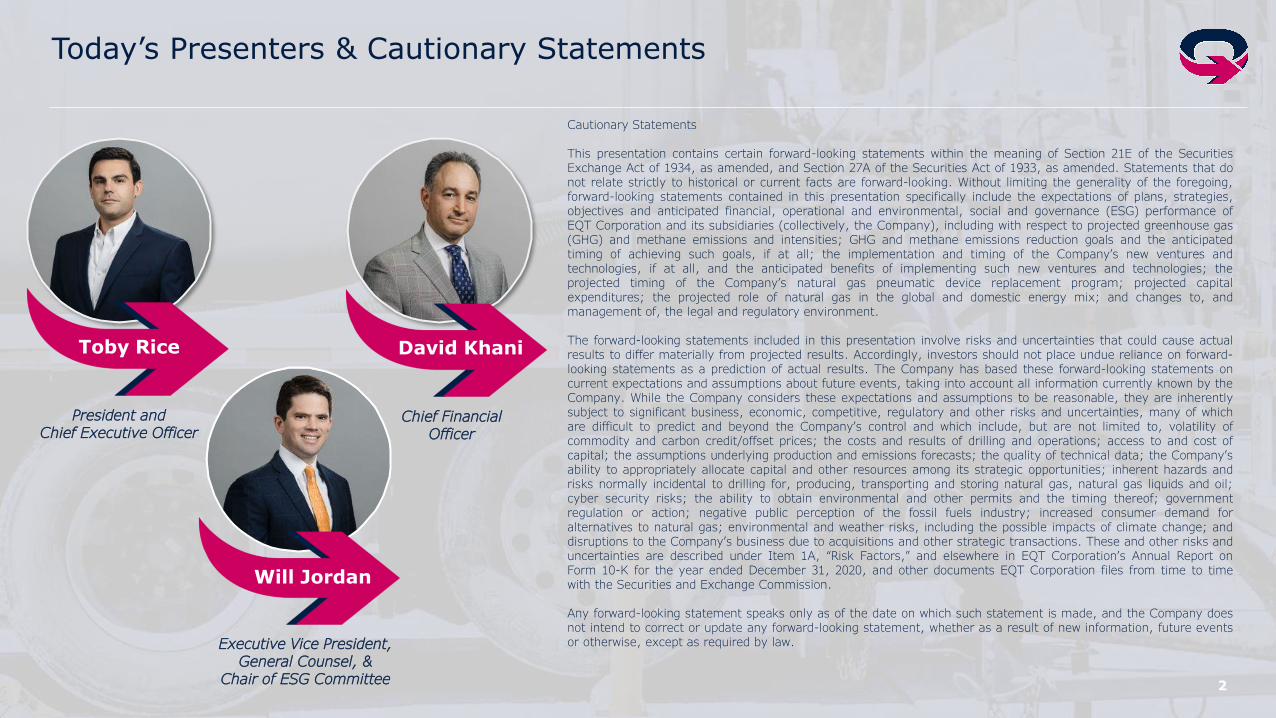
Today’s Presenters & Cautionary Statements
Toby Rice David Khani
President and Chief Executive Officer
Chief Financial Officer
Will Jordan
Executive Vice President,General Counsel, &
Chair of ESG Committee
Cautionary Statements
This presentation contains certain forward-looking statements within the meaning of Section 21E of the SecuritiesExchange Act of 1934, as amended, and Section 27A of the Securities Act of 1933, as amended. Statements that donot relate strictly to historical or current facts are forward-looking. Without limiting the generality of the foregoing,forward-looking statements contained in this presentation specifically include the expectations of plans, strategies,objectives and anticipated financial, operational and environmental, social and governance (ESG) performance ofEQT Corporation and its subsidiaries (collectively, the Company), including with respect to projected greenhouse gas(GHG) and methane emissions and intensities; GHG and methane emissions reduction goals and the anticipatedtiming of achieving such goals, if at all; the implementation and timing of the Company’s new ventures andtechnologies, if at all, and the anticipated benefits of implementing such new ventures and technologies; theprojected timing of the Company’s natural gas pneumatic device replacement program; projected capitalexpenditures; the projected role of natural gas in the global and domestic energy mix; and changes to, andmanagement of, the legal and regulatory environment.
The forward-looking statements included in this presentation involve risks and uncertainties that could cause actualresults to differ materially from projected results. Accordingly, investors should not place undue reliance on forward-looking statements as a prediction of actual results. The Company has based these forward-looking statements oncurrent expectations and assumptions about future events, taking into account all information currently known by theCompany. While the Company considers these expectations and assumptions to be reasonable, they are inherentlysubject to significant business, economic, competitive, regulatory and other risks and uncertainties, many of whichare difficult to predict and beyond the Company’s control and which include, but are not limited to, volatility ofcommodity and carbon credit/offset prices; the costs and results of drilling and operations; access to and cost ofcapital; the assumptions underlying production and emissions forecasts; the quality of technical data; the Company’sability to appropriately allocate capital and other resources among its strategic opportunities; inherent hazards andrisks normally incidental to drilling for, producing, transporting and storing natural gas, natural gas liquids and oil;cyber security risks; the ability to obtain environmental and other permits and the timing thereof; governmentregulation or action; negative public perception of the fossil fuels industry; increased consumer demand foralternatives to natural gas; environmental and weather risks, including the possible impacts of climate change; anddisruptions to the Company’s business due to acquisitions and other strategic transactions. These and other risks anduncertainties are described under Item 1A, “Risk Factors,” and elsewhere in EQT Corporation’s Annual Report onForm 10-K for the year ended December 31, 2020, and other documents EQT Corporation files from time to timewith the Securities and Exchange Commission.
Any forward-looking statement speaks only as of the date on which such statement is made, and the Company doesnot intend to correct or update any forward-looking statement, whether as a result of new information, future eventsor otherwise, except as required by law.

3
2020 ESG Report: EMPOWERING EVOLUTION
“We are turning our vision into reality and executing on our mission to be the operator of choice for all stakeholders.”
▪ Engagement, transparency and accountability are the cornerstones of establishing alignment with our stakeholders
▪ Produced under disclosure frameworks maintained by GRI, SASB, TCFD, AXPC and Disclosing the Facts
▪ This report, along with previous reports, can be found at esg.eqt.com
4
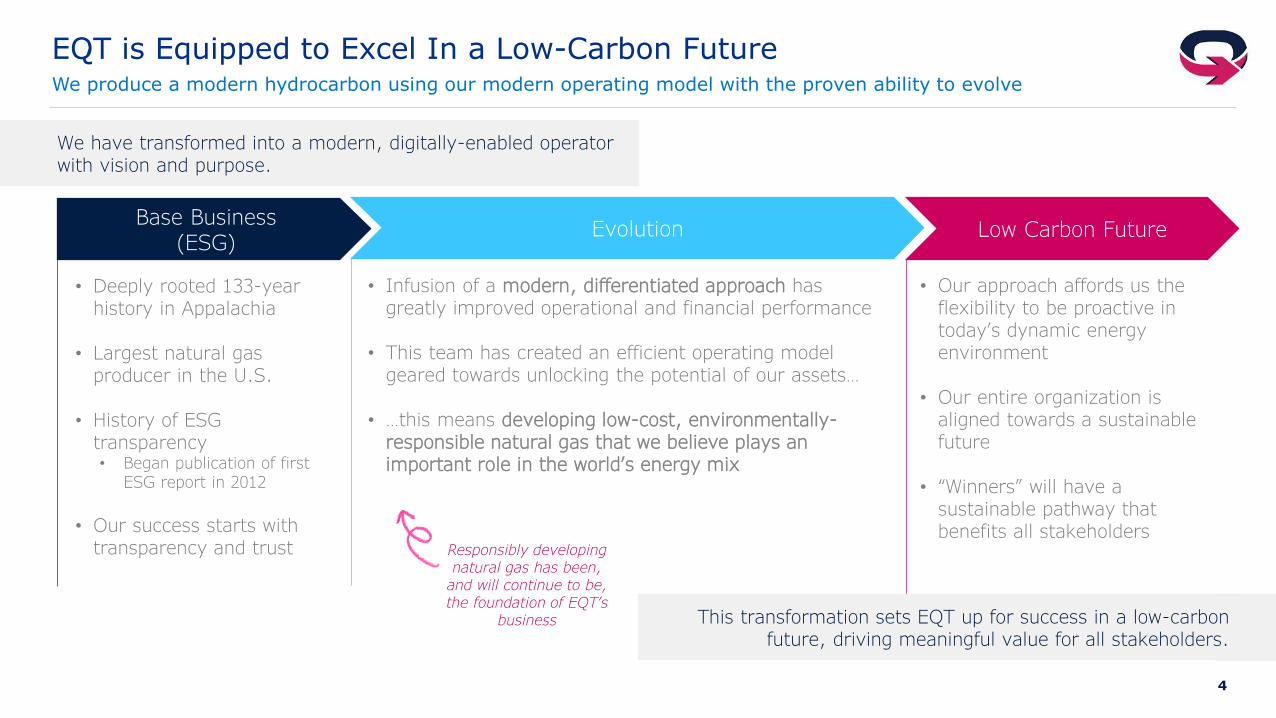
EQT is Equipped to Excel In a Low-Carbon Future
Base Business(ESG)
Evolution
We have transformed into a modern, digitally-enabled operator with vision and purpose.
This transformation sets EQT up for success in a low-carbon future, driving meaningful value for all stakeholders.
Low Carbon Future
• Deeply rooted 133-year history in Appalachia
• Largest natural gas producer in the U.S.
• History of ESG transparency• Began publication of first
ESG report in 2012
• Our success starts with transparency and trust
• Infusion of a modern, differentiated approach has greatly improved operational and financial performance
• This team has created an efficient operating model geared towards unlocking the potential of our assets…
• …this means developing low-cost, environmentally-responsible natural gas that we believe plays an important role in the world’s energy mix
• Our approach affords us the flexibility to be proactive in today’s dynamic energy environment
• Our entire organization is aligned towards a sustainable future
• “Winners” will have a sustainable pathway that benefits all stakeholders
Responsibly developing natural gas has been,
and will continue to be, the foundation of EQT’s
business
We produce a modern hydrocarbon using our modern operating model with the proven ability to evolve
5
Bangladesh
Canada
China
Colombia
Costa Rica
Denmark
Finland
FranceGermany
Ghana
Hungary
India
Indonesia
Iraq
Israel
Japan
KuwaitMexico
Nepal
Norway
Saudi Arabia
Spain
Switzerland
United Arab Emirates
United States
Uruguay
45
55
65
75
85
95
105
100 1,000 10,000
Socia
l Pro
gre
ss I
ndex
Energy use (kg of oil equivalent per capita)
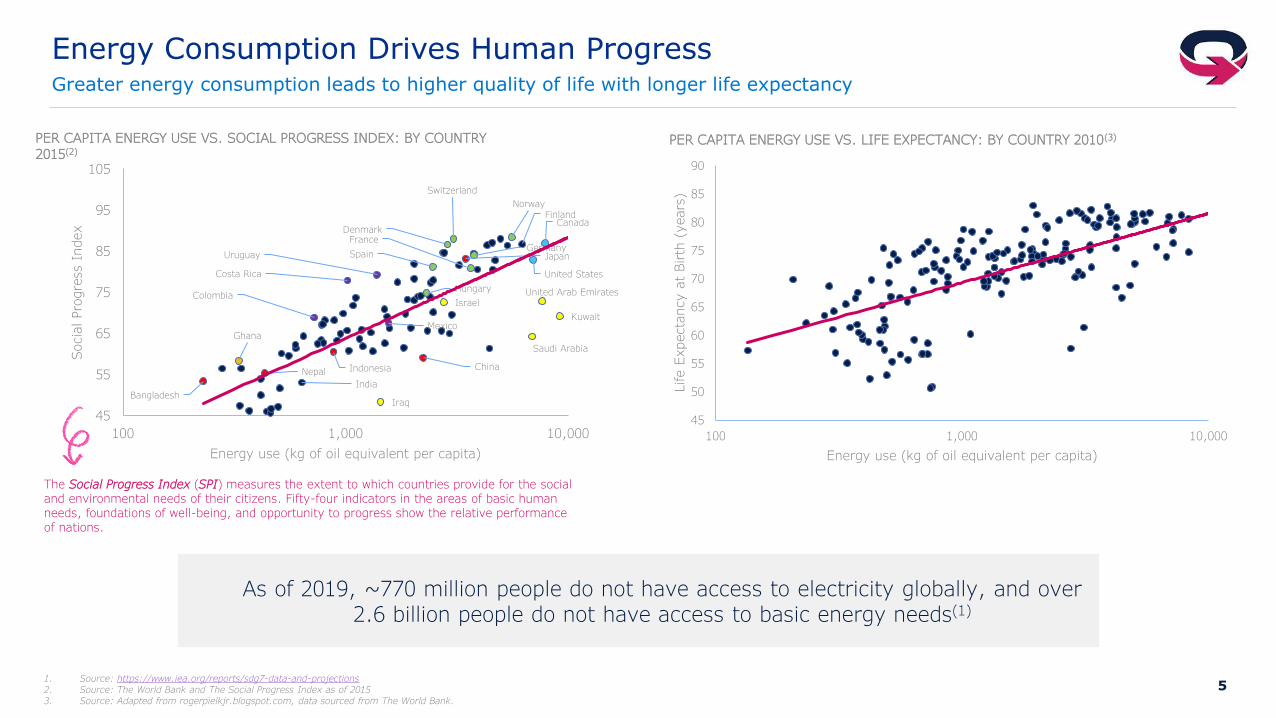
PER CAPITA ENERGY USE VS. SOCIAL PROGRESS INDEX: BY COUNTRY
2015(2)
Energy Consumption Drives Human ProgressGreater energy consumption leads to higher quality of life with longer life expectancy
45
50
55
60
65
70
75
80
85
90
100 1,000 10,000
Life E
xpecta
ncy a
t Birth
(years
)
Energy use (kg of oil equivalent per capita)
PER CAPITA ENERGY USE VS. LIFE EXPECTANCY: BY COUNTRY 2010(3)
1. Source: https://www.iea.org/reports/sdg7-data-and-projections2. Source: The World Bank and The Social Progress Index as of 20153. Source: Adapted from rogerpielkjr.blogspot.com, data sourced from The World Bank.
As of 2019, ~770 million people do not have access to electricity globally, and over 2.6 billion people do not have access to basic energy needs(1)
The Social Progress Index (SPI) measures the extent to which countries provide for the social and environmental needs of their citizens. Fifty-four indicators in the areas of basic human needs, foundations of well-being, and opportunity to progress show the relative performance of nations.
6
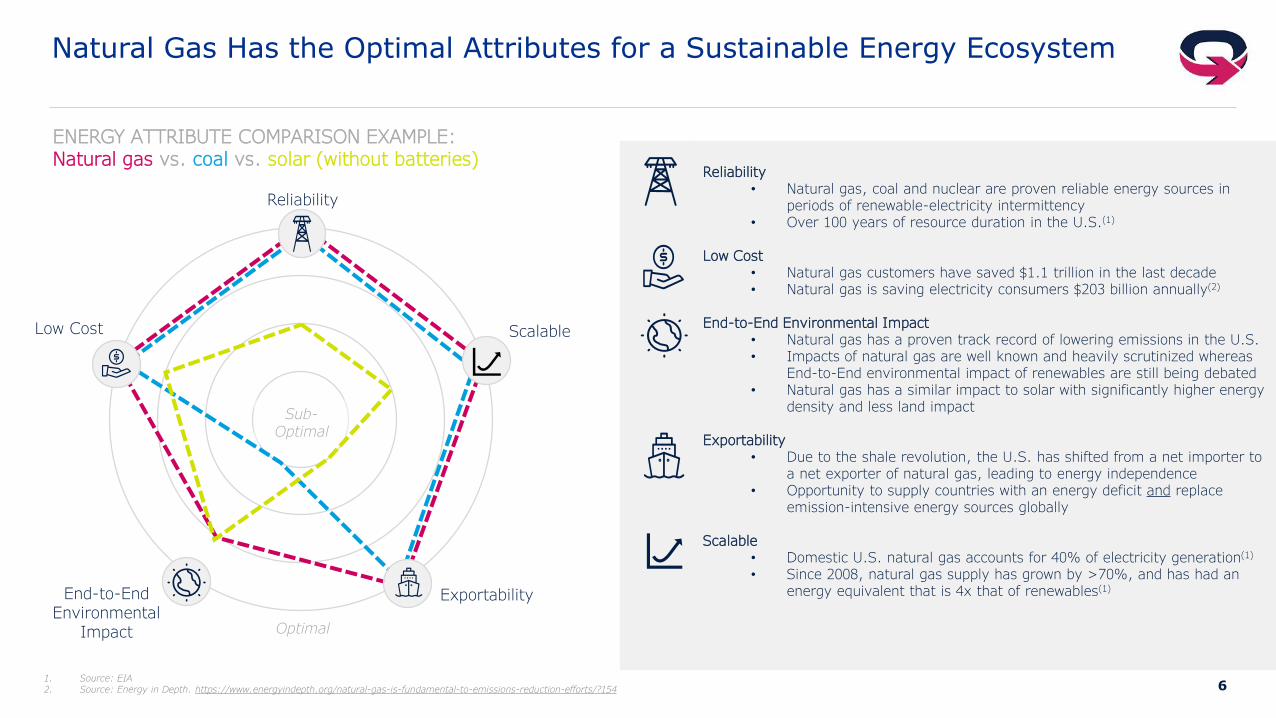
Reliability• Natural gas, coal and nuclear are proven reliable energy sources in
periods of renewable-electricity intermittency• Over 100 years of resource duration in the U.S.(1)
Low Cost• Natural gas customers have saved $1.1 trillion in the last decade• Natural gas is saving electricity consumers $203 billion annually(2)
End-to-End Environmental Impact• Natural gas has a proven track record of lowering emissions in the U.S.• Impacts of natural gas are well known and heavily scrutinized whereas
End-to-End environmental impact of renewables are still being debated• Natural gas has a similar impact to solar with significantly higher energy
density and less land impact
Exportability• Due to the shale revolution, the U.S. has shifted from a net importer to
a net exporter of natural gas, leading to energy independence• Opportunity to supply countries with an energy deficit and replace
emission-intensive energy sources globally
Scalable• Domestic U.S. natural gas accounts for 40% of electricity generation(1)
• Since 2008, natural gas supply has grown by >70%, and has had an energy equivalent that is 4x that of renewables(1)
Natural Gas Has the Optimal Attributes for a Sustainable Energy Ecosystem
Reliability
Scalable
ENERGY ATTRIBUTE COMPARISON EXAMPLE:Natural gas vs. coal vs. solar (without batteries)
Optimal
Sub-Optimal
1. Source: EIA2. Source: Energy in Depth. https://www.energyindepth.org/natural-gas-is-fundamental-to-emissions-reduction-efforts/?154
End-to-EndEnvironmental
Impact
Exportability
Low Cost
7
0
5,000
10,000
15,000
20,000
25,000
30,000
35,000
1/1
1/2
1/3
1/4
1/5
1/6
1/7
1/8
1/1
0
1/1
1
1/1
2
1/1
3
1/1
4
1/1
5
1/1
6
1/1
7
1/1
9
1/2
0
1/2
1
1/2
2
1/2
3
1/2
4
1/2
5
1/2
6
1/2
8
1/2
9
1/3
0
1/3
1
Mw
h
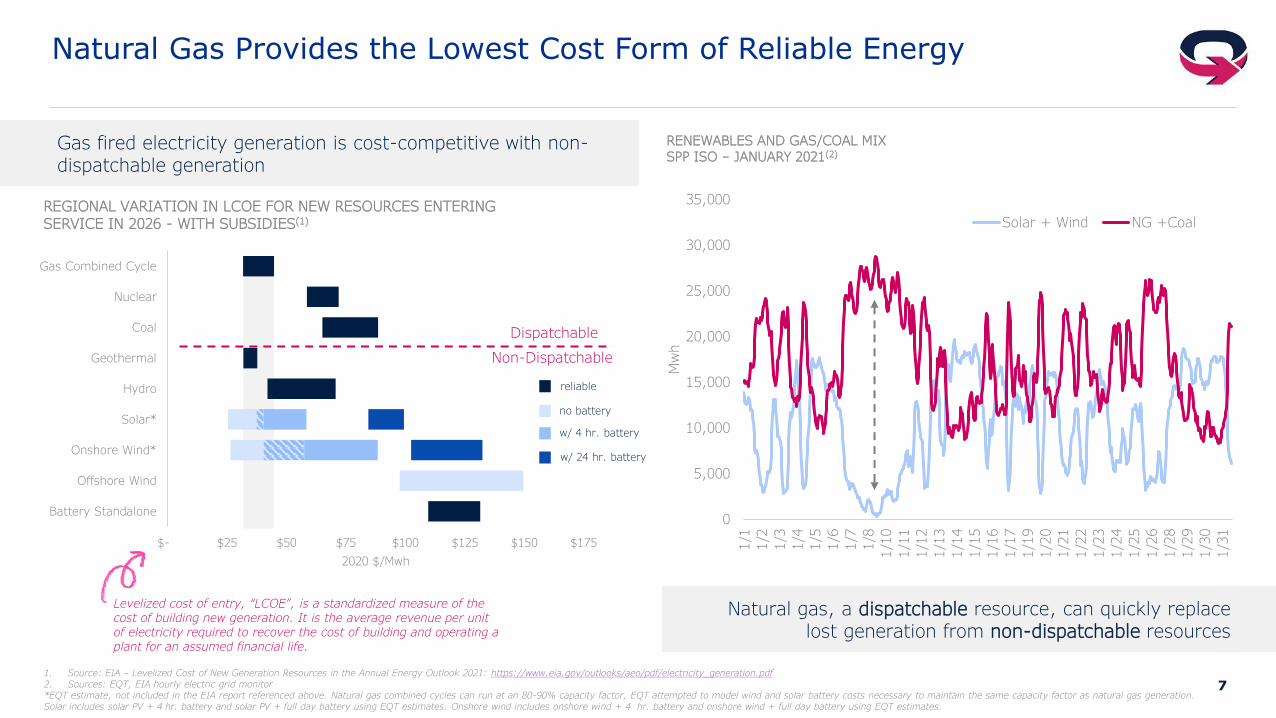
RENEWABLES AND GAS/COAL MIX
SPP ISO – JANUARY 2021(2)
Solar + Wind NG +Coal
$- $25 $50 $75 $100 $125 $150 $175
Battery Standalone
Offshore Wind
Onshore Wind*
Solar*
Hydro
Geothermal
Coal
Nuclear
Gas Combined Cycle
2020 $/Mwh
REGIONAL VARIATION IN LCOE FOR NEW RESOURCES ENTERING SERVICE IN 2026 - WITH SUBSIDIES(1)
Natural Gas Provides the Lowest Cost Form of Reliable Energy
Gas fired electricity generation is cost-competitive with non-dispatchable generation
Natural gas, a dispatchable resource, can quickly replace lost generation from non-dispatchable resources
1. Source: EIA – Levelized Cost of New Generation Resources in the Annual Energy Outlook 2021: https://www.eia.gov/outlooks/aeo/pdf/electricity_generation.pdf2. Sources: EQT, EIA hourly electric grid monitor*EQT estimate, not included in the EIA report referenced above. Natural gas combined cycles can run at an 80-90% capacity factor, EQT attempted to model wind and solar battery costs necessary to maintain the same capacity factor as natural gas generation. Solar includes solar PV + 4 hr. battery and solar PV + full day battery using EQT estimates. Onshore wind includes onshore wind + 4 hr. battery and onshore wind + full day battery using EQT estimates.
Levelized cost of entry, “LCOE”, is a standardized measure of the cost of building new generation. It is the average revenue per unit of electricity required to recover the cost of building and operating a plant for an assumed financial life.
Dispatchable
Non-Dispatchable
w/ 24 hr. battery
w/ 4 hr. battery
no battery
reliable
8
0%
10%
20%
30%
40%
50%
60%
70%
80%
90%
100%
1973
1976
1979
1982
1985
1988
1991
1994
1997
2000
2003
2006
2009
2012
2015
2018
% E
nerg
y M
ix
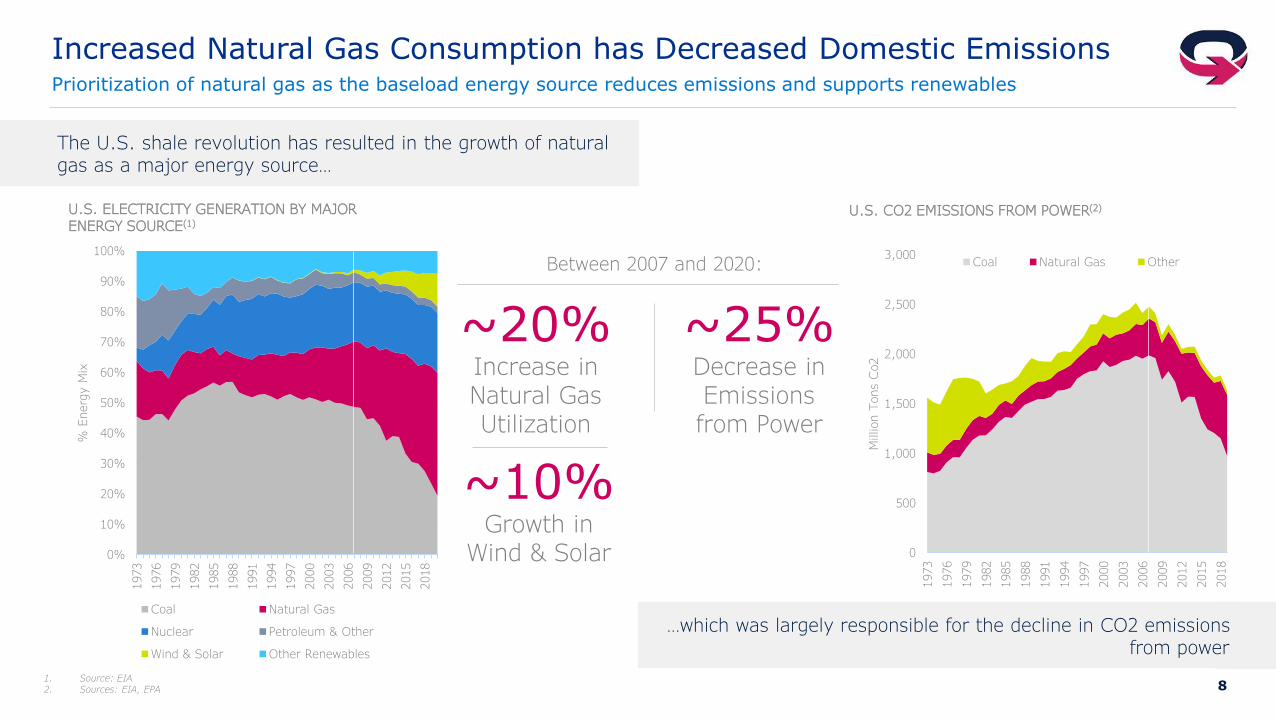
U.S. ELECTRICITY GENERATION BY MAJOR ENERGY SOURCE(1)
Coal Natural Gas
Nuclear Petroleum & Other
Wind & Solar Other Renewables
Increased Natural Gas Consumption has Decreased Domestic EmissionsPrioritization of natural gas as the baseload energy source reduces emissions and supports renewables
1. Source: EIA2. Sources: EIA, EPA
The U.S. shale revolution has resulted in the growth of natural gas as a major energy source…
…which was largely responsible for the decline in CO2 emissionsfrom power
0
500
1,000
1,500
2,000
2,500
3,000
1973
1976
1979
1982
1985
1988
1991
1994
1997
2000
2003
2006
2009
2012
2015
2018
Million T
ons C
o2
U.S. CO2 EMISSIONS FROM POWER(2)
Coal Natural Gas Other
~20%Increase in Natural Gas Utilization
~25% Decrease in Emissions from Power
Between 2007 and 2020:
~10%Growth in
Wind & Solar
9
Compelling Opportunity for Domestic Natural Gas to Replace Carbon-Intensive Energy Sources
1. Source: https://ourworldindata.org/grapher/coal-energy-share2. Source: Rhodium Group3. Source: https://www.carbonbrief.org/mapped-worlds-coal-power-plants4. That is announced, pre-permitted, permitted, or under construction as of 2020. Source: https://globalenergymonitor.org/projects/global-coal-plant-tracker/dashboard/
FUTURE GLOBAL COAL POWER(3)
Closing
Operating
New
Under Construction
Planned
Size of bubble represents capacity size (MW)
27%
11%
7% 6%3% 3% 3% 2%
0
2,000
4,000
6,000
8,000
10,000
12,000
14,000
16,000
Million M
T C
O2e
2019 NET GHG EMISSION FROM THE
WORLD'S LARGEST EMITTERS(2)
~3 BillionPeople in the world who rely on coal as their primary power
source(1)
>36%Of global power is
generated by coal in 2019
The opportunity for natural gas
~250,000 MWOf new(4) coal generation in
China
This equates to
~23 Bcf/d of natural gas demand…
…that would result in
~370 million fewer tons of CO2 emissions per year
10
0
5
10
15
20
25
30
35
40
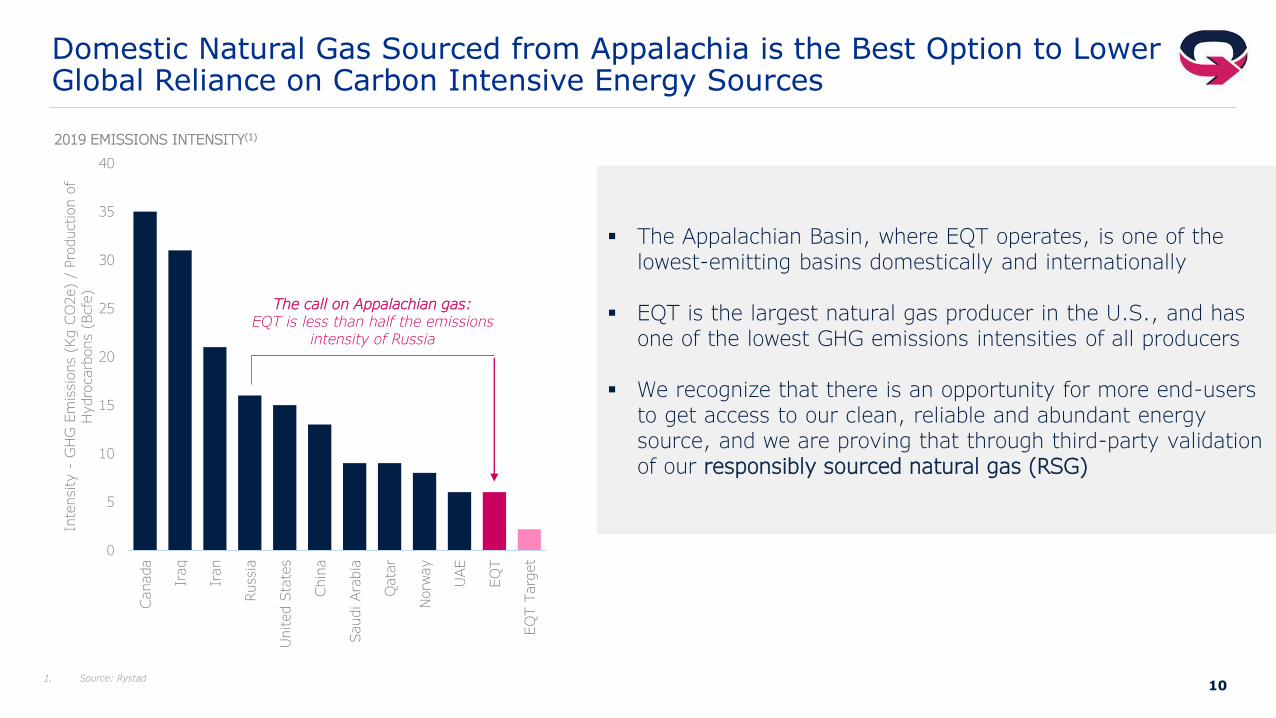
Canada
Iraq
Iran
Russi
a
United S
tate
s
Chin
a
Saudi Ara
bia
Qata
r
Norw
ay
UAE
EQ
T
EQ
T T
arg
et
Inte
nsity -
GHG
Em
issio
ns (
Kg C
O2e)
/ Pro
duction o
f Hydro
carb
ons (
Bcfe
)
2019 EMISSIONS INTENSITY(1)
Domestic Natural Gas Sourced from Appalachia is the Best Option to Lower Global Reliance on Carbon Intensive Energy Sources
1. Source: Rystad
▪ The Appalachian Basin, where EQT operates, is one of the lowest-emitting basins domestically and internationally
▪ EQT is the largest natural gas producer in the U.S., and has one of the lowest GHG emissions intensities of all producers
▪ We recognize that there is an opportunity for more end-users to get access to our clean, reliable and abundant energy source, and we are proving that through third-party validation of our responsibly sourced natural gas (RSG)
The call on Appalachian gas:EQT is less than half the emissions
intensity of Russia

11
EQT’s Engaged, Values-Driven Workforce is Driving ESG Excellence
CULTURE
▪ Our unique digital work environment has enhanced the way we work and communicate with each other
▪ Employee engagement has drastically improved, despite working-from-home
▪ Named a 2021 National Top Workplace by Energage
*EQT standalone; does not include acquired CVX Appalachia assets. 1. “Big Picture Score” comes from a vendor sourced database of >7,000 employers across all industries. Overall score considers employees commitment to EQT, motivation to work, and willingness to refer EQT as a great place to work.2. Peers with announced net zero goals, including AR, CP, CHK, COP, FANG, EOG, HES, MRO, OXY, PXD, RRC and XOM. Sourced from Enverus.
71%
0%
25%
50%
75%
100%
2016 2017 2018 2019 2020
"Big
Pic
ture
" Score
(1)
WORKFORCE ENGAGEMENT SURVEY
-
100,000
200,000
300,000
400,000
500,000
2018 2020*
metr
ic tons C
o2e
PRODUCTION SEGMENT COMBUSTION EMISSIONS
EMISSIONS
▪ Between 2018 and 2020, we reduced our Production segment combustion emissions by over 50%
▪ Use of electric frac fleets and hybrid drilling rigs have driven meaningful emissions reductions, among other technologies
▪ 2021 incentive compensation program tied to a reduction in Scope 1 GHG intensity
~(50%)
0
10
20
30
40
50
60
70
80
Em
issio
n I
nte
nsity –
GHG
Em
issio
ns (
Kg C
O2e)
/ Pro
duction o
f
Hydro
carb
ons (
Boe)
Anonymized Oil and Gas Companies
GHG EMISSIONS INTENSITY(2)
2x
5x
10x
15x
12
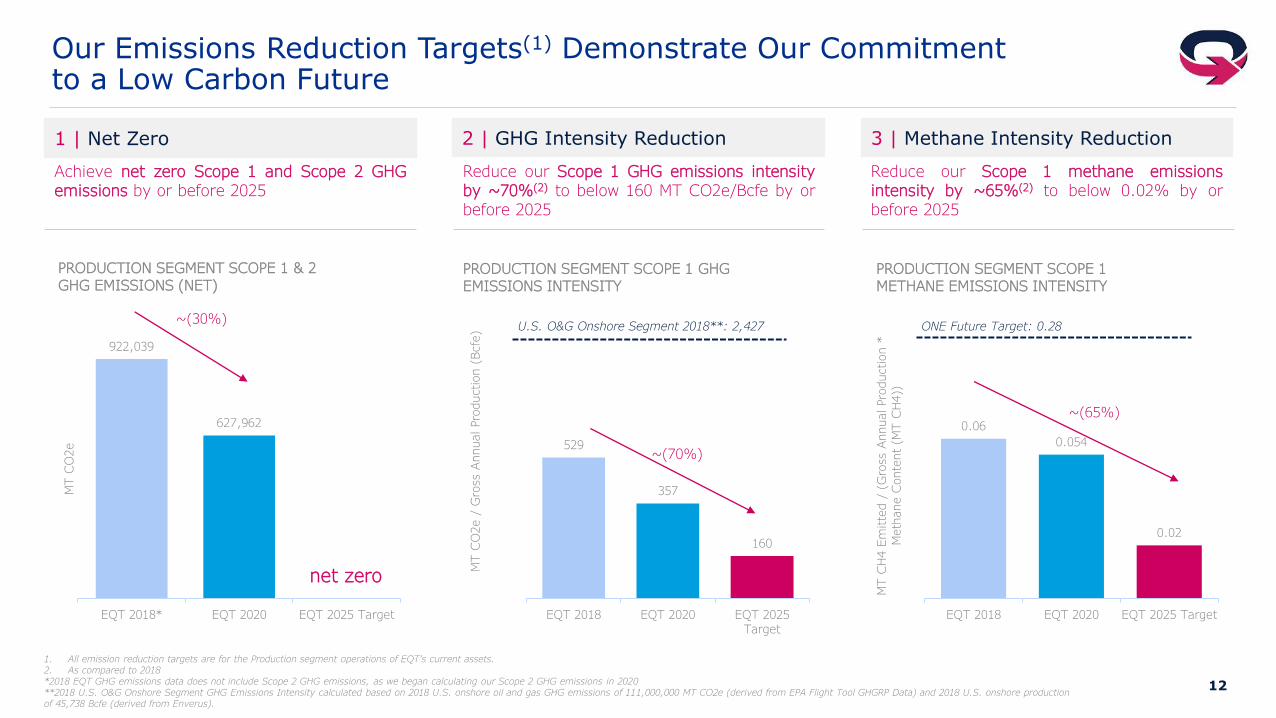
3 | Methane Intensity Reduction2 | GHG Intensity Reduction1 | Net Zero
0.06
0.054
0.02
EQT 2018 EQT 2020 EQT 2025 Target
MT C
H4 E
mitte
d /
(G
ross A
nnual Pro
duction *
Meth
ane C
onte
nt (M
T C
H4))
PRODUCTION SEGMENT SCOPE 1 METHANE EMISSIONS INTENSITY
Our Emissions Reduction Targets(1) Demonstrate Our Commitmentto a Low Carbon Future
1. All emission reduction targets are for the Production segment operations of EQT’s current assets.2. As compared to 2018*2018 EQT GHG emissions data does not include Scope 2 GHG emissions, as we began calculating our Scope 2 GHG emissions in 2020**2018 U.S. O&G Onshore Segment GHG Emissions Intensity calculated based on 2018 U.S. onshore oil and gas GHG emissions of 111,000,000 MT CO2e (derived from EPA Flight Tool GHGRP Data) and 2018 U.S. onshore production of 45,738 Bcfe (derived from Enverus).
922,039
627,962
EQT 2018* EQT 2020 EQT 2025 Target
MT C
O2e
PRODUCTION SEGMENT SCOPE 1 & 2 GHG EMISSIONS (NET)
net zero
529
357
160
EQT 2018 EQT 2020 EQT 2025Target
MT C
O2e /
Gro
ss A
nnual Pro
duction (
Bcfe
)
PRODUCTION SEGMENT SCOPE 1 GHG EMISSIONS INTENSITY
U.S. O&G Onshore Segment 2018**: 2,427 ONE Future Target: 0.28
~(70%)
~(65%)
~(30%)
Achieve net zero Scope 1 and Scope 2 GHGemissions by or before 2025
Reduce our Scope 1 GHG emissions intensityby ~70%(2) to below 160 MT CO2e/Bcfe by orbefore 2025
Reduce our Scope 1 methane emissionsintensity by ~65%(2) to below 0.02% by orbefore 2025
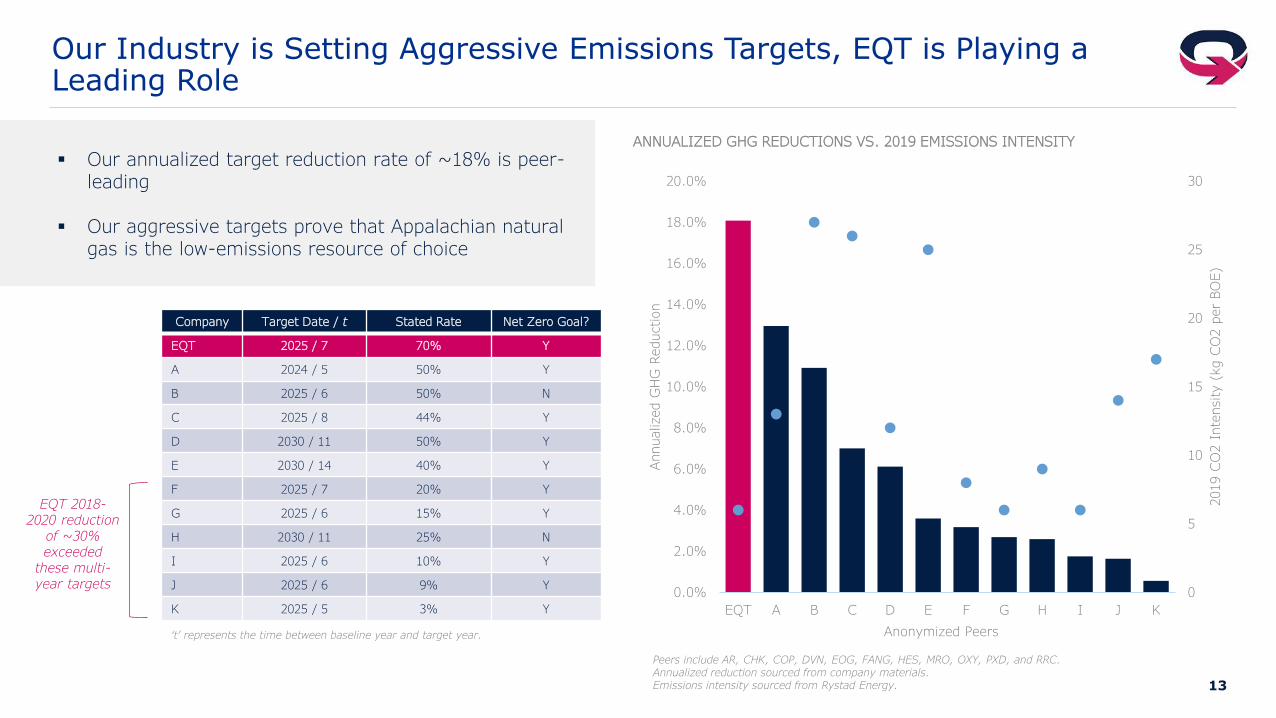
13
0
5
10
15
20
25
30
0.0%
2.0%
4.0%
6.0%
8.0%
10.0%
12.0%
14.0%
16.0%
18.0%
20.0%
EQT A B C D E F G H I J K
2019 C
O2 I
nte
nsity (
kg C
O2 p
er
BO
E)
Annualized G
HG
Reduction
ANNUALIZED GHG REDUCTIONS VS. 2019 EMISSIONS INTENSITY
Our Industry is Setting Aggressive Emissions Targets, EQT is Playing a Leading Role
Peers include AR, CHK, COP, DVN, EOG, FANG, HES, MRO, OXY, PXD, and RRC.Annualized reduction sourced from company materials.Emissions intensity sourced from Rystad Energy.
‘t’ represents the time between baseline year and target year.
Company Target Date / t Stated Rate Net Zero Goal?
EQT 2025 / 7 70% Y
A 2024 / 5 50% Y
B 2025 / 6 50% N
C 2025 / 8 44% Y
D 2030 / 11 50% Y
E 2030 / 14 40% Y
F 2025 / 7 20% Y
G 2025 / 6 15% Y
H 2030 / 11 25% N
I 2025 / 6 10% Y
J 2025 / 6 9% Y
K 2025 / 5 3% Y
▪ Our annualized target reduction rate of ~18% is peer-leading
▪ Our aggressive targets prove that Appalachian natural gas is the low-emissions resource of choice
Anonymized Peers
EQT 2018-2020 reduction
of ~30% exceeded
these multi-year targets
14
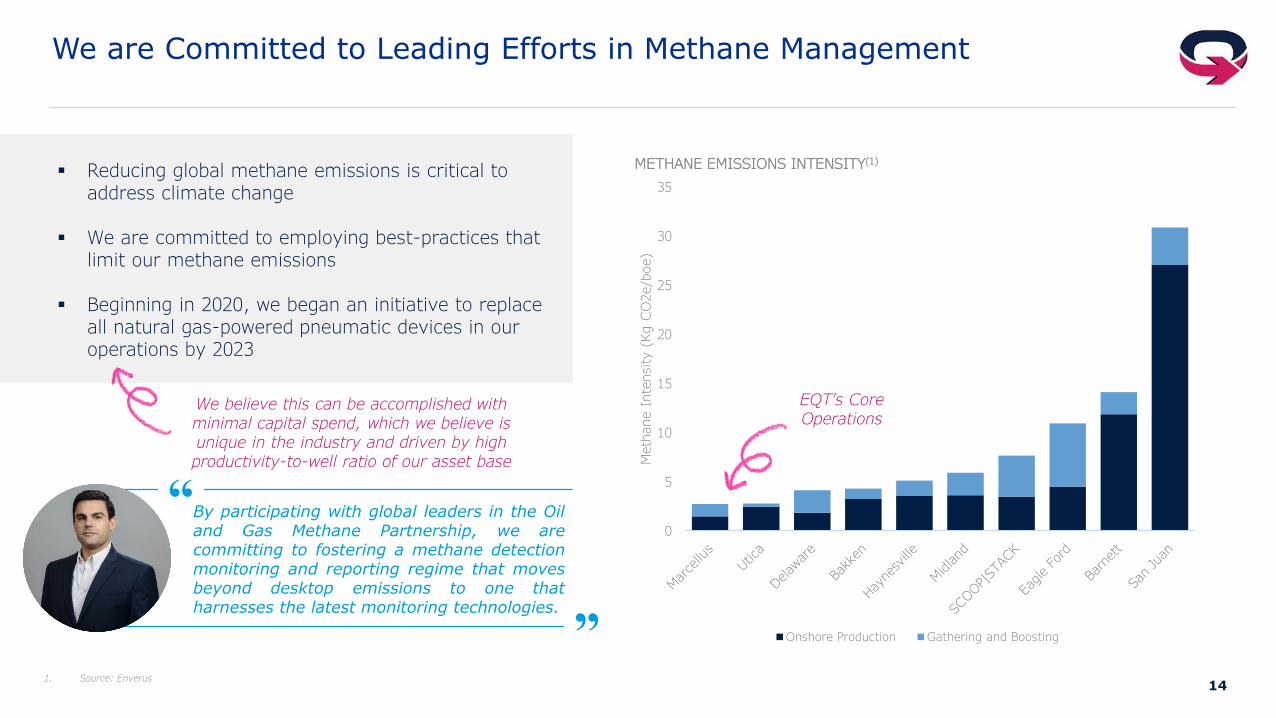
We are Committed to Leading Efforts in Methane Management
▪ Reducing global methane emissions is critical to address climate change
▪ We are committed to employing best-practices that limit our methane emissions
▪ Beginning in 2020, we began an initiative to replace all natural gas-powered pneumatic devices in our operations by 2023
1. Source: Enverus
“By participating with global leaders in the Oiland Gas Methane Partnership, we arecommitting to fostering a methane detectionmonitoring and reporting regime that movesbeyond desktop emissions to one thatharnesses the latest monitoring technologies.
”
We believe this can be accomplished with minimal capital spend, which we believe is unique in the industry and driven by high productivity-to-well ratio of our asset base
0
5
10
15
20
25
30
35
Meth
ane I
nte
nsity (
Kg C
O2e/b
oe)
METHANE EMISSIONS INTENSITY(1)
Onshore Production Gathering and Boosting
EQT’s Core Operations
15
Announced Alta NEPA Acquisition
1Q21
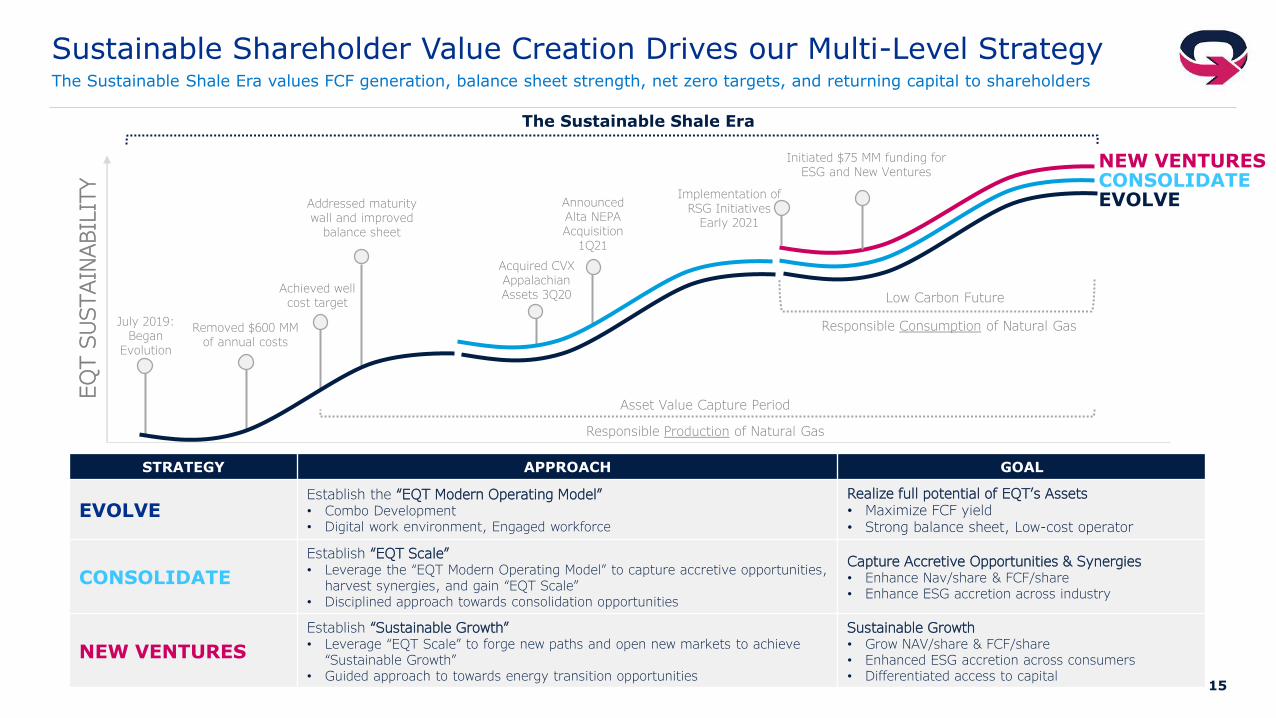
Sustainable Shareholder Value Creation Drives our Multi-Level StrategyThe Sustainable Shale Era values FCF generation, balance sheet strength, net zero targets, and returning capital to shareholders
EVOLVECONSOLIDATENEW VENTURES
July 2019:Began
Evolution
Addressed maturity wall and improved
balance sheet
Acquired CVX Appalachian Assets 3Q20
Implementation of RSG Initiatives
Early 2021
Removed $600 MM of annual costs
Achieved well cost target
EQ
T S
USTAIN
ABIL
ITY
Initiated $75 MM funding forESG and New Ventures
Low Carbon Future
Asset Value Capture Period
Responsible Production of Natural Gas
Responsible Consumption of Natural Gas
The Sustainable Shale Era
STRATEGY APPROACH GOAL
EVOLVEEstablish the “EQT Modern Operating Model”• Combo Development• Digital work environment, Engaged workforce
Realize full potential of EQT’s Assets• Maximize FCF yield• Strong balance sheet, Low-cost operator
CONSOLIDATE
Establish “EQT Scale”• Leverage the “EQT Modern Operating Model” to capture accretive opportunities,
harvest synergies, and gain “EQT Scale”• Disciplined approach towards consolidation opportunities
Capture Accretive Opportunities & Synergies• Enhance Nav/share & FCF/share• Enhance ESG accretion across industry
NEW VENTURES
Establish “Sustainable Growth”• Leverage “EQT Scale” to forge new paths and open new markets to achieve
“Sustainable Growth”• Guided approach to towards energy transition opportunities
Sustainable Growth• Grow NAV/share & FCF/share• Enhanced ESG accretion across consumers• Differentiated access to capital
16
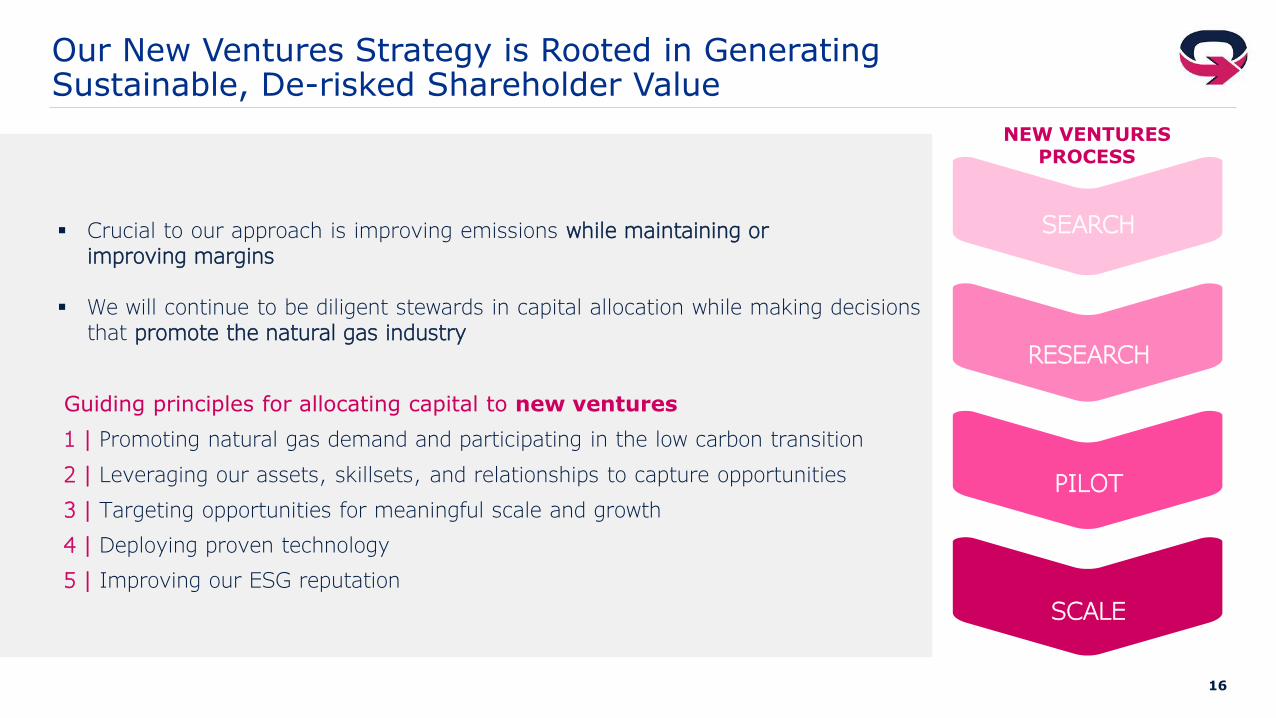
Our New Ventures Strategy is Rooted in Generating Sustainable, De-risked Shareholder Value
▪ Crucial to our approach is improving emissions while maintaining orimproving margins
▪ We will continue to be diligent stewards in capital allocation while making decisions that promote the natural gas industry
Guiding principles for allocating capital to new ventures
1 | Promoting natural gas demand and participating in the low carbon transition
2 | Leveraging our assets, skillsets, and relationships to capture opportunities
3 | Targeting opportunities for meaningful scale and growth
4 | Deploying proven technology
5 | Improving our ESG reputation
SEARCH
RESEARCH
PILOT
SCALE
NEW VENTURESPROCESS
17
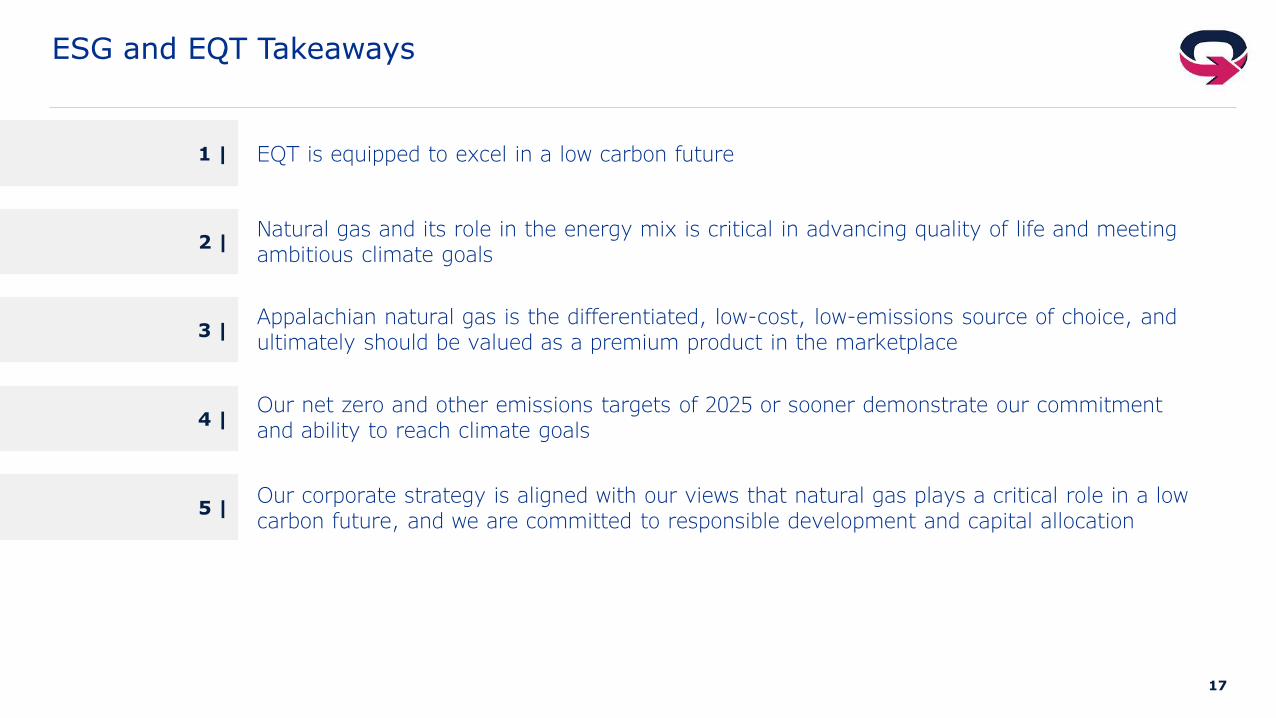
EQT is equipped to excel in a low carbon future
ESG and EQT Takeaways
1 |
2 |
3 |
4 |
5 |
Natural gas and its role in the energy mix is critical in advancing quality of life and meeting ambitious climate goals
Our net zero and other emissions targets of 2025 or sooner demonstrate our commitment and ability to reach climate goals
Our corporate strategy is aligned with our views that natural gas plays a critical role in a low carbon future, and we are committed to responsible development and capital allocation
Appalachian natural gas is the differentiated, low-cost, low-emissions source of choice, and ultimately should be valued as a premium product in the marketplace
18 18
Appendix
19
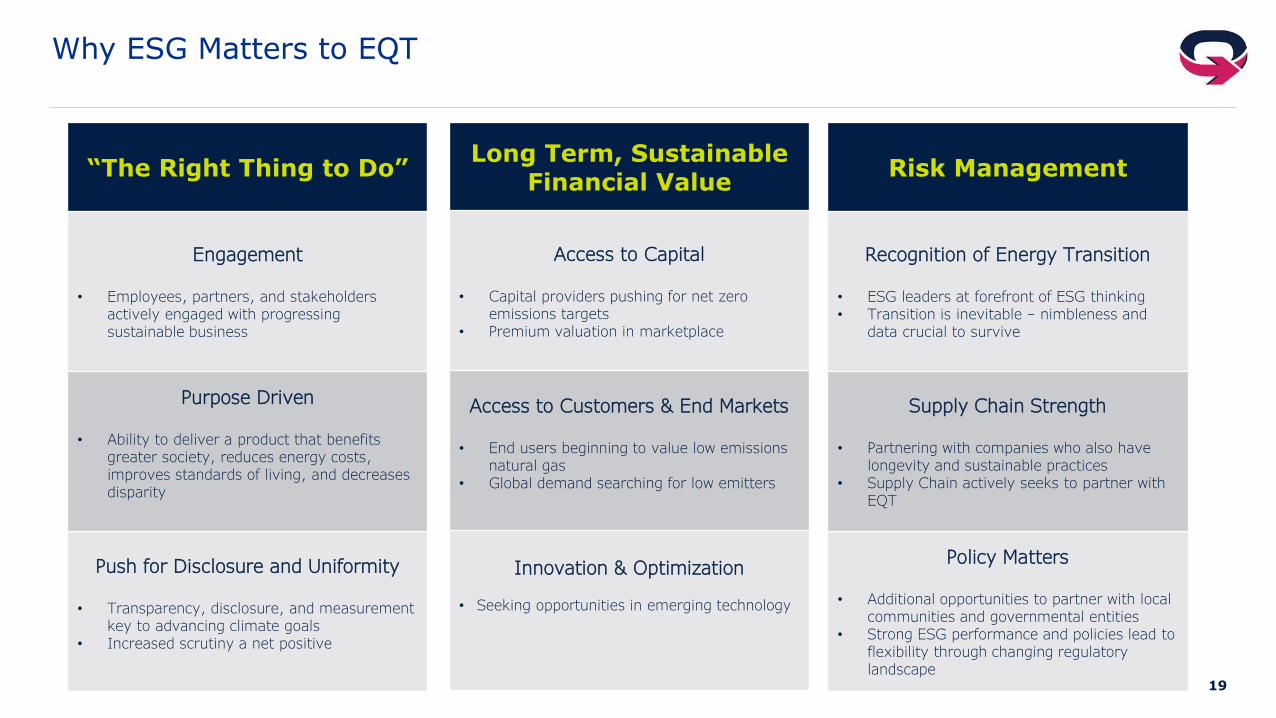
Why ESG Matters to EQT
“The Right Thing to Do”
Engagement
• Employees, partners, and stakeholders actively engaged with progressing sustainable business
Purpose Driven
• Ability to deliver a product that benefits greater society, reduces energy costs, improves standards of living, and decreases disparity
Push for Disclosure and Uniformity
• Transparency, disclosure, and measurement key to advancing climate goals
• Increased scrutiny a net positive
Long Term, Sustainable Financial Value
Access to Capital
• Capital providers pushing for net zero emissions targets
• Premium valuation in marketplace
Access to Customers & End Markets
• End users beginning to value low emissions natural gas
• Global demand searching for low emitters
Innovation & Optimization
• Seeking opportunities in emerging technology
Risk Management
Recognition of Energy Transition
• ESG leaders at forefront of ESG thinking• Transition is inevitable – nimbleness and
data crucial to survive
Supply Chain Strength
• Partnering with companies who also have longevity and sustainable practices
• Supply Chain actively seeks to partner with EQT
Policy Matters
• Additional opportunities to partner with local communities and governmental entities
• Strong ESG performance and policies lead to flexibility through changing regulatory landscape
20
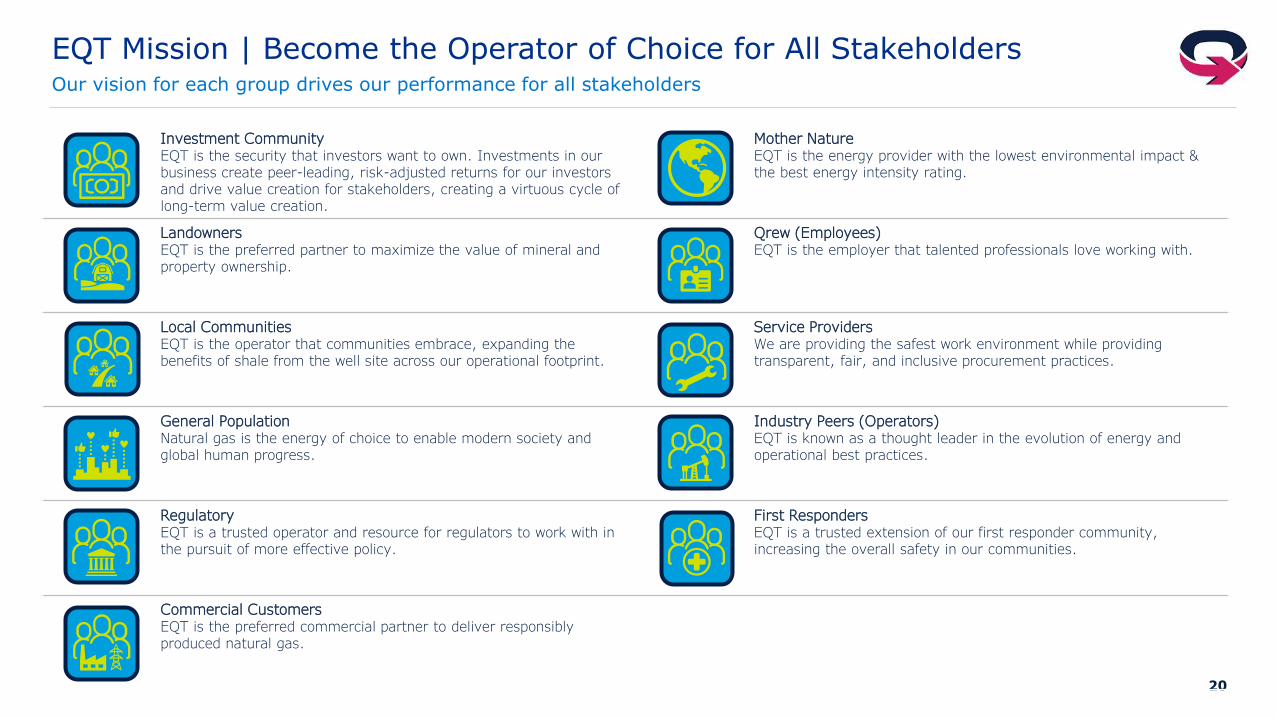
Investment CommunityEQT is the security that investors want to own. Investments in our business create peer-leading, risk-adjusted returns for our investors and drive value creation for stakeholders, creating a virtuous cycle of long-term value creation.
Mother NatureEQT is the energy provider with the lowest environmental impact & the best energy intensity rating.
LandownersEQT is the preferred partner to maximize the value of mineral and property ownership.
Qrew (Employees)EQT is the employer that talented professionals love working with.
Local CommunitiesEQT is the operator that communities embrace, expanding the benefits of shale from the well site across our operational footprint.
Service ProvidersWe are providing the safest work environment while providing transparent, fair, and inclusive procurement practices.
General PopulationNatural gas is the energy of choice to enable modern society and global human progress.
Industry Peers (Operators)EQT is known as a thought leader in the evolution of energy and operational best practices.
RegulatoryEQT is a trusted operator and resource for regulators to work with in the pursuit of more effective policy.
First RespondersEQT is a trusted extension of our first responder community, increasing the overall safety in our communities.
Commercial CustomersEQT is the preferred commercial partner to deliver responsibly produced natural gas.
EQT Mission | Become the Operator of Choice for All StakeholdersOur vision for each group drives our performance for all stakeholders
21
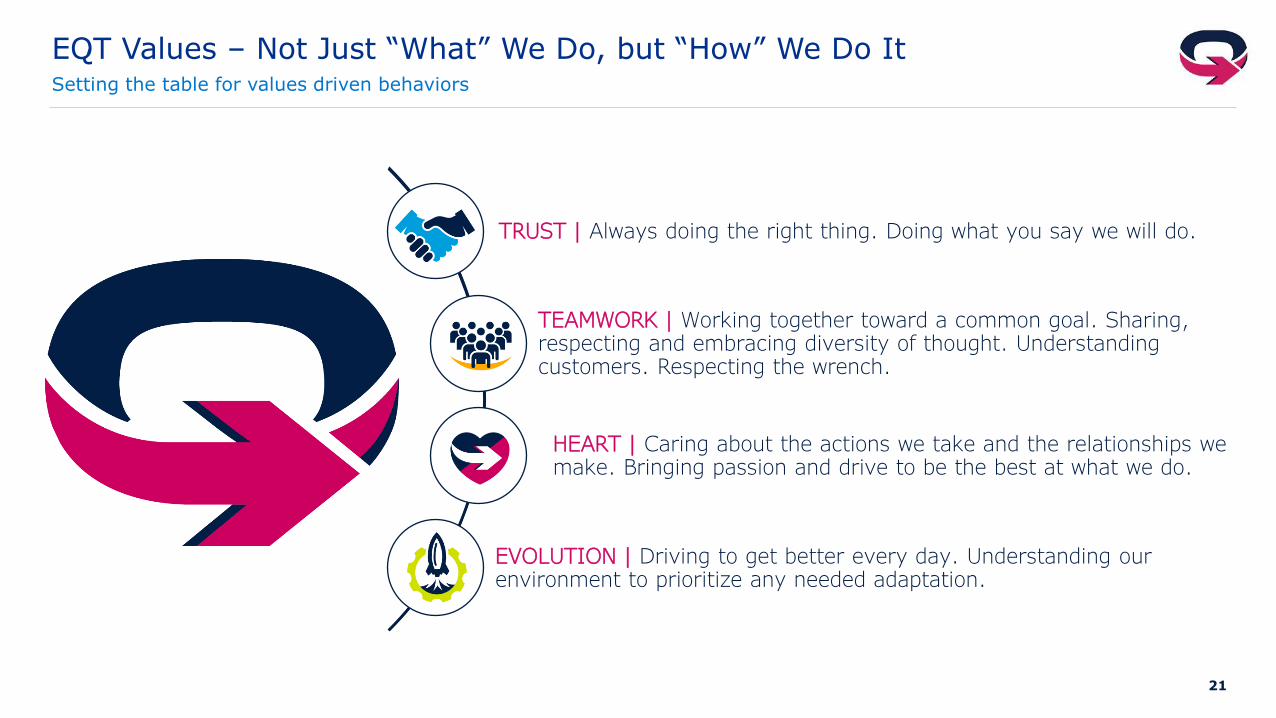
EQT Values – Not Just “What” We Do, but “How” We Do ItSetting the table for values driven behaviors
TRUST | Always doing the right thing. Doing what you say we will do.
TEAMWORK | Working together toward a common goal. Sharing, respecting and embracing diversity of thought. Understanding customers. Respecting the wrench.
HEART | Caring about the actions we take and the relationships we make. Bringing passion and drive to be the best at what we do.
EVOLUTION | Driving to get better every day. Understanding our environment to prioritize any needed adaptation.
22
0
10
20
30
40
50
60
70
80
2006 2007 2008 2009 2010 2011 2012 2013 2014 2015 2016 2017 2018 2019 2020 2021
DRY SHALE GAS PRODUCTION ESTIMATES BY PLAY (BCF/D)(1)
Marcellus Utica Permian Eagleford Haynesville Other
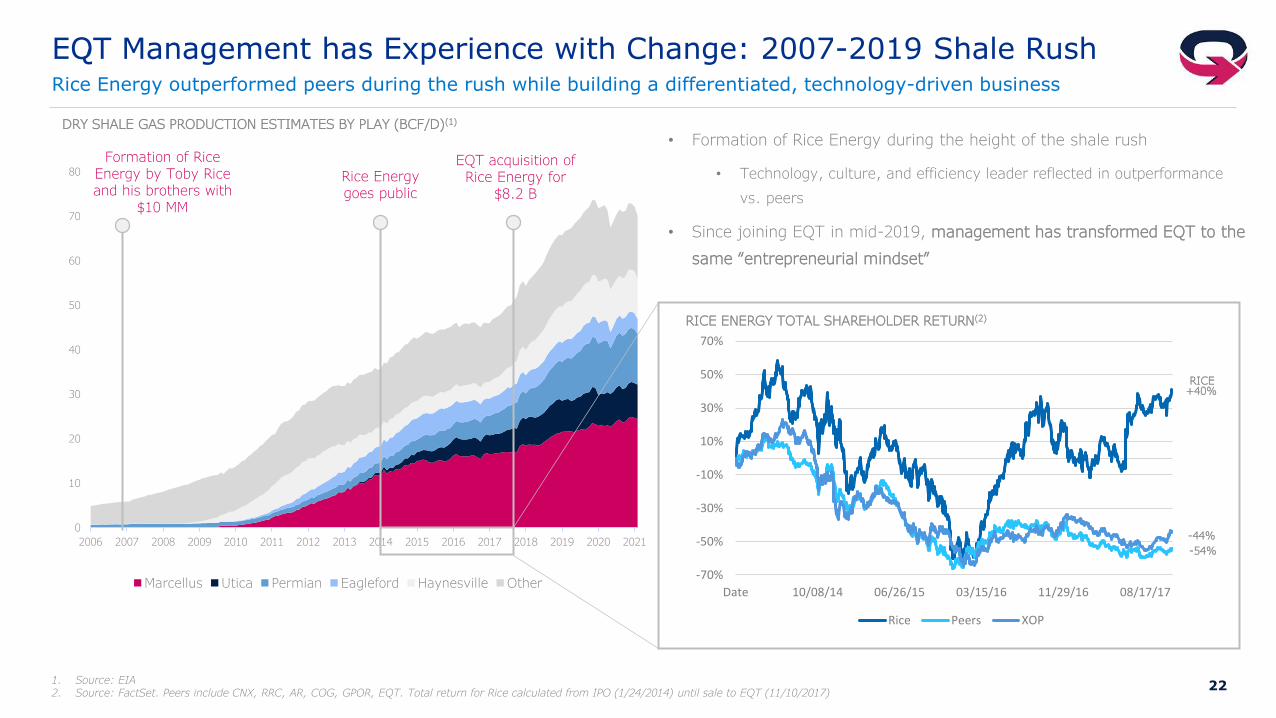
EQT Management has Experience with Change: 2007-2019 Shale RushRice Energy outperformed peers during the rush while building a differentiated, technology-driven business
• Formation of Rice Energy during the height of the shale rush
• Technology, culture, and efficiency leader reflected in outperformance
vs. peers
• Since joining EQT in mid-2019, management has transformed EQT to the
same “entrepreneurial mindset”
Formation of Rice Energy by Toby Rice and his brothers with
$10 MM
Rice Energy goes public
EQT acquisition of Rice Energy for
$8.2 B
1. Source: EIA2. Source: FactSet. Peers include CNX, RRC, AR, COG, GPOR, EQT. Total return for Rice calculated from IPO (1/24/2014) until sale to EQT (11/10/2017)
-70%
-50%
-30%
-10%
10%
30%
50%
70%
Date 10/08/14 06/26/15 03/15/16 11/29/16 08/17/17
Rice Peers XOP
+40%
-54%
-44%
RICE
RICE ENERGY TOTAL SHAREHOLDER RETURN(2)
23
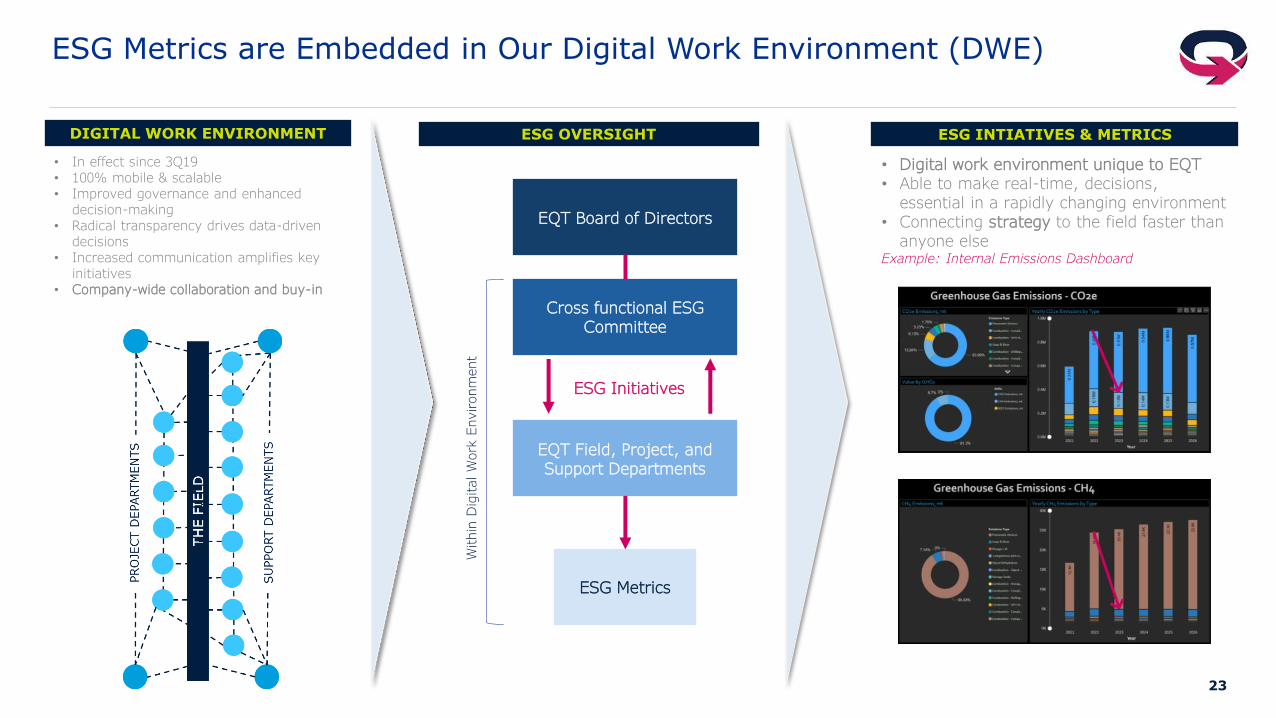
ESG Metrics are Embedded in Our Digital Work Environment (DWE)
DIGITAL WORK ENVIRONMENT
• In effect since 3Q19• 100% mobile & scalable• Improved governance and enhanced
decision-making• Radical transparency drives data-driven
decisions• Increased communication amplifies key
initiatives• Company-wide collaboration and buy-in
ESG OVERSIGHT
Cross functional ESG Committee
EQT Board of Directors
EQT Field, Project, and Support Departments
ESG Initiatives
ESG Metrics
ESG INTIATIVES & METRICS
Within
Dig
ital W
ork
Environm
ent
• Digital work environment unique to EQT• Able to make real-time, decisions,
essential in a rapidly changing environment• Connecting strategy to the field faster than
anyone elseExample: Internal Emissions Dashboard
24
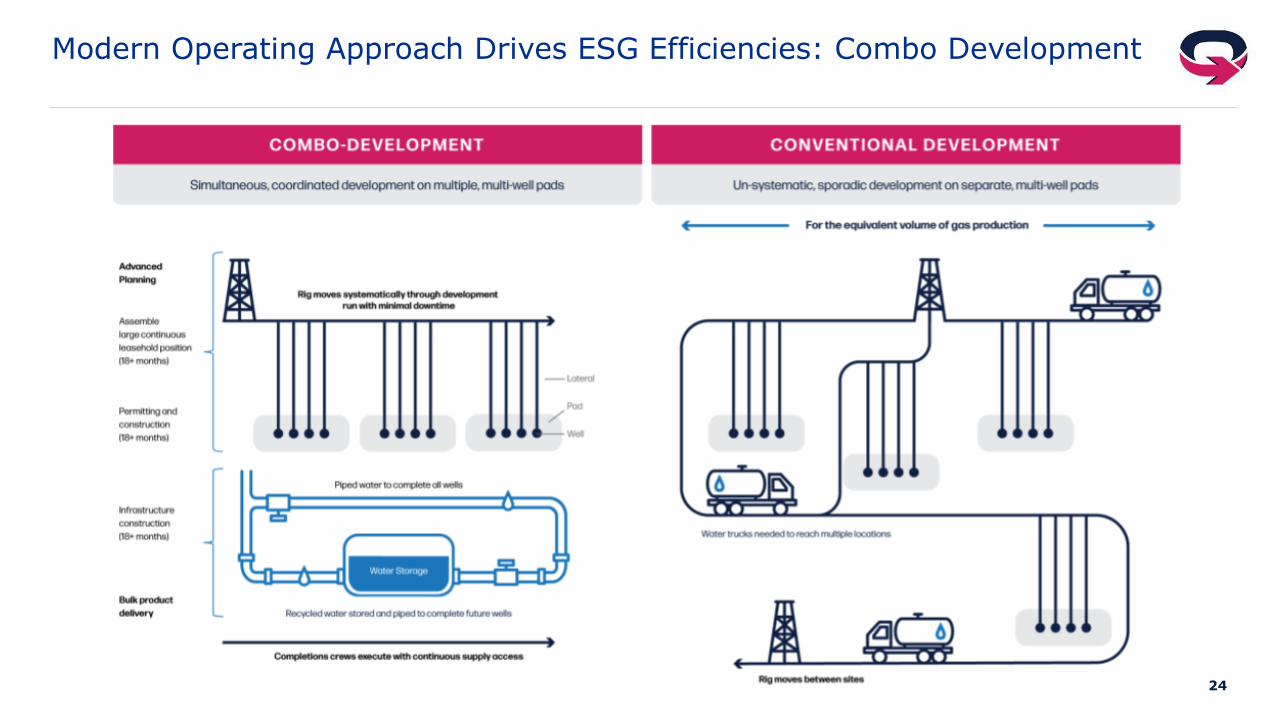
Modern Operating Approach Drives ESG Efficiencies: Combo Development