Embed Size (px)
Citation preview
Proteomics 2012, 12, 2523–2538 2523DOI 10.1002/pmic.201100273
RESEARCH ARTICLE
The glycolyzer: Automated glycan annotation software
for high performance mass spectrometry and its
application to ovarian cancer glycan biomarker discovery
Scott R. Kronewitter1, Maria Lorna A. De Leoz1, John S. Strum1, Hyun Joo An1,Lauren M. Dimapasoc1, Andres Guerrero1, Suzanne Miyamoto2, Carlito B. Lebrilla1
and Gary S. Leiserowitz3
1 Department of Chemistry, University of California, Davis, CA, USA2 Division of Hematology/Oncology, UC Davis Cancer Center, Sacramento, CA, USA3 Division of Gynecologic Oncology, UC Davis Medical Center, Sacramento, CA, USA
Human serum glycomics is a promising method for finding cancer biomarkers but often lacksthe tools for streamlined data analysis. The Glycolyzer software incorporates a suite of analytictools capable of identifying informative glycan peaks out of raw mass spectrometry data. Asa demonstration of its utility, the program was used to identify putative biomarkers for ep-ithelial ovarian cancer from a human serum sample set. A randomized, blocked, and blindedexperimental design was used on a discovery set consisting of 46 cases and 48 controls. Ret-rosynthetic glycan libraries were used for data analysis and several significant candidate glycanbiomarkers were discovered via hypothesis testing. The significant glycans were attributed to aglycan family based on glycan composition relationships and incorporated into a linear classi-fier motif test. The motif test was then applied to the discovery set to evaluate the disease statediscrimination performance. The test provided strongly predictive results based on receiveroperator characteristic curve analysis. The area under the receiver operator characteristic curvewas 0.93. Using the Glycolyzer software, we were able to identify a set of glycan biomarkersthat highly discriminate between cases and controls, and are ready to be formally validated insubsequent studies.
Keywords:
Biomarkers / Clinical glycomics / Data processing / Glycoproteomics / Human serum /Ovarian cancer
Received: May 22, 2011Revised: May 18, 2012
Accepted: May 22, 2012
1 Introduction
Glycans are a common post-translational modification ofproteins that consist of complex arrangements of monosac-charides that vary in size, linkage, and composition. Theyare instrumental to the vitality of higher organisms and are
Correspondence: Dr. Gary S. Leiserowitz, Division of GynecologicOncology, UC Davis Medical Center, 4860 Y Street, Suite 2500,Sacramento, CA 95817, USAE-mail: [email protected]: +1-916-734-6034
Abbreviations: FFTs, fast Fourier transforms; GCC-SPE, graphi-tized carbon cartridge solid-phase extraction; RMS, root meansquared; ROC, receiver operating characteristic curves; TPI, totalpeak intensity
currently of considerable interest as a source for serum-basedbiomarkers [1–8]. Glycan cancer biomarkers are of particularimportance because changes in glycosylation have beenobserved in globally released glycans from the serum ofcancer patients [4–11] and on glycans released from targetedglycoproteins [12, 13]. Mass spectrometry is widely used forstudying glycans because most compounds in a complexmixture can be simultaneously detected and identified.The masses and ionization characteristics of glycans aresuitable for most modern mass spectrometers. However, thevast amount of glycan data makes it difficult to extract andorganize information from mass spectra.
There have been several methods for annotating glycansincorporating combinatorial approaches (GlycoMod [14]),
Colour Online: See the article online to view Figs. 4–5 in colour.
C© 2012 WILEY-VCH Verlag GmbH & Co. KGaA, Weinheim www.proteomics-journal.com

2524 S. R. Kronewitter et al. Proteomics 2012, 12, 2523–2538
empirical databases (GlycoSuiteDB [15, 16], SWEET-DB [17],BOLD [18], KEGG [19], and EUROCarbDB [20]), glycobiology-oriented glycan library models (Cartoonist [21], Retrosyn-thetic Glycan Network Libraries [22]), and tandem massspectrometry processing algorithms (StrOligo [23], GlySpyand OSCAR [24, 25], GlycoPeakFinder [26], Glyco-Fragment[27,28], GlycoWorkbench [29]). However, there has been littleattention paid to raw glycan spectra processing. Vakhrushevand co-workers developed the SysBioWare software for pro-cessing and annotating raw glycan mass spectra [30]. This pro-gram includes several basic features including backgroundsubtraction, peak detection, noise thresholding, and data pro-cessing tools including preprocessing, smoothing, peak selec-tion, and isotope grouping. Additional tools in the softwareused for glycan processing include a difference calculator thatcan use monosaccharide masses and a rudimentary biolog-ical filter that uses logical monosaccharide ratio statementsentered by the user.
We have developed an integrated software annotation pro-gram for glycan biomarker discovery that is referred to asThe Glycolyzer. The Glycolyzer contains a full data anal-ysis pipeline in one software package to allow for min-imal user intervention. The software was written in Ig-orPro (WaveMetrics, Portland, OR, USA) language andthe source code is available from our group website(chemgroups.ucdavis.edu/∼lebrilla/Glycolyzer.zip) or by re-quest from the authors. Although IgorPro is required to runthe software, the algorithms can be viewed with text editors.Future versions will be written in a more common program-ming language. The mass spectrum analysis software is agraphical user interface-based program designed for process-ing and analyzing carbohydrate mass spectra with a focuson clinical glycan biomarker discovery. The Glycolyzer hassimilarities with the SysBioWare software but goes furtherby incorporating a full analysis pipeline including additionalalgorithms for calibration, theoretical retrosynthetic librarybased glycan annotation, and statistical hypothesis testing.The overall workflow, including Fourier transform ion cy-clotron resonance (FT-ICR) and general mass spectra dataprocessing, is shown in Fig. 1. Calibrated deconvoluted datafrom LC-MS experiments can be used as well by bypassing theinternal preprocessing algorithms and proceeding directly tothe annotation and statistics part of the pipeline.
We used this software to discover serum-based glycanbiomarkers for epithelial ovarian cancer. Epithelial ovariancancer is the most dangerous of the gynecologic malignan-cies due to its propensity for late detection when most patientspresent advanced stages of the disease. It currently lacks di-agnostic tests that are effective for screening and early de-tection. There are a limited number of FDA approved bloodtests available to assist in the diagnosis and monitoring ofovarian cancer, including CA 125 and HE4 [31], but the valueof these tests is largely limited to monitoring disease statusafter treatment, or assessing the risk of malignancy when anovarian mass has already been detected. CA 125 is elevatedin only 50% of Stage I cancers, so it is not a sensitive test for
Figure 1. The overall data workflow for the Glycolyzer.
early detection. It is also rather nonspecific, especially in pre-menopausal women, leading to many false-positive resultsthat require diagnostic intervention [31]. Thus, new novelserum-based biomarkers with improved sensitivity and speci-ficity would be highly desirable.
We have pursued glycomics analysis using mass spec-trometry to detect glycans that are altered either by
C© 2012 WILEY-VCH Verlag GmbH & Co. KGaA, Weinheim www.proteomics-journal.com
Proteomics 2012, 12, 2523–2538 2525
monosaccharide composition and/or have in-creased/decreased amounts when comparing the serumfrom patients with ovarian cancer cases and healthy con-trols [7, 32]. Although a number of informative glycanswere found that distinguished between cases and controls,detection of the glycan mass peaks has been hampered by thelack of useful bioinformatics analytic techniques. Use of theGlycolyzer software provides a platform that can substantiallyautomate the analysis of complex mass spectrometry data,allowing for detection and annotation of informative glycans.Glycan annotation employs a novel theoretical glycan librarythat has recently been published [22].
As a demonstration of the utility of this software, we haveused it to distinguish a unique set of glycans in a carefully se-lected group of matched cases and controls. Briefly, humanserum N-linked glycans (N-glycans) were profiled with thetheoretical retrosynthetic N-glycan library and experimentalprofiles were developed based on 46 control samples. Thework presented here demonstrates the high throughput ca-pabilities of the current methodology on a matched set ofcases and controls. The methodology includes isolation of N-linked glycans from human serum, mass spectrometry usingMALDI-FT-ICR, and then bioinformatic evaluation with theGlycolyzer software. Based on these results, the discovery setis appropriate for use in a clinical validation study to evaluatethe robustness of the candidate markers presented here.
2 Materials and methods
2.1 Human serum samples
Approval for this research protocol using clinical data andhuman serum samples was obtained from the InstitutionalReview Board of the University of California, Davis Medi-cal Center. Human serum samples were obtained througha formal data use agreement with the Gynecologic Oncol-ogy Group (GOG). The subjects either had epithelial ovariancancer (cancer cases) or were healthy volunteers (healthy con-trols). All serum samples arrived frozen and were transferredto a −75�C freezer prior to processing.
The discovery set included healthy controls (n = 48) andovarian cancer cases (n = 46). The discovery set samples wereaged matched by 5-year intervals to avoid confounding effects(40–45, 46–50, 51–55, 56–60, and 61–65 years). Disease status(case versus control) and age block were blinded outside ofour laboratory prior to chemical analysis. The samples wereblocked into eight sets of 12 samples (each block contained sixcontrols and six cancer cases) with relatively even balancingof subject ages. Following mass spectrometry data collectionand annotation using the Glycolyzer software, the sampleswere unblinded for statistical analysis.
N-glycan release and extraction from human serum forthe discovery set was carried out by the optimized methodsdescribed by Kronewitter et al. [33]. Briefly, 100 �L of serumwas mixed with 100 �L digestion buffer (pH 7.5, 100 mM
ammonium bicarbonate, 10 mM dithiothreitol) and heatedin boiling water for 2 min to denature the proteins. Aftercooling to room temperature, 2.0 �L Peptide N-glycosidaseF (PNGase F, 500 000 units/mL, glycerol free, New EnglandBioLabs, Ipswich, MA, USA) were added and the mixturewas incubated in a microwave reactor for 20 min at a con-stant power of 20 W. An 800 �L aliquot of chilled ethanol wasthen added to precipitate peptides and proteins. The solutionwas frozen in a −75�C freezer for 60 min and then cen-trifuged at 13 300 revolutions per minute for 20 min (5415 D,Eppendorf AG, Hamburg, Germany). After centrifuging, 700�L of supernatant was removed from the precipitate anddried in a Savant AES 2010 centrifugal evaporator (ThermoFischer Scientific, Waltham, MA, USA). PNGase F-releasedglycans were then purified by graphitized carbon cartridgesolid-phase extraction (GCC-SPE) with an automated GilsonGX-274 ASPEC liquid handler. GCC-SPE cartridges (150 mgbed weight, 4 mL cartridge volume) were acquired from All-tech (Deerfield, IL, USA). Three fractions of glycans were col-lected using increasing amounts of acetonitrile (ACN): 4 mLeach of 10% ACN/H2O (v/v), 20% ACN/H2O (v/v), and 40%ACN/H2O (v/v) with 0.05% trifluoroacetic acid. Each fractionwas collected and dried in a centrifugal evaporator apparatus.Fractions were reconstituted in nanopure water prior to massspectrometry. Mass spectra were recorded on an externalsource MALDI-FT-ICR instrument (HiResMALDI, IonSpecCorporation, Irvine, CA, USA) equipped with a 7.0 T super-conducting magnet and a pulsed 355 nm Nd:YAG laser. Fivespectra were collected for each sample: 10% ACN and 20%ACN fractions in the positive mode and the 40% ACN frac-tion in the negative mode. A total of 1410 FT-ICR spectra werecollected the 94 samples. The spectra were collected in blocks(blocked by SPE fraction). The samples from the blinded, ran-domized, sample set were analyzed sequentially on the sameinstrument over 2–3 days to maintain constant sample detec-tion conditions. The mass spectra collection conditions wereoptimized for reproducibility by controlling several instru-mental parameters during operation. The ultra-high vacuumbase pressure was maintained lower than 1 × 10⁻¹⁰ Torr(measured with an ion gauge). Cooling gas was used to ki-netically cool the ions during ion accumulation in a hexapoleprior to transfer to the ICR cell. The cooling gas pump downrate was controlled via the initial system pressure. The ini-tial system pressure chosen was between 1 × 10⁻¹⁰ and 5 ×10⁻¹⁰ Torr prior to ionization and subsequent accumulationand detection. Fixing the initial pressure allowed for replicatepressure conditions in the ICR cell during detection. Underthese conditions, the average coefficient of variation of glycanintensities from technical replicates from the same MALDIspot ranges from 12% to 17% [33].
3 Data analysis algorithms
The Glycolyzer is a software package consisting of a graph-ical user interface and several modular data processing
C© 2012 WILEY-VCH Verlag GmbH & Co. KGaA, Weinheim www.proteomics-journal.com
2526 S. R. Kronewitter et al. Proteomics 2012, 12, 2523–2538
algorithms that can be linked to each other in a user definedorder. All the algorithms are integrated into the platform’suser interface and can be run in series as a data analysispipeline. Different degrees of processed data can be loadedinto the software. For example, the analytical signal from theFT-ICR (ICR transient or free induction decay) can be loadeddirectly into the start of the pipeline and processed, or theanalytical signal can be processed externally to the Glycolyzersoftware via instrument software (e.g. Omega8, IonSpec) andloaded in at a later point in the data analysis pipeline. This al-lows data from other types of mass spectrometers to be usedas long as the data are already calibrated. If external soft-ware deconvolution is preferred rather than the Glycolyzer’sbuilt-in deconvolution algorithm, exogenous deconvolutedmonoisotopic masses can be loaded directly and the rest ofthe Glycolyzer’s analysis pipeline can still be applied.
3.1 Automatic spectra processing
Data analysis for clinical glycan sample sets requires manyautomated steps to assure rapid and consistent data handling.The Glycolyzer automates the full data analysis pipelinestarting with the analytical signal from the instrument andconcluding with biomarker elucidation. The general modulesincluded are: data importing and exporting, FT-ICR signalpreprocessing, internal calibration, noise threshold calcu-lation, peak picking, isotope grouping and filtering, glycanannotation, intensity normalization, missing value filling,multiple spectra averaging, hypothesis testing, and multipletesting corrections. The glycans that pass the rigorousmultiple testing corrected hypothesis tests are considered tobe candidate biomarkers and can be incorporated into dataclassifiers and their diagnostic performance evaluated.
3.2 Data importing/exporting
Importing data from text files is facilitated by the Glycolyzer’sgraphical user interface. Raw ICR transients, mass spectra, ordeconvoluted monoisotopic mass lists can be loaded in as sin-gle files or as a batch. The modular pipeline of the Glycolyzerallows the user to select appropriate analysis algorithms forthe data type loaded. Different levels of data preprocessingpreviously applied to file are taken into account by allowingdata to start at different parts in the analysis pipeline.
3.3 FT-ICR preprocessing
Fast Fourier transforms (FFTs) were performed on raw datatransients obtained from Omega8 (IonSpec) data acquisi-tion software. The analog-to-digital conversion rate, magnetstrength, number of zero fills, and apodization window arespecified by the user. In this study, one zero fill was used dur-ing the Fourier transform along with a Blackman apodization
window. A one second transient was used. In addition, theuser is able to truncate the length of the transients prior toapplying the FFT to improve quantification by reducing thedampening effects inherent to ICR transients. The FFT con-verts the transients from the time domain to the frequency do-main. Many apodization windows for smoothing out the peakshapes, such as the commonly used Blackman and Hammingwindows, are included in the user interface.
3.4 High mass accuracy spectra calibration
High mass accuracy calibration was used for the clinical sam-ples. The error was generally less than 5 parts per million(ppm) root-mean-squared (RMS) mass difference of calibrantions from calculated values across a data set. Smaller errors,e.g. 1–2 ppm, have been obtained for glycan standards (datanot shown) but is challenging for large data sets. Accurate cali-brations allow for accurate mass determination of unknowns.For FT-ICR instruments, the free induction decay transientsneed to be converted into mass spectra via the FFT and cal-ibration equations. The Glycolyzer’s internal calibration al-gorithm performs a six-point calibration using six commonglycan ions in each spectrum. A serum N-glycan mass profile,derived from 46 healthy controls, was used to identify the sixbest ions for calibrating human serum N-glycan spectra [22].The six calibrant ions were selected from the set of 28 glycansdetected in 100% of the samples. The calibrant masses wereconverted to the frequency domain via the following standardcalibration equation [34–36]:
m/z( f ) = A
f − B.
Each calibrant ion mass was aligned to its respectivemonoisotopic peak in each spectrum. To identify themonoisotopic peak for alignment, the first step is toisotope-filter the frequency data and highlight monoiso-topic peaks. Monoisotopic peak selection in the frequencydomain is different from the mass domain because theisotopologue distributions are reversed and the neutronmass differences between isotopologue ions are nonlinear inthe frequency domain. For this reason, a novel deisotopingalgorithm was developed specifically for the frequencydomain and presented here. Finally, graphs containing themonoisotopic-highlighted experimental data surroundingeach of the six calibrant ions are presented to the user fora final visual inspection. If the wrong peak is selected bythe computer, the user can manually reselect the correctpeak with arrow buttons then continue to the calibrationalgorithm and subsequent samples. The manual inspectionstep ensures proper calibration of densely packed spectra thatare hard to decipher with computer algorithms alone. Finalcalibration is performed by fitting the calibration equationto the calibration ions to find the equation coefficients. Theoptimized calibration is facilitated by a CurveFit functionbuilt into IgorPro that is based on the Levenberg–Marquardt
C© 2012 WILEY-VCH Verlag GmbH & Co. KGaA, Weinheim www.proteomics-journal.com
Proteomics 2012, 12, 2523–2538 2527
algorithm. The Omega8’s (IonSpec) and the Glycolyzer’sinternal calibration methods are compared in SupportingInformation Fig. S1, where 12 spectra were calibrated andtheir RMS mass deviations from known values recorded.
3.5 Noise threshold
Separating the signal from the noise is important for peak an-notation and reliable quantification. To threshold a spectrum,a limit of detection (LOD) line is calculated. All peaks abovethe line are considered signal and all peaks below the lineare classified as noise. One option for dynamically assigninga LOD is to manually set the threshold to a relative percent-age of the base peak. A user-selected threshold is problematicbecause the cutoff is arbitrary and independent of the noiseand background. In contrast, we apply different thresholdsettings based on the standard deviation and mean intensityof the noise. The mean intensity of the noise is calculatedby the average mean of all the peak intensities in the spectrasince the number of noise data points greatly outweighs thesignal. Commonly, the lower LOD is set at three-sigma abovethe mean noise level, but we used six-sigma above the meannoise level to further reduce the number of falsely annotatednoise peaks.
The standard deviation of the noise is calculated from ahistogram of all intensities in the spectrum. This histogramis presented in Supporting Information Fig. S2. The mostcommon intensity in the histogram is the noise level usedas the standard deviation. Noise removal by threshold cutoffsdrastically improves processing time since the subsequent al-gorithms are only applied to the signal. Alternately, the stan-dard deviation of the noise is calculated from the full-width-at-half maximum of the distribution. However, the standarddeviation from this method is smaller and produces a lowerthreshold line. Although lower threshold cutoffs allow forhigher sensitivity, they also result in less specificity as noisepeaks can be detected above the threshold. This algorithmworks well for data collected in this study because there aresignificantly more noise peaks than signal peaks detected ina spectrum.
3.6 Peak picking
The Glycolyzer program requires that each peak has a max-imum and contain at least three data points. The centroidmass of each peak is derived by fitting a parabola to the topthree points in each peak via parabolic regression. The fitparabola provides a centroid mass and a corrected intensity.Apex-based intensities are used for ICR spectra because peakline shapes and corresponding areas are affected by manyvariables not directly related to the number of ions in the ICRcell [37]. In contrast, intensities calculated by the area underthe curve (AUC) work well for TOF since the TOF detectorsare based on counting ions.
3.7 Isotope grouping
Current mass spectrometers commonly resolve glycans intotheir isotopologues. High resolving power presents the op-portunity to identify the monoisotopic peak for further anno-tation and analysis. Several research groups have developedisotope grouping algorithms [38–42]. The Glycolyzer’s gen-eral isotope grouping workflow is based on the ThoroughHigh Resolution Analysis of Spectra by Horn (THRASH) al-gorithm [43] with several modifications pertinent to MALDIionization and glycans.
One significant improvement is the Glycolyzer’s ability toseparate overlapping clusters of isotopologues. Rather thanusing subtractive methods for deconvoluting overlappingdistributions, the theoretical overlapped models are recon-structed to reduce the propagation of fitting errors in theresidual spectra. The reconstructive approach is similar to theLASSO method applied by Du and co-workers [44]; however,our model generation is permutated rather than regressedwith automatic variable selection. A simplified workflow ispresented in Supporting Information Fig. S3.
The first step for deconvolving the spectra is to identify anisotopic cluster. A cluster is a set of ions spaced apart by an iso-tope mass unit equal to 1.00235 Da [43], or a fraction depend-ing on the charge state. The fraction is equal to the isotopeunit divided by the charge state. A cluster can contain morethan one isotopic distribution if multiple distributions over-lap. Overlapped isotopic distributions are common in glycanspectra because chromatographic separation prior to massspectrometry is typically not performed. MALDI mass spec-trometry has the favorable characteristic of only producingions with a single charge. This eliminates the need for chargedeconvolution because the spacing between isotopologues isalways a full isotope mass unit rather than a fractional massrelated to higher charge states.
Isotope clusters are found in the spectra by a neighborpeak-finding algorithm. The algorithm looks for neighboringpeaks around a principal ion that are one isotope mass unitaway in both directions. A mass-error tolerance is appliedto this calculation to provide a window for locating a neigh-boring peak apex. This mass error window allows for properdetection of neighboring peaks despite imperfect peak shapesand centroid errors. If a neighboring peak apex is within theerror window, it is added to the cluster and the algorithmcontinues searching for additional ions to add to the cluster.Additional ions are found by making the newly added ion theprinciple ion and repeating the neighboring peak selectionprocess. This peak finding process continues until there areno neighboring ions to add. If a large mass-error toleranceis selected by the user, the clustering algorithm may falselyinclude a second cluster if the spectrum is densely populated.However, this type of error will be corrected later in the algo-rithm when the cluster is deconvoluted (see below). However,if the error is too small, the tail end of a cluster may be bro-ken off and form a second cluster. This condition results inassignment of extra false-positive monoisotopic peaks.
C© 2012 WILEY-VCH Verlag GmbH & Co. KGaA, Weinheim www.proteomics-journal.com

2528 S. R. Kronewitter et al. Proteomics 2012, 12, 2523–2538
The second step for deconvolution is to create syntheticisotopic distributions. Depending on the type of moleculesdetected in the spectra, the isotope distributions will change.Peptide mass spectra are often simulated with the use ofan averagine. An averagine unit represents, by mass andelemental composition, the average mass of an amino acidthat occurs in human proteins. Unknown peptide massescan be converted to elemental compositions by dividing theunknown mass by the averagine mass (111.1254 Da) to findthe number of averagine units and then multiplying thenumber of units by the averagine elemental composition(C4.9384H7.7583N1.3577O1.4773S0.0417) [45]. However, N-glycanshave compositions that differ from peptides. Because ofthe need for sugar-based isotope distribution models,an averagose model was established by An et al. [46].Subsequently, a direct glycan analogue to the averaginewas presented by Vakhrushev et al. [30], which included anaverage monosaccharide unit based on an equal weightingof hexose, N-acetylhexosamine, fucose, and neuraminicacid monosaccharides. We now propose a similar averagosefor modeling N-glycans based on the theoretical librariesand experimentally derived glycan profiles. Experimentalserum profiles generated from applying theoretical librariesto experimental spectra provide a more accurate estimateof a human averagose. The proposed serum averagoseis C6.0000H9.8124N0.3733O4.3470S0.0 with an average mass of156.64662 Da (sulfur was included as a place holder sinceit is not typically seen in our spectra). This new morespecific averagose is compared against theoretical isotopedistributions modeled from the estimates of elementalcompositions with Poisson distributions [46]. SupportingInformation Fig. S4 demonstrates that both Vakhrushev andGlycolyzer methods produce characteristics similar to theexact elemental composition model. In addition, a peptideaveragine was used for glycans and a relatively poor fit wasobtained compared to averagose methods. For deisotopingpurposes, reducing the length of the ICR transients from1.0 to 0.5 s (1 048 576–524 288 data points) improved thechi-squared fit of the model to the experimental data.
Next, we improved processing performance by filtering theclusters based on how many isotopic distributions are presentin a cluster. Extensive deconvolution is not needed on singleion clusters and is reserved for larger clusters containing sev-eral monoisotopic ions and respective distributions. If thereare multiple maxima within a cluster, multiple ions are ex-pected and complete deconvolution is performed.
Theoretical isotopologue intensity distributions are thencalculated based on an averagose model. If there is onlyone expected ion in the cluster, a simple theoretical modelwith one ion is created. However, if multiple ions need tobe deconvoluted, combinations of multiple distributions areneeded. Overlapping isotope group data reconstruction is ac-complished by applying a nonlinear set of 16 ratios betweenthe intensity of multiple clusters to build the model. Six-teen ratios of ion intensities are used to span two orders ofmagnitude with a small number of steps. This decreases the
computer processing overhead while maintaining the desireddeconvolution sensitivity. A nonlinear set of ratios are chosento have greater detail for the ratios close to unity while themore apparent larger ratios are still included. The syntheticmodels are created with varying amounts of mass unit offsetsbetween the theoretical ions. The number of unit offsets islimited by the number of ions in the cluster to further speedup the processing.
Finally, the complete models are multiplied by an align-ment matrix and the individual fits are evaluated with a chi-squared test. The best chi-squared fit alignment is decom-posed to identify the monoisotopic peaks and the results arerecorded. The monoisotopic and isotopologue peaks are as-signed and the theoretical values are subtracted from the spec-trum. The algorithm then repeats clustering on the nonan-notated portion of the spectra. This process repeats until allthe ions above the noise threshold are assigned.
3.8 Glycan annotation
The Glycolyzer provides two methods for annotatingpeaks using accurate mass: development mode and high-throughput mode. Tools available for use in the developmentmode include a broad combinatorial method for makingtheoretical glycans and calculating monosaccharide dif-ferences from the spectra. The brute-force combinatorialmethod can be adapted with biological rules input bythe user. Similar “biological filters” have been describedin the literature to reduce the quantity of nonsensicalglycan compositions [14, 30, 47]. OmniFinder, a dynamicalgorithm similar to GlycoMod [14], creates a list of all themathematically possible glycans or glycopeptides withinspecified monosaccharide and/or amino acid compositionsand searches for them in the spectra. The list is compre-hensive but includes a high degree of false-positive hits. Thenonsensical glycan false hits are largely eliminated with anarray of glycan filters based on known biology.
Another useful tool in the development mode is a glycanpeak relationship finder. Mass differences consistent withmonosaccharide masses are indicative of an ion being a gly-can or a glycoconjugate. This can be helpful with variable orunknown head groups. This information is also helpful fordetermining families of glycans that differ by one monosac-charide. Finding these differences require processed spectrathat only contain monoisotopic masses because many extra-neous differences will be found that include associated iso-topologues. A stem-and-leaf algorithm is employed to finddifferences because error bars can be applied to each side ofthe difference. The stem-and-leaf algorithm starts by lookingfor imprecise monosaccharide differences and iteratively fo-cuses in on the differences with the least RMS mass error.The adaptive algorithm allows the difference finder to workon poorly calibrated spectra. Calibrated spectra often yieldRMS mass errors in the several hundreds of parts-per-billionrange for monosaccharide differences. The high accuracy of
C© 2012 WILEY-VCH Verlag GmbH & Co. KGaA, Weinheim www.proteomics-journal.com
Proteomics 2012, 12, 2523–2538 2529
correctly matched pairs allows for easy differentiation of trueassignments from false ones.
In our glycomics studies, high-throughput annotation wasachieved by bounding the glycan composition possibilities toa targeted list of N-glycans. A recently published theoreticalglycan library or experimentally derived glycan profile wasused as a basis for annotation [22]. In short, the N-glycanlibrary was generated by degrading fully glycosylated com-plex, hybrid, and high mannose type glycans all the way tothe N-linked core. The glycome is bounded by the extent ofglycosylation of the starting point glycans. The retrosyntheticdegradation provides a well-defined comprehensive list. Sub-set profiles were rapidly established by scanning the N-glycanlibrary across a set of samples and matching the masses towell calibrated, highly resolved, peaks with masses within a15 RMS ppm mass error cutoff. Mass profile establishmentis critical for advancement from the development stage to thehigh-throughput biomarker analysis.
Implementation of glycan libraries improves thebiomarker detection sensitivity because it focuses the hypoth-esis testing to only glycan masses. Reducing the number oftests allows for respective performance gains from the multi-ple testing corrections. The Bonferroni multiple-testing cor-rections help avoid inflated Type-1 error rates. The size ofthe glycan profiles is large enough to test all the glycans ofinterest but still small enough for significant changes to bedetected.
The combinatorial glycan method (generating a library byiterating over all possible monosaccharide combinations) wascompared with the theoretical glycan library method by exam-ining the fraction of compositions consistent with the libraryto those that are not. The number of inconsistent combi-natorial compositions increases with increasing tolerancesfor mass assignments. This trend is shown in SupportingInformation Fig. S5. The drawback of using an unfilteredcombinatorial library is that it generates between 40% and60% false compositions depending on whether protonatedmasses or sodiated masses are used; assuming a 15 RMSppm mass error cutoff. There are more false compositions inthe sodiated mass list because of the allowed proton-sodiumexchange common to the carboxylic acid group of sialic acid.The sodium substituted cation takes on a multiple sodiatedform [M + (1 + x)Na − (x)H]+, where x can be equal to or lessthan the number of exchangeable acid groups. An N-glycanbiological filtered method is not included for comparison be-cause the N-glycan filter is inherent with the theoretical ret-rosynthetic theoretical N-glycan library [22]. All of the rulesare included in the glycan networks and initial starting pointions. Additionally, multiple mass error windows are includedfor comparison. Supporting Information Fig. S5 depicts theimportance of high mass accuracy measurements and showsthat as the mass error tolerance increases, the number of falseassignments increases.
Since many glycans are present in families that are relatedby monosaccharides, identifying these differences in spectrahelps confirm compositions without the need for tandem
mass spectrometry or glycosidase digestion. It is critical thateach spectrum is reduced to only monoisotopic peaks priorto searching for monosaccharide differences.
4 Statistics
4.1 Normalization
Normalizing spectra intensities is one of the most importantoperations in mass spectrometry analysis. It affects intensityvalues more than any other data operation. The Glycolyzerincludes several normalization options: base peak intensity,total ion intensity, total peak intensity (TPI), total library in-tensity, and select library intensity. Base peak intensity nor-malization converts peak intensities to a percentage relative tothe most intense peak in the spectrum. However, changes inthe base peak’s intensity cannot be observed and subsequentperturbations to it are propagated to other ions in the spectra.Total ion intensity is based on a sum of all data present in theunprocessed spectrum. Dividing ion intensities by the meanof all ion intensities will normalize the spectrum primarily tothe noise level because of the relative sparseness of the ionsas compared to the noise. TPI involves normalizing the spec-tra to the average peak intensity based on only peaks abovethe noise threshold. This is similar to the method used byBarkauskas et al. on a prostate cancer study [48] and focusesthe normalization to intense peaks. The total library intensityoption is similar to the TPI except that only annotated peakintensities contribute to the mean total intensity divisor. Thisallows normalizing by only the ions of interest (N-glycansin this case). The select library intensity normalization fur-ther focuses the normalization divisor by including only aselect subset of the annotated ions. Prior information on thefrequency of detection of library ions in a data set (the per-centage of samples containing the ion) can be used to rankthe ions so only glycan ions with high detection rate are usedfor normalization calculations.
Although the different normalization methods tested onthis data set produced slightly different sets of significantions, there was a high degree of similarity between resultsbecause the methods all used a constant divisor and onlyvaried by the different sets of ions used to calculate the divisor.The strongest biomarkers were found significant regardlessof normalization method. The results from this study arebased on the TPI method.
4.2 Spectra averaging
Collecting multiple spectra of the same sample greatly im-proves the precision of the measurement. As the numberof spectra, N, increases, the standard deviation decreases in-versely proportional to the square root of N [33]. Replicatespectra can be processed with the Glycolyzer providing theuser with two options to incorporate them. The most common
C© 2012 WILEY-VCH Verlag GmbH & Co. KGaA, Weinheim www.proteomics-journal.com
2530 S. R. Kronewitter et al. Proteomics 2012, 12, 2523–2538
method averages specific ions intensities from each techni-cal replicate together prior to statistical analysis. This worksbest when target ions are detected in all spectra. An alter-nate method is to take the highest value of each ion fromthe set of replicates to use as the value. This situation rep-resents the best-case scenario of data from the sample. Thiscan help overcome some of the variability from the MALDIionization process, where cold spots on the matrix produceonly the most intense ions. Each ion needs only be detectedabove the threshold in one sample of a given set of replicatesto be included. Standard spectra averaging of specific ion in-tensities were used for the five technical replicates acquiredin the discovery set.
4.3 Missing values
When extracting glycan library masses from the data, someof the ions in the profile are not detected in the data abovethe noise threshold or are missed by deisotoping errors. Theabsence of a peak is useful when monitoring the frequencyof detection of an ion (presence or absence) across a sam-ple set but often causes problems with downstream statisticscalculations. The solution to the missing data implementedhere is to look below the threshold and find the largest peakwithin a prescribed mass error window. Filling in noise valuesfor missing peaks should result in higher quality biomarkersbecause the former zero values will skew distributions oflow intensity ions that are near the noise threshold cutoff.However, very low intensity peaks can be over representedif the number of zeroes is greater than the number of de-tected peaks across a data set. Although a potential problem,this scenario typically does not lead to an increased numberof false-positive biomarkers because the glycans with largeamounts of missing values will not pass the strict hypothesistests due to high variance caused by the randomness of thelow intensity peaks used for data filling.
4.4 Multiple statistical hypothesis testing
Each glycan annotated by the theoretical profile is subjectedto hypothesis testing to determine if any changes are sig-nificant. Five technical replicate FT-ICR spectra from eachsample are averaged prior to hypothesis testing. The natu-ral logarithm of the intensities is used for testing to preventthe most intense ions in the spectra from overwhelming theless intense species. Furthermore, taking logarithms of theintensities improves the assumption of constant error vari-ance and makes the data better suited for standard statisticaltesting [4]. Two-tailed t-tests were used for hypothesis test-ing. Due to the large amount of independent glycans testedin this manner, multiple testing corrections should be em-ployed. Bonferroni corrections are implemented to add rigorto the testing by maintaining the family-wise error rate. Gly-cans with significant changes in intensity are found when
they pass the hypothesis testing (p < 0.05) and the Bonfer-roni multiple testing correction (n = 101 for the number ofglycan masses in the library).
4.5 Linear classifier motif tests
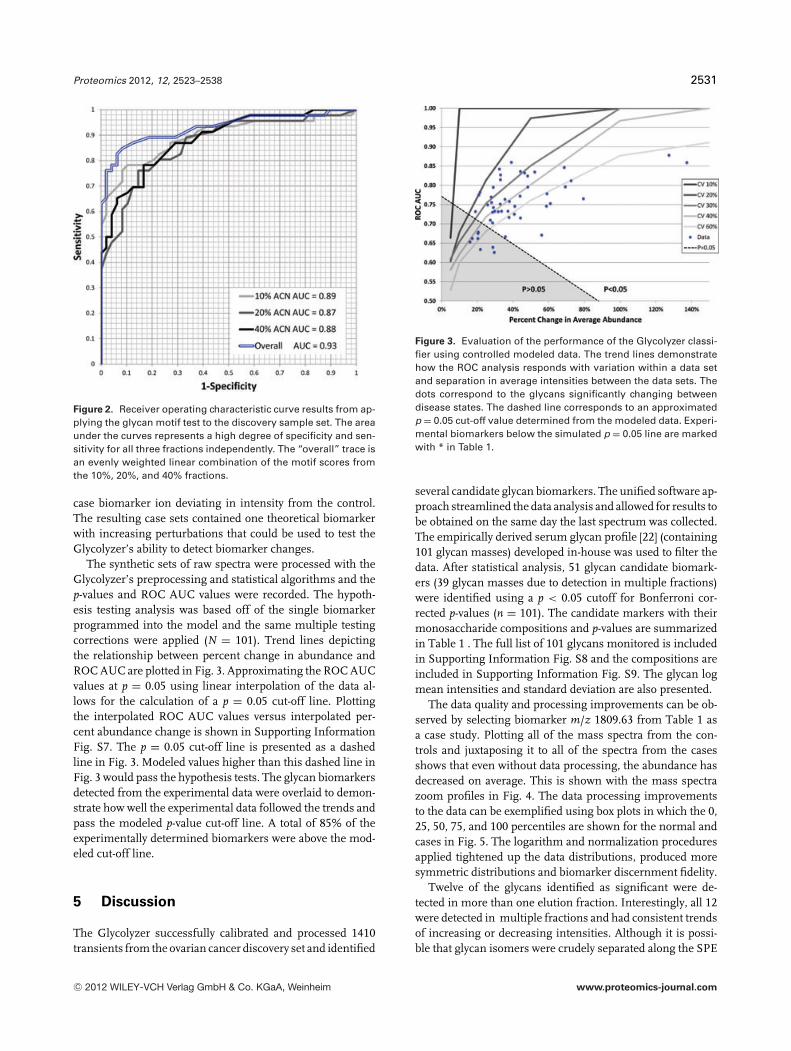
The significant markers that passed the t-test were combinedinto a motif test that leverages deviations in case intensitiesfrom control mean intensities. Combining multiple markersinto a diagnostic panel has been shown previously to improvediscrimination [49, 50]. To obtain a score for each sample,each glycan in the motif test is weighted by the difference be-tween the mean control ion intensity and the mean case ionintensity. The larger the difference between the mean is, thelarger the weighting factor. The scoring scheme was set up byadding the absolute value of the marker ion deviations fromthe control mean. This allows the summation of positive andnegative deviations found in the biomarker motif test. Thenet score is used to classify unknown samples; whereas thesamples consistent with the motifs, and thus larger devia-tions, score higher. A separate motif test was developed foreach ACN fraction. The results are summarized with receiveroperating characteristic curves (ROC) and evaluated by theAUC. The AUC is calculated by geometric integration. Ap-plying motif tests to the discovery set provided high AUCresults for the three fractions: 10% (0.89), 20% (0.87), and40% (0.88). When weighted evenly across the 10%, 20%, and40% fractions, a linear combination of the motif test scorescan be linearly combined into an overall test metric. The over-all test improves sensitivity and specificity and increases ROCAUC to 0.93. The ROC curve results are included in Fig. 2.
4.6 Data modeling
The data analysis pipeline was evaluated by modeling the datawith perturbation analysis. Synthetic case and control massspectra were created with perturbed intensities. A representa-tive sample spectrum was selected and used to seed new spec-tra. Each intensity value was modified with a multiplicativefactor generated randomly from a normal distribution usinga Box–Muller simulation [51]. Several data sets were gener-ated to include distributions in intensity values that producedcoefficients of variation of 10%, 20%, 30%, 40%, and 60%.The randomization was evaluated by comparing two sets ofunperturbed control spectra. After data processing, no signif-icant biomarkers were detected (p = 0.05) indicating the datais sufficiently randomized in the model. An example plot of48 simulated control spectra with a coefficient of variation of60% is included in Supporting Information Fig. S6. At eachcoefficient of variation perturbation, two sets of 48 spectra(one for case and the other for control) where the case setcontained one glycan ion with its mean intensity value in-creased by 5%, 10%, 25%, 50%, 100%, or 150% relative to thecontrol. This change in abundance simulates the effect of a
C© 2012 WILEY-VCH Verlag GmbH & Co. KGaA, Weinheim www.proteomics-journal.com
Proteomics 2012, 12, 2523–2538 2531
Figure 2. Receiver operating characteristic curve results from ap-plying the glycan motif test to the discovery sample set. The areaunder the curves represents a high degree of specificity and sen-sitivity for all three fractions independently. The “overall” trace isan evenly weighted linear combination of the motif scores fromthe 10%, 20%, and 40% fractions.
case biomarker ion deviating in intensity from the control.The resulting case sets contained one theoretical biomarkerwith increasing perturbations that could be used to test theGlycolyzer’s ability to detect biomarker changes.
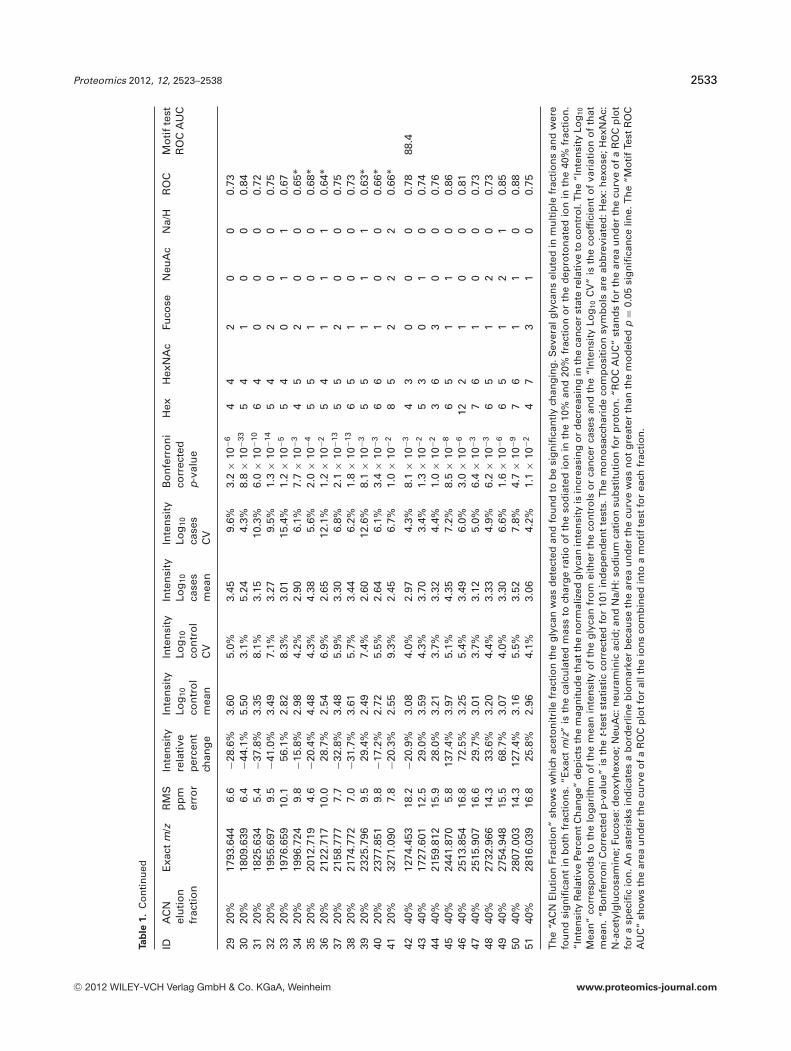
The synthetic sets of raw spectra were processed with theGlycolyzer’s preprocessing and statistical algorithms and thep-values and ROC AUC values were recorded. The hypoth-esis testing analysis was based off of the single biomarkerprogrammed into the model and the same multiple testingcorrections were applied (N = 101). Trend lines depictingthe relationship between percent change in abundance andROC AUC are plotted in Fig. 3. Approximating the ROC AUCvalues at p = 0.05 using linear interpolation of the data al-lows for the calculation of a p = 0.05 cut-off line. Plottingthe interpolated ROC AUC values versus interpolated per-cent abundance change is shown in Supporting InformationFig. S7. The p = 0.05 cut-off line is presented as a dashedline in Fig. 3. Modeled values higher than this dashed line inFig. 3 would pass the hypothesis tests. The glycan biomarkersdetected from the experimental data were overlaid to demon-strate how well the experimental data followed the trends andpass the modeled p-value cut-off line. A total of 85% of theexperimentally determined biomarkers were above the mod-eled cut-off line.
5 Discussion
The Glycolyzer successfully calibrated and processed 1410transients from the ovarian cancer discovery set and identified
Figure 3. Evaluation of the performance of the Glycolyzer classi-fier using controlled modeled data. The trend lines demonstratehow the ROC analysis responds with variation within a data setand separation in average intensities between the data sets. Thedots correspond to the glycans significantly changing betweendisease states. The dashed line corresponds to an approximatedp = 0.05 cut-off value determined from the modeled data. Experi-mental biomarkers below the simulated p = 0.05 line are markedwith * in Table 1.
several candidate glycan biomarkers. The unified software ap-proach streamlined the data analysis and allowed for results tobe obtained on the same day the last spectrum was collected.The empirically derived serum glycan profile [22] (containing101 glycan masses) developed in-house was used to filter thedata. After statistical analysis, 51 glycan candidate biomark-ers (39 glycan masses due to detection in multiple fractions)were identified using a p < 0.05 cutoff for Bonferroni cor-rected p-values (n = 101). The candidate markers with theirmonosaccharide compositions and p-values are summarizedin Table 1 . The full list of 101 glycans monitored is includedin Supporting Information Fig. S8 and the compositions areincluded in Supporting Information Fig. S9. The glycan logmean intensities and standard deviation are also presented.
The data quality and processing improvements can be ob-served by selecting biomarker m/z 1809.63 from Table 1 asa case study. Plotting all of the mass spectra from the con-trols and juxtaposing it to all of the spectra from the casesshows that even without data processing, the abundance hasdecreased on average. This is shown with the mass spectrazoom profiles in Fig. 4. The data processing improvementsto the data can be exemplified using box plots in which the 0,25, 50, 75, and 100 percentiles are shown for the normal andcases in Fig. 5. The logarithm and normalization proceduresapplied tightened up the data distributions, produced moresymmetric distributions and biomarker discernment fidelity.
Twelve of the glycans identified as significant were de-tected in more than one elution fraction. Interestingly, all 12were detected in multiple fractions and had consistent trendsof increasing or decreasing intensities. Although it is possi-ble that glycan isomers were crudely separated along the SPE
C© 2012 WILEY-VCH Verlag GmbH & Co. KGaA, Weinheim www.proteomics-journal.com

2532 S. R. Kronewitter et al. Proteomics 2012, 12, 2523–2538
Ta
ble
1.
Can
did
ate
gly
can
bio
mar
kers
fou
nd
wit
hB
on
ferr
on
ico
rrec
ted
p-v
alu
esle
ssth
an0.
05
IDA
CN
Exa
ctm
/zR
MS
Inte
nsi
tyIn
ten
sity
Inte
nsi
tyIn
ten
sity
Inte
nsi
tyB
on
ferr
on
iH
exH
exN
Ac
Fuco
seN
euA
cN
a/H
RO
CM
oti
fte
stel
uti
on
pp
mre
lati
veLo
g10
Log
10Lo
g10
Log
10co
rrec
ted
RO
CA
UC
frac
tio
ner
ror
per
cen
tco
ntr
ol
con
tro
lca
ses
case
sp
-val
ue
chan
ge
mea
nC
Vm
ean
CV
110
%12
57.4
237.
5−4
3.9%
3.99
6.5%
3.74
7.6%
1.1
×10
−35
20
00
0.77
89.4
210
%12
98.4
4910
.8−3
3.0%
3.24
4.7%
3.06
5.6%
6.4
×10
−54
30
00
0.81
310
%14
19.4
751.
8−2
7.3%
5.19
3.0%
5.05
4.2%
3.0
×10
−26
20
00
0.71
410
%14
44.5
0710
.5−3
5.5%
3.50
5.8%
3.31
6.2%
9.4
×10
−44
31
00
0.76
510
%14
60.5
029.
6−4
8.2%
4.02
6.1%
3.73
8.6%
3.1
×10
−45
30
00
0.80
610
%14
85.5
345.
160
.9%
5.09
3.4%
5.30
5.6%
5.0
×10
−33
41
00
0.75
710
%15
01.5
296.
6−3
8.0%
4.38
4.7%
4.17
6.1%
1.9
×10
−34
40
00
0.76
810
%15
42.5
555.
379
.4%
4.62
5.8%
4.87
7.1%
8.3
×10
−33
50
00
0.77
910
%16
47.5
862.
7−2
7.8%
5.09
2.6%
4.95
3.4%
9.2
×10
−44
41
00
0.77
1010
%16
63.5
819.
0−4
8.2%
4.30
4.8%
4.01
6.7%
5.9
×10
−65
40
00
0.82
1110
%17
93.6
4410
.3−3
9.1%
2.96
4.5%
2.75
6.2%
6.4
×10
−84
42
00
0.86
1210
%18
09.6
397.
6−5
2.2%
4.30
5.7%
3.98
6.2%
5.2
×10
−75
41
00
0.83
1310
%18
50.6
663.
6−2
1.5%
5.36
2.2%
5.26
2.3%
2.7
×10
−34
51
00
0.78
1410
%19
96.7
248.
9−3
3.0%
3.52
3.4%
3.35
4.8%
3.8
×10
−64
52
00
0.83
1510
%20
12.7
193.
0−3
2.4%
5.02
2.5%
4.85
3.1%
2.0
×10
−65
51
00
0.84
1610
%20
28.7
1410
.3−2
8.9%
2.96
4.2%
2.81
5.2%
4.7
×10
−56
50
00
0.80
1710
%21
58.7
7710
.5−4
6.5%
3.44
6.1%
3.16
7.0%
1.4
×10
−65
52
00
0.83
1820
%12
57.4
237.
3−3
5.7%
4.69
4.8%
4.50
10.1
%3.
7×
10−6
52
00
00.
6786
.519
20%
1339
.476
9.9
58.7
%3.
156.
8%3.
359.
1%1.
0×
10−1
03
40
00
0.75
2020
%14
44.5
0710
.9−4
0.7%
3.97
4.8%
3.74
8.9%
3.5
×10
−11
43
10
00.
7321
20%
1485
.534
4.2
69.3
%5.
314.
2%5.
545.
0%5.
6×
10−1
93
41
00
0.80
2220
%15
01.5
2910
.0−2
8.5%
4.11
3.0%
3.96
6.4%
7.5
×10
−11
44
00
00.
7023
20%
1542
.555
11.5
59.0
%2.
675.
8%2.
878.
9%1.
5×
10−1
43
50
00
0.78
2420
%16
06.5
6011
.1−2
1.7%
3.60
8.0%
3.49
11.0
%4.
8×
10−2
53
10
00.
63*
2520
%16
47.5
867.
5−1
8.9%
5.73
2.0%
5.63
2.5%
3.5
×10
−11
44
10
00.
7326
20%
1663
.581
7.5
−37.
2%4.
444.
5%4.
247.
0%2.
8×
10−1
45
40
00
0.73
2720
%16
88.6
138.
844
.2%
3.85
6.4%
4.01
6.2%
1.0
×10
−93
51
00
0.72
2820
%17
04.6
0810
.220
.6%
3.16
4.9%
3.25
6.5%
1.2
×10
−34
50
00
0.68
*
C© 2012 WILEY-VCH Verlag GmbH & Co. KGaA, Weinheim www.proteomics-journal.com
Proteomics 2012, 12, 2523–2538 2533
Ta
ble
1.
Co
nti
nu
ed
IDA
CN
Exa
ctm
/zR
MS
Inte
nsi
tyIn
ten
sity
Inte
nsi
tyIn
ten
sity
Inte
nsi
tyB
on
ferr
on
iH
exH
exN
Ac
Fuco
seN
euA
cN
a/H
RO
CM
oti
fte
stel
uti
on
pp
mre
lati
veLo
g10
Log
10Lo
g10
Log
10co
rrec
ted
RO
CA
UC
frac
tio
ner
ror
per
cen
tco
ntr
ol
con
tro
lca
ses
case
sp
-val
ue
chan
ge
mea
nC
Vm
ean
CV
2920
%17
93.6
446.
6−2
8.6%
3.60
5.0%
3.45
9.6%
3.2
×10
−64
42
00
0.73
3020
%18
09.6
396.
4−4
4.1%
5.50
3.1%
5.24
4.3%
8.8
×10
−33
54
10
00.
8431
20%
1825
.634
5.4
−37.
8%3.
358.
1%3.
1510
.3%
6.0
×10
−10
64
00
00.
7232
20%
1955
.697
9.5
−41.
0%3.
497.
1%3.
279.
5%1.
3×
10−1
45
42
00
0.75
3320
%19
76.6
5910
.156
.1%
2.82
8.3%
3.01
15.4
%1.
2×
10−5
54
01
10.
6734
20%
1996
.724
9.8
−15.
8%2.
984.
2%2.
906.
1%7.
7×
10−3
45
20
00.
65*
3520
%20
12.7
194.
6−2
0.4%
4.48
4.3%
4.38
5.6%
2.0
×10
−45
51
00
0.68
*36
20%
2122
.717
10.0
28.7
%2.
546.
9%2.
6512
.1%
1.2
×10
−25
41
11
0.64
*37
20%
2158
.777
7.7
−32.
8%3.
485.
9%3.
306.
8%2.
1×
10−1
35
52
00
0.75
3820
%21
74.7
727.
0−3
1.7%
3.61
5.7%
3.44
6.2%
1.8
×10
−13
65
10
00.
7339
20%
2325
.796
9.5
29.4
%2.
497.
4%2.
6012
.6%
8.1
×10
−35
51
11
0.63
*40
20%
2377
.851
9.8
−17.
2%2.
725.
5%2.
646.
1%3.
4×
10−3
66
10
00.
66*
4120
%32
71.0
907.
8−2
0.3%
2.55
9.3%
2.45
6.7%
1.0
×10
−28
52
22
0.66
*
4240
%12
74.4
5318
.2−2
0.9%
3.08
4.0%
2.97
4.3%
8.1
×10
−34
30
00
0.78
88.4
4340
%17
27.6
0112
.529
.0%
3.59
4.3%
3.70
3.4%
1.3
×10
−25
30
10
0.74
4440
%21
59.8
1215
.928
.0%
3.21
3.7%
3.32
4.4%
1.0
×10
−23
63
00
0.76
4540
%24
41.8
705.
813
7.4%
3.97
5.1%
4.35
7.2%
8.5
×10
−86
51
10
0.86
4640
%25
13.8
5416
.872
.5%
3.25
5.4%
3.49
6.0%
3.0
×10
−612
21
00
0.81
4740
%25
15.9
0716
.629
.7%
3.01
3.7%
3.12
5.0%
6.4
×10
−37
61
00
0.73
4840
%27
32.9
6614
.333
.6%
3.20
4.4%
3.33
4.9%
6.2
×10
−36
51
20
0.73
4940
%27
54.9
4815
.568
.7%
3.07
4.0%
3.30
6.6%
1.6
×10
−66
51
21
0.85
5040
%28
07.0
0314
.312
7.4%
3.16
5.5%
3.52
7.8%
4.7
×10
−97
61
10
0.88
5140
%28
16.0
3916
.825
.8%
2.96
4.1%
3.06
4.2%
1.1
×10
−24
73
10
0.75
Th
e“A
CN
Elu
tio
nFr
acti
on
”sh
ow
sw
hic
hac
eto
nit
rile
frac
tio
nth
eg
lyca
nw
asd
etec
ted
and
fou
nd
tob
esi
gn
ifica
ntl
ych
ang
ing
.Sev
eral
gly
can
sel
ute
din
mu
ltip
lefr
acti
on
san
dw
ere
fou
nd
sig
nifi
can
tin
bo
thfr
acti
on
s.“E
xact
m/z
”is
the
calc
ula
ted
mas
sto
char
ge
rati
oo
fth
eso
dia
ted
ion
inth
e10
%an
d20
%fr
acti
on
or
the
dep
roto
nat
edio
nin
the
40%
frac
tio
n.
“In
ten
sity
Rel
ativ
ePe
rcen
tCh
ang
e”d
epic
tsth
em
agn
itu
de
that
the
no
rmal
ized
gly
can
inte
nsi
tyis
incr
easi
ng
or
dec
reas
ing
inth
eca
nce
rst
ate
rela
tive
toco
ntr
ol.
Th
e“I
nte
nsi
tyLo
g10
Mea
n”
corr
esp
on
ds
toth
elo
gari
thm
of
the
mea
nin
ten
sity
of
the
gly
can
fro
mei
ther
the
con
tro
lso
rca
nce
rca
ses
and
the
“In
ten
sity
Log
10C
V”
isth
eco
effi
cien
to
fva
riat
ion
of
that
mea
n.
“Bo
nfe
rro
ni
Co
rrec
ted
p-v
alu
e”is
the
t-te
stst
atis
tic
corr
ecte
dfo
r10
1in
dep
end
ent
test
s.T
he
mo
no
sacc
har
ide
com
po
siti
on
sym
bo
lsar
eab
bre
viat
ed:
Hex
:h
exo
se;
Hex
NA
c:N
-ace
tylg
luco
sam
ine;
Fuco
se:d
eoxy
hex
oe;
Neu
Ac:
neu
ram
inic
acid
;an
dN
a/H
:so
diu
mca
tio
nsu
bst
itu
tio
nfo
rp
roto
n.“
RO
CA
UC
”st
and
sfo
rth
ear
eau
nd
erth
ecu
rve
of
aR
OC
plo
tfo
ra
spec
ific
ion
.An
aste
risk
sin
dic
ates
ab
ord
erlin
eb
iom
arke
rb
ecau
seth
ear
eau
nd
erth
ecu
rve
was
no
tg
reat
erth
anth
em
od
eled
p=
0.05
sig
nifi
can
celin
e.T
he
“Mo
tif
Test
RO
CA
UC
”sh
ow
sth
ear
eau
nd
erth
ecu
rve
of
aR
OC
plo
tfo
ral
lth
eio
ns
com
bin
edin
toa
mo
tif
test
for
each
frac
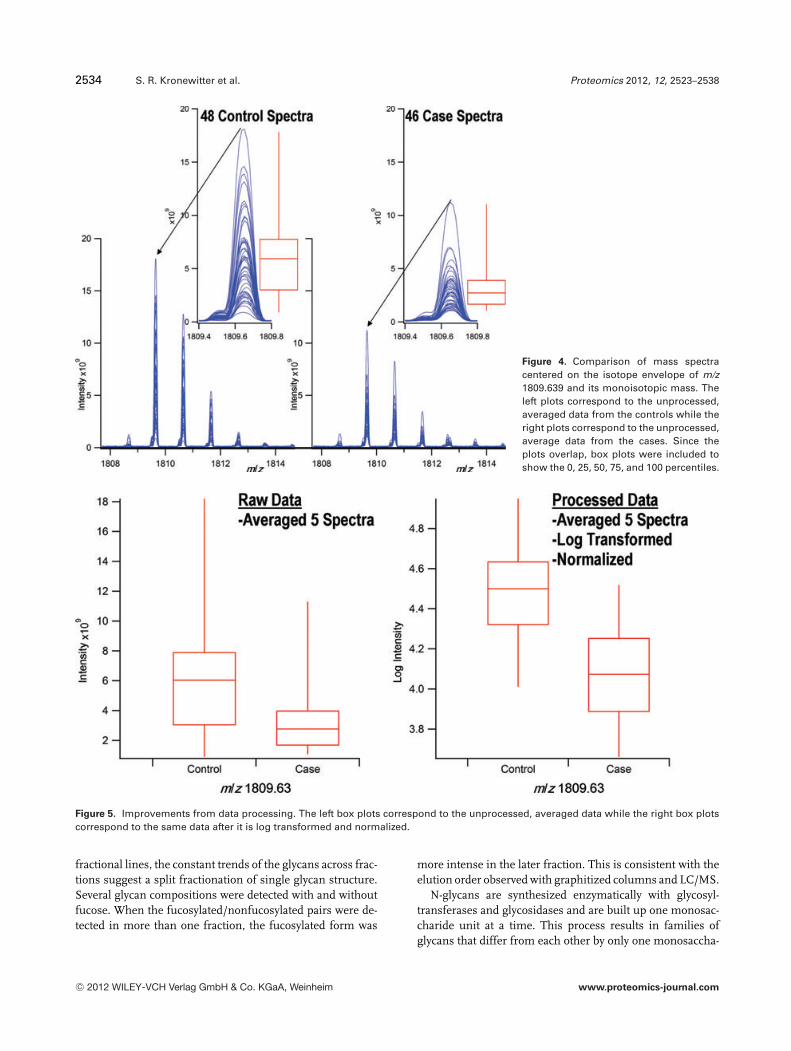
tio
n.
C© 2012 WILEY-VCH Verlag GmbH & Co. KGaA, Weinheim www.proteomics-journal.com
2534 S. R. Kronewitter et al. Proteomics 2012, 12, 2523–2538
Figure 4. Comparison of mass spectracentered on the isotope envelope of m/z1809.639 and its monoisotopic mass. Theleft plots correspond to the unprocessed,averaged data from the controls while theright plots correspond to the unprocessed,average data from the cases. Since theplots overlap, box plots were included toshow the 0, 25, 50, 75, and 100 percentiles.
Figure 5. Improvements from data processing. The left box plots correspond to the unprocessed, averaged data while the right box plotscorrespond to the same data after it is log transformed and normalized.
fractional lines, the constant trends of the glycans across frac-tions suggest a split fractionation of single glycan structure.Several glycan compositions were detected with and withoutfucose. When the fucosylated/nonfucosylated pairs were de-tected in more than one fraction, the fucosylated form was
more intense in the later fraction. This is consistent with theelution order observed with graphitized columns and LC/MS.
N-glycans are synthesized enzymatically with glycosyl-transferases and glycosidases and are built up one monosac-charide unit at a time. This process results in families ofglycans that differ from each other by only one monosaccha-
C© 2012 WILEY-VCH Verlag GmbH & Co. KGaA, Weinheim www.proteomics-journal.com
Proteomics 2012, 12, 2523–2538 2535
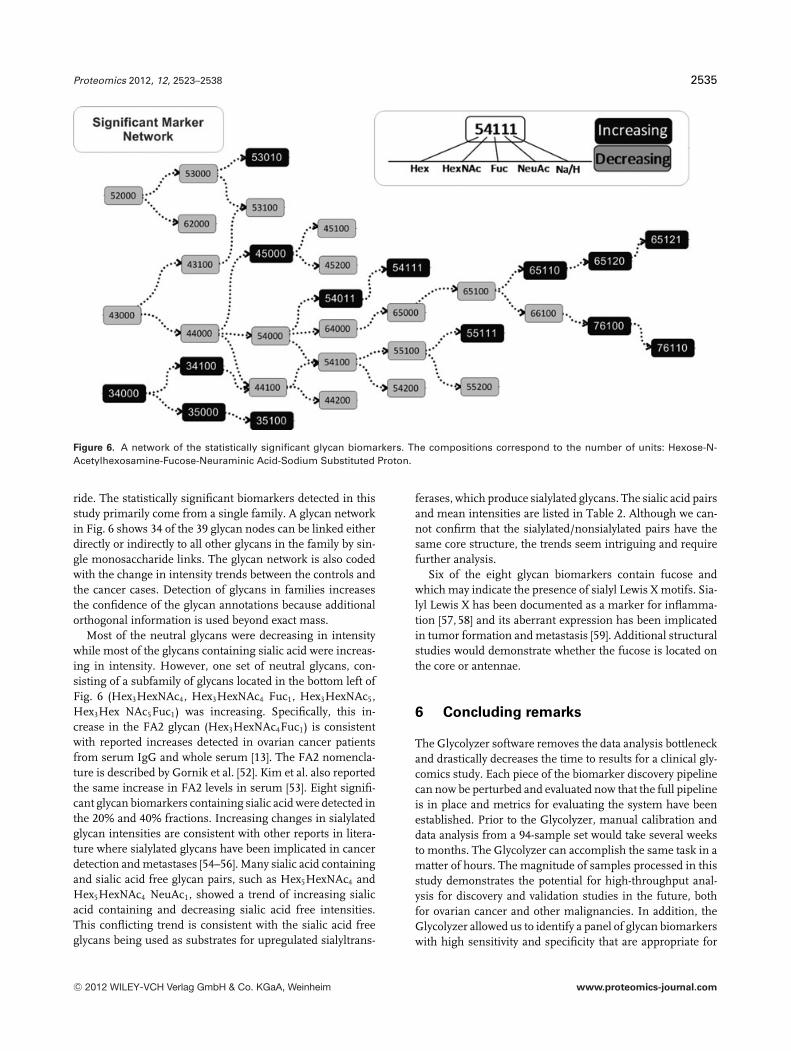
Figure 6. A network of the statistically significant glycan biomarkers. The compositions correspond to the number of units: Hexose-N-Acetylhexosamine-Fucose-Neuraminic Acid-Sodium Substituted Proton.
ride. The statistically significant biomarkers detected in thisstudy primarily come from a single family. A glycan networkin Fig. 6 shows 34 of the 39 glycan nodes can be linked eitherdirectly or indirectly to all other glycans in the family by sin-gle monosaccharide links. The glycan network is also codedwith the change in intensity trends between the controls andthe cancer cases. Detection of glycans in families increasesthe confidence of the glycan annotations because additionalorthogonal information is used beyond exact mass.
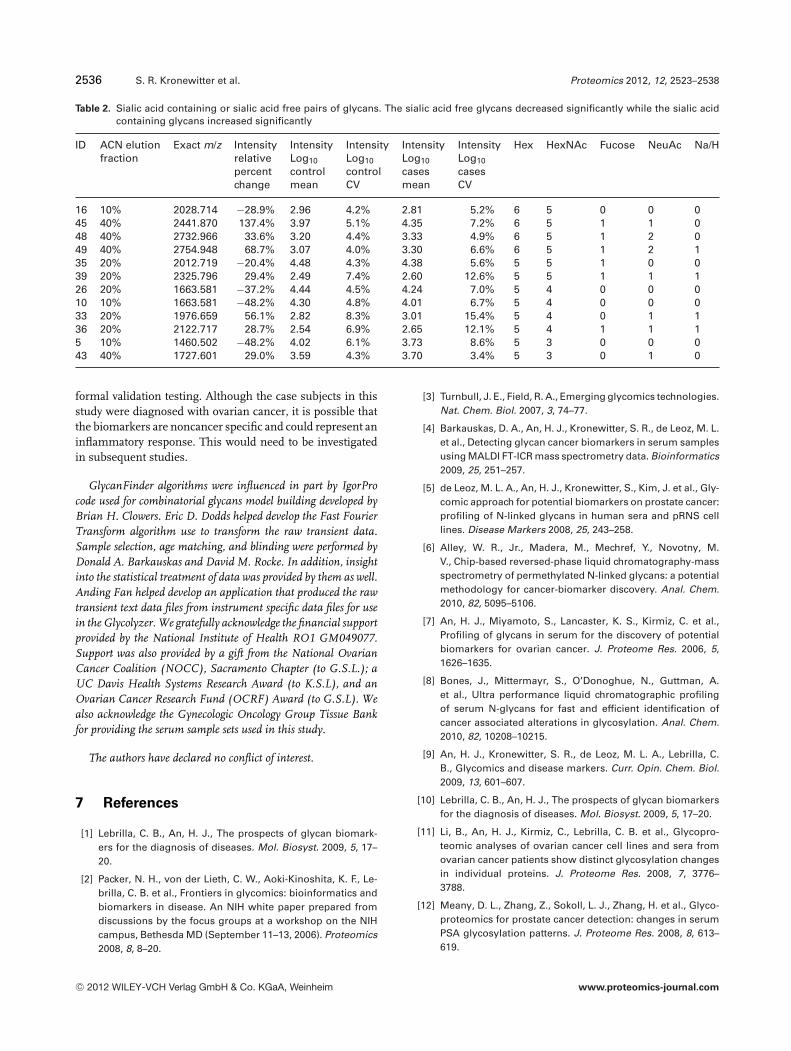
Most of the neutral glycans were decreasing in intensitywhile most of the glycans containing sialic acid were increas-ing in intensity. However, one set of neutral glycans, con-sisting of a subfamily of glycans located in the bottom left ofFig. 6 (Hex3HexNAc4, Hex3HexNAc4 Fuc1, Hex3HexNAc5,Hex3Hex NAc5Fuc1) was increasing. Specifically, this in-crease in the FA2 glycan (Hex3HexNAc4Fuc1) is consistentwith reported increases detected in ovarian cancer patientsfrom serum IgG and whole serum [13]. The FA2 nomencla-ture is described by Gornik et al. [52]. Kim et al. also reportedthe same increase in FA2 levels in serum [53]. Eight signifi-cant glycan biomarkers containing sialic acid were detected inthe 20% and 40% fractions. Increasing changes in sialylatedglycan intensities are consistent with other reports in litera-ture where sialylated glycans have been implicated in cancerdetection and metastases [54–56]. Many sialic acid containingand sialic acid free glycan pairs, such as Hex5HexNAc4 andHex5HexNAc4 NeuAc1, showed a trend of increasing sialicacid containing and decreasing sialic acid free intensities.This conflicting trend is consistent with the sialic acid freeglycans being used as substrates for upregulated sialyltrans-
ferases, which produce sialylated glycans. The sialic acid pairsand mean intensities are listed in Table 2. Although we can-not confirm that the sialylated/nonsialylated pairs have thesame core structure, the trends seem intriguing and requirefurther analysis.
Six of the eight glycan biomarkers contain fucose andwhich may indicate the presence of sialyl Lewis X motifs. Sia-lyl Lewis X has been documented as a marker for inflamma-tion [57, 58] and its aberrant expression has been implicatedin tumor formation and metastasis [59]. Additional structuralstudies would demonstrate whether the fucose is located onthe core or antennae.
6 Concluding remarks
The Glycolyzer software removes the data analysis bottleneckand drastically decreases the time to results for a clinical gly-comics study. Each piece of the biomarker discovery pipelinecan now be perturbed and evaluated now that the full pipelineis in place and metrics for evaluating the system have beenestablished. Prior to the Glycolyzer, manual calibration anddata analysis from a 94-sample set would take several weeksto months. The Glycolyzer can accomplish the same task in amatter of hours. The magnitude of samples processed in thisstudy demonstrates the potential for high-throughput anal-ysis for discovery and validation studies in the future, bothfor ovarian cancer and other malignancies. In addition, theGlycolyzer allowed us to identify a panel of glycan biomarkerswith high sensitivity and specificity that are appropriate for
C© 2012 WILEY-VCH Verlag GmbH & Co. KGaA, Weinheim www.proteomics-journal.com
2536 S. R. Kronewitter et al. Proteomics 2012, 12, 2523–2538
Table 2. Sialic acid containing or sialic acid free pairs of glycans. The sialic acid free glycans decreased significantly while the sialic acidcontaining glycans increased significantly
ID ACN elution Exact m/z Intensity Intensity Intensity Intensity Intensity Hex HexNAc Fucose NeuAc Na/Hfraction relative Log10 Log10 Log10 Log10
percent control control cases caseschange mean CV mean CV
16 10% 2028.714 −28.9% 2.96 4.2% 2.81 5.2% 6 5 0 0 045 40% 2441.870 137.4% 3.97 5.1% 4.35 7.2% 6 5 1 1 048 40% 2732.966 33.6% 3.20 4.4% 3.33 4.9% 6 5 1 2 049 40% 2754.948 68.7% 3.07 4.0% 3.30 6.6% 6 5 1 2 135 20% 2012.719 −20.4% 4.48 4.3% 4.38 5.6% 5 5 1 0 039 20% 2325.796 29.4% 2.49 7.4% 2.60 12.6% 5 5 1 1 126 20% 1663.581 −37.2% 4.44 4.5% 4.24 7.0% 5 4 0 0 010 10% 1663.581 −48.2% 4.30 4.8% 4.01 6.7% 5 4 0 0 033 20% 1976.659 56.1% 2.82 8.3% 3.01 15.4% 5 4 0 1 136 20% 2122.717 28.7% 2.54 6.9% 2.65 12.1% 5 4 1 1 15 10% 1460.502 −48.2% 4.02 6.1% 3.73 8.6% 5 3 0 0 043 40% 1727.601 29.0% 3.59 4.3% 3.70 3.4% 5 3 0 1 0
formal validation testing. Although the case subjects in thisstudy were diagnosed with ovarian cancer, it is possible thatthe biomarkers are noncancer specific and could represent aninflammatory response. This would need to be investigatedin subsequent studies.
GlycanFinder algorithms were influenced in part by IgorProcode used for combinatorial glycans model building developed byBrian H. Clowers. Eric D. Dodds helped develop the Fast FourierTransform algorithm use to transform the raw transient data.Sample selection, age matching, and blinding were performed byDonald A. Barkauskas and David M. Rocke. In addition, insightinto the statistical treatment of data was provided by them as well.Anding Fan helped develop an application that produced the rawtransient text data files from instrument specific data files for usein the Glycolyzer. We gratefully acknowledge the financial supportprovided by the National Institute of Health RO1 GM049077.Support was also provided by a gift from the National OvarianCancer Coalition (NOCC), Sacramento Chapter (to G.S.L.); aUC Davis Health Systems Research Award (to K.S.L), and anOvarian Cancer Research Fund (OCRF) Award (to G.S.L). Wealso acknowledge the Gynecologic Oncology Group Tissue Bankfor providing the serum sample sets used in this study.
The authors have declared no conflict of interest.
7 References
[1] Lebrilla, C. B., An, H. J., The prospects of glycan biomark-ers for the diagnosis of diseases. Mol. Biosyst. 2009, 5, 17–20.
[2] Packer, N. H., von der Lieth, C. W., Aoki-Kinoshita, K. F., Le-brilla, C. B. et al., Frontiers in glycomics: bioinformatics andbiomarkers in disease. An NIH white paper prepared fromdiscussions by the focus groups at a workshop on the NIHcampus, Bethesda MD (September 11–13, 2006). Proteomics2008, 8, 8–20.
[3] Turnbull, J. E., Field, R. A., Emerging glycomics technologies.Nat. Chem. Biol. 2007, 3, 74–77.
[4] Barkauskas, D. A., An, H. J., Kronewitter, S. R., de Leoz, M. L.et al., Detecting glycan cancer biomarkers in serum samplesusing MALDI FT-ICR mass spectrometry data. Bioinformatics2009, 25, 251–257.
[5] de Leoz, M. L. A., An, H. J., Kronewitter, S., Kim, J. et al., Gly-comic approach for potential biomarkers on prostate cancer:profiling of N-linked glycans in human sera and pRNS celllines. Disease Markers 2008, 25, 243–258.
[6] Alley, W. R., Jr., Madera, M., Mechref, Y., Novotny, M.V., Chip-based reversed-phase liquid chromatography-massspectrometry of permethylated N-linked glycans: a potentialmethodology for cancer-biomarker discovery. Anal. Chem.2010, 82, 5095–5106.
[7] An, H. J., Miyamoto, S., Lancaster, K. S., Kirmiz, C. et al.,Profiling of glycans in serum for the discovery of potentialbiomarkers for ovarian cancer. J. Proteome Res. 2006, 5,1626–1635.
[8] Bones, J., Mittermayr, S., O’Donoghue, N., Guttman, A.et al., Ultra performance liquid chromatographic profilingof serum N-glycans for fast and efficient identification ofcancer associated alterations in glycosylation. Anal. Chem.2010, 82, 10208–10215.
[9] An, H. J., Kronewitter, S. R., de Leoz, M. L. A., Lebrilla, C.B., Glycomics and disease markers. Curr. Opin. Chem. Biol.2009, 13, 601–607.
[10] Lebrilla, C. B., An, H. J., The prospects of glycan biomarkersfor the diagnosis of diseases. Mol. Biosyst. 2009, 5, 17–20.
[11] Li, B., An, H. J., Kirmiz, C., Lebrilla, C. B. et al., Glycopro-teomic analyses of ovarian cancer cell lines and sera fromovarian cancer patients show distinct glycosylation changesin individual proteins. J. Proteome Res. 2008, 7, 3776–3788.
[12] Meany, D. L., Zhang, Z., Sokoll, L. J., Zhang, H. et al., Glyco-proteomics for prostate cancer detection: changes in serumPSA glycosylation patterns. J. Proteome Res. 2008, 8, 613–619.
C© 2012 WILEY-VCH Verlag GmbH & Co. KGaA, Weinheim www.proteomics-journal.com
Proteomics 2012, 12, 2523–2538 2537
[13] Saldova, R., Royle, L., Radcliffe, C. M., Abd Hamid, U. M.et al., Ovarian cancer is associated with changes in glyco-sylation in both acute-phase proteins and IgG. Glycobiology2007, 17, 1344–1356.
[14] Cooper, C. A., Gasteiger, E., Packer, N. H., GlycoMod—a soft-ware tool for determining glycosylation compositions frommass spectrometric data. Proteomics 2001, 1, 340–349.
[15] Cooper, C. A., Harrison, M. J., Wilkins, M. R., Packer, N.H., GlycoSuiteDB: a new curated relational database of gly-coprotein glycan structures and their biological sources.Nucleic Acids Res. 2001, 29, 332–335.
[16] Cooper, C. A., Joshi, H. J., Harrison, M. J., Wilkins, M. R. et al.,GlycoSuiteDB: a curated relational database of glycoproteinglycan structures and their biological sources. 2003 update.Nucleic Acids Res. 2003, 31, 511–513.
[17] Lo, A., Bunsmann, P., Bohne, A., Lo, A. et al., SWEET-DB:an attempt to create annotated data collections for carbohy-drates. Nucleic Acids Res. 2002, 30, 405–408.
[18] Cooper, C. A., Wilkins, M. R., Williams, K. L., Packer, N. H.,BOLD—a biological O-linked glycan database. Electrophore-sis 1999, 20, 3589–3598.
[19] Hashimoto, K., Goto, S., Kawano, S., Aoki-Kinoshita, K.et al., KEGG as a glycome informatics resource. Glycobi-ology 2006, 16, 63R–70R.
[20] von der Lieth, C. W., Freire, A. A., Blank, D., Campbell, M. P.et al., EUROCarbDB: an open-access platform for glycoinfor-matics. Glycobiology 2011, 21, 493–502.
[21] Goldberg, D., Sutton-Smith, M., Paulson, J., Dell, A.,Automatic annotation of matrix-assisted laser desorp-tion/ionization N-glycan spectra. Proteomics 2005, 5, 865–875.
[22] Kronewitter, S. R., An, H. J., de Leoz, M. L., Lebrilla, C. B. et al.,The development of retrosynthetic glycan libraries to profileand classify the human serum N-linked glycome. Proteomics2009, 9, 2986–2994.
[23] Ethier, M., Figeys, D., Perreault, H., N-glycosylation analysisusing the StrOligo algorithm. Methods Mol. Biol. 2006, 328,187–197.
[24] Lapadula, A. J., Hatcher, P. J., Hanneman, A. J., Ashline,D. J. et al., Congruent strategies for carbohydrate sequenc-ing. 3. OSCAR: an algorithm for assigning oligosaccha-ride topology from MSn data. Anal. Chem. 2005, 77, 6271–6279.
[25] Zhang, H., Singh, S., Reinhold, V. N., Congruent strategiesfor carbohydrate sequencing. 2. FragLib: an MSn spectrallibrary. Anal. Chem. 2005, 77, 6263–6270.
[26] Maass, K., Ranzinger, R., Geyer, H., Lieth, C.-W. v. d. et al.,“Glyco-Peakfinder”—denovo composition analysis of glyco-conjugates. Proteomics 2007, 7, 4435–4444.
[27] Lohmann, K. K., Lieth, C.-W. v. d., GLYCO-FRAGMENT: a webtool to support the interpretation of mass spectra of complexcarbohydrates. Proteomics 2003, 3, 2028–2035.
[28] Lohmann, K. K., von der Lieth, C.-W., GlycoFragment andGlycoSearchMS: web tools to support the interpretation ofmass spectra of complex carbohydrates. Nucleic Acids Res.2004, 32, W261–W266.
[29] Ceroni, A., Maass, K., Geyer, H., Geyer, R. et al., GlycoWork-bench: a tool for the computer-assisted annotation of massspectra of glycans. J. Proteome Res. 2008, 7, 1650–1659.
[30] Vakhrushev, S. Y., Dadimov, D., Peter-Katalinic, J., Softwareplatform for high-throughput glycomics. Anal. Chem. 2009,81, 3252–3260.
[31] Moore, R. G., Jabre-Raughley, M., Brown, A. K., Robison, K.M. et al., Comparison of a novel multiple marker assay vsthe Risk of Malignancy Index for the prediction of epithelialovarian cancer in patients with a pelvic mass. Am. J. Obstet.Gynecol. 2010, 203, 228.e1–228.e6.
[32] Leiserowitz, G. S., Lebrilla, C., Miyamoto, S., An, H. J. et al.,Glycomics analysis of serum: a potential new biomarkerfor ovarian cancer? Int. J. Gynecol. Cancer 2007, 18, 470–475.
[33] Kronewitter, S. R., de Leoz, M. L., Peacock, K. S., McBride, K.R. et al., Human serum processing and analysis methods forrapid and reproducible N-glycan mass profiling. J. ProteomeRes. 2010, 9, 4952–4959.
[34] Shi, S. D. H., Drader, J. J., Freitas, M. A., Hendrickson, C.L. et al., Comparison and interconversion of the two mostcommon frequency-to-mass calibration functions for Fouriertransform ion cyclotron resonance mass spectrometry. Int.J. Mass Spectrom. 2000, 195–196, 591–598.
[35] Zhang, L. K., Rempel, D., Pramanik, B. N., Gross, M. L., Accu-rate mass measurements by Fourier transform mass spec-trometry. Mass Spectrom. Rev. 2005, 24, 286–309.
[36] Francl, T. J., Sherman, M. G., Hunter, R. L., Locke, M. J. et al.,Experimental determination of the effects of space charge onion cyclotron resonance frequencies. Int. J. Mass Spectrom.1983, 54, 189–199.
[37] Marshall, A. G., Comisarow, M. B., Parisod, G., The-ory of Fourier-transform ion-cyclotron resonance massspectroscopy-Iii. 1. Relaxation and spectral-line shape inFourier-transform ion resonance spectroscopy. J. Chem.Phys. 1979, 71, 4434–4444.
[38] Wehofsky, M., Hoffmann, R., Hubert, M., Spengler, B.,Isotopic deconvolution of matrix-assisted laser desorp-tion/ionization mass spectra for substance-class specificanalysis of complex samples. Eur. J. Mass Spectrom. 2001,7, 39–46.
[39] Maleknia, S. D., Downard, K. M., Charge ratio analysismethod to interpret high resolution electrospray Fouriertransform—ion cyclotron resonance mass spectra. Int. J.Mass Spectrom. 2005, 246, 1–9.
[40] Zhang, X. A., Asara, J. M., Adamec, J., Ouzzani, M.et al., Data pre-processing in liquid chromatography-massspectrometry-based proteomics. Bioinformatics 2005, 21,4054–4059.
[41] Kaur, P., O’Connor, P. B., Algorithms for automatic interpre-tation of high resolution mass spectra. J. Am. Soc. MassSpectrom. 2006, 17, 459–468.
[42] Tabb, D. L., Shah, M. B., Strader, M. B., Connelly, H. M. et al.,Determination of peptide and protein ion charge states byFourier transformation of isotope-resolved mass spectra. J.Am. Soc. Mass Spectrom. 2006, 17, 903–915.
C© 2012 WILEY-VCH Verlag GmbH & Co. KGaA, Weinheim www.proteomics-journal.com

2538 S. R. Kronewitter et al. Proteomics 2012, 12, 2523–2538
[43] Horn, D. M., Zubarev, R. A., McLafferty, F. W., Automatedreduction and interpretation of high resolution electrospraymass spectra of large molecules. J. Am. Soc. Mass Spec-trom. 2000, 11, 320–332.
[44] Du, P. C., Angeletti, R. H., Automatic deconvolution ofisotope-resolved mass spectra using variable selection andquantized peptide mass distribution. Anal. Chem. 2006, 78,3385–3392.
[45] Senko, M. W., Beu, S. C., McLafferty, F. W., Determina-tion of monoisotopic masses and ion populations for largebiomolecules from resolved isotopic distributions. J. Am.Soc. Mass Spectrom. 1995, 6, 229–233.
[46] An, H. J., Tillinghast, J. S., Woodruff, D. L., Rocke, D. M.et al., A new computer program (GlycoX) to determine si-multaneously the glycosylation sites and oligosaccharideheterogeneity of glycoproteins. J. Proteome Res. 2006, 5,2800–2808.
[47] Chu, C. S., Ninonuevo, M. R., Clowers, B. H., Perkins, P. D.et al., Profile of native N-linked glycan structures from hu-man serum using high performance liquid chromatographyon a microfluidic chip and time-of-flight mass spectrometry.Proteomics 2009, 9, 1939–1951.
[48] Barkauskas, D. A., An, H. J., Kronewitter, S. R., de Leoz, M. L.et al., Detecting glycan cancer biomarkers in serum samplesusing MALDI FT-ICR mass spectrometry data. Bioinformatics2009, 25, 251–257.
[49] Zhu, C. S., Pinsky, P. F., Cramer, D. W., Ransohoff, D. F. et al.,A framework for evaluating biomarkers for early detection:validation of biomarker panels for ovarian cancer. CancerPrev. Res. (Phila.) 2011, 4, 375–383.
[50] Cramer, D. W., Bast, R. C., Jr., Berg, C. D., Diamandis, E. P.et al., Ovarian cancer biomarker performance in prostate,lung, colorectal, and ovarian cancer screening trial speci-mens. Cancer Prev. Res. (Phila.) 2011, 4, 365–374.
[51] Box, G. E. P., Muller, M. E., A note on the generation ofrandom normal deviates. Ann. Math. Statist. 1958, 29, 610–611.
[52] Gornik, O., Royle, L., Harvey, D. J., Radcliffe, C. M. et al.,Changes of serum glycans during sepsis and acute pancre-atitis. Glycobiology 2007, 17, 1321–1332.
[53] Kim, Y. G., Jeong, H. J., Jang, K. S., Yang, Y. H. et al., Rapidand high-throughput analysis of N-glycans from ovariancancer serum using a 96-well plate platform. Anal. Biochem.2009, 391, 151–153.
[54] Dwek, M. V., Ross, H. A., Leathem, A. J., Proteome and glyco-sylation mapping identifies post-translational modificationsassociated with aggressive breast cancer. Proteomics 2001,1, 756–762.
[55] Kyselova, Z., Mechref, Y., Al Bataineh, M. M., Dobrolecki, L.E. et al., Alterations in the serum glycome due to metastaticprostate cancer. J. Proteome Res. 2007, 6, 1822–1832.
[56] Alley, W. R., Jr., Novotny, M. V., Glycomic analysis of sialicacid linkages in glycans derived from blood serum glyco-proteins. J. Proteome Res. 2010, 9, 3062–3072.
[57] De Graaf, T. W., Van der Stelt, M. E., Anbergen, M. G., vanDijk, W., Inflammation-induced expression of sialyl Lewis X-containing glycan structures on alpha 1-acid glycoprotein(orosomucoid) in human sera. J. Exp. Med. 1993, 177, 657–666.
[58] Brinkman-van der Linden, E. C. M., de Haan, P. F., Have-naar, E. C., van Dijk, W., Inflammation-induced expressionof sialyl Lewisx is not restricted to �1-acid glycoproteinbut also occurs to a lesser extent on �1-antichymotrypsinand haptoglobin. Glycoconjugate J. 1998, 15, 177–182.
[59] Ohyama, C., Tsuboi, S., Fukuda, M., Dual roles of sialyl LewisX oligosaccharides in tumor metastasis and rejection by nat-ural killer cells. EMBO J. 1999, 18, 1516–1525.
C© 2012 WILEY-VCH Verlag GmbH & Co. KGaA, Weinheim www.proteomics-journal.com