Embed Size (px)
Citation preview
RESEARCH ON FINANCIAL BEHAVIORS AND USE OF
SMALL-DOLLAR LOANS AND FINANCIAL SERVICES
LITERATURE REVIEW

Prepared for the US Department of the Treasury by the Urban Institute, 2010Authors of this report are:
Brett Theodos, The Urban Institute
Jessica F. Compton, The Urban Institute
Abstract
This literature review provides an overview of research on the following small-dollar credit products:auto title loans, pawnshops, payday lending, refund anticipation loans (RALs) and checks (RACs), andrent-to-own (RTO). This review includes recently published research. It is not intended as an exhaustivetreatment of these topics, but is designed to highlight key findings relevant for additional research.
Acknowledgments
This report was completed under contract to the U.S. Department of the Treasury under Order NumberGS23F8198H/T09BPA017, with funds authorized by the U.S. Department of the Treasury.
Oversight and review were provided by the U.S. Department of the Treasury’s Office of FinancialEducation and Financial Access. The report benefited from the experience and advice provided bySigne-Mary McKernan and Nancy Pindus.
The Urban Institute is a nonprofit, nonpartisan policy research and educational organization thatexamines the social, economic, and governance problems facing the nation. The views expressed arethose of the authors and should not be attributed to the Urban Institute, its trustees, or its funders.

1
Small-Dollar Loan Products and Financial Services Definitions
Auto Title Loan
Auto title loans are small short-term loans secured by a borrower’s vehicle. The loan amount is usuallybased on the car’s worth. Additional charges, such as processing fees, may apply and a lump sumpayment is usually due at the end of the loan term. The borrower generally keeps possession of the carduring the term of the loan but leaves the title with the lender as security for repayment of the loan.The lender may require a copy of the keys to facilitate repossession in the event of default. If theborrower is unable to repay the loan at maturity, the lender frequently renews the loan whileintroducing additional charges. If the borrower continues to not pay, the lender may repossess the car.Also, rather than making the full payment at the end of the loan term, borrowers may pay the accruedinterest and roll over the principal amount into a new loan which may also introduce additional fees tothe consumer. Title lenders may also refer to their loans as “sales and leasebacks,” “title pawns,” or“motor vehicle equity lines of credit.”1 Auto title loans have a typical term of one month and loan sizesrange between $600 and $2,500.2 One survey found that 7 percent of the U.S. population reported usingan auto title loan in the past five years (Applied Research and Consulting 2009).
Pawnshop Loan
The pawn process allows customers to pledge property as collateral and, in return, receive a small-dollarloan. Pawn loans are made on everything from jewelry to electronics. If the pawn customer chooses toredeem the loan, the collateral is returned upon repayment of the loan and the regulated fee. Theoption to redeem the collateral remains with the customer until the expiration of the contract. If thecustomer elects not to redeem his or her collateral by repaying the loan, there is no credit consequenceto the borrower and the items are sold by the pawnbroker to retail consumers. Pawn transactions arethe only type of consumer credit that requires reporting to local law enforcement agencies. In manystates this reporting is required daily and must include personal information about the consumer (i.e.,ethnicity, gender, address). Much of this information qualifies as nonpublic personal information underfederal privacy law and is entitled to protection as such.3 Additional reporting and research onpawnbrokers has noted the increasing numbers of pawn sales through the Internet on sites such as eBay(see Caskey 2005). The typical pawnshop loan lasts for one month and is worth less than $100.4
According to a report by Applied Research and Consulting (2009), 8 percent of people in the U.S. reportusing a pawn loan in the past five years.
Payday Loan
A payday loan is a small unsecured, short-term loan that is usually repaid on the borrower’s nextpayday. Customers are required to supply a few supporting documents, including proof of a regularincome, a personal checking account, and identification. When the customer is approved for the paydayloan, he or she writes a personal check for the amount of the advance plus a fee. The lender advances
1Amanda Quester and Jean Ann Fox, 2005, Car Title Lending: Driving Borrowers to Financial Ruin, Washington DC:
The Center for Responsible Lending and The Consumer Federation of America.2
South Carolina Appleseed Legal Justice Center, 2004, Auto Title Loans and the Law,Columbia: South CarolinaAppleseed Legal Justice Center.3
National Pawnbrokers Association, http://www.nationalpawnbrokers.org.4
National Pawnbrokers Association, 2008, Pawnbroking Industry Overview: Meeting the Needs of America’sWorking Families, Keller, TX: National Pawnbrokers Association.

2
the customer funds immediately but holds the check until an agreed -pon date, usually within two tofour weeks, when the borrower receives his or her next paycheck. Payday loans average $250–$350,typically for two weeks. For a $100 loan, fees average $15—$20 (Flannery and Samolyk 2005). Usingdata from a nationally representative survey, Applied Research and Consulting (2009) found that 5percent of respondents reported using a payday loan in the past five years.
Refund Anticipation Loan (RAL) or Check (RAC)
A refund anticipation loan (RAL) is money borrowed by a taxpayer from a lender based on the taxpayer’santicipated income tax refund. RALs are interest-bearing loans that allow a taxpayer to receive his or herrefund from a lender before receiving it from the IRS. With refund anticipation checks (RACs), the bankopens a temporary bank account into which the IRS directly deposits the refund check. The bank waitsuntil the IRS directly deposits the consumer’s refund into the account and then issues the consumer apaper check and closes the account. The consumer picks up the check from the tax-preparer’s office.
A tax preparer arranging a RAL or RAC must secure the taxpayer’s written consent to disclose taxinformation to the lending financial institution in connection with the application. Tax preparers candeduct tax-preparation fees and additional RAL/RAC preparation fees from the customer, leaving thefinal RAL/RAC to be borrowed. When assisting a taxpayer in applying for a RAL or RAC, the provider maycharge a flat fee for that assistance. The fee must be identical for all customers and must not relate tothe amount of the refund or the financial product. If a taxpayer is approved, then a RAL is directlydeposited within several business days to the taxpayer’s account. If a taxpayer is approved for a RAC,then the taxpayer receives a check (either mailed or on the spot). If the RAL or RAC customer does notreceive the expected tax return amount as calculated by the tax preparer, he or she is liable to thelender for additional interest and other fees, as applicable for receiving the RAL/RAC.5 Nationally, 8percent of people report receiving a RAL in the past five years (Applied Research and Consulting 2009).
Rent-to-Own (RTO) Agreement
The rent-to-own (RTO) industry (also known as the rental-purchase industry) consists of retailers thatrent furniture, appliances, home electronics, and jewelry. RTO transactions provide immediate access tosuch goods for a relatively low weekly (or biweekly) or monthly payment without credit checks or adown payment. This self-renewing weekly or monthly lease for rented merchandise provides thecustomer with the option to purchase the good by continued payments for a specified period of time,usually 12 to 24 months, or by early payment of some specified proportion of the remaining leasepayments. The customer has no obligation to continue payment beyond the current weekly or monthlyperiod. A nationally representative survey found that 5 percent of respondents reported using an RTOstore in the past five years (Applied Research and Consulting 2009).
5Internal Revenue Service, http://www.irs.gov, and Chi Chi Wu, 2004, “Building a Better Refund Anticipation
Check: Options for VITA Sites,” Boston: National Consumer Law Center.
Auto Title Loans 3
Small-Dollar Loan Products and Financial Services: Literature Review MatrixEmpirical Studies of Auto Title Loans
Source DataSample/Study
population Method Findings Acc
ess
Co
nsu
me
rb
eh
avi
or/
Sub
stit
ute
s
Co
sts
Fin
an
cia
lli
tera
cy
Loca
tio
nP
oli
cy
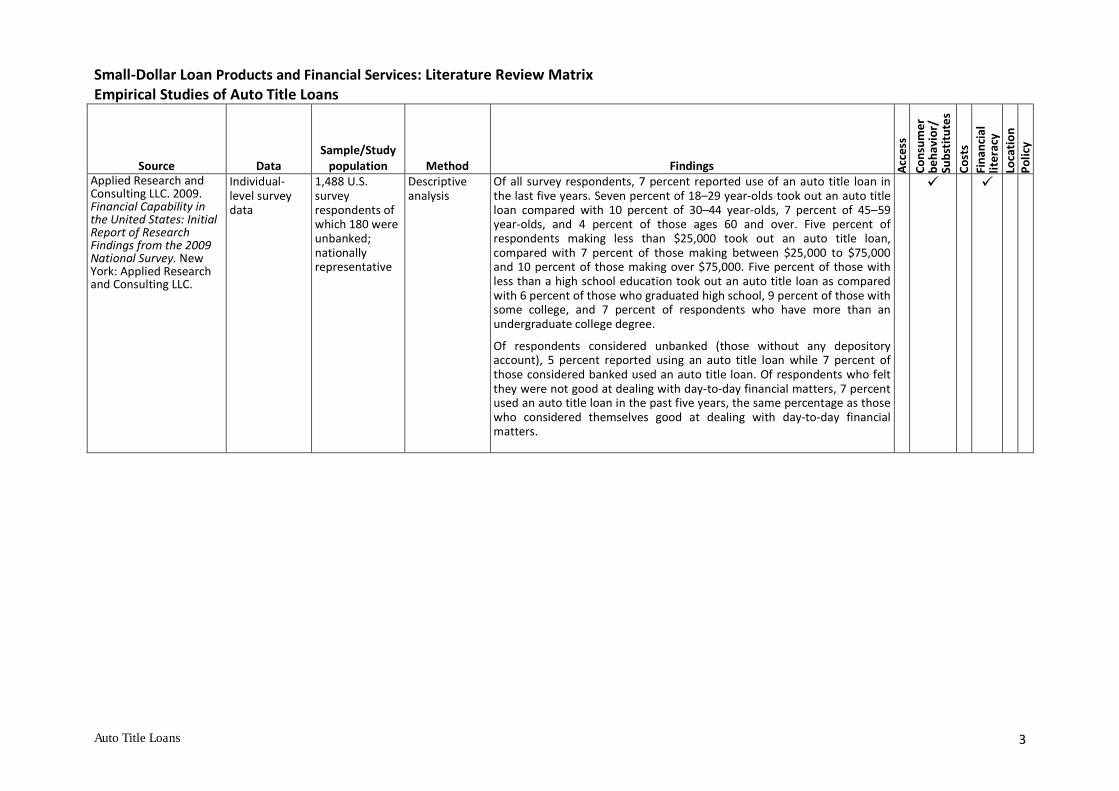
Applied Research andConsulting LLC. 2009.Financial Capability inthe United States: InitialReport of ResearchFindings from the 2009National Survey. NewYork: Applied Researchand Consulting LLC.
Individual-level surveydata
1,488 U.S.surveyrespondents ofwhich 180 wereunbanked;nationallyrepresentative
Descriptiveanalysis
Of all survey respondents, 7 percent reported use of an auto title loan inthe last five years. Seven percent of 18–29 year-olds took out an auto titleloan compared with 10 percent of 30–44 year-olds, 7 percent of 45–59year-olds, and 4 percent of those ages 60 and over. Five percent ofrespondents making less than $25,000 took out an auto title loan,compared with 7 percent of those making between $25,000 to $75,000and 10 percent of those making over $75,000. Five percent of those withless than a high school education took out an auto title loan as comparedwith 6 percent of those who graduated high school, 9 percent of those withsome college, and 7 percent of respondents who have more than anundergraduate college degree.
Of respondents considered unbanked (those without any depositoryaccount), 5 percent reported using an auto title loan while 7 percent ofthose considered banked used an auto title loan. Of respondents who feltthey were not good at dealing with day-to-day financial matters, 7 percentused an auto title loan in the past five years, the same percentage as thosewho considered themselves good at dealing with day-to-day financialmatters.

Auto Title Loans 4
Small-Dollar Loan Products and Financial Services: Literature Review MatrixEmpirical Studies of Auto Title Loans
Source DataSample/Study
population Method Findings Acc
ess
Co
nsu
me
rb
eh
avi
or/
Sub
stit
ute
s
Co
sts
Fin
an
cia
lli
tera
cy
Loca
tio
nP
oli
cy
Feltner, T. 2007. DebtDetour: The AutomobileTitle Lending Industry inIllinois. Chicago, IL:Woodstock Institute andthe Public ActionFoundation.
Illinois courtcases
61 Illinois autotitle loanborrowers whowere taken tocourt in 2005 bya licensed autotitle loancompany
Descriptiveanalysis
Nearly all the loans referenced in the Illinois court cases had terms of morethan 60 days, allowing them to circumvent strong consumer protectionpassed by the state in 2001. Of the loans reviewed, 93 percent werestructured so that the borrower made monthly, interest-only paymentsand a final balloon payment of the entire loan principal. These loans maycontribute to a series of refinances or renewals commonly described byconsumer advocates as a cycle of debt. Of the loans reviewed, 23 percentwere used to repay a previous loan with the same lender.
Overall, auto title loans were more likely to be made to male borrowersliving in moderate- to middle-income communities and made against older,high-mileage vehicles. The average borrower pursued in court by a titlelender faced median damages of $5,462 on a median loan of just $1,500—nearly four times the original loan principal. Included in this amount is the$268 in court and attorney fees. Borrowers often fail to appear in court,resulting in a default judgment in favor of the lender; nearly half (48percent) of reviewed cases were granted default judgments. Eighteenpercent of default auto title loans resulted in the repossession or loss ofthe borrower’s vehicle.
Fox, J. A., and E. Guy.2005. Driven into Debt:CFA Car Title Loan Storeand Online Survey.Washington, DC:Consumer Federation ofAmerica.
Individual-level data ofstore staff;review ofonline titlelenders; statelaws and courtdecisions forall 50 states
81 auto titlestores in 11states
Descriptiveanalysis
Over two dozen title lending bills were filed during the 2005 statelegislative season. To regulate the auto title lending industry, 13 stateshave either enacted restrictive title loan laws or court decisions haveestablished that title loans are regulated under pawn loan laws. Another 31states have small loan rate cap laws or usury limits that restrain car titleloan rates.
Fox and Guy find that title lenders use several loan structures that evadestate usury or small-loan rate caps. In some cases, lenders size their loansto fall outside rate-cap limits. In South Carolina, auto title loans are called601 loans because the threshold for small loan rate caps is $600. In otherstates, auto title lenders repackage single-payment title loans as lines ofcredit to get around rate caps. In Virginia, Iowa, and Kansas, auto title loancompanies define the industry as open-ended credit. This allows suchcompanies to benefit from the deregulation of credit cards within thosestates. In other states, title lenders who make loans via the Internet exporthigh-cost loans to consumers in protected states by using laws from stateswith no rate caps.
Auto Title Loans 5
Small-Dollar Loan Products and Financial Services: Literature Review MatrixEmpirical Studies of Auto Title Loans
Source DataSample/Study
population Method Findings Acc
ess
Co
nsu
me
rb
eh
avi
or/
Sub
stit
ute
s
Co
sts
Fin
an
cia
lli
tera
cy
Loca
tio
nP
oli
cy
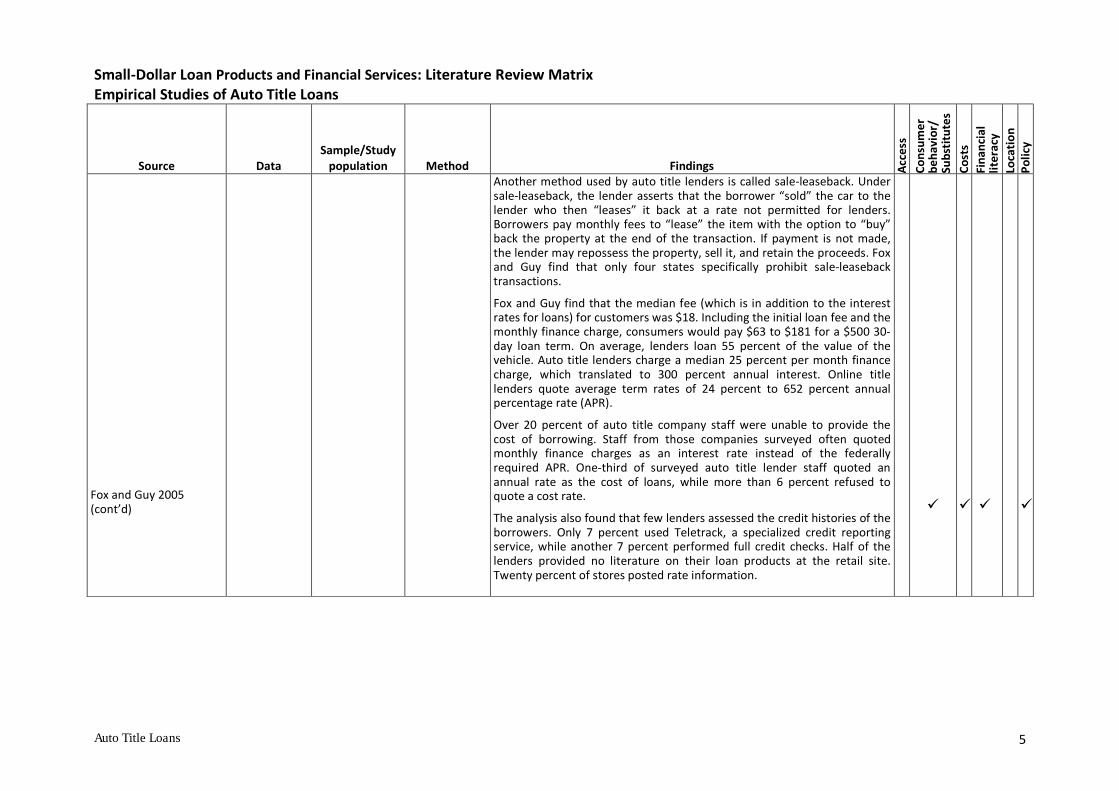
Fox and Guy 2005(cont’d)
Another method used by auto title lenders is called sale-leaseback. Undersale-leaseback, the lender asserts that the borrower “sold” the car to thelender who then “leases” it back at a rate not permitted for lenders.Borrowers pay monthly fees to “lease” the item with the option to “buy”back the property at the end of the transaction. If payment is not made,the lender may repossess the property, sell it, and retain the proceeds. Foxand Guy find that only four states specifically prohibit sale-leasebacktransactions.
Fox and Guy find that the median fee (which is in addition to the interestrates for loans) for customers was $18. Including the initial loan fee and themonthly finance charge, consumers would pay $63 to $181 for a $500 30-day loan term. On average, lenders loan 55 percent of the value of thevehicle. Auto title lenders charge a median 25 percent per month financecharge, which translated to 300 percent annual interest. Online titlelenders quote average term rates of 24 percent to 652 percent annualpercentage rate (APR).
Over 20 percent of auto title company staff were unable to provide thecost of borrowing. Staff from those companies surveyed often quotedmonthly finance charges as an interest rate instead of the federallyrequired APR. One-third of surveyed auto title lender staff quoted anannual rate as the cost of loans, while more than 6 percent refused toquote a cost rate.
The analysis also found that few lenders assessed the credit histories of theborrowers. Only 7 percent used Teletrack, a specialized credit reportingservice, while another 7 percent performed full credit checks. Half of thelenders provided no literature on their loan products at the retail site.Twenty percent of stores posted rate information.
Auto Title Loans 6
Small-Dollar Loan Products and Financial Services: Literature Review MatrixEmpirical Studies of Auto Title Loans
Source DataSample/Study
population Method Findings Acc
ess
Co
nsu
me
rb
eh
avi
or/
Sub
stit
ute
s
Co
sts
Fin
an
cia
lli
tera
cy
Loca
tio
nP
oli
cy
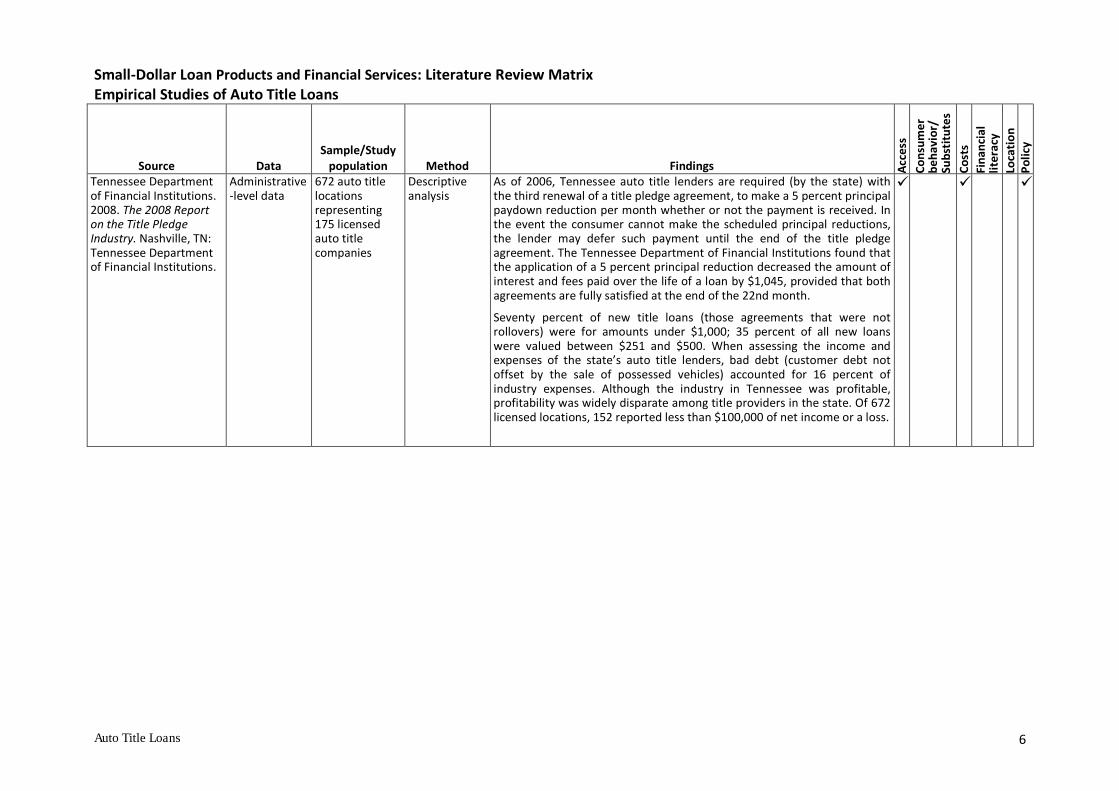
Tennessee Departmentof Financial Institutions.2008. The 2008 Reporton the Title PledgeIndustry. Nashville, TN:Tennessee Departmentof Financial Institutions.
Administrative-level data
672 auto titlelocationsrepresenting175 licensedauto titlecompanies
Descriptiveanalysis
As of 2006, Tennessee auto title lenders are required (by the state) withthe third renewal of a title pledge agreement, to make a 5 percent principalpaydown reduction per month whether or not the payment is received. Inthe event the consumer cannot make the scheduled principal reductions,the lender may defer such payment until the end of the title pledgeagreement. The Tennessee Department of Financial Institutions found thatthe application of a 5 percent principal reduction decreased the amount ofinterest and fees paid over the life of a loan by $1,045, provided that bothagreements are fully satisfied at the end of the 22nd month.
Seventy percent of new title loans (those agreements that were notrollovers) were for amounts under $1,000; 35 percent of all new loanswere valued between $251 and $500. When assessing the income andexpenses of the state’s auto title lenders, bad debt (customer debt notoffset by the sale of possessed vehicles) accounted for 16 percent ofindustry expenses. Although the industry in Tennessee was profitable,profitability was widely disparate among title providers in the state. Of 672licensed locations, 152 reported less than $100,000 of net income or a loss.
Pawnshop Loans 7
Small-Dollar Loan Products and Financial Services: Literature Review MatrixEmpirical Studies of Pawnshop Loans
Source DataSample/Study
population Method Findings Acc
ess
Co
nsu
me
rB
eh
avi
or/
Sub
stit
ute
sC
ost
s
Fin
an
cia
lli
tera
cy
Loca
tio
nP
oli
cy
Applied Research andConsulting LLC. 2009.Financial Capability inthe United States: InitialReport of ResearchFindings from the 2009National Survey. NewYork: Applied Researchand Consulting LLC.
Individual-level surveydata
1,488 U.S.surveyrespondents ofwhich 180 wereunbanked;nationallyrepresentative
Descriptiveanalysis
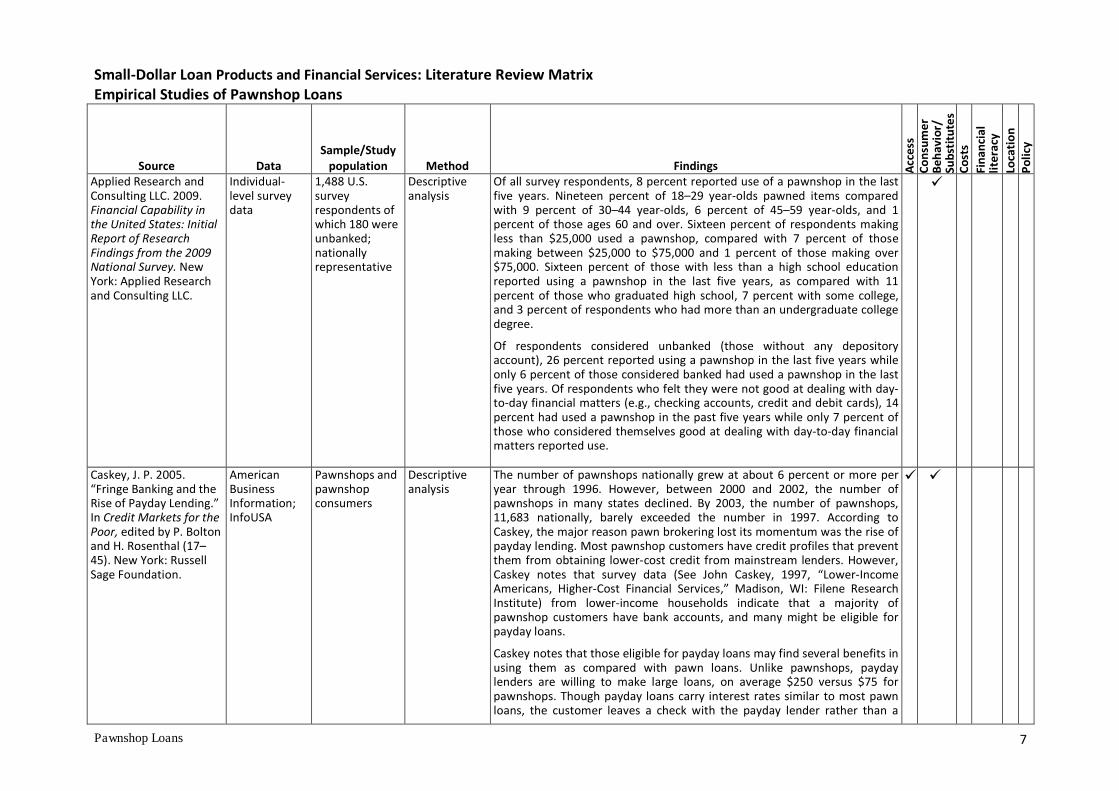
Of all survey respondents, 8 percent reported use of a pawnshop in the lastfive years. Nineteen percent of 18–29 year-olds pawned items comparedwith 9 percent of 30–44 year-olds, 6 percent of 45–59 year-olds, and 1percent of those ages 60 and over. Sixteen percent of respondents makingless than $25,000 used a pawnshop, compared with 7 percent of thosemaking between $25,000 to $75,000 and 1 percent of those making over$75,000. Sixteen percent of those with less than a high school educationreported using a pawnshop in the last five years, as compared with 11percent of those who graduated high school, 7 percent with some college,and 3 percent of respondents who had more than an undergraduate collegedegree.
Of respondents considered unbanked (those without any depositoryaccount), 26 percent reported using a pawnshop in the last five years whileonly 6 percent of those considered banked had used a pawnshop in the lastfive years. Of respondents who felt they were not good at dealing with day-to-day financial matters (e.g., checking accounts, credit and debit cards), 14percent had used a pawnshop in the past five years while only 7 percent ofthose who considered themselves good at dealing with day-to-day financialmatters reported use.
Caskey, J. P. 2005.“Fringe Banking and theRise of Payday Lending.”In Credit Markets for thePoor, edited by P. Boltonand H. Rosenthal (17–45). New York: RussellSage Foundation.
AmericanBusinessInformation;InfoUSA
Pawnshops andpawnshopconsumers
Descriptiveanalysis
The number of pawnshops nationally grew at about 6 percent or more peryear through 1996. However, between 2000 and 2002, the number ofpawnshops in many states declined. By 2003, the number of pawnshops,11,683 nationally, barely exceeded the number in 1997. According toCaskey, the major reason pawn brokering lost its momentum was the rise ofpayday lending. Most pawnshop customers have credit profiles that preventthem from obtaining lower-cost credit from mainstream lenders. However,Caskey notes that survey data (See John Caskey, 1997, “Lower-IncomeAmericans, Higher-Cost Financial Services,” Madison, WI: Filene ResearchInstitute) from lower-income households indicate that a majority ofpawnshop customers have bank accounts, and many might be eligible forpayday loans.
Caskey notes that those eligible for payday loans may find several benefits inusing them as compared with pawn loans. Unlike pawnshops, paydaylenders are willing to make large loans, on average $250 versus $75 forpawnshops. Though payday loans carry interest rates similar to most pawnloans, the customer leaves a check with the payday lender rather than a
Pawnshop Loans 8
Small-Dollar Loan Products and Financial Services: Literature Review MatrixEmpirical Studies of Pawnshop Loans
Source DataSample/Study
population Method Findings Acc
ess
Co
nsu
me
rB
eh
avi
or/
Sub
stit
ute
sC
ost
s
Fin
an
cia
lli
tera
cy
Loca
tio
nP
oli
cy
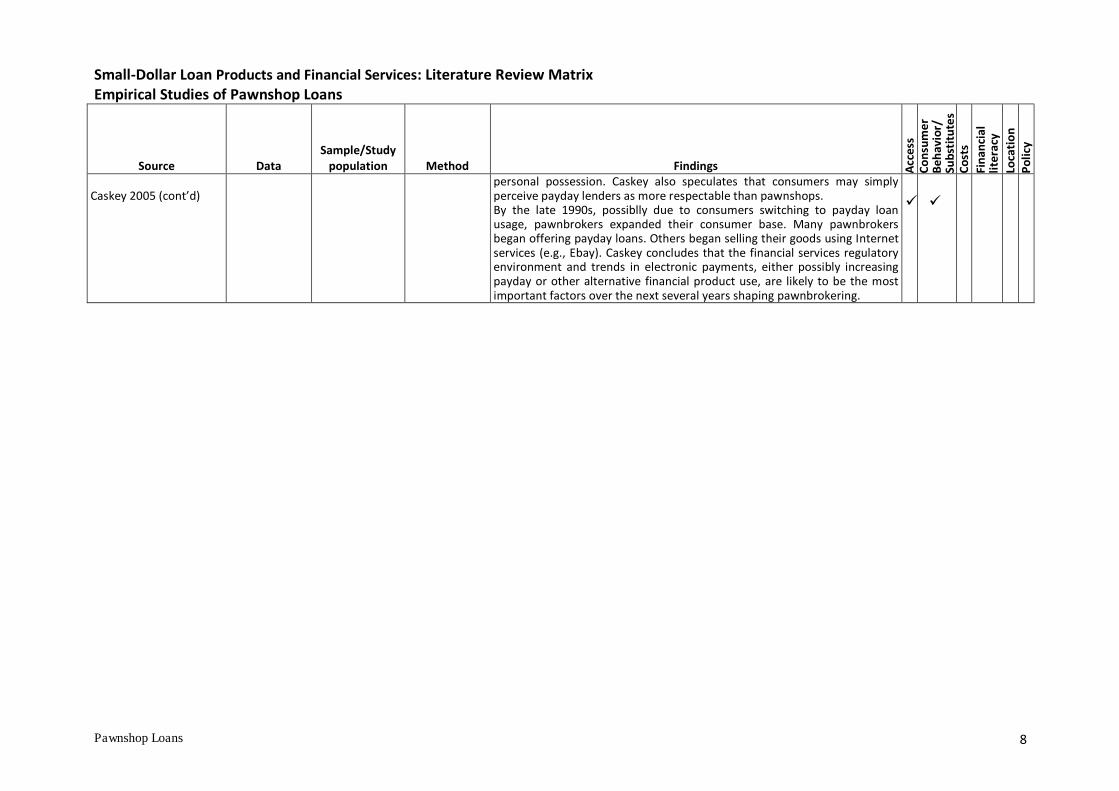
Caskey 2005 (cont’d)personal possession. Caskey also speculates that consumers may simplyperceive payday lenders as more respectable than pawnshops.By the late 1990s, possiblly due to consumers switching to payday loanusage, pawnbrokers expanded their consumer base. Many pawnbrokersbegan offering payday loans. Others began selling their goods using Internetservices (e.g., Ebay). Caskey concludes that the financial services regulatoryenvironment and trends in electronic payments, either possibly increasingpayday or other alternative financial product use, are likely to be the mostimportant factors over the next several years shaping pawnbrokering.

Pawnshop Loans 9
Small-Dollar Loan Products and Financial Services: Literature Review MatrixEmpirical Studies of Pawnshop Loans
Source DataSample/Study
population Method Findings Acc
ess
Co
nsu
me
rB
eh
avi
or/
Sub
stit
ute
sC
ost
s
Fin
an
cia
lli
tera
cy
Loca
tio
nP
oli
cy
FDICUnbanked/UnderbankedSurvey Study Group.2009. FDIC NationalSurvey of Unbanked andUnderbankedHouseholds.Washington, DC: FederalDeposit InsuranceCorporation.
Unbanked/UnderbankedSupplement tothe CurrentPopulationSurvey
47,000 U.S.householdssurveyed in2009; nationallyrepresentative
Descriptiveanalysis
Roughly one out of six unbanked households, those currently without achecking or savings account, have obtained funds by selling items atpawnshops in the last five years. Previously banked households were morelikely to have sold items at a pawnshop than never-banked households.About one-fifth of previously banked households (21 percent) have solditems at pawnshops compared with 8 percent of never-banked households.In contrast to other alternative financial service (AFS) products, pawnshopstend to be used much less frequently. About 20 percent of unbankedhouseholds that sold items at pawnshops did so more than once or twice ayear, and nearly half of unbanked households that have sold items atpawnshops almost never did so.
Approximately 16 percent of underbanked households, those that have abank account but rely on alternative financial products, reported usingpawnshops within the last five years. Compared with other underbankedhouseholds that use alternative financial products, underbanked householdsthat pawned did so infrequently. Only 13 percent of underbankedhouseholds that use pawnshops do so at least a few times a year. This is justover one-third of the number of underbanked households who reported useof a payday loan a few times a year in the last five years. Thirty-threepercent of underbanked households who pawned did so once or twice ayear. Over half (55 percent) of pawnshop users pawned almost never.
Of underbanked households that used pawnshops in the last five years, 38percent did so because they felt it was easier than qualifying for a bank loan.Thirteen percent of underbanked households turned to pawnbrokersbecause they could not qualify for a bank loans. Just over 20 percent ofunderbanked pawn users felt that pawnshops are more convenient thanbanks. Nearly 20 percent of underbanked households had other reasons forusing pawnshops.

Pawnshop Loans 10
Small-Dollar Loan Products and Financial Services: Literature Review MatrixEmpirical Studies of Pawnshop Loans
Source DataSample/Study
population Method Findings Acc
ess
Co
nsu
me
rB
eh
avi
or/
Sub
stit
ute
sC
ost
s
Fin
an
cia
lli
tera
cy
Loca
tio
nP
oli
cy
Fellowes, M., and M.Mabanta. 2008. Bankingon Wealth:America’s New RetailBanking Infrastructureand Its Wealth-BuildingPotential. Washington,DC: BrookingsInstitution.
FDICInstitutionDirectory;infoUSA;store-leveldata fromstate andfederallicensingagency
Census tractlocations ofbanks, creditunions, paydayloan providers,pawnshops, andcheck cashers in2007
Descriptiveanalysis;simulationmodels
There are more than 10,300 pawnshops in business. Of these locations,more than 46 percent are in low-income neighborhoods and another 30percent are in lower-middle-income neighborhoods. The authors suggestthat this finding may be an indication of pawnshops' mostly moderate- andlower-income customer base. Fellowes and Mabanta also find that about 93percent of pawnshops are located within one mile of a bank or credit unionbranch, and 80 percent are located in the same neighborhood as a bank orcredit union branch. This trend is only modestly different acrossneighborhood income groups, indicating that pawnshops are as likely to beclose to branches in low-income neighborhoods as they are in higher-incomeneighborhoods.
Johnson, R. W., and D. P.Johnson. 1998.Pawnbroking in the U.S.:A Profile of Customers.Washington, DC:Georgetown University,Credit Research Center.
Individual-level surveydata
1,820pawnshopcustomers whohave borrowedwithin the last12 months orwho are awareof and shop atpawnshops butdo not borrowmoney there, at9 differentpawnshops in 6selected states
Descriptiveanalysis
Johnson and Johnson believe that pawnshop customers comprise anespecially vulnerable population and lack sufficient alternatives for short-term loans. As reported from consumer surveys, the main reason individualsborrow from pawnshops instead of banks is that they have a much betterchance of getting the loan they need. Correspondingly, Johnson and Johnsonfind that a high percentage of pawn borrowers who have applied for creditelsewhere have been rejected and express a desire to avoid the credit checkthat is part of most lending procedures. In addition, or perhaps as a result,many are uncomfortable with aspects of established financial institutions.Over 50 percent of survey respondents learned about the pawnshop fromthe shop sign.
The most frequent pattern of pawnshop customer usage is borrowing for afew weeks or a month, redeeming the pawns then later, borrowing againand redeeming again. Household possessions are used in lieu of savingsaccounts and in lieu of credit checks. However, pawnshops meet only theneeds for short-term blips in the household’s finances. Consumers alsoreported that their most common alternative to pawning is to seek fundsfrom friends or relatives.
Their survey found that pawnshop customers tend to have largerhouseholds; are more likely to have had a divorce, separation, orwidowhood or to have never been married; and have less education thantheir cohorts. The survey also found that the majority of pawnshopcustomers are ages 25–44. Johnson and Johnson note that this age rangerepresents the family-raising stage of life when the demands upon ahousehold are frequently greater than the income.
Pawnshop Loans 11
Small-Dollar Loan Products and Financial Services: Literature Review MatrixEmpirical Studies of Pawnshop Loans
Source DataSample/Study
population Method Findings Acc
ess
Co
nsu
me
rB
eh
avi
or/
Sub
stit
ute
sC
ost
s
Fin
an
cia
lli
tera
cy
Loca
tio
nP
oli
cy
Johnson and Johnson1998 (cont’d)
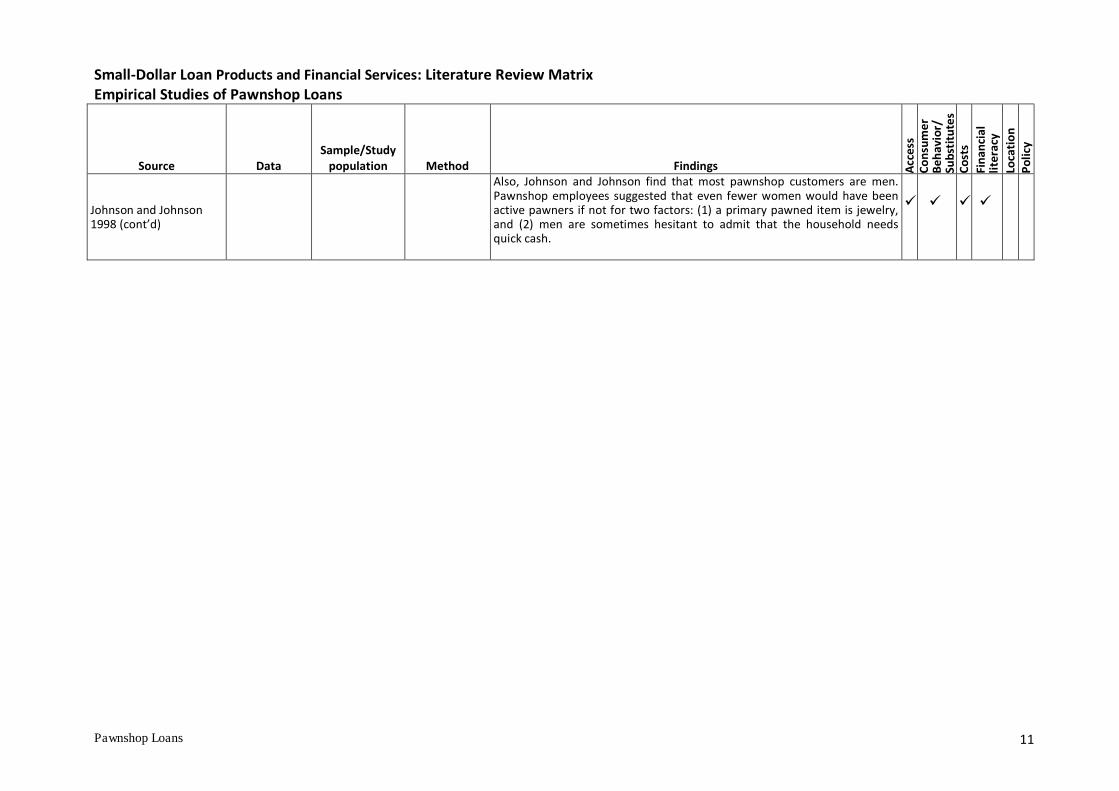
Also, Johnson and Johnson find that most pawnshop customers are men.Pawnshop employees suggested that even fewer women would have beenactive pawners if not for two factors: (1) a primary pawned item is jewelry,and (2) men are sometimes hesitant to admit that the household needsquick cash.
Payday Loans 12
Small-Dollar Loan Products and Financial Services: Literature Review MatrixEmpirical Studies of Payday Loans
Source DataSample/Study
population Method Findings Acc
ess
Co
nsu
me
rB
eh
avi
or/
Sub
stit
ute
sC
ost
s
Fin
an
cia
lli
tera
cy
Loca
tio
nP
oli
cy
Agarwal, S., P. M. Skiba,and J. Tobacman. 2009.“Rationality in theConsumer CreditMarket: Payday Loansand Credit Cards—NewLiquidity and CreditScoring Puzzles?”American EconomicReview: Papers &Proceedings 99(2): 412–17.
Individual-levelcredit cardaccount datafrom a largeU.S. bank and apayday loanprovider
102,779payday loanborrowers and143,228 creditcard accountholders withinthe stateswhere thepayday lenderoperates;matchedsample of3,090 people
Logitregression
DV(dependentvariable):Credit carddefault
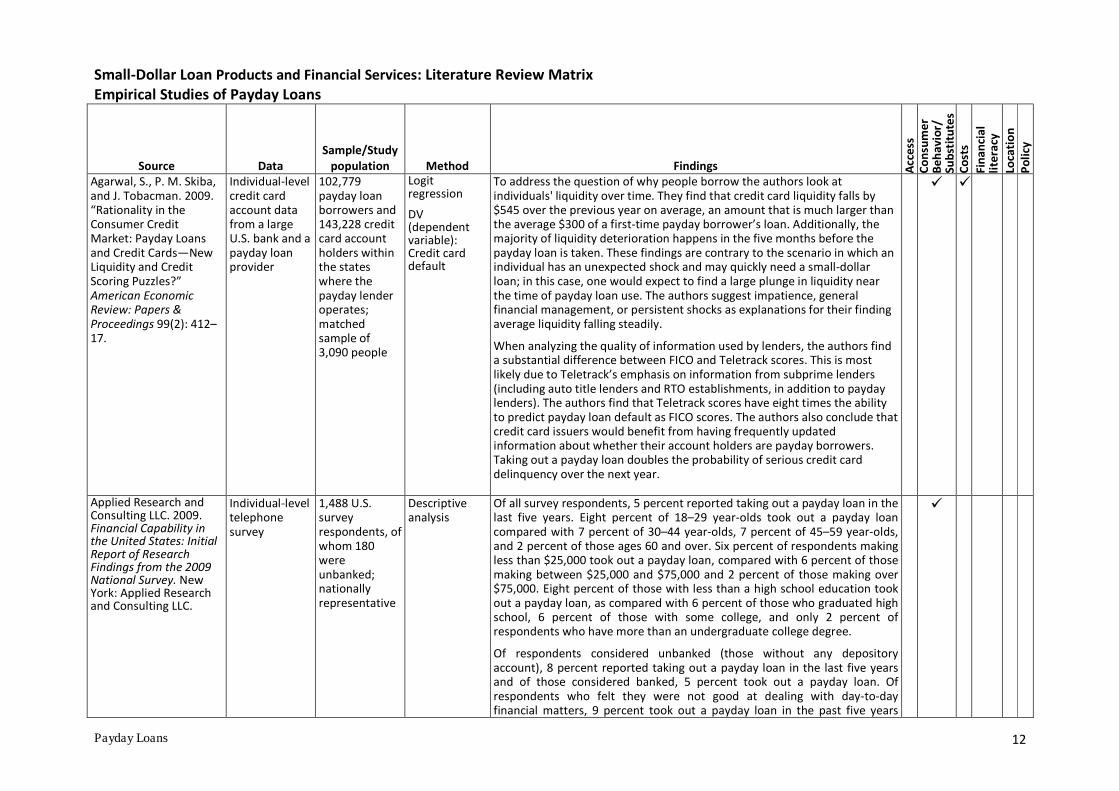
To address the question of why people borrow the authors look atindividuals' liquidity over time. They find that credit card liquidity falls by$545 over the previous year on average, an amount that is much larger thanthe average $300 of a first-time payday borrower’s loan. Additionally, themajority of liquidity deterioration happens in the five months before thepayday loan is taken. These findings are contrary to the scenario in which anindividual has an unexpected shock and may quickly need a small-dollarloan; in this case, one would expect to find a large plunge in liquidity nearthe time of payday loan use. The authors suggest impatience, generalfinancial management, or persistent shocks as explanations for their findingaverage liquidity falling steadily.
When analyzing the quality of information used by lenders, the authors finda substantial difference between FICO and Teletrack scores. This is mostlikely due to Teletrack’s emphasis on information from subprime lenders(including auto title lenders and RTO establishments, in addition to paydaylenders). The authors find that Teletrack scores have eight times the abilityto predict payday loan default as FICO scores. The authors also conclude thatcredit card issuers would benefit from having frequently updatedinformation about whether their account holders are payday borrowers.Taking out a payday loan doubles the probability of serious credit carddelinquency over the next year.
Applied Research andConsulting LLC. 2009.Financial Capability inthe United States: InitialReport of ResearchFindings from the 2009National Survey. NewYork: Applied Researchand Consulting LLC.
Individual-leveltelephonesurvey
1,488 U.S.surveyrespondents, ofwhom 180wereunbanked;nationallyrepresentative
Descriptiveanalysis
Of all survey respondents, 5 percent reported taking out a payday loan in thelast five years. Eight percent of 18–29 year-olds took out a payday loancompared with 7 percent of 30–44 year-olds, 7 percent of 45–59 year-olds,and 2 percent of those ages 60 and over. Six percent of respondents makingless than $25,000 took out a payday loan, compared with 6 percent of thosemaking between $25,000 and $75,000 and 2 percent of those making over$75,000. Eight percent of those with less than a high school education tookout a payday loan, as compared with 6 percent of those who graduated highschool, 6 percent of those with some college, and only 2 percent ofrespondents who have more than an undergraduate college degree.
Of respondents considered unbanked (those without any depositoryaccount), 8 percent reported taking out a payday loan in the last five yearsand of those considered banked, 5 percent took out a payday loan. Ofrespondents who felt they were not good at dealing with day-to-dayfinancial matters, 9 percent took out a payday loan in the past five years
Payday Loans 13
Small-Dollar Loan Products and Financial Services: Literature Review MatrixEmpirical Studies of Payday Loans
Source DataSample/Study
population Method Findings Acc
ess
Co
nsu
me
rB
eh
avi
or/
Sub
stit
ute
sC
ost
s
Fin
an
cia
lli
tera
cy
Loca
tio
nP
oli
cy
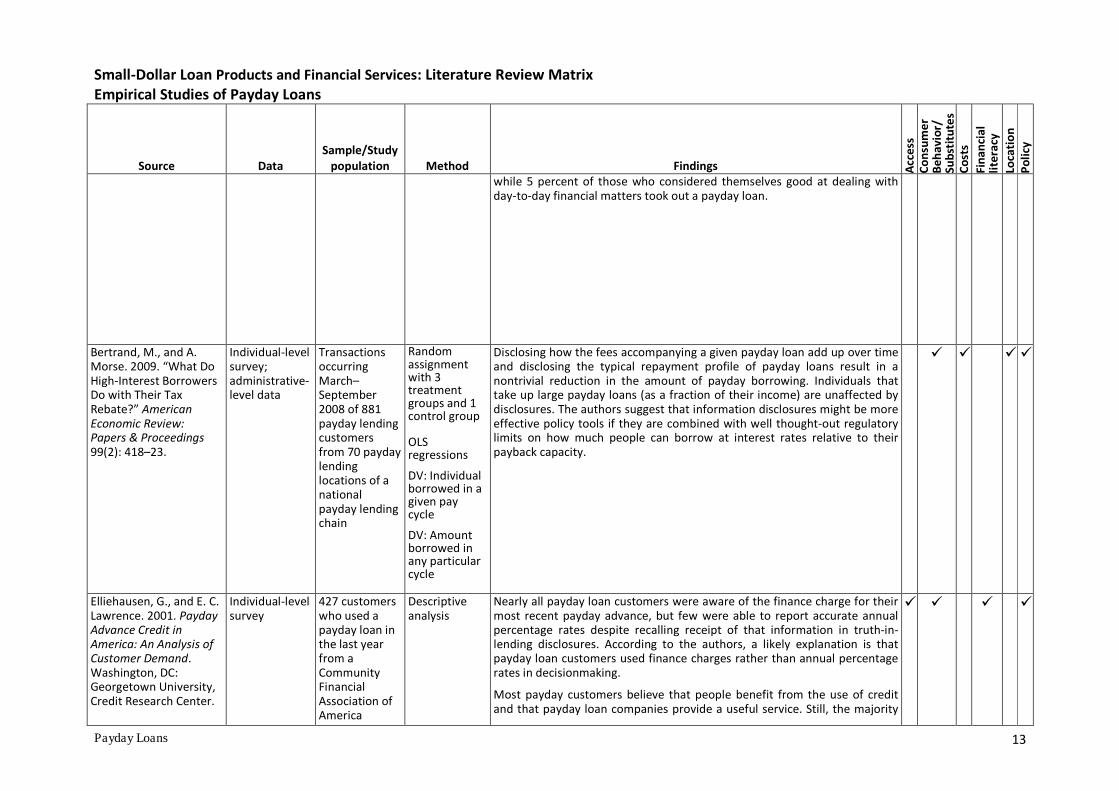
while 5 percent of those who considered themselves good at dealing withday-to-day financial matters took out a payday loan.
Bertrand, M., and A.Morse. 2009. “What DoHigh-Interest BorrowersDo with Their TaxRebate?” AmericanEconomic Review:Papers & Proceedings99(2): 418–23.
Individual-levelsurvey;administrative-level data
TransactionsoccurringMarch–September2008 of 881payday lendingcustomersfrom 70 paydaylendinglocations of anationalpayday lendingchain
Randomassignmentwith 3treatmentgroups and 1control group
OLSregressions
DV: Individualborrowed in agiven paycycle
DV: Amountborrowed inany particularcycle
Disclosing how the fees accompanying a given payday loan add up over timeand disclosing the typical repayment profile of payday loans result in anontrivial reduction in the amount of payday borrowing. Individuals thattake up large payday loans (as a fraction of their income) are unaffected bydisclosures. The authors suggest that information disclosures might be moreeffective policy tools if they are combined with well thought-out regulatorylimits on how much people can borrow at interest rates relative to theirpayback capacity.
Elliehausen, G., and E. C.Lawrence. 2001. PaydayAdvance Credit inAmerica: An Analysis ofCustomer Demand.Washington, DC:Georgetown University,Credit Research Center.
Individual-levelsurvey
427 customerswho used apayday loan inthe last yearfrom aCommunityFinancialAssociation ofAmerica
Descriptiveanalysis
Nearly all payday loan customers were aware of the finance charge for theirmost recent payday advance, but few were able to report accurate annualpercentage rates despite recalling receipt of that information in truth-in-lending disclosures. According to the authors, a likely explanation is thatpayday loan customers used finance charges rather than annual percentagerates in decisionmaking.
Most payday customers believe that people benefit from the use of creditand that payday loan companies provide a useful service. Still, the majority
Payday Loans 14
Small-Dollar Loan Products and Financial Services: Literature Review MatrixEmpirical Studies of Payday Loans
Source DataSample/Study
population Method Findings Acc
ess
Co
nsu
me
rB
eh
avi
or/
Sub
stit
ute
sC
ost
s
Fin
an
cia
lli
tera
cy
Loca
tio
nP
oli
cy
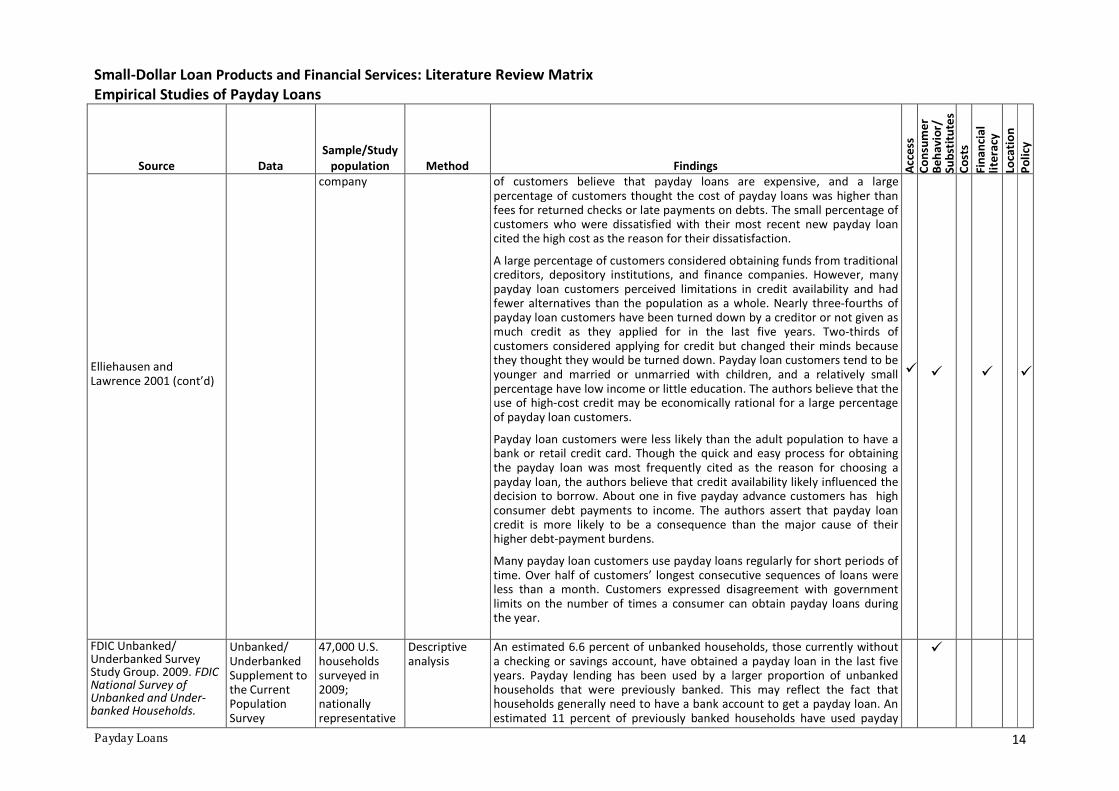
Elliehausen andLawrence 2001 (cont’d)
company of customers believe that payday loans are expensive, and a largepercentage of customers thought the cost of payday loans was higher thanfees for returned checks or late payments on debts. The small percentage ofcustomers who were dissatisfied with their most recent new payday loancited the high cost as the reason for their dissatisfaction.
A large percentage of customers considered obtaining funds from traditionalcreditors, depository institutions, and finance companies. However, manypayday loan customers perceived limitations in credit availability and hadfewer alternatives than the population as a whole. Nearly three-fourths ofpayday loan customers have been turned down by a creditor or not given asmuch credit as they applied for in the last five years. Two-thirds ofcustomers considered applying for credit but changed their minds becausethey thought they would be turned down. Payday loan customers tend to beyounger and married or unmarried with children, and a relatively smallpercentage have low income or little education. The authors believe that theuse of high-cost credit may be economically rational for a large percentageof payday loan customers.
Payday loan customers were less likely than the adult population to have abank or retail credit card. Though the quick and easy process for obtainingthe payday loan was most frequently cited as the reason for choosing apayday loan, the authors believe that credit availability likely influenced thedecision to borrow. About one in five payday advance customers has highconsumer debt payments to income. The authors assert that payday loancredit is more likely to be a consequence than the major cause of theirhigher debt-payment burdens.
Many payday loan customers use payday loans regularly for short periods oftime. Over half of customers’ longest consecutive sequences of loans wereless than a month. Customers expressed disagreement with governmentlimits on the number of times a consumer can obtain payday loans duringthe year.
FDIC Unbanked/Underbanked SurveyStudy Group. 2009. FDICNational Survey ofUnbanked and Under-banked Households.
Unbanked/UnderbankedSupplement tothe CurrentPopulationSurvey
47,000 U.S.householdssurveyed in2009;nationallyrepresentative
Descriptiveanalysis
An estimated 6.6 percent of unbanked households, those currently withouta checking or savings account, have obtained a payday loan in the last fiveyears. Payday lending has been used by a larger proportion of unbankedhouseholds that were previously banked. This may reflect the fact thathouseholds generally need to have a bank account to get a payday loan. Anestimated 11 percent of previously banked households have used payday
Payday Loans 15
Small-Dollar Loan Products and Financial Services: Literature Review MatrixEmpirical Studies of Payday Loans
Source DataSample/Study
population Method Findings Acc
ess
Co
nsu
me
rB
eh
avi
or/
Sub
stit
ute
sC
ost
s
Fin
an
cia
lli
tera
cy
Loca
tio
nP
oli
cy
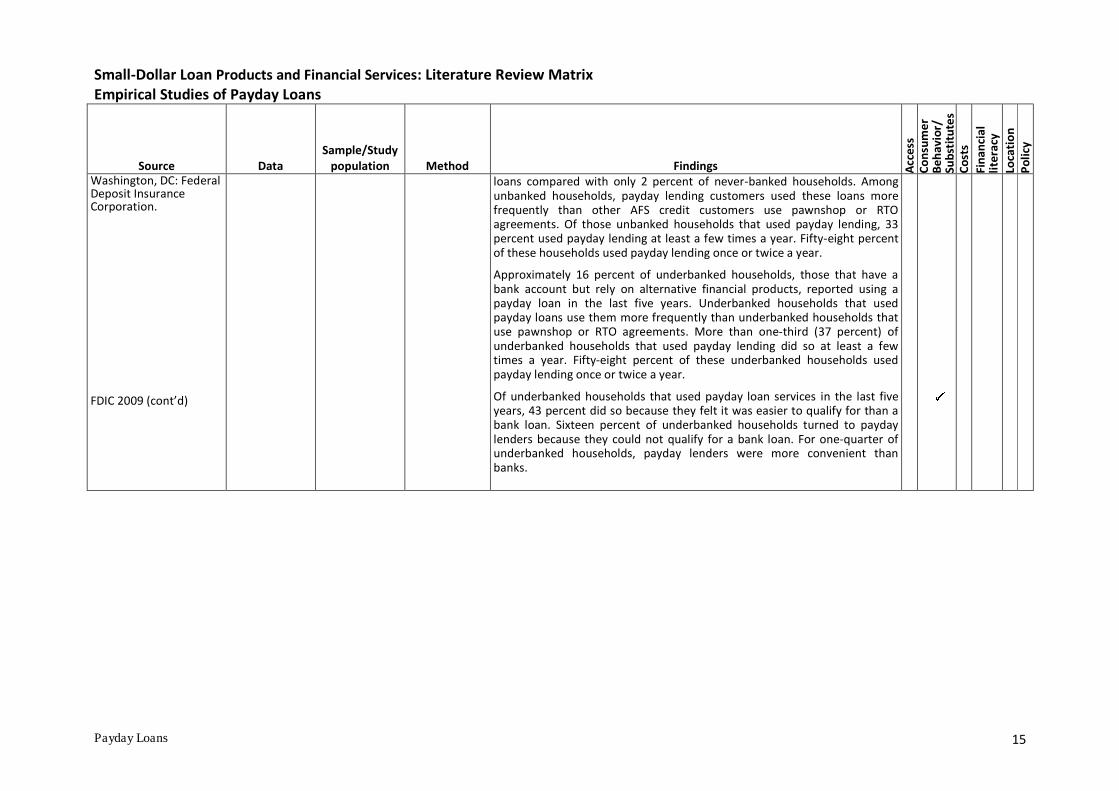
Washington, DC: FederalDeposit InsuranceCorporation.
FDIC 2009 (cont’d)
loans compared with only 2 percent of never-banked households. Amongunbanked households, payday lending customers used these loans morefrequently than other AFS credit customers use pawnshop or RTOagreements. Of those unbanked households that used payday lending, 33percent used payday lending at least a few times a year. Fifty-eight percentof these households used payday lending once or twice a year.
Approximately 16 percent of underbanked households, those that have abank account but rely on alternative financial products, reported using apayday loan in the last five years. Underbanked households that usedpayday loans use them more frequently than underbanked households thatuse pawnshop or RTO agreements. More than one-third (37 percent) ofunderbanked households that used payday lending did so at least a fewtimes a year. Fifty-eight percent of these underbanked households usedpayday lending once or twice a year.
Of underbanked households that used payday loan services in the last fiveyears, 43 percent did so because they felt it was easier to qualify for than abank loan. Sixteen percent of underbanked households turned to paydaylenders because they could not qualify for a bank loan. For one-quarter ofunderbanked households, payday lenders were more convenient thanbanks.

Payday Loans 16
Small-Dollar Loan Products and Financial Services: Literature Review MatrixEmpirical Studies of Payday Loans
Source DataSample/Study
population Method Findings Acc
ess
Co
nsu
me
rB
eh
avi
or/
Sub
stit
ute
sC
ost
s
Fin
an
cia
lli
tera
cy
Loca
tio
nP
oli
cy
Fellowes, M., and M.Mabanta. 2008. Bankingon Wealth: America’sNew Retail BankingInfrastructure and ItsWealth-BuildingPotential. Washington,DC: BrookingsInstitution.
FDIC InstitutionDirectory;infoUSA; store-level data fromstate andfederallicensingagencies
Census tractlocations ofbanks, creditunions, paydayloan providers,pawnshops,and checkcashers in 2007
Descriptiveanalysis;simulationmodels
According to Fellowes and Mabanta’s inventory of basic financial servicelocations, there are nearly 23,000 payday lenders in business and of those,approximately 8,000 are located in low-income neighborhoods. Ninety-fivepercent of all payday lenders are located within one mile of a bank or creditunion branch, and 84 percent are located in the same neighborhood orcensus tract as a bank or credit union branch. This trend is consistent acrossneighborhoods of all income levels. Fellowes and Mabanta conclude thatalmost all payday lenders seem to be clustered around bank and creditunion branches and that this is consistent with the fact that payday lendercustomers require their customers have a bank or credit union account touse their services.
Based on these findings, Fellowes and Mabanta believe that the retailinfrastructure is in place to shift moderate- and lower-income workers’demand for high-cost financial services to more affordable financial servicesand possibly create pathways for savings to create even more wealth overtime. To measure the potential savings and investment wealth ofhouseholds, the authors simulate a number of different possible demandand supply dynamics. They find that a typical payday loan customer, whopays about $600 per year for short-term payday loans, could make about$75,000 over her career if that money were instead invested in a diversifiedportfolio. They note that such wealth would dissipate if she regularly reliedon overdraft funds as a substitute for payday loans; in most cases, paydayloans are preferable to overdraft protection plans.
The authors posit that most payday loan customers may instead prefer tosubstitute their use of payday loans with a lower-cost alternative. Looking attwo alternatives (the North Carolina State Employees Credit Union and EESavings Bond), borrowers are expected to build moderate savings, similar toif they had completely ended their payday loan consumption.

Payday Loans 17
Small-Dollar Loan Products and Financial Services: Literature Review MatrixEmpirical Studies of Payday Loans
Source DataSample/Study
population Method Findings Acc
ess
Co
nsu
me
rB
eh
avi
or/
Sub
stit
ute
sC
ost
s
Fin
an
cia
lli
tera
cy
Loca
tio
nP
oli
cy
Flannery, M., and K.Samolyk. 2005. PaydayLending: Do the CostsJustify the Price?Washington, DC: FDICCenter for FinancialResearch.
Adminstrative-level data
Two monolinepayday lendingcompaniesoperating 600stores in 22states
Multivariateregression
DV: Storeprofitability
Using store data from 2002, 2003, and 2004, Flannery and Samolyk find thatnew payday lending stores (open for less than one year) generate negativeor low profits for a few years before becoming profitable. On a per loanbasis, Flannery and Samolyk find that total store operating costs—which arethe cost of store operations (e.g., wages, occupancy, advertising, other) andthe cost of default losses and loan-collection expenses—average $36 perloan at young stores and $25 at mature stores. However, the average totalrevenue of the mature stores ($349,000) exceeds that of the young stores($253,000) by more than 38 percent. Mean store operating income (thedifference between total revenue and total store operating costs) per loan is$9.8 for young stores, compared with almost $18.8 for mature stores.
Flannery and Samolyk find a relatively high average cost of originatingpayday loans and find that default rates substantially exceed the customarycredit losses at mainstream financial institutions. Therefore, a company’srate of new-store formation substantially affects its profitability. However,the location of the new-store formation has no influence on profitability.After controlling for loan volume, the authors do not find that economic anddemographic conditions in the neighborhoods where stores are located havean effect on profitability, although they do slightly influence default losses.
Flannery and Samolyk find no evidence that loan rollovers and repeatborrowers affect store profits beyond their proportional contribution tototal loan volume. In other words, a store’s loan volume is a key determinantof its profitability per se. These findings are reflective of the scant creditanalysis undertaken in connection with payday loans. The authors concludethat fixed operating costs and loan loss rates do justify a large part of thehigh APRs charged on payday loans.
Payday Loans 18
Small-Dollar Loan Products and Financial Services: Literature Review MatrixEmpirical Studies of Payday Loans
Source DataSample/Study
population Method Findings Acc
ess
Co
nsu
me
rB
eh
avi
or/
Sub
stit
ute
sC
ost
s
Fin
an
cia
lli
tera
cy
Loca
tio
nP
oli
cy
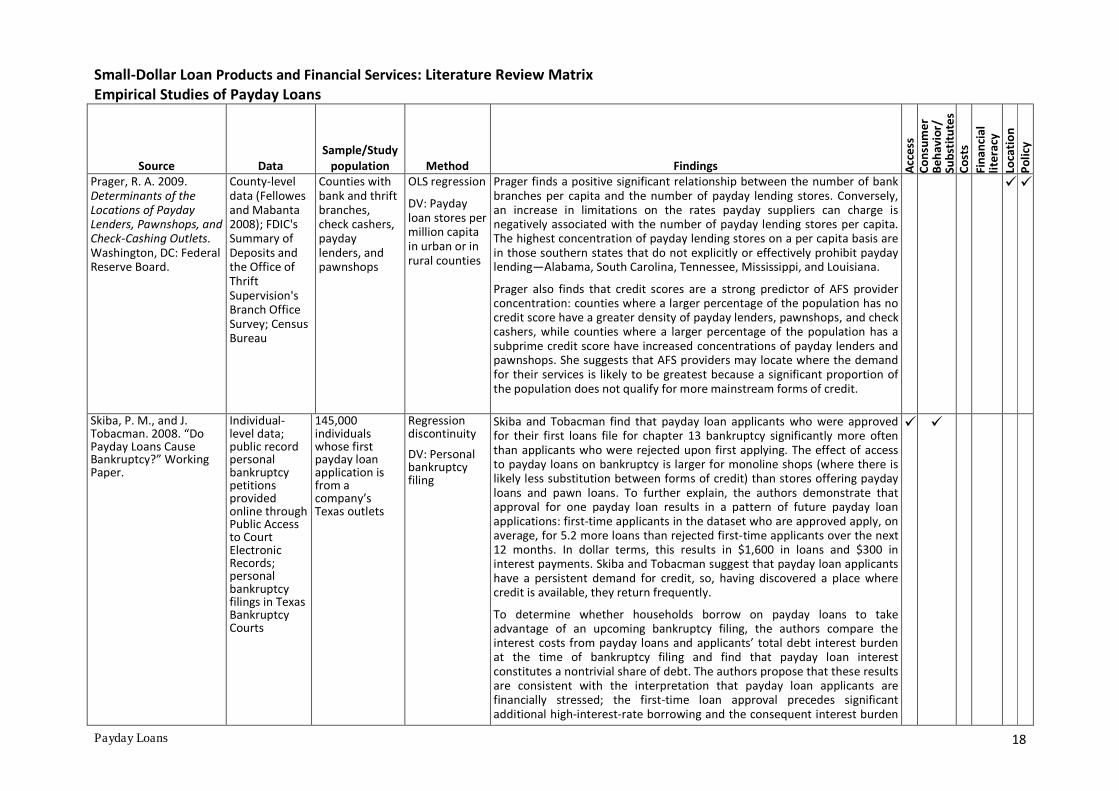
Prager, R. A. 2009.Determinants of theLocations of PaydayLenders, Pawnshops, andCheck-Cashing Outlets.Washington, DC: FederalReserve Board.
County-leveldata (Fellowesand Mabanta2008); FDIC'sSummary ofDeposits andthe Office ofThriftSupervision'sBranch OfficeSurvey; CensusBureau
Counties withbank and thriftbranches,check cashers,paydaylenders, andpawnshops
OLS regression
DV: Paydayloan stores permillion capitain urban or inrural counties
Prager finds a positive significant relationship between the number of bankbranches per capita and the number of payday lending stores. Conversely,an increase in limitations on the rates payday suppliers can charge isnegatively associated with the number of payday lending stores per capita.The highest concentration of payday lending stores on a per capita basis arein those southern states that do not explicitly or effectively prohibit paydaylending—Alabama, South Carolina, Tennessee, Mississippi, and Louisiana.
Prager also finds that credit scores are a strong predictor of AFS providerconcentration: counties where a larger percentage of the population has nocredit score have a greater density of payday lenders, pawnshops, and checkcashers, while counties where a larger percentage of the population has asubprime credit score have increased concentrations of payday lenders andpawnshops. She suggests that AFS providers may locate where the demandfor their services is likely to be greatest because a significant proportion ofthe population does not qualify for more mainstream forms of credit.
Skiba, P. M., and J.Tobacman. 2008. “DoPayday Loans CauseBankruptcy?” WorkingPaper.
Individual-level data;public recordpersonalbankruptcypetitionsprovidedonline throughPublic Accessto CourtElectronicRecords;personalbankruptcyfilings in TexasBankruptcyCourts
145,000individualswhose firstpayday loanapplication isfrom acompany’sTexas outlets
Regressiondiscontinuity
DV: Personalbankruptcyfiling
Skiba and Tobacman find that payday loan applicants who were approvedfor their first loans file for chapter 13 bankruptcy significantly more oftenthan applicants who were rejected upon first applying. The effect of accessto payday loans on bankruptcy is larger for monoline shops (where there islikely less substitution between forms of credit) than stores offering paydayloans and pawn loans. To further explain, the authors demonstrate thatapproval for one payday loan results in a pattern of future payday loanapplications: first-time applicants in the dataset who are approved apply, onaverage, for 5.2 more loans than rejected first-time applicants over the next12 months. In dollar terms, this results in $1,600 in loans and $300 ininterest payments. Skiba and Tobacman suggest that payday loan applicantshave a persistent demand for credit, so, having discovered a place wherecredit is available, they return frequently.
To determine whether households borrow on payday loans to takeadvantage of an upcoming bankruptcy filing, the authors compare theinterest costs from payday loans and applicants’ total debt interest burdenat the time of bankruptcy filing and find that payday loan interestconstitutes a nontrivial share of debt. The authors propose that these resultsare consistent with the interpretation that payday loan applicants arefinancially stressed; the first-time loan approval precedes significantadditional high-interest-rate borrowing and the consequent interest burden
Payday Loans 19
Small-Dollar Loan Products and Financial Services: Literature Review MatrixEmpirical Studies of Payday Loans
Source DataSample/Study
population Method Findings Acc
ess
Co
nsu
me
rB
eh
avi
or/
Sub
stit
ute
sC
ost
s
Fin
an
cia
lli
tera
cy
Loca
tio
nP
oli
cy
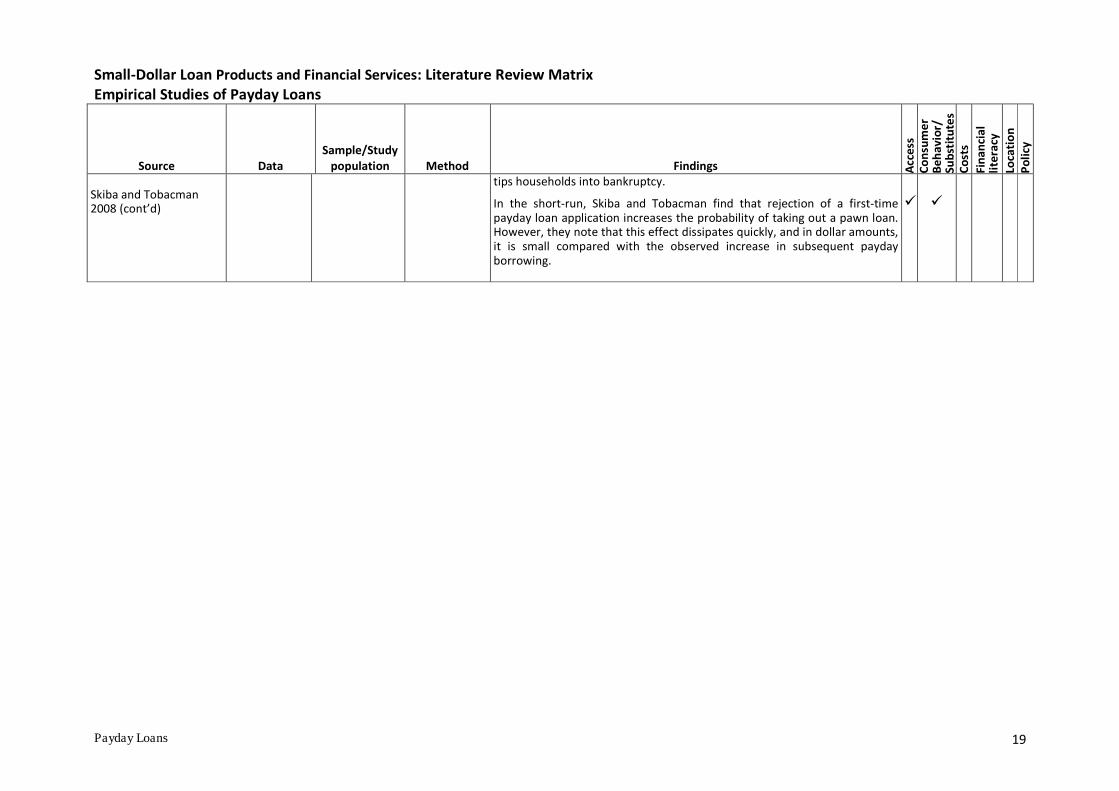
Skiba and Tobacman2008 (cont’d)
tips households into bankruptcy.
In the short-run, Skiba and Tobacman find that rejection of a first-timepayday loan application increases the probability of taking out a pawn loan.However, they note that this effect dissipates quickly, and in dollar amounts,it is small compared with the observed increase in subsequent paydayborrowing.

Refund Anticipation Loans and Checks 20
Small-Dollar Loan Products and Financial Services: Literature Review MatrixEmpirical Studies of Refund Anticipation Loans and Checks (RALs and RACs)
Source DataSample/Study
population Method Findings Acc
ess
Co
nsu
me
rB
eh
avi
or/
Sub
stit
ute
s
Co
sts
Fin
an
cia
lli
tera
cy
Loca
tio
nP
oli
cy
Applied Research andConsulting LLC. 2009.Financial Capability inthe United States: InitialReport of ResearchFindings from the 2009National Survey. NewYork: Applied Researchand Consulting LLC.
Individual-level surveydata
1,488 U.S.surveyrespondents, ofwhom 180 wereunbanked;nationallyrepresentative
Descriptiveanalysis
Of all respondents, 8 percent received an advance on their tax refundsusing a RAL in the last five years. Twelve percent of 18–29 year-olds and 11percent of 30–44 year-olds used a RAL compared with only 4 percent and 3percent of those 45–59 and 65 or above. Twelve percent of respondentsmaking less than $25,000 used a RAL compared with 7 percent of thosemaking between $25,000 to $75,000 and 3 percent of those making over$75,000. Thirteen percent of those with less than a high school educationused a RAL, compared with 9 percent of those who graduated high school,8 percent of those with some college, and 4 percent of those with a collegedegree or more.
More African Americans, 13 percent, used a RAL in the last five years thanother racial/ethnic groups; 6 percent of Caucasians, 9 percent of Hispanics,and 5 percent of Asians reported using a RAL. Of respondents who felt theywere not good at dealing with day-to-day financial matters, 11 percentused a RAL in the past five years, compared with 6 percent of those whosaid that they were good at dealing with day-to-day financial matters. Ofunbanked respondents, 16 percent reported the use of a RAL. Only 6percent of those considered banked used a RAL.
Refund Anticipation Loans and Checks 21
Small-Dollar Loan Products and Financial Services: Literature Review MatrixEmpirical Studies of Refund Anticipation Loans and Checks (RALs and RACs)
Source DataSample/Study
population Method Findings Acc
ess
Co
nsu
me
rB
eh
avi
or/
Sub
stit
ute
s
Co
sts
Fin
an
cia
lli
tera
cy
Loca
tio
nP
oli
cy
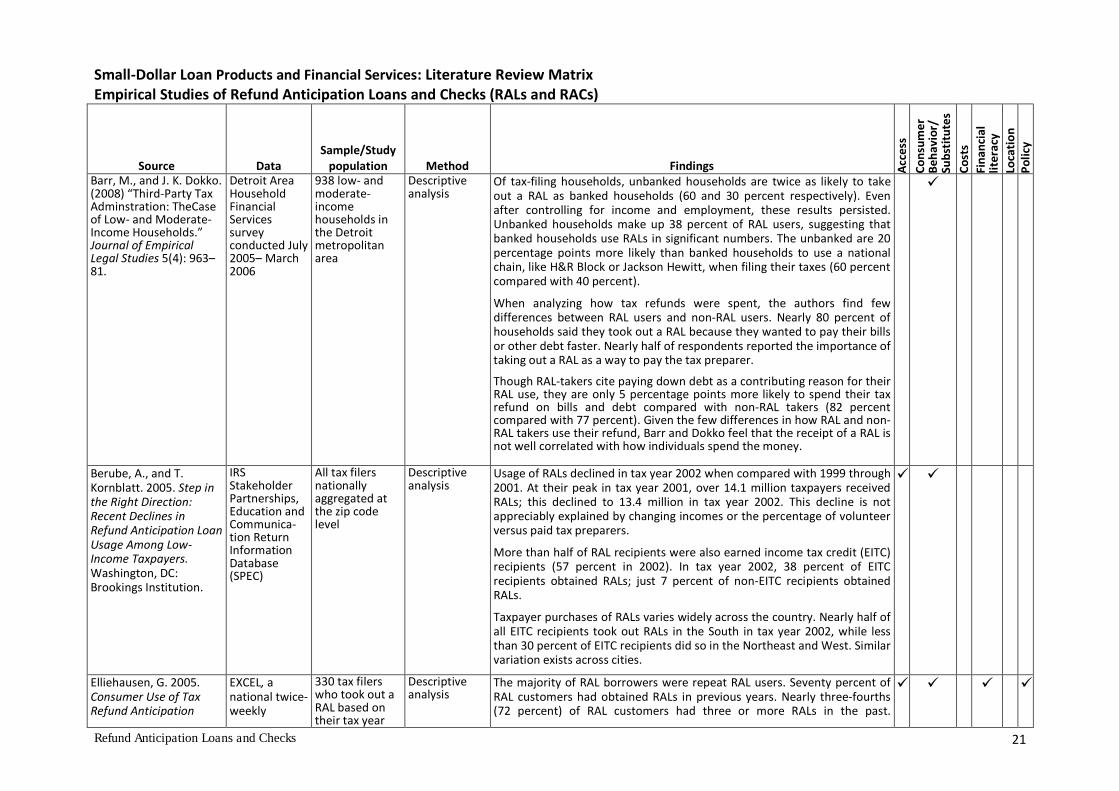
Barr, M., and J. K. Dokko.(2008) “Third-Party TaxAdminstration: TheCaseof Low- and Moderate-Income Households.”Journal of EmpiricalLegal Studies 5(4): 963–81.
Detroit AreaHouseholdFinancialServicessurveyconducted July2005– March2006
938 low- andmoderate-incomehouseholds inthe Detroitmetropolitanarea
Descriptiveanalysis
Of tax-filing households, unbanked households are twice as likely to takeout a RAL as banked households (60 and 30 percent respectively). Evenafter controlling for income and employment, these results persisted.Unbanked households make up 38 percent of RAL users, suggesting thatbanked households use RALs in significant numbers. The unbanked are 20percentage points more likely than banked households to use a nationalchain, like H&R Block or Jackson Hewitt, when filing their taxes (60 percentcompared with 40 percent).
When analyzing how tax refunds were spent, the authors find fewdifferences between RAL users and non-RAL users. Nearly 80 percent ofhouseholds said they took out a RAL because they wanted to pay their billsor other debt faster. Nearly half of respondents reported the importance oftaking out a RAL as a way to pay the tax preparer.
Though RAL-takers cite paying down debt as a contributing reason for theirRAL use, they are only 5 percentage points more likely to spend their taxrefund on bills and debt compared with non-RAL takers (82 percentcompared with 77 percent). Given the few differences in how RAL and non-RAL takers use their refund, Barr and Dokko feel that the receipt of a RAL isnot well correlated with how individuals spend the money.
Berube, A., and T.Kornblatt. 2005. Step inthe Right Direction:Recent Declines inRefund Anticipation LoanUsage Among Low-Income Taxpayers.Washington, DC:Brookings Institution.
IRSStakeholderPartnerships,Education andCommunica-tion ReturnInformationDatabase(SPEC)
All tax filersnationallyaggregated atthe zip codelevel
Descriptiveanalysis
Usage of RALs declined in tax year 2002 when compared with 1999 through2001. At their peak in tax year 2001, over 14.1 million taxpayers receivedRALs; this declined to 13.4 million in tax year 2002. This decline is notappreciably explained by changing incomes or the percentage of volunteerversus paid tax preparers.
More than half of RAL recipients were also earned income tax credit (EITC)recipients (57 percent in 2002). In tax year 2002, 38 percent of EITCrecipients obtained RALs; just 7 percent of non-EITC recipients obtainedRALs.
Taxpayer purchases of RALs varies widely across the country. Nearly half ofall EITC recipients took out RALs in the South in tax year 2002, while lessthan 30 percent of EITC recipients did so in the Northeast and West. Similarvariation exists across cities.
Elliehausen, G. 2005.Consumer Use of TaxRefund Anticipation
EXCEL, anational twice-weekly
330 tax filerswho took out aRAL based ontheir tax year
Descriptiveanalysis
The majority of RAL borrowers were repeat RAL users. Seventy percent ofRAL customers had obtained RALs in previous years. Nearly three-fourths(72 percent) of RAL customers had three or more RALs in the past.

Refund Anticipation Loans and Checks 22
Small-Dollar Loan Products and Financial Services: Literature Review MatrixEmpirical Studies of Refund Anticipation Loans and Checks (RALs and RACs)
Source DataSample/Study
population Method Findings Acc
ess
Co
nsu
me
rB
eh
avi
or/
Sub
stit
ute
s
Co
sts
Fin
an
cia
lli
tera
cy
Loca
tio
nP
oli
cy
Loans. Washington, DC:Georgetown University,Credit Research Center.
Elliehausen 2005(cont’d)
individual-levelsurveyconducted byInternationalCommunica-tions Research;Survey ofConsumerFinances;Survey ofConsumerAttitudes
2003 refund Consumers’ primary reason for obtaining a RAL was to pay bills. Forty-onepercent of RAL recipients reported they used their refund to pay bills, ofwhich only 13 percent were from Christmas. Another 21 percent reportedthat their refund went toward unexpected expenditures. Fifteen percentreported not wanting to wait for their refund as the primary reason forobtaining a RAL. Virtually all RAL customers knew that their tax-preparationservice offered electronic filing of tax returns. Nearly two-thirds of RALcustomers discussed with the tax preparer other options for receiving theirrefund faster—such as electronic filing and direct deposit—beforeobtaining a RAL.
RAL customers are disproportionately from lower- or moderate-incomehouseholds. Twenty-eight percent of RAL customers had incomes between$15,000 and $24,999 and 16 percent of RAL customers had incomesbetween $25,000 and $39,999. Nineteen percent of RAL borrowers hadincomes less than $15,000. Only 26 percent of RAL users had incomes of$40,000 or more. Nearly half (47 percent) of RALs were for $3,000 or more.Small loans were not very common: just 11 percent of RALs were for lessthan $1,000.
Consumers using high-cost, short-term types of credit often have andperceive few options for borrowing. Many RAL customers borrow fromother high-cost, short-term lenders. In the previous five years, 23 percentof RAL users borrowed from a pawnshop, and 18 percent borrowed from apayday loan company. Nearly half of RAL customers did not apply for creditbecause they thought that they would be turned down. Nearly half of EITCrecipients that obtained a RAL reported being turned down or limited by alender in the last five years—more than two times the percentage of allhouseholds experiencing turndowns or limitations and more than threetimes the percentage of all households perceiving limitations in creditavailability.
EITC recipients were more likely than all households to have obtained aRAL: 19 percent of EITC recipients obtained a RAL, compared with 8percent of all households. Elliehausen suggests that the higher incidence ofRAL use by EITC recipients may be attributable to their disproportionatelikelihood to be in the early family life cycle that is associated with highdemand for credit. Thirty-six percent of EITC recipients are less than 45years of age, are married, and have children, compared with 19 percent of

Refund Anticipation Loans and Checks 23
Small-Dollar Loan Products and Financial Services: Literature Review MatrixEmpirical Studies of Refund Anticipation Loans and Checks (RALs and RACs)
Source DataSample/Study
population Method Findings Acc
ess
Co
nsu
me
rB
eh
avi
or/
Sub
stit
ute
s
Co
sts
Fin
an
cia
lli
tera
cy
Loca
tio
nP
oli
cy
all households.
Most RAL customers lack awareness of the APR for their loans. Only abouta quarter of customers recalled receiving an annual percentage ratedisclosure and of those recalling receipt of an APR, 85 percent said thatthey did not know the rate that was disclosed. This lack of consumerknowledge suggests that RAL users are unlikely to have found APRinformation useful in making their decisions.
FDIC Unbanked/Underbanked SurveyStudy Group. 2009. FDICNational Survey of Un-banked and Under-banked Households.Washington, DC: FederalDeposit InsuranceCorporation.
Unbanked/UnderbankedSupplement tothe CurrentPopulationSurvey
47,000 U.S.householdssurveyed in2009; nationallyrepresentative
Descriptiveanalysis
Among unbanked households, those currently without a checking orsavings account, 8 percent have used RALs within the last five years.Previously banked households are more likely to have used RALs thannever-banked households. Almost 12 percent of previously bankedhouseholds used RALs compared with 4 percent of never-bankedhouseholds. Approximately 13 percent of underbanked households, thosethat have a bank account but rely on alternative financial products,reported using RALs within the last five years.
First NationsDevelopment Instituteand Center forResponsible Lending.2008. Borrowed Time:Use of RefundAnticipation LoansAmong EITC Filers inNative AmericanCommunities.Longmont, CO: FirstNations DevelopmentInstitute.
County-leveldata
EITC recipientsin AZ, MN, MT,ND, NM, OK,OR, SD, WA, WI
OLS regression
DV: RAL usage
A higher concentration of Native Americans and a greater level ofurbanization were each found to be predictors of higher rates of RALusage. Native counties are more likely to be rural, but also have higherrates of RAL usage. Many of the counties with the highest use of RALsamong EITC filers using a paid preparer are very remote rural counties withreservations. Findings suggest that patterns of RAL usage in some Nativecommunities may be different than other rural areas, and perhaps signal atargeting of this particular population by paid tax preparers offering RALs.
In nine of the ten states examined in tax year 2007, counties with Nativeland and at least 10 percent of the total population identifying as NativeAmerican (Native-population communities) had higher rates of RAL usageamong EITC recipients than other counties in the state. In four states(Minnesota, Montana, North Dakota, and South Dakota), RAL usage is at
Refund Anticipation Loans and Checks 24
Small-Dollar Loan Products and Financial Services: Literature Review MatrixEmpirical Studies of Refund Anticipation Loans and Checks (RALs and RACs)
Source DataSample/Study
population Method Findings Acc
ess
Co
nsu
me
rB
eh
avi
or/
Sub
stit
ute
s
Co
sts
Fin
an
cia
lli
tera
cy
Loca
tio
nP
oli
cy
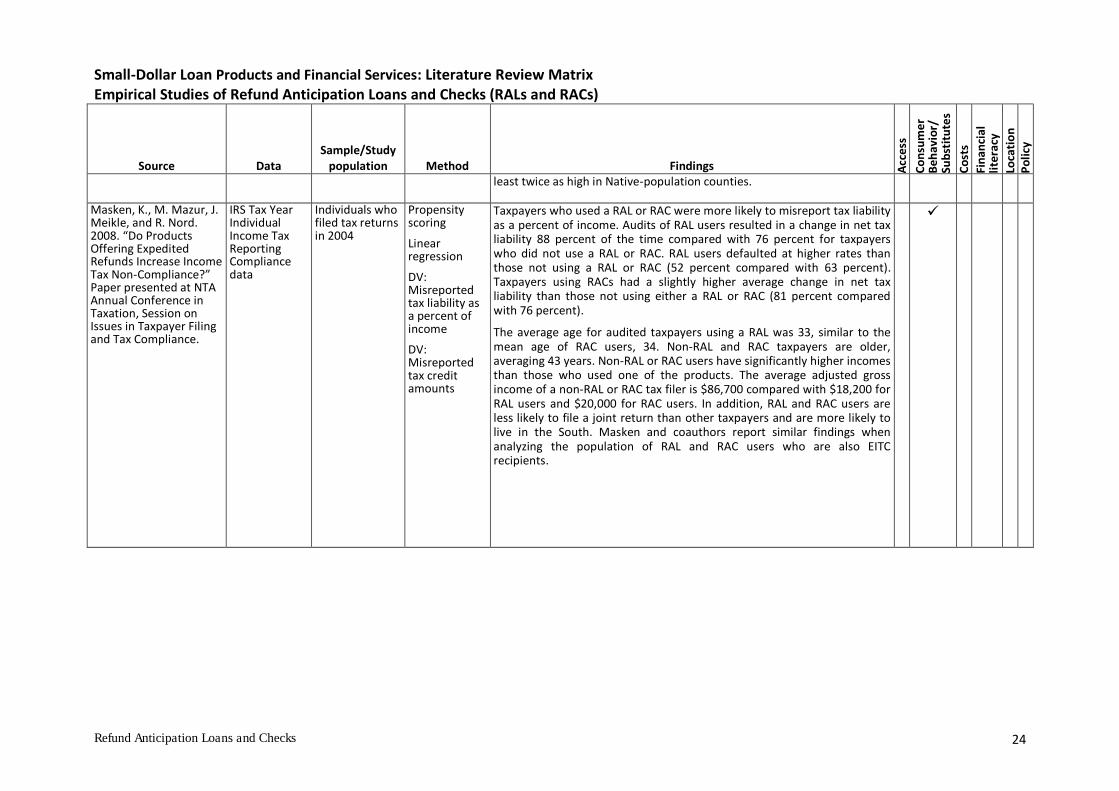
least twice as high in Native-population counties.
Masken, K., M. Mazur, J.Meikle, and R. Nord.2008. “Do ProductsOffering ExpeditedRefunds Increase IncomeTax Non-Compliance?”Paper presented at NTAAnnual Conference inTaxation, Session onIssues in Taxpayer Filingand Tax Compliance.
IRS Tax YearIndividualIncome TaxReportingCompliancedata
Individuals whofiled tax returnsin 2004
Propensityscoring
Linearregression
DV:Misreportedtax liability asa percent ofincome
DV:Misreportedtax creditamounts
Taxpayers who used a RAL or RAC were more likely to misreport tax liabilityas a percent of income. Audits of RAL users resulted in a change in net taxliability 88 percent of the time compared with 76 percent for taxpayerswho did not use a RAL or RAC. RAL users defaulted at higher rates thanthose not using a RAL or RAC (52 percent compared with 63 percent).Taxpayers using RACs had a slightly higher average change in net taxliability than those not using either a RAL or RAC (81 percent comparedwith 76 percent).
The average age for audited taxpayers using a RAL was 33, similar to themean age of RAC users, 34. Non-RAL and RAC taxpayers are older,averaging 43 years. Non-RAL or RAC users have significantly higher incomesthan those who used one of the products. The average adjusted grossincome of a non-RAL or RAC tax filer is $86,700 compared with $18,200 forRAL users and $20,000 for RAC users. In addition, RAL and RAC users areless likely to file a joint return than other taxpayers and are more likely tolive in the South. Masken and coauthors report similar findings whenanalyzing the population of RAL and RAC users who are also EITCrecipients.

Refund Anticipation Loans and Checks 25
Small-Dollar Loan Products and Financial Services: Literature Review MatrixEmpirical Studies of Refund Anticipation Loans and Checks (RALs and RACs)
Source DataSample/Study
population Method Findings Acc
ess
Co
nsu
me
rB
eh
avi
or/
Sub
stit
ute
s
Co
sts
Fin
an
cia
lli
tera
cy
Loca
tio
nP
oli
cy
Treasury InspectorGeneral for TaxAdministration. 2008.Many Taxpayers WhoObtain RefundAnticipation Loans CouldBenefit from Free TaxPreparation Services.Washington, DC: U.S.Government PrintingOffice.
Individual-level surveydata
350 taxpayerswhose tax year2007 accountscontained RALindicators
Descriptiveanalysis
Based on survey responses, the authors conclude that if taxpayers wereaware that refunds could arrive in as few as five days (this timeframe isbased on a testing a new computer system), RALs might not have been asattractive to them. Eighty-five percent of the 250 respondents whoconfirmed receiving RALs stated that they would have been willing to waitup to nine days to receive their tax refund. Only 167 (67 percent)confirmed RAL recipients stated that their preparer explained how long itwould take for the taxpayers to receive their tax refunds if they chose notto obtain the RAL. A review of IRS accounts for the 250 confirmed RALusers showed that their tax refunds were issued to lenders within 14 days.
Twenty-six percent of the 250 respondents who used a RAL received debitcards from the preparers. Sixty-three percent (157 of 250) of therespondents stated that they would prefer to receive a debit card from theIRS instead of getting a RAL.
Of the 250 respondents who stated that they had received a RAL, 213 (85percent) obtained RALs because they wanted faster access to their taxrefunds and 185 (74 percent) used the money to pay bills. Another 14 (6percent) used the money to buy or repair a car or for home repairs andexpenses. Eight percent stated they put the money in savings.
As reported by respondents who confirmed receiving a RAL, tax returnpreparation and fees to obtain the RALs ranged from 5 to 25 percent oftaxpayers’ tax refunds. The average fee for respondents with tax refunds ofless than $2,000 was $183, compared to $338 for respondents with taxrefunds of more than $5,000.
Wu, C., and J. Fox. 2009.Big Business, Big Bucks:Quickie Tax LoansGenerate Profits forBanks and Tax PreparersWhile Putting Low-Income Taxpayers atRisk. Washington, DC:Consumer Federation ofAmerica and NationalConsumer Law Center.
IRSStakeholderPartnerships,Education &Communica-tion (SPEC)ReturnInformationDatabase forTax Year 2006;companyreports
Individuals whofiled taxreturns; RALand RACcompanies
Descriptiveanalysis
EITC recipients are overrepresented among the ranks of RAL consumers.Though EITC recipients made up only 17 percent of individual taxpayers in2007, IRS data show that in 2007 nearly two-thirds (63 percent) of RALconsumers were EITC recipients, or 5.4 million families. In 2007, nearly$523 million in EITC funds were spent on RAL loan fees. EITC recipients whogot RALs paid an additional $996 million in tax-preparation fees.
The price of RALs has declined significantly for some of the biggestproviders. In 2007, for taxpayers who received refunds, the average loanamount was about $2,700. At that loan amount, a RAL loan fee was $104to $111. In 2009, a consumer could expect to pay from $62 to $110. Theeffective APR for an average RAL would be 77–140 percent. The price of

Refund Anticipation Loans and Checks 26
Small-Dollar Loan Products and Financial Services: Literature Review MatrixEmpirical Studies of Refund Anticipation Loans and Checks (RALs and RACs)
Source DataSample/Study
population Method Findings Acc
ess
Co
nsu
me
rB
eh
avi
or/
Sub
stit
ute
s
Co
sts
Fin
an
cia
lli
tera
cy
Loca
tio
nP
oli
cy
Wu and Fox 2009tax-preparation averages $183 for H&R Block and can be higher for otherpreparers. Altogether, the consumer might pay about $245 to $293. If theconsumer chooses an independent tax preparer that charges a “documentprocessing” or “application” fee of $40 per loan, the total loan amountcould rise to as much as $285 to $333.
Independent preparers have about 70–75 percent of the paid preparermarket and 40 percent of the RAL market.
Some individual preparers and preparer companies receive incentiveswhen a consumer elects to receive a RAL. For example, Republic Bank &Trust advertises on its web site an incentive payment of $6 per RAL. SantaBarbara Bank & Trust pays $3 per RAL plus an additional payment of $1 to$3 depending on the loan performance of RALs. H&R Block no longerprovides employees compensation per sale of RALs and RACs.
Several additional products have been introduced by leading RAL and RACproviders. Both H&R Block and Jackson Hewitt introduced “pay stub” and“holiday” RALs, loans made based on anticipated refunds before taxpayersreceived their IRS Form W-2s and could file their returns. Jackson Hewitt’sversion is called the ipower Line of Credit issued by MetaBank. MetaBankcharges a 1.5 percent fee for the first advance from the line and a 10percent charge per advance thereafter, plus 18 percent periodic interest.Another product that tax preparers and their bank partners offer is an“instant” same-day RAL. These instant RALs are available for an additionalfee ranging from $25 to $55. Starting in 2007, H&R Block dropped RAL loanfees for those customers who received a RAL on the Block Emerald Card.The Emerald Line of Credit carries an interest rate of 36 percent plus anannual fee of $45.
Rent-to-Own Agreements 27
Small-Dollar Loan Products and Financial Services: Literature Review MatrixEmpirical Studies of Rent-to-Own (RTO) Agreements
Source DataSample/Study
population Method Findings Acc
ess
Co
nsu
me
rB
eh
avi
or/
Sub
stit
ute
s
Co
sts
Fin
an
cia
lli
tera
cy
Loca
tio
nP
oli
cy
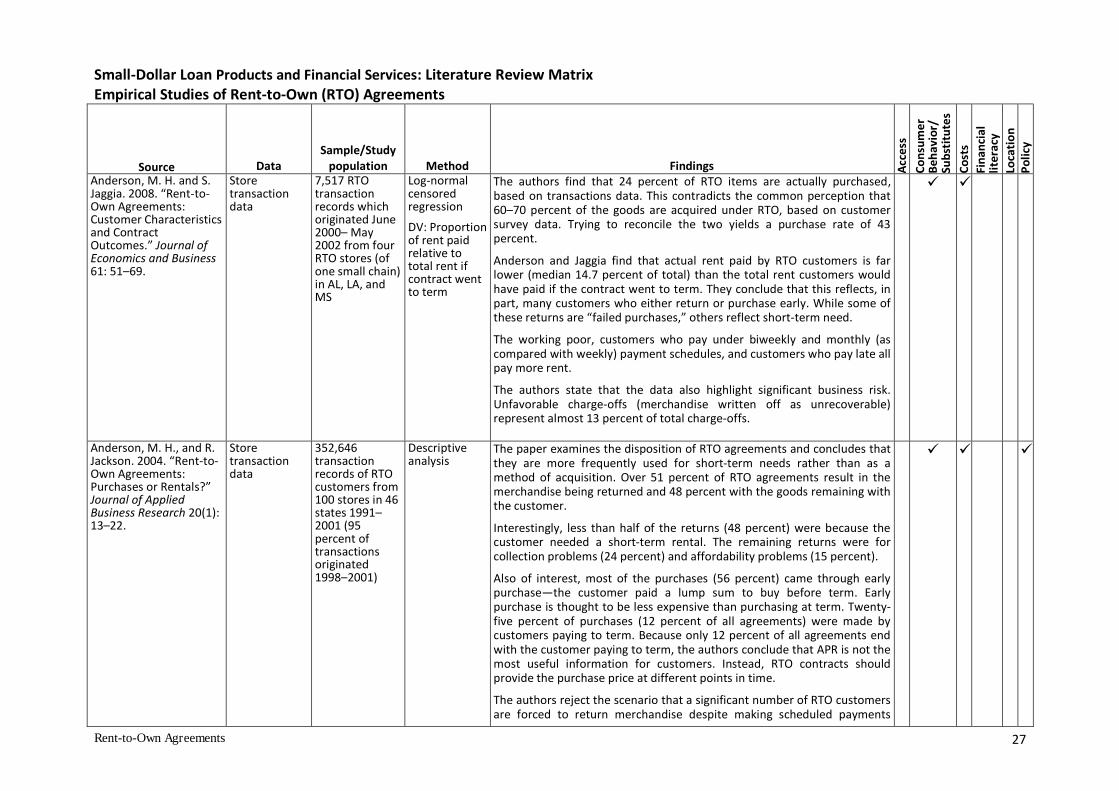
Anderson, M. H. and S.Jaggia. 2008. “Rent-to-Own Agreements:Customer Characteristicsand ContractOutcomes.” Journal ofEconomics and Business61: 51–69.
Storetransactiondata
7,517 RTOtransactionrecords whichoriginated June2000– May2002 from fourRTO stores (ofone small chain)in AL, LA, andMS
Log-normalcensoredregression
DV: Proportionof rent paidrelative tototal rent ifcontract wentto term
The authors find that 24 percent of RTO items are actually purchased,based on transactions data. This contradicts the common perception that60–70 percent of the goods are acquired under RTO, based on customersurvey data. Trying to reconcile the two yields a purchase rate of 43percent.
Anderson and Jaggia find that actual rent paid by RTO customers is farlower (median 14.7 percent of total) than the total rent customers wouldhave paid if the contract went to term. They conclude that this reflects, inpart, many customers who either return or purchase early. While some ofthese returns are “failed purchases,” others reflect short-term need.
The working poor, customers who pay under biweekly and monthly (ascompared with weekly) payment schedules, and customers who pay late allpay more rent.
The authors state that the data also highlight significant business risk.Unfavorable charge-offs (merchandise written off as unrecoverable)represent almost 13 percent of total charge-offs.
Anderson, M. H., and R.Jackson. 2004. “Rent-to-Own Agreements:Purchases or Rentals?”Journal of AppliedBusiness Research 20(1):13–22.
Storetransactiondata
352,646transactionrecords of RTOcustomers from100 stores in 46states 1991–2001 (95percent oftransactionsoriginated1998–2001)
Descriptiveanalysis
The paper examines the disposition of RTO agreements and concludes thatthey are more frequently used for short-term needs rather than as amethod of acquisition. Over 51 percent of RTO agreements result in themerchandise being returned and 48 percent with the goods remaining withthe customer.
Interestingly, less than half of the returns (48 percent) were because thecustomer needed a short-term rental. The remaining returns were forcollection problems (24 percent) and affordability problems (15 percent).
Also of interest, most of the purchases (56 percent) came through earlypurchase—the customer paid a lump sum to buy before term. Earlypurchase is thought to be less expensive than purchasing at term. Twenty-five percent of purchases (12 percent of all agreements) were made bycustomers paying to term. Because only 12 percent of all agreements endwith the customer paying to term, the authors conclude that APR is not themost useful information for customers. Instead, RTO contracts shouldprovide the purchase price at different points in time.
The authors reject the scenario that a significant number of RTO customersare forced to return merchandise despite making scheduled payments
Rent-to-Own Agreements 28
Small-Dollar Loan Products and Financial Services: Literature Review MatrixEmpirical Studies of Rent-to-Own (RTO) Agreements
Source DataSample/Study
population Method Findings Acc
ess
Co
nsu
me
rB
eh
avi
or/
Sub
stit
ute
s
Co
sts
Fin
an
cia
lli
tera
cy
Loca
tio
nP
oli
cy
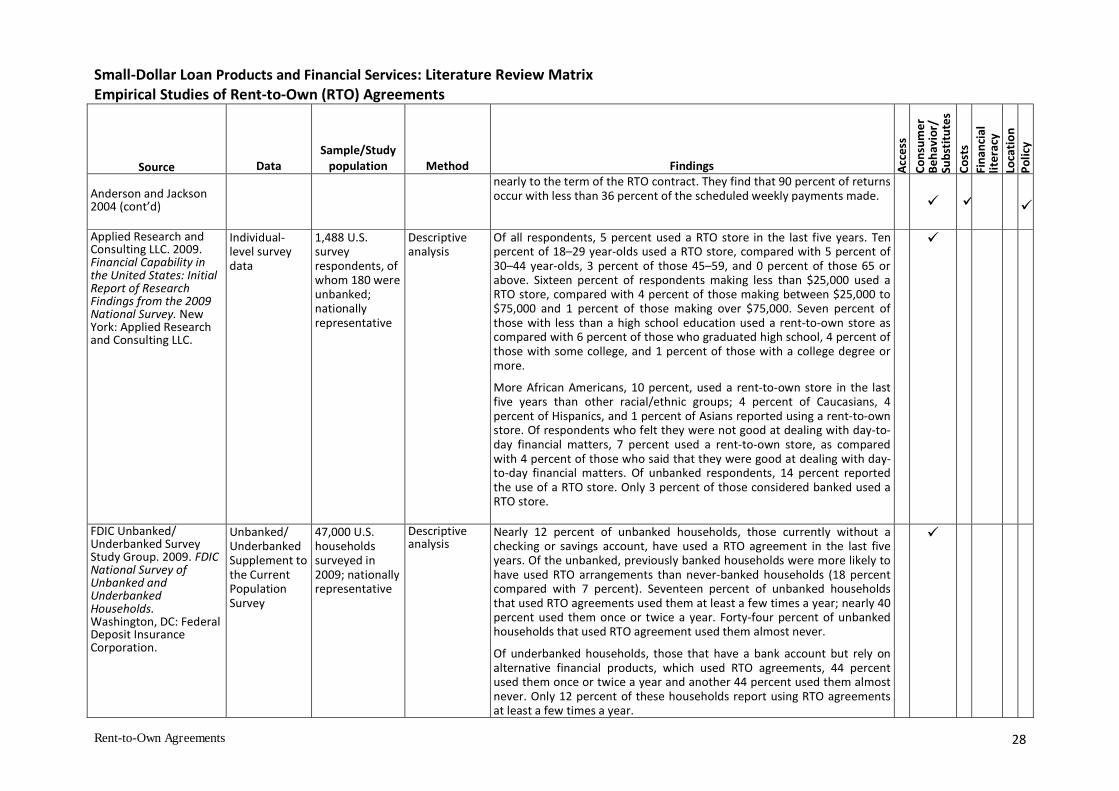
Anderson and Jackson2004 (cont’d)
nearly to the term of the RTO contract. They find that 90 percent of returnsoccur with less than 36 percent of the scheduled weekly payments made.
Applied Research andConsulting LLC. 2009.Financial Capability inthe United States: InitialReport of ResearchFindings from the 2009National Survey. NewYork: Applied Researchand Consulting LLC.
Individual-level surveydata
1,488 U.S.surveyrespondents, ofwhom 180 wereunbanked;nationallyrepresentative
Descriptiveanalysis
Of all respondents, 5 percent used a RTO store in the last five years. Tenpercent of 18–29 year-olds used a RTO store, compared with 5 percent of30–44 year-olds, 3 percent of those 45–59, and 0 percent of those 65 orabove. Sixteen percent of respondents making less than $25,000 used aRTO store, compared with 4 percent of those making between $25,000 to$75,000 and 1 percent of those making over $75,000. Seven percent ofthose with less than a high school education used a rent-to-own store ascompared with 6 percent of those who graduated high school, 4 percent ofthose with some college, and 1 percent of those with a college degree ormore.
More African Americans, 10 percent, used a rent-to-own store in the lastfive years than other racial/ethnic groups; 4 percent of Caucasians, 4percent of Hispanics, and 1 percent of Asians reported using a rent-to-ownstore. Of respondents who felt they were not good at dealing with day-to-day financial matters, 7 percent used a rent-to-own store, as comparedwith 4 percent of those who said that they were good at dealing with day-to-day financial matters. Of unbanked respondents, 14 percent reportedthe use of a RTO store. Only 3 percent of those considered banked used aRTO store.
FDIC Unbanked/Underbanked SurveyStudy Group. 2009. FDICNational Survey ofUnbanked andUnderbankedHouseholds.Washington, DC: FederalDeposit InsuranceCorporation.
Unbanked/UnderbankedSupplement tothe CurrentPopulationSurvey
47,000 U.S.householdssurveyed in2009; nationallyrepresentative
Descriptiveanalysis
Nearly 12 percent of unbanked households, those currently without achecking or savings account, have used a RTO agreement in the last fiveyears. Of the unbanked, previously banked households were more likely tohave used RTO arrangements than never-banked households (18 percentcompared with 7 percent). Seventeen percent of unbanked householdsthat used RTO agreements used them at least a few times a year; nearly 40percent used them once or twice a year. Forty-four percent of unbankedhouseholds that used RTO agreement used them almost never.
Of underbanked households, those that have a bank account but rely onalternative financial products, which used RTO agreements, 44 percentused them once or twice a year and another 44 percent used them almostnever. Only 12 percent of these households report using RTO agreementsat least a few times a year.

Rent-to-Own Agreements 29
Small-Dollar Loan Products and Financial Services: Literature Review MatrixEmpirical Studies of Rent-to-Own (RTO) Agreements
Source DataSample/Study
population Method Findings Acc
ess
Co
nsu
me
rB
eh
avi
or/
Sub
stit
ute
s
Co
sts
Fin
an
cia
lli
tera
cy
Loca
tio
nP
oli
cy
Lacko, J. M., S. M.McKernan and M.Hastak. 2000. Survey ofRent-to-Own Customers.Washington, DC: FederalTrade Commission.
and
Lacko, J.M., S. M.McKernan and M.Hastak. 2002. “CustomerExperience with Rent-to-Own Transactions.”Journal of Public Policy &Marketing 21(1): 126–38.
Individual-level surveydata collectedDecember1998–February 1999
12,136 U.S.households ofwhich 532 hadused RTO withinthe last fiveyears; nationallyrepresentative
Descriptiveanalysis
2.3 percent of U.S. households had used RTO transactions in the last yearand 4.9 percent, in the last five years. Compared with households who hadnot used RTO, RTO customers were more likely to be African American,younger, less educated, have lower incomes, have children, rent theirresidence, live in the South, and live in nonsuburban areas.
Most (67 percent) of RTO customers entered the transaction intending topurchase and most (70 percent) purchased. As a result, the authors suggestthat total cost and other terms of purchase should be provided on productlabels and in agreements. The authors state that APR disclosures and pricerestriction policies raise more difficult questions, because they could besubject to manipulation by RTO dealers, and price restrictions could limitavailability.
The authors state that careful analysis should be undertaken beforeadopting policies that would substantially limit availability of RTOtransactions because most (75 percent) of RTO customers are satisfied withtheir experience. Nineteen percent of RTO customers were dissatisfied,with the major complaint being about high prices.
Nearly half of all RTO customers had been late making a payment and 67percent of late customers reported the treatment they received from thestore when they were late was either “very good” or “good.” Elevenpercent of late customers reported possibly abusive collection practices.The authors concluded that these results suggest that federal regulation ofindustry collection practices may be unnecessary, but the most seriousabuses (such as unauthorized entry into customers’ homes) warrantcontinued attention, even if not widespread.
McKernan, S. M., J. M.Lacko, and M. Hastak.2003. “EmpiricalEvidence on theDeterminants of Rent-to-Own Use and PurchaseBehavior.” EconomicDevelopment Quarterly17(1): 33–52.
Individual-level surveydata collectedDecember1998–February 1999
and
12,136 U.S.households ofwhich 532 hadused RTO withinthe last fiveyears; nationallyrepresentative
Logitregression
DV: RTO use
DV: RTOpurchase
Multinomiallogit
Consumers with lower incomes (except those with incomes less than$15,000), less access to credit, less education, and that are AfricanAmerican are more likely to use RTO transactions with the intent topurchase. Based on these findings, the authors suggest that (1) consumersusing RTO transactions to purchase are likely to be drawn from lowerincome levels but not necessarily the most disadvantaged groups; (2) RTOcustomers uses the transactions because they lack other means to obtainthe merchandise, or at least obtain it as quickly; and (3) financial literacymay enable consumers to better assess the cost and make more informed

Rent-to-Own Agreements 30
Small-Dollar Loan Products and Financial Services: Literature Review MatrixEmpirical Studies of Rent-to-Own (RTO) Agreements
Source DataSample/Study
population Method Findings Acc
ess
Co
nsu
me
rB
eh
avi
or/
Sub
stit
ute
s
Co
sts
Fin
an
cia
lli
tera
cy
Loca
tio
nP
oli
cy
McKernan, Lacko, andHastak 2003 (cont’d)
State law datacompiled fromindustrysources andcourtdecisions
regression
DV: RTO usewith intent (1)to purchase,(2) to rent, (3)unsure.
decisions.
State laws also are associated with RTO customers’ intention of purchasingor renting from RTO stores. First, consumers living in states with total costlabel disclosure laws are less likely to use RTO to purchase than areconsumers living in other states, though this finding is not robust to allmodel specifications. The authors state that if this finding is reliable, it isconsistent with a conclusion that some customers underestimate the costin the absence of total cost disclosures and that disclosures more fullyinform these consumers, leading some to make different decisions.Second, customers in states with reinstatement laws are more likely toultimately purchase the merchandise than are customers in other states.The authors state that this preliminary finding suggests that reinstatementrights may benefit consumers by preventing the loss of merchandise if theymiss payments.