Embed Size (px)
Citation preview
Mol. Nutr. Food Res. 2013, 00, 1–10 1DOI 10.1002/mnfr.201200858
RESEARCH ARTICLE
Effects of chocolate supplementation on metabolic
and cardiovascular parameters in ApoE3L mice fed a
high-cholesterol atherogenic dietGopala K. Yakala1,2, Peter Y. Wielinga2,3, Manuel Suarez4,5, Annelies Bunschoten6,Jolanda M. van Golde2, Lluis Arola4,5, Jaap Keijer2,6, Robert Kleemann2,3, Teake Kooistra2,3
and Peter Heeringa1,2
1 Department of Pathology and Medical Biology, University Medical Center Groningen, University of Groningen,Groningen, The Netherlands
2 Top Institute Food and Nutrition, Wageningen, The Netherlands3 TNO-BioSciences, Leiden, The Netherlands4 Department of Biochemistry and Biotechnology, Nutrigenomics Research Group, Rovira and Virgili University,Tarragona, Spain
5 Centre Tecnologic de Nutricio i Salut (CTNS), TECNIO, Reus, Spain6 Human and Animal Physiology, Wageningen University, Wageningen, The Netherlands
Scope: Dietary intake of cocoa and/or chocolate has been suggested to exhibit protectivecardiovascular effects although this is still controversial. The aim of this study was to investigatethe effects of chocolate supplementation on metabolic and cardiovascular parameters.Methods and results: Four groups of ApoE*3Leiden mice were exposed to the followingdiet regimens. Group 1: cholesterol-free control diet (CO). Group 2: high-dose (1.0% w/w)control cholesterol (CC). Group 3: CC supplemented chocolate A (CCA) and Group 4: CCsupplemented chocolate B (CCB). Both chocolates differed in polyphenol and fiber content,CCA had a relatively high-polyphenol and low-fiber content compared to CCB. Mice fed ahigh-cholesterol diet showed increased plasma-cholesterol and developed atherosclerosis. Bothchocolate treatments, particularly CCA, further increased plasma-cholesterol and increasedatherosclerotic plaque formation. Moreover, compared to mice fed a high-cholesterol diet, bothchocolate-treated groups displayed increased liver injury. Mice on high-cholesterol diet hadelevated plasma levels of sVCAM-1, sE-selectin and SAA, which was further increased in theCCB group. Similar effects were observed for renal inflammation markers.Conclusion: The two chocolate preparations showed unfavorable, but different effects oncardiometabolic health in E3L mice, which dissimilarities may be related to differences inchocolate composition. We conclude that discrepancies reported on the effects of chocolate oncardiometabolic health may at least partly be due to differences in chocolate composition.
Keywords:
Atherosclerosis / Cardiovascular disease / Inflammation / Liver injury /Renal inflammation
Received: December 27, 2012Revised: April 5, 2013
Accepted: May 17, 2013
� Additional supporting information may be found in the online version of this article atthe publisher’s web-site
Correspondence: Dr. Gopala K. Yakala, Department of Pathologyand Medical Biology, University Medical Center Groningen, Uni-versity of Groningen, Medical Biology Section, Internal postalcode EA11, Hanzeplein 1, 9713 GZ Groningen, The NetherlandsE-mail: [email protected]: +31503619911
Abbreviations: ALAT, alanine transaminase; CC, control choles-terol; CCA, control cholesterol chocolate A; CCB, control choles-
1 Introduction
Cardiovascular disease (CVD) represents the leading cause ofmortality and morbidity on a global scale and the costs associ-ated with treatment of the growing number of CVD patientsare increasing correspondingly [1, 2]. To date, numerous
terol chocolate B; CVD, cardiovascular disease; SRM, selectedreaction monitoring
C© 2013 WILEY-VCH Verlag GmbH & Co. KGaA, Weinheim www.mnf-journal.com
2 G. K. Yakala et al. Mol. Nutr. Food Res. 2013, 00, 1–10
metabolic factors have been linked to the development ofCVD and atherosclerosis but especially elevated plasma lipidshave been extensively postulated as key predictors [3, 4].
Most of these cardiometabolic disorders can be avertedif necessary precautions are taken. Following a healthy di-etary lifestyle can play a potent role in controlling the existingand preventing the occurrence of impending chronic dis-eases [5–7]. From epidemiological studies it is evident thatregular intake of plant-derived products is inversely corre-lated with CVDs [8]. In particular, the intake of polyphenols,a subgroup of flavonoids commonly known as antioxidants,has been linked to improved cardiovascular health [9–11]. Co-coa and chocolate are a rich source of polyphenols, which areknown to exhibit protective cardiovascular effects by improv-ing endothelial function [12, 13].
However, there is conflicting data from human observa-tional and intervention studies with regards to the effect ofchocolate on cardiometabolic health. In some, but not allcases beneficial effects were observed [14] and these are at-tributed to polyphenols that are present in the diet [15]. Yet,it is difficult to make strong conclusions about the beneficialeffects of chocolate with human intervention studies becauseof discrepancies in dietary habits and genetic and ethnic dis-parity. Similarly, studies in experimental animal models sug-gest a potential beneficial effect of cacao on metabolic andvascular health. A study in Kurosawa and Kusanagi hyperc-holesterolemic rabbits showed that cacao liquor polyphenolsdecreased atherosclerotic plaque formation and foam cellformation upon cholesterol treatment [16]. Similarly, Lokeet al., reported that specific dietary polyphenols attenuateatherosclerosis by alleviating inflammation and endothelialdysfunction in apolipoprotein E-knockout mice [17]. Also, Os-akabe and Yasuda have reported that cacao procyanidins re-duced plasma cholesterol levels in cholesterol-fed rats [18,19].However, data on the beneficial effects of chocolate in theirnatural context on metabolic and vascular health are still lim-ited.
To investigate the effects of chocolate supplementationin experimental models, it is essential that the model cho-sen mimic the human situation as closely as possible. TheAPOE3*Leiden (E3L) is an established humanized mousemodel to study CVD and atherosclerosis because thesemice develop hyperlipidemia and hypercholesterolemia [20].E3L mice have an attenuated clearance of apoB-containinglipoproteins and consequently display a lipoprotein profilecomparable to that of patients with dysbetalipoproteinemia[20]. Unlike many other models of CVD, E3L mice respondpositively to lipid-lowering drugs such as, statins [21, 22] anddietary compounds including cafestol [23], fish oil [24], fenofi-brates [25], and polyphenols [26].
We previously showed that feeding E3L mice a diet supple-mented with high cholesterol (1% w/w), induces atherosclero-sis, systemic inflammation and inflammation in liver and kid-ney [4]. We now used this model to investigate whether dietarysupplementation of chocolates beneficially affects metabolicrisk factors and disease endpoints in a setting of diet-induced
atherosclerosis. To this end, we have compared these param-eters in mice fed a control, cholesterol rich (1% w/w) athero-genic diet with mice fed the same diet supplemented withchocolate. Bearing in mind that the composition of commer-cially available chocolates differs from one type of chocolate toanother, in particular with respect to the cocoa content [16],we used two different types of chocolates preparations dif-fering in polyphenol and fiber content. Chocolate A had arelatively high-polyphenol and low-fiber content compared tochocolate B. In this study, our main goal was to compare theeffects of the two chocolates that differed in their composi-tion and evaluate their effects on metabolic and cardiovascu-lar parameters in their natural context. The bioavailability ofphenolic compounds from cacao and chocolate is very com-plex and several papers have dealt with this subject in recentyears [27, 28]. Since the beneficial effect of the cocoa compo-nent is attributed to the polyphenol (flavonoid) content [12,13]and polyphenols have a variable bioavailability [29, 30], wehave assessed plasma polyphenol content, focusing on cocoa-relevant polyphenols, using MS.
2 Materials and methods
2.1 Animals and diets
Animal experiments were was performed according to thecriteria outlined in the “Guide for the Care and Use of Lab-oratory Animals” published by the National Institutes ofHealth (NIH) and were approved by an independent insti-tutional ethical committee on animal care and experimenta-tion (DEC, Zeist, The Netherlands, DEC number 2975). Fe-male ApoE*3-Leiden transgenic (E3L) mice (n = 76) were ob-tained from TNO-Metabolic Health Research, Gaubius Lab-oratory, Leiden, The Netherlands. Mice (12–14 weeks old)were group housed (—three to five mice per cage) with a 12-hlight/dark cycle and had access to water and diet ad libitum.Prior to their respective diet treatments, all animals remainedon maintenance chow (Sniff R/M diet V1530, Uden, TheNetherlands).
2.2 Study design
At the start of the study, the mice were divided into fourgroups of 19 animals each, matched for plasma cholesterol.Group 1 received a cholesterol free Western-type diet (CO;rodent diet T, Hope Farms, Woerden, The Netherlands), pro-vided as Supporting Information Table 4. Group 2 was fedthe same CO, supplemented with a high dose (1.0% w/w) ofcholesterol (CC; control cholesterol). Group 3 received a con-trol cholesterol diet supplemented with chocolate A (CCA;control cholesterol chocolate A; ACTICOA chocolate; Arti-cle: CHD-Q65ACTICOA-000; Barry Callebaut, Belgium) andGroup 4 received a control cholesterol diet supplemented
C© 2013 WILEY-VCH Verlag GmbH & Co. KGaA, Weinheim www.mnf-journal.com
Mol. Nutr. Food Res. 2013, 00, 1–10 3
with chocolate B (CCB; control cholesterol chocolate B;Article: CHD-L108018B01–000; Barry Callebaut, Belgium).The chocolate dosage used in this study is considered rele-vant for the human situation. The dosage in mice was alignedaccording to a dosage applicable in humans, assuming anintake of 70 g chocolate/person/day (= 0.875 g/kg/day). Be-cause mice have a tenfold higher metabolic rate, i.e. 8.75g/kg/day, the chocolate concentrations were in both cases8.75% w/w of the diet.
Both CCA and CCB are high in polyphenol content butdiffer in the polyphenol concentration and fiber content. Forthe CCA and CCB diets, cocoa butter was compensated basedon the chocolate content of CCA and CCB and thus com-parable between all the groups. All the major componentspresent in both chocolates are same and the total amountof fats in all the diets was kept constant and the diets didnot significantly differ in energy content. Both chocolate di-ets were prepared by homogenously mixing liquid chocolate(chocolate melted in a water bath at 55�C for 3 h), liquid cocoabutter (melted on a stove for approximately 1 h), cholesterol-free basic diet without cocoa butter, and cholesterol mixedwith agar. Diets were stored at −20�C until use. The grossenergy content of the diets was determined by assessing0.5 g of diet, in duplicate, in a bomb calorimeter (calorimeterC7000, IKA, Staufen, Germany). The composition of choco-lates used in this study is provided in Supporting InformationTable 1.
Body weight (individually) and food intake (at cage level)were monitored every 4 weeks and blood samples were takenby tail vein incision after 4 h of fasting at t = 0 and weeks 4,8, 12, 16, and 20. At sacrifice, spot urine was collected fromindividual animals. After 20 weeks of the experimental dietfeeding, mice were fasted for 4 h and sacrificed by CO2 andorgans were isolated and weighed. Adipose tissues, aortas,livers (median lobe), and kidneys (left) were formalin fixedand embedded in paraffin; livers (sinister and caudate lobes)and kidneys (right) were snap frozen in liquid N2 and storedat −80�C until further use.
2.3 Analysis of plasma lipids, lipoprotein profiles,
and plasma inflammation markers
Total plasma cholesterol and triglyceride levels were mea-sured after 4 h of fasting, using kits number 11489437and 11488872 (Roche Diagnostics, Almere, The Nether-lands), respectively. For lipoprotein profiles, pooled plasmawas fractionated using an AKTA FPLC system (Pharma-cia, Roosendaal, The Netherlands) [31]. Plasma ALAT (ala-nine transaminase) levels were determined spectrophoto-metrically using a Reflotron system (Roche Diagnostics).The plasma levels of E-selectin, VCAM-1 (all R&D SystemsEurope, Ltd., Abington, UK), insulin (Alpco, Tilburg, TheNetherlands), and SAA (Biosource, Nivelles, Belgium) at sac-rifice were determined by ELISA as reported [4].
2.4 Plasma polyphenol metabolites extraction and
quantification
The extraction of the chocolate metabolites at sacrifice fromserum (nine random serum samples from the same dietarygroup pooled as three samples, n = 3) samples in the fedstate was carried out by using OASIS HLB �Elution Plates30 �m (Waters, Milford, USA) following the method de-scribed by Serra et al. (2011) with some modifications [32].First, the wells were sequentially conditioned by using 250�L of methanol and 250 �L of milliQ water/acetic acid(99.2:0.2, v/v). For the extraction of the metabolites, 600 �Lof a mixture of serum and phosphoric acid 4% containingcatechol as internal standard were loaded onto the plate. Af-ter that, the clean-up of the plates was sequentially done with200 �L of milliQ water and 200 �L of milliQ water/acetic acid(99.2:0.2, v/v) to eliminate any interference that the samplemight contain. Finally, the elution of the retained metaboliteswas done with 2 × 50 �L of acetone/miliQ water/acetic acid(70:29.5:0.5, v/v/v).
Chocolate metabolites in the serum samples were quanti-fied and identified by using an HPLC-MS/MS system consist-ing of an Agilent HPLC 1200 Series (Agilent Technologies,Palo Alto, USA). A Zorbax SB-Aq column (3.5 �m,150 mm × 2.1 mm i.d.) equipped with a pre-columnZorbax SB-C18 (3.5 �m, 15 mm × 2.1 mm i.d.) (AgilentTechnologies) was used to carry on the analysis. The HPLCwas coupled to a triple quadrupole mass spectrometer 6410(Agilent Technologies). Data acquisition was carried out us-ing Masshunter software.
Analyses of the serum metabolites were carried out inelectrospray (ESI) in the negative mode. The selected reactionmonitoring (SRM) transitions and the individual fragmentorvoltage and collision energy for each compound were evalu-ated by infusing 10 mg/L of each compound to obtain the bestinstrumental conditions. Two transitions were acquired foreach compound, one for quantification and a second for con-firmation purposes. The selected SRM transitions and theinstrumental parameters for each compound are shown inSupporting Information Table 2A and B.
Quality parameters of the analytical method (linearity, re-covery, accuracy, reproducibility, LOD, and LOQ) were eval-uated to confirm the reliability of the method. These pa-rameters were determined by spiking basal plasma with 14commercially standards at known concentrations. Resultsconfirm the suitability of the method to study the phenolicmetabolite composition of plasma samples (data not shown).
2.5 Histological analysis of atherosclerosis
Serial cross-sections (5 �m thick) were taken throughout theentire aortic root area for histological analysis of atheroscle-rosis. Briefly, paraffin-embedded aortic cross-sections werestained with hematoxylin-phloxine-saffron and atheroscle-rotic lesion area was analyzed blindly in four cross-sections of
C© 2013 WILEY-VCH Verlag GmbH & Co. KGaA, Weinheim www.mnf-journal.com
4 G. K. Yakala et al. Mol. Nutr. Food Res. 2013, 00, 1–10
each specimen (at intervals of 50 �m). Cell-D software (Olym-pus Soft Imagine Solutions GmbH) was used for morphome-tric computer-assisted quantification of lesion number, lesionarea, and lesion severity according to the classification of theAmerican Heart Association as established [21].
2.6 Renal RNA extraction and gene expression
analysis
Total RNA was extracted from thirty 5 �m thin cryosec-tions from kidney using RNeasy Mini plus Kit (Qiagen,Westburg, Leusden, The Netherlands) according to the man-ufacturer’s instructions. Integrity of RNA was determinedby Agarose gel electrophoresis. RNA quantity (OD-260) andquality (OD-260/OD-280) were determined using an ND-1,000 UV-Vis spectrophotometer (NanoDrop Technologies,Rockland, DE, USA). Total RNA was reverse-transcribed us-ing SuperScript III reverse transcriptase (Invitrogen, Breda,The Netherlands) and random hexamer primers (Promega,Leiden, The Netherlands). To detect the expression of se-lected target genes Assays-On-DemandTM gene expressionprimer/probe sets (ABI Systems, Foster City, CA, USA)were used. Endogenous B-actin (assay Mm01205647_g1)was used as a housekeeping gene along with the follow-ing probes: CD68 (assay IDMm00839636_g1), monocytechemotactic protein-1 (MCP-1; assay IDMm00441242_m1),VCAM-1 (assay IDMm00449197_m1), and E-selectin (assayIDMm00441278_m1). Real-time PCR was performed in du-plicate and the obtained threshold cycle (CT) values wereaveraged. Relative mRNA levels were calculated as 2-�CT, inwhich �CT is CT gene of interest—CT housekeeping gene.
2.7 Kidney function measured by albuminuria
To assess renal function, the microalbumin levels were mea-sured in mouse urine using a commercially available ELISAkit (Mouse Albumin ELISA Quantitation set, Bethyl Labora-tories, Montgomery, Texas, USA) according to the manufac-turer’s instructions.
2.8 Renal histology and immunohistochemistry
For light microscopy, 3 �m renal paraffin sectionswere stained with periodic acid Schiff’s as reported [33].Immunohistochemical staining for macrophages was per-formed on acetone-fixed 5 �m cryosections using an anti-rabbit peroxidase-based Envision R©+ system (DakoCytoma-tion, Carpinteria, CA, USA). Briefly, sections were incubatedfor 60 min with 5 �g/mL rat-anti-mouse CD68 (clone FA11,Serotech, Puchheim, Germany), followed by a 30-min incu-bation with 10 �g/mL unlabeled rabbit-anti-rat secondary an-tibody (Vector Laboratories, Burlingame, CA, USA). After de-tection of peroxidase activity with 3-amino-9-ethylcarbazole,sections were counterstained with Mayer’s hematoxylin.
2.9 Liver aconitase and citrate synthase activity
Liver was grinded in liquid nitrogen and further homoge-nized using a disposable pestle in a microtube containingice cooled 50 mM Tris-HCl, pH 7.4. All handling was doneon ice until measurement. Protein concentrations were mea-sured using the DC Protein Assay (Bio-Rad, Veenendaal, TheNetherlands) according to the manufacturer’s instructions.Maximal aconitase activity was determined in fourfold bymonitoring the formation of NADPH as described [34]. Ab-sorbance at 340 nm was measured during 1 h at 37�C in amicroplate reader (BioTek, Winooski, USA) and the maximalaconitase activity was calculated from the slope of the linearpart of the curve. Citrate synthase was measured in tripli-cate in a 96-well plates using the Citrate Synthase assay kit(Sigma-Aldrich, St. Louis, USA) according to the manufac-turer’s instructions. Absorption was measured for 1 h at 25�Cin a microplate reader (BioTek, Winooski, USA) and the max-imal citrate synthase activity was calculated from the slope ofthe linear part of the curve.
2.10 Statistical analysis
Data were analyzed with Graphpad prism (Graphpad soft-ware 5.0, San Diego CA, USA) and SPSS 17.0 for Windows.Differences between groups at one specific time point wereanalyzed with one-way ANOVA followed by LSD posthocanalysis. Changes over time were statistically analyzed withone-way ANOVA (repeated measures for within subject sam-ples) and LSD posthoc, unless stated otherwise. p < 0.05 wasconsidered significant. Results are shown as means ± SEM,unless stated otherwise.
3 Results
3.1 Body weight, fat tissue masses, and food intake
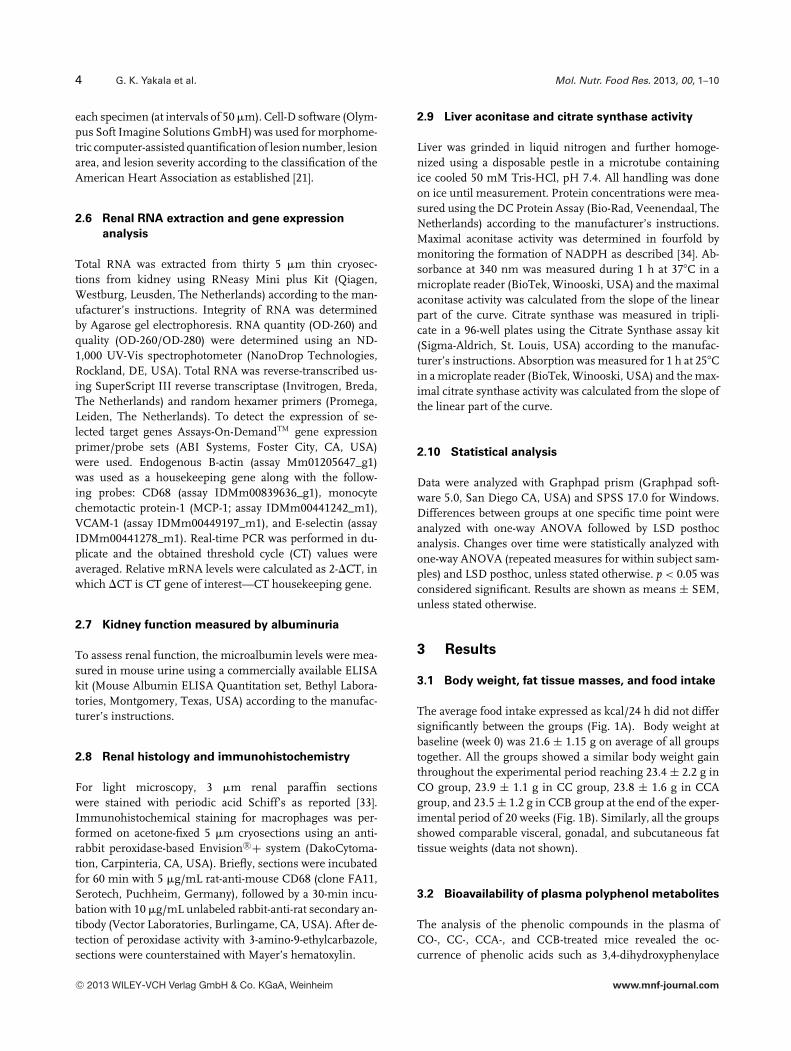
The average food intake expressed as kcal/24 h did not differsignificantly between the groups (Fig. 1A). Body weight atbaseline (week 0) was 21.6 ± 1.15 g on average of all groupstogether. All the groups showed a similar body weight gainthroughout the experimental period reaching 23.4 ± 2.2 g inCO group, 23.9 ± 1.1 g in CC group, 23.8 ± 1.6 g in CCAgroup, and 23.5 ± 1.2 g in CCB group at the end of the exper-imental period of 20 weeks (Fig. 1B). Similarly, all the groupsshowed comparable visceral, gonadal, and subcutaneous fattissue weights (data not shown).
3.2 Bioavailability of plasma polyphenol metabolites
The analysis of the phenolic compounds in the plasma ofCO-, CC-, CCA-, and CCB-treated mice revealed the oc-currence of phenolic acids such as 3,4-dihydroxyphenylace
C© 2013 WILEY-VCH Verlag GmbH & Co. KGaA, Weinheim www.mnf-journal.com
Mol. Nutr. Food Res. 2013, 00, 1–10 5
Figure 1. Effect of chocolates on food in-take and body weight gain. (A) Food intakeand (B) body weight gain. Groups are ab-breviated as: Mice fed control diet withoutcholesterol (CO, n = 19); mice fed controldiet (i.e. with 1% cholesterol) (CC, n = 19);mice fed control diet supplemented withchoc A (CCA, n = 19); and mice fed controldiet supplemented with choc B (CCB, n =19).
tic, protocatechuic, hippuric, p-hydroxyphenylacetic, 3-hydroxyphenylacetic, vanillic, p-coumaric, ferulic, and benzoicacids. Besides, some flavonoids were also identified suchas catechin, epicatechin, and procyanidin B2. Additionally,both chocolate (CCA and CCB) treated groups revealed thepresence of methyl and sulphate derivatives of (epi)catechinincluding methyl catechin glucuronide, methyl epicatechinglucuronide, epicatechin glucuronide, catechin sulphate,methyl epicatechin-O-sulphate, epicatechin sulphate, and3-O-methyl epicatechin. These metabolites are specific of co-coa consumption and therefore, were absent in both CO- andCC-treated groups. The SRM transitions and the instrumen-tal parameters for each plasma metabolite are listed in Sup-porting Information Table 2. The individual concentrationsof these polyphenols and their corresponding metabolites arelisted in the Supporting Information Table 3. Comparing theconcentrations of these plasma metabolites levels between thetwo chocolates, values were almost ten times higher in CCA
compared to CCB. The principal difference in the phenolicfraction of the two chocolates is in the flavonoids (catechins,epicathechins, and procyanidins), which are consideredto constitute the beneficial compounds of cocao/chocolate[29, 30]. This result is consistent with the different phenoliccontent of both chocolates used in the study.
3.3 Plasma lipids and atherosclerosis
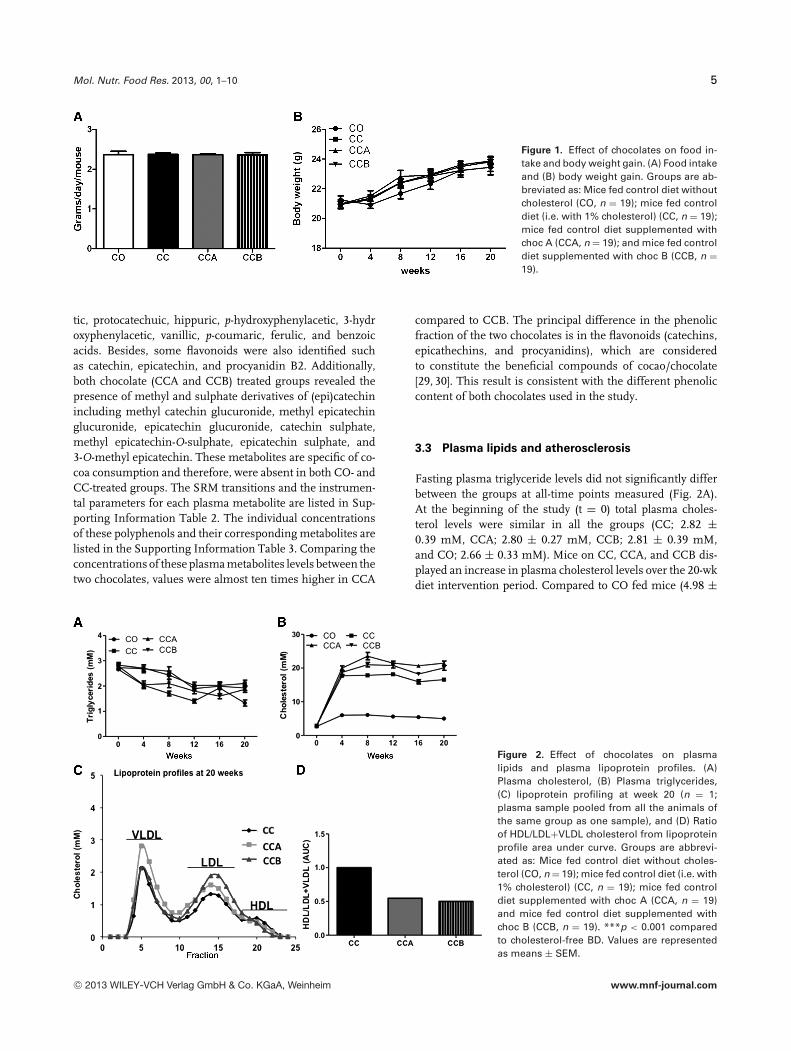
Fasting plasma triglyceride levels did not significantly differbetween the groups at all-time points measured (Fig. 2A).At the beginning of the study (t = 0) total plasma choles-terol levels were similar in all the groups (CC; 2.82 ±0.39 mM, CCA; 2.80 ± 0.27 mM, CCB; 2.81 ± 0.39 mM,and CO; 2.66 ± 0.33 mM). Mice on CC, CCA, and CCB dis-played an increase in plasma cholesterol levels over the 20-wkdiet intervention period. Compared to CO fed mice (4.98 ±
Figure 2. Effect of chocolates on plasmalipids and plasma lipoprotein profiles. (A)Plasma cholesterol, (B) Plasma triglycerides,(C) lipoprotein profiling at week 20 (n = 1;plasma sample pooled from all the animals ofthe same group as one sample), and (D) Ratioof HDL/LDL+VLDL cholesterol from lipoproteinprofile area under curve. Groups are abbrevi-ated as: Mice fed control diet without choles-terol (CO, n = 19); mice fed control diet (i.e. with1% cholesterol) (CC, n = 19); mice fed controldiet supplemented with choc A (CCA, n = 19)and mice fed control diet supplemented withchoc B (CCB, n = 19). ***p < 0.001 comparedto cholesterol-free BD. Values are representedas means ± SEM.
C© 2013 WILEY-VCH Verlag GmbH & Co. KGaA, Weinheim www.mnf-journal.com
6 G. K. Yakala et al. Mol. Nutr. Food Res. 2013, 00, 1–10
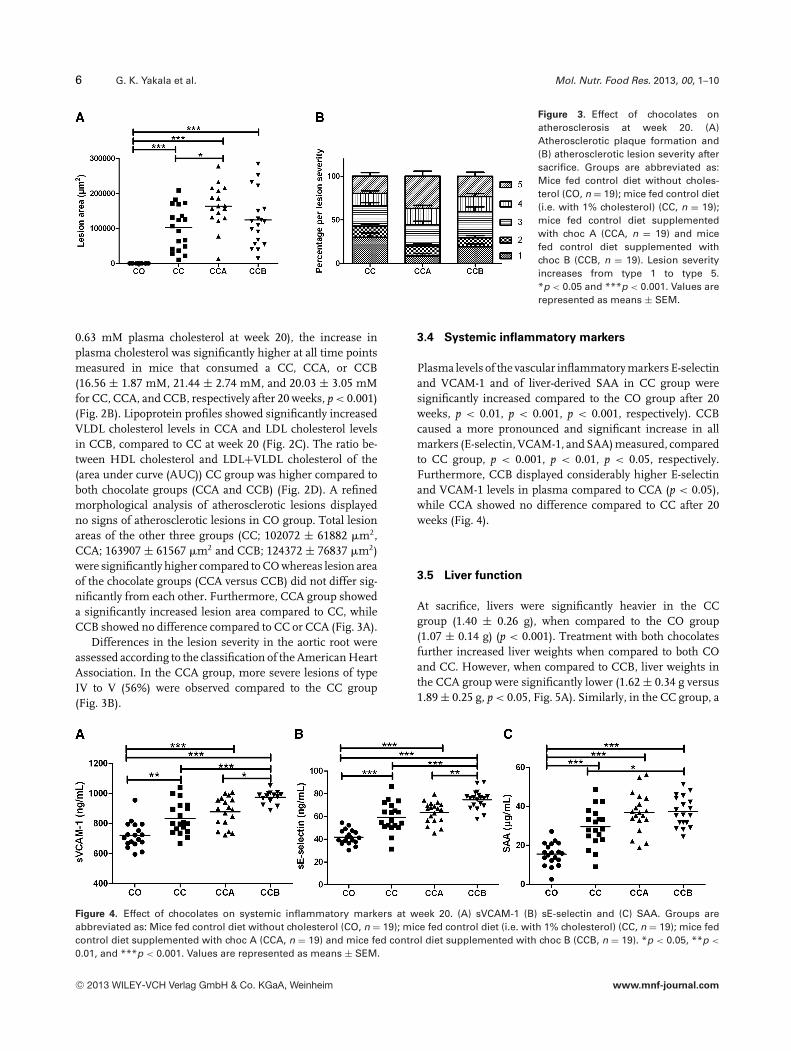
Figure 3. Effect of chocolates onatherosclerosis at week 20. (A)Atherosclerotic plaque formation and(B) atherosclerotic lesion severity aftersacrifice. Groups are abbreviated as:Mice fed control diet without choles-terol (CO, n = 19); mice fed control diet(i.e. with 1% cholesterol) (CC, n = 19);mice fed control diet supplementedwith choc A (CCA, n = 19) and micefed control diet supplemented withchoc B (CCB, n = 19). Lesion severityincreases from type 1 to type 5.*p < 0.05 and ***p < 0.001. Values arerepresented as means ± SEM.
0.63 mM plasma cholesterol at week 20), the increase inplasma cholesterol was significantly higher at all time pointsmeasured in mice that consumed a CC, CCA, or CCB(16.56 ± 1.87 mM, 21.44 ± 2.74 mM, and 20.03 ± 3.05 mMfor CC, CCA, and CCB, respectively after 20 weeks, p < 0.001)(Fig. 2B). Lipoprotein profiles showed significantly increasedVLDL cholesterol levels in CCA and LDL cholesterol levelsin CCB, compared to CC at week 20 (Fig. 2C). The ratio be-tween HDL cholesterol and LDL+VLDL cholesterol of the(area under curve (AUC)) CC group was higher compared toboth chocolate groups (CCA and CCB) (Fig. 2D). A refinedmorphological analysis of atherosclerotic lesions displayedno signs of atherosclerotic lesions in CO group. Total lesionareas of the other three groups (CC; 102072 ± 61882 �m2,CCA; 163907 ± 61567 �m2 and CCB; 124372 ± 76837 �m2)were significantly higher compared to CO whereas lesion areaof the chocolate groups (CCA versus CCB) did not differ sig-nificantly from each other. Furthermore, CCA group showeda significantly increased lesion area compared to CC, whileCCB showed no difference compared to CC or CCA (Fig. 3A).
Differences in the lesion severity in the aortic root wereassessed according to the classification of the American HeartAssociation. In the CCA group, more severe lesions of typeIV to V (56%) were observed compared to the CC group(Fig. 3B).
3.4 Systemic inflammatory markers
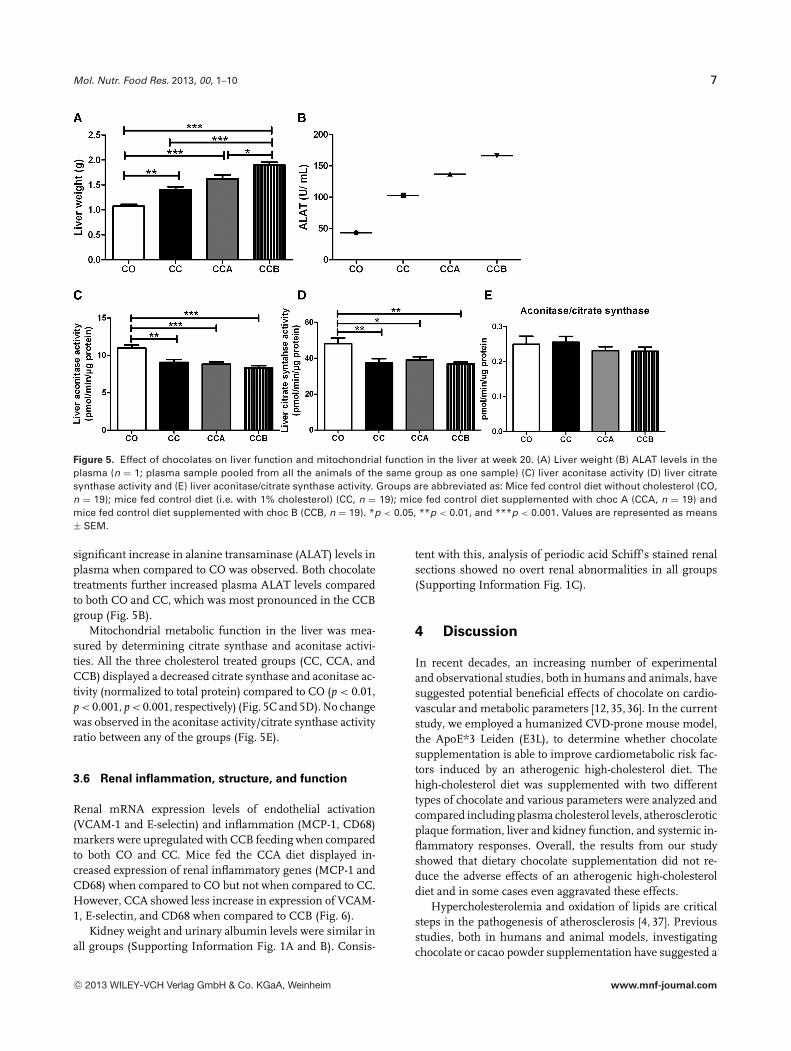
Plasma levels of the vascular inflammatory markers E-selectinand VCAM-1 and of liver-derived SAA in CC group weresignificantly increased compared to the CO group after 20weeks, p < 0.01, p < 0.001, p < 0.001, respectively). CCBcaused a more pronounced and significant increase in allmarkers (E-selectin, VCAM-1, and SAA) measured, comparedto CC group, p < 0.001, p < 0.01, p < 0.05, respectively.Furthermore, CCB displayed considerably higher E-selectinand VCAM-1 levels in plasma compared to CCA (p < 0.05),while CCA showed no difference compared to CC after 20weeks (Fig. 4).
3.5 Liver function
At sacrifice, livers were significantly heavier in the CCgroup (1.40 ± 0.26 g), when compared to the CO group(1.07 ± 0.14 g) (p < 0.001). Treatment with both chocolatesfurther increased liver weights when compared to both COand CC. However, when compared to CCB, liver weights inthe CCA group were significantly lower (1.62 ± 0.34 g versus1.89 ± 0.25 g, p < 0.05, Fig. 5A). Similarly, in the CC group, a
Figure 4. Effect of chocolates on systemic inflammatory markers at week 20. (A) sVCAM-1 (B) sE-selectin and (C) SAA. Groups areabbreviated as: Mice fed control diet without cholesterol (CO, n = 19); mice fed control diet (i.e. with 1% cholesterol) (CC, n = 19); mice fedcontrol diet supplemented with choc A (CCA, n = 19) and mice fed control diet supplemented with choc B (CCB, n = 19). *p < 0.05, **p <
0.01, and ***p < 0.001. Values are represented as means ± SEM.
C© 2013 WILEY-VCH Verlag GmbH & Co. KGaA, Weinheim www.mnf-journal.com
Mol. Nutr. Food Res. 2013, 00, 1–10 7
Figure 5. Effect of chocolates on liver function and mitochondrial function in the liver at week 20. (A) Liver weight (B) ALAT levels in theplasma (n = 1; plasma sample pooled from all the animals of the same group as one sample) (C) liver aconitase activity (D) liver citratesynthase activity and (E) liver aconitase/citrate synthase activity. Groups are abbreviated as: Mice fed control diet without cholesterol (CO,n = 19); mice fed control diet (i.e. with 1% cholesterol) (CC, n = 19); mice fed control diet supplemented with choc A (CCA, n = 19) andmice fed control diet supplemented with choc B (CCB, n = 19). *p < 0.05, **p < 0.01, and ***p < 0.001. Values are represented as means± SEM.
significant increase in alanine transaminase (ALAT) levels inplasma when compared to CO was observed. Both chocolatetreatments further increased plasma ALAT levels comparedto both CO and CC, which was most pronounced in the CCBgroup (Fig. 5B).
Mitochondrial metabolic function in the liver was mea-sured by determining citrate synthase and aconitase activi-ties. All the three cholesterol treated groups (CC, CCA, andCCB) displayed a decreased citrate synthase and aconitase ac-tivity (normalized to total protein) compared to CO (p < 0.01,p < 0.001, p < 0.001, respectively) (Fig. 5C and 5D). No changewas observed in the aconitase activity/citrate synthase activityratio between any of the groups (Fig. 5E).
3.6 Renal inflammation, structure, and function
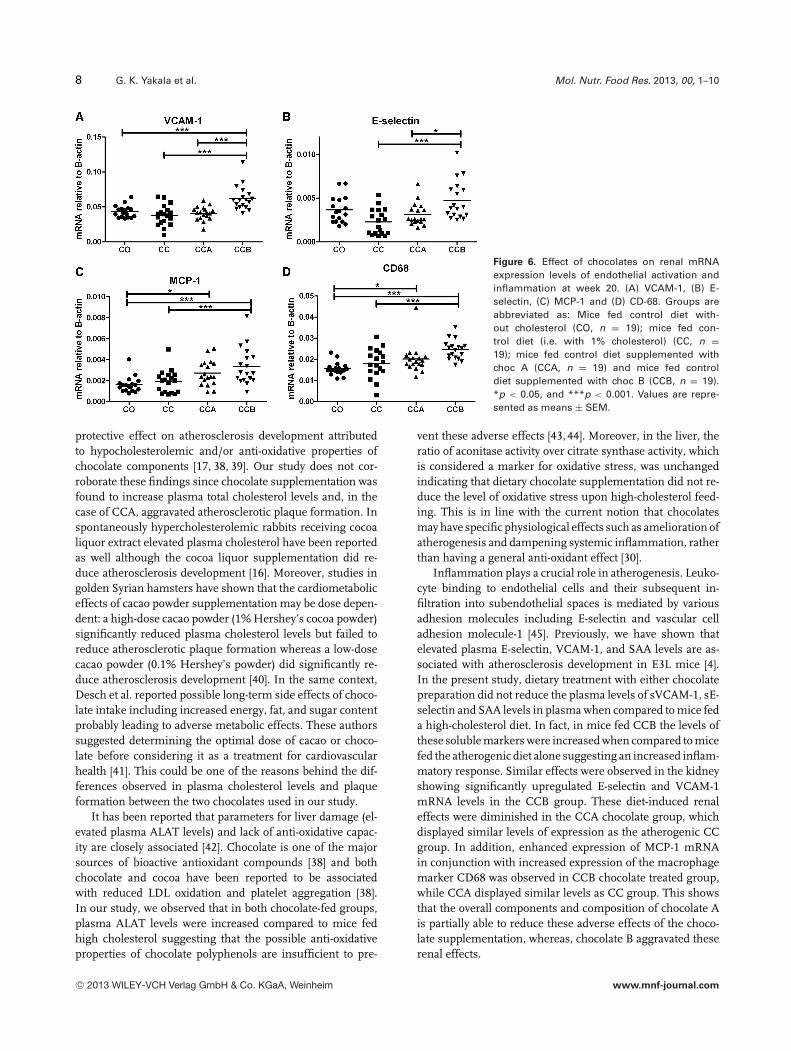
Renal mRNA expression levels of endothelial activation(VCAM-1 and E-selectin) and inflammation (MCP-1, CD68)markers were upregulated with CCB feeding when comparedto both CO and CC. Mice fed the CCA diet displayed in-creased expression of renal inflammatory genes (MCP-1 andCD68) when compared to CO but not when compared to CC.However, CCA showed less increase in expression of VCAM-1, E-selectin, and CD68 when compared to CCB (Fig. 6).
Kidney weight and urinary albumin levels were similar inall groups (Supporting Information Fig. 1A and B). Consis-
tent with this, analysis of periodic acid Schiff’s stained renalsections showed no overt renal abnormalities in all groups(Supporting Information Fig. 1C).
4 Discussion
In recent decades, an increasing number of experimentaland observational studies, both in humans and animals, havesuggested potential beneficial effects of chocolate on cardio-vascular and metabolic parameters [12,35,36]. In the currentstudy, we employed a humanized CVD-prone mouse model,the ApoE*3 Leiden (E3L), to determine whether chocolatesupplementation is able to improve cardiometabolic risk fac-tors induced by an atherogenic high-cholesterol diet. Thehigh-cholesterol diet was supplemented with two differenttypes of chocolate and various parameters were analyzed andcompared including plasma cholesterol levels, atheroscleroticplaque formation, liver and kidney function, and systemic in-flammatory responses. Overall, the results from our studyshowed that dietary chocolate supplementation did not re-duce the adverse effects of an atherogenic high-cholesteroldiet and in some cases even aggravated these effects.
Hypercholesterolemia and oxidation of lipids are criticalsteps in the pathogenesis of atherosclerosis [4, 37]. Previousstudies, both in humans and animal models, investigatingchocolate or cacao powder supplementation have suggested a
C© 2013 WILEY-VCH Verlag GmbH & Co. KGaA, Weinheim www.mnf-journal.com
8 G. K. Yakala et al. Mol. Nutr. Food Res. 2013, 00, 1–10
Figure 6. Effect of chocolates on renal mRNAexpression levels of endothelial activation andinflammation at week 20. (A) VCAM-1, (B) E-selectin, (C) MCP-1 and (D) CD-68. Groups areabbreviated as: Mice fed control diet with-out cholesterol (CO, n = 19); mice fed con-trol diet (i.e. with 1% cholesterol) (CC, n =19); mice fed control diet supplemented withchoc A (CCA, n = 19) and mice fed controldiet supplemented with choc B (CCB, n = 19).*p < 0.05, and ***p < 0.001. Values are repre-sented as means ± SEM.
protective effect on atherosclerosis development attributedto hypocholesterolemic and/or anti-oxidative properties ofchocolate components [17, 38, 39]. Our study does not cor-roborate these findings since chocolate supplementation wasfound to increase plasma total cholesterol levels and, in thecase of CCA, aggravated atherosclerotic plaque formation. Inspontaneously hypercholesterolemic rabbits receiving cocoaliquor extract elevated plasma cholesterol have been reportedas well although the cocoa liquor supplementation did re-duce atherosclerosis development [16]. Moreover, studies ingolden Syrian hamsters have shown that the cardiometaboliceffects of cacao powder supplementation may be dose depen-dent: a high-dose cacao powder (1% Hershey’s cocoa powder)significantly reduced plasma cholesterol levels but failed toreduce atherosclerotic plaque formation whereas a low-dosecacao powder (0.1% Hershey’s powder) did significantly re-duce atherosclerosis development [40]. In the same context,Desch et al. reported possible long-term side effects of choco-late intake including increased energy, fat, and sugar contentprobably leading to adverse metabolic effects. These authorssuggested determining the optimal dose of cacao or choco-late before considering it as a treatment for cardiovascularhealth [41]. This could be one of the reasons behind the dif-ferences observed in plasma cholesterol levels and plaqueformation between the two chocolates used in our study.
It has been reported that parameters for liver damage (el-evated plasma ALAT levels) and lack of anti-oxidative capac-ity are closely associated [42]. Chocolate is one of the majorsources of bioactive antioxidant compounds [38] and bothchocolate and cocoa have been reported to be associatedwith reduced LDL oxidation and platelet aggregation [38].In our study, we observed that in both chocolate-fed groups,plasma ALAT levels were increased compared to mice fedhigh cholesterol suggesting that the possible anti-oxidativeproperties of chocolate polyphenols are insufficient to pre-
vent these adverse effects [43, 44]. Moreover, in the liver, theratio of aconitase activity over citrate synthase activity, whichis considered a marker for oxidative stress, was unchangedindicating that dietary chocolate supplementation did not re-duce the level of oxidative stress upon high-cholesterol feed-ing. This is in line with the current notion that chocolatesmay have specific physiological effects such as amelioration ofatherogenesis and dampening systemic inflammation, ratherthan having a general anti-oxidant effect [30].
Inflammation plays a crucial role in atherogenesis. Leuko-cyte binding to endothelial cells and their subsequent in-filtration into subendothelial spaces is mediated by variousadhesion molecules including E-selectin and vascular celladhesion molecule-1 [45]. Previously, we have shown thatelevated plasma E-selectin, VCAM-1, and SAA levels are as-sociated with atherosclerosis development in E3L mice [4].In the present study, dietary treatment with either chocolatepreparation did not reduce the plasma levels of sVCAM-1, sE-selectin and SAA levels in plasma when compared to mice feda high-cholesterol diet. In fact, in mice fed CCB the levels ofthese soluble markers were increased when compared to micefed the atherogenic diet alone suggesting an increased inflam-matory response. Similar effects were observed in the kidneyshowing significantly upregulated E-selectin and VCAM-1mRNA levels in the CCB group. These diet-induced renaleffects were diminished in the CCA chocolate group, whichdisplayed similar levels of expression as the atherogenic CCgroup. In addition, enhanced expression of MCP-1 mRNAin conjunction with increased expression of the macrophagemarker CD68 was observed in CCB chocolate treated group,while CCA displayed similar levels as CC group. This showsthat the overall components and composition of chocolate Ais partially able to reduce these adverse effects of the choco-late supplementation, whereas, chocolate B aggravated theserenal effects.
C© 2013 WILEY-VCH Verlag GmbH & Co. KGaA, Weinheim www.mnf-journal.com
Mol. Nutr. Food Res. 2013, 00, 1–10 9
In the present study, we observed differential effects of thetwo chocolates on systemic and organ-specific inflammatoryparameters. Both CCA and CCB show no effect or unfavorableeffects on plasma parameters, atherosclerosis, and/or kidneystatus when compared with CC. These unfavorable effectscannot be easily explained because the chocolate preparationsdiffer in many components and we can only speculate. Sup-plementation with chocolate A (CCA group) appeared to beless unfavorable than chocolate B (CCB group) with respectto plasma and renal inflammatory parameters. This may berelated to the higher circulating polyphenol concentrationspresent in the CCA group (see Supporting Information Table3), which would be in line with reported anti-inflammatoryeffects of cocoa polyphenols [46]. However, CCA was unsuc-cessful in reducing the adverse effects caused by the athero-genic diet (CC) itself and mice in this group developed moresevere atherosclerosis compared to the CC group. This maybe due to the higher plasma cholesterol levels observed inthe CCA group. In contrast, the reduced atherosclerosis de-velopment observed in the CCB group may be attributed to acholesterol-lowering effect of fibers of which the content washigher in the CCB group. Interestingly, in a meta-analysis,dietary fiber intake has been associated with lower cholesterollevels [47].
In all, the present study shows that two chocolate prepara-tions differing in the content of polyphenols, fiber, and oth-ers, both unfavorably affected cardiovascular and metabolichealth, albeit to a different extent. Together with previousfindings demonstrating that different dietary doses of choco-lates can also exert dissimilar effects on CVD outcome [40,41],we conclude that discrepancies reported on the effects ofchocolate on cardiometabolic health may at least partly bedue to differences in chocolate composition and quantityconsumed.
The authors’ responsibilities were as follows: Conceived anddesigned the experiments: T.K., R.K., P.Y.W., G.K.Y., P.H., J.K.,and J.V.G. Performed the experiments: G.K.Y., P.Y.W., A.B.,M.S., J.K., R.K., T.K., and P.H. Analyzed the data: G.K.Y.,P.Y.W., A.B., M.S., J.K., R.K., T.K., and PH. Wrote the paper:G.K.Y., M.S., J.K., T.K., and P.H. All authors read and approvedthe final manuscript.
The authors have declared no conflict of interest.
5 References
[1] Rosamond, W., Flegal, K., Friday, G., Furie, K. et al., Heartdisease and stroke statistics–2007 update: a report from theAmerican Heart Association Statistics Committee and StrokeStatistics Subcommittee. Circulation 2007, 115, e69–e171.
[2] Rosamond, W., Flegal, K., Furie, K., Go, A. et al., Heart dis-ease and stroke statistics–2008 update: a report from theAmerican Heart Association Statistics Committee and StrokeStatistics Subcommittee. Circulation 2008, 117, e25–e146.
[3] Ballantyne, C., Arroll, B., Shepherd, J., Lipids and CVD man-
agement: towards a global consensus. Eur Heart J. 2005, 26,2224–2231.
[4] Wielinga, P. Y., Yakala, G. K., Heeringa, P., Kleemann, R.et al., Beneficial effects of alternate dietary regimen on liverinflammation, atherosclerosis and renal activation. PloS One2011, 6, e18432.
[5] Hu, F. B., Willett, W. C., Optimal diets for prevention of coro-nary heart disease. JAMA 2002, 288, 2569–2578.
[6] Ding, E. L., Mozaffarian, D., Optimal dietary habits for theprevention of stroke. Semin. Neurol. 2006, 26, 11–23.
[7] Stampfer, M. J., Hu, F. B., Manson, J. E., Rimm, E. B. et al.,Primary prevention of coronary heart disease in womenthrough diet and lifestyle. N. Eng. J. Med. 2000, 343,16–22.
[8] Hertog, M. G., Feskens, E. J., Hollman, P. C., Katan, M. B.et al., Dietary antioxidant flavonoids and risk of coronaryheart disease: the Zutphen elderly study. Lancet 1993, 342,1007–1011.
[9] Scalbert, A., Johnson, I. T., Saltmarsh, M., Polyphenols:antioxidants and beyond. Am. J. Clin. Nutr. 2005, 81,215S–217S.
[10] Manach, C., Mazur, A., Scalbert, A., Polyphenols and preven-tion of cardiovascular diseases. Curr. Opin. Lipidol. 2005, 16,77–84.
[11] Arts, I. C., Hollman, P. C., Polyphenols and disease riskin epidemiologic studies. Am. J. Clin. Nutr. 2005, 81,317S–325S.
[12] Corti, R., Flammer, A. J., Hollenberg, N. K., Luscher, T.F., Cocoa and cardiovascular health. Circulation 2009, 119,1433–1441.
[13] Fernandez-Murga, L., Tarin, J. J., Garcia-Perez, M. A., Cano,A., The impact of chocolate on cardiovascular health. Matu-ritas 2011, 69, 312–321.
[14] Buitrago-Lopez, A., Sanderson, J., Johnson, L., Warnakula,S. et al., Chocolate consumption and cardiometabolic disor-ders: systematic review and meta-analysis. BMJ 2011, 343,d4488.
[15] Erdman, J. W., Jr, Carson, L., Kwik-Uribe, C., Evans, E. M. etal., Effects of cocoa flavanols on risk factors for cardiovas-cular disease. Asia Pacific J. Clin. Nutr. 2008, 17(Suppl 1),284–287.
[16] Kurosawa, T., Itoh, F., Nozaki, A., Nakano, Y. et al., Suppres-sive effects of cacao liquor polyphenols (CLP) on LDL oxi-dation and the development of atherosclerosis in Kurosawaand Kusanagi hypercholesterolemic rabbits. Atherosclerosis2005, 179, 237–246.
[17] Loke, W. M., Proudfoot, J. M., Hodgson, J. M., McKinley, A. J.et al., Specific dietary polyphenols attenuate atherosclerosisin apolipoprotein E-knockout mice by alleviating inflamma-tion and endothelial dysfunction. Arterioscler. Thromb. Vasc.Biol. 2010, 30, 749–757.
[18] Osakabe, N., Yamagishi, M., Procyanidins in Theobroma ca-cao reduce plasma cholesterol levels in high cholesterol-fedrats. J. Clin. Biochem. Nutr. 2009, 45, 131–136.
[19] Yasuda, A., Natsume, M., Sasaki, K., Baba, S. et al., Cacaoprocyanidins reduce plasma cholesterol and increase fecal
C© 2013 WILEY-VCH Verlag GmbH & Co. KGaA, Weinheim www.mnf-journal.com
10 G. K. Yakala et al. Mol. Nutr. Food Res. 2013, 00, 1–10
steroid excretion in rats fed a high-cholesterol diet. Biofac-tors 2008, 33, 211–223.
[20] van den Maagdenberg, A. M., Hofker, M. H., Krimpen-fort, P. J., de Bruijn, I. et al., Transgenic mice carrying theapolipoprotein E3-leiden gene exhibit hyperlipoproteinemia.J. Biol. Chem. 1993, 268, 10540–10545
[21] Verschuren, L., Kleemann, R., Offerman, E. H., Szalai, A. J.et al., Effect of low dose atorvastatin versus diet-inducedcholesterol lowering on atherosclerotic lesion progressionand inflammation in apolipoprotein E*3-leiden transgenicmice. Arterioscler. Thromb. Vasc. Biol. 2005, 25, 161–167.
[22] Kleemann, R., Princen, H. M., Emeis, J. J., Jukema, J. W.et al., Rosuvastatin reduces atherosclerosis development be-yond and independent of its plasma cholesterol-loweringeffect in APOE*3-leiden transgenic mice: evidence for anti-inflammatory effects of rosuvastatin. Circulation 2003, 108,1368–1374.
[23] Post, S. M., de Roos, B., Vermeulen, M., Afman, L. et al.,Cafestol increases serum cholesterol levels in apolipopro-tein E*3-leiden transgenic mice by suppression of bileacid synthesis. Arterioscler. Thromb. Vasc. Biol. 2000, 20,1551–1556.
[24] van Vlijmen, B. J., Mensink, R. P., van ‘t Hof, H. B., Of-fermans, R. F. et al., Effects of dietary fish oil on serumlipids and VLDL kinetics in hyperlipidemic apolipopro-tein E*3-leiden transgenic mice. J. Lipid Res. 1998, 39,1181–1188.
[25] van der Hoogt, C. C., de Haan, W., Westerterp, M., Hoekstra,M. et al., Fenofibrate increases HDL-cholesterol by reducingcholesteryl ester transfer protein expression. J. Lipid Res.2007, 48, 1763–1771.
[26] Kleemann, R., Verschuren, L., Morrison, M., Zadelaar,S. et al., Anti-inflammatory, anti-proliferative and anti-atherosclerotic effects of quercetin in human in vitro andin vivo models. Atherosclerosis 2011, 218, 44–52.
[27] Monahan, K. D., Effect of cocoa/chocolate ingestion onbrachial artery flow-mediated dilation and its relevanceto cardiovascular health and disease in humans. Arch.Biochem. Biophys. 2012, 527, 90–94.
[28] Rimbach, G., Melchin, M., Moehring, J., Wagner, A. E.,Polyphenols from cocoa and vascular health: a critical re-view. Internat. J. Mol. Sci. 2009, 10, 4290–4309.
[29] Vitaglione, P., Barone Lumaga, R., Ferracane, R., Sellitto, S.et al., Human bioavailability of flavanols and phenolic acidsfrom cocoa-nut creams enriched with free or microencapsu-lated cocoa polyphenols. Br. J. Nutr. 2012, 10, 1–12.
[30] Hollman, P. C., Cassidy, A., Comte, B., Heinonen, M. et al., Thebiological relevance of direct antioxidant effects of polyphe-nols for cardiovascular health in humans is not established.J. Nutr. 2011, 141, 989S–1009S.
[31] Wielinga, P. Y., Harthoorn, L. F., Verschuren, L., Schoe-maker, M. H. et al., Arachidonic acid/docosahexaenoic acid-supplemented diet in early life reduces body weight gain,plasma lipids, and adiposity in later life in ApoE*3Leidenmice. Mol. Nutr. Food Res. 2012, 56, 1081–1089.
[32] Serra, A., Macia, A., Romero, M.-P., Pinol, C.et al., Rapid methods to determine procyanidins, an-
thocyanins, theobromine and caffeine in rat tissues byliquid chromatography-tandem mass spectrometry. J.Chromatogr. B 2011, 879, 1519–1528
[33] Yakala, G. K., van der Heijden, R., Molema, G., Schipper, M.et al., Beneficial effects of an alternating high- fat dietaryregimen on systemic insulin resistance, hepatic and renalinflammation and renal function. PloS One 2012, 7, e45866.
[34] Schulz, T. J., Thierbach, R., Voigt, A., Drewes, G. et al., Induc-tion of oxidative metabolism by mitochondrial frataxin in-hibits cancer growth: Otto Warburg revisited. J. Biol. Chem.2006, 281, 977–981.
[35] Visioli, F., Bernaert, H., Corti, R., Ferri, C. et al., Chocolate,lifestyle, and health. Crit. Rev. Food Sci. Nutr. 2009, 49,299–312.
[36] Galleano, M., Oteiza, P. I., Fraga, C. G., Cocoa, chocolate, andcardiovascular disease. J. Cardiovasc. Pharmacol. 2009, 54,483–490.
[37] Araujo, J. A., Zhang, M., Yin, F., Heme oxygenase-1, oxida-tion, inflammation, and atherosclerosis. Front. Pharmacol.2012, 3, 119.
[38] Ding, E. L., Hutfless, S. M., Ding, X., Girotra, S., Chocolateand prevention of cardiovascular disease: a systematic re-view. Nutr. Metabol. 2006, 3, 2.
[39] Kurosawa, T., Itoh, F., Nozaki, A., Nakano, Y. et al., Suppres-sive effect of cocoa powder on atherosclerosis in Kurosawaand Kusanagi hypercholesterolemic rabbits. J. Atheroscler.Thromb. 2005, 12, 20–28.
[40] Vinson, J. A., Proch, J., Bose, P., Muchler, S. et al., Choco-late is a powerful ex vivo and in vivo antioxidant, anantiatherosclerotic agent in an animal model, and a sig-nificant contributor to antioxidants in the European andAmerican diets. J. Agricultural Food Chem. 2006, 54,8071–8076.
[41] Desch, S., Schmidt, J., Kobler, D., Sonnabend, M. et al.,Effect of cocoa products on blood pressure: systematicreview and meta-analysis. Am. J. Hypertens. 2010, 23,97–103.
[42] Jain, A., Soni, M., Deb, L., Jain, A. et al., Antioxidant andhepatoprotective activity of ethanolic and aqueous extractsof momordica dioica roxb. leaves. J. Ethnopharmacol. 2008,115, 61–66.
[43] Waddington, E., Puddey, I. B., Croft, K. D., Red wine polyphe-nolic compounds inhibit atherosclerosis in apolipoprotein E-deficient mice independently of effects on lipid peroxidation.Am. J. Clin. Nutr. 2004, 79, 54–61.
[44] Stocker, R., O’Halloran, R. A., Dealcoholized red wine de-creases atherosclerosis in apolipoprotein E gene-deficientmice independently of inhibition of lipid peroxidation in theartery wall. Am. J. Clin. Nutr. 2004, 79, 123–130.
[45] Libby, P., Inflammation in atherosclerosis. Nature 2002, 420,868–874.
[46] Katz, D. L., Doughty, K., Ali, A., Antiox. Redox Signal. 2011,15, 2779–2811.
[47] Brown, L., Rosner, B., Willett, W. W., Sacks, F. M., Cholesterol-lowering effects of dietary fiber: a meta-analysis. Am. J. Clin.Nutr. 1999, 69, 30–42.
C© 2013 WILEY-VCH Verlag GmbH & Co. KGaA, Weinheim www.mnf-journal.com