Embed Size (px)
Citation preview
ESEA ACCOUNTABILITYJAMESVILLE-DEWITT
2013-2014
1
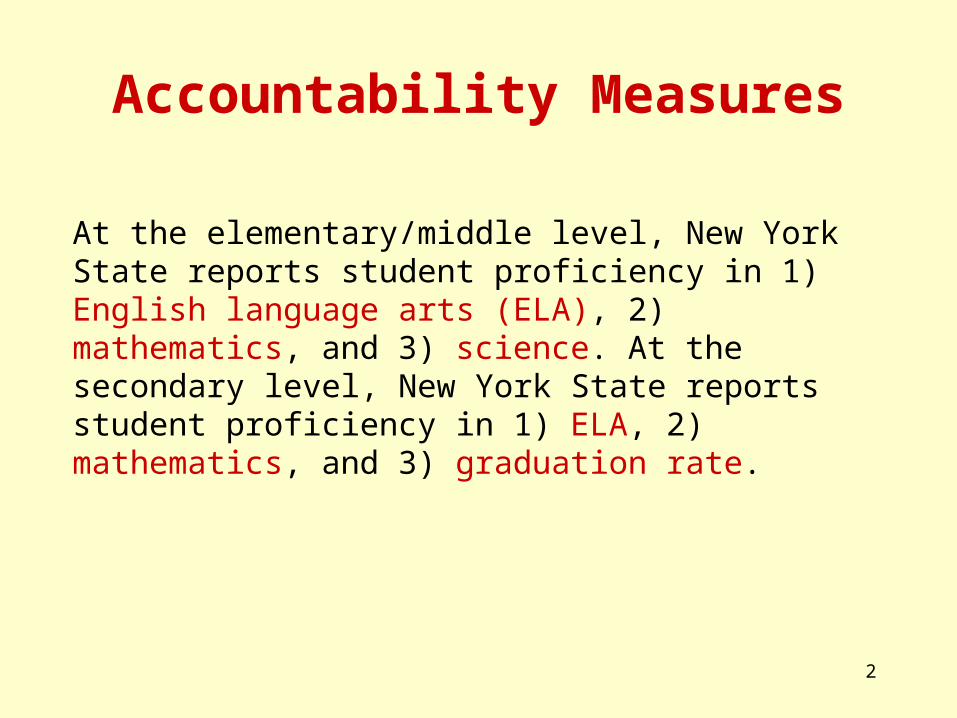
Accountability Measures
At the elementary/middle level, New York State reports student proficiency in 1) English language arts (ELA), 2) mathematics, and 3) science. At the secondary level, New York State reports student proficiency in 1) ELA, 2) mathematics, and 3) graduation rate.
2
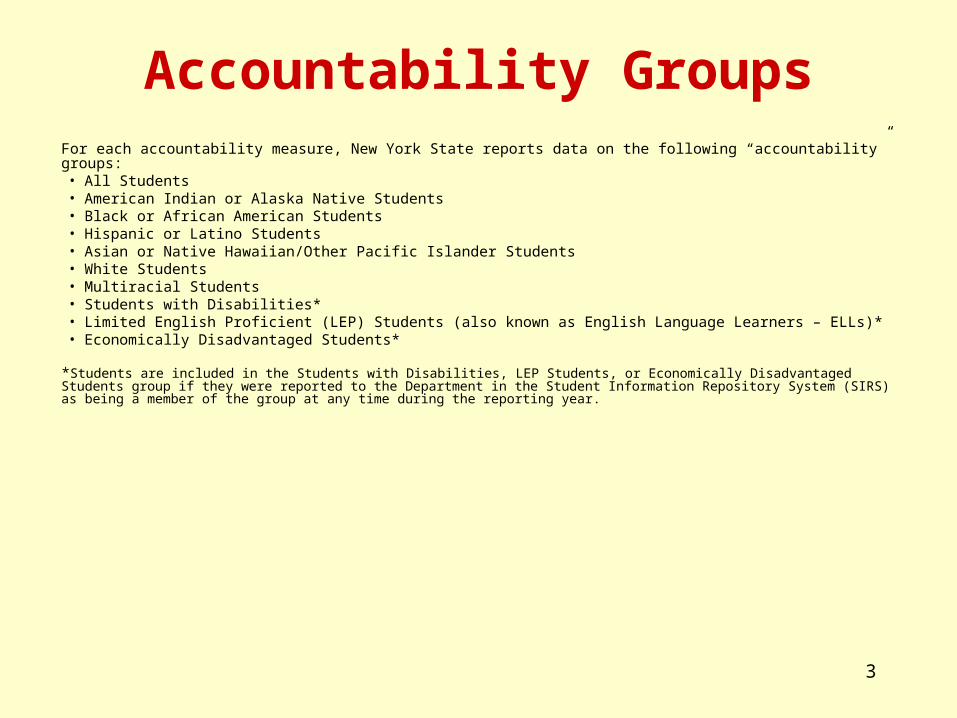
Accountability GroupsFor each accountability measure, New York State reports data on the following “accountability” groups:• All Students• American Indian or Alaska Native Students• Black or African American Students• Hispanic or Latino Students• Asian or Native Hawaiian/Other Pacific Islander Students• White Students• Multiracial Students• Students with Disabilities*• Limited English Proficient (LEP) Students (also known as English Language Learners – ELLs)*• Economically Disadvantaged Students*
*Students are included in the Students with Disabilities, LEP Students, or Economically Disadvantaged Students group if they were reported to the Department in the Student Information Repository System (SIRS) as being a member of the group at any time during the reporting year.
3
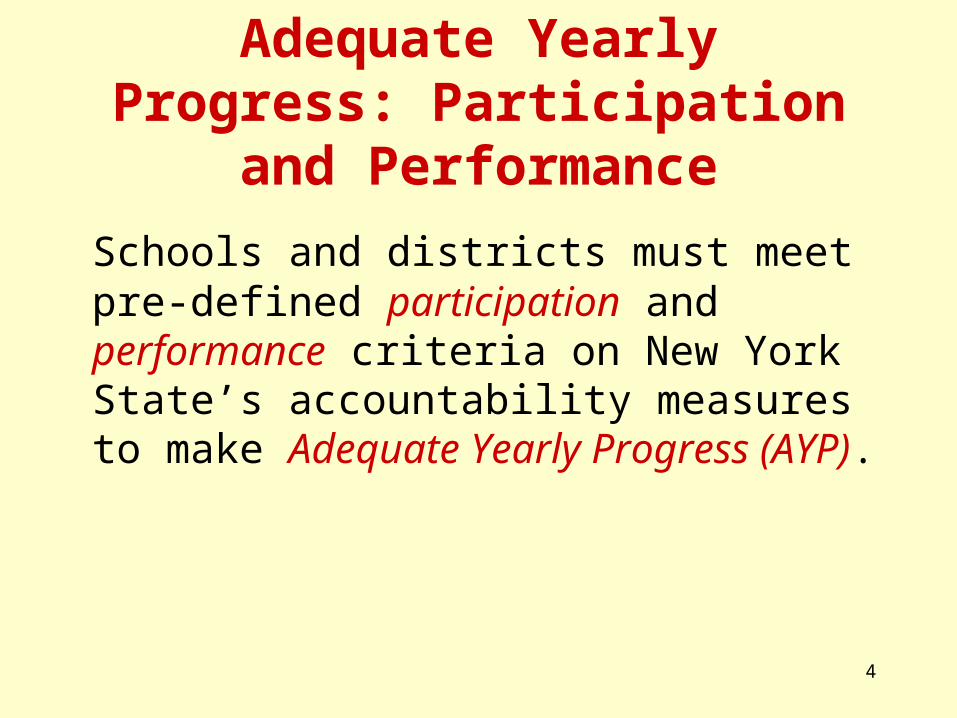
Adequate Yearly Progress: Participation and Performance
Schools and districts must meet pre-defined participation and performance criteria on New York State’s accountability measures to make Adequate Yearly Progress (AYP).
4
Participation Criterion
5
Participation CriterionElementary/Middle Level
6
For an accountability group with 40 or more students enrolled during the test administration period to meet the participation criterion in English language arts (ELA) or mathematics, 95 percent of these students must have valid scores on an appropriate assessment.
For an accountability group with 40 or more students enrolled during the test administration period to meet the participation criterion in science, 80 percent of these students must have valid scores on an appropriate assessment.
Participation CriterionSecondary Level
7
For an accountability group with 40 or more 12th graders to meet the participation criterion in English language arts (ELA) or mathematics, 95 percent of the 12th graders must have valid scores on Regents examinations (or approved alternatives), Regents competency tests (or approved alternatives), or New York State Alternate Assessments.
Performance Criterion:Performance Indices
8
9
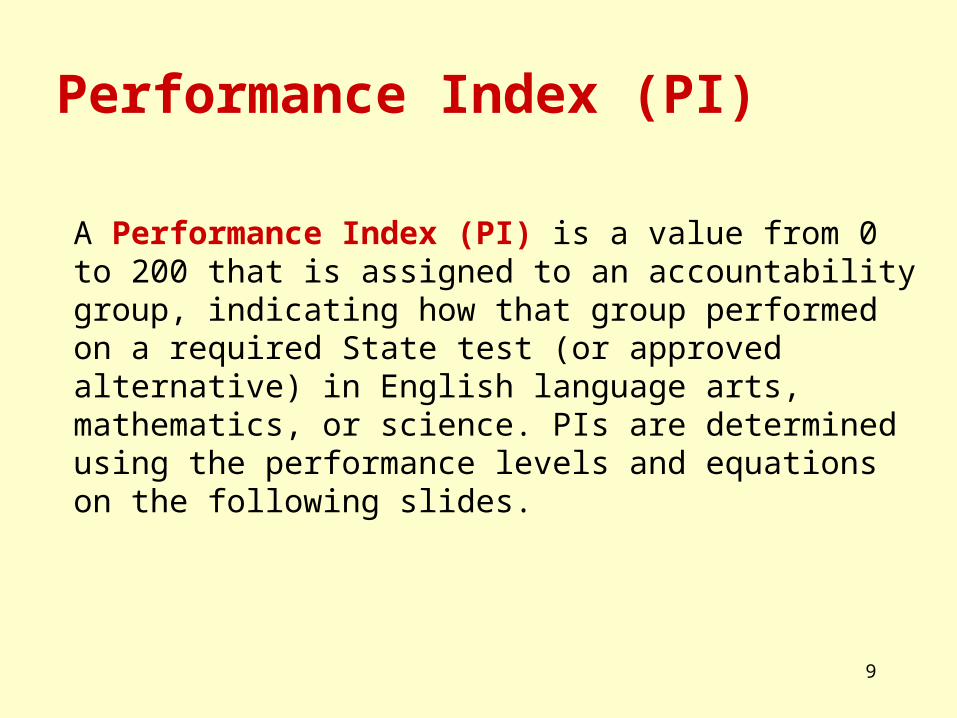
Performance Index (PI)
A Performance Index (PI) is a value from 0 to 200 that is assigned to an accountability group, indicating how that group performed on a required State test (or approved alternative) in English language arts, mathematics, or science. PIs are determined using the performance levels and equations on the following slides.
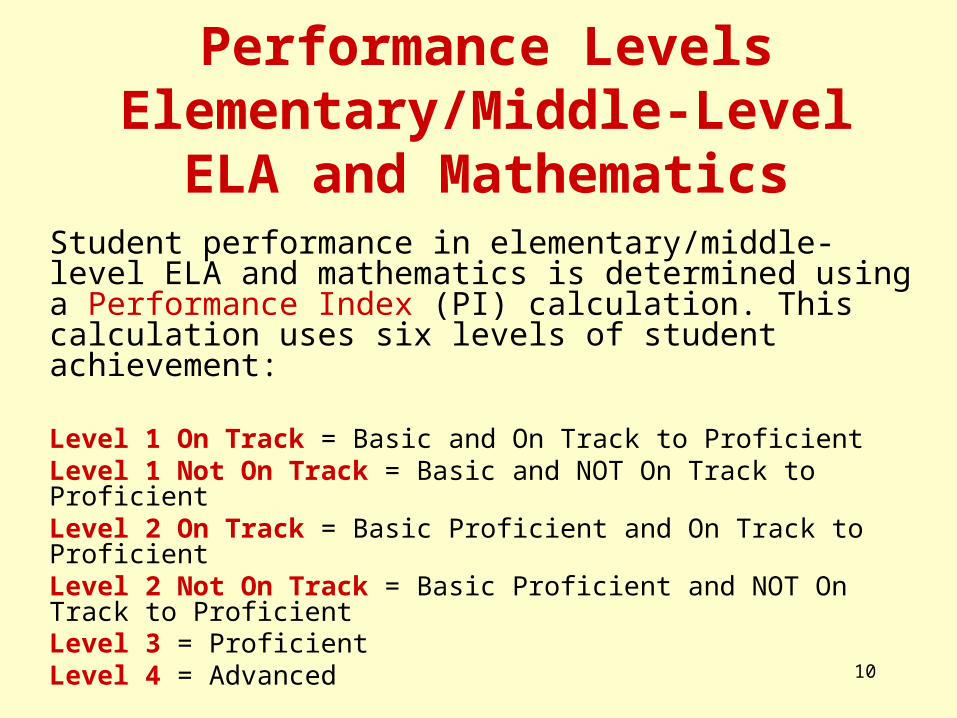
Performance Levels Elementary/Middle-Level
ELA and Mathematics
10
Student performance in elementary/middle-level ELA and mathematics is determined using a Performance Index (PI) calculation. This calculation uses six levels of student achievement:
Level 1 On Track = Basic and On Track to ProficientLevel 1 Not On Track = Basic and NOT On Track to ProficientLevel 2 On Track = Basic Proficient and On Track to ProficientLevel 2 Not On Track = Basic Proficient and NOT On Track to ProficientLevel 3 = ProficientLevel 4 = Advanced
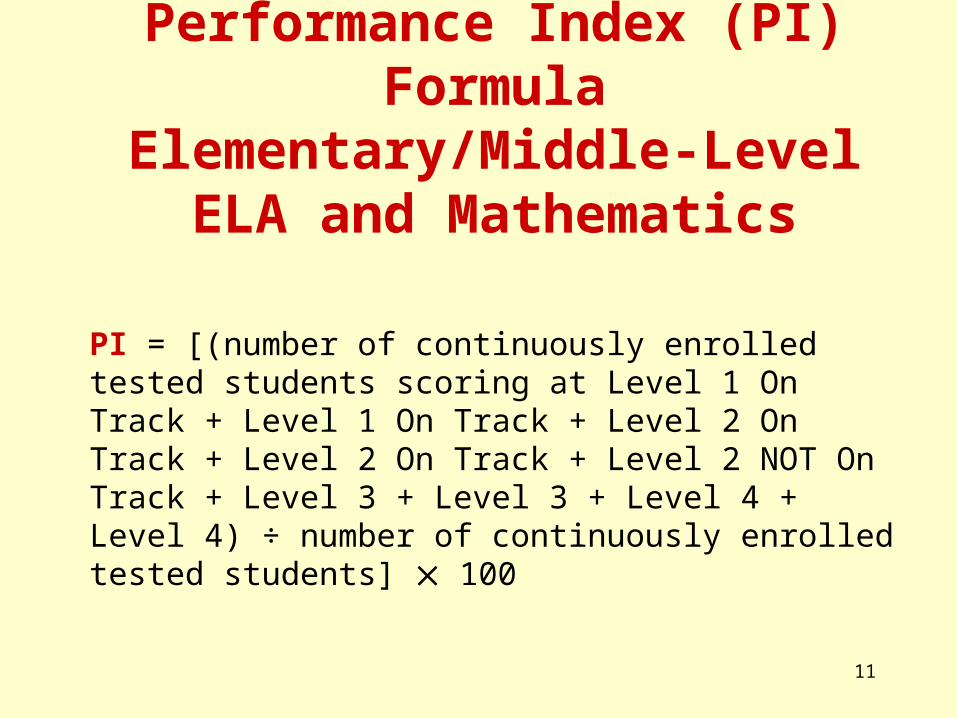
Performance Index (PI) FormulaElementary/Middle-Level
ELA and Mathematics
11
PI = [(number of continuously enrolled tested students scoring at Level 1 On Track + Level 1 On Track + Level 2 On Track + Level 2 On Track + Level 2 NOT On Track + Level 3 + Level 3 + Level 4 + Level 4) ÷ number of continuously enrolled tested students] 100
12
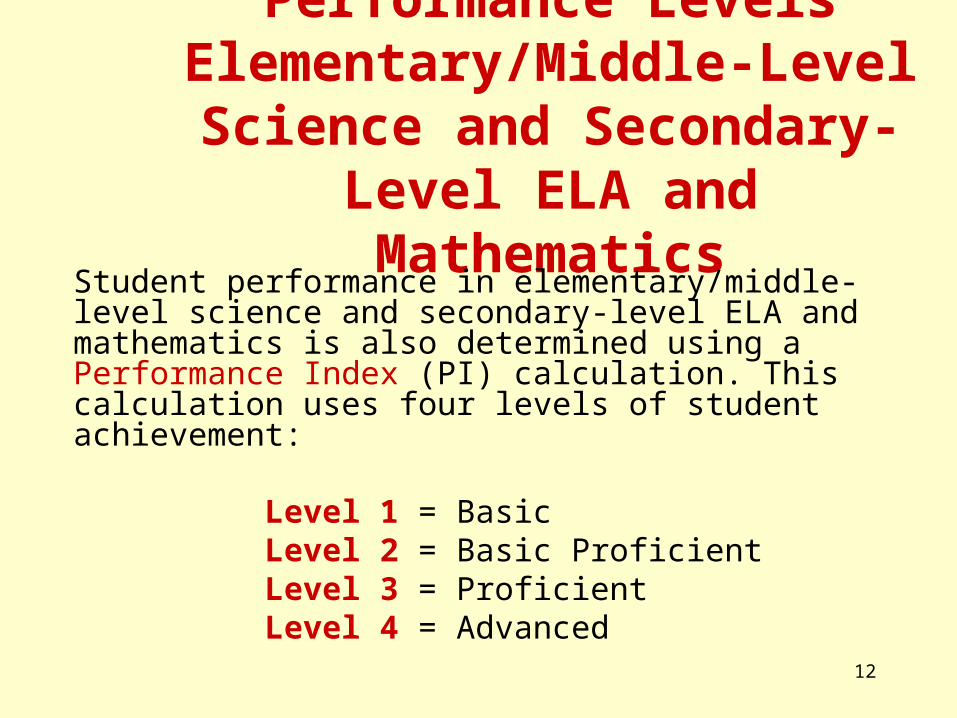
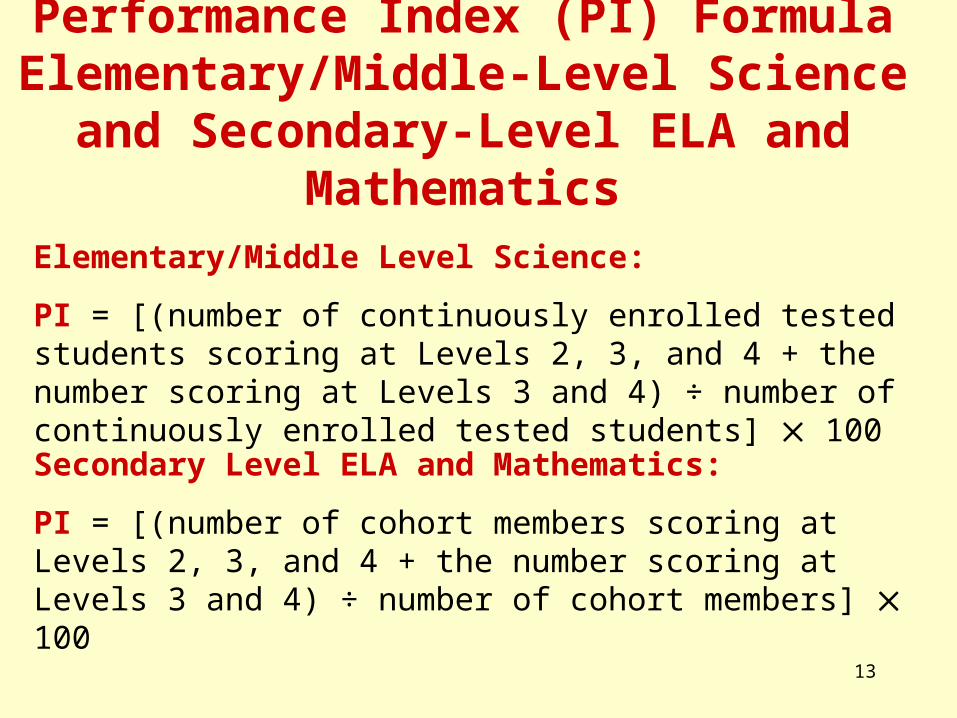
Performance Levels Elementary/Middle-Level
Science and Secondary-Level ELA and Mathematics
Student performance in elementary/middle-level science and secondary-level ELA and mathematics is also determined using a Performance Index (PI) calculation. This calculation uses four levels of student achievement:
Level 1 = BasicLevel 2 = Basic ProficientLevel 3 = ProficientLevel 4 = Advanced
13
Performance Index (PI) FormulaElementary/Middle-Level Science and
Secondary-Level ELA and Mathematics
Elementary/Middle Level Science:
PI = [(number of continuously enrolled tested students scoring at Levels 2, 3, and 4 + the number scoring at Levels 3 and 4) ÷ number of continuously enrolled tested students] 100
Secondary Level ELA and Mathematics:
PI = [(number of cohort members scoring at Levels 2, 3, and 4 + the number scoring at Levels 3 and 4) ÷ number of cohort members] 100
14
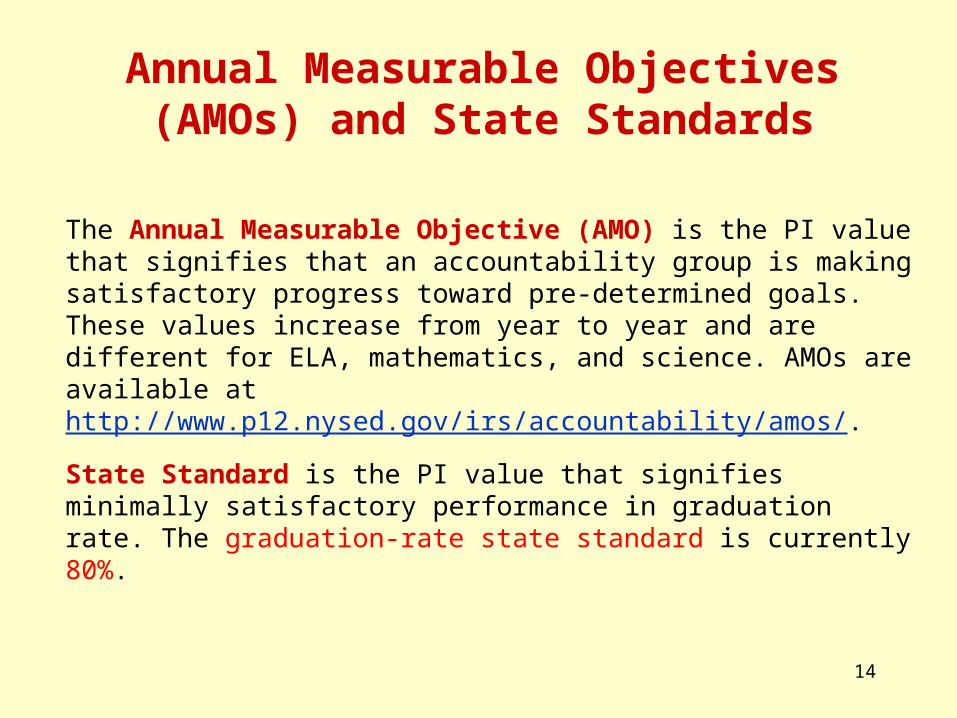
Annual Measurable Objectives (AMOs) and State Standards
The Annual Measurable Objective (AMO) is the PI value that signifies that an accountability group is making satisfactory progress toward pre-determined goals. These values increase from year to year and are different for ELA, mathematics, and science. AMOs are available at http://www.p12.nysed.gov/irs/accountability/amos/.
State Standard is the PI value that signifies minimally satisfactory performance in graduation rate. The graduation-rate state standard is currently 80%.
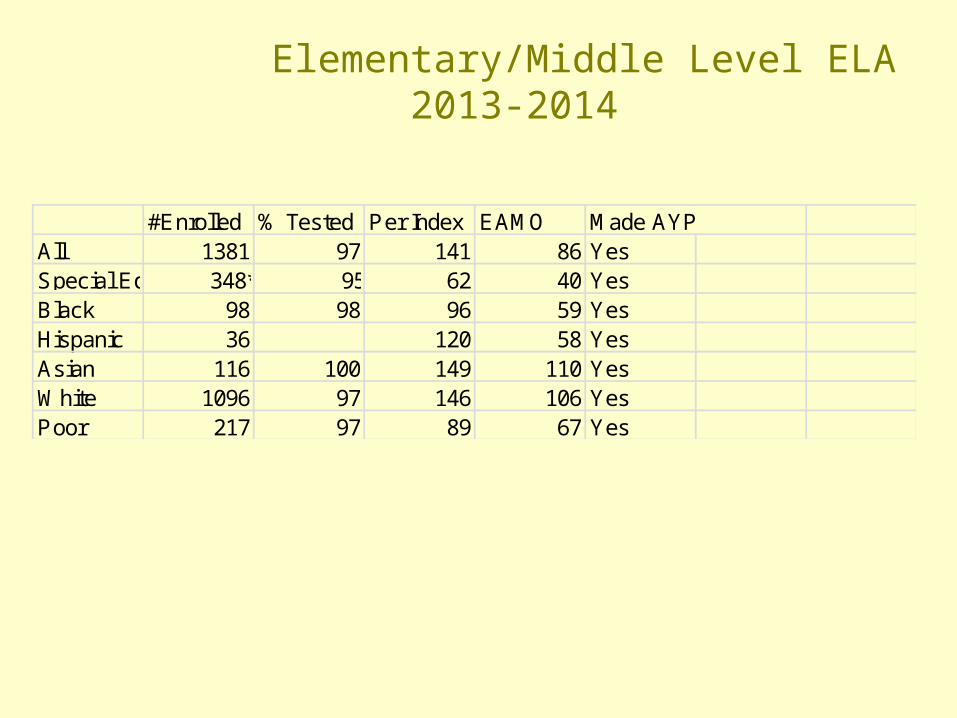
Elementary/Middle Level ELA 2013-2014
#Enrolled % Tested Per Index EAMO Made AYPAll 1381 97 141 86 YesSpecial Ed 348* 95* 62 40 YesBlack 98 98 96 59 YesHispanic 36 120 58 YesAsian 116 100 149 110 YesWhite 1096 97 146 106 YesPoor 217 97 89 67 Yes
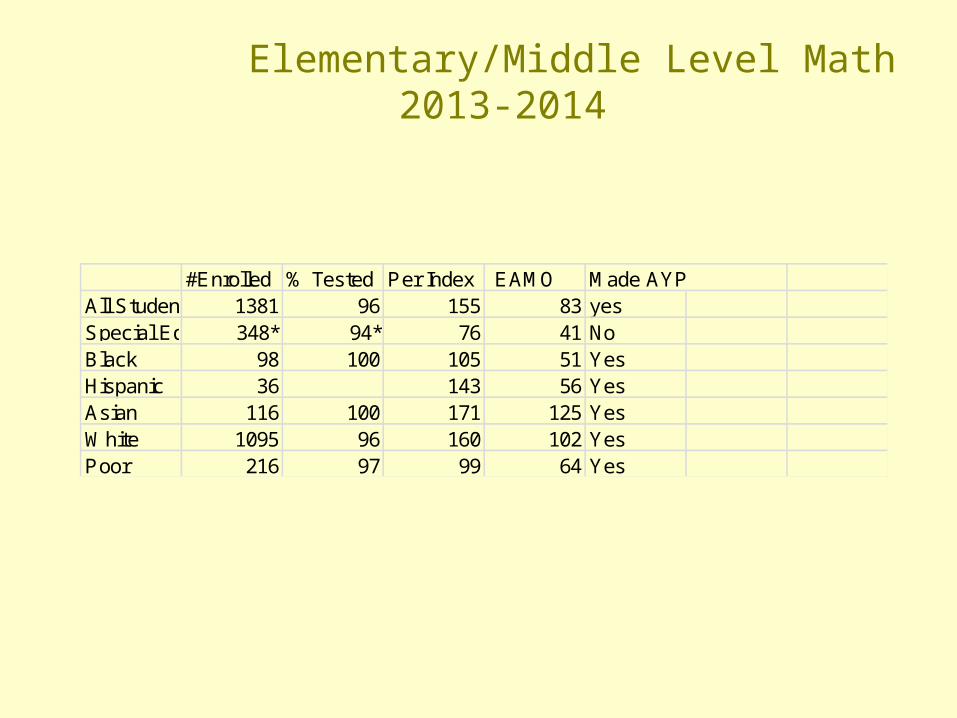
Elementary/Middle Level Math2013-2014
#Enrolled % Tested Per Index EAMO Made AYPAll Students 1381 96 155 83 yesSpecial Ed 348* 94* 76 41 No Black 98 100 105 51 YesHispanic 36 143 56 YesAsian 116 100 171 125 YesWhite 1095 96 160 102 YesPoor 216 97 99 64 Yes
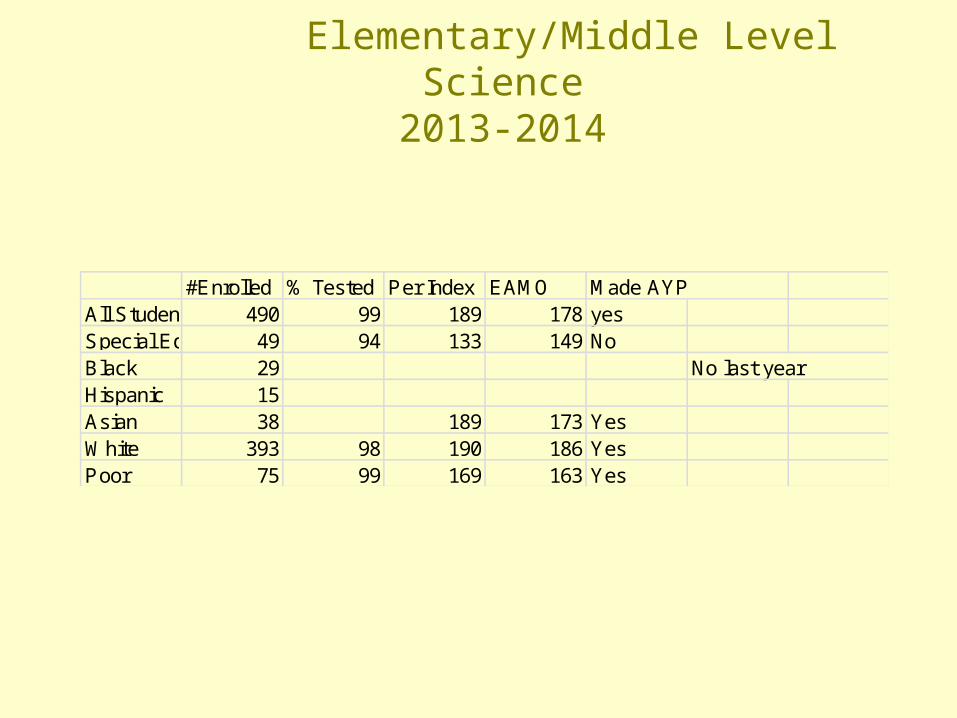
Elementary/Middle Level Science2013-2014
#Enrolled % Tested Per Index EAMO Made AYPAll Students 490 99 189 178 yesSpecial Ed 49 94 133 149 NoBlack 29 No last yearHispanic 15Asian 38 189 173 YesWhite 393 98 190 186 YesPoor 75 99 169 163 Yes
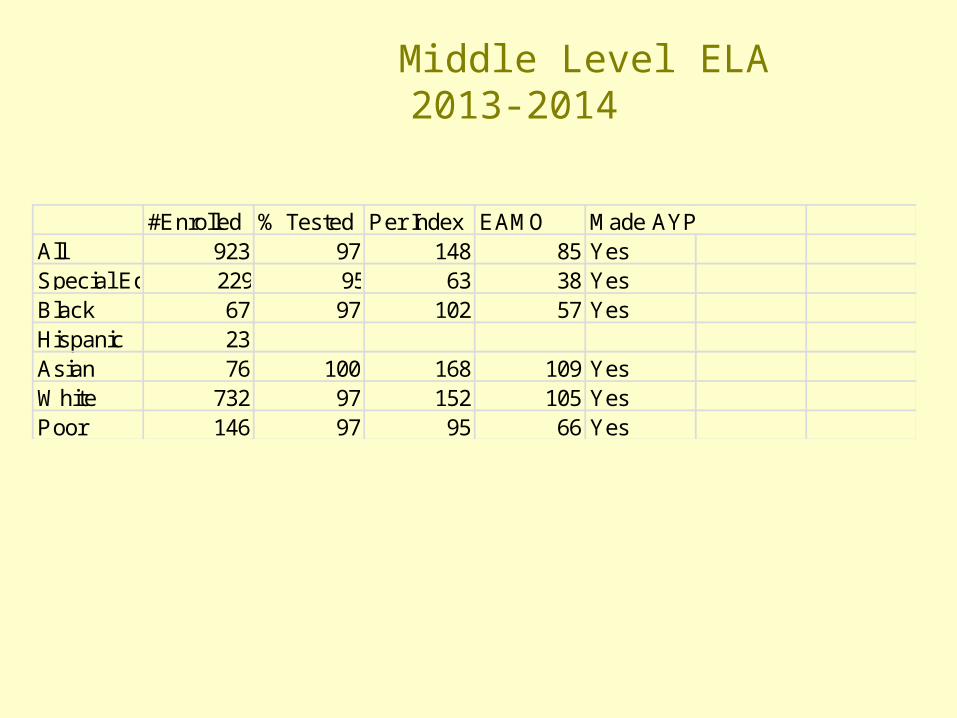
Middle Level ELA 2013-2014
#Enrolled % Tested Per Index EAMO Made AYPAll 923 97 148 85 YesSpecial Ed 229* 95* 63 38 Yes 63 38 YesBlack 67 97 102 57 YesHispanic 23Asian 76 100 168 109 YesWhite 732 97 152 105 YesPoor 146 97 95 66 Yes
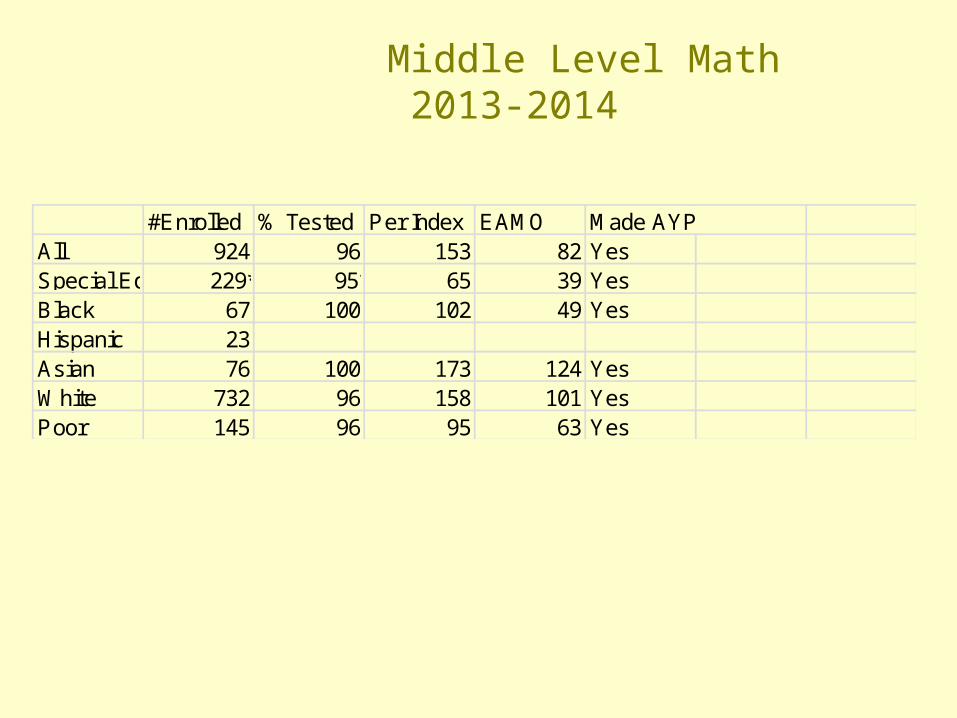
Middle Level Math 2013-2014
#Enrolled % Tested Per Index EAMO Made AYPAll 924 96 153 82 YesSpecial Ed 229* 95* 65 39 YesBlack 67 100 102 49 YesHispanic 23Asian 76 100 173 124 YesWhite 732 96 158 101 YesPoor 145 96 95 63 Yes
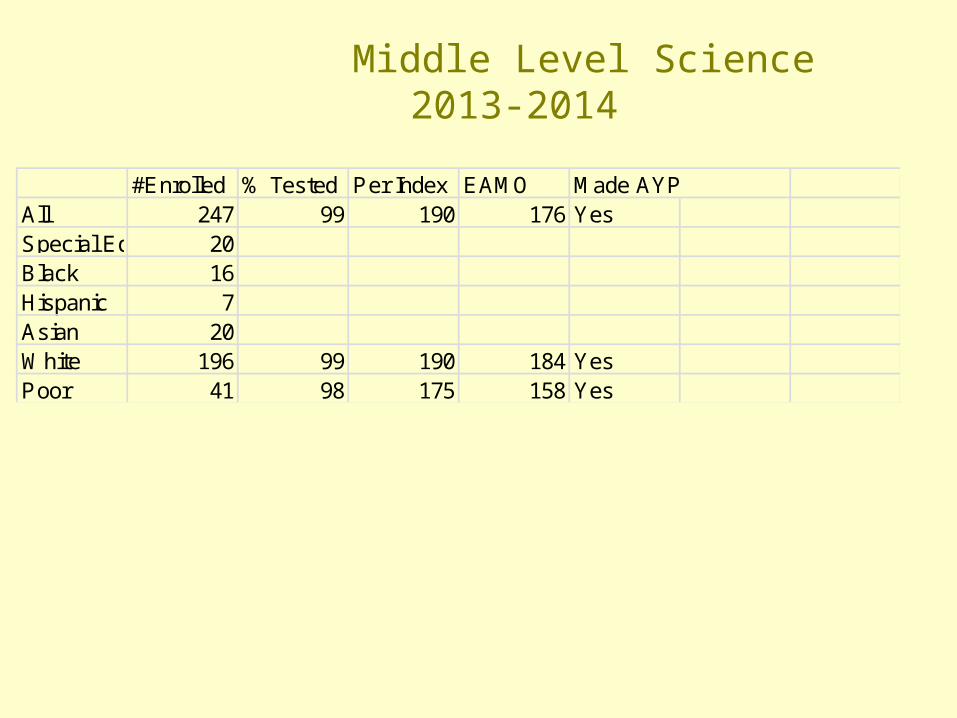
Middle Level Science 2013-2014
#Enrolled % Tested Per Index EAMO Made AYPAll 247 99 190 176 YesSpecial Ed 20Black 16Hispanic 7Asian 20White 196 99 190 184 YesPoor 41 98 175 158 Yes
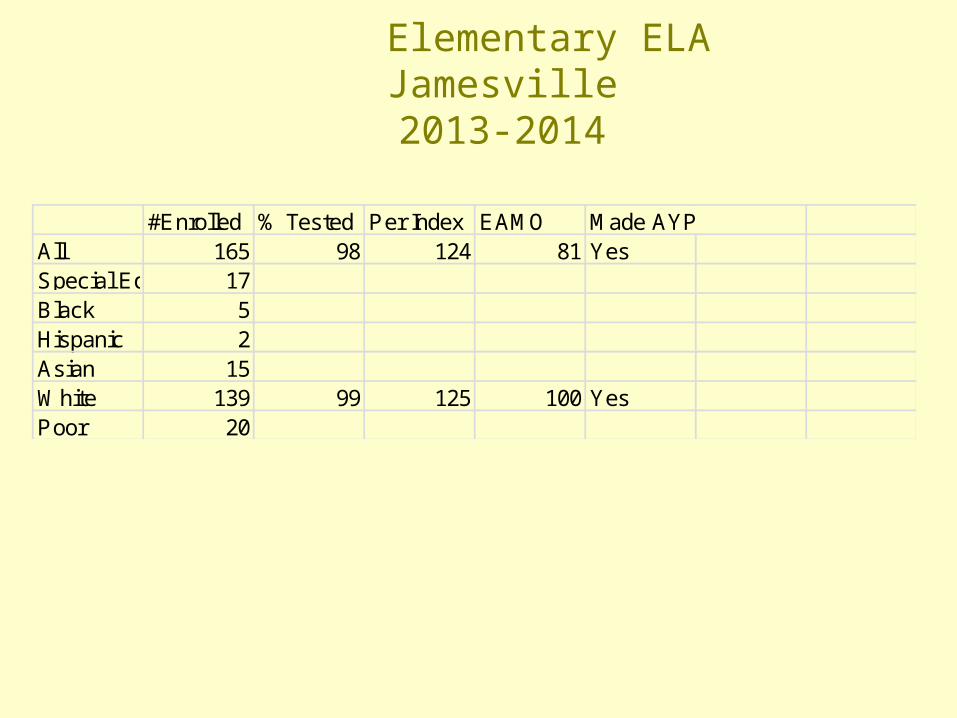
Elementary ELA Jamesville 2013-2014
#Enrolled % Tested Per Index EAMO Made AYPAll 165 98 124 81 YesSpecial Ed 17Black 5Hispanic 2Asian 15White 139 99 125 100 YesPoor 20
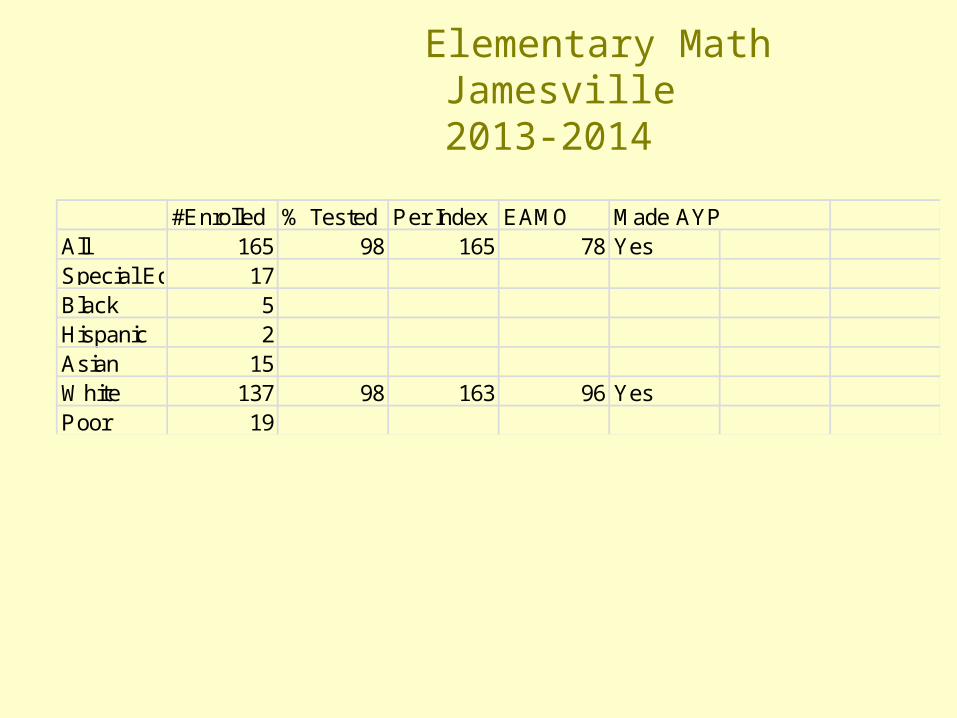
Elementary Math Jamesville 2013-2014
#Enrolled % Tested Per Index EAMO Made AYPAll 165 98 165 78 YesSpecial Ed 17Black 5Hispanic 2Asian 15White 137 98 163 96 YesPoor 19
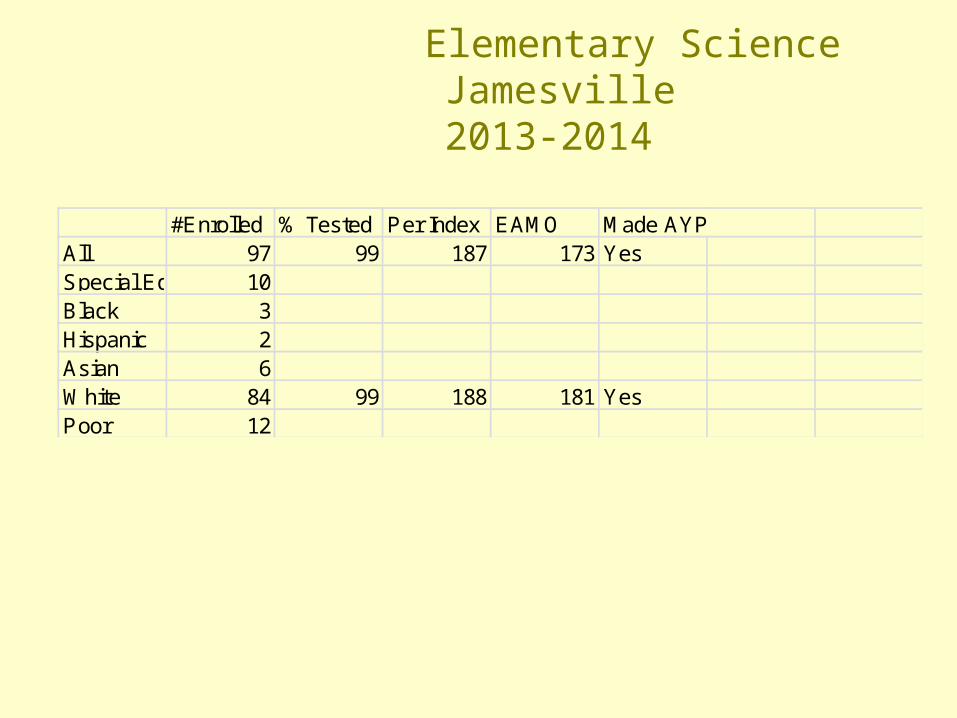
Elementary Science Jamesville 2013-2014
#Enrolled % Tested Per Index EAMO Made AYPAll 97 99 187 173 YesSpecial Ed 10Black 3Hispanic 2Asian 6White 84 99 188 181 YesPoor 12
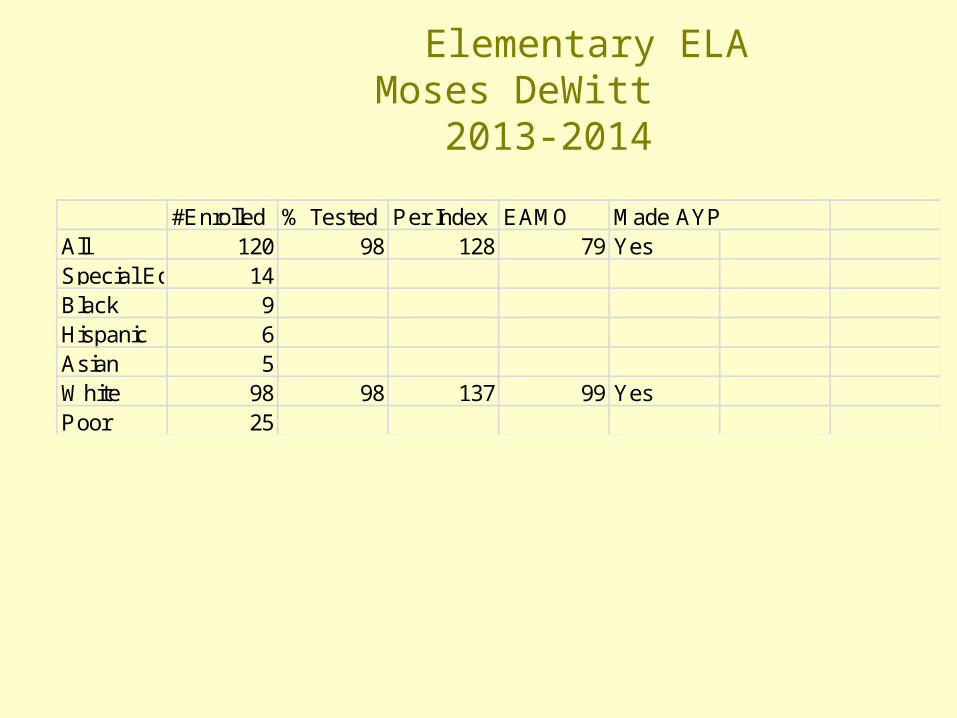
Elementary ELA Moses DeWitt 2013-2014
#Enrolled % Tested Per Index EAMO Made AYPAll 120 98 128 79 YesSpecial Ed 14Black 9Hispanic 6Asian 5White 98 98 137 99 YesPoor 25
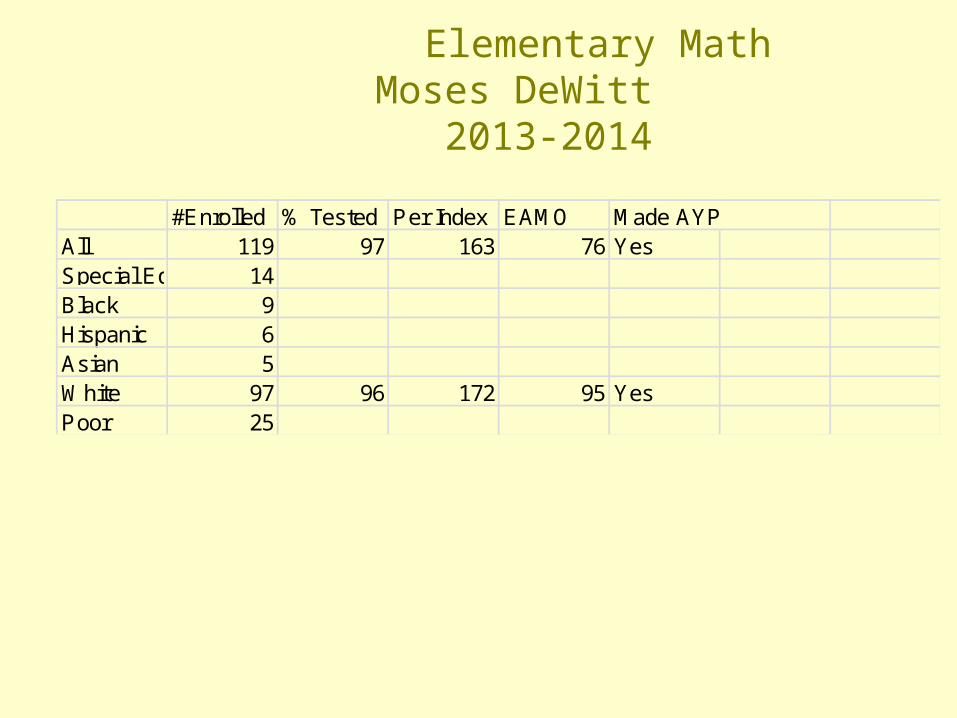
Elementary Math Moses DeWitt 2013-2014
#Enrolled % Tested Per Index EAMO Made AYPAll 119 97 163 76 YesSpecial Ed 14Black 9Hispanic 6Asian 5White 97 96 172 95 YesPoor 25
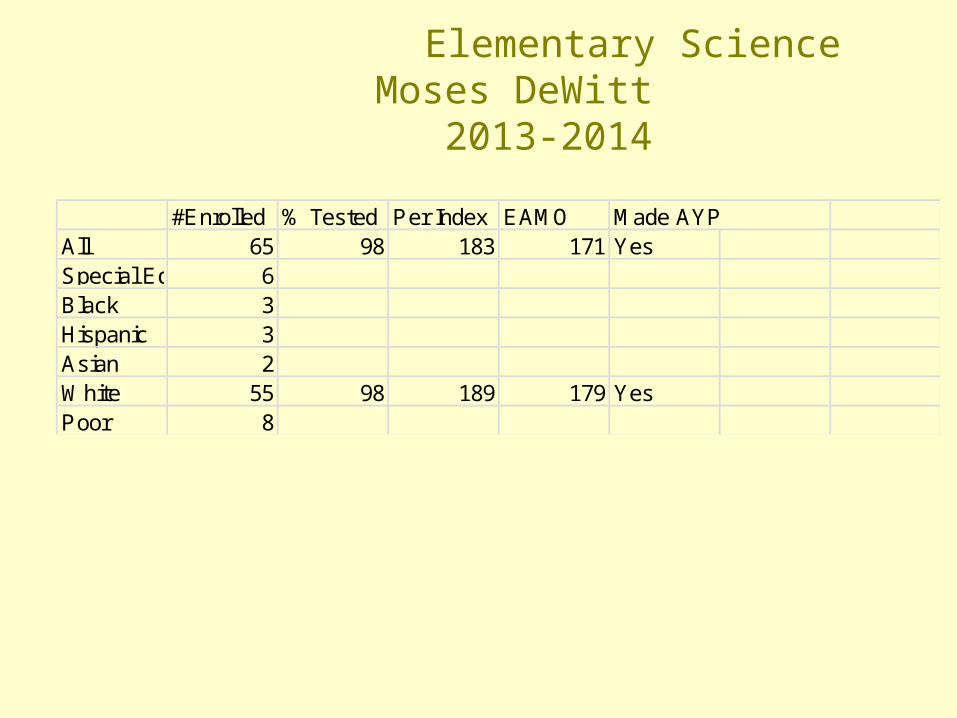
Elementary Science Moses DeWitt 2013-2014
#Enrolled % Tested Per Index EAMO Made AYPAll 65 98 183 171 YesSpecial Ed 6Black 3Hispanic 3Asian 2White 55 98 189 179 YesPoor 8

Elementary ELA Tecumseh 2013-2014
#Enrolled % Tested Per Index EAMO Made AYPAll 164 97 135 81 YesSpecial Ed 18Black 15Hispanic 5Asian 20White 122 96 146 99 YesPoor 26
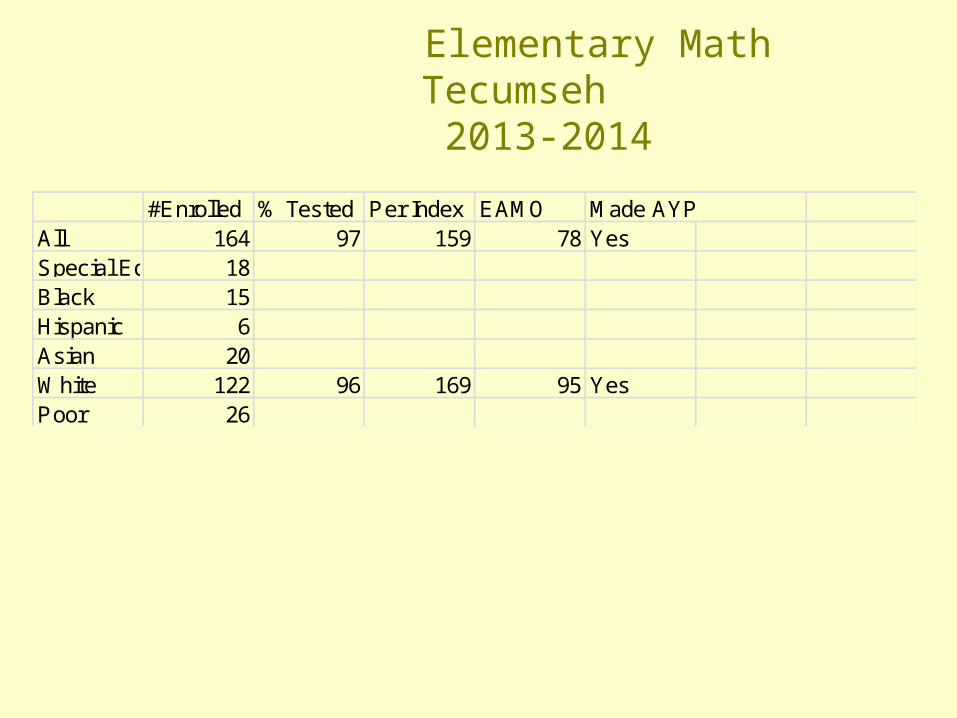
Elementary Math Tecumseh 2013-2014
#Enrolled % Tested Per Index EAMO Made AYPAll 164 97 159 78 YesSpecial Ed 18Black 15Hispanic 6Asian 20White 122 96 169 95 YesPoor 26
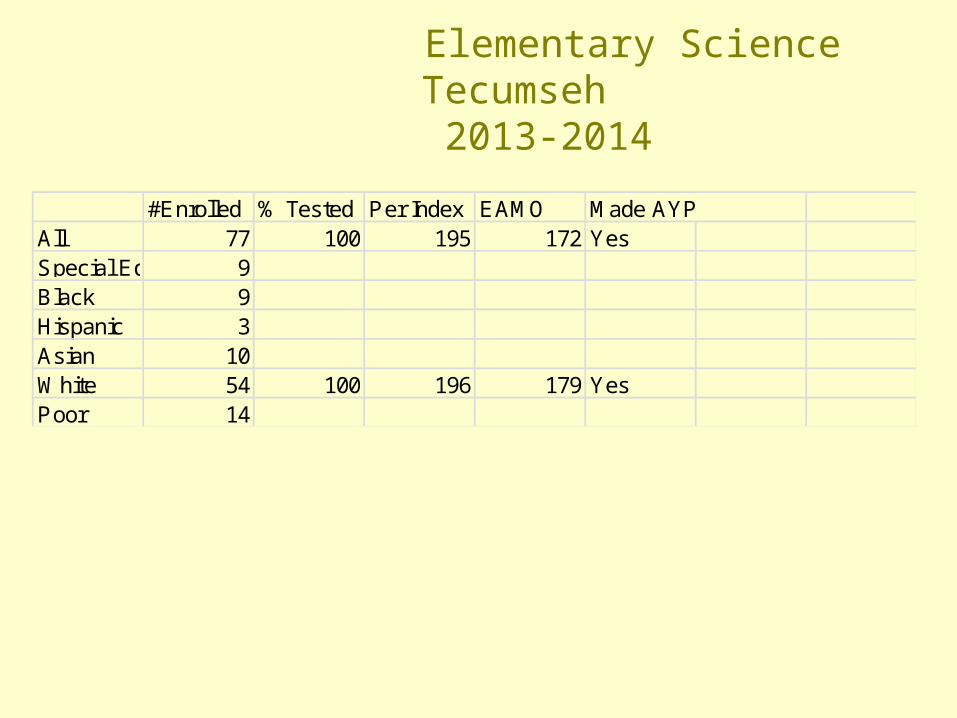
Elementary Science Tecumseh 2013-2014
#Enrolled % Tested Per Index EAMO Made AYPAll 77 100 195 172 YesSpecial Ed 9Black 9Hispanic 3Asian 10White 54 100 196 179 YesPoor 14
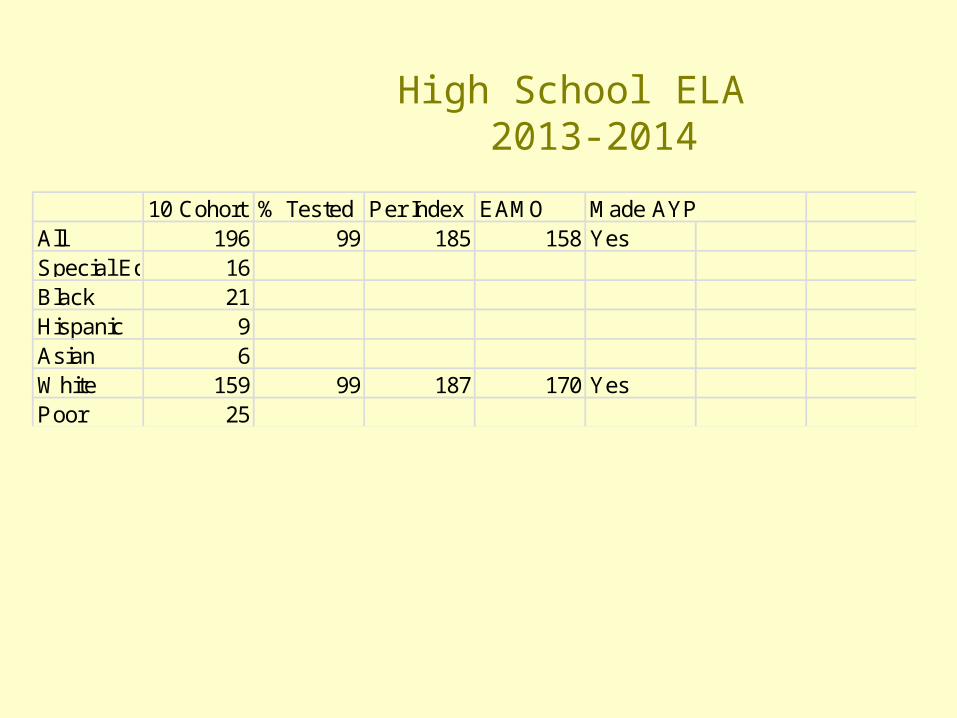
High School ELA 2013-2014
10 Cohort % Tested Per Index EAMO Made AYPAll 196 99 185 158 YesSpecial Ed 16Black 21Hispanic 9Asian 6White 159 99 187 170 YesPoor 25
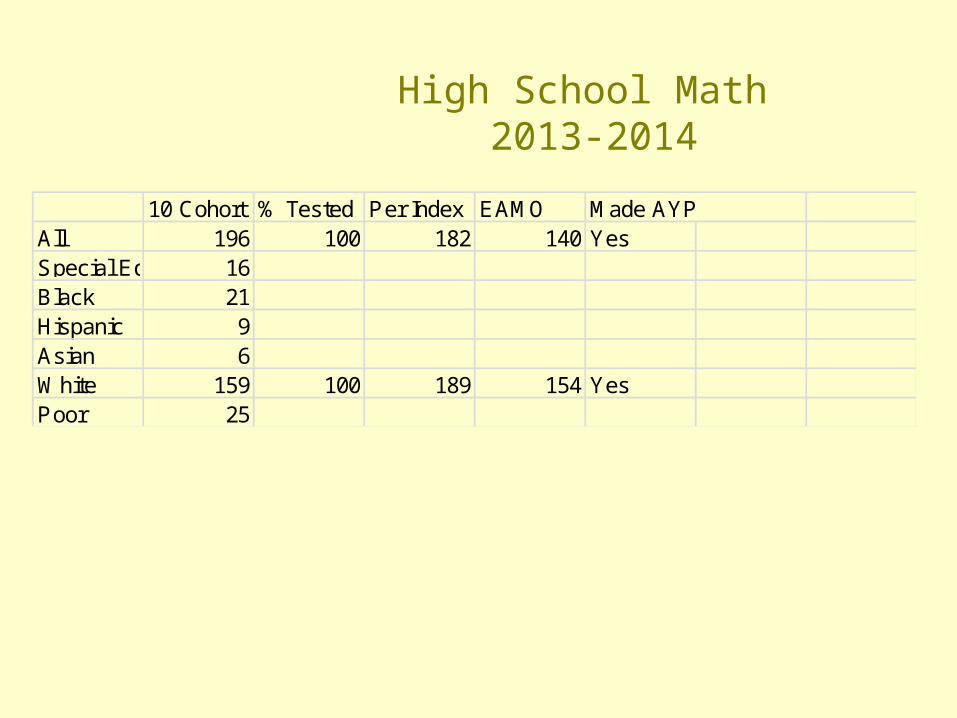
High School Math 2013-2014
10 Cohort % Tested Per Index EAMO Made AYPAll 196 100 182 140 YesSpecial Ed 16Black 21Hispanic 9Asian 6White 159 100 189 154 YesPoor 25
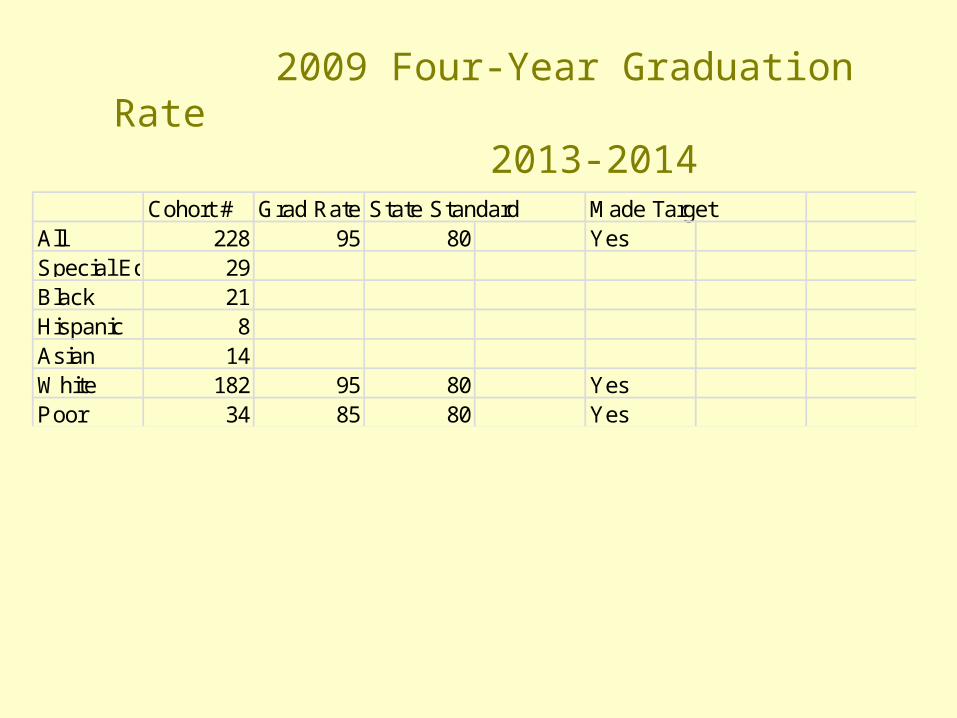
2009 Four-Year Graduation Rate
2013-2014
Cohort # Grad Rate State Standard Made TargetAll 228 95 80 YesSpecial Ed 29Black 21Hispanic 8Asian 14White 182 95 80 YesPoor 34 85 80 Yes
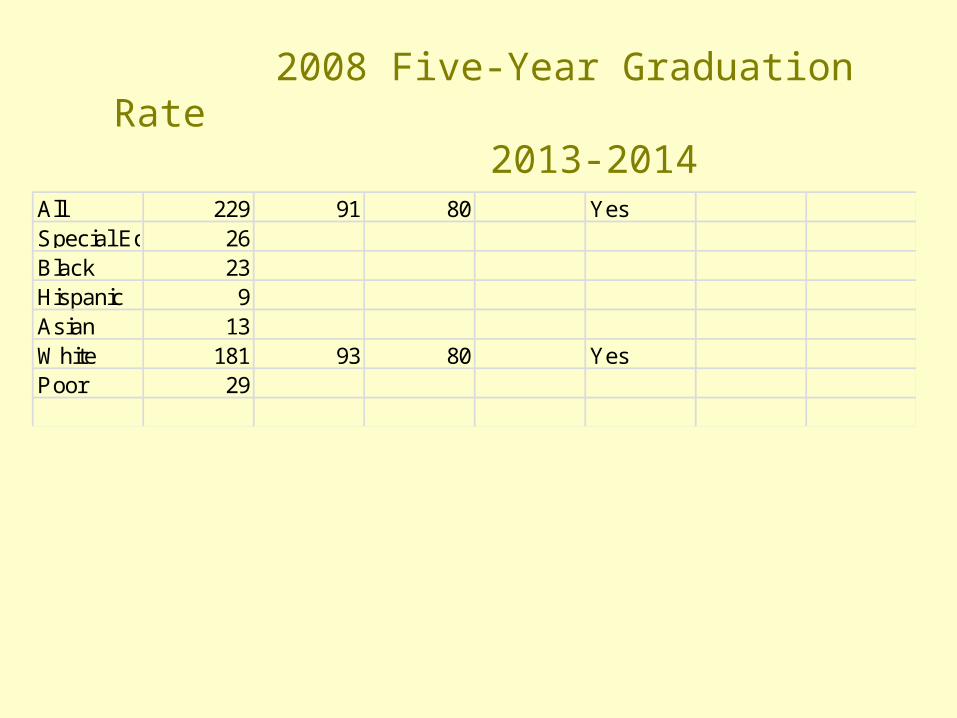
2008 Five-Year Graduation Rate
2013-2014
All 229 91 80 YesSpecial Ed 26Black 23Hispanic 9Asian 13White 181 93 80 YesPoor 29

GOOD NEWS!
ALL BUILDINGS
IN GOOD STANDING