Embed Size (px)
Citation preview
ESD Staff Allocation Kaizen Event Report Out
The Dump Trucks
March 26-30, 2007

The Dump Truck Team

Team Members Team Leader
• Jim Scott - TBM • Christine Brittain – Kaizen Officer • Ken Hessenius – FO3 • Julie Sievers – FO3 • Dan Stipe – FO4 • Holly Vandemark – FO4 • Jim Stricker – FO5 • Bill Gross – FO5 • Dennis Ostwinkle – FO6 • Terry Jones – FO6 • Joe Sanfilippo – FO1 • Mike Wade – FO1 • Jeff Vansteenburg – FO2 • Curt Krieger – FO2 • Barb Lynch – Field Service • Brian Tormey – Energy and Waste Management • Cory McCloid – Water Quality • Dennis Alt – Water Quality • Brian Hutchins – Air Quality Compliance and Monitoring • Tammie Krausman – Enviromental Services • Karen Grimes – Communications • Maggie Clover - Field Service

Background The Dump Truck Team
Barb Lynch Why?????
Objectives Corey McCoid
• Capture allocations of money and FTE, to make sure they aligned in the programs they represent.
• Prioritize what work activities will be completed for each program area.
• Determine what to keep doing and what to stop doing.

Goals Corey McCoid
To define what the end results are for the department and tie dollar amounts to each result.

Kaizen Methodology Christine Brittain
• Clear objectives • Team process • Tight focus on time • Quick & simple • Necessary resources immediately available • Immediate results (new process functioning by
end of week) • 5S “mindset”, use the steps to support the event
activities

Assessment of Current Process Tammie Krausman
After laying out the maps, what did we see? • More FTE’s-better compliance #’s
• Need to look at content vs. #’s
• Age/mature of program education
– Staff development/training – Regulated party education
Assessment of Current Process Tammie Krausman
• Attention you give to a problem on drive compliance
• Compliance with contacts “compare”
• Cluster or location geographical/drive time
• $ funding so driving priority of attention – $0 for some, some have moderate $, and some have full program
$-- not reflected on environmental need or attention
Development of Priorities Jeff Vansteenburg
Combined list for top 10 priorities (Team Consensuses) 1. Emergency Response 2. Open feedlots 3. Storm water 4. Unsewered Communities 5. Complaints 6. Technical assistance / outreach 7. Employee training 8. Inspections 9. Compliance – Enforcement 10. Safe and adequate drinking water

Criteria for Putting New Items on the Priorities List
Terry Jones
• Why
• Realistic FTE’s allocations – statewide and in each region
• $100,000 / FTE
• Training support and plan
• Equipment needs
• Information technology programs
• Results – Environmental – Public Health results – Measures
• Timeline for implementation
• Work Description – Performance Plans
• If unfunded or small project need to shift funding or FTE’s

Development of Metrics Ken Hessenius
Open Lots
• Report overflows
• Report gallons – tons of manure applied – economic value
• How many installed pollution prevention
• Impairment analysis of streams
• Measure of fertilizer value
• Stream improvement – Water quality
• % of compliance of producers (solid out of stream)
• Number of one-on-one site visits
• Number training programs – public information
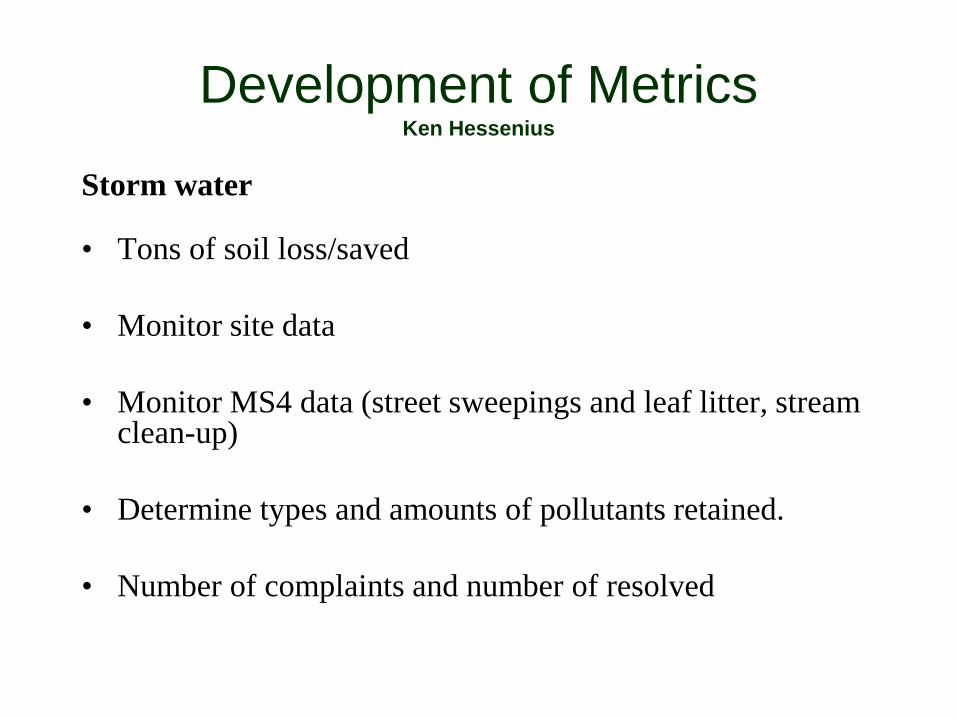
Development of Metrics Ken Hessenius
Storm water
• Tons of soil loss/saved
• Monitor site data
• Monitor MS4 data (street sweepings and leaf litter, stream clean-up)
• Determine types and amounts of pollutants retained.
• Number of complaints and number of resolved

Development of Metrics Ken Hessenius
Unsewered Communities • Gallons of treated water
• Property value increase
• Stream improvement – water quality
• Number of upgraded of communities, number brought into compliance
• Track number of units in compliance.

Development of Metrics Dennis Ostwinkle
Complaints • Tons of solid waste
• Reduced air pollutants
• Increased property values
• How quickly we respond – priority based (have already be screamed), how you responded to your customers, could use different categories ( ie. refered, handled as a ER, or giving them the expectations on when the DNR will respond.
• Photography before and after
• Water quality – improvements
• Surveys – were the citizens happy or not, how did you heard about us.
• Percentage and or number of complaints.

Development of Metrics Dennis Ostwinkle
Technical assistance – outreach
• Contact hours
• Number of trainees implementing Pollution prevention
• Material trained – have they learned
• Number of hits on web pages
• Number of list serve hits
• Number citizens assistance phone calls-e-mails
• Measure effective outreach
• Targeted information – Audience analysis – ID needs – Track – evaluate information learned
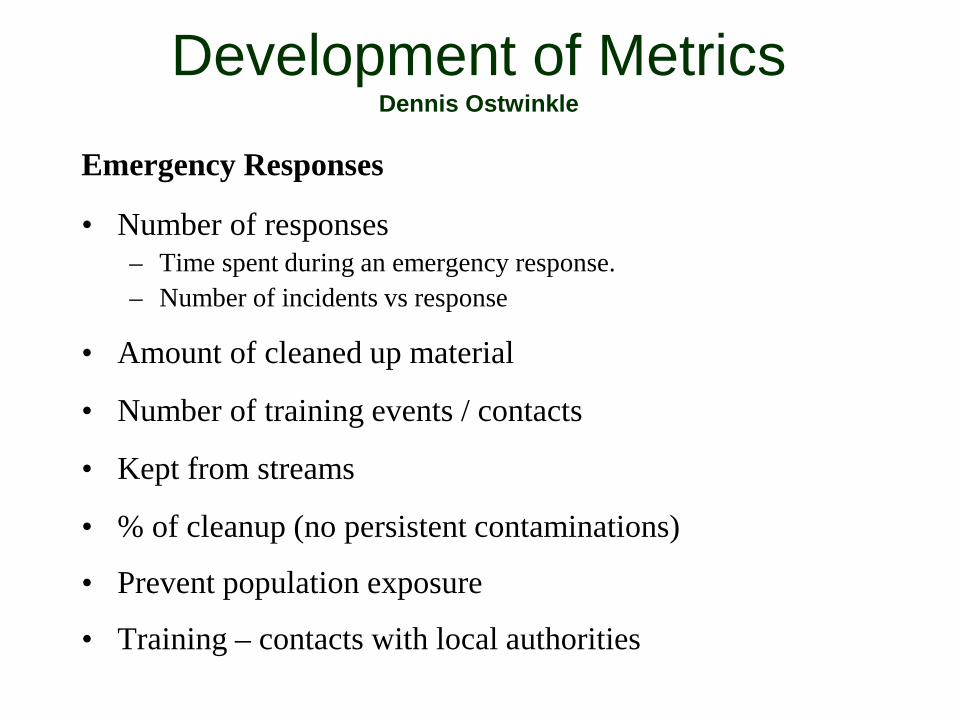
Development of Metrics Dennis Ostwinkle
Emergency Responses
• Number of responses – Time spent during an emergency response. – Number of incidents vs response
• Amount of cleaned up material
• Number of training events / contacts
• Kept from streams
• % of cleanup (no persistent contaminations)
• Prevent population exposure
• Training – contacts with local authorities

Development of Metrics Joe Sanfilippo
Employee Training
• Needs – survey
• Contact hours
• Safety – (no incidents)
• Technical proficiency – testing – on line testing
• All training staff program areas – all staff getting the training
• Mentoring – cross training
• Number of new employees (new duties) being mentored
• %/# employees in professional organizations (trends)
• Training plans and follow-up
• Dissemination of information’s
• Employee surveys

Development of Metrics Joe Sanfilippo
Inspections
• Meet mandates – numbers
• Target non compliant facilities
• See Compliance-enforcement category
• Pollutants controlled/prevented
• % compliance trends
• # deficiencies corrected
• Recommendations implemented

Development of Metrics Bill Gross
Compliance – Enforcement
• Air Quality – % Compliance with construction permit – % Compliance with maintenance requirements – % Compliance with record keeping
• Repeat Enforcement
• % compliance (trends)
• % in compliance with all other standards
• # source water plans developed and implemented
• # facilities achieving viability from technical assistance

Development of Metrics Bill Gross
Safe and Adequate Public Drinking Water
• # facilities significant/noncompliant
• # bypasses/facility/reason/days
• Gallons of wastewater saved from bypassing
• # of Beach closings
• Angler days lost on a stream/lake
• Monitoring reports (submitter)
• % in compliance with Health based standards
• % in compliance with all other standards
• # source water plans developed and implemented
• # facilities achieving viability from tech. assistance

Communication Plan Karen Grimes
Audience Content WHO Time Line
FO Staff Initial communication roll out PPT
FO Supervisor At next staff meeting
Upper Management, including Bureau Chiefs
Roll out PPT What we need to do What we actually do What we propose to do Augmented with - Specific examples - Data from the field - Photos from the field - Video from the field
Barb Lynch presents
Communication Team develops/ Karen Grimes
3 weeks
EPA at preview event for kaizen
High Level - Talking points based on
PPT
Wayne Gieselman presents
Communication Team / Karen Grimes
2 weeks

Communication Plan Karen Grimes
30 Day Team Meeting Follow-up on topics and plan
Team 30 days
Field Office Staff Follow-up on topics and plan – more details, including tracking details, implementation, transition plan
Continual updates
Team After 30 day meeting – no later than 60 Days
As needed
Upper Management Progress Report Continual updates
Follow-up on topics and plan as determined by details of transition plan including budget requests and adding priorities.
Barb Lynch and Team
After 30 day meeting – no later than 60 Days
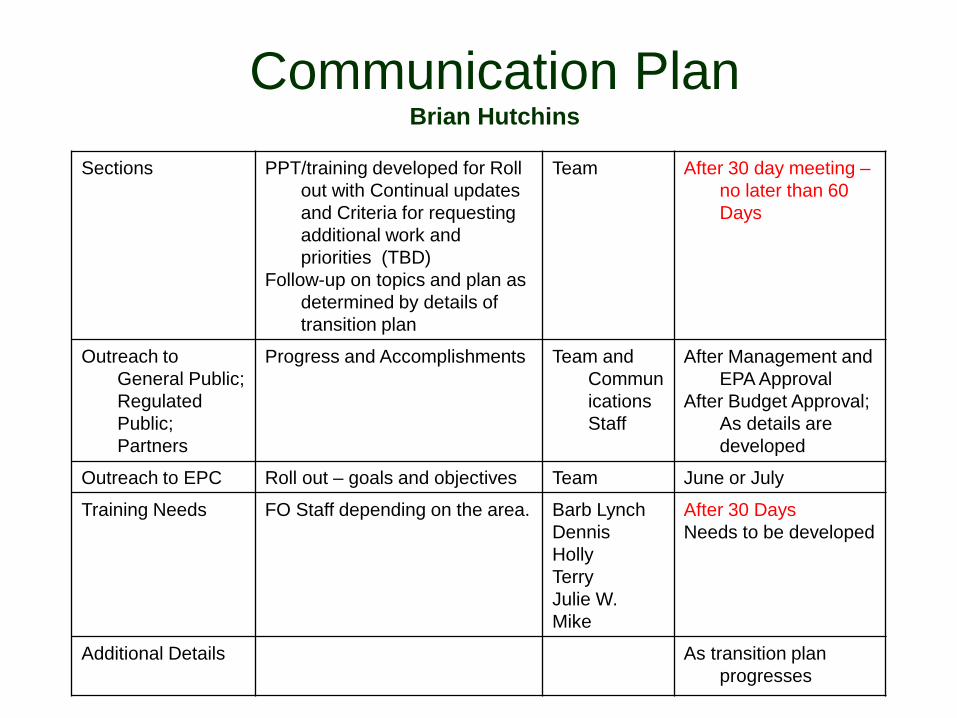
Communication Plan Brian Hutchins
Sections PPT/training developed for Roll out with Continual updates and Criteria for requesting additional work and priorities (TBD)
Follow-up on topics and plan as determined by details of transition plan
Team After 30 day meeting – no later than 60 Days
Outreach to General Public; Regulated Public; Partners
Progress and Accomplishments Team and Communications Staff
After Management and EPA Approval
After Budget Approval; As details are developed
Outreach to EPC Roll out – goals and objectives Team June or July
Training Needs FO Staff depending on the area. Barb Lynch Dennis Holly Terry Julie W. Mike
After 30 Days Needs to be developed
Additional Details As transition plan progresses

How to Measure Mike Wade
ER Who Will Track How to Track When
Amount of cleaned up material
Staff responding (ER or FO)
Spread Sheet (Excel) 2 weeks
Training Events and Contacts
Each FO, ER Spread Sheet (Excel) 2 weeks
Person Hours Set up activity code tracked via time sheets
Time Sheets 2 weeks

How to Measure Mike Wade
Unsewered Communities
What Who will How When
Gallons of treated WW FO involved Spread sheet 2 weeks
Property Value increase County Auditor Tax Evaluation Upon completion of each upgrade
Stream improvement WQ Each FO Pre/Post sampling Next state fiscal year
Number of hours budget into compliance upgraded
Each FO Spread sheet (using county records if appropriate
Next fiscal year

Level of Effort Planning - Transition Plan Curt Krieger
Short Term
• “Blur” FO Lines to accommodate immediate needs.
• Determine level of effort for short term
• Focus on state wide priorities with standards for action
• Needs determined quarterly
• Pilot or Trial efforts – UST inspections across Regional boundaries with FO1 – Realignment of funding in open feedlots allowing for cross
boundary efforts
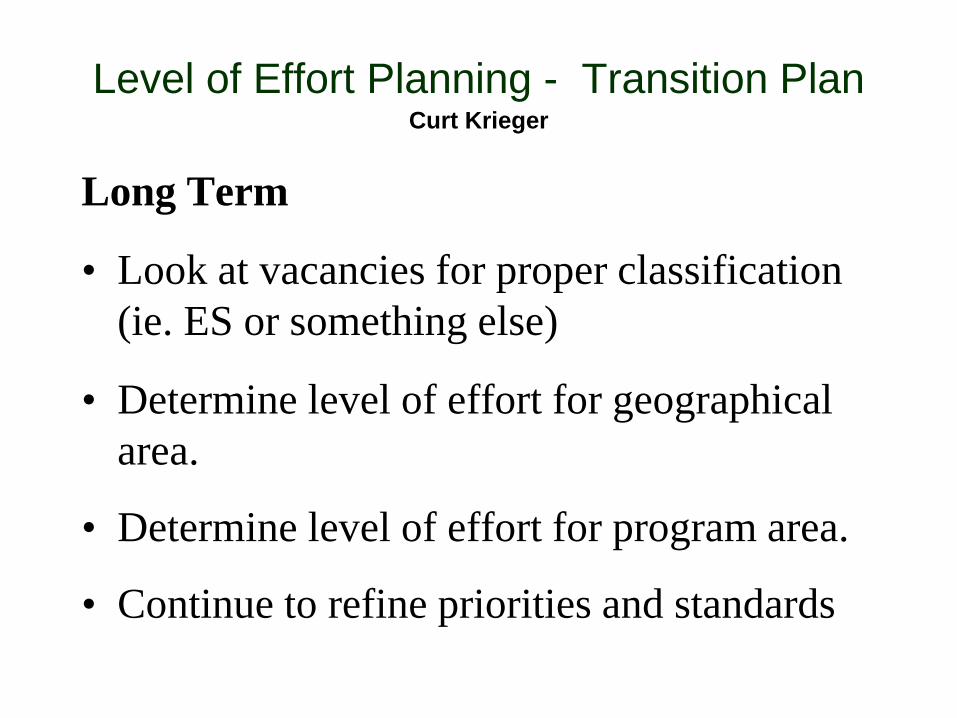
Level of Effort Planning - Transition Plan Curt Krieger
Long Term
• Look at vacancies for proper classification (ie. ES or something else)
• Determine level of effort for geographical area.
• Determine level of effort for program area.
• Continue to refine priorities and standards

Homework Jim Stricker
Item Item Description Person Responsible Due Date
1 Refine the measures and define who will track them. Barb Lynch July 1
2 Develop a tracking a system Bill Gross July 1
3 Prioritize inspections - Establish standards Barb Lynch July 1
4 Develop a training plan Jerah Gallinger Don Sievers
July 1
5 Look / Develop the Outreach plan Karen Grimes Barb Lynch Julie Sievers
July 1
6 Communications Plan Karen Grimes Mid April
7 Resource allocations Barb Lynch April 2

Team Member’s Experience Holly Vandemark
Dennis Alt Maggie Clover

Comments Consultant

We welcome your questions and comments!