Embed Size (px)
Citation preview

Escher DocumentationRelease 143
Zachary King
March 09 2016
Contents
1 Escher in 3 minutes 3
2 Help I just upgraded to v12 and my map and model caches are empty 5
3 Features 7
4 Supported browsers 9
5 Installation 11
6 Citing Escher 13
7 Contents 1571 Getting started 1572 Escher COBRA and COBRApy 2773 Run Escher locally and in IPython 2774 Validate and convert maps 2875 Building and contributing maps 2976 Developing with Escher 3177 EscherConverter 3378 JavaScript API 3979 Python API 44710 License 48
Python Module Index 49
i
ii
Escher Documentation Release 143
Escher is a web-based tool for building viewing and sharing visualizations of biological pathways These lsquopathwaymapsrsquo are a great way to contextualize biological datasets The easiest way to use Escher is to browse and build mapson the Escher website New users may be interested in the Getting started guide
Contents 1
Escher Documentation Release 143
2 Contents
CHAPTER 1
Escher in 3 minutes
3
Escher Documentation Release 143
4 Chapter 1 Escher in 3 minutes
CHAPTER 2
Help I just upgraded to v12 and my map and model caches areempty
Starting with Escher v12 the maps and models available from the Escher website are versioned Each time youupgrade Escher you will have access to the new versions of the Escher maps and models Any maps and models youwere using before are still saved in the Escher cache in case you need them For more details on finding managingand clearing the cache see the Python cache functions
Also starting with Escher v12 the maps and models in Escher are the same as those in the BiGG Database
5
Escher Documentation Release 143
6 Chapter 2 Help I just upgraded to v12 and my map and model caches are empty
CHAPTER 3
Features
1 View pathway maps in any modern web browser
2 Build maps using the content of genome-scale metabolic models
3 Visualize data on reactions genes and metabolites
4 Full text search
5 Detailed options for changing colors sizes and more all from the web browser
6 View maps inside the IPython Notebook
7 Embed maps within any website with minimal dependencies (escherjs d3js and optionally Twitter Bootstrap)
7
Escher Documentation Release 143
8 Chapter 3 Features
CHAPTER 4
Supported browsers
We recommend using Google Chrome for optimal performance but Escher will also run in the latest versions ofFirefox Internet Explorer and Safari (including mobile Safari)
9
Escher Documentation Release 143
10 Chapter 4 Supported browsers
CHAPTER 5
Installation
Escher can be used without any installation by visiting the Escher website However you can install escher if youwould like to (1) run Escher offline (2) include your own maps and models in the launch page (3) view Escher mapsin an IPython Notebook or (4) modify the source code
To install the latest stable version of Escher run
pip install escher
For more information see the documentation on Run Escher locally and in IPython and Developing with Escher
11
Escher Documentation Release 143
12 Chapter 5 Installation
CHAPTER 6
Citing Escher
You can help support Escher by citing our publication when you use Escher or EscherConverter
Zachary A King Andreas Draumlger Ali Ebrahim Nikolaus Sonnenschein Nathan E Lewis and Bernhard O Pals-son (2015) Escher A web application for building sharing and embedding data-rich visualizations of biologicalpathways PLOS Computational Biology 11(8) e1004321 doi101371journalpcbi1004321
13
Escher Documentation Release 143
14 Chapter 6 Citing Escher
CHAPTER 7
Contents
71 Getting started
711 Introduction
Escher is here to help you visualize pathway maps But if you have never heard of a pathway map you mightappreciate a quick introduction
What are pathway maps
To understand pathway maps it is useful to think about the general organization of a cell At the smallest levelmolecules in a cell are arranged in three-dimensional structures and these structures determine many of the functionsthat take place in a cell For example the 3D structure of an enzyme determines the biochemical reactions that it cancatalyze These structures can be visualized in 3D using tools like Jmol (as in this example structure)
The DNA sequence is a second fundamental level of biological organization DNA sequences are the blueprints for allthe machinery of the cell and they can be visualized as a one-dimensional series of bases (ATCG) using tools like theUCSC genome browser
To use a football analogy the 3D molecular structures are akin to the players on the field and the information in theDNA sequence is like the playbook on the sidelines But football would not be very interesting if the players nevertook to the field and executed those plays So we are missing this level of detail the execution of biological plans bythe molecular players
What we are missing is the biochemical reaction network Proteins in the cell catalyze the conversion of substratemolecules into product molecules and these reactions are responsible for generating energy constructing cellularmachinery and structures detecting molecules in the environment signaling and more Biochemical reactions canbe grouped into pathways when they work in concert to carry out a function (If a reaction is a football play thenthe pathway is a drive) And Escher can be used to visualize these reactions and pathways Together we call thesevisualizations pathway maps
Escher to the rescue
Many Escher maps represent metabolic pathways and Escher was developed at the Systems Biology Research Groupwhere we have been building genome-scale models of metabolism over the past fifteen years However Escher is notlimited to metabolism It can be used to visualize any collection of biochemical reactions
Escher includes one more killer feature The ability to visualize datasets on a pathway map Many biological discov-eries are enabled by collecting and analyzing enormous datsets and so biologists are grappling with the challenges ofbig data By visualizing data in the context of pathway maps we can quickly spot trends which would not be apparent
15
Escher Documentation Release 143
with standard statistical tools And Escher visualizations can be adapted and shared to demonstrate those biologicaldiscoveries
The rest of this guide will introduce the Escher user interface and the major features of Escher
712 The launch page
When you open the Escher website you will see a launch page that looks like this
The options on the launch page are
bull Filter by organism Choose an organism to filter the Maps and Models
bull Map Choose a pre-built map or start from scratch with an empty builder by choosing None In parenthesesnext to the map name you will see the name of the model that was used to build this map
bull Model (Optional) If you choose a COBRA model to load then you can add new reactions to the pathway mapYou can also load your own model later after you launch the tool For an explanation of maps models andCOBRA see Escher COBRA and COBRApy
bull Tool
ndash The Viewer allows you to pan and zoom the map and to visualize data for reactions genes and metabo-lites
ndash The Builder in addition to the Viewer features allows you to add reactions move and rotate existingreactions add text annotations and adjust the map canvas
bull Options
ndash Scroll to zoom (instead of scroll to pan) Determines the effect of using the mousersquos scroll wheel overthe map
ndash Never ask before reloading If this is checked then you will not be warned before leaving the page evenif you have unsaved changes
Choose Load map to open the Escher viewer or builder in a new tab and prepare to be delighted by your very ownpathway map
16 Chapter 7 Contents
Escher Documentation Release 143
713 The menu bar
Once you have loaded an Escher map you will see a menu bar along the top of the screen Click the question mark tobring up the Escher documentation
714 Loading and saving maps
Using the map menu you can load and save maps at any time
Click Save map JSON to save the Escher map as a JSON file which is the standard file representing an Escher map
NOTE The JSON file does NOT save any datasets you have loaded This may be changed in a future version ofEscher
NOTE 2 In Safari saving files from Escher works a little differently than in the other major browsers After clickingSave map JSON Safari will load a new tab with the raw content of the Escher map file To save the file chooseFilegtSave As from the Safari menu A new dialog appears in the dropdown menu near the bottom select PageSource (rather than Web Archive) give your file an appropriate name (eg mapjson for an Escher map or mapsvgfor an SVG export) and click Save
Later you can can load a JSON file to view and edit a map by clicking Load map JSON
Click Export as SVG to generate a SVG file for editing in tools like Adobe Illustrator and Inkscape This is thebest way to generate figures for presentations and publications Unlike a JSON file a SVG file maintains the datavisualizations on the Escher map However you cannot load SVG files into Escher after you generate them
Click Clear Map to empty the whole map leaving a blank canvas NOTE You cannot undo Clear Map
715 Loading models
Use the model menu to manage the COBRA model loaded in Escher
71 Getting started 17
Escher Documentation Release 143
Choose Load COBRA model JSON to open a COBRA model Read more about COBRA models in Escher COBRAand COBRApy Once you have COBRApy v030 or later installed then you can generate a JSON model by followingthis example code
Once you have loaded a COBRA model there may be inconsistencies between the content in the map and the model(eg reaction IDs descriptive names and gene reaction rules) You click Update names and gene reaction rulesusing model to find matching reactions and metabolites between the map and the model (based on their IDs) andthen apply the names and gene reaction rules from the model to the map The reactions that do not match will behighlighted in red (This can be turned off again in the settings menu by deselecting Highlight reactions not in model)More advice on building maps is available in Building and contributing maps
Click Clear Model to clear the current model
716 Loading reaction gene and metabolite data
Datasets can be loaded as CSV files or JSON files using the Data Menu
In Escher reaction and gene datasets are visualized by changing the color thickness and labels of reaction arrowsMetabolite datasets are visualized by changing the color size and labels of metabolite circles The specific visualstyles can be modified in the Settings menu When data is not present for a specific reaction gene or metabolite thenthe text label will say lsquondrsquo which means lsquono datarsquo
18 Chapter 7 Contents
Escher Documentation Release 143
The structure of a CSV file
CSV files should have 1 header row 1 ID column and either 1 or 2 columns for data values The ID column cancontain BiGG IDs or descriptive names for the reactions metabolites or genes in the dataset Here is an example witha single data value columns
IDtime 0secglc__D_c54g6p__D_c23
Which might look like this is Excel
ID time 0secglc__D_c 54g6p_c 23
If two datasets are provided then the Escher map will display the difference between the datasets In the Settings menuthe Comparison setting allows you to choose between comparison functions (Fold Change Log2(Fold Change) andDifference) With two datasets the CSV file looks like this
ID time 0sec time 5sglc__D_c 54 102g6p_c 23 81
Data can also be loaded from a JSON file This Python code snippet provides an example of generating the properformat for single reaction data values and for reaction data comparisons
import json
save a single flux vector as JSONflux_dictionary = glc__D_c 54 g6p_c 23with open(outjson w) as f
jsondump(flux_dictionary f)
save a flux comparison as JSON
71 Getting started 19
Escher Documentation Release 143
flux_comp = [glc__D_c 54 g6p_c 23 glc__D_c 102 g6p_c 81]with open(out_compjson w) as f
jsondump(flux_comp f)
Gene data and gene reaction rules
Escher uses gene reaction rules to connect gene data to the reactions on a metabolic pathway You can see these genereaction rules on the map by selecting Show gene reaction rules in the Settings menu
Gene reaction rules show the genes whose gene products are required to catalyze a reaction Gene are connected usingAND and OR rules AND rules are used when two genes are required for enzymatic activity eg they are membersof a protein complex OR rules are used when either gene can catalyze the enzymatic activity eg they are isozymes
With OR rules Escher will take the sum of the data values for each gene With AND rules Escher will either takethe mean (the default) or the minimum of the components The AND behavior (mean vs minimum) is defined in theSettings menu
717 Editing and building
The Edit menu gives you access to function for editing the map
20 Chapter 7 Contents
Escher Documentation Release 143
Escher has five major modes and you can switch between those modes using the buttons in the Edit menu or usingthe buttons in the button bar on the left of the screen
1 Pan mode Drag the canvas to pan the map You can also use the mouse scroll wheel or trackpad scroll function(drag with 2 fingers) to pan the map (or to zoom if you selected Scroll to zoom in the settings)
2 Select mode Select nodes by clicking on them Shift-click to select multiple nodes or drag across the canvasto select multiple nodes using the selection brush
3 Add reaction mode If you have loaded a Model then click on the canvas to see a list of reactions that you candraw on the map Click on a node to see reactions that connect to that node In the input box you can search byreaction ID metabolite ID or gene ID (locus tag)
4 Rotate model Before entering rotate mode be sure to select one or more nodes in select mode Then afterentering rotate mode drag anywhere on the canvas to rotate the selection You can also drag the red crosshairsto change the center of the rotation
5 Text mode Use text mode to add text annotations to the map Click on the canvas to add a new text annotationor click an existing annotation to edit it When you are finished click Enter or Escape to save the changes
71 Getting started 21
Escher Documentation Release 143
In addition to the editing modes the Edit menu gives you access to the following commands
bull Delete Delete the currently selected node(s)
bull Undo Undo the last action NOTE Certain actions such as editing the canvas cannot be undone in the currentversion of Escher
bull Redo Redo the last action that was undone
bull Toggle primarysecondary node In Escher each metabolite node is either a primary node or a secondarynode Primary nodes are larger and secondary nodes can be hidden in the Settings menu Use this command totoggle the currently selected node(s) between primary and secondary
bull Rotate reactant locations When you draw a new reaction in Escher this command will rotate the new reactantsso that a new reactant is primary and centered This command is extremely useful when you are drawing a longpathway and you want to quickly switch which metabolite to ldquofollowrdquo eg make sure you are following thecarbon-containing metabolites
If you are confused then try drawing a new pathway and hitting the ldquocrdquo key to see the reactants rotate
bull Select all Select all nodes
bull Select none Unselect all nodes
bull Invert selection Select all the nodes that are currently unselected This feature is very useful when you wantto keep just one part of the map Simply drag to select the part you want to keep call the Invert selectioncommand then call the Delete command
718 Editing the canvas
A somewhat non-obvious feature of Escher is that you can edit the canvas by dragging the canvas edges This ispossible in Pan mode and Select mode
22 Chapter 7 Contents
Escher Documentation Release 143
719 View options
bull Zoom in Zoom in to the map
bull Zoom out Zoom out of the map
bull Zoom to nodes Zoom to see all the nodes on the map
bull Zoom to canvas Zoom to see the entire canvas
bull Find Search for a reaction metabolite or gene on the map
bull Show control points Show the control points you can drag these red and blue circle to adjust the shapes ofthe reactions curves
bull Settings Open the Settings menu
7110 The button bar
The button bar give you quick access to many of the common Escher functions
71 Getting started 23
Escher Documentation Release 143
24 Chapter 7 Contents
Escher Documentation Release 143
7111 Settings
View and build options
bull Identifiers Choose whether to show BiGG IDs or descriptive names for reactions metabolites and genes
bull Hide secondary metabolites This will simplify the map by hiding all secondary metabolites and the pathsconnected to them
bull Show gene reaction rules Show the gene reaction rules below the reaction labels even gene data is not loaded
bull Hide reaction gene and metabolite labels Another option to visually simplify the map this will hide alllabels that are not text annotations
bull Allow duplicate reactions By default duplicate reactions are hidden in the add reaction dropdown menuHowever you can turn this option on to show the duplicate reactions
bull Highlight reactions not in model Highlight in red any reactions that are on the map but are not in the modelThis is useful when you are adapting a map from one model for use with another model
71 Getting started 25
Escher Documentation Release 143
Reaction data settings
When reaction or gene data is loaded this section can be used to change visual settings for reactions
The color bar has individual control points and you can drag the control points (execpt min and max) left and right tochange their values Alternatively you can use the dropdown menu (next to the word median in the figure above) toattach a control point to a statistical measure (mean median first quartile (Q1) or third quartile (Q3)) This lets youchoose a color scale that will adapt to your dataset
For each control point you can choose a color by entering a CSS-style color (eg red ff0000 rgba(20 20 255 05)and you can choose a size that will scale the thickness of reactions
There are also color and size options for reactions that do not have any data value
Finally there are a few onoff settings for the loaded reaction or gene dataset
bull Options These determine how to visualize the datasets Check Absolute value to color and size reactions bythe absolute value of each data value The Size Color and Text options can be unselected to turn off sizingcoloring and data values in reaction labels individually
bull Comparison Determines the comparison algorithm to use when two datasets are loaded
bull Method for evaluating AND Determines the method that will be used to reconcile AND statements in genereaction rules when there is gene data loaded See Gene data and gene reaction rules for more details
Metabolite data settings
The data settings for metabolite data are analagous to those for reaction data The only difference is that size nowrefers to the size of the metabolite circles
26 Chapter 7 Contents
Escher Documentation Release 143
72 Escher COBRA and COBRApy
Escher can be used as an independent application but it draws heavily on the information in COBRA models ACOBRA model is a collection of all the reactions metabolites and genes known to exist in an organism (In theliterature these are generally called genome-scale models (GEMs) but we refer to them as COBRA models here toemphasize that Escher interoperates with models that are exported from COBRApy)
By loading a COBRA model into the Escher interface you have access to every reaction and metabolite in that modelYou also have the gene reaction rules for the reactions in the network which allow you to connect gene data toreactions and metabolites
COBRApy is a software package for COBRA modeling written in Python The Escher Python package uses CO-BRApy package for reading and writing COBRA models
721 Maps and models
In Escher you will see references to maps and models
A map contains the reactions and metabolites that you see in the Escher builder including their locations text annota-tions and the canvas
A model (a COBRA model) contains reactions and metabolites that you have not drawn yet Thus you can load aCOBRA model when you want to draw new reactions on the map
722 What is JSON and why do we use it
Both Escher maps and COBRA models are stored as JSON files JSON is a useful plain-text format for storing nesteddata structures We use JSON much like the SBML community uses XML You may notice that SBML files have axml extension and Escher maps and COBRA models have a json extension
You can use Python to explore a JSON file like this
import json
with open(mapjson r) as fmap_object = jsonload(f)
print map_object[0]print map_object[1][reactions]values()[0]
723 Escher SBML and SBGN
A tool has been developed for converting Escher maps to SBML Layout and SBGN and it will be released soon
COBRA models can be converted to SBML using COBRApy
73 Run Escher locally and in IPython
To run Escher on a local computer or to use Escher in PythonIPython first install it The Python package for Eschercan be installed using pip
pip install escher
72 Escher COBRA and COBRApy 27
Escher Documentation Release 143
Depending on your installation of Python you may need sudo
sudo pip install escher
Alternatively one can download the source files and install the package directly
python setuppy install
731 Escher in the IPython Notebook
Once you have installed Escher locally you can interact with Escher maps in an IPython Notebook
Here are example notebooks to get started with
bull COBRApy and Escher
bull JavaScript development and offline maps
bull Generate JSON models in COBRApy
Dependencies
bull Jinja2
bull Tornado
bull COBRApy 030 or later
732 Running the local server
You can run your own local server if you want to use Escher offline or explore your own maps with the homepagebrowser To get started install the Python package and run from any directory by calling
python -m escherserver
This starts a server at httplocalhost7778 You can also choose another port
python -m escherserver --port=8005
74 Validate and convert maps
741 Validate an Escher map
Escher maps follow a specification using the JSON Schema format Therefore any JSON Schema validator can beused to validate an Escher map by comparing it to the latest schema file For example the current schema is locatedhere
httpsgithubcomzakandrewkingescherblobmasterescherjsonschema1-0-0
To make this easier the Escher Python package includes a validation script To validate a map first install Escher
pip install escher
Then call the validator
python -m eschervalidate my_mapjson
Any errors in the map will print to the console
28 Chapter 7 Contents
Escher Documentation Release 143
742 Convert or upgrade an Escher map
Any Escher maps built with pre-release versions of Escher will not load right away in the stable v10 release Toconvert pre-release maps to the new format follow these steps
1 Install Escher
pip install escher
2 Find a COBRA model for your maps This COBRA model will be used to update the content of the mapin order to support all the new Escher features You can use a COBRA model encoded as SBML or JSON(generated with COBRApy v030b4 or later) The COBRA models currently available on the Escher websitecan be downloaded from the BiGG Models website
httpbiggucsdedu
For a refresher on the distinction between Escher maps COBRA models and their file types (SBML JSONSBML Layout) see Escher COBRA and COBRApy
3 Run the convert_map script to convert your existing Escher map (my_old_mapjson) to the new formatusing a COBRA model (model_filejson or model_filexml in these examples)
With a JSON file modelpython -m escherconvert_map my_old_mapjson pathtomodel_filejson
With an SBML modelpython -m escherconvert_map my_old_mapjson pathtomodel_filexml
Those commands will generate a new map called my_old_map_convertedjson that will load in Escher v10and later
75 Building and contributing maps
We are excited to collect pathway maps for every organism with a well characterized metabolic network This sectiondescribes the process of building a new map either from scratch or using a COBRA model with BiGG IDs
751 Building from scratch
To build a map from scratch you will first need a COBRA model for your map See the section Escher COBRA andCOBRApy for some background information on COBRA models
If you would like to eventually contribute your map to the Escher website it is important that your COBRA modeladheres to the identifiers in the BiGG Database Escher and BiGG are being developed together and we want tomaintain consistency and interoperability between them
Once you have a COBRA model you can follow these steps
1 Load your model in the Escher Builder
2 Begin building new reactions If you are familiar with the genes in your organism then try search for newreactions by their gene IDs
3 Limit each map to ~200 reactions Maps larger than this will slow down the Escher viewer especially on oldbrowsers Rather than building one giant map Escher is designed for building many smaller subsystem maps
4 When you have built a map for your a subsystem save the map as JSON with a name that includes the modelID followed by a period followed by the name of the subsystem For example
75 Building and contributing maps 29
Escher Documentation Release 143
iMM904Amino acid biosynthesisjson
5 (Optional) Once you have a set of subsystem maps you can set up a local Escher server so that subsystem mapsappear in the ldquoquick jumprdquo menu in the bottom right corner of the screen (as seen here for iJO1366) To setthis up you will need to start a local server as describe in Running the local server Next find your local cachedirectory by running this command in a terminal
python -c import escher print(escherget_cache_dir(name=maps))
This will print the location of the local maps cache Add your new subsystem maps to cache folder Now whenyou run the server (described in Running the local server) you should see that quick jump menu appear
NOTE The cache directory is organized into folders for organisms You can use these folder for filtering byorganism on the local launch page or you can place the maps in the top directory
NOTE 2 A similar approach can be used to access your models from the local launch page Place maps in thefolder indicated by
python -c import escher print(escherget_cache_dir(name=models))
752 Building from an existing map for a similar organism
Follow the instruction above except rather than starting from scratch load an existing Escher map for a differentorganism
Once you have the new model loaded use the Update names and gene reaction rules using model button in theModel menu to convert all descriptive names and gene reaction rules in the model to those in the map Reactions thatdo not match the model will be highlighted in red (This can be turned off again in the settings menu by deselectingHighlight reactions not in model)
Now visit each highlighted reaction and see if you can replace it with an equivalent biochemical pathway from themodel If not then delete the reaction and move on
Finally when there are no highlighted reactions left you can repeat this for other subsystems
753 Submitting maps to the Escher website
If you would like to contribute maps to Escher you can make a Pull Request to the GitHub repository eschergithubioMake sure there is a folder with the name of the organism in 1-0-0maps For example a new yeast map goes inthe folder
1-0-0mapsSaccharomyces cerevisiae
Then name your map by concatenating the model ID and the map name separated by a period For example a yeastmap built with the genome-scale model iMM904 could be named
iMM904Amino acid biosynthesisjson
Then add the JSON file for the model to the Pull Request if that model is not already available As before make afolder for your organism within 1-0-0models The model filename is just the model ID
In this example a correct Pull Request would include the following files
1-0-0mapsSaccharomyces cerevisiaeiMM904Amino acid biosynthesisjson1-0-0modelsSaccharomyces cerevisiaeiMM904json
30 Chapter 7 Contents
Escher Documentation Release 143
76 Developing with Escher
761 Using the static JavaScript and CSS files
You can include the compiled Escher JavaScript and CSS files in any HTML document The only dependencies ared3js and optionally Twitter Bootstrap if you are using the option menu=rsquoallrsquo
The compiled files are available form npmcdn
httpsnpmcdncomescher-visjsdistescherjshttpsnpmcdncomescher-visjsdistescherminjshttpsnpmcdncomescher-viscssdistbuildercsshttpsnpmcdncomescher-viscssdistbuildermincss
Source maps are also hosted there
httpsnpmcdncomescher-visjsdistescherjsmaphttpsnpmcdncomescher-visjsdistescherminjsmaphttpsnpmcdncomescher-viscssdistbuildermincssmap
If you want a particular version of escher add a version tag like this
httpsnpmcdncomescher-vis140-beta3jsdistescherjs
For an example of the boilerplate code that is required to begin developing with Escher have a look at the escher-demorepository For projects built with npm use the escher-test repository as a guide
762 Building and testing Escher
First install dependencies with npm
npm install
Escher uses grunt to manage the build process To run typical build steps just run
npm run compile
To test the JavaScript files run
npm run test
For Python testing run this in the py directory
python setuppy test
Build the static website
python setuppy build_gh
Clear static website files
python setuppy clean
Build and run the docs
cd docsmake htmlcd _buildhtml
76 Developing with Escher 31
Escher Documentation Release 143
python -m SimpleHTTPServer python 2python -m httpserver python 3
763 Generating and reading Escher and COBRA files
The Escher file format
Escher layouts are defined by JSON files that follow a specific schema using json schema The latest schemafor Escher JSON files is here The Escher schemas are versioned with inspiration from SchemaVer Theeschervalidate module can be used to validate models against the schema
The Escher layout schema is designed to be as simple as possible For example the core metabolism map of Es-cherichia coli is layed out like this
[
map_name E coli coreCore metabolismmap_id 2938hoq32a1map_description E coli core metabolic networknLast Modified Fri Dec 05 2014 163944 GMT-0800 (PST)homepage httpseschergithubioschema httpseschergithubioescherjsonschema1-0-0
reactions nodes text_label canvas
x 7857062530517567y 31436893920898433width 5894515691375733height 4860457037353515
]
The map_name includes the model that was used to build this layout followed by a period and then a readable namefor the map The map_id is a unique identifier for this map The map_description describes the map and thelast time it was modified Both the homepage and the schema entries must have exactly these values for the Eschermap to be valid
In the next section the reactions nodes labels and canvas are all defined For reactions nodes and text labels eachelement has a key that is an arbitrary integer As long as there are no repeated IDs (eg no 2 segments with the ID517) then everything should work fine
Read through the schema (here) for more detail on the format
The COBRA file format
COBRA models are also saved as JSON files This format has not been documented with a schema but you canbrowse through the core metabolism model as a guide to generating valid COBRA models
I still need help
If you are interested in developing with Escher and you need more information than what is provided in the documen-tation please contact Zachary King (zaking-AT-ucsd-DOT-edu)
32 Chapter 7 Contents
Escher Documentation Release 143
77 EscherConverter
EscherConverter is a standalone program that reads files created with the graphical network editor Escher and convertsthem to files in community standard formats
Download EscherConverter 05 (137 MB)
771 Using EscherConverter
Escher uses a JSON file format to represent its networks This format has been developed because of its very small filesize and its compatibility to online programs that are written in JavaScript In particular JSON is a JavaScript ObjectNotation or in other words a JSON file directly represents components of JavaScript programs This makes parsingvery simple and allows direct use of those files in web-based programs
However in systems biology specific file formats have been developed with the aim to be easily exchangeable betweensoftware implemented in diverse programming languages
To this end these formats support semantically clear annotations and are maintained by a large community of scientistsEscherConverter supports export to two particularly important XML-based community file formats SBML with layoutextension and SBGN-ML
While SBML has been mainly developed for dynamic simulation of biological networks it is nowadays also usablefor diverse other purposes Its layout extension facilitates the encoding the display of biological networks
SBGN-ML has been directly developed as a language for the display of biological pathway maps of diverse kinds Itstores the position and connection of entities similar to what is shown in Escher networks
EscherConverter takes Escherrsquos JSON files as input and generates equivalent SBML Level 3 Version 1 files with layoutextension or SBGN-ML files
In order to ensure that the conversion is correct EscherConverter provides its own display that gives users a previewof how the export data format will be rendered by other tools In this preview display you can zoom in and out movearcs and node positions However it is important to know that none of the changes made in this preview are stored inthe export file
Download and Installation
You can obtain local copy of EscherConverter by clicking here
As a Javatrade application no specific installation is required for EscherConverter
However make sure you have a recent Javatrade Runtime Environment (JRE) installed on your computer (at least JRE8) You can obtain Javatrade from the Oracle website There you can also find installation instructions for your respectiveoperating system
Once Javatrade has been installed you can simply place the EscherConverter JAR file somewhere on your local computerfor instance in the folder
bull Applications if you are working under Mac OS
77 EscherConverter 33
Escher Documentation Release 143
bull opt for Linux computers
bull CProgram Files if you are using Windows
Launching the program
You can launch EscherConverter simply by double-clicking on the application JAR file This will open a followinggraphical user interface as described in the following figures
Figure 1 | The graphical user interface of EscherConverter
bull Preferences opens a settings dialog (see next screenshot)
bull Open displays a file chooser to select an input file in JSON format
bull Save export the map that is displayed in the current tab to SBML or SBGN-ML
bull Discard closes the current tab without saving
bull Help opens the online help that displays all command-line options
bull License displays the license under which this software is distributed
bull About shows information about the authors of this software
bull Main the main panel of the software in which converted Escher maps will be displayed organized in tabs
bull Status the status bar shows information and logging messages during the conversion
34 Chapter 7 Contents
Escher Documentation Release 143
Figure 2 | The preferences dialog All settings in this dialog are also available through EscherConverterrsquos command-line interface
Layout section several properties that are required in SBML and SBGN-ML are not explicitly specified in EscherrsquosJSON format and therefore need to be adjusted by the user These are the size of the drawing canvas the default boxsize for text labels the size of primary and secondary nodes In contrast to SBGN-ML and Escherrsquos JSON formatthe SBML layout extension supports three-dimensional displays When selecting this export file format it is thereforenecessary to also define the z-coordinate and the depth of all objects
Components and naming section Most settings in this section are specific for the SBML layout extension and areonly active if this output format is selected These are names and identifiers of the layout component and the in caseof SBML mandatory default compartment (a compartment without physical meaning a reaction space in which allmetabolites are located) EscherConverter can infer compartment bounds from metabolites but this is an experimentalfeature Just try it and see how the preview changes
77 EscherConverter 35
Escher Documentation Release 143
Figure 3 | A layout preview
The birds-eye view and the navigation component on the left help you navigate through the network display Thisgraph shows you how the converted pathway map will be rendered by software that supports SBGN-ML or the SBMLlayout extension This preview can be modified by moving arcs or nodes however none of those changes are storedwhen exporting the file In this current version EscherConver only exports layouts as given in the original JSON file
Included third-party software
EscherConverter includes several third-party libraries which we here list and acknowledge
bull ArgParser
bull JSBML
bull libSBGN
bull Pixel-Mixer icons
bull yFiles
772 Command-line interface API
You can launch EscherConverter from the command-line On a Unix system (such as Linux MacOS or Solaris etc)use a command like
bash$ java -jar -Xms8G -Xmx8G -Duserlanguage=en EscherConverter-05jar [options]
Under Window use a command like
Cgt javaw -jar -Xms8G -Xmx8G -Duserlanguage=en EscherConverter-05jar [options]
Escher has a large collection of command-line options (see below) which can be useful if you want to launch theprogram with specific settings or if multiple files are to be converted in a batch mode It is even possible to completelydisable the graphical user interface
36 Chapter 7 Contents
Escher Documentation Release 143
Input and output files
Definition of input and output data files as well as the format for the output
--input=ltFilegt
Specifies the JSON input file If a directory is given the conversion will be recursively performed Accepts JSON
--output=ltFilegt
The path to the file into which the output should be written If the input is a directory this must also be a directory inorder to perform a recursive conversion Accepts SBML SBGN
Escher layout
The options in this group allow you to influence how large certain elements should be displayed
--canvas-default-height=ltDoublegt
Just as in the case of the width of the canvas this value needs to be specified for cases where the JSON input file lacksan explicit specification of the canvas height Arguments must fit into the range [11E9] (Default value 2500)
--canvas-default-width=ltDoublegt
This value is used when no width has been defined for the canvas Since the width attribute is mandatory for the layouta default value must be provided in these cases Arguments must fit into the range [11E9] (Default value 2500)
--label-height=ltDoublegt
With this option you can specify the height of the bounding box of text labels Arguments must fit into the range[11E9] (Default value 500)
--label-width=ltDoublegt
This option defines the width of bounding boxes for text labels Arguments must fit into the range [11E9] (Defaultvalue 1600)
--node-depth=ltDoublegt
The length of nodes along z-coordinate Escher maps are actually two-dimensional but in general a layout can bethree-dimensional This value should be an arbitrary value greater than zero because some rendering engines mightnot display the node if its depth is zero Arguments must fit into the range [11E9] (Default value 10)
--node-label-height=ltDoublegt
Node labels can have a size different from general labels in the graph Here you can specify how height the boundingbox of the labels for nodes should be Arguments must fit into the range [11E9] (Default value 200)
--primary-node-height=ltDoublegt
The primary node should be bigger than the secondary node With this option you can specify the height of this typeof nodes Arguments must fit into the range [11E9] (Default value 300)
--primary-node-width=ltDoublegt
Escher maps distinguish between primary and secondary nodes Primary nodes should be larger than secondary nodesand display the main flow of matter through the network This option allows you to specify the width of primarynodes Arguments must fit into the range [11E9] (Default value 300)
77 EscherConverter 37
Escher Documentation Release 143
--reaction-label-height=ltDoublegt
Reaction label heightArguments must fit into the range [11E9] (Default value 300)
--reaction-node-ratio=ltDoublegt
This value is used as a conversion factor to determine the size of the reaction display box depending on the size ofprimary nodes Height and width of reaction nodes are determined by dividing the corresponding values from theprimary node size by this factor Arguments must fit into the range [01] (Default value 05)
--secondary-node-ratio=ltDoublegt
Similar to the reaction node ratio the size of secondary nodes (width and height) is determined by dividing thecorresponding values from the primary nodes by this value Arguments must fit into the range [01] (Default value06666666666666666)
--z=ltDoublegt
The position on the z-axis where the entire two-dimensional graph should be drawn Arguments must fit into the range[-1E91E9] (Default value 00)
Escher Components and their naming
Here you can influence which elements are to be included in the layout and how elements in the layout are to be calledor identified
--format=ltOutputFormatgt
The desired format for the conversion eg SBML All possible values for type ltOutputFormatgt are SBGN andSBML (Default value SBML)
--layout-id=ltStringgt
In contrast to the name this identifier does not have to be human-readable This is a machine identifier which muststart with a letter or underscore and can only contain ASCII characters (Default value Escher_Layout)
--layout-name=ltStringgt
This should be a human-readable name for the layout that is to be created This name might be displayed to describethe figure and should therefore be explanatory (Default value Escher Layout)
--compartment-id=ltStringgt
A compartment needs to have a unique identifier which needs to be a machine-readable Sting that must start with aletter or underscore and can only contain ASCII characters Since the JSON file does not provide this information thisoption allows you to specify the required identifier (Default value default)
--compartment-name=ltStringgt
With this option it is possible to define a name for the default compartment can be that needs to be generated for theconversion to SBML The name does not have any restrictions ie any UTF-8 character can be used (Default valueDefault compartment)
--infer-compartment-bounds
This converter can infer where the boundaries of compartments could be drawn To this end it uses each nodersquos BiGGids to identify the compartment of all metabolites Assuming that compartments have rectangular shapes the algorithmcan find the outermost node on each side of the box and hence obtain the boundaries of the compartment However
38 Chapter 7 Contents
Escher Documentation Release 143
this methods will fail when metabolites are drawn inside of such a box that belong to a different compartment that isactually further outside For this reason this option is deactivated by default (Default value false)
Options for the graphical user interface
--gui
If this option is given the program will display its graphical user interface (Default value false)
--log-level=ltStringgt
Change the log-level of this application This option will influence how fine-grained error and other log messages willbe that you receive while executing this program All possible values for type ltStringgt are ALL CONFIG FINEFINER FINEST INFO OFF SEVERE and WARNING (Default value INFO)
--log-file=ltFilegt
This option allows you to specify a log file to which all information of the program will be written Accepts (bp2bp3 log owl xml)
78 JavaScript API
class escherBuilder(map_data model_data embedded_css selection options)A Builder object contains all the UI and logic to generate a map builder or viewer
Arguments
bull map_data (object) ndash The data for a map to be passed to escherMapfrom_data() Ifnull then an empty Builder is initialized
bull model_data (object) ndash The data for a cobra model to be passed to es-cherCobraModel() Can be null
bull embedded_css (string) ndash The stylesheet for the SVG elements in the Escher map
bull selection (object) ndash (Optional Default In the body element) The d3 selection of anelement to place the Builder into The selection cannot be inside an SVG element
bull options (object) ndash (Optional) An object defining any of the following options
optionsmenu(Default rsquoallrsquo) The type of menu that will be displayed Can be lsquoallrsquo for the fullmenu or lsquozoomrsquo for just zoom buttons The lsquoallrsquo option requires the full set of Escherdependencies (D3js JQuery and Bootstrap) while the lsquozoomrsquo option requires only D3jsFor more details see Developing with Escher
optionsscroll_behavior(Default rsquopanrsquo) This option determines the effect that the scroll wheel will have onan Escher map Can be lsquopanrsquo to pan the map or lsquozoomrsquo to zoom the map when the usermoves the scroll wheel
optionsuse_3d_transform(Default Chooses a good option by testing the browser) If true then use CSS3 3D trans-forms to speed up panning and zooming This feature will only work on browsers thatsupport the 3D transforms It works best in the latest versions of Chrome Firefox andInternet Explorer Safari works better with this turned off
78 JavaScript API 39
Escher Documentation Release 143
optionsenable_editing(Default true) If true then display the map editing functions If false then hide themand only allow the user to view the map
optionenable_keys(Default true) If true then enable keyboard shortcuts
optionsenable_search(Default true) If true then enable indexing of the map for search Use false to disablesearching and potentially improve the map performance
optionsfill_screen(Default false) Use true to fill the screen when an Escher Builder is placed in a top-level container (eg a div in the body element)
optionsfull_screen_button(Default false) Include a button in the user interface for entering full screen mode
optionsignore_bootstrap(Default false) Do not use Bootstrap for buttons even if it available This is used toembed Escher in a Jupyter notebook where it conflicts with the Jupyter Boostrap installa-tion
Map model and styles
optionsstarting_reaction(Default null) The ID (as a string) of a reaction to draw when the Builder loads
optionsnever_ask_before_quit(Default false) If false then display a warning before the user closes an Eschermap If true then never display the warning This options is only respected if op-tionsenable_editing == true If enable_editing is false then the warnings are not dis-played
optionsunique_map_id(Default null) A unique ID that will be used to UI elements donrsquot interfere whenmultiple maps are in the same HTML document
optionsprimary_metabolite_radius(Default 15) The radius of primary metabolites in px
optionssecondary_metabolite_radius(Default 10) The radius of secondary metabolites in px
optionsmarker_radius(Default 5) The radius of marker nodes in px
optionsgene_font_size(Default 18) The font size of the gene reaction rules in px
optionshide_secondary_metabolites(Default false) If true then secondary nodes and segments are hidden This is conve-nient for generating simplified map figures
optionsshow_gene_reaction_rules(Default false) If true then show the gene reaction rules even without gene data
optionshide_all_labels(Default false) If checked hide all reaction gene and metabolite labels
Applied data
40 Chapter 7 Contents
Escher Documentation Release 143
optionsreaction_data(Default null) An object with reaction ids for keys and reaction data points for values
optionsreaction_stylesDefault [rsquocolorrsquo rsquosizersquo rsquotextrsquo]
An array of style types The array can contain any of the following lsquocolorrsquo lsquosizersquo lsquotextrsquolsquoabsrsquo The lsquocolorrsquo style means that the reactions will be colored according to the loadeddataset The lsquosizersquo style means that the reactions will be sized according to the loadeddataset The lsquotextrsquo style means that the data values will be displayed in the reactionlabels The lsquoabsrsquo style means the the absolute values of reaction values will be used fordata visualization
optionsreaction_compare_style(Default rsquodiffrsquo) How to compare to datasets Can be either lsquofold lsquolog2_foldrsquo orlsquodiffrsquo
optionsreaction_scaleDefault
[ type min color c8c8c8 size 12 type median color 9696ff size 20 type max color ff0000 size 25 ]
An array of objects that define points on the data scale
Each point is an object with a type attribute Types can be lsquominrsquo lsquomaxrsquo lsquomeanrsquo lsquoQ1rsquo (firstquartile) lsquomedianrsquo lsquoQ3rsquo (third quartile) or lsquovaluersquo Each point can have a color attributethat specifies a color with a string (any CSS color specification is allowed including hexrgb and rgba) Each point can have a size attirbute that specifies a reaction thickness as anumber Finally points with type lsquovaluersquo can have a value attribute that specifies an exactnumber for pont in the scale
NOTE If lsquominrsquo or lsquomaxrsquo is not provided Escher automatically adds them To be com-pletely clear about what you expect to see on the map it is best to provide lsquominrsquo andlsquomaxrsquo in addition to other scale points
Here are examples of each type
type rsquominrsquo color rsquoredrsquo size 12 Specifies that reactionsnear the minimum value are red and have thickness 12
type rsquoQ1rsquo color rsquorgba(100 100 50 05)rsquo size 12 Specifies that reactions near the first quartile have the given color opacity andthickness
type rsquomeanrsquo color rsquorgb(100 100 50)rsquo size 50 Specifies that reactions near the mean value have the given color and thickness
type rsquovaluersquo value 85 color rsquo333rsquo size 50 Specifies that reactions near 85 value have the given color and size
optionsreaction_no_data_color(Default rsquodcdcdcrsquo) The color of reactions with no data value
optionsreaction_no_data_size(Default 8) The size of reactions with no data value
optionsgene_data(Default null) An object with Gene ids for keys and gene data points for values
78 JavaScript API 41
Escher Documentation Release 143
optionsand_method_in_gene_reaction_rule(Default mean) When evaluating a gene reaction rule use this function to evaluate ANDrules Can be lsquomeanrsquo or lsquominrsquo
optionsmetabolite_data(Default null) An object with metabolite ids for keys and metabolite data points forvalues
optionsmetabolite_stylesDefault [rsquocolorrsquo rsquosizersquo rsquotextrsquo]
An array of style types The array can contain any of the following lsquocolorrsquo lsquosizersquo lsquotextrsquolsquoabsrsquo The lsquocolorrsquo style means that the metabolites will be colored according to the loadeddataset The lsquosizersquo style means that the metabolites will be sized according to the loadeddataset The lsquotextrsquo style means that the data values will be displayed in the metabolitelabels The lsquoabsrsquo style means the the absolute values of metabolite values will be used fordata visualization
optionsmetabolite_compare_style(Default rsquodiffrsquo) How to compare to datasets Can be either lsquofoldrsquo lsquolog2_foldrsquo orlsquodiffrsquo
optionsmetabolite_scaleDefault
[ type min color fffaf0 size 20 type median color f1c470 size 30 type max color 800000 size 40 ]
An array of objects that define points on the data scale See the description of op-tionsreaction_scale for an explanation of the format
optionsmetabolite_no_data_color(Default rsquoffffffrsquo) The color of metabolites with no data value
optionsmetabolite_no_data_size(Default 10) The size of metabolites with no data value
View and build options
optionsidentifiers_on_map(Default rsquobigg_idrsquo) The identifiers that will be displayed in reaction metabolite andgene labels Can be lsquobigg_idrsquo or lsquonamersquo
optionshighlight_missing(Default false) If true then highlight in red reactions that are not in the loaded COBRAmodel
optionsallow_building_duplicate_reactions(Default true) If true then building duplicate reactions is allowed If false then dupli-cate reactions are hidden in Add reaction mode
optionscofactors(Default [rsquoatprsquo rsquoadprsquo rsquonadrsquo rsquonadhrsquo rsquonadprsquo rsquonadphrsquorsquogtprsquo rsquogdprsquo rsquohrsquo rsquocoarsquo rsquoumprsquo rsquoh20rsquo rsquoppirsquo]) A list of metabo-lite IDs to treat as cofactors These will be secondary metabolites in new reactions
Callbacks
optionsfirst_load_callbackA function to run after loading the Builder
42 Chapter 7 Contents
Escher Documentation Release 143
load_map(map_data[ should_update_data])Load a map for the loaded data Also reloads most of the Builder content
Arguments
bull map_data ndash The data for a map
bull should_update_data (Boolean) ndash (Default true) Whether data should be ap-plied to the map
load_model(model_data[ should_update_data])Load the cobra model from model data
Arguments
bull model_data ndash The data for a Cobra model (Parsing in done by escherCobraModel)
bull should_update_data (Boolean) ndash (Default true) Whether data should be ap-plied to the model
view_mode()Enter view mode
build_mode()Enter build mode
brush_mode()Enter brush mode
zoom_mode()Enter zoom mode
rotate_mode()Enter rotate mode
text_mode()Enter text mode
set_reaction_data(data)
Arguments
bull data (array) ndash An array of 1 or 2 objects where each object has keys that are reactionIDrsquos and values that are data points (numbers)
set_metabolite_data(data)
Arguments
bull data (array) ndash An array of 1 or 2 objects where each object has keys that are metaboliteIDrsquos and values that are data points (numbers)
set_gene_data(data clear_gene_reaction_rules)
Arguments
bull data (array) ndash An array of 1 or 2 objects where each object has keys that are gene IDrsquosand values that are data points (numbers)
Arguments
bull clear_gene_reaction_rules (Boolean) ndash (Optional Default false) In addi-tion to setting the data also turn of the gene_reaction_rules
78 JavaScript API 43
Escher Documentation Release 143
79 Python API
class escherBuilder(map_name=None map_json=None model=None model_name=Nonemodel_json=None embedded_css=None reaction_data=None metabo-lite_data=None gene_data=None local_host=None id=None safe=Falsekwargs)
A metabolic map that can be viewed edited and used to visualize data
This map will also show metabolic fluxes passed in during consruction It can be viewed as a standalone htmlinside a browswer Alternately the respresentation inside an IPython notebook will also display the map
Maps are stored in json files and are stored in a cache directory Maps which are not found will be downloadedfrom a map repository if found
Parameters
bull map_name ndash A string specifying a map to be downloaded from the Escher web server orloaded from the cache
bull map_json ndash A JSON string or a file path to a JSON file or a URL specifying a JSON fileto be downloaded
bull model ndash A Cobra model
bull model_name ndash A string specifying a model to be downloaded from the Escher web serveror loaded from the cache
bull model_json ndash A JSON string or a file path to a JSON file or a URL specifying a JSONfile to be downloaded
bull embedded_css ndash The CSS (as a string) to be embedded with the Escher SVG
bull reaction_data ndash A dictionary with keys that correspond to reaction ids and values thatwill be mapped to reaction arrows and labels
bull metabolite_data ndash A dictionary with keys that correspond to metabolite ids and valuesthat will be mapped to metabolite nodes and labels
bull gene_data ndash A dictionary with keys that correspond to gene ids and values that will bemapped to corresponding reactions
bull local_host ndash A hostname that will be used for any local files This is generally usedfor using the notebook offline and for testing in the IPython Notebook with modified Eschercode An example value for local_host is lsquohttplocalhost7778lsquo
bull id ndash Specify an id to make the javascript data definitions unique A random id is chosen bydefault
bull safe ndash If True then loading files from the filesytem is not allowed This is to ensure thesafety of using Builder within a web server
Keyword Arguments
These are defined in the Javascript API
bulluse_3d_transform
bullenable_search
bullfill_screen
bullzoom_to_element
bullfull_screen_button
44 Chapter 7 Contents
Escher Documentation Release 143
bullstarting_reaction
bullunique_map_id
bullprimary_metabolite_radius
bullsecondary_metabolite_radius
bullmarker_radius
bullgene_font_size
bullhide_secondary_metabolites
bullshow_gene_reaction_rules
bullhide_all_labels
bullreaction_styles
bullreaction_compare_style
bullreaction_scale
bullreaction_no_data_color
bullreaction_no_data_size
bulland_method_in_gene_reaction_rule
bullmetabolite_styles
bullmetabolite_compare_style
bullmetabolite_scale
bullmetabolite_no_data_color
bullmetabolite_no_data_size
bullidentifiers_on_map
bullhighlight_missing
bullallow_building_duplicate_reactions
bullcofactors
All keyword arguments can also be set on an existing Builder object using setter functions eg
my_builderset_reaction_styles(new_styles)
display_in_browser(ip=lsquo127001rsquo port=7655 n_retries=50 js_source=rsquowebrsquo menu=rsquoallrsquoscroll_behavior=rsquopanrsquo enable_editing=True enable_keys=True mini-fied_js=True never_ask_before_quit=False)
Launch a web browser to view the map
Parameters
bull ip ndash The IP address to serve the map on
bull port ndash The port to serve the map on If specified the port is occupied then a random freeport will be used
bull n_retries (int) ndash The number of times the server will try to find a port before quitting
bull js_source (string) ndash Can be one of the following
ndash web (Default) - Use JavaScript files from eschergithubio
79 Python API 45
Escher Documentation Release 143
ndash local - Use compiled JavaScript files in the local Escher installation Works offline
ndash dev - No longer necessary with source maps This now gives the same behavior aslsquolocalrsquo
bull menu (string) ndash Menu bar options include
ndash none - No menu or buttons
ndash zoom - Just zoom buttons
ndash all (Default) - Menu and button bar (requires Bootstrap)
bull scroll_behavior (string) ndash Scroll behavior options
ndash pan - Pan the map
ndash zoom - Zoom the map
ndash none (Default) - No scroll events
bull enable_editing (Boolean) ndash Enable the map editing modes
bull enable_keys (Boolean) ndash Enable keyboard shortcuts
bull minified_js (Boolean) ndash If True use the minified version of JavaScript and CSSfiles
bull never_ask_before_quit (Boolean) ndash Never display an alert asking if you wantto leave the page By default this message is displayed if enable_editing is True
display_in_notebook(js_source=rsquowebrsquo menu=rsquozoomrsquo scroll_behavior=rsquononersquo mini-fied_js=True height=500 enable_editing=False)
Embed the Map within the current IPython Notebook
Parameters
bull js_source (string) ndash Can be one of the following
ndash web (Default) - Use JavaScript files from eschergithubio
ndash local - Use compiled JavaScript files in the local Escher installation Works offline
ndash dev - No longer necessary with source maps This now gives the same behav-ior as lsquolocalrsquo
bull menu (string) ndash Menu bar options include
ndash none - No menu or buttons
ndash zoom - Just zoom buttons
ndash Note The all menu option does not work in an IPython notebook
bull scroll_behavior (string) ndash Scroll behavior options
ndash pan - Pan the map
ndash zoom - Zoom the map
ndash none - (Default) No scroll events
bull minified_js (Boolean) ndash If True use the minified version of JavaScript andCSS files
bull height ndash Height of the HTML container
bull enable_editing (Boolean) ndash Enable the map editing modes
46 Chapter 7 Contents
Escher Documentation Release 143
save_html(filepath=None overwrite=False js_source=rsquowebrsquo protocol=rsquohttpsrsquo menu=rsquoallrsquoscroll_behavior=rsquopanrsquo enable_editing=True enable_keys=True minified_js=Truenever_ask_before_quit=False static_site_index_json=None)
Save an HTML file containing the map
Parameters
bull filepath (string) ndash The HTML file will be saved to this location Whenjs_source is lsquolocalrsquo then a new directory will be created with this name
bull overwrite (Boolean) ndash Overwrite existing files
bull js_source (string) ndash Can be one of the following
ndash web (Default) - Use JavaScript files from eschergithubio
ndash local - Use compiled JavaScript files in the local Escher installation Works of-fline To make the dependencies available to the downloaded file a new directorywill be made with the name specified by filepath
ndash dev - No longer necessary with source maps This now gives the same behav-ior as lsquolocalrsquo
bull protocol (string) ndash The protocol can be lsquohttprsquo lsquohttpsrsquo or None which indicatesa lsquoprotocol relative URLrsquo as in eschergithubio Ignored if source is local
bull menu (string) ndash Menu bar options include
ndash none - No menu or buttons
ndash zoom - Just zoom buttons
ndash all (Default) - Menu and button bar (requires Bootstrap)
bull scroll_behavior (string) ndash Scroll behavior options
ndash pan - Pan the map
ndash zoom - Zoom the map
ndash none (Default) - No scroll events
bull enable_editing (Boolean) ndash Enable the map editing modes
bull enable_keys (Boolean) ndash Enable keyboard shortcuts
bull minified_js (Boolean) ndash If True use the minified version of JavaScript andCSS files
bull height (number) ndash Height of the HTML container
bull never_ask_before_quit (Boolean) ndash Never display an alert asking if youwant to leave the page By default this message is displayed if enable_editing isTrue
bull static_site_index_json (string) ndash The index as a JSON string for thestatic site Use javascript to parse the URL options Used for generating static pages(see static_sitepy)
791 Cache
escherget_cache_dir(versioned=True name=None)Get the cache dir as a string and make the directory if it does not already exist
Parameters
79 Python API 47
Escher Documentation Release 143
bull versioned (Boolean) ndash Whether to return the versioned path in the cache Eschermaps for the latest version of Escher are found in the versioned directory (versioned= True) but maps for previous versions of Escher can be found by visiting the parentdirectory (versioned = False)
bull name (string) ndash An optional subdirectory within the cache If versioned is False thenname is ignored
escherclear_cache(different_cache_dir=None ask=True)Empty the contents of the cache directory including all versions of all maps and models
Parameters
bull different_cache_dir (string) ndash (Optional) The directory of another cacheThis is mainly for testing
bull ask (Boolean) ndash Whether to ask before deleting
escherlist_cached_maps()Return a list of all cached maps
escherlist_cached_models()Return a list of all cached models
escherlist_available_maps()Return a list of all maps available on the server
escherlist_available_models()Return a list of all models available on the server
710 License
Escher and EscherConverter are distributed under the MIT license
bull genindex
48 Chapter 7 Contents
Python Module Index
eescher 44
49
Escher Documentation Release 143
50 Python Module Index
Index
Bbrush_mode() (built-in function) 43build_mode() (built-in function) 43Builder (class in escher) 44
Cclear_cache() (in module escher) 48
Ddisplay_in_browser() (escherBuilder method) 45display_in_notebook() (escherBuilder method) 46
Eescher (module) 44escherBuilder() (class) 39
Gget_cache_dir() (in module escher) 47
Llist_available_maps() (in module escher) 48list_available_models() (in module escher) 48list_cached_maps() (in module escher) 48list_cached_models() (in module escher) 48load_map() (built-in function) 42load_model() (built-in function) 43
Ooptionenable_keys (option attribute) 40optionsallow_building_duplicate_reactions (options at-
tribute) 42optionsand_method_in_gene_reaction_rule (options at-
tribute) 41optionscofactors (options attribute) 42optionsenable_editing (options attribute) 39optionsenable_search (options attribute) 40optionsfill_screen (options attribute) 40optionsfirst_load_callback (options attribute) 42optionsfull_screen_button (options attribute) 40optionsgene_data (options attribute) 41
optionsgene_font_size (options attribute) 40optionshide_all_labels (options attribute) 40optionshide_secondary_metabolites (options attribute)
40optionshighlight_missing (options attribute) 42optionsidentifiers_on_map (options attribute) 42optionsignore_bootstrap (options attribute) 40optionsmarker_radius (options attribute) 40optionsmenu (options attribute) 39optionsmetabolite_compare_style (options attribute) 42optionsmetabolite_data (options attribute) 42optionsmetabolite_no_data_color (options attribute) 42optionsmetabolite_no_data_size (options attribute) 42optionsmetabolite_scale (options attribute) 42optionsmetabolite_styles (options attribute) 42optionsnever_ask_before_quit (options attribute) 40optionsprimary_metabolite_radius (options attribute) 40optionsreaction_compare_style (options attribute) 41optionsreaction_data (options attribute) 40optionsreaction_no_data_color (options attribute) 41optionsreaction_no_data_size (options attribute) 41optionsreaction_scale (options attribute) 41optionsreaction_styles (options attribute) 41optionsscroll_behavior (options attribute) 39optionssecondary_metabolite_radius (options attribute)
40optionsshow_gene_reaction_rules (options attribute) 40optionsstarting_reaction (options attribute) 40optionsunique_map_id (options attribute) 40optionsuse_3d_transform (options attribute) 39
Rrotate_mode() (built-in function) 43
Ssave_html() (escherBuilder method) 46set_gene_data() (built-in function) 43set_metabolite_data() (built-in function) 43set_reaction_data() (built-in function) 43
51
Escher Documentation Release 143
Ttext_mode() (built-in function) 43
Vview_mode() (built-in function) 43
Zzoom_mode() (built-in function) 43
52 Index

Contents
1 Escher in 3 minutes 3
2 Help I just upgraded to v12 and my map and model caches are empty 5
3 Features 7
4 Supported browsers 9
5 Installation 11
6 Citing Escher 13
7 Contents 1571 Getting started 1572 Escher COBRA and COBRApy 2773 Run Escher locally and in IPython 2774 Validate and convert maps 2875 Building and contributing maps 2976 Developing with Escher 3177 EscherConverter 3378 JavaScript API 3979 Python API 44710 License 48
Python Module Index 49
i
ii
Escher Documentation Release 143
Escher is a web-based tool for building viewing and sharing visualizations of biological pathways These lsquopathwaymapsrsquo are a great way to contextualize biological datasets The easiest way to use Escher is to browse and build mapson the Escher website New users may be interested in the Getting started guide
Contents 1
Escher Documentation Release 143
2 Contents
CHAPTER 1
Escher in 3 minutes
3
Escher Documentation Release 143
4 Chapter 1 Escher in 3 minutes
CHAPTER 2
Help I just upgraded to v12 and my map and model caches areempty
Starting with Escher v12 the maps and models available from the Escher website are versioned Each time youupgrade Escher you will have access to the new versions of the Escher maps and models Any maps and models youwere using before are still saved in the Escher cache in case you need them For more details on finding managingand clearing the cache see the Python cache functions
Also starting with Escher v12 the maps and models in Escher are the same as those in the BiGG Database
5
Escher Documentation Release 143
6 Chapter 2 Help I just upgraded to v12 and my map and model caches are empty
CHAPTER 3
Features
1 View pathway maps in any modern web browser
2 Build maps using the content of genome-scale metabolic models
3 Visualize data on reactions genes and metabolites
4 Full text search
5 Detailed options for changing colors sizes and more all from the web browser
6 View maps inside the IPython Notebook
7 Embed maps within any website with minimal dependencies (escherjs d3js and optionally Twitter Bootstrap)
7
Escher Documentation Release 143
8 Chapter 3 Features
CHAPTER 4
Supported browsers
We recommend using Google Chrome for optimal performance but Escher will also run in the latest versions ofFirefox Internet Explorer and Safari (including mobile Safari)
9
Escher Documentation Release 143
10 Chapter 4 Supported browsers
CHAPTER 5
Installation
Escher can be used without any installation by visiting the Escher website However you can install escher if youwould like to (1) run Escher offline (2) include your own maps and models in the launch page (3) view Escher mapsin an IPython Notebook or (4) modify the source code
To install the latest stable version of Escher run
pip install escher
For more information see the documentation on Run Escher locally and in IPython and Developing with Escher
11
Escher Documentation Release 143
12 Chapter 5 Installation
CHAPTER 6
Citing Escher
You can help support Escher by citing our publication when you use Escher or EscherConverter
Zachary A King Andreas Draumlger Ali Ebrahim Nikolaus Sonnenschein Nathan E Lewis and Bernhard O Pals-son (2015) Escher A web application for building sharing and embedding data-rich visualizations of biologicalpathways PLOS Computational Biology 11(8) e1004321 doi101371journalpcbi1004321
13
Escher Documentation Release 143
14 Chapter 6 Citing Escher
CHAPTER 7
Contents
71 Getting started
711 Introduction
Escher is here to help you visualize pathway maps But if you have never heard of a pathway map you mightappreciate a quick introduction
What are pathway maps
To understand pathway maps it is useful to think about the general organization of a cell At the smallest levelmolecules in a cell are arranged in three-dimensional structures and these structures determine many of the functionsthat take place in a cell For example the 3D structure of an enzyme determines the biochemical reactions that it cancatalyze These structures can be visualized in 3D using tools like Jmol (as in this example structure)
The DNA sequence is a second fundamental level of biological organization DNA sequences are the blueprints for allthe machinery of the cell and they can be visualized as a one-dimensional series of bases (ATCG) using tools like theUCSC genome browser
To use a football analogy the 3D molecular structures are akin to the players on the field and the information in theDNA sequence is like the playbook on the sidelines But football would not be very interesting if the players nevertook to the field and executed those plays So we are missing this level of detail the execution of biological plans bythe molecular players
What we are missing is the biochemical reaction network Proteins in the cell catalyze the conversion of substratemolecules into product molecules and these reactions are responsible for generating energy constructing cellularmachinery and structures detecting molecules in the environment signaling and more Biochemical reactions canbe grouped into pathways when they work in concert to carry out a function (If a reaction is a football play thenthe pathway is a drive) And Escher can be used to visualize these reactions and pathways Together we call thesevisualizations pathway maps
Escher to the rescue
Many Escher maps represent metabolic pathways and Escher was developed at the Systems Biology Research Groupwhere we have been building genome-scale models of metabolism over the past fifteen years However Escher is notlimited to metabolism It can be used to visualize any collection of biochemical reactions
Escher includes one more killer feature The ability to visualize datasets on a pathway map Many biological discov-eries are enabled by collecting and analyzing enormous datsets and so biologists are grappling with the challenges ofbig data By visualizing data in the context of pathway maps we can quickly spot trends which would not be apparent
15
Escher Documentation Release 143
with standard statistical tools And Escher visualizations can be adapted and shared to demonstrate those biologicaldiscoveries
The rest of this guide will introduce the Escher user interface and the major features of Escher
712 The launch page
When you open the Escher website you will see a launch page that looks like this
The options on the launch page are
bull Filter by organism Choose an organism to filter the Maps and Models
bull Map Choose a pre-built map or start from scratch with an empty builder by choosing None In parenthesesnext to the map name you will see the name of the model that was used to build this map
bull Model (Optional) If you choose a COBRA model to load then you can add new reactions to the pathway mapYou can also load your own model later after you launch the tool For an explanation of maps models andCOBRA see Escher COBRA and COBRApy
bull Tool
ndash The Viewer allows you to pan and zoom the map and to visualize data for reactions genes and metabo-lites
ndash The Builder in addition to the Viewer features allows you to add reactions move and rotate existingreactions add text annotations and adjust the map canvas
bull Options
ndash Scroll to zoom (instead of scroll to pan) Determines the effect of using the mousersquos scroll wheel overthe map
ndash Never ask before reloading If this is checked then you will not be warned before leaving the page evenif you have unsaved changes
Choose Load map to open the Escher viewer or builder in a new tab and prepare to be delighted by your very ownpathway map
16 Chapter 7 Contents
Escher Documentation Release 143
713 The menu bar
Once you have loaded an Escher map you will see a menu bar along the top of the screen Click the question mark tobring up the Escher documentation
714 Loading and saving maps
Using the map menu you can load and save maps at any time
Click Save map JSON to save the Escher map as a JSON file which is the standard file representing an Escher map
NOTE The JSON file does NOT save any datasets you have loaded This may be changed in a future version ofEscher
NOTE 2 In Safari saving files from Escher works a little differently than in the other major browsers After clickingSave map JSON Safari will load a new tab with the raw content of the Escher map file To save the file chooseFilegtSave As from the Safari menu A new dialog appears in the dropdown menu near the bottom select PageSource (rather than Web Archive) give your file an appropriate name (eg mapjson for an Escher map or mapsvgfor an SVG export) and click Save
Later you can can load a JSON file to view and edit a map by clicking Load map JSON
Click Export as SVG to generate a SVG file for editing in tools like Adobe Illustrator and Inkscape This is thebest way to generate figures for presentations and publications Unlike a JSON file a SVG file maintains the datavisualizations on the Escher map However you cannot load SVG files into Escher after you generate them
Click Clear Map to empty the whole map leaving a blank canvas NOTE You cannot undo Clear Map
715 Loading models
Use the model menu to manage the COBRA model loaded in Escher
71 Getting started 17
Escher Documentation Release 143
Choose Load COBRA model JSON to open a COBRA model Read more about COBRA models in Escher COBRAand COBRApy Once you have COBRApy v030 or later installed then you can generate a JSON model by followingthis example code
Once you have loaded a COBRA model there may be inconsistencies between the content in the map and the model(eg reaction IDs descriptive names and gene reaction rules) You click Update names and gene reaction rulesusing model to find matching reactions and metabolites between the map and the model (based on their IDs) andthen apply the names and gene reaction rules from the model to the map The reactions that do not match will behighlighted in red (This can be turned off again in the settings menu by deselecting Highlight reactions not in model)More advice on building maps is available in Building and contributing maps
Click Clear Model to clear the current model
716 Loading reaction gene and metabolite data
Datasets can be loaded as CSV files or JSON files using the Data Menu
In Escher reaction and gene datasets are visualized by changing the color thickness and labels of reaction arrowsMetabolite datasets are visualized by changing the color size and labels of metabolite circles The specific visualstyles can be modified in the Settings menu When data is not present for a specific reaction gene or metabolite thenthe text label will say lsquondrsquo which means lsquono datarsquo
18 Chapter 7 Contents
Escher Documentation Release 143
The structure of a CSV file
CSV files should have 1 header row 1 ID column and either 1 or 2 columns for data values The ID column cancontain BiGG IDs or descriptive names for the reactions metabolites or genes in the dataset Here is an example witha single data value columns
IDtime 0secglc__D_c54g6p__D_c23
Which might look like this is Excel
ID time 0secglc__D_c 54g6p_c 23
If two datasets are provided then the Escher map will display the difference between the datasets In the Settings menuthe Comparison setting allows you to choose between comparison functions (Fold Change Log2(Fold Change) andDifference) With two datasets the CSV file looks like this
ID time 0sec time 5sglc__D_c 54 102g6p_c 23 81
Data can also be loaded from a JSON file This Python code snippet provides an example of generating the properformat for single reaction data values and for reaction data comparisons
import json
save a single flux vector as JSONflux_dictionary = glc__D_c 54 g6p_c 23with open(outjson w) as f
jsondump(flux_dictionary f)
save a flux comparison as JSON
71 Getting started 19
Escher Documentation Release 143
flux_comp = [glc__D_c 54 g6p_c 23 glc__D_c 102 g6p_c 81]with open(out_compjson w) as f
jsondump(flux_comp f)
Gene data and gene reaction rules
Escher uses gene reaction rules to connect gene data to the reactions on a metabolic pathway You can see these genereaction rules on the map by selecting Show gene reaction rules in the Settings menu
Gene reaction rules show the genes whose gene products are required to catalyze a reaction Gene are connected usingAND and OR rules AND rules are used when two genes are required for enzymatic activity eg they are membersof a protein complex OR rules are used when either gene can catalyze the enzymatic activity eg they are isozymes
With OR rules Escher will take the sum of the data values for each gene With AND rules Escher will either takethe mean (the default) or the minimum of the components The AND behavior (mean vs minimum) is defined in theSettings menu
717 Editing and building
The Edit menu gives you access to function for editing the map
20 Chapter 7 Contents
Escher Documentation Release 143
Escher has five major modes and you can switch between those modes using the buttons in the Edit menu or usingthe buttons in the button bar on the left of the screen
1 Pan mode Drag the canvas to pan the map You can also use the mouse scroll wheel or trackpad scroll function(drag with 2 fingers) to pan the map (or to zoom if you selected Scroll to zoom in the settings)
2 Select mode Select nodes by clicking on them Shift-click to select multiple nodes or drag across the canvasto select multiple nodes using the selection brush
3 Add reaction mode If you have loaded a Model then click on the canvas to see a list of reactions that you candraw on the map Click on a node to see reactions that connect to that node In the input box you can search byreaction ID metabolite ID or gene ID (locus tag)
4 Rotate model Before entering rotate mode be sure to select one or more nodes in select mode Then afterentering rotate mode drag anywhere on the canvas to rotate the selection You can also drag the red crosshairsto change the center of the rotation
5 Text mode Use text mode to add text annotations to the map Click on the canvas to add a new text annotationor click an existing annotation to edit it When you are finished click Enter or Escape to save the changes
71 Getting started 21
Escher Documentation Release 143
In addition to the editing modes the Edit menu gives you access to the following commands
bull Delete Delete the currently selected node(s)
bull Undo Undo the last action NOTE Certain actions such as editing the canvas cannot be undone in the currentversion of Escher
bull Redo Redo the last action that was undone
bull Toggle primarysecondary node In Escher each metabolite node is either a primary node or a secondarynode Primary nodes are larger and secondary nodes can be hidden in the Settings menu Use this command totoggle the currently selected node(s) between primary and secondary
bull Rotate reactant locations When you draw a new reaction in Escher this command will rotate the new reactantsso that a new reactant is primary and centered This command is extremely useful when you are drawing a longpathway and you want to quickly switch which metabolite to ldquofollowrdquo eg make sure you are following thecarbon-containing metabolites
If you are confused then try drawing a new pathway and hitting the ldquocrdquo key to see the reactants rotate
bull Select all Select all nodes
bull Select none Unselect all nodes
bull Invert selection Select all the nodes that are currently unselected This feature is very useful when you wantto keep just one part of the map Simply drag to select the part you want to keep call the Invert selectioncommand then call the Delete command
718 Editing the canvas
A somewhat non-obvious feature of Escher is that you can edit the canvas by dragging the canvas edges This ispossible in Pan mode and Select mode
22 Chapter 7 Contents
Escher Documentation Release 143
719 View options
bull Zoom in Zoom in to the map
bull Zoom out Zoom out of the map
bull Zoom to nodes Zoom to see all the nodes on the map
bull Zoom to canvas Zoom to see the entire canvas
bull Find Search for a reaction metabolite or gene on the map
bull Show control points Show the control points you can drag these red and blue circle to adjust the shapes ofthe reactions curves
bull Settings Open the Settings menu
7110 The button bar
The button bar give you quick access to many of the common Escher functions
71 Getting started 23
Escher Documentation Release 143
24 Chapter 7 Contents
Escher Documentation Release 143
7111 Settings
View and build options
bull Identifiers Choose whether to show BiGG IDs or descriptive names for reactions metabolites and genes
bull Hide secondary metabolites This will simplify the map by hiding all secondary metabolites and the pathsconnected to them
bull Show gene reaction rules Show the gene reaction rules below the reaction labels even gene data is not loaded
bull Hide reaction gene and metabolite labels Another option to visually simplify the map this will hide alllabels that are not text annotations
bull Allow duplicate reactions By default duplicate reactions are hidden in the add reaction dropdown menuHowever you can turn this option on to show the duplicate reactions
bull Highlight reactions not in model Highlight in red any reactions that are on the map but are not in the modelThis is useful when you are adapting a map from one model for use with another model
71 Getting started 25
Escher Documentation Release 143
Reaction data settings
When reaction or gene data is loaded this section can be used to change visual settings for reactions
The color bar has individual control points and you can drag the control points (execpt min and max) left and right tochange their values Alternatively you can use the dropdown menu (next to the word median in the figure above) toattach a control point to a statistical measure (mean median first quartile (Q1) or third quartile (Q3)) This lets youchoose a color scale that will adapt to your dataset
For each control point you can choose a color by entering a CSS-style color (eg red ff0000 rgba(20 20 255 05)and you can choose a size that will scale the thickness of reactions
There are also color and size options for reactions that do not have any data value
Finally there are a few onoff settings for the loaded reaction or gene dataset
bull Options These determine how to visualize the datasets Check Absolute value to color and size reactions bythe absolute value of each data value The Size Color and Text options can be unselected to turn off sizingcoloring and data values in reaction labels individually
bull Comparison Determines the comparison algorithm to use when two datasets are loaded
bull Method for evaluating AND Determines the method that will be used to reconcile AND statements in genereaction rules when there is gene data loaded See Gene data and gene reaction rules for more details
Metabolite data settings
The data settings for metabolite data are analagous to those for reaction data The only difference is that size nowrefers to the size of the metabolite circles
26 Chapter 7 Contents
Escher Documentation Release 143
72 Escher COBRA and COBRApy
Escher can be used as an independent application but it draws heavily on the information in COBRA models ACOBRA model is a collection of all the reactions metabolites and genes known to exist in an organism (In theliterature these are generally called genome-scale models (GEMs) but we refer to them as COBRA models here toemphasize that Escher interoperates with models that are exported from COBRApy)
By loading a COBRA model into the Escher interface you have access to every reaction and metabolite in that modelYou also have the gene reaction rules for the reactions in the network which allow you to connect gene data toreactions and metabolites
COBRApy is a software package for COBRA modeling written in Python The Escher Python package uses CO-BRApy package for reading and writing COBRA models
721 Maps and models
In Escher you will see references to maps and models
A map contains the reactions and metabolites that you see in the Escher builder including their locations text annota-tions and the canvas
A model (a COBRA model) contains reactions and metabolites that you have not drawn yet Thus you can load aCOBRA model when you want to draw new reactions on the map
722 What is JSON and why do we use it
Both Escher maps and COBRA models are stored as JSON files JSON is a useful plain-text format for storing nesteddata structures We use JSON much like the SBML community uses XML You may notice that SBML files have axml extension and Escher maps and COBRA models have a json extension
You can use Python to explore a JSON file like this
import json
with open(mapjson r) as fmap_object = jsonload(f)
print map_object[0]print map_object[1][reactions]values()[0]
723 Escher SBML and SBGN
A tool has been developed for converting Escher maps to SBML Layout and SBGN and it will be released soon
COBRA models can be converted to SBML using COBRApy
73 Run Escher locally and in IPython
To run Escher on a local computer or to use Escher in PythonIPython first install it The Python package for Eschercan be installed using pip
pip install escher
72 Escher COBRA and COBRApy 27
Escher Documentation Release 143
Depending on your installation of Python you may need sudo
sudo pip install escher
Alternatively one can download the source files and install the package directly
python setuppy install
731 Escher in the IPython Notebook
Once you have installed Escher locally you can interact with Escher maps in an IPython Notebook
Here are example notebooks to get started with
bull COBRApy and Escher
bull JavaScript development and offline maps
bull Generate JSON models in COBRApy
Dependencies
bull Jinja2
bull Tornado
bull COBRApy 030 or later
732 Running the local server
You can run your own local server if you want to use Escher offline or explore your own maps with the homepagebrowser To get started install the Python package and run from any directory by calling
python -m escherserver
This starts a server at httplocalhost7778 You can also choose another port
python -m escherserver --port=8005
74 Validate and convert maps
741 Validate an Escher map
Escher maps follow a specification using the JSON Schema format Therefore any JSON Schema validator can beused to validate an Escher map by comparing it to the latest schema file For example the current schema is locatedhere
httpsgithubcomzakandrewkingescherblobmasterescherjsonschema1-0-0
To make this easier the Escher Python package includes a validation script To validate a map first install Escher
pip install escher
Then call the validator
python -m eschervalidate my_mapjson
Any errors in the map will print to the console
28 Chapter 7 Contents
Escher Documentation Release 143
742 Convert or upgrade an Escher map
Any Escher maps built with pre-release versions of Escher will not load right away in the stable v10 release Toconvert pre-release maps to the new format follow these steps
1 Install Escher
pip install escher
2 Find a COBRA model for your maps This COBRA model will be used to update the content of the mapin order to support all the new Escher features You can use a COBRA model encoded as SBML or JSON(generated with COBRApy v030b4 or later) The COBRA models currently available on the Escher websitecan be downloaded from the BiGG Models website
httpbiggucsdedu
For a refresher on the distinction between Escher maps COBRA models and their file types (SBML JSONSBML Layout) see Escher COBRA and COBRApy
3 Run the convert_map script to convert your existing Escher map (my_old_mapjson) to the new formatusing a COBRA model (model_filejson or model_filexml in these examples)
With a JSON file modelpython -m escherconvert_map my_old_mapjson pathtomodel_filejson
With an SBML modelpython -m escherconvert_map my_old_mapjson pathtomodel_filexml
Those commands will generate a new map called my_old_map_convertedjson that will load in Escher v10and later
75 Building and contributing maps
We are excited to collect pathway maps for every organism with a well characterized metabolic network This sectiondescribes the process of building a new map either from scratch or using a COBRA model with BiGG IDs
751 Building from scratch
To build a map from scratch you will first need a COBRA model for your map See the section Escher COBRA andCOBRApy for some background information on COBRA models
If you would like to eventually contribute your map to the Escher website it is important that your COBRA modeladheres to the identifiers in the BiGG Database Escher and BiGG are being developed together and we want tomaintain consistency and interoperability between them
Once you have a COBRA model you can follow these steps
1 Load your model in the Escher Builder
2 Begin building new reactions If you are familiar with the genes in your organism then try search for newreactions by their gene IDs
3 Limit each map to ~200 reactions Maps larger than this will slow down the Escher viewer especially on oldbrowsers Rather than building one giant map Escher is designed for building many smaller subsystem maps
4 When you have built a map for your a subsystem save the map as JSON with a name that includes the modelID followed by a period followed by the name of the subsystem For example
75 Building and contributing maps 29
Escher Documentation Release 143
iMM904Amino acid biosynthesisjson
5 (Optional) Once you have a set of subsystem maps you can set up a local Escher server so that subsystem mapsappear in the ldquoquick jumprdquo menu in the bottom right corner of the screen (as seen here for iJO1366) To setthis up you will need to start a local server as describe in Running the local server Next find your local cachedirectory by running this command in a terminal
python -c import escher print(escherget_cache_dir(name=maps))
This will print the location of the local maps cache Add your new subsystem maps to cache folder Now whenyou run the server (described in Running the local server) you should see that quick jump menu appear
NOTE The cache directory is organized into folders for organisms You can use these folder for filtering byorganism on the local launch page or you can place the maps in the top directory
NOTE 2 A similar approach can be used to access your models from the local launch page Place maps in thefolder indicated by
python -c import escher print(escherget_cache_dir(name=models))
752 Building from an existing map for a similar organism
Follow the instruction above except rather than starting from scratch load an existing Escher map for a differentorganism
Once you have the new model loaded use the Update names and gene reaction rules using model button in theModel menu to convert all descriptive names and gene reaction rules in the model to those in the map Reactions thatdo not match the model will be highlighted in red (This can be turned off again in the settings menu by deselectingHighlight reactions not in model)
Now visit each highlighted reaction and see if you can replace it with an equivalent biochemical pathway from themodel If not then delete the reaction and move on
Finally when there are no highlighted reactions left you can repeat this for other subsystems
753 Submitting maps to the Escher website
If you would like to contribute maps to Escher you can make a Pull Request to the GitHub repository eschergithubioMake sure there is a folder with the name of the organism in 1-0-0maps For example a new yeast map goes inthe folder
1-0-0mapsSaccharomyces cerevisiae
Then name your map by concatenating the model ID and the map name separated by a period For example a yeastmap built with the genome-scale model iMM904 could be named
iMM904Amino acid biosynthesisjson
Then add the JSON file for the model to the Pull Request if that model is not already available As before make afolder for your organism within 1-0-0models The model filename is just the model ID
In this example a correct Pull Request would include the following files
1-0-0mapsSaccharomyces cerevisiaeiMM904Amino acid biosynthesisjson1-0-0modelsSaccharomyces cerevisiaeiMM904json
30 Chapter 7 Contents
Escher Documentation Release 143
76 Developing with Escher
761 Using the static JavaScript and CSS files
You can include the compiled Escher JavaScript and CSS files in any HTML document The only dependencies ared3js and optionally Twitter Bootstrap if you are using the option menu=rsquoallrsquo
The compiled files are available form npmcdn
httpsnpmcdncomescher-visjsdistescherjshttpsnpmcdncomescher-visjsdistescherminjshttpsnpmcdncomescher-viscssdistbuildercsshttpsnpmcdncomescher-viscssdistbuildermincss
Source maps are also hosted there
httpsnpmcdncomescher-visjsdistescherjsmaphttpsnpmcdncomescher-visjsdistescherminjsmaphttpsnpmcdncomescher-viscssdistbuildermincssmap
If you want a particular version of escher add a version tag like this
httpsnpmcdncomescher-vis140-beta3jsdistescherjs
For an example of the boilerplate code that is required to begin developing with Escher have a look at the escher-demorepository For projects built with npm use the escher-test repository as a guide
762 Building and testing Escher
First install dependencies with npm
npm install
Escher uses grunt to manage the build process To run typical build steps just run
npm run compile
To test the JavaScript files run
npm run test
For Python testing run this in the py directory
python setuppy test
Build the static website
python setuppy build_gh
Clear static website files
python setuppy clean
Build and run the docs
cd docsmake htmlcd _buildhtml
76 Developing with Escher 31
Escher Documentation Release 143
python -m SimpleHTTPServer python 2python -m httpserver python 3
763 Generating and reading Escher and COBRA files
The Escher file format
Escher layouts are defined by JSON files that follow a specific schema using json schema The latest schemafor Escher JSON files is here The Escher schemas are versioned with inspiration from SchemaVer Theeschervalidate module can be used to validate models against the schema
The Escher layout schema is designed to be as simple as possible For example the core metabolism map of Es-cherichia coli is layed out like this
[
map_name E coli coreCore metabolismmap_id 2938hoq32a1map_description E coli core metabolic networknLast Modified Fri Dec 05 2014 163944 GMT-0800 (PST)homepage httpseschergithubioschema httpseschergithubioescherjsonschema1-0-0
reactions nodes text_label canvas
x 7857062530517567y 31436893920898433width 5894515691375733height 4860457037353515
]
The map_name includes the model that was used to build this layout followed by a period and then a readable namefor the map The map_id is a unique identifier for this map The map_description describes the map and thelast time it was modified Both the homepage and the schema entries must have exactly these values for the Eschermap to be valid
In the next section the reactions nodes labels and canvas are all defined For reactions nodes and text labels eachelement has a key that is an arbitrary integer As long as there are no repeated IDs (eg no 2 segments with the ID517) then everything should work fine
Read through the schema (here) for more detail on the format
The COBRA file format
COBRA models are also saved as JSON files This format has not been documented with a schema but you canbrowse through the core metabolism model as a guide to generating valid COBRA models
I still need help
If you are interested in developing with Escher and you need more information than what is provided in the documen-tation please contact Zachary King (zaking-AT-ucsd-DOT-edu)
32 Chapter 7 Contents
Escher Documentation Release 143
77 EscherConverter
EscherConverter is a standalone program that reads files created with the graphical network editor Escher and convertsthem to files in community standard formats
Download EscherConverter 05 (137 MB)
771 Using EscherConverter
Escher uses a JSON file format to represent its networks This format has been developed because of its very small filesize and its compatibility to online programs that are written in JavaScript In particular JSON is a JavaScript ObjectNotation or in other words a JSON file directly represents components of JavaScript programs This makes parsingvery simple and allows direct use of those files in web-based programs
However in systems biology specific file formats have been developed with the aim to be easily exchangeable betweensoftware implemented in diverse programming languages
To this end these formats support semantically clear annotations and are maintained by a large community of scientistsEscherConverter supports export to two particularly important XML-based community file formats SBML with layoutextension and SBGN-ML
While SBML has been mainly developed for dynamic simulation of biological networks it is nowadays also usablefor diverse other purposes Its layout extension facilitates the encoding the display of biological networks
SBGN-ML has been directly developed as a language for the display of biological pathway maps of diverse kinds Itstores the position and connection of entities similar to what is shown in Escher networks
EscherConverter takes Escherrsquos JSON files as input and generates equivalent SBML Level 3 Version 1 files with layoutextension or SBGN-ML files
In order to ensure that the conversion is correct EscherConverter provides its own display that gives users a previewof how the export data format will be rendered by other tools In this preview display you can zoom in and out movearcs and node positions However it is important to know that none of the changes made in this preview are stored inthe export file
Download and Installation
You can obtain local copy of EscherConverter by clicking here
As a Javatrade application no specific installation is required for EscherConverter
However make sure you have a recent Javatrade Runtime Environment (JRE) installed on your computer (at least JRE8) You can obtain Javatrade from the Oracle website There you can also find installation instructions for your respectiveoperating system
Once Javatrade has been installed you can simply place the EscherConverter JAR file somewhere on your local computerfor instance in the folder
bull Applications if you are working under Mac OS
77 EscherConverter 33
Escher Documentation Release 143
bull opt for Linux computers
bull CProgram Files if you are using Windows
Launching the program
You can launch EscherConverter simply by double-clicking on the application JAR file This will open a followinggraphical user interface as described in the following figures
Figure 1 | The graphical user interface of EscherConverter
bull Preferences opens a settings dialog (see next screenshot)
bull Open displays a file chooser to select an input file in JSON format
bull Save export the map that is displayed in the current tab to SBML or SBGN-ML
bull Discard closes the current tab without saving
bull Help opens the online help that displays all command-line options
bull License displays the license under which this software is distributed
bull About shows information about the authors of this software
bull Main the main panel of the software in which converted Escher maps will be displayed organized in tabs
bull Status the status bar shows information and logging messages during the conversion
34 Chapter 7 Contents
Escher Documentation Release 143
Figure 2 | The preferences dialog All settings in this dialog are also available through EscherConverterrsquos command-line interface
Layout section several properties that are required in SBML and SBGN-ML are not explicitly specified in EscherrsquosJSON format and therefore need to be adjusted by the user These are the size of the drawing canvas the default boxsize for text labels the size of primary and secondary nodes In contrast to SBGN-ML and Escherrsquos JSON formatthe SBML layout extension supports three-dimensional displays When selecting this export file format it is thereforenecessary to also define the z-coordinate and the depth of all objects
Components and naming section Most settings in this section are specific for the SBML layout extension and areonly active if this output format is selected These are names and identifiers of the layout component and the in caseof SBML mandatory default compartment (a compartment without physical meaning a reaction space in which allmetabolites are located) EscherConverter can infer compartment bounds from metabolites but this is an experimentalfeature Just try it and see how the preview changes
77 EscherConverter 35
Escher Documentation Release 143
Figure 3 | A layout preview
The birds-eye view and the navigation component on the left help you navigate through the network display Thisgraph shows you how the converted pathway map will be rendered by software that supports SBGN-ML or the SBMLlayout extension This preview can be modified by moving arcs or nodes however none of those changes are storedwhen exporting the file In this current version EscherConver only exports layouts as given in the original JSON file
Included third-party software
EscherConverter includes several third-party libraries which we here list and acknowledge
bull ArgParser
bull JSBML
bull libSBGN
bull Pixel-Mixer icons
bull yFiles
772 Command-line interface API
You can launch EscherConverter from the command-line On a Unix system (such as Linux MacOS or Solaris etc)use a command like
bash$ java -jar -Xms8G -Xmx8G -Duserlanguage=en EscherConverter-05jar [options]
Under Window use a command like
Cgt javaw -jar -Xms8G -Xmx8G -Duserlanguage=en EscherConverter-05jar [options]
Escher has a large collection of command-line options (see below) which can be useful if you want to launch theprogram with specific settings or if multiple files are to be converted in a batch mode It is even possible to completelydisable the graphical user interface
36 Chapter 7 Contents
Escher Documentation Release 143
Input and output files
Definition of input and output data files as well as the format for the output
--input=ltFilegt
Specifies the JSON input file If a directory is given the conversion will be recursively performed Accepts JSON
--output=ltFilegt
The path to the file into which the output should be written If the input is a directory this must also be a directory inorder to perform a recursive conversion Accepts SBML SBGN
Escher layout
The options in this group allow you to influence how large certain elements should be displayed
--canvas-default-height=ltDoublegt
Just as in the case of the width of the canvas this value needs to be specified for cases where the JSON input file lacksan explicit specification of the canvas height Arguments must fit into the range [11E9] (Default value 2500)
--canvas-default-width=ltDoublegt
This value is used when no width has been defined for the canvas Since the width attribute is mandatory for the layouta default value must be provided in these cases Arguments must fit into the range [11E9] (Default value 2500)
--label-height=ltDoublegt
With this option you can specify the height of the bounding box of text labels Arguments must fit into the range[11E9] (Default value 500)
--label-width=ltDoublegt
This option defines the width of bounding boxes for text labels Arguments must fit into the range [11E9] (Defaultvalue 1600)
--node-depth=ltDoublegt
The length of nodes along z-coordinate Escher maps are actually two-dimensional but in general a layout can bethree-dimensional This value should be an arbitrary value greater than zero because some rendering engines mightnot display the node if its depth is zero Arguments must fit into the range [11E9] (Default value 10)
--node-label-height=ltDoublegt
Node labels can have a size different from general labels in the graph Here you can specify how height the boundingbox of the labels for nodes should be Arguments must fit into the range [11E9] (Default value 200)
--primary-node-height=ltDoublegt
The primary node should be bigger than the secondary node With this option you can specify the height of this typeof nodes Arguments must fit into the range [11E9] (Default value 300)
--primary-node-width=ltDoublegt
Escher maps distinguish between primary and secondary nodes Primary nodes should be larger than secondary nodesand display the main flow of matter through the network This option allows you to specify the width of primarynodes Arguments must fit into the range [11E9] (Default value 300)
77 EscherConverter 37
Escher Documentation Release 143
--reaction-label-height=ltDoublegt
Reaction label heightArguments must fit into the range [11E9] (Default value 300)
--reaction-node-ratio=ltDoublegt
This value is used as a conversion factor to determine the size of the reaction display box depending on the size ofprimary nodes Height and width of reaction nodes are determined by dividing the corresponding values from theprimary node size by this factor Arguments must fit into the range [01] (Default value 05)
--secondary-node-ratio=ltDoublegt
Similar to the reaction node ratio the size of secondary nodes (width and height) is determined by dividing thecorresponding values from the primary nodes by this value Arguments must fit into the range [01] (Default value06666666666666666)
--z=ltDoublegt
The position on the z-axis where the entire two-dimensional graph should be drawn Arguments must fit into the range[-1E91E9] (Default value 00)
Escher Components and their naming
Here you can influence which elements are to be included in the layout and how elements in the layout are to be calledor identified
--format=ltOutputFormatgt
The desired format for the conversion eg SBML All possible values for type ltOutputFormatgt are SBGN andSBML (Default value SBML)
--layout-id=ltStringgt
In contrast to the name this identifier does not have to be human-readable This is a machine identifier which muststart with a letter or underscore and can only contain ASCII characters (Default value Escher_Layout)
--layout-name=ltStringgt
This should be a human-readable name for the layout that is to be created This name might be displayed to describethe figure and should therefore be explanatory (Default value Escher Layout)
--compartment-id=ltStringgt
A compartment needs to have a unique identifier which needs to be a machine-readable Sting that must start with aletter or underscore and can only contain ASCII characters Since the JSON file does not provide this information thisoption allows you to specify the required identifier (Default value default)
--compartment-name=ltStringgt
With this option it is possible to define a name for the default compartment can be that needs to be generated for theconversion to SBML The name does not have any restrictions ie any UTF-8 character can be used (Default valueDefault compartment)
--infer-compartment-bounds
This converter can infer where the boundaries of compartments could be drawn To this end it uses each nodersquos BiGGids to identify the compartment of all metabolites Assuming that compartments have rectangular shapes the algorithmcan find the outermost node on each side of the box and hence obtain the boundaries of the compartment However
38 Chapter 7 Contents
Escher Documentation Release 143
this methods will fail when metabolites are drawn inside of such a box that belong to a different compartment that isactually further outside For this reason this option is deactivated by default (Default value false)
Options for the graphical user interface
--gui
If this option is given the program will display its graphical user interface (Default value false)
--log-level=ltStringgt
Change the log-level of this application This option will influence how fine-grained error and other log messages willbe that you receive while executing this program All possible values for type ltStringgt are ALL CONFIG FINEFINER FINEST INFO OFF SEVERE and WARNING (Default value INFO)
--log-file=ltFilegt
This option allows you to specify a log file to which all information of the program will be written Accepts (bp2bp3 log owl xml)
78 JavaScript API
class escherBuilder(map_data model_data embedded_css selection options)A Builder object contains all the UI and logic to generate a map builder or viewer
Arguments
bull map_data (object) ndash The data for a map to be passed to escherMapfrom_data() Ifnull then an empty Builder is initialized
bull model_data (object) ndash The data for a cobra model to be passed to es-cherCobraModel() Can be null
bull embedded_css (string) ndash The stylesheet for the SVG elements in the Escher map
bull selection (object) ndash (Optional Default In the body element) The d3 selection of anelement to place the Builder into The selection cannot be inside an SVG element
bull options (object) ndash (Optional) An object defining any of the following options
optionsmenu(Default rsquoallrsquo) The type of menu that will be displayed Can be lsquoallrsquo for the fullmenu or lsquozoomrsquo for just zoom buttons The lsquoallrsquo option requires the full set of Escherdependencies (D3js JQuery and Bootstrap) while the lsquozoomrsquo option requires only D3jsFor more details see Developing with Escher
optionsscroll_behavior(Default rsquopanrsquo) This option determines the effect that the scroll wheel will have onan Escher map Can be lsquopanrsquo to pan the map or lsquozoomrsquo to zoom the map when the usermoves the scroll wheel
optionsuse_3d_transform(Default Chooses a good option by testing the browser) If true then use CSS3 3D trans-forms to speed up panning and zooming This feature will only work on browsers thatsupport the 3D transforms It works best in the latest versions of Chrome Firefox andInternet Explorer Safari works better with this turned off
78 JavaScript API 39
Escher Documentation Release 143
optionsenable_editing(Default true) If true then display the map editing functions If false then hide themand only allow the user to view the map
optionenable_keys(Default true) If true then enable keyboard shortcuts
optionsenable_search(Default true) If true then enable indexing of the map for search Use false to disablesearching and potentially improve the map performance
optionsfill_screen(Default false) Use true to fill the screen when an Escher Builder is placed in a top-level container (eg a div in the body element)
optionsfull_screen_button(Default false) Include a button in the user interface for entering full screen mode
optionsignore_bootstrap(Default false) Do not use Bootstrap for buttons even if it available This is used toembed Escher in a Jupyter notebook where it conflicts with the Jupyter Boostrap installa-tion
Map model and styles
optionsstarting_reaction(Default null) The ID (as a string) of a reaction to draw when the Builder loads
optionsnever_ask_before_quit(Default false) If false then display a warning before the user closes an Eschermap If true then never display the warning This options is only respected if op-tionsenable_editing == true If enable_editing is false then the warnings are not dis-played
optionsunique_map_id(Default null) A unique ID that will be used to UI elements donrsquot interfere whenmultiple maps are in the same HTML document
optionsprimary_metabolite_radius(Default 15) The radius of primary metabolites in px
optionssecondary_metabolite_radius(Default 10) The radius of secondary metabolites in px
optionsmarker_radius(Default 5) The radius of marker nodes in px
optionsgene_font_size(Default 18) The font size of the gene reaction rules in px
optionshide_secondary_metabolites(Default false) If true then secondary nodes and segments are hidden This is conve-nient for generating simplified map figures
optionsshow_gene_reaction_rules(Default false) If true then show the gene reaction rules even without gene data
optionshide_all_labels(Default false) If checked hide all reaction gene and metabolite labels
Applied data
40 Chapter 7 Contents
Escher Documentation Release 143
optionsreaction_data(Default null) An object with reaction ids for keys and reaction data points for values
optionsreaction_stylesDefault [rsquocolorrsquo rsquosizersquo rsquotextrsquo]
An array of style types The array can contain any of the following lsquocolorrsquo lsquosizersquo lsquotextrsquolsquoabsrsquo The lsquocolorrsquo style means that the reactions will be colored according to the loadeddataset The lsquosizersquo style means that the reactions will be sized according to the loadeddataset The lsquotextrsquo style means that the data values will be displayed in the reactionlabels The lsquoabsrsquo style means the the absolute values of reaction values will be used fordata visualization
optionsreaction_compare_style(Default rsquodiffrsquo) How to compare to datasets Can be either lsquofold lsquolog2_foldrsquo orlsquodiffrsquo
optionsreaction_scaleDefault
[ type min color c8c8c8 size 12 type median color 9696ff size 20 type max color ff0000 size 25 ]
An array of objects that define points on the data scale
Each point is an object with a type attribute Types can be lsquominrsquo lsquomaxrsquo lsquomeanrsquo lsquoQ1rsquo (firstquartile) lsquomedianrsquo lsquoQ3rsquo (third quartile) or lsquovaluersquo Each point can have a color attributethat specifies a color with a string (any CSS color specification is allowed including hexrgb and rgba) Each point can have a size attirbute that specifies a reaction thickness as anumber Finally points with type lsquovaluersquo can have a value attribute that specifies an exactnumber for pont in the scale
NOTE If lsquominrsquo or lsquomaxrsquo is not provided Escher automatically adds them To be com-pletely clear about what you expect to see on the map it is best to provide lsquominrsquo andlsquomaxrsquo in addition to other scale points
Here are examples of each type
type rsquominrsquo color rsquoredrsquo size 12 Specifies that reactionsnear the minimum value are red and have thickness 12
type rsquoQ1rsquo color rsquorgba(100 100 50 05)rsquo size 12 Specifies that reactions near the first quartile have the given color opacity andthickness
type rsquomeanrsquo color rsquorgb(100 100 50)rsquo size 50 Specifies that reactions near the mean value have the given color and thickness
type rsquovaluersquo value 85 color rsquo333rsquo size 50 Specifies that reactions near 85 value have the given color and size
optionsreaction_no_data_color(Default rsquodcdcdcrsquo) The color of reactions with no data value
optionsreaction_no_data_size(Default 8) The size of reactions with no data value
optionsgene_data(Default null) An object with Gene ids for keys and gene data points for values
78 JavaScript API 41
Escher Documentation Release 143
optionsand_method_in_gene_reaction_rule(Default mean) When evaluating a gene reaction rule use this function to evaluate ANDrules Can be lsquomeanrsquo or lsquominrsquo
optionsmetabolite_data(Default null) An object with metabolite ids for keys and metabolite data points forvalues
optionsmetabolite_stylesDefault [rsquocolorrsquo rsquosizersquo rsquotextrsquo]
An array of style types The array can contain any of the following lsquocolorrsquo lsquosizersquo lsquotextrsquolsquoabsrsquo The lsquocolorrsquo style means that the metabolites will be colored according to the loadeddataset The lsquosizersquo style means that the metabolites will be sized according to the loadeddataset The lsquotextrsquo style means that the data values will be displayed in the metabolitelabels The lsquoabsrsquo style means the the absolute values of metabolite values will be used fordata visualization
optionsmetabolite_compare_style(Default rsquodiffrsquo) How to compare to datasets Can be either lsquofoldrsquo lsquolog2_foldrsquo orlsquodiffrsquo
optionsmetabolite_scaleDefault
[ type min color fffaf0 size 20 type median color f1c470 size 30 type max color 800000 size 40 ]
An array of objects that define points on the data scale See the description of op-tionsreaction_scale for an explanation of the format
optionsmetabolite_no_data_color(Default rsquoffffffrsquo) The color of metabolites with no data value
optionsmetabolite_no_data_size(Default 10) The size of metabolites with no data value
View and build options
optionsidentifiers_on_map(Default rsquobigg_idrsquo) The identifiers that will be displayed in reaction metabolite andgene labels Can be lsquobigg_idrsquo or lsquonamersquo
optionshighlight_missing(Default false) If true then highlight in red reactions that are not in the loaded COBRAmodel
optionsallow_building_duplicate_reactions(Default true) If true then building duplicate reactions is allowed If false then dupli-cate reactions are hidden in Add reaction mode
optionscofactors(Default [rsquoatprsquo rsquoadprsquo rsquonadrsquo rsquonadhrsquo rsquonadprsquo rsquonadphrsquorsquogtprsquo rsquogdprsquo rsquohrsquo rsquocoarsquo rsquoumprsquo rsquoh20rsquo rsquoppirsquo]) A list of metabo-lite IDs to treat as cofactors These will be secondary metabolites in new reactions
Callbacks
optionsfirst_load_callbackA function to run after loading the Builder
42 Chapter 7 Contents
Escher Documentation Release 143
load_map(map_data[ should_update_data])Load a map for the loaded data Also reloads most of the Builder content
Arguments
bull map_data ndash The data for a map
bull should_update_data (Boolean) ndash (Default true) Whether data should be ap-plied to the map
load_model(model_data[ should_update_data])Load the cobra model from model data
Arguments
bull model_data ndash The data for a Cobra model (Parsing in done by escherCobraModel)
bull should_update_data (Boolean) ndash (Default true) Whether data should be ap-plied to the model
view_mode()Enter view mode
build_mode()Enter build mode
brush_mode()Enter brush mode
zoom_mode()Enter zoom mode
rotate_mode()Enter rotate mode
text_mode()Enter text mode
set_reaction_data(data)
Arguments
bull data (array) ndash An array of 1 or 2 objects where each object has keys that are reactionIDrsquos and values that are data points (numbers)
set_metabolite_data(data)
Arguments
bull data (array) ndash An array of 1 or 2 objects where each object has keys that are metaboliteIDrsquos and values that are data points (numbers)
set_gene_data(data clear_gene_reaction_rules)
Arguments
bull data (array) ndash An array of 1 or 2 objects where each object has keys that are gene IDrsquosand values that are data points (numbers)
Arguments
bull clear_gene_reaction_rules (Boolean) ndash (Optional Default false) In addi-tion to setting the data also turn of the gene_reaction_rules
78 JavaScript API 43
Escher Documentation Release 143
79 Python API
class escherBuilder(map_name=None map_json=None model=None model_name=Nonemodel_json=None embedded_css=None reaction_data=None metabo-lite_data=None gene_data=None local_host=None id=None safe=Falsekwargs)
A metabolic map that can be viewed edited and used to visualize data
This map will also show metabolic fluxes passed in during consruction It can be viewed as a standalone htmlinside a browswer Alternately the respresentation inside an IPython notebook will also display the map
Maps are stored in json files and are stored in a cache directory Maps which are not found will be downloadedfrom a map repository if found
Parameters
bull map_name ndash A string specifying a map to be downloaded from the Escher web server orloaded from the cache
bull map_json ndash A JSON string or a file path to a JSON file or a URL specifying a JSON fileto be downloaded
bull model ndash A Cobra model
bull model_name ndash A string specifying a model to be downloaded from the Escher web serveror loaded from the cache
bull model_json ndash A JSON string or a file path to a JSON file or a URL specifying a JSONfile to be downloaded
bull embedded_css ndash The CSS (as a string) to be embedded with the Escher SVG
bull reaction_data ndash A dictionary with keys that correspond to reaction ids and values thatwill be mapped to reaction arrows and labels
bull metabolite_data ndash A dictionary with keys that correspond to metabolite ids and valuesthat will be mapped to metabolite nodes and labels
bull gene_data ndash A dictionary with keys that correspond to gene ids and values that will bemapped to corresponding reactions
bull local_host ndash A hostname that will be used for any local files This is generally usedfor using the notebook offline and for testing in the IPython Notebook with modified Eschercode An example value for local_host is lsquohttplocalhost7778lsquo
bull id ndash Specify an id to make the javascript data definitions unique A random id is chosen bydefault
bull safe ndash If True then loading files from the filesytem is not allowed This is to ensure thesafety of using Builder within a web server
Keyword Arguments
These are defined in the Javascript API
bulluse_3d_transform
bullenable_search
bullfill_screen
bullzoom_to_element
bullfull_screen_button
44 Chapter 7 Contents
Escher Documentation Release 143
bullstarting_reaction
bullunique_map_id
bullprimary_metabolite_radius
bullsecondary_metabolite_radius
bullmarker_radius
bullgene_font_size
bullhide_secondary_metabolites
bullshow_gene_reaction_rules
bullhide_all_labels
bullreaction_styles
bullreaction_compare_style
bullreaction_scale
bullreaction_no_data_color
bullreaction_no_data_size
bulland_method_in_gene_reaction_rule
bullmetabolite_styles
bullmetabolite_compare_style
bullmetabolite_scale
bullmetabolite_no_data_color
bullmetabolite_no_data_size
bullidentifiers_on_map
bullhighlight_missing
bullallow_building_duplicate_reactions
bullcofactors
All keyword arguments can also be set on an existing Builder object using setter functions eg
my_builderset_reaction_styles(new_styles)
display_in_browser(ip=lsquo127001rsquo port=7655 n_retries=50 js_source=rsquowebrsquo menu=rsquoallrsquoscroll_behavior=rsquopanrsquo enable_editing=True enable_keys=True mini-fied_js=True never_ask_before_quit=False)
Launch a web browser to view the map
Parameters
bull ip ndash The IP address to serve the map on
bull port ndash The port to serve the map on If specified the port is occupied then a random freeport will be used
bull n_retries (int) ndash The number of times the server will try to find a port before quitting
bull js_source (string) ndash Can be one of the following
ndash web (Default) - Use JavaScript files from eschergithubio
79 Python API 45
Escher Documentation Release 143
ndash local - Use compiled JavaScript files in the local Escher installation Works offline
ndash dev - No longer necessary with source maps This now gives the same behavior aslsquolocalrsquo
bull menu (string) ndash Menu bar options include
ndash none - No menu or buttons
ndash zoom - Just zoom buttons
ndash all (Default) - Menu and button bar (requires Bootstrap)
bull scroll_behavior (string) ndash Scroll behavior options
ndash pan - Pan the map
ndash zoom - Zoom the map
ndash none (Default) - No scroll events
bull enable_editing (Boolean) ndash Enable the map editing modes
bull enable_keys (Boolean) ndash Enable keyboard shortcuts
bull minified_js (Boolean) ndash If True use the minified version of JavaScript and CSSfiles
bull never_ask_before_quit (Boolean) ndash Never display an alert asking if you wantto leave the page By default this message is displayed if enable_editing is True
display_in_notebook(js_source=rsquowebrsquo menu=rsquozoomrsquo scroll_behavior=rsquononersquo mini-fied_js=True height=500 enable_editing=False)
Embed the Map within the current IPython Notebook
Parameters
bull js_source (string) ndash Can be one of the following
ndash web (Default) - Use JavaScript files from eschergithubio
ndash local - Use compiled JavaScript files in the local Escher installation Works offline
ndash dev - No longer necessary with source maps This now gives the same behav-ior as lsquolocalrsquo
bull menu (string) ndash Menu bar options include
ndash none - No menu or buttons
ndash zoom - Just zoom buttons
ndash Note The all menu option does not work in an IPython notebook
bull scroll_behavior (string) ndash Scroll behavior options
ndash pan - Pan the map
ndash zoom - Zoom the map
ndash none - (Default) No scroll events
bull minified_js (Boolean) ndash If True use the minified version of JavaScript andCSS files
bull height ndash Height of the HTML container
bull enable_editing (Boolean) ndash Enable the map editing modes
46 Chapter 7 Contents
Escher Documentation Release 143
save_html(filepath=None overwrite=False js_source=rsquowebrsquo protocol=rsquohttpsrsquo menu=rsquoallrsquoscroll_behavior=rsquopanrsquo enable_editing=True enable_keys=True minified_js=Truenever_ask_before_quit=False static_site_index_json=None)
Save an HTML file containing the map
Parameters
bull filepath (string) ndash The HTML file will be saved to this location Whenjs_source is lsquolocalrsquo then a new directory will be created with this name
bull overwrite (Boolean) ndash Overwrite existing files
bull js_source (string) ndash Can be one of the following
ndash web (Default) - Use JavaScript files from eschergithubio
ndash local - Use compiled JavaScript files in the local Escher installation Works of-fline To make the dependencies available to the downloaded file a new directorywill be made with the name specified by filepath
ndash dev - No longer necessary with source maps This now gives the same behav-ior as lsquolocalrsquo
bull protocol (string) ndash The protocol can be lsquohttprsquo lsquohttpsrsquo or None which indicatesa lsquoprotocol relative URLrsquo as in eschergithubio Ignored if source is local
bull menu (string) ndash Menu bar options include
ndash none - No menu or buttons
ndash zoom - Just zoom buttons
ndash all (Default) - Menu and button bar (requires Bootstrap)
bull scroll_behavior (string) ndash Scroll behavior options
ndash pan - Pan the map
ndash zoom - Zoom the map
ndash none (Default) - No scroll events
bull enable_editing (Boolean) ndash Enable the map editing modes
bull enable_keys (Boolean) ndash Enable keyboard shortcuts
bull minified_js (Boolean) ndash If True use the minified version of JavaScript andCSS files
bull height (number) ndash Height of the HTML container
bull never_ask_before_quit (Boolean) ndash Never display an alert asking if youwant to leave the page By default this message is displayed if enable_editing isTrue
bull static_site_index_json (string) ndash The index as a JSON string for thestatic site Use javascript to parse the URL options Used for generating static pages(see static_sitepy)
791 Cache
escherget_cache_dir(versioned=True name=None)Get the cache dir as a string and make the directory if it does not already exist
Parameters
79 Python API 47
Escher Documentation Release 143
bull versioned (Boolean) ndash Whether to return the versioned path in the cache Eschermaps for the latest version of Escher are found in the versioned directory (versioned= True) but maps for previous versions of Escher can be found by visiting the parentdirectory (versioned = False)
bull name (string) ndash An optional subdirectory within the cache If versioned is False thenname is ignored
escherclear_cache(different_cache_dir=None ask=True)Empty the contents of the cache directory including all versions of all maps and models
Parameters
bull different_cache_dir (string) ndash (Optional) The directory of another cacheThis is mainly for testing
bull ask (Boolean) ndash Whether to ask before deleting
escherlist_cached_maps()Return a list of all cached maps
escherlist_cached_models()Return a list of all cached models
escherlist_available_maps()Return a list of all maps available on the server
escherlist_available_models()Return a list of all models available on the server
710 License
Escher and EscherConverter are distributed under the MIT license
bull genindex
48 Chapter 7 Contents
Python Module Index
eescher 44
49
Escher Documentation Release 143
50 Python Module Index
Index
Bbrush_mode() (built-in function) 43build_mode() (built-in function) 43Builder (class in escher) 44
Cclear_cache() (in module escher) 48
Ddisplay_in_browser() (escherBuilder method) 45display_in_notebook() (escherBuilder method) 46
Eescher (module) 44escherBuilder() (class) 39
Gget_cache_dir() (in module escher) 47
Llist_available_maps() (in module escher) 48list_available_models() (in module escher) 48list_cached_maps() (in module escher) 48list_cached_models() (in module escher) 48load_map() (built-in function) 42load_model() (built-in function) 43
Ooptionenable_keys (option attribute) 40optionsallow_building_duplicate_reactions (options at-
tribute) 42optionsand_method_in_gene_reaction_rule (options at-
tribute) 41optionscofactors (options attribute) 42optionsenable_editing (options attribute) 39optionsenable_search (options attribute) 40optionsfill_screen (options attribute) 40optionsfirst_load_callback (options attribute) 42optionsfull_screen_button (options attribute) 40optionsgene_data (options attribute) 41
optionsgene_font_size (options attribute) 40optionshide_all_labels (options attribute) 40optionshide_secondary_metabolites (options attribute)
40optionshighlight_missing (options attribute) 42optionsidentifiers_on_map (options attribute) 42optionsignore_bootstrap (options attribute) 40optionsmarker_radius (options attribute) 40optionsmenu (options attribute) 39optionsmetabolite_compare_style (options attribute) 42optionsmetabolite_data (options attribute) 42optionsmetabolite_no_data_color (options attribute) 42optionsmetabolite_no_data_size (options attribute) 42optionsmetabolite_scale (options attribute) 42optionsmetabolite_styles (options attribute) 42optionsnever_ask_before_quit (options attribute) 40optionsprimary_metabolite_radius (options attribute) 40optionsreaction_compare_style (options attribute) 41optionsreaction_data (options attribute) 40optionsreaction_no_data_color (options attribute) 41optionsreaction_no_data_size (options attribute) 41optionsreaction_scale (options attribute) 41optionsreaction_styles (options attribute) 41optionsscroll_behavior (options attribute) 39optionssecondary_metabolite_radius (options attribute)
40optionsshow_gene_reaction_rules (options attribute) 40optionsstarting_reaction (options attribute) 40optionsunique_map_id (options attribute) 40optionsuse_3d_transform (options attribute) 39
Rrotate_mode() (built-in function) 43
Ssave_html() (escherBuilder method) 46set_gene_data() (built-in function) 43set_metabolite_data() (built-in function) 43set_reaction_data() (built-in function) 43
51
Escher Documentation Release 143
Ttext_mode() (built-in function) 43
Vview_mode() (built-in function) 43
Zzoom_mode() (built-in function) 43
52 Index

Escher Documentation Release 143
2 Contents
CHAPTER 1
Escher in 3 minutes
3
Escher Documentation Release 143
4 Chapter 1 Escher in 3 minutes
CHAPTER 2
Help I just upgraded to v12 and my map and model caches areempty
Starting with Escher v12 the maps and models available from the Escher website are versioned Each time youupgrade Escher you will have access to the new versions of the Escher maps and models Any maps and models youwere using before are still saved in the Escher cache in case you need them For more details on finding managingand clearing the cache see the Python cache functions
Also starting with Escher v12 the maps and models in Escher are the same as those in the BiGG Database
5
Escher Documentation Release 143
6 Chapter 2 Help I just upgraded to v12 and my map and model caches are empty
CHAPTER 3
Features
1 View pathway maps in any modern web browser
2 Build maps using the content of genome-scale metabolic models
3 Visualize data on reactions genes and metabolites
4 Full text search
5 Detailed options for changing colors sizes and more all from the web browser
6 View maps inside the IPython Notebook
7 Embed maps within any website with minimal dependencies (escherjs d3js and optionally Twitter Bootstrap)
7
Escher Documentation Release 143
8 Chapter 3 Features
CHAPTER 4
Supported browsers
We recommend using Google Chrome for optimal performance but Escher will also run in the latest versions ofFirefox Internet Explorer and Safari (including mobile Safari)
9
Escher Documentation Release 143
10 Chapter 4 Supported browsers
CHAPTER 5
Installation
Escher can be used without any installation by visiting the Escher website However you can install escher if youwould like to (1) run Escher offline (2) include your own maps and models in the launch page (3) view Escher mapsin an IPython Notebook or (4) modify the source code
To install the latest stable version of Escher run
pip install escher
For more information see the documentation on Run Escher locally and in IPython and Developing with Escher
11
Escher Documentation Release 143
12 Chapter 5 Installation
CHAPTER 6
Citing Escher
You can help support Escher by citing our publication when you use Escher or EscherConverter
Zachary A King Andreas Draumlger Ali Ebrahim Nikolaus Sonnenschein Nathan E Lewis and Bernhard O Pals-son (2015) Escher A web application for building sharing and embedding data-rich visualizations of biologicalpathways PLOS Computational Biology 11(8) e1004321 doi101371journalpcbi1004321
13
Escher Documentation Release 143
14 Chapter 6 Citing Escher
CHAPTER 7
Contents
71 Getting started
711 Introduction
Escher is here to help you visualize pathway maps But if you have never heard of a pathway map you mightappreciate a quick introduction
What are pathway maps
To understand pathway maps it is useful to think about the general organization of a cell At the smallest levelmolecules in a cell are arranged in three-dimensional structures and these structures determine many of the functionsthat take place in a cell For example the 3D structure of an enzyme determines the biochemical reactions that it cancatalyze These structures can be visualized in 3D using tools like Jmol (as in this example structure)
The DNA sequence is a second fundamental level of biological organization DNA sequences are the blueprints for allthe machinery of the cell and they can be visualized as a one-dimensional series of bases (ATCG) using tools like theUCSC genome browser
To use a football analogy the 3D molecular structures are akin to the players on the field and the information in theDNA sequence is like the playbook on the sidelines But football would not be very interesting if the players nevertook to the field and executed those plays So we are missing this level of detail the execution of biological plans bythe molecular players
What we are missing is the biochemical reaction network Proteins in the cell catalyze the conversion of substratemolecules into product molecules and these reactions are responsible for generating energy constructing cellularmachinery and structures detecting molecules in the environment signaling and more Biochemical reactions canbe grouped into pathways when they work in concert to carry out a function (If a reaction is a football play thenthe pathway is a drive) And Escher can be used to visualize these reactions and pathways Together we call thesevisualizations pathway maps
Escher to the rescue
Many Escher maps represent metabolic pathways and Escher was developed at the Systems Biology Research Groupwhere we have been building genome-scale models of metabolism over the past fifteen years However Escher is notlimited to metabolism It can be used to visualize any collection of biochemical reactions
Escher includes one more killer feature The ability to visualize datasets on a pathway map Many biological discov-eries are enabled by collecting and analyzing enormous datsets and so biologists are grappling with the challenges ofbig data By visualizing data in the context of pathway maps we can quickly spot trends which would not be apparent
15
Escher Documentation Release 143
with standard statistical tools And Escher visualizations can be adapted and shared to demonstrate those biologicaldiscoveries
The rest of this guide will introduce the Escher user interface and the major features of Escher
712 The launch page
When you open the Escher website you will see a launch page that looks like this
The options on the launch page are
bull Filter by organism Choose an organism to filter the Maps and Models
bull Map Choose a pre-built map or start from scratch with an empty builder by choosing None In parenthesesnext to the map name you will see the name of the model that was used to build this map
bull Model (Optional) If you choose a COBRA model to load then you can add new reactions to the pathway mapYou can also load your own model later after you launch the tool For an explanation of maps models andCOBRA see Escher COBRA and COBRApy
bull Tool
ndash The Viewer allows you to pan and zoom the map and to visualize data for reactions genes and metabo-lites
ndash The Builder in addition to the Viewer features allows you to add reactions move and rotate existingreactions add text annotations and adjust the map canvas
bull Options
ndash Scroll to zoom (instead of scroll to pan) Determines the effect of using the mousersquos scroll wheel overthe map
ndash Never ask before reloading If this is checked then you will not be warned before leaving the page evenif you have unsaved changes
Choose Load map to open the Escher viewer or builder in a new tab and prepare to be delighted by your very ownpathway map
16 Chapter 7 Contents
Escher Documentation Release 143
713 The menu bar
Once you have loaded an Escher map you will see a menu bar along the top of the screen Click the question mark tobring up the Escher documentation
714 Loading and saving maps
Using the map menu you can load and save maps at any time
Click Save map JSON to save the Escher map as a JSON file which is the standard file representing an Escher map
NOTE The JSON file does NOT save any datasets you have loaded This may be changed in a future version ofEscher
NOTE 2 In Safari saving files from Escher works a little differently than in the other major browsers After clickingSave map JSON Safari will load a new tab with the raw content of the Escher map file To save the file chooseFilegtSave As from the Safari menu A new dialog appears in the dropdown menu near the bottom select PageSource (rather than Web Archive) give your file an appropriate name (eg mapjson for an Escher map or mapsvgfor an SVG export) and click Save
Later you can can load a JSON file to view and edit a map by clicking Load map JSON
Click Export as SVG to generate a SVG file for editing in tools like Adobe Illustrator and Inkscape This is thebest way to generate figures for presentations and publications Unlike a JSON file a SVG file maintains the datavisualizations on the Escher map However you cannot load SVG files into Escher after you generate them
Click Clear Map to empty the whole map leaving a blank canvas NOTE You cannot undo Clear Map
715 Loading models
Use the model menu to manage the COBRA model loaded in Escher
71 Getting started 17
Escher Documentation Release 143
Choose Load COBRA model JSON to open a COBRA model Read more about COBRA models in Escher COBRAand COBRApy Once you have COBRApy v030 or later installed then you can generate a JSON model by followingthis example code
Once you have loaded a COBRA model there may be inconsistencies between the content in the map and the model(eg reaction IDs descriptive names and gene reaction rules) You click Update names and gene reaction rulesusing model to find matching reactions and metabolites between the map and the model (based on their IDs) andthen apply the names and gene reaction rules from the model to the map The reactions that do not match will behighlighted in red (This can be turned off again in the settings menu by deselecting Highlight reactions not in model)More advice on building maps is available in Building and contributing maps
Click Clear Model to clear the current model
716 Loading reaction gene and metabolite data
Datasets can be loaded as CSV files or JSON files using the Data Menu
In Escher reaction and gene datasets are visualized by changing the color thickness and labels of reaction arrowsMetabolite datasets are visualized by changing the color size and labels of metabolite circles The specific visualstyles can be modified in the Settings menu When data is not present for a specific reaction gene or metabolite thenthe text label will say lsquondrsquo which means lsquono datarsquo
18 Chapter 7 Contents
Escher Documentation Release 143
The structure of a CSV file
CSV files should have 1 header row 1 ID column and either 1 or 2 columns for data values The ID column cancontain BiGG IDs or descriptive names for the reactions metabolites or genes in the dataset Here is an example witha single data value columns
IDtime 0secglc__D_c54g6p__D_c23
Which might look like this is Excel
ID time 0secglc__D_c 54g6p_c 23
If two datasets are provided then the Escher map will display the difference between the datasets In the Settings menuthe Comparison setting allows you to choose between comparison functions (Fold Change Log2(Fold Change) andDifference) With two datasets the CSV file looks like this
ID time 0sec time 5sglc__D_c 54 102g6p_c 23 81
Data can also be loaded from a JSON file This Python code snippet provides an example of generating the properformat for single reaction data values and for reaction data comparisons
import json
save a single flux vector as JSONflux_dictionary = glc__D_c 54 g6p_c 23with open(outjson w) as f
jsondump(flux_dictionary f)
save a flux comparison as JSON
71 Getting started 19
Escher Documentation Release 143
flux_comp = [glc__D_c 54 g6p_c 23 glc__D_c 102 g6p_c 81]with open(out_compjson w) as f
jsondump(flux_comp f)
Gene data and gene reaction rules
Escher uses gene reaction rules to connect gene data to the reactions on a metabolic pathway You can see these genereaction rules on the map by selecting Show gene reaction rules in the Settings menu
Gene reaction rules show the genes whose gene products are required to catalyze a reaction Gene are connected usingAND and OR rules AND rules are used when two genes are required for enzymatic activity eg they are membersof a protein complex OR rules are used when either gene can catalyze the enzymatic activity eg they are isozymes
With OR rules Escher will take the sum of the data values for each gene With AND rules Escher will either takethe mean (the default) or the minimum of the components The AND behavior (mean vs minimum) is defined in theSettings menu
717 Editing and building
The Edit menu gives you access to function for editing the map
20 Chapter 7 Contents
Escher Documentation Release 143
Escher has five major modes and you can switch between those modes using the buttons in the Edit menu or usingthe buttons in the button bar on the left of the screen
1 Pan mode Drag the canvas to pan the map You can also use the mouse scroll wheel or trackpad scroll function(drag with 2 fingers) to pan the map (or to zoom if you selected Scroll to zoom in the settings)
2 Select mode Select nodes by clicking on them Shift-click to select multiple nodes or drag across the canvasto select multiple nodes using the selection brush
3 Add reaction mode If you have loaded a Model then click on the canvas to see a list of reactions that you candraw on the map Click on a node to see reactions that connect to that node In the input box you can search byreaction ID metabolite ID or gene ID (locus tag)
4 Rotate model Before entering rotate mode be sure to select one or more nodes in select mode Then afterentering rotate mode drag anywhere on the canvas to rotate the selection You can also drag the red crosshairsto change the center of the rotation
5 Text mode Use text mode to add text annotations to the map Click on the canvas to add a new text annotationor click an existing annotation to edit it When you are finished click Enter or Escape to save the changes
71 Getting started 21
Escher Documentation Release 143
In addition to the editing modes the Edit menu gives you access to the following commands
bull Delete Delete the currently selected node(s)
bull Undo Undo the last action NOTE Certain actions such as editing the canvas cannot be undone in the currentversion of Escher
bull Redo Redo the last action that was undone
bull Toggle primarysecondary node In Escher each metabolite node is either a primary node or a secondarynode Primary nodes are larger and secondary nodes can be hidden in the Settings menu Use this command totoggle the currently selected node(s) between primary and secondary
bull Rotate reactant locations When you draw a new reaction in Escher this command will rotate the new reactantsso that a new reactant is primary and centered This command is extremely useful when you are drawing a longpathway and you want to quickly switch which metabolite to ldquofollowrdquo eg make sure you are following thecarbon-containing metabolites
If you are confused then try drawing a new pathway and hitting the ldquocrdquo key to see the reactants rotate
bull Select all Select all nodes
bull Select none Unselect all nodes
bull Invert selection Select all the nodes that are currently unselected This feature is very useful when you wantto keep just one part of the map Simply drag to select the part you want to keep call the Invert selectioncommand then call the Delete command
718 Editing the canvas
A somewhat non-obvious feature of Escher is that you can edit the canvas by dragging the canvas edges This ispossible in Pan mode and Select mode
22 Chapter 7 Contents
Escher Documentation Release 143
719 View options
bull Zoom in Zoom in to the map
bull Zoom out Zoom out of the map
bull Zoom to nodes Zoom to see all the nodes on the map
bull Zoom to canvas Zoom to see the entire canvas
bull Find Search for a reaction metabolite or gene on the map
bull Show control points Show the control points you can drag these red and blue circle to adjust the shapes ofthe reactions curves
bull Settings Open the Settings menu
7110 The button bar
The button bar give you quick access to many of the common Escher functions
71 Getting started 23
Escher Documentation Release 143
24 Chapter 7 Contents
Escher Documentation Release 143
7111 Settings
View and build options
bull Identifiers Choose whether to show BiGG IDs or descriptive names for reactions metabolites and genes
bull Hide secondary metabolites This will simplify the map by hiding all secondary metabolites and the pathsconnected to them
bull Show gene reaction rules Show the gene reaction rules below the reaction labels even gene data is not loaded
bull Hide reaction gene and metabolite labels Another option to visually simplify the map this will hide alllabels that are not text annotations
bull Allow duplicate reactions By default duplicate reactions are hidden in the add reaction dropdown menuHowever you can turn this option on to show the duplicate reactions
bull Highlight reactions not in model Highlight in red any reactions that are on the map but are not in the modelThis is useful when you are adapting a map from one model for use with another model
71 Getting started 25
Escher Documentation Release 143
Reaction data settings
When reaction or gene data is loaded this section can be used to change visual settings for reactions
The color bar has individual control points and you can drag the control points (execpt min and max) left and right tochange their values Alternatively you can use the dropdown menu (next to the word median in the figure above) toattach a control point to a statistical measure (mean median first quartile (Q1) or third quartile (Q3)) This lets youchoose a color scale that will adapt to your dataset
For each control point you can choose a color by entering a CSS-style color (eg red ff0000 rgba(20 20 255 05)and you can choose a size that will scale the thickness of reactions
There are also color and size options for reactions that do not have any data value
Finally there are a few onoff settings for the loaded reaction or gene dataset
bull Options These determine how to visualize the datasets Check Absolute value to color and size reactions bythe absolute value of each data value The Size Color and Text options can be unselected to turn off sizingcoloring and data values in reaction labels individually
bull Comparison Determines the comparison algorithm to use when two datasets are loaded
bull Method for evaluating AND Determines the method that will be used to reconcile AND statements in genereaction rules when there is gene data loaded See Gene data and gene reaction rules for more details
Metabolite data settings
The data settings for metabolite data are analagous to those for reaction data The only difference is that size nowrefers to the size of the metabolite circles
26 Chapter 7 Contents
Escher Documentation Release 143
72 Escher COBRA and COBRApy
Escher can be used as an independent application but it draws heavily on the information in COBRA models ACOBRA model is a collection of all the reactions metabolites and genes known to exist in an organism (In theliterature these are generally called genome-scale models (GEMs) but we refer to them as COBRA models here toemphasize that Escher interoperates with models that are exported from COBRApy)
By loading a COBRA model into the Escher interface you have access to every reaction and metabolite in that modelYou also have the gene reaction rules for the reactions in the network which allow you to connect gene data toreactions and metabolites
COBRApy is a software package for COBRA modeling written in Python The Escher Python package uses CO-BRApy package for reading and writing COBRA models
721 Maps and models
In Escher you will see references to maps and models
A map contains the reactions and metabolites that you see in the Escher builder including their locations text annota-tions and the canvas
A model (a COBRA model) contains reactions and metabolites that you have not drawn yet Thus you can load aCOBRA model when you want to draw new reactions on the map
722 What is JSON and why do we use it
Both Escher maps and COBRA models are stored as JSON files JSON is a useful plain-text format for storing nesteddata structures We use JSON much like the SBML community uses XML You may notice that SBML files have axml extension and Escher maps and COBRA models have a json extension
You can use Python to explore a JSON file like this
import json
with open(mapjson r) as fmap_object = jsonload(f)
print map_object[0]print map_object[1][reactions]values()[0]
723 Escher SBML and SBGN
A tool has been developed for converting Escher maps to SBML Layout and SBGN and it will be released soon
COBRA models can be converted to SBML using COBRApy
73 Run Escher locally and in IPython
To run Escher on a local computer or to use Escher in PythonIPython first install it The Python package for Eschercan be installed using pip
pip install escher
72 Escher COBRA and COBRApy 27
Escher Documentation Release 143
Depending on your installation of Python you may need sudo
sudo pip install escher
Alternatively one can download the source files and install the package directly
python setuppy install
731 Escher in the IPython Notebook
Once you have installed Escher locally you can interact with Escher maps in an IPython Notebook
Here are example notebooks to get started with
bull COBRApy and Escher
bull JavaScript development and offline maps
bull Generate JSON models in COBRApy
Dependencies
bull Jinja2
bull Tornado
bull COBRApy 030 or later
732 Running the local server
You can run your own local server if you want to use Escher offline or explore your own maps with the homepagebrowser To get started install the Python package and run from any directory by calling
python -m escherserver
This starts a server at httplocalhost7778 You can also choose another port
python -m escherserver --port=8005
74 Validate and convert maps
741 Validate an Escher map
Escher maps follow a specification using the JSON Schema format Therefore any JSON Schema validator can beused to validate an Escher map by comparing it to the latest schema file For example the current schema is locatedhere
httpsgithubcomzakandrewkingescherblobmasterescherjsonschema1-0-0
To make this easier the Escher Python package includes a validation script To validate a map first install Escher
pip install escher
Then call the validator
python -m eschervalidate my_mapjson
Any errors in the map will print to the console
28 Chapter 7 Contents
Escher Documentation Release 143
742 Convert or upgrade an Escher map
Any Escher maps built with pre-release versions of Escher will not load right away in the stable v10 release Toconvert pre-release maps to the new format follow these steps
1 Install Escher
pip install escher
2 Find a COBRA model for your maps This COBRA model will be used to update the content of the mapin order to support all the new Escher features You can use a COBRA model encoded as SBML or JSON(generated with COBRApy v030b4 or later) The COBRA models currently available on the Escher websitecan be downloaded from the BiGG Models website
httpbiggucsdedu
For a refresher on the distinction between Escher maps COBRA models and their file types (SBML JSONSBML Layout) see Escher COBRA and COBRApy
3 Run the convert_map script to convert your existing Escher map (my_old_mapjson) to the new formatusing a COBRA model (model_filejson or model_filexml in these examples)
With a JSON file modelpython -m escherconvert_map my_old_mapjson pathtomodel_filejson
With an SBML modelpython -m escherconvert_map my_old_mapjson pathtomodel_filexml
Those commands will generate a new map called my_old_map_convertedjson that will load in Escher v10and later
75 Building and contributing maps
We are excited to collect pathway maps for every organism with a well characterized metabolic network This sectiondescribes the process of building a new map either from scratch or using a COBRA model with BiGG IDs
751 Building from scratch
To build a map from scratch you will first need a COBRA model for your map See the section Escher COBRA andCOBRApy for some background information on COBRA models
If you would like to eventually contribute your map to the Escher website it is important that your COBRA modeladheres to the identifiers in the BiGG Database Escher and BiGG are being developed together and we want tomaintain consistency and interoperability between them
Once you have a COBRA model you can follow these steps
1 Load your model in the Escher Builder
2 Begin building new reactions If you are familiar with the genes in your organism then try search for newreactions by their gene IDs
3 Limit each map to ~200 reactions Maps larger than this will slow down the Escher viewer especially on oldbrowsers Rather than building one giant map Escher is designed for building many smaller subsystem maps
4 When you have built a map for your a subsystem save the map as JSON with a name that includes the modelID followed by a period followed by the name of the subsystem For example
75 Building and contributing maps 29
Escher Documentation Release 143
iMM904Amino acid biosynthesisjson
5 (Optional) Once you have a set of subsystem maps you can set up a local Escher server so that subsystem mapsappear in the ldquoquick jumprdquo menu in the bottom right corner of the screen (as seen here for iJO1366) To setthis up you will need to start a local server as describe in Running the local server Next find your local cachedirectory by running this command in a terminal
python -c import escher print(escherget_cache_dir(name=maps))
This will print the location of the local maps cache Add your new subsystem maps to cache folder Now whenyou run the server (described in Running the local server) you should see that quick jump menu appear
NOTE The cache directory is organized into folders for organisms You can use these folder for filtering byorganism on the local launch page or you can place the maps in the top directory
NOTE 2 A similar approach can be used to access your models from the local launch page Place maps in thefolder indicated by
python -c import escher print(escherget_cache_dir(name=models))
752 Building from an existing map for a similar organism
Follow the instruction above except rather than starting from scratch load an existing Escher map for a differentorganism
Once you have the new model loaded use the Update names and gene reaction rules using model button in theModel menu to convert all descriptive names and gene reaction rules in the model to those in the map Reactions thatdo not match the model will be highlighted in red (This can be turned off again in the settings menu by deselectingHighlight reactions not in model)
Now visit each highlighted reaction and see if you can replace it with an equivalent biochemical pathway from themodel If not then delete the reaction and move on
Finally when there are no highlighted reactions left you can repeat this for other subsystems
753 Submitting maps to the Escher website
If you would like to contribute maps to Escher you can make a Pull Request to the GitHub repository eschergithubioMake sure there is a folder with the name of the organism in 1-0-0maps For example a new yeast map goes inthe folder
1-0-0mapsSaccharomyces cerevisiae
Then name your map by concatenating the model ID and the map name separated by a period For example a yeastmap built with the genome-scale model iMM904 could be named
iMM904Amino acid biosynthesisjson
Then add the JSON file for the model to the Pull Request if that model is not already available As before make afolder for your organism within 1-0-0models The model filename is just the model ID
In this example a correct Pull Request would include the following files
1-0-0mapsSaccharomyces cerevisiaeiMM904Amino acid biosynthesisjson1-0-0modelsSaccharomyces cerevisiaeiMM904json
30 Chapter 7 Contents
Escher Documentation Release 143
76 Developing with Escher
761 Using the static JavaScript and CSS files
You can include the compiled Escher JavaScript and CSS files in any HTML document The only dependencies ared3js and optionally Twitter Bootstrap if you are using the option menu=rsquoallrsquo
The compiled files are available form npmcdn
httpsnpmcdncomescher-visjsdistescherjshttpsnpmcdncomescher-visjsdistescherminjshttpsnpmcdncomescher-viscssdistbuildercsshttpsnpmcdncomescher-viscssdistbuildermincss
Source maps are also hosted there
httpsnpmcdncomescher-visjsdistescherjsmaphttpsnpmcdncomescher-visjsdistescherminjsmaphttpsnpmcdncomescher-viscssdistbuildermincssmap
If you want a particular version of escher add a version tag like this
httpsnpmcdncomescher-vis140-beta3jsdistescherjs
For an example of the boilerplate code that is required to begin developing with Escher have a look at the escher-demorepository For projects built with npm use the escher-test repository as a guide
762 Building and testing Escher
First install dependencies with npm
npm install
Escher uses grunt to manage the build process To run typical build steps just run
npm run compile
To test the JavaScript files run
npm run test
For Python testing run this in the py directory
python setuppy test
Build the static website
python setuppy build_gh
Clear static website files
python setuppy clean
Build and run the docs
cd docsmake htmlcd _buildhtml
76 Developing with Escher 31
Escher Documentation Release 143
python -m SimpleHTTPServer python 2python -m httpserver python 3
763 Generating and reading Escher and COBRA files
The Escher file format
Escher layouts are defined by JSON files that follow a specific schema using json schema The latest schemafor Escher JSON files is here The Escher schemas are versioned with inspiration from SchemaVer Theeschervalidate module can be used to validate models against the schema
The Escher layout schema is designed to be as simple as possible For example the core metabolism map of Es-cherichia coli is layed out like this
[
map_name E coli coreCore metabolismmap_id 2938hoq32a1map_description E coli core metabolic networknLast Modified Fri Dec 05 2014 163944 GMT-0800 (PST)homepage httpseschergithubioschema httpseschergithubioescherjsonschema1-0-0
reactions nodes text_label canvas
x 7857062530517567y 31436893920898433width 5894515691375733height 4860457037353515
]
The map_name includes the model that was used to build this layout followed by a period and then a readable namefor the map The map_id is a unique identifier for this map The map_description describes the map and thelast time it was modified Both the homepage and the schema entries must have exactly these values for the Eschermap to be valid
In the next section the reactions nodes labels and canvas are all defined For reactions nodes and text labels eachelement has a key that is an arbitrary integer As long as there are no repeated IDs (eg no 2 segments with the ID517) then everything should work fine
Read through the schema (here) for more detail on the format
The COBRA file format
COBRA models are also saved as JSON files This format has not been documented with a schema but you canbrowse through the core metabolism model as a guide to generating valid COBRA models
I still need help
If you are interested in developing with Escher and you need more information than what is provided in the documen-tation please contact Zachary King (zaking-AT-ucsd-DOT-edu)
32 Chapter 7 Contents
Escher Documentation Release 143
77 EscherConverter
EscherConverter is a standalone program that reads files created with the graphical network editor Escher and convertsthem to files in community standard formats
Download EscherConverter 05 (137 MB)
771 Using EscherConverter
Escher uses a JSON file format to represent its networks This format has been developed because of its very small filesize and its compatibility to online programs that are written in JavaScript In particular JSON is a JavaScript ObjectNotation or in other words a JSON file directly represents components of JavaScript programs This makes parsingvery simple and allows direct use of those files in web-based programs
However in systems biology specific file formats have been developed with the aim to be easily exchangeable betweensoftware implemented in diverse programming languages
To this end these formats support semantically clear annotations and are maintained by a large community of scientistsEscherConverter supports export to two particularly important XML-based community file formats SBML with layoutextension and SBGN-ML
While SBML has been mainly developed for dynamic simulation of biological networks it is nowadays also usablefor diverse other purposes Its layout extension facilitates the encoding the display of biological networks
SBGN-ML has been directly developed as a language for the display of biological pathway maps of diverse kinds Itstores the position and connection of entities similar to what is shown in Escher networks
EscherConverter takes Escherrsquos JSON files as input and generates equivalent SBML Level 3 Version 1 files with layoutextension or SBGN-ML files
In order to ensure that the conversion is correct EscherConverter provides its own display that gives users a previewof how the export data format will be rendered by other tools In this preview display you can zoom in and out movearcs and node positions However it is important to know that none of the changes made in this preview are stored inthe export file
Download and Installation
You can obtain local copy of EscherConverter by clicking here
As a Javatrade application no specific installation is required for EscherConverter
However make sure you have a recent Javatrade Runtime Environment (JRE) installed on your computer (at least JRE8) You can obtain Javatrade from the Oracle website There you can also find installation instructions for your respectiveoperating system
Once Javatrade has been installed you can simply place the EscherConverter JAR file somewhere on your local computerfor instance in the folder
bull Applications if you are working under Mac OS
77 EscherConverter 33
Escher Documentation Release 143
bull opt for Linux computers
bull CProgram Files if you are using Windows
Launching the program
You can launch EscherConverter simply by double-clicking on the application JAR file This will open a followinggraphical user interface as described in the following figures
Figure 1 | The graphical user interface of EscherConverter
bull Preferences opens a settings dialog (see next screenshot)
bull Open displays a file chooser to select an input file in JSON format
bull Save export the map that is displayed in the current tab to SBML or SBGN-ML
bull Discard closes the current tab without saving
bull Help opens the online help that displays all command-line options
bull License displays the license under which this software is distributed
bull About shows information about the authors of this software
bull Main the main panel of the software in which converted Escher maps will be displayed organized in tabs
bull Status the status bar shows information and logging messages during the conversion
34 Chapter 7 Contents
Escher Documentation Release 143
Figure 2 | The preferences dialog All settings in this dialog are also available through EscherConverterrsquos command-line interface
Layout section several properties that are required in SBML and SBGN-ML are not explicitly specified in EscherrsquosJSON format and therefore need to be adjusted by the user These are the size of the drawing canvas the default boxsize for text labels the size of primary and secondary nodes In contrast to SBGN-ML and Escherrsquos JSON formatthe SBML layout extension supports three-dimensional displays When selecting this export file format it is thereforenecessary to also define the z-coordinate and the depth of all objects
Components and naming section Most settings in this section are specific for the SBML layout extension and areonly active if this output format is selected These are names and identifiers of the layout component and the in caseof SBML mandatory default compartment (a compartment without physical meaning a reaction space in which allmetabolites are located) EscherConverter can infer compartment bounds from metabolites but this is an experimentalfeature Just try it and see how the preview changes
77 EscherConverter 35
Escher Documentation Release 143
Figure 3 | A layout preview
The birds-eye view and the navigation component on the left help you navigate through the network display Thisgraph shows you how the converted pathway map will be rendered by software that supports SBGN-ML or the SBMLlayout extension This preview can be modified by moving arcs or nodes however none of those changes are storedwhen exporting the file In this current version EscherConver only exports layouts as given in the original JSON file
Included third-party software
EscherConverter includes several third-party libraries which we here list and acknowledge
bull ArgParser
bull JSBML
bull libSBGN
bull Pixel-Mixer icons
bull yFiles
772 Command-line interface API
You can launch EscherConverter from the command-line On a Unix system (such as Linux MacOS or Solaris etc)use a command like
bash$ java -jar -Xms8G -Xmx8G -Duserlanguage=en EscherConverter-05jar [options]
Under Window use a command like
Cgt javaw -jar -Xms8G -Xmx8G -Duserlanguage=en EscherConverter-05jar [options]
Escher has a large collection of command-line options (see below) which can be useful if you want to launch theprogram with specific settings or if multiple files are to be converted in a batch mode It is even possible to completelydisable the graphical user interface
36 Chapter 7 Contents
Escher Documentation Release 143
Input and output files
Definition of input and output data files as well as the format for the output
--input=ltFilegt
Specifies the JSON input file If a directory is given the conversion will be recursively performed Accepts JSON
--output=ltFilegt
The path to the file into which the output should be written If the input is a directory this must also be a directory inorder to perform a recursive conversion Accepts SBML SBGN
Escher layout
The options in this group allow you to influence how large certain elements should be displayed
--canvas-default-height=ltDoublegt
Just as in the case of the width of the canvas this value needs to be specified for cases where the JSON input file lacksan explicit specification of the canvas height Arguments must fit into the range [11E9] (Default value 2500)
--canvas-default-width=ltDoublegt
This value is used when no width has been defined for the canvas Since the width attribute is mandatory for the layouta default value must be provided in these cases Arguments must fit into the range [11E9] (Default value 2500)
--label-height=ltDoublegt
With this option you can specify the height of the bounding box of text labels Arguments must fit into the range[11E9] (Default value 500)
--label-width=ltDoublegt
This option defines the width of bounding boxes for text labels Arguments must fit into the range [11E9] (Defaultvalue 1600)
--node-depth=ltDoublegt
The length of nodes along z-coordinate Escher maps are actually two-dimensional but in general a layout can bethree-dimensional This value should be an arbitrary value greater than zero because some rendering engines mightnot display the node if its depth is zero Arguments must fit into the range [11E9] (Default value 10)
--node-label-height=ltDoublegt
Node labels can have a size different from general labels in the graph Here you can specify how height the boundingbox of the labels for nodes should be Arguments must fit into the range [11E9] (Default value 200)
--primary-node-height=ltDoublegt
The primary node should be bigger than the secondary node With this option you can specify the height of this typeof nodes Arguments must fit into the range [11E9] (Default value 300)
--primary-node-width=ltDoublegt
Escher maps distinguish between primary and secondary nodes Primary nodes should be larger than secondary nodesand display the main flow of matter through the network This option allows you to specify the width of primarynodes Arguments must fit into the range [11E9] (Default value 300)
77 EscherConverter 37
Escher Documentation Release 143
--reaction-label-height=ltDoublegt
Reaction label heightArguments must fit into the range [11E9] (Default value 300)
--reaction-node-ratio=ltDoublegt
This value is used as a conversion factor to determine the size of the reaction display box depending on the size ofprimary nodes Height and width of reaction nodes are determined by dividing the corresponding values from theprimary node size by this factor Arguments must fit into the range [01] (Default value 05)
--secondary-node-ratio=ltDoublegt
Similar to the reaction node ratio the size of secondary nodes (width and height) is determined by dividing thecorresponding values from the primary nodes by this value Arguments must fit into the range [01] (Default value06666666666666666)
--z=ltDoublegt
The position on the z-axis where the entire two-dimensional graph should be drawn Arguments must fit into the range[-1E91E9] (Default value 00)
Escher Components and their naming
Here you can influence which elements are to be included in the layout and how elements in the layout are to be calledor identified
--format=ltOutputFormatgt
The desired format for the conversion eg SBML All possible values for type ltOutputFormatgt are SBGN andSBML (Default value SBML)
--layout-id=ltStringgt
In contrast to the name this identifier does not have to be human-readable This is a machine identifier which muststart with a letter or underscore and can only contain ASCII characters (Default value Escher_Layout)
--layout-name=ltStringgt
This should be a human-readable name for the layout that is to be created This name might be displayed to describethe figure and should therefore be explanatory (Default value Escher Layout)
--compartment-id=ltStringgt
A compartment needs to have a unique identifier which needs to be a machine-readable Sting that must start with aletter or underscore and can only contain ASCII characters Since the JSON file does not provide this information thisoption allows you to specify the required identifier (Default value default)
--compartment-name=ltStringgt
With this option it is possible to define a name for the default compartment can be that needs to be generated for theconversion to SBML The name does not have any restrictions ie any UTF-8 character can be used (Default valueDefault compartment)
--infer-compartment-bounds
This converter can infer where the boundaries of compartments could be drawn To this end it uses each nodersquos BiGGids to identify the compartment of all metabolites Assuming that compartments have rectangular shapes the algorithmcan find the outermost node on each side of the box and hence obtain the boundaries of the compartment However
38 Chapter 7 Contents
Escher Documentation Release 143
this methods will fail when metabolites are drawn inside of such a box that belong to a different compartment that isactually further outside For this reason this option is deactivated by default (Default value false)
Options for the graphical user interface
--gui
If this option is given the program will display its graphical user interface (Default value false)
--log-level=ltStringgt
Change the log-level of this application This option will influence how fine-grained error and other log messages willbe that you receive while executing this program All possible values for type ltStringgt are ALL CONFIG FINEFINER FINEST INFO OFF SEVERE and WARNING (Default value INFO)
--log-file=ltFilegt
This option allows you to specify a log file to which all information of the program will be written Accepts (bp2bp3 log owl xml)
78 JavaScript API
class escherBuilder(map_data model_data embedded_css selection options)A Builder object contains all the UI and logic to generate a map builder or viewer
Arguments
bull map_data (object) ndash The data for a map to be passed to escherMapfrom_data() Ifnull then an empty Builder is initialized
bull model_data (object) ndash The data for a cobra model to be passed to es-cherCobraModel() Can be null
bull embedded_css (string) ndash The stylesheet for the SVG elements in the Escher map
bull selection (object) ndash (Optional Default In the body element) The d3 selection of anelement to place the Builder into The selection cannot be inside an SVG element
bull options (object) ndash (Optional) An object defining any of the following options
optionsmenu(Default rsquoallrsquo) The type of menu that will be displayed Can be lsquoallrsquo for the fullmenu or lsquozoomrsquo for just zoom buttons The lsquoallrsquo option requires the full set of Escherdependencies (D3js JQuery and Bootstrap) while the lsquozoomrsquo option requires only D3jsFor more details see Developing with Escher
optionsscroll_behavior(Default rsquopanrsquo) This option determines the effect that the scroll wheel will have onan Escher map Can be lsquopanrsquo to pan the map or lsquozoomrsquo to zoom the map when the usermoves the scroll wheel
optionsuse_3d_transform(Default Chooses a good option by testing the browser) If true then use CSS3 3D trans-forms to speed up panning and zooming This feature will only work on browsers thatsupport the 3D transforms It works best in the latest versions of Chrome Firefox andInternet Explorer Safari works better with this turned off
78 JavaScript API 39
Escher Documentation Release 143
optionsenable_editing(Default true) If true then display the map editing functions If false then hide themand only allow the user to view the map
optionenable_keys(Default true) If true then enable keyboard shortcuts
optionsenable_search(Default true) If true then enable indexing of the map for search Use false to disablesearching and potentially improve the map performance
optionsfill_screen(Default false) Use true to fill the screen when an Escher Builder is placed in a top-level container (eg a div in the body element)
optionsfull_screen_button(Default false) Include a button in the user interface for entering full screen mode
optionsignore_bootstrap(Default false) Do not use Bootstrap for buttons even if it available This is used toembed Escher in a Jupyter notebook where it conflicts with the Jupyter Boostrap installa-tion
Map model and styles
optionsstarting_reaction(Default null) The ID (as a string) of a reaction to draw when the Builder loads
optionsnever_ask_before_quit(Default false) If false then display a warning before the user closes an Eschermap If true then never display the warning This options is only respected if op-tionsenable_editing == true If enable_editing is false then the warnings are not dis-played
optionsunique_map_id(Default null) A unique ID that will be used to UI elements donrsquot interfere whenmultiple maps are in the same HTML document
optionsprimary_metabolite_radius(Default 15) The radius of primary metabolites in px
optionssecondary_metabolite_radius(Default 10) The radius of secondary metabolites in px
optionsmarker_radius(Default 5) The radius of marker nodes in px
optionsgene_font_size(Default 18) The font size of the gene reaction rules in px
optionshide_secondary_metabolites(Default false) If true then secondary nodes and segments are hidden This is conve-nient for generating simplified map figures
optionsshow_gene_reaction_rules(Default false) If true then show the gene reaction rules even without gene data
optionshide_all_labels(Default false) If checked hide all reaction gene and metabolite labels
Applied data
40 Chapter 7 Contents
Escher Documentation Release 143
optionsreaction_data(Default null) An object with reaction ids for keys and reaction data points for values
optionsreaction_stylesDefault [rsquocolorrsquo rsquosizersquo rsquotextrsquo]
An array of style types The array can contain any of the following lsquocolorrsquo lsquosizersquo lsquotextrsquolsquoabsrsquo The lsquocolorrsquo style means that the reactions will be colored according to the loadeddataset The lsquosizersquo style means that the reactions will be sized according to the loadeddataset The lsquotextrsquo style means that the data values will be displayed in the reactionlabels The lsquoabsrsquo style means the the absolute values of reaction values will be used fordata visualization
optionsreaction_compare_style(Default rsquodiffrsquo) How to compare to datasets Can be either lsquofold lsquolog2_foldrsquo orlsquodiffrsquo
optionsreaction_scaleDefault
[ type min color c8c8c8 size 12 type median color 9696ff size 20 type max color ff0000 size 25 ]
An array of objects that define points on the data scale
Each point is an object with a type attribute Types can be lsquominrsquo lsquomaxrsquo lsquomeanrsquo lsquoQ1rsquo (firstquartile) lsquomedianrsquo lsquoQ3rsquo (third quartile) or lsquovaluersquo Each point can have a color attributethat specifies a color with a string (any CSS color specification is allowed including hexrgb and rgba) Each point can have a size attirbute that specifies a reaction thickness as anumber Finally points with type lsquovaluersquo can have a value attribute that specifies an exactnumber for pont in the scale
NOTE If lsquominrsquo or lsquomaxrsquo is not provided Escher automatically adds them To be com-pletely clear about what you expect to see on the map it is best to provide lsquominrsquo andlsquomaxrsquo in addition to other scale points
Here are examples of each type
type rsquominrsquo color rsquoredrsquo size 12 Specifies that reactionsnear the minimum value are red and have thickness 12
type rsquoQ1rsquo color rsquorgba(100 100 50 05)rsquo size 12 Specifies that reactions near the first quartile have the given color opacity andthickness
type rsquomeanrsquo color rsquorgb(100 100 50)rsquo size 50 Specifies that reactions near the mean value have the given color and thickness
type rsquovaluersquo value 85 color rsquo333rsquo size 50 Specifies that reactions near 85 value have the given color and size
optionsreaction_no_data_color(Default rsquodcdcdcrsquo) The color of reactions with no data value
optionsreaction_no_data_size(Default 8) The size of reactions with no data value
optionsgene_data(Default null) An object with Gene ids for keys and gene data points for values
78 JavaScript API 41
Escher Documentation Release 143
optionsand_method_in_gene_reaction_rule(Default mean) When evaluating a gene reaction rule use this function to evaluate ANDrules Can be lsquomeanrsquo or lsquominrsquo
optionsmetabolite_data(Default null) An object with metabolite ids for keys and metabolite data points forvalues
optionsmetabolite_stylesDefault [rsquocolorrsquo rsquosizersquo rsquotextrsquo]
An array of style types The array can contain any of the following lsquocolorrsquo lsquosizersquo lsquotextrsquolsquoabsrsquo The lsquocolorrsquo style means that the metabolites will be colored according to the loadeddataset The lsquosizersquo style means that the metabolites will be sized according to the loadeddataset The lsquotextrsquo style means that the data values will be displayed in the metabolitelabels The lsquoabsrsquo style means the the absolute values of metabolite values will be used fordata visualization
optionsmetabolite_compare_style(Default rsquodiffrsquo) How to compare to datasets Can be either lsquofoldrsquo lsquolog2_foldrsquo orlsquodiffrsquo
optionsmetabolite_scaleDefault
[ type min color fffaf0 size 20 type median color f1c470 size 30 type max color 800000 size 40 ]
An array of objects that define points on the data scale See the description of op-tionsreaction_scale for an explanation of the format
optionsmetabolite_no_data_color(Default rsquoffffffrsquo) The color of metabolites with no data value
optionsmetabolite_no_data_size(Default 10) The size of metabolites with no data value
View and build options
optionsidentifiers_on_map(Default rsquobigg_idrsquo) The identifiers that will be displayed in reaction metabolite andgene labels Can be lsquobigg_idrsquo or lsquonamersquo
optionshighlight_missing(Default false) If true then highlight in red reactions that are not in the loaded COBRAmodel
optionsallow_building_duplicate_reactions(Default true) If true then building duplicate reactions is allowed If false then dupli-cate reactions are hidden in Add reaction mode
optionscofactors(Default [rsquoatprsquo rsquoadprsquo rsquonadrsquo rsquonadhrsquo rsquonadprsquo rsquonadphrsquorsquogtprsquo rsquogdprsquo rsquohrsquo rsquocoarsquo rsquoumprsquo rsquoh20rsquo rsquoppirsquo]) A list of metabo-lite IDs to treat as cofactors These will be secondary metabolites in new reactions
Callbacks
optionsfirst_load_callbackA function to run after loading the Builder
42 Chapter 7 Contents
Escher Documentation Release 143
load_map(map_data[ should_update_data])Load a map for the loaded data Also reloads most of the Builder content
Arguments
bull map_data ndash The data for a map
bull should_update_data (Boolean) ndash (Default true) Whether data should be ap-plied to the map
load_model(model_data[ should_update_data])Load the cobra model from model data
Arguments
bull model_data ndash The data for a Cobra model (Parsing in done by escherCobraModel)
bull should_update_data (Boolean) ndash (Default true) Whether data should be ap-plied to the model
view_mode()Enter view mode
build_mode()Enter build mode
brush_mode()Enter brush mode
zoom_mode()Enter zoom mode
rotate_mode()Enter rotate mode
text_mode()Enter text mode
set_reaction_data(data)
Arguments
bull data (array) ndash An array of 1 or 2 objects where each object has keys that are reactionIDrsquos and values that are data points (numbers)
set_metabolite_data(data)
Arguments
bull data (array) ndash An array of 1 or 2 objects where each object has keys that are metaboliteIDrsquos and values that are data points (numbers)
set_gene_data(data clear_gene_reaction_rules)
Arguments
bull data (array) ndash An array of 1 or 2 objects where each object has keys that are gene IDrsquosand values that are data points (numbers)
Arguments
bull clear_gene_reaction_rules (Boolean) ndash (Optional Default false) In addi-tion to setting the data also turn of the gene_reaction_rules
78 JavaScript API 43
Escher Documentation Release 143
79 Python API
class escherBuilder(map_name=None map_json=None model=None model_name=Nonemodel_json=None embedded_css=None reaction_data=None metabo-lite_data=None gene_data=None local_host=None id=None safe=Falsekwargs)
A metabolic map that can be viewed edited and used to visualize data
This map will also show metabolic fluxes passed in during consruction It can be viewed as a standalone htmlinside a browswer Alternately the respresentation inside an IPython notebook will also display the map
Maps are stored in json files and are stored in a cache directory Maps which are not found will be downloadedfrom a map repository if found
Parameters
bull map_name ndash A string specifying a map to be downloaded from the Escher web server orloaded from the cache
bull map_json ndash A JSON string or a file path to a JSON file or a URL specifying a JSON fileto be downloaded
bull model ndash A Cobra model
bull model_name ndash A string specifying a model to be downloaded from the Escher web serveror loaded from the cache
bull model_json ndash A JSON string or a file path to a JSON file or a URL specifying a JSONfile to be downloaded
bull embedded_css ndash The CSS (as a string) to be embedded with the Escher SVG
bull reaction_data ndash A dictionary with keys that correspond to reaction ids and values thatwill be mapped to reaction arrows and labels
bull metabolite_data ndash A dictionary with keys that correspond to metabolite ids and valuesthat will be mapped to metabolite nodes and labels
bull gene_data ndash A dictionary with keys that correspond to gene ids and values that will bemapped to corresponding reactions
bull local_host ndash A hostname that will be used for any local files This is generally usedfor using the notebook offline and for testing in the IPython Notebook with modified Eschercode An example value for local_host is lsquohttplocalhost7778lsquo
bull id ndash Specify an id to make the javascript data definitions unique A random id is chosen bydefault
bull safe ndash If True then loading files from the filesytem is not allowed This is to ensure thesafety of using Builder within a web server
Keyword Arguments
These are defined in the Javascript API
bulluse_3d_transform
bullenable_search
bullfill_screen
bullzoom_to_element
bullfull_screen_button
44 Chapter 7 Contents
Escher Documentation Release 143
bullstarting_reaction
bullunique_map_id
bullprimary_metabolite_radius
bullsecondary_metabolite_radius
bullmarker_radius
bullgene_font_size
bullhide_secondary_metabolites
bullshow_gene_reaction_rules
bullhide_all_labels
bullreaction_styles
bullreaction_compare_style
bullreaction_scale
bullreaction_no_data_color
bullreaction_no_data_size
bulland_method_in_gene_reaction_rule
bullmetabolite_styles
bullmetabolite_compare_style
bullmetabolite_scale
bullmetabolite_no_data_color
bullmetabolite_no_data_size
bullidentifiers_on_map
bullhighlight_missing
bullallow_building_duplicate_reactions
bullcofactors
All keyword arguments can also be set on an existing Builder object using setter functions eg
my_builderset_reaction_styles(new_styles)
display_in_browser(ip=lsquo127001rsquo port=7655 n_retries=50 js_source=rsquowebrsquo menu=rsquoallrsquoscroll_behavior=rsquopanrsquo enable_editing=True enable_keys=True mini-fied_js=True never_ask_before_quit=False)
Launch a web browser to view the map
Parameters
bull ip ndash The IP address to serve the map on
bull port ndash The port to serve the map on If specified the port is occupied then a random freeport will be used
bull n_retries (int) ndash The number of times the server will try to find a port before quitting
bull js_source (string) ndash Can be one of the following
ndash web (Default) - Use JavaScript files from eschergithubio
79 Python API 45
Escher Documentation Release 143
ndash local - Use compiled JavaScript files in the local Escher installation Works offline
ndash dev - No longer necessary with source maps This now gives the same behavior aslsquolocalrsquo
bull menu (string) ndash Menu bar options include
ndash none - No menu or buttons
ndash zoom - Just zoom buttons
ndash all (Default) - Menu and button bar (requires Bootstrap)
bull scroll_behavior (string) ndash Scroll behavior options
ndash pan - Pan the map
ndash zoom - Zoom the map
ndash none (Default) - No scroll events
bull enable_editing (Boolean) ndash Enable the map editing modes
bull enable_keys (Boolean) ndash Enable keyboard shortcuts
bull minified_js (Boolean) ndash If True use the minified version of JavaScript and CSSfiles
bull never_ask_before_quit (Boolean) ndash Never display an alert asking if you wantto leave the page By default this message is displayed if enable_editing is True
display_in_notebook(js_source=rsquowebrsquo menu=rsquozoomrsquo scroll_behavior=rsquononersquo mini-fied_js=True height=500 enable_editing=False)
Embed the Map within the current IPython Notebook
Parameters
bull js_source (string) ndash Can be one of the following
ndash web (Default) - Use JavaScript files from eschergithubio
ndash local - Use compiled JavaScript files in the local Escher installation Works offline
ndash dev - No longer necessary with source maps This now gives the same behav-ior as lsquolocalrsquo
bull menu (string) ndash Menu bar options include
ndash none - No menu or buttons
ndash zoom - Just zoom buttons
ndash Note The all menu option does not work in an IPython notebook
bull scroll_behavior (string) ndash Scroll behavior options
ndash pan - Pan the map
ndash zoom - Zoom the map
ndash none - (Default) No scroll events
bull minified_js (Boolean) ndash If True use the minified version of JavaScript andCSS files
bull height ndash Height of the HTML container
bull enable_editing (Boolean) ndash Enable the map editing modes
46 Chapter 7 Contents
Escher Documentation Release 143
save_html(filepath=None overwrite=False js_source=rsquowebrsquo protocol=rsquohttpsrsquo menu=rsquoallrsquoscroll_behavior=rsquopanrsquo enable_editing=True enable_keys=True minified_js=Truenever_ask_before_quit=False static_site_index_json=None)
Save an HTML file containing the map
Parameters
bull filepath (string) ndash The HTML file will be saved to this location Whenjs_source is lsquolocalrsquo then a new directory will be created with this name
bull overwrite (Boolean) ndash Overwrite existing files
bull js_source (string) ndash Can be one of the following
ndash web (Default) - Use JavaScript files from eschergithubio
ndash local - Use compiled JavaScript files in the local Escher installation Works of-fline To make the dependencies available to the downloaded file a new directorywill be made with the name specified by filepath
ndash dev - No longer necessary with source maps This now gives the same behav-ior as lsquolocalrsquo
bull protocol (string) ndash The protocol can be lsquohttprsquo lsquohttpsrsquo or None which indicatesa lsquoprotocol relative URLrsquo as in eschergithubio Ignored if source is local
bull menu (string) ndash Menu bar options include
ndash none - No menu or buttons
ndash zoom - Just zoom buttons
ndash all (Default) - Menu and button bar (requires Bootstrap)
bull scroll_behavior (string) ndash Scroll behavior options
ndash pan - Pan the map
ndash zoom - Zoom the map
ndash none (Default) - No scroll events
bull enable_editing (Boolean) ndash Enable the map editing modes
bull enable_keys (Boolean) ndash Enable keyboard shortcuts
bull minified_js (Boolean) ndash If True use the minified version of JavaScript andCSS files
bull height (number) ndash Height of the HTML container
bull never_ask_before_quit (Boolean) ndash Never display an alert asking if youwant to leave the page By default this message is displayed if enable_editing isTrue
bull static_site_index_json (string) ndash The index as a JSON string for thestatic site Use javascript to parse the URL options Used for generating static pages(see static_sitepy)
791 Cache
escherget_cache_dir(versioned=True name=None)Get the cache dir as a string and make the directory if it does not already exist
Parameters
79 Python API 47
Escher Documentation Release 143
bull versioned (Boolean) ndash Whether to return the versioned path in the cache Eschermaps for the latest version of Escher are found in the versioned directory (versioned= True) but maps for previous versions of Escher can be found by visiting the parentdirectory (versioned = False)
bull name (string) ndash An optional subdirectory within the cache If versioned is False thenname is ignored
escherclear_cache(different_cache_dir=None ask=True)Empty the contents of the cache directory including all versions of all maps and models
Parameters
bull different_cache_dir (string) ndash (Optional) The directory of another cacheThis is mainly for testing
bull ask (Boolean) ndash Whether to ask before deleting
escherlist_cached_maps()Return a list of all cached maps
escherlist_cached_models()Return a list of all cached models
escherlist_available_maps()Return a list of all maps available on the server
escherlist_available_models()Return a list of all models available on the server
710 License
Escher and EscherConverter are distributed under the MIT license
bull genindex
48 Chapter 7 Contents
Python Module Index
eescher 44
49
Escher Documentation Release 143
50 Python Module Index
Index
Bbrush_mode() (built-in function) 43build_mode() (built-in function) 43Builder (class in escher) 44
Cclear_cache() (in module escher) 48
Ddisplay_in_browser() (escherBuilder method) 45display_in_notebook() (escherBuilder method) 46
Eescher (module) 44escherBuilder() (class) 39
Gget_cache_dir() (in module escher) 47
Llist_available_maps() (in module escher) 48list_available_models() (in module escher) 48list_cached_maps() (in module escher) 48list_cached_models() (in module escher) 48load_map() (built-in function) 42load_model() (built-in function) 43
Ooptionenable_keys (option attribute) 40optionsallow_building_duplicate_reactions (options at-
tribute) 42optionsand_method_in_gene_reaction_rule (options at-
tribute) 41optionscofactors (options attribute) 42optionsenable_editing (options attribute) 39optionsenable_search (options attribute) 40optionsfill_screen (options attribute) 40optionsfirst_load_callback (options attribute) 42optionsfull_screen_button (options attribute) 40optionsgene_data (options attribute) 41
optionsgene_font_size (options attribute) 40optionshide_all_labels (options attribute) 40optionshide_secondary_metabolites (options attribute)
40optionshighlight_missing (options attribute) 42optionsidentifiers_on_map (options attribute) 42optionsignore_bootstrap (options attribute) 40optionsmarker_radius (options attribute) 40optionsmenu (options attribute) 39optionsmetabolite_compare_style (options attribute) 42optionsmetabolite_data (options attribute) 42optionsmetabolite_no_data_color (options attribute) 42optionsmetabolite_no_data_size (options attribute) 42optionsmetabolite_scale (options attribute) 42optionsmetabolite_styles (options attribute) 42optionsnever_ask_before_quit (options attribute) 40optionsprimary_metabolite_radius (options attribute) 40optionsreaction_compare_style (options attribute) 41optionsreaction_data (options attribute) 40optionsreaction_no_data_color (options attribute) 41optionsreaction_no_data_size (options attribute) 41optionsreaction_scale (options attribute) 41optionsreaction_styles (options attribute) 41optionsscroll_behavior (options attribute) 39optionssecondary_metabolite_radius (options attribute)
40optionsshow_gene_reaction_rules (options attribute) 40optionsstarting_reaction (options attribute) 40optionsunique_map_id (options attribute) 40optionsuse_3d_transform (options attribute) 39
Rrotate_mode() (built-in function) 43
Ssave_html() (escherBuilder method) 46set_gene_data() (built-in function) 43set_metabolite_data() (built-in function) 43set_reaction_data() (built-in function) 43
51
Escher Documentation Release 143
Ttext_mode() (built-in function) 43
Vview_mode() (built-in function) 43
Zzoom_mode() (built-in function) 43
52 Index

Escher Documentation Release 143
4 Chapter 1 Escher in 3 minutes
CHAPTER 2
Help I just upgraded to v12 and my map and model caches areempty
Starting with Escher v12 the maps and models available from the Escher website are versioned Each time youupgrade Escher you will have access to the new versions of the Escher maps and models Any maps and models youwere using before are still saved in the Escher cache in case you need them For more details on finding managingand clearing the cache see the Python cache functions
Also starting with Escher v12 the maps and models in Escher are the same as those in the BiGG Database
5
Escher Documentation Release 143
6 Chapter 2 Help I just upgraded to v12 and my map and model caches are empty
CHAPTER 3
Features
1 View pathway maps in any modern web browser
2 Build maps using the content of genome-scale metabolic models
3 Visualize data on reactions genes and metabolites
4 Full text search
5 Detailed options for changing colors sizes and more all from the web browser
6 View maps inside the IPython Notebook
7 Embed maps within any website with minimal dependencies (escherjs d3js and optionally Twitter Bootstrap)
7
Escher Documentation Release 143
8 Chapter 3 Features
CHAPTER 4
Supported browsers
We recommend using Google Chrome for optimal performance but Escher will also run in the latest versions ofFirefox Internet Explorer and Safari (including mobile Safari)
9
Escher Documentation Release 143
10 Chapter 4 Supported browsers
CHAPTER 5
Installation
Escher can be used without any installation by visiting the Escher website However you can install escher if youwould like to (1) run Escher offline (2) include your own maps and models in the launch page (3) view Escher mapsin an IPython Notebook or (4) modify the source code
To install the latest stable version of Escher run
pip install escher
For more information see the documentation on Run Escher locally and in IPython and Developing with Escher
11
Escher Documentation Release 143
12 Chapter 5 Installation
CHAPTER 6
Citing Escher
You can help support Escher by citing our publication when you use Escher or EscherConverter
Zachary A King Andreas Draumlger Ali Ebrahim Nikolaus Sonnenschein Nathan E Lewis and Bernhard O Pals-son (2015) Escher A web application for building sharing and embedding data-rich visualizations of biologicalpathways PLOS Computational Biology 11(8) e1004321 doi101371journalpcbi1004321
13
Escher Documentation Release 143
14 Chapter 6 Citing Escher
CHAPTER 7
Contents
71 Getting started
711 Introduction
Escher is here to help you visualize pathway maps But if you have never heard of a pathway map you mightappreciate a quick introduction
What are pathway maps
To understand pathway maps it is useful to think about the general organization of a cell At the smallest levelmolecules in a cell are arranged in three-dimensional structures and these structures determine many of the functionsthat take place in a cell For example the 3D structure of an enzyme determines the biochemical reactions that it cancatalyze These structures can be visualized in 3D using tools like Jmol (as in this example structure)
The DNA sequence is a second fundamental level of biological organization DNA sequences are the blueprints for allthe machinery of the cell and they can be visualized as a one-dimensional series of bases (ATCG) using tools like theUCSC genome browser
To use a football analogy the 3D molecular structures are akin to the players on the field and the information in theDNA sequence is like the playbook on the sidelines But football would not be very interesting if the players nevertook to the field and executed those plays So we are missing this level of detail the execution of biological plans bythe molecular players
What we are missing is the biochemical reaction network Proteins in the cell catalyze the conversion of substratemolecules into product molecules and these reactions are responsible for generating energy constructing cellularmachinery and structures detecting molecules in the environment signaling and more Biochemical reactions canbe grouped into pathways when they work in concert to carry out a function (If a reaction is a football play thenthe pathway is a drive) And Escher can be used to visualize these reactions and pathways Together we call thesevisualizations pathway maps
Escher to the rescue
Many Escher maps represent metabolic pathways and Escher was developed at the Systems Biology Research Groupwhere we have been building genome-scale models of metabolism over the past fifteen years However Escher is notlimited to metabolism It can be used to visualize any collection of biochemical reactions
Escher includes one more killer feature The ability to visualize datasets on a pathway map Many biological discov-eries are enabled by collecting and analyzing enormous datsets and so biologists are grappling with the challenges ofbig data By visualizing data in the context of pathway maps we can quickly spot trends which would not be apparent
15
Escher Documentation Release 143
with standard statistical tools And Escher visualizations can be adapted and shared to demonstrate those biologicaldiscoveries
The rest of this guide will introduce the Escher user interface and the major features of Escher
712 The launch page
When you open the Escher website you will see a launch page that looks like this
The options on the launch page are
bull Filter by organism Choose an organism to filter the Maps and Models
bull Map Choose a pre-built map or start from scratch with an empty builder by choosing None In parenthesesnext to the map name you will see the name of the model that was used to build this map
bull Model (Optional) If you choose a COBRA model to load then you can add new reactions to the pathway mapYou can also load your own model later after you launch the tool For an explanation of maps models andCOBRA see Escher COBRA and COBRApy
bull Tool
ndash The Viewer allows you to pan and zoom the map and to visualize data for reactions genes and metabo-lites
ndash The Builder in addition to the Viewer features allows you to add reactions move and rotate existingreactions add text annotations and adjust the map canvas
bull Options
ndash Scroll to zoom (instead of scroll to pan) Determines the effect of using the mousersquos scroll wheel overthe map
ndash Never ask before reloading If this is checked then you will not be warned before leaving the page evenif you have unsaved changes
Choose Load map to open the Escher viewer or builder in a new tab and prepare to be delighted by your very ownpathway map
16 Chapter 7 Contents
Escher Documentation Release 143
713 The menu bar
Once you have loaded an Escher map you will see a menu bar along the top of the screen Click the question mark tobring up the Escher documentation
714 Loading and saving maps
Using the map menu you can load and save maps at any time
Click Save map JSON to save the Escher map as a JSON file which is the standard file representing an Escher map
NOTE The JSON file does NOT save any datasets you have loaded This may be changed in a future version ofEscher
NOTE 2 In Safari saving files from Escher works a little differently than in the other major browsers After clickingSave map JSON Safari will load a new tab with the raw content of the Escher map file To save the file chooseFilegtSave As from the Safari menu A new dialog appears in the dropdown menu near the bottom select PageSource (rather than Web Archive) give your file an appropriate name (eg mapjson for an Escher map or mapsvgfor an SVG export) and click Save
Later you can can load a JSON file to view and edit a map by clicking Load map JSON
Click Export as SVG to generate a SVG file for editing in tools like Adobe Illustrator and Inkscape This is thebest way to generate figures for presentations and publications Unlike a JSON file a SVG file maintains the datavisualizations on the Escher map However you cannot load SVG files into Escher after you generate them
Click Clear Map to empty the whole map leaving a blank canvas NOTE You cannot undo Clear Map
715 Loading models
Use the model menu to manage the COBRA model loaded in Escher
71 Getting started 17
Escher Documentation Release 143
Choose Load COBRA model JSON to open a COBRA model Read more about COBRA models in Escher COBRAand COBRApy Once you have COBRApy v030 or later installed then you can generate a JSON model by followingthis example code
Once you have loaded a COBRA model there may be inconsistencies between the content in the map and the model(eg reaction IDs descriptive names and gene reaction rules) You click Update names and gene reaction rulesusing model to find matching reactions and metabolites between the map and the model (based on their IDs) andthen apply the names and gene reaction rules from the model to the map The reactions that do not match will behighlighted in red (This can be turned off again in the settings menu by deselecting Highlight reactions not in model)More advice on building maps is available in Building and contributing maps
Click Clear Model to clear the current model
716 Loading reaction gene and metabolite data
Datasets can be loaded as CSV files or JSON files using the Data Menu
In Escher reaction and gene datasets are visualized by changing the color thickness and labels of reaction arrowsMetabolite datasets are visualized by changing the color size and labels of metabolite circles The specific visualstyles can be modified in the Settings menu When data is not present for a specific reaction gene or metabolite thenthe text label will say lsquondrsquo which means lsquono datarsquo
18 Chapter 7 Contents
Escher Documentation Release 143
The structure of a CSV file
CSV files should have 1 header row 1 ID column and either 1 or 2 columns for data values The ID column cancontain BiGG IDs or descriptive names for the reactions metabolites or genes in the dataset Here is an example witha single data value columns
IDtime 0secglc__D_c54g6p__D_c23
Which might look like this is Excel
ID time 0secglc__D_c 54g6p_c 23
If two datasets are provided then the Escher map will display the difference between the datasets In the Settings menuthe Comparison setting allows you to choose between comparison functions (Fold Change Log2(Fold Change) andDifference) With two datasets the CSV file looks like this
ID time 0sec time 5sglc__D_c 54 102g6p_c 23 81
Data can also be loaded from a JSON file This Python code snippet provides an example of generating the properformat for single reaction data values and for reaction data comparisons
import json
save a single flux vector as JSONflux_dictionary = glc__D_c 54 g6p_c 23with open(outjson w) as f
jsondump(flux_dictionary f)
save a flux comparison as JSON
71 Getting started 19
Escher Documentation Release 143
flux_comp = [glc__D_c 54 g6p_c 23 glc__D_c 102 g6p_c 81]with open(out_compjson w) as f
jsondump(flux_comp f)
Gene data and gene reaction rules
Escher uses gene reaction rules to connect gene data to the reactions on a metabolic pathway You can see these genereaction rules on the map by selecting Show gene reaction rules in the Settings menu
Gene reaction rules show the genes whose gene products are required to catalyze a reaction Gene are connected usingAND and OR rules AND rules are used when two genes are required for enzymatic activity eg they are membersof a protein complex OR rules are used when either gene can catalyze the enzymatic activity eg they are isozymes
With OR rules Escher will take the sum of the data values for each gene With AND rules Escher will either takethe mean (the default) or the minimum of the components The AND behavior (mean vs minimum) is defined in theSettings menu
717 Editing and building
The Edit menu gives you access to function for editing the map
20 Chapter 7 Contents
Escher Documentation Release 143
Escher has five major modes and you can switch between those modes using the buttons in the Edit menu or usingthe buttons in the button bar on the left of the screen
1 Pan mode Drag the canvas to pan the map You can also use the mouse scroll wheel or trackpad scroll function(drag with 2 fingers) to pan the map (or to zoom if you selected Scroll to zoom in the settings)
2 Select mode Select nodes by clicking on them Shift-click to select multiple nodes or drag across the canvasto select multiple nodes using the selection brush
3 Add reaction mode If you have loaded a Model then click on the canvas to see a list of reactions that you candraw on the map Click on a node to see reactions that connect to that node In the input box you can search byreaction ID metabolite ID or gene ID (locus tag)
4 Rotate model Before entering rotate mode be sure to select one or more nodes in select mode Then afterentering rotate mode drag anywhere on the canvas to rotate the selection You can also drag the red crosshairsto change the center of the rotation
5 Text mode Use text mode to add text annotations to the map Click on the canvas to add a new text annotationor click an existing annotation to edit it When you are finished click Enter or Escape to save the changes
71 Getting started 21
Escher Documentation Release 143
In addition to the editing modes the Edit menu gives you access to the following commands
bull Delete Delete the currently selected node(s)
bull Undo Undo the last action NOTE Certain actions such as editing the canvas cannot be undone in the currentversion of Escher
bull Redo Redo the last action that was undone
bull Toggle primarysecondary node In Escher each metabolite node is either a primary node or a secondarynode Primary nodes are larger and secondary nodes can be hidden in the Settings menu Use this command totoggle the currently selected node(s) between primary and secondary
bull Rotate reactant locations When you draw a new reaction in Escher this command will rotate the new reactantsso that a new reactant is primary and centered This command is extremely useful when you are drawing a longpathway and you want to quickly switch which metabolite to ldquofollowrdquo eg make sure you are following thecarbon-containing metabolites
If you are confused then try drawing a new pathway and hitting the ldquocrdquo key to see the reactants rotate
bull Select all Select all nodes
bull Select none Unselect all nodes
bull Invert selection Select all the nodes that are currently unselected This feature is very useful when you wantto keep just one part of the map Simply drag to select the part you want to keep call the Invert selectioncommand then call the Delete command
718 Editing the canvas
A somewhat non-obvious feature of Escher is that you can edit the canvas by dragging the canvas edges This ispossible in Pan mode and Select mode
22 Chapter 7 Contents
Escher Documentation Release 143
719 View options
bull Zoom in Zoom in to the map
bull Zoom out Zoom out of the map
bull Zoom to nodes Zoom to see all the nodes on the map
bull Zoom to canvas Zoom to see the entire canvas
bull Find Search for a reaction metabolite or gene on the map
bull Show control points Show the control points you can drag these red and blue circle to adjust the shapes ofthe reactions curves
bull Settings Open the Settings menu
7110 The button bar
The button bar give you quick access to many of the common Escher functions
71 Getting started 23
Escher Documentation Release 143
24 Chapter 7 Contents
Escher Documentation Release 143
7111 Settings
View and build options
bull Identifiers Choose whether to show BiGG IDs or descriptive names for reactions metabolites and genes
bull Hide secondary metabolites This will simplify the map by hiding all secondary metabolites and the pathsconnected to them
bull Show gene reaction rules Show the gene reaction rules below the reaction labels even gene data is not loaded
bull Hide reaction gene and metabolite labels Another option to visually simplify the map this will hide alllabels that are not text annotations
bull Allow duplicate reactions By default duplicate reactions are hidden in the add reaction dropdown menuHowever you can turn this option on to show the duplicate reactions
bull Highlight reactions not in model Highlight in red any reactions that are on the map but are not in the modelThis is useful when you are adapting a map from one model for use with another model
71 Getting started 25
Escher Documentation Release 143
Reaction data settings
When reaction or gene data is loaded this section can be used to change visual settings for reactions
The color bar has individual control points and you can drag the control points (execpt min and max) left and right tochange their values Alternatively you can use the dropdown menu (next to the word median in the figure above) toattach a control point to a statistical measure (mean median first quartile (Q1) or third quartile (Q3)) This lets youchoose a color scale that will adapt to your dataset
For each control point you can choose a color by entering a CSS-style color (eg red ff0000 rgba(20 20 255 05)and you can choose a size that will scale the thickness of reactions
There are also color and size options for reactions that do not have any data value
Finally there are a few onoff settings for the loaded reaction or gene dataset
bull Options These determine how to visualize the datasets Check Absolute value to color and size reactions bythe absolute value of each data value The Size Color and Text options can be unselected to turn off sizingcoloring and data values in reaction labels individually
bull Comparison Determines the comparison algorithm to use when two datasets are loaded
bull Method for evaluating AND Determines the method that will be used to reconcile AND statements in genereaction rules when there is gene data loaded See Gene data and gene reaction rules for more details
Metabolite data settings
The data settings for metabolite data are analagous to those for reaction data The only difference is that size nowrefers to the size of the metabolite circles
26 Chapter 7 Contents
Escher Documentation Release 143
72 Escher COBRA and COBRApy
Escher can be used as an independent application but it draws heavily on the information in COBRA models ACOBRA model is a collection of all the reactions metabolites and genes known to exist in an organism (In theliterature these are generally called genome-scale models (GEMs) but we refer to them as COBRA models here toemphasize that Escher interoperates with models that are exported from COBRApy)
By loading a COBRA model into the Escher interface you have access to every reaction and metabolite in that modelYou also have the gene reaction rules for the reactions in the network which allow you to connect gene data toreactions and metabolites
COBRApy is a software package for COBRA modeling written in Python The Escher Python package uses CO-BRApy package for reading and writing COBRA models
721 Maps and models
In Escher you will see references to maps and models
A map contains the reactions and metabolites that you see in the Escher builder including their locations text annota-tions and the canvas
A model (a COBRA model) contains reactions and metabolites that you have not drawn yet Thus you can load aCOBRA model when you want to draw new reactions on the map
722 What is JSON and why do we use it
Both Escher maps and COBRA models are stored as JSON files JSON is a useful plain-text format for storing nesteddata structures We use JSON much like the SBML community uses XML You may notice that SBML files have axml extension and Escher maps and COBRA models have a json extension
You can use Python to explore a JSON file like this
import json
with open(mapjson r) as fmap_object = jsonload(f)
print map_object[0]print map_object[1][reactions]values()[0]
723 Escher SBML and SBGN
A tool has been developed for converting Escher maps to SBML Layout and SBGN and it will be released soon
COBRA models can be converted to SBML using COBRApy
73 Run Escher locally and in IPython
To run Escher on a local computer or to use Escher in PythonIPython first install it The Python package for Eschercan be installed using pip
pip install escher
72 Escher COBRA and COBRApy 27
Escher Documentation Release 143
Depending on your installation of Python you may need sudo
sudo pip install escher
Alternatively one can download the source files and install the package directly
python setuppy install
731 Escher in the IPython Notebook
Once you have installed Escher locally you can interact with Escher maps in an IPython Notebook
Here are example notebooks to get started with
bull COBRApy and Escher
bull JavaScript development and offline maps
bull Generate JSON models in COBRApy
Dependencies
bull Jinja2
bull Tornado
bull COBRApy 030 or later
732 Running the local server
You can run your own local server if you want to use Escher offline or explore your own maps with the homepagebrowser To get started install the Python package and run from any directory by calling
python -m escherserver
This starts a server at httplocalhost7778 You can also choose another port
python -m escherserver --port=8005
74 Validate and convert maps
741 Validate an Escher map
Escher maps follow a specification using the JSON Schema format Therefore any JSON Schema validator can beused to validate an Escher map by comparing it to the latest schema file For example the current schema is locatedhere
httpsgithubcomzakandrewkingescherblobmasterescherjsonschema1-0-0
To make this easier the Escher Python package includes a validation script To validate a map first install Escher
pip install escher
Then call the validator
python -m eschervalidate my_mapjson
Any errors in the map will print to the console
28 Chapter 7 Contents
Escher Documentation Release 143
742 Convert or upgrade an Escher map
Any Escher maps built with pre-release versions of Escher will not load right away in the stable v10 release Toconvert pre-release maps to the new format follow these steps
1 Install Escher
pip install escher
2 Find a COBRA model for your maps This COBRA model will be used to update the content of the mapin order to support all the new Escher features You can use a COBRA model encoded as SBML or JSON(generated with COBRApy v030b4 or later) The COBRA models currently available on the Escher websitecan be downloaded from the BiGG Models website
httpbiggucsdedu
For a refresher on the distinction between Escher maps COBRA models and their file types (SBML JSONSBML Layout) see Escher COBRA and COBRApy
3 Run the convert_map script to convert your existing Escher map (my_old_mapjson) to the new formatusing a COBRA model (model_filejson or model_filexml in these examples)
With a JSON file modelpython -m escherconvert_map my_old_mapjson pathtomodel_filejson
With an SBML modelpython -m escherconvert_map my_old_mapjson pathtomodel_filexml
Those commands will generate a new map called my_old_map_convertedjson that will load in Escher v10and later
75 Building and contributing maps
We are excited to collect pathway maps for every organism with a well characterized metabolic network This sectiondescribes the process of building a new map either from scratch or using a COBRA model with BiGG IDs
751 Building from scratch
To build a map from scratch you will first need a COBRA model for your map See the section Escher COBRA andCOBRApy for some background information on COBRA models
If you would like to eventually contribute your map to the Escher website it is important that your COBRA modeladheres to the identifiers in the BiGG Database Escher and BiGG are being developed together and we want tomaintain consistency and interoperability between them
Once you have a COBRA model you can follow these steps
1 Load your model in the Escher Builder
2 Begin building new reactions If you are familiar with the genes in your organism then try search for newreactions by their gene IDs
3 Limit each map to ~200 reactions Maps larger than this will slow down the Escher viewer especially on oldbrowsers Rather than building one giant map Escher is designed for building many smaller subsystem maps
4 When you have built a map for your a subsystem save the map as JSON with a name that includes the modelID followed by a period followed by the name of the subsystem For example
75 Building and contributing maps 29
Escher Documentation Release 143
iMM904Amino acid biosynthesisjson
5 (Optional) Once you have a set of subsystem maps you can set up a local Escher server so that subsystem mapsappear in the ldquoquick jumprdquo menu in the bottom right corner of the screen (as seen here for iJO1366) To setthis up you will need to start a local server as describe in Running the local server Next find your local cachedirectory by running this command in a terminal
python -c import escher print(escherget_cache_dir(name=maps))
This will print the location of the local maps cache Add your new subsystem maps to cache folder Now whenyou run the server (described in Running the local server) you should see that quick jump menu appear
NOTE The cache directory is organized into folders for organisms You can use these folder for filtering byorganism on the local launch page or you can place the maps in the top directory
NOTE 2 A similar approach can be used to access your models from the local launch page Place maps in thefolder indicated by
python -c import escher print(escherget_cache_dir(name=models))
752 Building from an existing map for a similar organism
Follow the instruction above except rather than starting from scratch load an existing Escher map for a differentorganism
Once you have the new model loaded use the Update names and gene reaction rules using model button in theModel menu to convert all descriptive names and gene reaction rules in the model to those in the map Reactions thatdo not match the model will be highlighted in red (This can be turned off again in the settings menu by deselectingHighlight reactions not in model)
Now visit each highlighted reaction and see if you can replace it with an equivalent biochemical pathway from themodel If not then delete the reaction and move on
Finally when there are no highlighted reactions left you can repeat this for other subsystems
753 Submitting maps to the Escher website
If you would like to contribute maps to Escher you can make a Pull Request to the GitHub repository eschergithubioMake sure there is a folder with the name of the organism in 1-0-0maps For example a new yeast map goes inthe folder
1-0-0mapsSaccharomyces cerevisiae
Then name your map by concatenating the model ID and the map name separated by a period For example a yeastmap built with the genome-scale model iMM904 could be named
iMM904Amino acid biosynthesisjson
Then add the JSON file for the model to the Pull Request if that model is not already available As before make afolder for your organism within 1-0-0models The model filename is just the model ID
In this example a correct Pull Request would include the following files
1-0-0mapsSaccharomyces cerevisiaeiMM904Amino acid biosynthesisjson1-0-0modelsSaccharomyces cerevisiaeiMM904json
30 Chapter 7 Contents
Escher Documentation Release 143
76 Developing with Escher
761 Using the static JavaScript and CSS files
You can include the compiled Escher JavaScript and CSS files in any HTML document The only dependencies ared3js and optionally Twitter Bootstrap if you are using the option menu=rsquoallrsquo
The compiled files are available form npmcdn
httpsnpmcdncomescher-visjsdistescherjshttpsnpmcdncomescher-visjsdistescherminjshttpsnpmcdncomescher-viscssdistbuildercsshttpsnpmcdncomescher-viscssdistbuildermincss
Source maps are also hosted there
httpsnpmcdncomescher-visjsdistescherjsmaphttpsnpmcdncomescher-visjsdistescherminjsmaphttpsnpmcdncomescher-viscssdistbuildermincssmap
If you want a particular version of escher add a version tag like this
httpsnpmcdncomescher-vis140-beta3jsdistescherjs
For an example of the boilerplate code that is required to begin developing with Escher have a look at the escher-demorepository For projects built with npm use the escher-test repository as a guide
762 Building and testing Escher
First install dependencies with npm
npm install
Escher uses grunt to manage the build process To run typical build steps just run
npm run compile
To test the JavaScript files run
npm run test
For Python testing run this in the py directory
python setuppy test
Build the static website
python setuppy build_gh
Clear static website files
python setuppy clean
Build and run the docs
cd docsmake htmlcd _buildhtml
76 Developing with Escher 31
Escher Documentation Release 143
python -m SimpleHTTPServer python 2python -m httpserver python 3
763 Generating and reading Escher and COBRA files
The Escher file format
Escher layouts are defined by JSON files that follow a specific schema using json schema The latest schemafor Escher JSON files is here The Escher schemas are versioned with inspiration from SchemaVer Theeschervalidate module can be used to validate models against the schema
The Escher layout schema is designed to be as simple as possible For example the core metabolism map of Es-cherichia coli is layed out like this
[
map_name E coli coreCore metabolismmap_id 2938hoq32a1map_description E coli core metabolic networknLast Modified Fri Dec 05 2014 163944 GMT-0800 (PST)homepage httpseschergithubioschema httpseschergithubioescherjsonschema1-0-0
reactions nodes text_label canvas
x 7857062530517567y 31436893920898433width 5894515691375733height 4860457037353515
]
The map_name includes the model that was used to build this layout followed by a period and then a readable namefor the map The map_id is a unique identifier for this map The map_description describes the map and thelast time it was modified Both the homepage and the schema entries must have exactly these values for the Eschermap to be valid
In the next section the reactions nodes labels and canvas are all defined For reactions nodes and text labels eachelement has a key that is an arbitrary integer As long as there are no repeated IDs (eg no 2 segments with the ID517) then everything should work fine
Read through the schema (here) for more detail on the format
The COBRA file format
COBRA models are also saved as JSON files This format has not been documented with a schema but you canbrowse through the core metabolism model as a guide to generating valid COBRA models
I still need help
If you are interested in developing with Escher and you need more information than what is provided in the documen-tation please contact Zachary King (zaking-AT-ucsd-DOT-edu)
32 Chapter 7 Contents
Escher Documentation Release 143
77 EscherConverter
EscherConverter is a standalone program that reads files created with the graphical network editor Escher and convertsthem to files in community standard formats
Download EscherConverter 05 (137 MB)
771 Using EscherConverter
Escher uses a JSON file format to represent its networks This format has been developed because of its very small filesize and its compatibility to online programs that are written in JavaScript In particular JSON is a JavaScript ObjectNotation or in other words a JSON file directly represents components of JavaScript programs This makes parsingvery simple and allows direct use of those files in web-based programs
However in systems biology specific file formats have been developed with the aim to be easily exchangeable betweensoftware implemented in diverse programming languages
To this end these formats support semantically clear annotations and are maintained by a large community of scientistsEscherConverter supports export to two particularly important XML-based community file formats SBML with layoutextension and SBGN-ML
While SBML has been mainly developed for dynamic simulation of biological networks it is nowadays also usablefor diverse other purposes Its layout extension facilitates the encoding the display of biological networks
SBGN-ML has been directly developed as a language for the display of biological pathway maps of diverse kinds Itstores the position and connection of entities similar to what is shown in Escher networks
EscherConverter takes Escherrsquos JSON files as input and generates equivalent SBML Level 3 Version 1 files with layoutextension or SBGN-ML files
In order to ensure that the conversion is correct EscherConverter provides its own display that gives users a previewof how the export data format will be rendered by other tools In this preview display you can zoom in and out movearcs and node positions However it is important to know that none of the changes made in this preview are stored inthe export file
Download and Installation
You can obtain local copy of EscherConverter by clicking here
As a Javatrade application no specific installation is required for EscherConverter
However make sure you have a recent Javatrade Runtime Environment (JRE) installed on your computer (at least JRE8) You can obtain Javatrade from the Oracle website There you can also find installation instructions for your respectiveoperating system
Once Javatrade has been installed you can simply place the EscherConverter JAR file somewhere on your local computerfor instance in the folder
bull Applications if you are working under Mac OS
77 EscherConverter 33
Escher Documentation Release 143
bull opt for Linux computers
bull CProgram Files if you are using Windows
Launching the program
You can launch EscherConverter simply by double-clicking on the application JAR file This will open a followinggraphical user interface as described in the following figures
Figure 1 | The graphical user interface of EscherConverter
bull Preferences opens a settings dialog (see next screenshot)
bull Open displays a file chooser to select an input file in JSON format
bull Save export the map that is displayed in the current tab to SBML or SBGN-ML
bull Discard closes the current tab without saving
bull Help opens the online help that displays all command-line options
bull License displays the license under which this software is distributed
bull About shows information about the authors of this software
bull Main the main panel of the software in which converted Escher maps will be displayed organized in tabs
bull Status the status bar shows information and logging messages during the conversion
34 Chapter 7 Contents
Escher Documentation Release 143
Figure 2 | The preferences dialog All settings in this dialog are also available through EscherConverterrsquos command-line interface
Layout section several properties that are required in SBML and SBGN-ML are not explicitly specified in EscherrsquosJSON format and therefore need to be adjusted by the user These are the size of the drawing canvas the default boxsize for text labels the size of primary and secondary nodes In contrast to SBGN-ML and Escherrsquos JSON formatthe SBML layout extension supports three-dimensional displays When selecting this export file format it is thereforenecessary to also define the z-coordinate and the depth of all objects
Components and naming section Most settings in this section are specific for the SBML layout extension and areonly active if this output format is selected These are names and identifiers of the layout component and the in caseof SBML mandatory default compartment (a compartment without physical meaning a reaction space in which allmetabolites are located) EscherConverter can infer compartment bounds from metabolites but this is an experimentalfeature Just try it and see how the preview changes
77 EscherConverter 35
Escher Documentation Release 143
Figure 3 | A layout preview
The birds-eye view and the navigation component on the left help you navigate through the network display Thisgraph shows you how the converted pathway map will be rendered by software that supports SBGN-ML or the SBMLlayout extension This preview can be modified by moving arcs or nodes however none of those changes are storedwhen exporting the file In this current version EscherConver only exports layouts as given in the original JSON file
Included third-party software
EscherConverter includes several third-party libraries which we here list and acknowledge
bull ArgParser
bull JSBML
bull libSBGN
bull Pixel-Mixer icons
bull yFiles
772 Command-line interface API
You can launch EscherConverter from the command-line On a Unix system (such as Linux MacOS or Solaris etc)use a command like
bash$ java -jar -Xms8G -Xmx8G -Duserlanguage=en EscherConverter-05jar [options]
Under Window use a command like
Cgt javaw -jar -Xms8G -Xmx8G -Duserlanguage=en EscherConverter-05jar [options]
Escher has a large collection of command-line options (see below) which can be useful if you want to launch theprogram with specific settings or if multiple files are to be converted in a batch mode It is even possible to completelydisable the graphical user interface
36 Chapter 7 Contents
Escher Documentation Release 143
Input and output files
Definition of input and output data files as well as the format for the output
--input=ltFilegt
Specifies the JSON input file If a directory is given the conversion will be recursively performed Accepts JSON
--output=ltFilegt
The path to the file into which the output should be written If the input is a directory this must also be a directory inorder to perform a recursive conversion Accepts SBML SBGN
Escher layout
The options in this group allow you to influence how large certain elements should be displayed
--canvas-default-height=ltDoublegt
Just as in the case of the width of the canvas this value needs to be specified for cases where the JSON input file lacksan explicit specification of the canvas height Arguments must fit into the range [11E9] (Default value 2500)
--canvas-default-width=ltDoublegt
This value is used when no width has been defined for the canvas Since the width attribute is mandatory for the layouta default value must be provided in these cases Arguments must fit into the range [11E9] (Default value 2500)
--label-height=ltDoublegt
With this option you can specify the height of the bounding box of text labels Arguments must fit into the range[11E9] (Default value 500)
--label-width=ltDoublegt
This option defines the width of bounding boxes for text labels Arguments must fit into the range [11E9] (Defaultvalue 1600)
--node-depth=ltDoublegt
The length of nodes along z-coordinate Escher maps are actually two-dimensional but in general a layout can bethree-dimensional This value should be an arbitrary value greater than zero because some rendering engines mightnot display the node if its depth is zero Arguments must fit into the range [11E9] (Default value 10)
--node-label-height=ltDoublegt
Node labels can have a size different from general labels in the graph Here you can specify how height the boundingbox of the labels for nodes should be Arguments must fit into the range [11E9] (Default value 200)
--primary-node-height=ltDoublegt
The primary node should be bigger than the secondary node With this option you can specify the height of this typeof nodes Arguments must fit into the range [11E9] (Default value 300)
--primary-node-width=ltDoublegt
Escher maps distinguish between primary and secondary nodes Primary nodes should be larger than secondary nodesand display the main flow of matter through the network This option allows you to specify the width of primarynodes Arguments must fit into the range [11E9] (Default value 300)
77 EscherConverter 37
Escher Documentation Release 143
--reaction-label-height=ltDoublegt
Reaction label heightArguments must fit into the range [11E9] (Default value 300)
--reaction-node-ratio=ltDoublegt
This value is used as a conversion factor to determine the size of the reaction display box depending on the size ofprimary nodes Height and width of reaction nodes are determined by dividing the corresponding values from theprimary node size by this factor Arguments must fit into the range [01] (Default value 05)
--secondary-node-ratio=ltDoublegt
Similar to the reaction node ratio the size of secondary nodes (width and height) is determined by dividing thecorresponding values from the primary nodes by this value Arguments must fit into the range [01] (Default value06666666666666666)
--z=ltDoublegt
The position on the z-axis where the entire two-dimensional graph should be drawn Arguments must fit into the range[-1E91E9] (Default value 00)
Escher Components and their naming
Here you can influence which elements are to be included in the layout and how elements in the layout are to be calledor identified
--format=ltOutputFormatgt
The desired format for the conversion eg SBML All possible values for type ltOutputFormatgt are SBGN andSBML (Default value SBML)
--layout-id=ltStringgt
In contrast to the name this identifier does not have to be human-readable This is a machine identifier which muststart with a letter or underscore and can only contain ASCII characters (Default value Escher_Layout)
--layout-name=ltStringgt
This should be a human-readable name for the layout that is to be created This name might be displayed to describethe figure and should therefore be explanatory (Default value Escher Layout)
--compartment-id=ltStringgt
A compartment needs to have a unique identifier which needs to be a machine-readable Sting that must start with aletter or underscore and can only contain ASCII characters Since the JSON file does not provide this information thisoption allows you to specify the required identifier (Default value default)
--compartment-name=ltStringgt
With this option it is possible to define a name for the default compartment can be that needs to be generated for theconversion to SBML The name does not have any restrictions ie any UTF-8 character can be used (Default valueDefault compartment)
--infer-compartment-bounds
This converter can infer where the boundaries of compartments could be drawn To this end it uses each nodersquos BiGGids to identify the compartment of all metabolites Assuming that compartments have rectangular shapes the algorithmcan find the outermost node on each side of the box and hence obtain the boundaries of the compartment However
38 Chapter 7 Contents
Escher Documentation Release 143
this methods will fail when metabolites are drawn inside of such a box that belong to a different compartment that isactually further outside For this reason this option is deactivated by default (Default value false)
Options for the graphical user interface
--gui
If this option is given the program will display its graphical user interface (Default value false)
--log-level=ltStringgt
Change the log-level of this application This option will influence how fine-grained error and other log messages willbe that you receive while executing this program All possible values for type ltStringgt are ALL CONFIG FINEFINER FINEST INFO OFF SEVERE and WARNING (Default value INFO)
--log-file=ltFilegt
This option allows you to specify a log file to which all information of the program will be written Accepts (bp2bp3 log owl xml)
78 JavaScript API
class escherBuilder(map_data model_data embedded_css selection options)A Builder object contains all the UI and logic to generate a map builder or viewer
Arguments
bull map_data (object) ndash The data for a map to be passed to escherMapfrom_data() Ifnull then an empty Builder is initialized
bull model_data (object) ndash The data for a cobra model to be passed to es-cherCobraModel() Can be null
bull embedded_css (string) ndash The stylesheet for the SVG elements in the Escher map
bull selection (object) ndash (Optional Default In the body element) The d3 selection of anelement to place the Builder into The selection cannot be inside an SVG element
bull options (object) ndash (Optional) An object defining any of the following options
optionsmenu(Default rsquoallrsquo) The type of menu that will be displayed Can be lsquoallrsquo for the fullmenu or lsquozoomrsquo for just zoom buttons The lsquoallrsquo option requires the full set of Escherdependencies (D3js JQuery and Bootstrap) while the lsquozoomrsquo option requires only D3jsFor more details see Developing with Escher
optionsscroll_behavior(Default rsquopanrsquo) This option determines the effect that the scroll wheel will have onan Escher map Can be lsquopanrsquo to pan the map or lsquozoomrsquo to zoom the map when the usermoves the scroll wheel
optionsuse_3d_transform(Default Chooses a good option by testing the browser) If true then use CSS3 3D trans-forms to speed up panning and zooming This feature will only work on browsers thatsupport the 3D transforms It works best in the latest versions of Chrome Firefox andInternet Explorer Safari works better with this turned off
78 JavaScript API 39
Escher Documentation Release 143
optionsenable_editing(Default true) If true then display the map editing functions If false then hide themand only allow the user to view the map
optionenable_keys(Default true) If true then enable keyboard shortcuts
optionsenable_search(Default true) If true then enable indexing of the map for search Use false to disablesearching and potentially improve the map performance
optionsfill_screen(Default false) Use true to fill the screen when an Escher Builder is placed in a top-level container (eg a div in the body element)
optionsfull_screen_button(Default false) Include a button in the user interface for entering full screen mode
optionsignore_bootstrap(Default false) Do not use Bootstrap for buttons even if it available This is used toembed Escher in a Jupyter notebook where it conflicts with the Jupyter Boostrap installa-tion
Map model and styles
optionsstarting_reaction(Default null) The ID (as a string) of a reaction to draw when the Builder loads
optionsnever_ask_before_quit(Default false) If false then display a warning before the user closes an Eschermap If true then never display the warning This options is only respected if op-tionsenable_editing == true If enable_editing is false then the warnings are not dis-played
optionsunique_map_id(Default null) A unique ID that will be used to UI elements donrsquot interfere whenmultiple maps are in the same HTML document
optionsprimary_metabolite_radius(Default 15) The radius of primary metabolites in px
optionssecondary_metabolite_radius(Default 10) The radius of secondary metabolites in px
optionsmarker_radius(Default 5) The radius of marker nodes in px
optionsgene_font_size(Default 18) The font size of the gene reaction rules in px
optionshide_secondary_metabolites(Default false) If true then secondary nodes and segments are hidden This is conve-nient for generating simplified map figures
optionsshow_gene_reaction_rules(Default false) If true then show the gene reaction rules even without gene data
optionshide_all_labels(Default false) If checked hide all reaction gene and metabolite labels
Applied data
40 Chapter 7 Contents
Escher Documentation Release 143
optionsreaction_data(Default null) An object with reaction ids for keys and reaction data points for values
optionsreaction_stylesDefault [rsquocolorrsquo rsquosizersquo rsquotextrsquo]
An array of style types The array can contain any of the following lsquocolorrsquo lsquosizersquo lsquotextrsquolsquoabsrsquo The lsquocolorrsquo style means that the reactions will be colored according to the loadeddataset The lsquosizersquo style means that the reactions will be sized according to the loadeddataset The lsquotextrsquo style means that the data values will be displayed in the reactionlabels The lsquoabsrsquo style means the the absolute values of reaction values will be used fordata visualization
optionsreaction_compare_style(Default rsquodiffrsquo) How to compare to datasets Can be either lsquofold lsquolog2_foldrsquo orlsquodiffrsquo
optionsreaction_scaleDefault
[ type min color c8c8c8 size 12 type median color 9696ff size 20 type max color ff0000 size 25 ]
An array of objects that define points on the data scale
Each point is an object with a type attribute Types can be lsquominrsquo lsquomaxrsquo lsquomeanrsquo lsquoQ1rsquo (firstquartile) lsquomedianrsquo lsquoQ3rsquo (third quartile) or lsquovaluersquo Each point can have a color attributethat specifies a color with a string (any CSS color specification is allowed including hexrgb and rgba) Each point can have a size attirbute that specifies a reaction thickness as anumber Finally points with type lsquovaluersquo can have a value attribute that specifies an exactnumber for pont in the scale
NOTE If lsquominrsquo or lsquomaxrsquo is not provided Escher automatically adds them To be com-pletely clear about what you expect to see on the map it is best to provide lsquominrsquo andlsquomaxrsquo in addition to other scale points
Here are examples of each type
type rsquominrsquo color rsquoredrsquo size 12 Specifies that reactionsnear the minimum value are red and have thickness 12
type rsquoQ1rsquo color rsquorgba(100 100 50 05)rsquo size 12 Specifies that reactions near the first quartile have the given color opacity andthickness
type rsquomeanrsquo color rsquorgb(100 100 50)rsquo size 50 Specifies that reactions near the mean value have the given color and thickness
type rsquovaluersquo value 85 color rsquo333rsquo size 50 Specifies that reactions near 85 value have the given color and size
optionsreaction_no_data_color(Default rsquodcdcdcrsquo) The color of reactions with no data value
optionsreaction_no_data_size(Default 8) The size of reactions with no data value
optionsgene_data(Default null) An object with Gene ids for keys and gene data points for values
78 JavaScript API 41
Escher Documentation Release 143
optionsand_method_in_gene_reaction_rule(Default mean) When evaluating a gene reaction rule use this function to evaluate ANDrules Can be lsquomeanrsquo or lsquominrsquo
optionsmetabolite_data(Default null) An object with metabolite ids for keys and metabolite data points forvalues
optionsmetabolite_stylesDefault [rsquocolorrsquo rsquosizersquo rsquotextrsquo]
An array of style types The array can contain any of the following lsquocolorrsquo lsquosizersquo lsquotextrsquolsquoabsrsquo The lsquocolorrsquo style means that the metabolites will be colored according to the loadeddataset The lsquosizersquo style means that the metabolites will be sized according to the loadeddataset The lsquotextrsquo style means that the data values will be displayed in the metabolitelabels The lsquoabsrsquo style means the the absolute values of metabolite values will be used fordata visualization
optionsmetabolite_compare_style(Default rsquodiffrsquo) How to compare to datasets Can be either lsquofoldrsquo lsquolog2_foldrsquo orlsquodiffrsquo
optionsmetabolite_scaleDefault
[ type min color fffaf0 size 20 type median color f1c470 size 30 type max color 800000 size 40 ]
An array of objects that define points on the data scale See the description of op-tionsreaction_scale for an explanation of the format
optionsmetabolite_no_data_color(Default rsquoffffffrsquo) The color of metabolites with no data value
optionsmetabolite_no_data_size(Default 10) The size of metabolites with no data value
View and build options
optionsidentifiers_on_map(Default rsquobigg_idrsquo) The identifiers that will be displayed in reaction metabolite andgene labels Can be lsquobigg_idrsquo or lsquonamersquo
optionshighlight_missing(Default false) If true then highlight in red reactions that are not in the loaded COBRAmodel
optionsallow_building_duplicate_reactions(Default true) If true then building duplicate reactions is allowed If false then dupli-cate reactions are hidden in Add reaction mode
optionscofactors(Default [rsquoatprsquo rsquoadprsquo rsquonadrsquo rsquonadhrsquo rsquonadprsquo rsquonadphrsquorsquogtprsquo rsquogdprsquo rsquohrsquo rsquocoarsquo rsquoumprsquo rsquoh20rsquo rsquoppirsquo]) A list of metabo-lite IDs to treat as cofactors These will be secondary metabolites in new reactions
Callbacks
optionsfirst_load_callbackA function to run after loading the Builder
42 Chapter 7 Contents
Escher Documentation Release 143
load_map(map_data[ should_update_data])Load a map for the loaded data Also reloads most of the Builder content
Arguments
bull map_data ndash The data for a map
bull should_update_data (Boolean) ndash (Default true) Whether data should be ap-plied to the map
load_model(model_data[ should_update_data])Load the cobra model from model data
Arguments
bull model_data ndash The data for a Cobra model (Parsing in done by escherCobraModel)
bull should_update_data (Boolean) ndash (Default true) Whether data should be ap-plied to the model
view_mode()Enter view mode
build_mode()Enter build mode
brush_mode()Enter brush mode
zoom_mode()Enter zoom mode
rotate_mode()Enter rotate mode
text_mode()Enter text mode
set_reaction_data(data)
Arguments
bull data (array) ndash An array of 1 or 2 objects where each object has keys that are reactionIDrsquos and values that are data points (numbers)
set_metabolite_data(data)
Arguments
bull data (array) ndash An array of 1 or 2 objects where each object has keys that are metaboliteIDrsquos and values that are data points (numbers)
set_gene_data(data clear_gene_reaction_rules)
Arguments
bull data (array) ndash An array of 1 or 2 objects where each object has keys that are gene IDrsquosand values that are data points (numbers)
Arguments
bull clear_gene_reaction_rules (Boolean) ndash (Optional Default false) In addi-tion to setting the data also turn of the gene_reaction_rules
78 JavaScript API 43
Escher Documentation Release 143
79 Python API
class escherBuilder(map_name=None map_json=None model=None model_name=Nonemodel_json=None embedded_css=None reaction_data=None metabo-lite_data=None gene_data=None local_host=None id=None safe=Falsekwargs)
A metabolic map that can be viewed edited and used to visualize data
This map will also show metabolic fluxes passed in during consruction It can be viewed as a standalone htmlinside a browswer Alternately the respresentation inside an IPython notebook will also display the map
Maps are stored in json files and are stored in a cache directory Maps which are not found will be downloadedfrom a map repository if found
Parameters
bull map_name ndash A string specifying a map to be downloaded from the Escher web server orloaded from the cache
bull map_json ndash A JSON string or a file path to a JSON file or a URL specifying a JSON fileto be downloaded
bull model ndash A Cobra model
bull model_name ndash A string specifying a model to be downloaded from the Escher web serveror loaded from the cache
bull model_json ndash A JSON string or a file path to a JSON file or a URL specifying a JSONfile to be downloaded
bull embedded_css ndash The CSS (as a string) to be embedded with the Escher SVG
bull reaction_data ndash A dictionary with keys that correspond to reaction ids and values thatwill be mapped to reaction arrows and labels
bull metabolite_data ndash A dictionary with keys that correspond to metabolite ids and valuesthat will be mapped to metabolite nodes and labels
bull gene_data ndash A dictionary with keys that correspond to gene ids and values that will bemapped to corresponding reactions
bull local_host ndash A hostname that will be used for any local files This is generally usedfor using the notebook offline and for testing in the IPython Notebook with modified Eschercode An example value for local_host is lsquohttplocalhost7778lsquo
bull id ndash Specify an id to make the javascript data definitions unique A random id is chosen bydefault
bull safe ndash If True then loading files from the filesytem is not allowed This is to ensure thesafety of using Builder within a web server
Keyword Arguments
These are defined in the Javascript API
bulluse_3d_transform
bullenable_search
bullfill_screen
bullzoom_to_element
bullfull_screen_button
44 Chapter 7 Contents
Escher Documentation Release 143
bullstarting_reaction
bullunique_map_id
bullprimary_metabolite_radius
bullsecondary_metabolite_radius
bullmarker_radius
bullgene_font_size
bullhide_secondary_metabolites
bullshow_gene_reaction_rules
bullhide_all_labels
bullreaction_styles
bullreaction_compare_style
bullreaction_scale
bullreaction_no_data_color
bullreaction_no_data_size
bulland_method_in_gene_reaction_rule
bullmetabolite_styles
bullmetabolite_compare_style
bullmetabolite_scale
bullmetabolite_no_data_color
bullmetabolite_no_data_size
bullidentifiers_on_map
bullhighlight_missing
bullallow_building_duplicate_reactions
bullcofactors
All keyword arguments can also be set on an existing Builder object using setter functions eg
my_builderset_reaction_styles(new_styles)
display_in_browser(ip=lsquo127001rsquo port=7655 n_retries=50 js_source=rsquowebrsquo menu=rsquoallrsquoscroll_behavior=rsquopanrsquo enable_editing=True enable_keys=True mini-fied_js=True never_ask_before_quit=False)
Launch a web browser to view the map
Parameters
bull ip ndash The IP address to serve the map on
bull port ndash The port to serve the map on If specified the port is occupied then a random freeport will be used
bull n_retries (int) ndash The number of times the server will try to find a port before quitting
bull js_source (string) ndash Can be one of the following
ndash web (Default) - Use JavaScript files from eschergithubio
79 Python API 45
Escher Documentation Release 143
ndash local - Use compiled JavaScript files in the local Escher installation Works offline
ndash dev - No longer necessary with source maps This now gives the same behavior aslsquolocalrsquo
bull menu (string) ndash Menu bar options include
ndash none - No menu or buttons
ndash zoom - Just zoom buttons
ndash all (Default) - Menu and button bar (requires Bootstrap)
bull scroll_behavior (string) ndash Scroll behavior options
ndash pan - Pan the map
ndash zoom - Zoom the map
ndash none (Default) - No scroll events
bull enable_editing (Boolean) ndash Enable the map editing modes
bull enable_keys (Boolean) ndash Enable keyboard shortcuts
bull minified_js (Boolean) ndash If True use the minified version of JavaScript and CSSfiles
bull never_ask_before_quit (Boolean) ndash Never display an alert asking if you wantto leave the page By default this message is displayed if enable_editing is True
display_in_notebook(js_source=rsquowebrsquo menu=rsquozoomrsquo scroll_behavior=rsquononersquo mini-fied_js=True height=500 enable_editing=False)
Embed the Map within the current IPython Notebook
Parameters
bull js_source (string) ndash Can be one of the following
ndash web (Default) - Use JavaScript files from eschergithubio
ndash local - Use compiled JavaScript files in the local Escher installation Works offline
ndash dev - No longer necessary with source maps This now gives the same behav-ior as lsquolocalrsquo
bull menu (string) ndash Menu bar options include
ndash none - No menu or buttons
ndash zoom - Just zoom buttons
ndash Note The all menu option does not work in an IPython notebook
bull scroll_behavior (string) ndash Scroll behavior options
ndash pan - Pan the map
ndash zoom - Zoom the map
ndash none - (Default) No scroll events
bull minified_js (Boolean) ndash If True use the minified version of JavaScript andCSS files
bull height ndash Height of the HTML container
bull enable_editing (Boolean) ndash Enable the map editing modes
46 Chapter 7 Contents
Escher Documentation Release 143
save_html(filepath=None overwrite=False js_source=rsquowebrsquo protocol=rsquohttpsrsquo menu=rsquoallrsquoscroll_behavior=rsquopanrsquo enable_editing=True enable_keys=True minified_js=Truenever_ask_before_quit=False static_site_index_json=None)
Save an HTML file containing the map
Parameters
bull filepath (string) ndash The HTML file will be saved to this location Whenjs_source is lsquolocalrsquo then a new directory will be created with this name
bull overwrite (Boolean) ndash Overwrite existing files
bull js_source (string) ndash Can be one of the following
ndash web (Default) - Use JavaScript files from eschergithubio
ndash local - Use compiled JavaScript files in the local Escher installation Works of-fline To make the dependencies available to the downloaded file a new directorywill be made with the name specified by filepath
ndash dev - No longer necessary with source maps This now gives the same behav-ior as lsquolocalrsquo
bull protocol (string) ndash The protocol can be lsquohttprsquo lsquohttpsrsquo or None which indicatesa lsquoprotocol relative URLrsquo as in eschergithubio Ignored if source is local
bull menu (string) ndash Menu bar options include
ndash none - No menu or buttons
ndash zoom - Just zoom buttons
ndash all (Default) - Menu and button bar (requires Bootstrap)
bull scroll_behavior (string) ndash Scroll behavior options
ndash pan - Pan the map
ndash zoom - Zoom the map
ndash none (Default) - No scroll events
bull enable_editing (Boolean) ndash Enable the map editing modes
bull enable_keys (Boolean) ndash Enable keyboard shortcuts
bull minified_js (Boolean) ndash If True use the minified version of JavaScript andCSS files
bull height (number) ndash Height of the HTML container
bull never_ask_before_quit (Boolean) ndash Never display an alert asking if youwant to leave the page By default this message is displayed if enable_editing isTrue
bull static_site_index_json (string) ndash The index as a JSON string for thestatic site Use javascript to parse the URL options Used for generating static pages(see static_sitepy)
791 Cache
escherget_cache_dir(versioned=True name=None)Get the cache dir as a string and make the directory if it does not already exist
Parameters
79 Python API 47
Escher Documentation Release 143
bull versioned (Boolean) ndash Whether to return the versioned path in the cache Eschermaps for the latest version of Escher are found in the versioned directory (versioned= True) but maps for previous versions of Escher can be found by visiting the parentdirectory (versioned = False)
bull name (string) ndash An optional subdirectory within the cache If versioned is False thenname is ignored
escherclear_cache(different_cache_dir=None ask=True)Empty the contents of the cache directory including all versions of all maps and models
Parameters
bull different_cache_dir (string) ndash (Optional) The directory of another cacheThis is mainly for testing
bull ask (Boolean) ndash Whether to ask before deleting
escherlist_cached_maps()Return a list of all cached maps
escherlist_cached_models()Return a list of all cached models
escherlist_available_maps()Return a list of all maps available on the server
escherlist_available_models()Return a list of all models available on the server
710 License
Escher and EscherConverter are distributed under the MIT license
bull genindex
48 Chapter 7 Contents
Python Module Index
eescher 44
49
Escher Documentation Release 143
50 Python Module Index
Index
Bbrush_mode() (built-in function) 43build_mode() (built-in function) 43Builder (class in escher) 44
Cclear_cache() (in module escher) 48
Ddisplay_in_browser() (escherBuilder method) 45display_in_notebook() (escherBuilder method) 46
Eescher (module) 44escherBuilder() (class) 39
Gget_cache_dir() (in module escher) 47
Llist_available_maps() (in module escher) 48list_available_models() (in module escher) 48list_cached_maps() (in module escher) 48list_cached_models() (in module escher) 48load_map() (built-in function) 42load_model() (built-in function) 43
Ooptionenable_keys (option attribute) 40optionsallow_building_duplicate_reactions (options at-
tribute) 42optionsand_method_in_gene_reaction_rule (options at-
tribute) 41optionscofactors (options attribute) 42optionsenable_editing (options attribute) 39optionsenable_search (options attribute) 40optionsfill_screen (options attribute) 40optionsfirst_load_callback (options attribute) 42optionsfull_screen_button (options attribute) 40optionsgene_data (options attribute) 41
optionsgene_font_size (options attribute) 40optionshide_all_labels (options attribute) 40optionshide_secondary_metabolites (options attribute)
40optionshighlight_missing (options attribute) 42optionsidentifiers_on_map (options attribute) 42optionsignore_bootstrap (options attribute) 40optionsmarker_radius (options attribute) 40optionsmenu (options attribute) 39optionsmetabolite_compare_style (options attribute) 42optionsmetabolite_data (options attribute) 42optionsmetabolite_no_data_color (options attribute) 42optionsmetabolite_no_data_size (options attribute) 42optionsmetabolite_scale (options attribute) 42optionsmetabolite_styles (options attribute) 42optionsnever_ask_before_quit (options attribute) 40optionsprimary_metabolite_radius (options attribute) 40optionsreaction_compare_style (options attribute) 41optionsreaction_data (options attribute) 40optionsreaction_no_data_color (options attribute) 41optionsreaction_no_data_size (options attribute) 41optionsreaction_scale (options attribute) 41optionsreaction_styles (options attribute) 41optionsscroll_behavior (options attribute) 39optionssecondary_metabolite_radius (options attribute)
40optionsshow_gene_reaction_rules (options attribute) 40optionsstarting_reaction (options attribute) 40optionsunique_map_id (options attribute) 40optionsuse_3d_transform (options attribute) 39
Rrotate_mode() (built-in function) 43
Ssave_html() (escherBuilder method) 46set_gene_data() (built-in function) 43set_metabolite_data() (built-in function) 43set_reaction_data() (built-in function) 43
51
Escher Documentation Release 143
Ttext_mode() (built-in function) 43
Vview_mode() (built-in function) 43
Zzoom_mode() (built-in function) 43
52 Index

Escher Documentation Release 143
6 Chapter 2 Help I just upgraded to v12 and my map and model caches are empty
CHAPTER 3
Features
1 View pathway maps in any modern web browser
2 Build maps using the content of genome-scale metabolic models
3 Visualize data on reactions genes and metabolites
4 Full text search
5 Detailed options for changing colors sizes and more all from the web browser
6 View maps inside the IPython Notebook
7 Embed maps within any website with minimal dependencies (escherjs d3js and optionally Twitter Bootstrap)
7
Escher Documentation Release 143
8 Chapter 3 Features
CHAPTER 4
Supported browsers
We recommend using Google Chrome for optimal performance but Escher will also run in the latest versions ofFirefox Internet Explorer and Safari (including mobile Safari)
9
Escher Documentation Release 143
10 Chapter 4 Supported browsers
CHAPTER 5
Installation
Escher can be used without any installation by visiting the Escher website However you can install escher if youwould like to (1) run Escher offline (2) include your own maps and models in the launch page (3) view Escher mapsin an IPython Notebook or (4) modify the source code
To install the latest stable version of Escher run
pip install escher
For more information see the documentation on Run Escher locally and in IPython and Developing with Escher
11
Escher Documentation Release 143
12 Chapter 5 Installation
CHAPTER 6
Citing Escher
You can help support Escher by citing our publication when you use Escher or EscherConverter
Zachary A King Andreas Draumlger Ali Ebrahim Nikolaus Sonnenschein Nathan E Lewis and Bernhard O Pals-son (2015) Escher A web application for building sharing and embedding data-rich visualizations of biologicalpathways PLOS Computational Biology 11(8) e1004321 doi101371journalpcbi1004321
13
Escher Documentation Release 143
14 Chapter 6 Citing Escher
CHAPTER 7
Contents
71 Getting started
711 Introduction
Escher is here to help you visualize pathway maps But if you have never heard of a pathway map you mightappreciate a quick introduction
What are pathway maps
To understand pathway maps it is useful to think about the general organization of a cell At the smallest levelmolecules in a cell are arranged in three-dimensional structures and these structures determine many of the functionsthat take place in a cell For example the 3D structure of an enzyme determines the biochemical reactions that it cancatalyze These structures can be visualized in 3D using tools like Jmol (as in this example structure)
The DNA sequence is a second fundamental level of biological organization DNA sequences are the blueprints for allthe machinery of the cell and they can be visualized as a one-dimensional series of bases (ATCG) using tools like theUCSC genome browser
To use a football analogy the 3D molecular structures are akin to the players on the field and the information in theDNA sequence is like the playbook on the sidelines But football would not be very interesting if the players nevertook to the field and executed those plays So we are missing this level of detail the execution of biological plans bythe molecular players
What we are missing is the biochemical reaction network Proteins in the cell catalyze the conversion of substratemolecules into product molecules and these reactions are responsible for generating energy constructing cellularmachinery and structures detecting molecules in the environment signaling and more Biochemical reactions canbe grouped into pathways when they work in concert to carry out a function (If a reaction is a football play thenthe pathway is a drive) And Escher can be used to visualize these reactions and pathways Together we call thesevisualizations pathway maps
Escher to the rescue
Many Escher maps represent metabolic pathways and Escher was developed at the Systems Biology Research Groupwhere we have been building genome-scale models of metabolism over the past fifteen years However Escher is notlimited to metabolism It can be used to visualize any collection of biochemical reactions
Escher includes one more killer feature The ability to visualize datasets on a pathway map Many biological discov-eries are enabled by collecting and analyzing enormous datsets and so biologists are grappling with the challenges ofbig data By visualizing data in the context of pathway maps we can quickly spot trends which would not be apparent
15
Escher Documentation Release 143
with standard statistical tools And Escher visualizations can be adapted and shared to demonstrate those biologicaldiscoveries
The rest of this guide will introduce the Escher user interface and the major features of Escher
712 The launch page
When you open the Escher website you will see a launch page that looks like this
The options on the launch page are
bull Filter by organism Choose an organism to filter the Maps and Models
bull Map Choose a pre-built map or start from scratch with an empty builder by choosing None In parenthesesnext to the map name you will see the name of the model that was used to build this map
bull Model (Optional) If you choose a COBRA model to load then you can add new reactions to the pathway mapYou can also load your own model later after you launch the tool For an explanation of maps models andCOBRA see Escher COBRA and COBRApy
bull Tool
ndash The Viewer allows you to pan and zoom the map and to visualize data for reactions genes and metabo-lites
ndash The Builder in addition to the Viewer features allows you to add reactions move and rotate existingreactions add text annotations and adjust the map canvas
bull Options
ndash Scroll to zoom (instead of scroll to pan) Determines the effect of using the mousersquos scroll wheel overthe map
ndash Never ask before reloading If this is checked then you will not be warned before leaving the page evenif you have unsaved changes
Choose Load map to open the Escher viewer or builder in a new tab and prepare to be delighted by your very ownpathway map
16 Chapter 7 Contents
Escher Documentation Release 143
713 The menu bar
Once you have loaded an Escher map you will see a menu bar along the top of the screen Click the question mark tobring up the Escher documentation
714 Loading and saving maps
Using the map menu you can load and save maps at any time
Click Save map JSON to save the Escher map as a JSON file which is the standard file representing an Escher map
NOTE The JSON file does NOT save any datasets you have loaded This may be changed in a future version ofEscher
NOTE 2 In Safari saving files from Escher works a little differently than in the other major browsers After clickingSave map JSON Safari will load a new tab with the raw content of the Escher map file To save the file chooseFilegtSave As from the Safari menu A new dialog appears in the dropdown menu near the bottom select PageSource (rather than Web Archive) give your file an appropriate name (eg mapjson for an Escher map or mapsvgfor an SVG export) and click Save
Later you can can load a JSON file to view and edit a map by clicking Load map JSON
Click Export as SVG to generate a SVG file for editing in tools like Adobe Illustrator and Inkscape This is thebest way to generate figures for presentations and publications Unlike a JSON file a SVG file maintains the datavisualizations on the Escher map However you cannot load SVG files into Escher after you generate them
Click Clear Map to empty the whole map leaving a blank canvas NOTE You cannot undo Clear Map
715 Loading models
Use the model menu to manage the COBRA model loaded in Escher
71 Getting started 17
Escher Documentation Release 143
Choose Load COBRA model JSON to open a COBRA model Read more about COBRA models in Escher COBRAand COBRApy Once you have COBRApy v030 or later installed then you can generate a JSON model by followingthis example code
Once you have loaded a COBRA model there may be inconsistencies between the content in the map and the model(eg reaction IDs descriptive names and gene reaction rules) You click Update names and gene reaction rulesusing model to find matching reactions and metabolites between the map and the model (based on their IDs) andthen apply the names and gene reaction rules from the model to the map The reactions that do not match will behighlighted in red (This can be turned off again in the settings menu by deselecting Highlight reactions not in model)More advice on building maps is available in Building and contributing maps
Click Clear Model to clear the current model
716 Loading reaction gene and metabolite data
Datasets can be loaded as CSV files or JSON files using the Data Menu
In Escher reaction and gene datasets are visualized by changing the color thickness and labels of reaction arrowsMetabolite datasets are visualized by changing the color size and labels of metabolite circles The specific visualstyles can be modified in the Settings menu When data is not present for a specific reaction gene or metabolite thenthe text label will say lsquondrsquo which means lsquono datarsquo
18 Chapter 7 Contents
Escher Documentation Release 143
The structure of a CSV file
CSV files should have 1 header row 1 ID column and either 1 or 2 columns for data values The ID column cancontain BiGG IDs or descriptive names for the reactions metabolites or genes in the dataset Here is an example witha single data value columns
IDtime 0secglc__D_c54g6p__D_c23
Which might look like this is Excel
ID time 0secglc__D_c 54g6p_c 23
If two datasets are provided then the Escher map will display the difference between the datasets In the Settings menuthe Comparison setting allows you to choose between comparison functions (Fold Change Log2(Fold Change) andDifference) With two datasets the CSV file looks like this
ID time 0sec time 5sglc__D_c 54 102g6p_c 23 81
Data can also be loaded from a JSON file This Python code snippet provides an example of generating the properformat for single reaction data values and for reaction data comparisons
import json
save a single flux vector as JSONflux_dictionary = glc__D_c 54 g6p_c 23with open(outjson w) as f
jsondump(flux_dictionary f)
save a flux comparison as JSON
71 Getting started 19
Escher Documentation Release 143
flux_comp = [glc__D_c 54 g6p_c 23 glc__D_c 102 g6p_c 81]with open(out_compjson w) as f
jsondump(flux_comp f)
Gene data and gene reaction rules
Escher uses gene reaction rules to connect gene data to the reactions on a metabolic pathway You can see these genereaction rules on the map by selecting Show gene reaction rules in the Settings menu
Gene reaction rules show the genes whose gene products are required to catalyze a reaction Gene are connected usingAND and OR rules AND rules are used when two genes are required for enzymatic activity eg they are membersof a protein complex OR rules are used when either gene can catalyze the enzymatic activity eg they are isozymes
With OR rules Escher will take the sum of the data values for each gene With AND rules Escher will either takethe mean (the default) or the minimum of the components The AND behavior (mean vs minimum) is defined in theSettings menu
717 Editing and building
The Edit menu gives you access to function for editing the map
20 Chapter 7 Contents
Escher Documentation Release 143
Escher has five major modes and you can switch between those modes using the buttons in the Edit menu or usingthe buttons in the button bar on the left of the screen
1 Pan mode Drag the canvas to pan the map You can also use the mouse scroll wheel or trackpad scroll function(drag with 2 fingers) to pan the map (or to zoom if you selected Scroll to zoom in the settings)
2 Select mode Select nodes by clicking on them Shift-click to select multiple nodes or drag across the canvasto select multiple nodes using the selection brush
3 Add reaction mode If you have loaded a Model then click on the canvas to see a list of reactions that you candraw on the map Click on a node to see reactions that connect to that node In the input box you can search byreaction ID metabolite ID or gene ID (locus tag)
4 Rotate model Before entering rotate mode be sure to select one or more nodes in select mode Then afterentering rotate mode drag anywhere on the canvas to rotate the selection You can also drag the red crosshairsto change the center of the rotation
5 Text mode Use text mode to add text annotations to the map Click on the canvas to add a new text annotationor click an existing annotation to edit it When you are finished click Enter or Escape to save the changes
71 Getting started 21
Escher Documentation Release 143
In addition to the editing modes the Edit menu gives you access to the following commands
bull Delete Delete the currently selected node(s)
bull Undo Undo the last action NOTE Certain actions such as editing the canvas cannot be undone in the currentversion of Escher
bull Redo Redo the last action that was undone
bull Toggle primarysecondary node In Escher each metabolite node is either a primary node or a secondarynode Primary nodes are larger and secondary nodes can be hidden in the Settings menu Use this command totoggle the currently selected node(s) between primary and secondary
bull Rotate reactant locations When you draw a new reaction in Escher this command will rotate the new reactantsso that a new reactant is primary and centered This command is extremely useful when you are drawing a longpathway and you want to quickly switch which metabolite to ldquofollowrdquo eg make sure you are following thecarbon-containing metabolites
If you are confused then try drawing a new pathway and hitting the ldquocrdquo key to see the reactants rotate
bull Select all Select all nodes
bull Select none Unselect all nodes
bull Invert selection Select all the nodes that are currently unselected This feature is very useful when you wantto keep just one part of the map Simply drag to select the part you want to keep call the Invert selectioncommand then call the Delete command
718 Editing the canvas
A somewhat non-obvious feature of Escher is that you can edit the canvas by dragging the canvas edges This ispossible in Pan mode and Select mode
22 Chapter 7 Contents
Escher Documentation Release 143
719 View options
bull Zoom in Zoom in to the map
bull Zoom out Zoom out of the map
bull Zoom to nodes Zoom to see all the nodes on the map
bull Zoom to canvas Zoom to see the entire canvas
bull Find Search for a reaction metabolite or gene on the map
bull Show control points Show the control points you can drag these red and blue circle to adjust the shapes ofthe reactions curves
bull Settings Open the Settings menu
7110 The button bar
The button bar give you quick access to many of the common Escher functions
71 Getting started 23
Escher Documentation Release 143
24 Chapter 7 Contents
Escher Documentation Release 143
7111 Settings
View and build options
bull Identifiers Choose whether to show BiGG IDs or descriptive names for reactions metabolites and genes
bull Hide secondary metabolites This will simplify the map by hiding all secondary metabolites and the pathsconnected to them
bull Show gene reaction rules Show the gene reaction rules below the reaction labels even gene data is not loaded
bull Hide reaction gene and metabolite labels Another option to visually simplify the map this will hide alllabels that are not text annotations
bull Allow duplicate reactions By default duplicate reactions are hidden in the add reaction dropdown menuHowever you can turn this option on to show the duplicate reactions
bull Highlight reactions not in model Highlight in red any reactions that are on the map but are not in the modelThis is useful when you are adapting a map from one model for use with another model
71 Getting started 25
Escher Documentation Release 143
Reaction data settings
When reaction or gene data is loaded this section can be used to change visual settings for reactions
The color bar has individual control points and you can drag the control points (execpt min and max) left and right tochange their values Alternatively you can use the dropdown menu (next to the word median in the figure above) toattach a control point to a statistical measure (mean median first quartile (Q1) or third quartile (Q3)) This lets youchoose a color scale that will adapt to your dataset
For each control point you can choose a color by entering a CSS-style color (eg red ff0000 rgba(20 20 255 05)and you can choose a size that will scale the thickness of reactions
There are also color and size options for reactions that do not have any data value
Finally there are a few onoff settings for the loaded reaction or gene dataset
bull Options These determine how to visualize the datasets Check Absolute value to color and size reactions bythe absolute value of each data value The Size Color and Text options can be unselected to turn off sizingcoloring and data values in reaction labels individually
bull Comparison Determines the comparison algorithm to use when two datasets are loaded
bull Method for evaluating AND Determines the method that will be used to reconcile AND statements in genereaction rules when there is gene data loaded See Gene data and gene reaction rules for more details
Metabolite data settings
The data settings for metabolite data are analagous to those for reaction data The only difference is that size nowrefers to the size of the metabolite circles
26 Chapter 7 Contents
Escher Documentation Release 143
72 Escher COBRA and COBRApy
Escher can be used as an independent application but it draws heavily on the information in COBRA models ACOBRA model is a collection of all the reactions metabolites and genes known to exist in an organism (In theliterature these are generally called genome-scale models (GEMs) but we refer to them as COBRA models here toemphasize that Escher interoperates with models that are exported from COBRApy)
By loading a COBRA model into the Escher interface you have access to every reaction and metabolite in that modelYou also have the gene reaction rules for the reactions in the network which allow you to connect gene data toreactions and metabolites
COBRApy is a software package for COBRA modeling written in Python The Escher Python package uses CO-BRApy package for reading and writing COBRA models
721 Maps and models
In Escher you will see references to maps and models
A map contains the reactions and metabolites that you see in the Escher builder including their locations text annota-tions and the canvas
A model (a COBRA model) contains reactions and metabolites that you have not drawn yet Thus you can load aCOBRA model when you want to draw new reactions on the map
722 What is JSON and why do we use it
Both Escher maps and COBRA models are stored as JSON files JSON is a useful plain-text format for storing nesteddata structures We use JSON much like the SBML community uses XML You may notice that SBML files have axml extension and Escher maps and COBRA models have a json extension
You can use Python to explore a JSON file like this
import json
with open(mapjson r) as fmap_object = jsonload(f)
print map_object[0]print map_object[1][reactions]values()[0]
723 Escher SBML and SBGN
A tool has been developed for converting Escher maps to SBML Layout and SBGN and it will be released soon
COBRA models can be converted to SBML using COBRApy
73 Run Escher locally and in IPython
To run Escher on a local computer or to use Escher in PythonIPython first install it The Python package for Eschercan be installed using pip
pip install escher
72 Escher COBRA and COBRApy 27
Escher Documentation Release 143
Depending on your installation of Python you may need sudo
sudo pip install escher
Alternatively one can download the source files and install the package directly
python setuppy install
731 Escher in the IPython Notebook
Once you have installed Escher locally you can interact with Escher maps in an IPython Notebook
Here are example notebooks to get started with
bull COBRApy and Escher
bull JavaScript development and offline maps
bull Generate JSON models in COBRApy
Dependencies
bull Jinja2
bull Tornado
bull COBRApy 030 or later
732 Running the local server
You can run your own local server if you want to use Escher offline or explore your own maps with the homepagebrowser To get started install the Python package and run from any directory by calling
python -m escherserver
This starts a server at httplocalhost7778 You can also choose another port
python -m escherserver --port=8005
74 Validate and convert maps
741 Validate an Escher map
Escher maps follow a specification using the JSON Schema format Therefore any JSON Schema validator can beused to validate an Escher map by comparing it to the latest schema file For example the current schema is locatedhere
httpsgithubcomzakandrewkingescherblobmasterescherjsonschema1-0-0
To make this easier the Escher Python package includes a validation script To validate a map first install Escher
pip install escher
Then call the validator
python -m eschervalidate my_mapjson
Any errors in the map will print to the console
28 Chapter 7 Contents
Escher Documentation Release 143
742 Convert or upgrade an Escher map
Any Escher maps built with pre-release versions of Escher will not load right away in the stable v10 release Toconvert pre-release maps to the new format follow these steps
1 Install Escher
pip install escher
2 Find a COBRA model for your maps This COBRA model will be used to update the content of the mapin order to support all the new Escher features You can use a COBRA model encoded as SBML or JSON(generated with COBRApy v030b4 or later) The COBRA models currently available on the Escher websitecan be downloaded from the BiGG Models website
httpbiggucsdedu
For a refresher on the distinction between Escher maps COBRA models and their file types (SBML JSONSBML Layout) see Escher COBRA and COBRApy
3 Run the convert_map script to convert your existing Escher map (my_old_mapjson) to the new formatusing a COBRA model (model_filejson or model_filexml in these examples)
With a JSON file modelpython -m escherconvert_map my_old_mapjson pathtomodel_filejson
With an SBML modelpython -m escherconvert_map my_old_mapjson pathtomodel_filexml
Those commands will generate a new map called my_old_map_convertedjson that will load in Escher v10and later
75 Building and contributing maps
We are excited to collect pathway maps for every organism with a well characterized metabolic network This sectiondescribes the process of building a new map either from scratch or using a COBRA model with BiGG IDs
751 Building from scratch
To build a map from scratch you will first need a COBRA model for your map See the section Escher COBRA andCOBRApy for some background information on COBRA models
If you would like to eventually contribute your map to the Escher website it is important that your COBRA modeladheres to the identifiers in the BiGG Database Escher and BiGG are being developed together and we want tomaintain consistency and interoperability between them
Once you have a COBRA model you can follow these steps
1 Load your model in the Escher Builder
2 Begin building new reactions If you are familiar with the genes in your organism then try search for newreactions by their gene IDs
3 Limit each map to ~200 reactions Maps larger than this will slow down the Escher viewer especially on oldbrowsers Rather than building one giant map Escher is designed for building many smaller subsystem maps
4 When you have built a map for your a subsystem save the map as JSON with a name that includes the modelID followed by a period followed by the name of the subsystem For example
75 Building and contributing maps 29
Escher Documentation Release 143
iMM904Amino acid biosynthesisjson
5 (Optional) Once you have a set of subsystem maps you can set up a local Escher server so that subsystem mapsappear in the ldquoquick jumprdquo menu in the bottom right corner of the screen (as seen here for iJO1366) To setthis up you will need to start a local server as describe in Running the local server Next find your local cachedirectory by running this command in a terminal
python -c import escher print(escherget_cache_dir(name=maps))
This will print the location of the local maps cache Add your new subsystem maps to cache folder Now whenyou run the server (described in Running the local server) you should see that quick jump menu appear
NOTE The cache directory is organized into folders for organisms You can use these folder for filtering byorganism on the local launch page or you can place the maps in the top directory
NOTE 2 A similar approach can be used to access your models from the local launch page Place maps in thefolder indicated by
python -c import escher print(escherget_cache_dir(name=models))
752 Building from an existing map for a similar organism
Follow the instruction above except rather than starting from scratch load an existing Escher map for a differentorganism
Once you have the new model loaded use the Update names and gene reaction rules using model button in theModel menu to convert all descriptive names and gene reaction rules in the model to those in the map Reactions thatdo not match the model will be highlighted in red (This can be turned off again in the settings menu by deselectingHighlight reactions not in model)
Now visit each highlighted reaction and see if you can replace it with an equivalent biochemical pathway from themodel If not then delete the reaction and move on
Finally when there are no highlighted reactions left you can repeat this for other subsystems
753 Submitting maps to the Escher website
If you would like to contribute maps to Escher you can make a Pull Request to the GitHub repository eschergithubioMake sure there is a folder with the name of the organism in 1-0-0maps For example a new yeast map goes inthe folder
1-0-0mapsSaccharomyces cerevisiae
Then name your map by concatenating the model ID and the map name separated by a period For example a yeastmap built with the genome-scale model iMM904 could be named
iMM904Amino acid biosynthesisjson
Then add the JSON file for the model to the Pull Request if that model is not already available As before make afolder for your organism within 1-0-0models The model filename is just the model ID
In this example a correct Pull Request would include the following files
1-0-0mapsSaccharomyces cerevisiaeiMM904Amino acid biosynthesisjson1-0-0modelsSaccharomyces cerevisiaeiMM904json
30 Chapter 7 Contents
Escher Documentation Release 143
76 Developing with Escher
761 Using the static JavaScript and CSS files
You can include the compiled Escher JavaScript and CSS files in any HTML document The only dependencies ared3js and optionally Twitter Bootstrap if you are using the option menu=rsquoallrsquo
The compiled files are available form npmcdn
httpsnpmcdncomescher-visjsdistescherjshttpsnpmcdncomescher-visjsdistescherminjshttpsnpmcdncomescher-viscssdistbuildercsshttpsnpmcdncomescher-viscssdistbuildermincss
Source maps are also hosted there
httpsnpmcdncomescher-visjsdistescherjsmaphttpsnpmcdncomescher-visjsdistescherminjsmaphttpsnpmcdncomescher-viscssdistbuildermincssmap
If you want a particular version of escher add a version tag like this
httpsnpmcdncomescher-vis140-beta3jsdistescherjs
For an example of the boilerplate code that is required to begin developing with Escher have a look at the escher-demorepository For projects built with npm use the escher-test repository as a guide
762 Building and testing Escher
First install dependencies with npm
npm install
Escher uses grunt to manage the build process To run typical build steps just run
npm run compile
To test the JavaScript files run
npm run test
For Python testing run this in the py directory
python setuppy test
Build the static website
python setuppy build_gh
Clear static website files
python setuppy clean
Build and run the docs
cd docsmake htmlcd _buildhtml
76 Developing with Escher 31
Escher Documentation Release 143
python -m SimpleHTTPServer python 2python -m httpserver python 3
763 Generating and reading Escher and COBRA files
The Escher file format
Escher layouts are defined by JSON files that follow a specific schema using json schema The latest schemafor Escher JSON files is here The Escher schemas are versioned with inspiration from SchemaVer Theeschervalidate module can be used to validate models against the schema
The Escher layout schema is designed to be as simple as possible For example the core metabolism map of Es-cherichia coli is layed out like this
[
map_name E coli coreCore metabolismmap_id 2938hoq32a1map_description E coli core metabolic networknLast Modified Fri Dec 05 2014 163944 GMT-0800 (PST)homepage httpseschergithubioschema httpseschergithubioescherjsonschema1-0-0
reactions nodes text_label canvas
x 7857062530517567y 31436893920898433width 5894515691375733height 4860457037353515
]
The map_name includes the model that was used to build this layout followed by a period and then a readable namefor the map The map_id is a unique identifier for this map The map_description describes the map and thelast time it was modified Both the homepage and the schema entries must have exactly these values for the Eschermap to be valid
In the next section the reactions nodes labels and canvas are all defined For reactions nodes and text labels eachelement has a key that is an arbitrary integer As long as there are no repeated IDs (eg no 2 segments with the ID517) then everything should work fine
Read through the schema (here) for more detail on the format
The COBRA file format
COBRA models are also saved as JSON files This format has not been documented with a schema but you canbrowse through the core metabolism model as a guide to generating valid COBRA models
I still need help
If you are interested in developing with Escher and you need more information than what is provided in the documen-tation please contact Zachary King (zaking-AT-ucsd-DOT-edu)
32 Chapter 7 Contents
Escher Documentation Release 143
77 EscherConverter
EscherConverter is a standalone program that reads files created with the graphical network editor Escher and convertsthem to files in community standard formats
Download EscherConverter 05 (137 MB)
771 Using EscherConverter
Escher uses a JSON file format to represent its networks This format has been developed because of its very small filesize and its compatibility to online programs that are written in JavaScript In particular JSON is a JavaScript ObjectNotation or in other words a JSON file directly represents components of JavaScript programs This makes parsingvery simple and allows direct use of those files in web-based programs
However in systems biology specific file formats have been developed with the aim to be easily exchangeable betweensoftware implemented in diverse programming languages
To this end these formats support semantically clear annotations and are maintained by a large community of scientistsEscherConverter supports export to two particularly important XML-based community file formats SBML with layoutextension and SBGN-ML
While SBML has been mainly developed for dynamic simulation of biological networks it is nowadays also usablefor diverse other purposes Its layout extension facilitates the encoding the display of biological networks
SBGN-ML has been directly developed as a language for the display of biological pathway maps of diverse kinds Itstores the position and connection of entities similar to what is shown in Escher networks
EscherConverter takes Escherrsquos JSON files as input and generates equivalent SBML Level 3 Version 1 files with layoutextension or SBGN-ML files
In order to ensure that the conversion is correct EscherConverter provides its own display that gives users a previewof how the export data format will be rendered by other tools In this preview display you can zoom in and out movearcs and node positions However it is important to know that none of the changes made in this preview are stored inthe export file
Download and Installation
You can obtain local copy of EscherConverter by clicking here
As a Javatrade application no specific installation is required for EscherConverter
However make sure you have a recent Javatrade Runtime Environment (JRE) installed on your computer (at least JRE8) You can obtain Javatrade from the Oracle website There you can also find installation instructions for your respectiveoperating system
Once Javatrade has been installed you can simply place the EscherConverter JAR file somewhere on your local computerfor instance in the folder
bull Applications if you are working under Mac OS
77 EscherConverter 33
Escher Documentation Release 143
bull opt for Linux computers
bull CProgram Files if you are using Windows
Launching the program
You can launch EscherConverter simply by double-clicking on the application JAR file This will open a followinggraphical user interface as described in the following figures
Figure 1 | The graphical user interface of EscherConverter
bull Preferences opens a settings dialog (see next screenshot)
bull Open displays a file chooser to select an input file in JSON format
bull Save export the map that is displayed in the current tab to SBML or SBGN-ML
bull Discard closes the current tab without saving
bull Help opens the online help that displays all command-line options
bull License displays the license under which this software is distributed
bull About shows information about the authors of this software
bull Main the main panel of the software in which converted Escher maps will be displayed organized in tabs
bull Status the status bar shows information and logging messages during the conversion
34 Chapter 7 Contents
Escher Documentation Release 143
Figure 2 | The preferences dialog All settings in this dialog are also available through EscherConverterrsquos command-line interface
Layout section several properties that are required in SBML and SBGN-ML are not explicitly specified in EscherrsquosJSON format and therefore need to be adjusted by the user These are the size of the drawing canvas the default boxsize for text labels the size of primary and secondary nodes In contrast to SBGN-ML and Escherrsquos JSON formatthe SBML layout extension supports three-dimensional displays When selecting this export file format it is thereforenecessary to also define the z-coordinate and the depth of all objects
Components and naming section Most settings in this section are specific for the SBML layout extension and areonly active if this output format is selected These are names and identifiers of the layout component and the in caseof SBML mandatory default compartment (a compartment without physical meaning a reaction space in which allmetabolites are located) EscherConverter can infer compartment bounds from metabolites but this is an experimentalfeature Just try it and see how the preview changes
77 EscherConverter 35
Escher Documentation Release 143
Figure 3 | A layout preview
The birds-eye view and the navigation component on the left help you navigate through the network display Thisgraph shows you how the converted pathway map will be rendered by software that supports SBGN-ML or the SBMLlayout extension This preview can be modified by moving arcs or nodes however none of those changes are storedwhen exporting the file In this current version EscherConver only exports layouts as given in the original JSON file
Included third-party software
EscherConverter includes several third-party libraries which we here list and acknowledge
bull ArgParser
bull JSBML
bull libSBGN
bull Pixel-Mixer icons
bull yFiles
772 Command-line interface API
You can launch EscherConverter from the command-line On a Unix system (such as Linux MacOS or Solaris etc)use a command like
bash$ java -jar -Xms8G -Xmx8G -Duserlanguage=en EscherConverter-05jar [options]
Under Window use a command like
Cgt javaw -jar -Xms8G -Xmx8G -Duserlanguage=en EscherConverter-05jar [options]
Escher has a large collection of command-line options (see below) which can be useful if you want to launch theprogram with specific settings or if multiple files are to be converted in a batch mode It is even possible to completelydisable the graphical user interface
36 Chapter 7 Contents
Escher Documentation Release 143
Input and output files
Definition of input and output data files as well as the format for the output
--input=ltFilegt
Specifies the JSON input file If a directory is given the conversion will be recursively performed Accepts JSON
--output=ltFilegt
The path to the file into which the output should be written If the input is a directory this must also be a directory inorder to perform a recursive conversion Accepts SBML SBGN
Escher layout
The options in this group allow you to influence how large certain elements should be displayed
--canvas-default-height=ltDoublegt
Just as in the case of the width of the canvas this value needs to be specified for cases where the JSON input file lacksan explicit specification of the canvas height Arguments must fit into the range [11E9] (Default value 2500)
--canvas-default-width=ltDoublegt
This value is used when no width has been defined for the canvas Since the width attribute is mandatory for the layouta default value must be provided in these cases Arguments must fit into the range [11E9] (Default value 2500)
--label-height=ltDoublegt
With this option you can specify the height of the bounding box of text labels Arguments must fit into the range[11E9] (Default value 500)
--label-width=ltDoublegt
This option defines the width of bounding boxes for text labels Arguments must fit into the range [11E9] (Defaultvalue 1600)
--node-depth=ltDoublegt
The length of nodes along z-coordinate Escher maps are actually two-dimensional but in general a layout can bethree-dimensional This value should be an arbitrary value greater than zero because some rendering engines mightnot display the node if its depth is zero Arguments must fit into the range [11E9] (Default value 10)
--node-label-height=ltDoublegt
Node labels can have a size different from general labels in the graph Here you can specify how height the boundingbox of the labels for nodes should be Arguments must fit into the range [11E9] (Default value 200)
--primary-node-height=ltDoublegt
The primary node should be bigger than the secondary node With this option you can specify the height of this typeof nodes Arguments must fit into the range [11E9] (Default value 300)
--primary-node-width=ltDoublegt
Escher maps distinguish between primary and secondary nodes Primary nodes should be larger than secondary nodesand display the main flow of matter through the network This option allows you to specify the width of primarynodes Arguments must fit into the range [11E9] (Default value 300)
77 EscherConverter 37
Escher Documentation Release 143
--reaction-label-height=ltDoublegt
Reaction label heightArguments must fit into the range [11E9] (Default value 300)
--reaction-node-ratio=ltDoublegt
This value is used as a conversion factor to determine the size of the reaction display box depending on the size ofprimary nodes Height and width of reaction nodes are determined by dividing the corresponding values from theprimary node size by this factor Arguments must fit into the range [01] (Default value 05)
--secondary-node-ratio=ltDoublegt
Similar to the reaction node ratio the size of secondary nodes (width and height) is determined by dividing thecorresponding values from the primary nodes by this value Arguments must fit into the range [01] (Default value06666666666666666)
--z=ltDoublegt
The position on the z-axis where the entire two-dimensional graph should be drawn Arguments must fit into the range[-1E91E9] (Default value 00)
Escher Components and their naming
Here you can influence which elements are to be included in the layout and how elements in the layout are to be calledor identified
--format=ltOutputFormatgt
The desired format for the conversion eg SBML All possible values for type ltOutputFormatgt are SBGN andSBML (Default value SBML)
--layout-id=ltStringgt
In contrast to the name this identifier does not have to be human-readable This is a machine identifier which muststart with a letter or underscore and can only contain ASCII characters (Default value Escher_Layout)
--layout-name=ltStringgt
This should be a human-readable name for the layout that is to be created This name might be displayed to describethe figure and should therefore be explanatory (Default value Escher Layout)
--compartment-id=ltStringgt
A compartment needs to have a unique identifier which needs to be a machine-readable Sting that must start with aletter or underscore and can only contain ASCII characters Since the JSON file does not provide this information thisoption allows you to specify the required identifier (Default value default)
--compartment-name=ltStringgt
With this option it is possible to define a name for the default compartment can be that needs to be generated for theconversion to SBML The name does not have any restrictions ie any UTF-8 character can be used (Default valueDefault compartment)
--infer-compartment-bounds
This converter can infer where the boundaries of compartments could be drawn To this end it uses each nodersquos BiGGids to identify the compartment of all metabolites Assuming that compartments have rectangular shapes the algorithmcan find the outermost node on each side of the box and hence obtain the boundaries of the compartment However
38 Chapter 7 Contents
Escher Documentation Release 143
this methods will fail when metabolites are drawn inside of such a box that belong to a different compartment that isactually further outside For this reason this option is deactivated by default (Default value false)
Options for the graphical user interface
--gui
If this option is given the program will display its graphical user interface (Default value false)
--log-level=ltStringgt
Change the log-level of this application This option will influence how fine-grained error and other log messages willbe that you receive while executing this program All possible values for type ltStringgt are ALL CONFIG FINEFINER FINEST INFO OFF SEVERE and WARNING (Default value INFO)
--log-file=ltFilegt
This option allows you to specify a log file to which all information of the program will be written Accepts (bp2bp3 log owl xml)
78 JavaScript API
class escherBuilder(map_data model_data embedded_css selection options)A Builder object contains all the UI and logic to generate a map builder or viewer
Arguments
bull map_data (object) ndash The data for a map to be passed to escherMapfrom_data() Ifnull then an empty Builder is initialized
bull model_data (object) ndash The data for a cobra model to be passed to es-cherCobraModel() Can be null
bull embedded_css (string) ndash The stylesheet for the SVG elements in the Escher map
bull selection (object) ndash (Optional Default In the body element) The d3 selection of anelement to place the Builder into The selection cannot be inside an SVG element
bull options (object) ndash (Optional) An object defining any of the following options
optionsmenu(Default rsquoallrsquo) The type of menu that will be displayed Can be lsquoallrsquo for the fullmenu or lsquozoomrsquo for just zoom buttons The lsquoallrsquo option requires the full set of Escherdependencies (D3js JQuery and Bootstrap) while the lsquozoomrsquo option requires only D3jsFor more details see Developing with Escher
optionsscroll_behavior(Default rsquopanrsquo) This option determines the effect that the scroll wheel will have onan Escher map Can be lsquopanrsquo to pan the map or lsquozoomrsquo to zoom the map when the usermoves the scroll wheel
optionsuse_3d_transform(Default Chooses a good option by testing the browser) If true then use CSS3 3D trans-forms to speed up panning and zooming This feature will only work on browsers thatsupport the 3D transforms It works best in the latest versions of Chrome Firefox andInternet Explorer Safari works better with this turned off
78 JavaScript API 39
Escher Documentation Release 143
optionsenable_editing(Default true) If true then display the map editing functions If false then hide themand only allow the user to view the map
optionenable_keys(Default true) If true then enable keyboard shortcuts
optionsenable_search(Default true) If true then enable indexing of the map for search Use false to disablesearching and potentially improve the map performance
optionsfill_screen(Default false) Use true to fill the screen when an Escher Builder is placed in a top-level container (eg a div in the body element)
optionsfull_screen_button(Default false) Include a button in the user interface for entering full screen mode
optionsignore_bootstrap(Default false) Do not use Bootstrap for buttons even if it available This is used toembed Escher in a Jupyter notebook where it conflicts with the Jupyter Boostrap installa-tion
Map model and styles
optionsstarting_reaction(Default null) The ID (as a string) of a reaction to draw when the Builder loads
optionsnever_ask_before_quit(Default false) If false then display a warning before the user closes an Eschermap If true then never display the warning This options is only respected if op-tionsenable_editing == true If enable_editing is false then the warnings are not dis-played
optionsunique_map_id(Default null) A unique ID that will be used to UI elements donrsquot interfere whenmultiple maps are in the same HTML document
optionsprimary_metabolite_radius(Default 15) The radius of primary metabolites in px
optionssecondary_metabolite_radius(Default 10) The radius of secondary metabolites in px
optionsmarker_radius(Default 5) The radius of marker nodes in px
optionsgene_font_size(Default 18) The font size of the gene reaction rules in px
optionshide_secondary_metabolites(Default false) If true then secondary nodes and segments are hidden This is conve-nient for generating simplified map figures
optionsshow_gene_reaction_rules(Default false) If true then show the gene reaction rules even without gene data
optionshide_all_labels(Default false) If checked hide all reaction gene and metabolite labels
Applied data
40 Chapter 7 Contents
Escher Documentation Release 143
optionsreaction_data(Default null) An object with reaction ids for keys and reaction data points for values
optionsreaction_stylesDefault [rsquocolorrsquo rsquosizersquo rsquotextrsquo]
An array of style types The array can contain any of the following lsquocolorrsquo lsquosizersquo lsquotextrsquolsquoabsrsquo The lsquocolorrsquo style means that the reactions will be colored according to the loadeddataset The lsquosizersquo style means that the reactions will be sized according to the loadeddataset The lsquotextrsquo style means that the data values will be displayed in the reactionlabels The lsquoabsrsquo style means the the absolute values of reaction values will be used fordata visualization
optionsreaction_compare_style(Default rsquodiffrsquo) How to compare to datasets Can be either lsquofold lsquolog2_foldrsquo orlsquodiffrsquo
optionsreaction_scaleDefault
[ type min color c8c8c8 size 12 type median color 9696ff size 20 type max color ff0000 size 25 ]
An array of objects that define points on the data scale
Each point is an object with a type attribute Types can be lsquominrsquo lsquomaxrsquo lsquomeanrsquo lsquoQ1rsquo (firstquartile) lsquomedianrsquo lsquoQ3rsquo (third quartile) or lsquovaluersquo Each point can have a color attributethat specifies a color with a string (any CSS color specification is allowed including hexrgb and rgba) Each point can have a size attirbute that specifies a reaction thickness as anumber Finally points with type lsquovaluersquo can have a value attribute that specifies an exactnumber for pont in the scale
NOTE If lsquominrsquo or lsquomaxrsquo is not provided Escher automatically adds them To be com-pletely clear about what you expect to see on the map it is best to provide lsquominrsquo andlsquomaxrsquo in addition to other scale points
Here are examples of each type
type rsquominrsquo color rsquoredrsquo size 12 Specifies that reactionsnear the minimum value are red and have thickness 12
type rsquoQ1rsquo color rsquorgba(100 100 50 05)rsquo size 12 Specifies that reactions near the first quartile have the given color opacity andthickness
type rsquomeanrsquo color rsquorgb(100 100 50)rsquo size 50 Specifies that reactions near the mean value have the given color and thickness
type rsquovaluersquo value 85 color rsquo333rsquo size 50 Specifies that reactions near 85 value have the given color and size
optionsreaction_no_data_color(Default rsquodcdcdcrsquo) The color of reactions with no data value
optionsreaction_no_data_size(Default 8) The size of reactions with no data value
optionsgene_data(Default null) An object with Gene ids for keys and gene data points for values
78 JavaScript API 41
Escher Documentation Release 143
optionsand_method_in_gene_reaction_rule(Default mean) When evaluating a gene reaction rule use this function to evaluate ANDrules Can be lsquomeanrsquo or lsquominrsquo
optionsmetabolite_data(Default null) An object with metabolite ids for keys and metabolite data points forvalues
optionsmetabolite_stylesDefault [rsquocolorrsquo rsquosizersquo rsquotextrsquo]
An array of style types The array can contain any of the following lsquocolorrsquo lsquosizersquo lsquotextrsquolsquoabsrsquo The lsquocolorrsquo style means that the metabolites will be colored according to the loadeddataset The lsquosizersquo style means that the metabolites will be sized according to the loadeddataset The lsquotextrsquo style means that the data values will be displayed in the metabolitelabels The lsquoabsrsquo style means the the absolute values of metabolite values will be used fordata visualization
optionsmetabolite_compare_style(Default rsquodiffrsquo) How to compare to datasets Can be either lsquofoldrsquo lsquolog2_foldrsquo orlsquodiffrsquo
optionsmetabolite_scaleDefault
[ type min color fffaf0 size 20 type median color f1c470 size 30 type max color 800000 size 40 ]
An array of objects that define points on the data scale See the description of op-tionsreaction_scale for an explanation of the format
optionsmetabolite_no_data_color(Default rsquoffffffrsquo) The color of metabolites with no data value
optionsmetabolite_no_data_size(Default 10) The size of metabolites with no data value
View and build options
optionsidentifiers_on_map(Default rsquobigg_idrsquo) The identifiers that will be displayed in reaction metabolite andgene labels Can be lsquobigg_idrsquo or lsquonamersquo
optionshighlight_missing(Default false) If true then highlight in red reactions that are not in the loaded COBRAmodel
optionsallow_building_duplicate_reactions(Default true) If true then building duplicate reactions is allowed If false then dupli-cate reactions are hidden in Add reaction mode
optionscofactors(Default [rsquoatprsquo rsquoadprsquo rsquonadrsquo rsquonadhrsquo rsquonadprsquo rsquonadphrsquorsquogtprsquo rsquogdprsquo rsquohrsquo rsquocoarsquo rsquoumprsquo rsquoh20rsquo rsquoppirsquo]) A list of metabo-lite IDs to treat as cofactors These will be secondary metabolites in new reactions
Callbacks
optionsfirst_load_callbackA function to run after loading the Builder
42 Chapter 7 Contents
Escher Documentation Release 143
load_map(map_data[ should_update_data])Load a map for the loaded data Also reloads most of the Builder content
Arguments
bull map_data ndash The data for a map
bull should_update_data (Boolean) ndash (Default true) Whether data should be ap-plied to the map
load_model(model_data[ should_update_data])Load the cobra model from model data
Arguments
bull model_data ndash The data for a Cobra model (Parsing in done by escherCobraModel)
bull should_update_data (Boolean) ndash (Default true) Whether data should be ap-plied to the model
view_mode()Enter view mode
build_mode()Enter build mode
brush_mode()Enter brush mode
zoom_mode()Enter zoom mode
rotate_mode()Enter rotate mode
text_mode()Enter text mode
set_reaction_data(data)
Arguments
bull data (array) ndash An array of 1 or 2 objects where each object has keys that are reactionIDrsquos and values that are data points (numbers)
set_metabolite_data(data)
Arguments
bull data (array) ndash An array of 1 or 2 objects where each object has keys that are metaboliteIDrsquos and values that are data points (numbers)
set_gene_data(data clear_gene_reaction_rules)
Arguments
bull data (array) ndash An array of 1 or 2 objects where each object has keys that are gene IDrsquosand values that are data points (numbers)
Arguments
bull clear_gene_reaction_rules (Boolean) ndash (Optional Default false) In addi-tion to setting the data also turn of the gene_reaction_rules
78 JavaScript API 43
Escher Documentation Release 143
79 Python API
class escherBuilder(map_name=None map_json=None model=None model_name=Nonemodel_json=None embedded_css=None reaction_data=None metabo-lite_data=None gene_data=None local_host=None id=None safe=Falsekwargs)
A metabolic map that can be viewed edited and used to visualize data
This map will also show metabolic fluxes passed in during consruction It can be viewed as a standalone htmlinside a browswer Alternately the respresentation inside an IPython notebook will also display the map
Maps are stored in json files and are stored in a cache directory Maps which are not found will be downloadedfrom a map repository if found
Parameters
bull map_name ndash A string specifying a map to be downloaded from the Escher web server orloaded from the cache
bull map_json ndash A JSON string or a file path to a JSON file or a URL specifying a JSON fileto be downloaded
bull model ndash A Cobra model
bull model_name ndash A string specifying a model to be downloaded from the Escher web serveror loaded from the cache
bull model_json ndash A JSON string or a file path to a JSON file or a URL specifying a JSONfile to be downloaded
bull embedded_css ndash The CSS (as a string) to be embedded with the Escher SVG
bull reaction_data ndash A dictionary with keys that correspond to reaction ids and values thatwill be mapped to reaction arrows and labels
bull metabolite_data ndash A dictionary with keys that correspond to metabolite ids and valuesthat will be mapped to metabolite nodes and labels
bull gene_data ndash A dictionary with keys that correspond to gene ids and values that will bemapped to corresponding reactions
bull local_host ndash A hostname that will be used for any local files This is generally usedfor using the notebook offline and for testing in the IPython Notebook with modified Eschercode An example value for local_host is lsquohttplocalhost7778lsquo
bull id ndash Specify an id to make the javascript data definitions unique A random id is chosen bydefault
bull safe ndash If True then loading files from the filesytem is not allowed This is to ensure thesafety of using Builder within a web server
Keyword Arguments
These are defined in the Javascript API
bulluse_3d_transform
bullenable_search
bullfill_screen
bullzoom_to_element
bullfull_screen_button
44 Chapter 7 Contents
Escher Documentation Release 143
bullstarting_reaction
bullunique_map_id
bullprimary_metabolite_radius
bullsecondary_metabolite_radius
bullmarker_radius
bullgene_font_size
bullhide_secondary_metabolites
bullshow_gene_reaction_rules
bullhide_all_labels
bullreaction_styles
bullreaction_compare_style
bullreaction_scale
bullreaction_no_data_color
bullreaction_no_data_size
bulland_method_in_gene_reaction_rule
bullmetabolite_styles
bullmetabolite_compare_style
bullmetabolite_scale
bullmetabolite_no_data_color
bullmetabolite_no_data_size
bullidentifiers_on_map
bullhighlight_missing
bullallow_building_duplicate_reactions
bullcofactors
All keyword arguments can also be set on an existing Builder object using setter functions eg
my_builderset_reaction_styles(new_styles)
display_in_browser(ip=lsquo127001rsquo port=7655 n_retries=50 js_source=rsquowebrsquo menu=rsquoallrsquoscroll_behavior=rsquopanrsquo enable_editing=True enable_keys=True mini-fied_js=True never_ask_before_quit=False)
Launch a web browser to view the map
Parameters
bull ip ndash The IP address to serve the map on
bull port ndash The port to serve the map on If specified the port is occupied then a random freeport will be used
bull n_retries (int) ndash The number of times the server will try to find a port before quitting
bull js_source (string) ndash Can be one of the following
ndash web (Default) - Use JavaScript files from eschergithubio
79 Python API 45
Escher Documentation Release 143
ndash local - Use compiled JavaScript files in the local Escher installation Works offline
ndash dev - No longer necessary with source maps This now gives the same behavior aslsquolocalrsquo
bull menu (string) ndash Menu bar options include
ndash none - No menu or buttons
ndash zoom - Just zoom buttons
ndash all (Default) - Menu and button bar (requires Bootstrap)
bull scroll_behavior (string) ndash Scroll behavior options
ndash pan - Pan the map
ndash zoom - Zoom the map
ndash none (Default) - No scroll events
bull enable_editing (Boolean) ndash Enable the map editing modes
bull enable_keys (Boolean) ndash Enable keyboard shortcuts
bull minified_js (Boolean) ndash If True use the minified version of JavaScript and CSSfiles
bull never_ask_before_quit (Boolean) ndash Never display an alert asking if you wantto leave the page By default this message is displayed if enable_editing is True
display_in_notebook(js_source=rsquowebrsquo menu=rsquozoomrsquo scroll_behavior=rsquononersquo mini-fied_js=True height=500 enable_editing=False)
Embed the Map within the current IPython Notebook
Parameters
bull js_source (string) ndash Can be one of the following
ndash web (Default) - Use JavaScript files from eschergithubio
ndash local - Use compiled JavaScript files in the local Escher installation Works offline
ndash dev - No longer necessary with source maps This now gives the same behav-ior as lsquolocalrsquo
bull menu (string) ndash Menu bar options include
ndash none - No menu or buttons
ndash zoom - Just zoom buttons
ndash Note The all menu option does not work in an IPython notebook
bull scroll_behavior (string) ndash Scroll behavior options
ndash pan - Pan the map
ndash zoom - Zoom the map
ndash none - (Default) No scroll events
bull minified_js (Boolean) ndash If True use the minified version of JavaScript andCSS files
bull height ndash Height of the HTML container
bull enable_editing (Boolean) ndash Enable the map editing modes
46 Chapter 7 Contents
Escher Documentation Release 143
save_html(filepath=None overwrite=False js_source=rsquowebrsquo protocol=rsquohttpsrsquo menu=rsquoallrsquoscroll_behavior=rsquopanrsquo enable_editing=True enable_keys=True minified_js=Truenever_ask_before_quit=False static_site_index_json=None)
Save an HTML file containing the map
Parameters
bull filepath (string) ndash The HTML file will be saved to this location Whenjs_source is lsquolocalrsquo then a new directory will be created with this name
bull overwrite (Boolean) ndash Overwrite existing files
bull js_source (string) ndash Can be one of the following
ndash web (Default) - Use JavaScript files from eschergithubio
ndash local - Use compiled JavaScript files in the local Escher installation Works of-fline To make the dependencies available to the downloaded file a new directorywill be made with the name specified by filepath
ndash dev - No longer necessary with source maps This now gives the same behav-ior as lsquolocalrsquo
bull protocol (string) ndash The protocol can be lsquohttprsquo lsquohttpsrsquo or None which indicatesa lsquoprotocol relative URLrsquo as in eschergithubio Ignored if source is local
bull menu (string) ndash Menu bar options include
ndash none - No menu or buttons
ndash zoom - Just zoom buttons
ndash all (Default) - Menu and button bar (requires Bootstrap)
bull scroll_behavior (string) ndash Scroll behavior options
ndash pan - Pan the map
ndash zoom - Zoom the map
ndash none (Default) - No scroll events
bull enable_editing (Boolean) ndash Enable the map editing modes
bull enable_keys (Boolean) ndash Enable keyboard shortcuts
bull minified_js (Boolean) ndash If True use the minified version of JavaScript andCSS files
bull height (number) ndash Height of the HTML container
bull never_ask_before_quit (Boolean) ndash Never display an alert asking if youwant to leave the page By default this message is displayed if enable_editing isTrue
bull static_site_index_json (string) ndash The index as a JSON string for thestatic site Use javascript to parse the URL options Used for generating static pages(see static_sitepy)
791 Cache
escherget_cache_dir(versioned=True name=None)Get the cache dir as a string and make the directory if it does not already exist
Parameters
79 Python API 47
Escher Documentation Release 143
bull versioned (Boolean) ndash Whether to return the versioned path in the cache Eschermaps for the latest version of Escher are found in the versioned directory (versioned= True) but maps for previous versions of Escher can be found by visiting the parentdirectory (versioned = False)
bull name (string) ndash An optional subdirectory within the cache If versioned is False thenname is ignored
escherclear_cache(different_cache_dir=None ask=True)Empty the contents of the cache directory including all versions of all maps and models
Parameters
bull different_cache_dir (string) ndash (Optional) The directory of another cacheThis is mainly for testing
bull ask (Boolean) ndash Whether to ask before deleting
escherlist_cached_maps()Return a list of all cached maps
escherlist_cached_models()Return a list of all cached models
escherlist_available_maps()Return a list of all maps available on the server
escherlist_available_models()Return a list of all models available on the server
710 License
Escher and EscherConverter are distributed under the MIT license
bull genindex
48 Chapter 7 Contents
Python Module Index
eescher 44
49
Escher Documentation Release 143
50 Python Module Index
Index
Bbrush_mode() (built-in function) 43build_mode() (built-in function) 43Builder (class in escher) 44
Cclear_cache() (in module escher) 48
Ddisplay_in_browser() (escherBuilder method) 45display_in_notebook() (escherBuilder method) 46
Eescher (module) 44escherBuilder() (class) 39
Gget_cache_dir() (in module escher) 47
Llist_available_maps() (in module escher) 48list_available_models() (in module escher) 48list_cached_maps() (in module escher) 48list_cached_models() (in module escher) 48load_map() (built-in function) 42load_model() (built-in function) 43
Ooptionenable_keys (option attribute) 40optionsallow_building_duplicate_reactions (options at-
tribute) 42optionsand_method_in_gene_reaction_rule (options at-
tribute) 41optionscofactors (options attribute) 42optionsenable_editing (options attribute) 39optionsenable_search (options attribute) 40optionsfill_screen (options attribute) 40optionsfirst_load_callback (options attribute) 42optionsfull_screen_button (options attribute) 40optionsgene_data (options attribute) 41
optionsgene_font_size (options attribute) 40optionshide_all_labels (options attribute) 40optionshide_secondary_metabolites (options attribute)
40optionshighlight_missing (options attribute) 42optionsidentifiers_on_map (options attribute) 42optionsignore_bootstrap (options attribute) 40optionsmarker_radius (options attribute) 40optionsmenu (options attribute) 39optionsmetabolite_compare_style (options attribute) 42optionsmetabolite_data (options attribute) 42optionsmetabolite_no_data_color (options attribute) 42optionsmetabolite_no_data_size (options attribute) 42optionsmetabolite_scale (options attribute) 42optionsmetabolite_styles (options attribute) 42optionsnever_ask_before_quit (options attribute) 40optionsprimary_metabolite_radius (options attribute) 40optionsreaction_compare_style (options attribute) 41optionsreaction_data (options attribute) 40optionsreaction_no_data_color (options attribute) 41optionsreaction_no_data_size (options attribute) 41optionsreaction_scale (options attribute) 41optionsreaction_styles (options attribute) 41optionsscroll_behavior (options attribute) 39optionssecondary_metabolite_radius (options attribute)
40optionsshow_gene_reaction_rules (options attribute) 40optionsstarting_reaction (options attribute) 40optionsunique_map_id (options attribute) 40optionsuse_3d_transform (options attribute) 39
Rrotate_mode() (built-in function) 43
Ssave_html() (escherBuilder method) 46set_gene_data() (built-in function) 43set_metabolite_data() (built-in function) 43set_reaction_data() (built-in function) 43
51
Escher Documentation Release 143
Ttext_mode() (built-in function) 43
Vview_mode() (built-in function) 43
Zzoom_mode() (built-in function) 43
52 Index

Escher Documentation Release 143
8 Chapter 3 Features
CHAPTER 4
Supported browsers
We recommend using Google Chrome for optimal performance but Escher will also run in the latest versions ofFirefox Internet Explorer and Safari (including mobile Safari)
9
Escher Documentation Release 143
10 Chapter 4 Supported browsers
CHAPTER 5
Installation
Escher can be used without any installation by visiting the Escher website However you can install escher if youwould like to (1) run Escher offline (2) include your own maps and models in the launch page (3) view Escher mapsin an IPython Notebook or (4) modify the source code
To install the latest stable version of Escher run
pip install escher
For more information see the documentation on Run Escher locally and in IPython and Developing with Escher
11
Escher Documentation Release 143
12 Chapter 5 Installation
CHAPTER 6
Citing Escher
You can help support Escher by citing our publication when you use Escher or EscherConverter
Zachary A King Andreas Draumlger Ali Ebrahim Nikolaus Sonnenschein Nathan E Lewis and Bernhard O Pals-son (2015) Escher A web application for building sharing and embedding data-rich visualizations of biologicalpathways PLOS Computational Biology 11(8) e1004321 doi101371journalpcbi1004321
13
Escher Documentation Release 143
14 Chapter 6 Citing Escher
CHAPTER 7
Contents
71 Getting started
711 Introduction
Escher is here to help you visualize pathway maps But if you have never heard of a pathway map you mightappreciate a quick introduction
What are pathway maps
To understand pathway maps it is useful to think about the general organization of a cell At the smallest levelmolecules in a cell are arranged in three-dimensional structures and these structures determine many of the functionsthat take place in a cell For example the 3D structure of an enzyme determines the biochemical reactions that it cancatalyze These structures can be visualized in 3D using tools like Jmol (as in this example structure)
The DNA sequence is a second fundamental level of biological organization DNA sequences are the blueprints for allthe machinery of the cell and they can be visualized as a one-dimensional series of bases (ATCG) using tools like theUCSC genome browser
To use a football analogy the 3D molecular structures are akin to the players on the field and the information in theDNA sequence is like the playbook on the sidelines But football would not be very interesting if the players nevertook to the field and executed those plays So we are missing this level of detail the execution of biological plans bythe molecular players
What we are missing is the biochemical reaction network Proteins in the cell catalyze the conversion of substratemolecules into product molecules and these reactions are responsible for generating energy constructing cellularmachinery and structures detecting molecules in the environment signaling and more Biochemical reactions canbe grouped into pathways when they work in concert to carry out a function (If a reaction is a football play thenthe pathway is a drive) And Escher can be used to visualize these reactions and pathways Together we call thesevisualizations pathway maps
Escher to the rescue
Many Escher maps represent metabolic pathways and Escher was developed at the Systems Biology Research Groupwhere we have been building genome-scale models of metabolism over the past fifteen years However Escher is notlimited to metabolism It can be used to visualize any collection of biochemical reactions
Escher includes one more killer feature The ability to visualize datasets on a pathway map Many biological discov-eries are enabled by collecting and analyzing enormous datsets and so biologists are grappling with the challenges ofbig data By visualizing data in the context of pathway maps we can quickly spot trends which would not be apparent
15
Escher Documentation Release 143
with standard statistical tools And Escher visualizations can be adapted and shared to demonstrate those biologicaldiscoveries
The rest of this guide will introduce the Escher user interface and the major features of Escher
712 The launch page
When you open the Escher website you will see a launch page that looks like this
The options on the launch page are
bull Filter by organism Choose an organism to filter the Maps and Models
bull Map Choose a pre-built map or start from scratch with an empty builder by choosing None In parenthesesnext to the map name you will see the name of the model that was used to build this map
bull Model (Optional) If you choose a COBRA model to load then you can add new reactions to the pathway mapYou can also load your own model later after you launch the tool For an explanation of maps models andCOBRA see Escher COBRA and COBRApy
bull Tool
ndash The Viewer allows you to pan and zoom the map and to visualize data for reactions genes and metabo-lites
ndash The Builder in addition to the Viewer features allows you to add reactions move and rotate existingreactions add text annotations and adjust the map canvas
bull Options
ndash Scroll to zoom (instead of scroll to pan) Determines the effect of using the mousersquos scroll wheel overthe map
ndash Never ask before reloading If this is checked then you will not be warned before leaving the page evenif you have unsaved changes
Choose Load map to open the Escher viewer or builder in a new tab and prepare to be delighted by your very ownpathway map
16 Chapter 7 Contents
Escher Documentation Release 143
713 The menu bar
Once you have loaded an Escher map you will see a menu bar along the top of the screen Click the question mark tobring up the Escher documentation
714 Loading and saving maps
Using the map menu you can load and save maps at any time
Click Save map JSON to save the Escher map as a JSON file which is the standard file representing an Escher map
NOTE The JSON file does NOT save any datasets you have loaded This may be changed in a future version ofEscher
NOTE 2 In Safari saving files from Escher works a little differently than in the other major browsers After clickingSave map JSON Safari will load a new tab with the raw content of the Escher map file To save the file chooseFilegtSave As from the Safari menu A new dialog appears in the dropdown menu near the bottom select PageSource (rather than Web Archive) give your file an appropriate name (eg mapjson for an Escher map or mapsvgfor an SVG export) and click Save
Later you can can load a JSON file to view and edit a map by clicking Load map JSON
Click Export as SVG to generate a SVG file for editing in tools like Adobe Illustrator and Inkscape This is thebest way to generate figures for presentations and publications Unlike a JSON file a SVG file maintains the datavisualizations on the Escher map However you cannot load SVG files into Escher after you generate them
Click Clear Map to empty the whole map leaving a blank canvas NOTE You cannot undo Clear Map
715 Loading models
Use the model menu to manage the COBRA model loaded in Escher
71 Getting started 17
Escher Documentation Release 143
Choose Load COBRA model JSON to open a COBRA model Read more about COBRA models in Escher COBRAand COBRApy Once you have COBRApy v030 or later installed then you can generate a JSON model by followingthis example code
Once you have loaded a COBRA model there may be inconsistencies between the content in the map and the model(eg reaction IDs descriptive names and gene reaction rules) You click Update names and gene reaction rulesusing model to find matching reactions and metabolites between the map and the model (based on their IDs) andthen apply the names and gene reaction rules from the model to the map The reactions that do not match will behighlighted in red (This can be turned off again in the settings menu by deselecting Highlight reactions not in model)More advice on building maps is available in Building and contributing maps
Click Clear Model to clear the current model
716 Loading reaction gene and metabolite data
Datasets can be loaded as CSV files or JSON files using the Data Menu
In Escher reaction and gene datasets are visualized by changing the color thickness and labels of reaction arrowsMetabolite datasets are visualized by changing the color size and labels of metabolite circles The specific visualstyles can be modified in the Settings menu When data is not present for a specific reaction gene or metabolite thenthe text label will say lsquondrsquo which means lsquono datarsquo
18 Chapter 7 Contents
Escher Documentation Release 143
The structure of a CSV file
CSV files should have 1 header row 1 ID column and either 1 or 2 columns for data values The ID column cancontain BiGG IDs or descriptive names for the reactions metabolites or genes in the dataset Here is an example witha single data value columns
IDtime 0secglc__D_c54g6p__D_c23
Which might look like this is Excel
ID time 0secglc__D_c 54g6p_c 23
If two datasets are provided then the Escher map will display the difference between the datasets In the Settings menuthe Comparison setting allows you to choose between comparison functions (Fold Change Log2(Fold Change) andDifference) With two datasets the CSV file looks like this
ID time 0sec time 5sglc__D_c 54 102g6p_c 23 81
Data can also be loaded from a JSON file This Python code snippet provides an example of generating the properformat for single reaction data values and for reaction data comparisons
import json
save a single flux vector as JSONflux_dictionary = glc__D_c 54 g6p_c 23with open(outjson w) as f
jsondump(flux_dictionary f)
save a flux comparison as JSON
71 Getting started 19
Escher Documentation Release 143
flux_comp = [glc__D_c 54 g6p_c 23 glc__D_c 102 g6p_c 81]with open(out_compjson w) as f
jsondump(flux_comp f)
Gene data and gene reaction rules
Escher uses gene reaction rules to connect gene data to the reactions on a metabolic pathway You can see these genereaction rules on the map by selecting Show gene reaction rules in the Settings menu
Gene reaction rules show the genes whose gene products are required to catalyze a reaction Gene are connected usingAND and OR rules AND rules are used when two genes are required for enzymatic activity eg they are membersof a protein complex OR rules are used when either gene can catalyze the enzymatic activity eg they are isozymes
With OR rules Escher will take the sum of the data values for each gene With AND rules Escher will either takethe mean (the default) or the minimum of the components The AND behavior (mean vs minimum) is defined in theSettings menu
717 Editing and building
The Edit menu gives you access to function for editing the map
20 Chapter 7 Contents
Escher Documentation Release 143
Escher has five major modes and you can switch between those modes using the buttons in the Edit menu or usingthe buttons in the button bar on the left of the screen
1 Pan mode Drag the canvas to pan the map You can also use the mouse scroll wheel or trackpad scroll function(drag with 2 fingers) to pan the map (or to zoom if you selected Scroll to zoom in the settings)
2 Select mode Select nodes by clicking on them Shift-click to select multiple nodes or drag across the canvasto select multiple nodes using the selection brush
3 Add reaction mode If you have loaded a Model then click on the canvas to see a list of reactions that you candraw on the map Click on a node to see reactions that connect to that node In the input box you can search byreaction ID metabolite ID or gene ID (locus tag)
4 Rotate model Before entering rotate mode be sure to select one or more nodes in select mode Then afterentering rotate mode drag anywhere on the canvas to rotate the selection You can also drag the red crosshairsto change the center of the rotation
5 Text mode Use text mode to add text annotations to the map Click on the canvas to add a new text annotationor click an existing annotation to edit it When you are finished click Enter or Escape to save the changes
71 Getting started 21
Escher Documentation Release 143
In addition to the editing modes the Edit menu gives you access to the following commands
bull Delete Delete the currently selected node(s)
bull Undo Undo the last action NOTE Certain actions such as editing the canvas cannot be undone in the currentversion of Escher
bull Redo Redo the last action that was undone
bull Toggle primarysecondary node In Escher each metabolite node is either a primary node or a secondarynode Primary nodes are larger and secondary nodes can be hidden in the Settings menu Use this command totoggle the currently selected node(s) between primary and secondary
bull Rotate reactant locations When you draw a new reaction in Escher this command will rotate the new reactantsso that a new reactant is primary and centered This command is extremely useful when you are drawing a longpathway and you want to quickly switch which metabolite to ldquofollowrdquo eg make sure you are following thecarbon-containing metabolites
If you are confused then try drawing a new pathway and hitting the ldquocrdquo key to see the reactants rotate
bull Select all Select all nodes
bull Select none Unselect all nodes
bull Invert selection Select all the nodes that are currently unselected This feature is very useful when you wantto keep just one part of the map Simply drag to select the part you want to keep call the Invert selectioncommand then call the Delete command
718 Editing the canvas
A somewhat non-obvious feature of Escher is that you can edit the canvas by dragging the canvas edges This ispossible in Pan mode and Select mode
22 Chapter 7 Contents
Escher Documentation Release 143
719 View options
bull Zoom in Zoom in to the map
bull Zoom out Zoom out of the map
bull Zoom to nodes Zoom to see all the nodes on the map
bull Zoom to canvas Zoom to see the entire canvas
bull Find Search for a reaction metabolite or gene on the map
bull Show control points Show the control points you can drag these red and blue circle to adjust the shapes ofthe reactions curves
bull Settings Open the Settings menu
7110 The button bar
The button bar give you quick access to many of the common Escher functions
71 Getting started 23
Escher Documentation Release 143
24 Chapter 7 Contents
Escher Documentation Release 143
7111 Settings
View and build options
bull Identifiers Choose whether to show BiGG IDs or descriptive names for reactions metabolites and genes
bull Hide secondary metabolites This will simplify the map by hiding all secondary metabolites and the pathsconnected to them
bull Show gene reaction rules Show the gene reaction rules below the reaction labels even gene data is not loaded
bull Hide reaction gene and metabolite labels Another option to visually simplify the map this will hide alllabels that are not text annotations
bull Allow duplicate reactions By default duplicate reactions are hidden in the add reaction dropdown menuHowever you can turn this option on to show the duplicate reactions
bull Highlight reactions not in model Highlight in red any reactions that are on the map but are not in the modelThis is useful when you are adapting a map from one model for use with another model
71 Getting started 25
Escher Documentation Release 143
Reaction data settings
When reaction or gene data is loaded this section can be used to change visual settings for reactions
The color bar has individual control points and you can drag the control points (execpt min and max) left and right tochange their values Alternatively you can use the dropdown menu (next to the word median in the figure above) toattach a control point to a statistical measure (mean median first quartile (Q1) or third quartile (Q3)) This lets youchoose a color scale that will adapt to your dataset
For each control point you can choose a color by entering a CSS-style color (eg red ff0000 rgba(20 20 255 05)and you can choose a size that will scale the thickness of reactions
There are also color and size options for reactions that do not have any data value
Finally there are a few onoff settings for the loaded reaction or gene dataset
bull Options These determine how to visualize the datasets Check Absolute value to color and size reactions bythe absolute value of each data value The Size Color and Text options can be unselected to turn off sizingcoloring and data values in reaction labels individually
bull Comparison Determines the comparison algorithm to use when two datasets are loaded
bull Method for evaluating AND Determines the method that will be used to reconcile AND statements in genereaction rules when there is gene data loaded See Gene data and gene reaction rules for more details
Metabolite data settings
The data settings for metabolite data are analagous to those for reaction data The only difference is that size nowrefers to the size of the metabolite circles
26 Chapter 7 Contents
Escher Documentation Release 143
72 Escher COBRA and COBRApy
Escher can be used as an independent application but it draws heavily on the information in COBRA models ACOBRA model is a collection of all the reactions metabolites and genes known to exist in an organism (In theliterature these are generally called genome-scale models (GEMs) but we refer to them as COBRA models here toemphasize that Escher interoperates with models that are exported from COBRApy)
By loading a COBRA model into the Escher interface you have access to every reaction and metabolite in that modelYou also have the gene reaction rules for the reactions in the network which allow you to connect gene data toreactions and metabolites
COBRApy is a software package for COBRA modeling written in Python The Escher Python package uses CO-BRApy package for reading and writing COBRA models
721 Maps and models
In Escher you will see references to maps and models
A map contains the reactions and metabolites that you see in the Escher builder including their locations text annota-tions and the canvas
A model (a COBRA model) contains reactions and metabolites that you have not drawn yet Thus you can load aCOBRA model when you want to draw new reactions on the map
722 What is JSON and why do we use it
Both Escher maps and COBRA models are stored as JSON files JSON is a useful plain-text format for storing nesteddata structures We use JSON much like the SBML community uses XML You may notice that SBML files have axml extension and Escher maps and COBRA models have a json extension
You can use Python to explore a JSON file like this
import json
with open(mapjson r) as fmap_object = jsonload(f)
print map_object[0]print map_object[1][reactions]values()[0]
723 Escher SBML and SBGN
A tool has been developed for converting Escher maps to SBML Layout and SBGN and it will be released soon
COBRA models can be converted to SBML using COBRApy
73 Run Escher locally and in IPython
To run Escher on a local computer or to use Escher in PythonIPython first install it The Python package for Eschercan be installed using pip
pip install escher
72 Escher COBRA and COBRApy 27
Escher Documentation Release 143
Depending on your installation of Python you may need sudo
sudo pip install escher
Alternatively one can download the source files and install the package directly
python setuppy install
731 Escher in the IPython Notebook
Once you have installed Escher locally you can interact with Escher maps in an IPython Notebook
Here are example notebooks to get started with
bull COBRApy and Escher
bull JavaScript development and offline maps
bull Generate JSON models in COBRApy
Dependencies
bull Jinja2
bull Tornado
bull COBRApy 030 or later
732 Running the local server
You can run your own local server if you want to use Escher offline or explore your own maps with the homepagebrowser To get started install the Python package and run from any directory by calling
python -m escherserver
This starts a server at httplocalhost7778 You can also choose another port
python -m escherserver --port=8005
74 Validate and convert maps
741 Validate an Escher map
Escher maps follow a specification using the JSON Schema format Therefore any JSON Schema validator can beused to validate an Escher map by comparing it to the latest schema file For example the current schema is locatedhere
httpsgithubcomzakandrewkingescherblobmasterescherjsonschema1-0-0
To make this easier the Escher Python package includes a validation script To validate a map first install Escher
pip install escher
Then call the validator
python -m eschervalidate my_mapjson
Any errors in the map will print to the console
28 Chapter 7 Contents
Escher Documentation Release 143
742 Convert or upgrade an Escher map
Any Escher maps built with pre-release versions of Escher will not load right away in the stable v10 release Toconvert pre-release maps to the new format follow these steps
1 Install Escher
pip install escher
2 Find a COBRA model for your maps This COBRA model will be used to update the content of the mapin order to support all the new Escher features You can use a COBRA model encoded as SBML or JSON(generated with COBRApy v030b4 or later) The COBRA models currently available on the Escher websitecan be downloaded from the BiGG Models website
httpbiggucsdedu
For a refresher on the distinction between Escher maps COBRA models and their file types (SBML JSONSBML Layout) see Escher COBRA and COBRApy
3 Run the convert_map script to convert your existing Escher map (my_old_mapjson) to the new formatusing a COBRA model (model_filejson or model_filexml in these examples)
With a JSON file modelpython -m escherconvert_map my_old_mapjson pathtomodel_filejson
With an SBML modelpython -m escherconvert_map my_old_mapjson pathtomodel_filexml
Those commands will generate a new map called my_old_map_convertedjson that will load in Escher v10and later
75 Building and contributing maps
We are excited to collect pathway maps for every organism with a well characterized metabolic network This sectiondescribes the process of building a new map either from scratch or using a COBRA model with BiGG IDs
751 Building from scratch
To build a map from scratch you will first need a COBRA model for your map See the section Escher COBRA andCOBRApy for some background information on COBRA models
If you would like to eventually contribute your map to the Escher website it is important that your COBRA modeladheres to the identifiers in the BiGG Database Escher and BiGG are being developed together and we want tomaintain consistency and interoperability between them
Once you have a COBRA model you can follow these steps
1 Load your model in the Escher Builder
2 Begin building new reactions If you are familiar with the genes in your organism then try search for newreactions by their gene IDs
3 Limit each map to ~200 reactions Maps larger than this will slow down the Escher viewer especially on oldbrowsers Rather than building one giant map Escher is designed for building many smaller subsystem maps
4 When you have built a map for your a subsystem save the map as JSON with a name that includes the modelID followed by a period followed by the name of the subsystem For example
75 Building and contributing maps 29
Escher Documentation Release 143
iMM904Amino acid biosynthesisjson
5 (Optional) Once you have a set of subsystem maps you can set up a local Escher server so that subsystem mapsappear in the ldquoquick jumprdquo menu in the bottom right corner of the screen (as seen here for iJO1366) To setthis up you will need to start a local server as describe in Running the local server Next find your local cachedirectory by running this command in a terminal
python -c import escher print(escherget_cache_dir(name=maps))
This will print the location of the local maps cache Add your new subsystem maps to cache folder Now whenyou run the server (described in Running the local server) you should see that quick jump menu appear
NOTE The cache directory is organized into folders for organisms You can use these folder for filtering byorganism on the local launch page or you can place the maps in the top directory
NOTE 2 A similar approach can be used to access your models from the local launch page Place maps in thefolder indicated by
python -c import escher print(escherget_cache_dir(name=models))
752 Building from an existing map for a similar organism
Follow the instruction above except rather than starting from scratch load an existing Escher map for a differentorganism
Once you have the new model loaded use the Update names and gene reaction rules using model button in theModel menu to convert all descriptive names and gene reaction rules in the model to those in the map Reactions thatdo not match the model will be highlighted in red (This can be turned off again in the settings menu by deselectingHighlight reactions not in model)
Now visit each highlighted reaction and see if you can replace it with an equivalent biochemical pathway from themodel If not then delete the reaction and move on
Finally when there are no highlighted reactions left you can repeat this for other subsystems
753 Submitting maps to the Escher website
If you would like to contribute maps to Escher you can make a Pull Request to the GitHub repository eschergithubioMake sure there is a folder with the name of the organism in 1-0-0maps For example a new yeast map goes inthe folder
1-0-0mapsSaccharomyces cerevisiae
Then name your map by concatenating the model ID and the map name separated by a period For example a yeastmap built with the genome-scale model iMM904 could be named
iMM904Amino acid biosynthesisjson
Then add the JSON file for the model to the Pull Request if that model is not already available As before make afolder for your organism within 1-0-0models The model filename is just the model ID
In this example a correct Pull Request would include the following files
1-0-0mapsSaccharomyces cerevisiaeiMM904Amino acid biosynthesisjson1-0-0modelsSaccharomyces cerevisiaeiMM904json
30 Chapter 7 Contents
Escher Documentation Release 143
76 Developing with Escher
761 Using the static JavaScript and CSS files
You can include the compiled Escher JavaScript and CSS files in any HTML document The only dependencies ared3js and optionally Twitter Bootstrap if you are using the option menu=rsquoallrsquo
The compiled files are available form npmcdn
httpsnpmcdncomescher-visjsdistescherjshttpsnpmcdncomescher-visjsdistescherminjshttpsnpmcdncomescher-viscssdistbuildercsshttpsnpmcdncomescher-viscssdistbuildermincss
Source maps are also hosted there
httpsnpmcdncomescher-visjsdistescherjsmaphttpsnpmcdncomescher-visjsdistescherminjsmaphttpsnpmcdncomescher-viscssdistbuildermincssmap
If you want a particular version of escher add a version tag like this
httpsnpmcdncomescher-vis140-beta3jsdistescherjs
For an example of the boilerplate code that is required to begin developing with Escher have a look at the escher-demorepository For projects built with npm use the escher-test repository as a guide
762 Building and testing Escher
First install dependencies with npm
npm install
Escher uses grunt to manage the build process To run typical build steps just run
npm run compile
To test the JavaScript files run
npm run test
For Python testing run this in the py directory
python setuppy test
Build the static website
python setuppy build_gh
Clear static website files
python setuppy clean
Build and run the docs
cd docsmake htmlcd _buildhtml
76 Developing with Escher 31
Escher Documentation Release 143
python -m SimpleHTTPServer python 2python -m httpserver python 3
763 Generating and reading Escher and COBRA files
The Escher file format
Escher layouts are defined by JSON files that follow a specific schema using json schema The latest schemafor Escher JSON files is here The Escher schemas are versioned with inspiration from SchemaVer Theeschervalidate module can be used to validate models against the schema
The Escher layout schema is designed to be as simple as possible For example the core metabolism map of Es-cherichia coli is layed out like this
[
map_name E coli coreCore metabolismmap_id 2938hoq32a1map_description E coli core metabolic networknLast Modified Fri Dec 05 2014 163944 GMT-0800 (PST)homepage httpseschergithubioschema httpseschergithubioescherjsonschema1-0-0
reactions nodes text_label canvas
x 7857062530517567y 31436893920898433width 5894515691375733height 4860457037353515
]
The map_name includes the model that was used to build this layout followed by a period and then a readable namefor the map The map_id is a unique identifier for this map The map_description describes the map and thelast time it was modified Both the homepage and the schema entries must have exactly these values for the Eschermap to be valid
In the next section the reactions nodes labels and canvas are all defined For reactions nodes and text labels eachelement has a key that is an arbitrary integer As long as there are no repeated IDs (eg no 2 segments with the ID517) then everything should work fine
Read through the schema (here) for more detail on the format
The COBRA file format
COBRA models are also saved as JSON files This format has not been documented with a schema but you canbrowse through the core metabolism model as a guide to generating valid COBRA models
I still need help
If you are interested in developing with Escher and you need more information than what is provided in the documen-tation please contact Zachary King (zaking-AT-ucsd-DOT-edu)
32 Chapter 7 Contents
Escher Documentation Release 143
77 EscherConverter
EscherConverter is a standalone program that reads files created with the graphical network editor Escher and convertsthem to files in community standard formats
Download EscherConverter 05 (137 MB)
771 Using EscherConverter
Escher uses a JSON file format to represent its networks This format has been developed because of its very small filesize and its compatibility to online programs that are written in JavaScript In particular JSON is a JavaScript ObjectNotation or in other words a JSON file directly represents components of JavaScript programs This makes parsingvery simple and allows direct use of those files in web-based programs
However in systems biology specific file formats have been developed with the aim to be easily exchangeable betweensoftware implemented in diverse programming languages
To this end these formats support semantically clear annotations and are maintained by a large community of scientistsEscherConverter supports export to two particularly important XML-based community file formats SBML with layoutextension and SBGN-ML
While SBML has been mainly developed for dynamic simulation of biological networks it is nowadays also usablefor diverse other purposes Its layout extension facilitates the encoding the display of biological networks
SBGN-ML has been directly developed as a language for the display of biological pathway maps of diverse kinds Itstores the position and connection of entities similar to what is shown in Escher networks
EscherConverter takes Escherrsquos JSON files as input and generates equivalent SBML Level 3 Version 1 files with layoutextension or SBGN-ML files
In order to ensure that the conversion is correct EscherConverter provides its own display that gives users a previewof how the export data format will be rendered by other tools In this preview display you can zoom in and out movearcs and node positions However it is important to know that none of the changes made in this preview are stored inthe export file
Download and Installation
You can obtain local copy of EscherConverter by clicking here
As a Javatrade application no specific installation is required for EscherConverter
However make sure you have a recent Javatrade Runtime Environment (JRE) installed on your computer (at least JRE8) You can obtain Javatrade from the Oracle website There you can also find installation instructions for your respectiveoperating system
Once Javatrade has been installed you can simply place the EscherConverter JAR file somewhere on your local computerfor instance in the folder
bull Applications if you are working under Mac OS
77 EscherConverter 33
Escher Documentation Release 143
bull opt for Linux computers
bull CProgram Files if you are using Windows
Launching the program
You can launch EscherConverter simply by double-clicking on the application JAR file This will open a followinggraphical user interface as described in the following figures
Figure 1 | The graphical user interface of EscherConverter
bull Preferences opens a settings dialog (see next screenshot)
bull Open displays a file chooser to select an input file in JSON format
bull Save export the map that is displayed in the current tab to SBML or SBGN-ML
bull Discard closes the current tab without saving
bull Help opens the online help that displays all command-line options
bull License displays the license under which this software is distributed
bull About shows information about the authors of this software
bull Main the main panel of the software in which converted Escher maps will be displayed organized in tabs
bull Status the status bar shows information and logging messages during the conversion
34 Chapter 7 Contents
Escher Documentation Release 143
Figure 2 | The preferences dialog All settings in this dialog are also available through EscherConverterrsquos command-line interface
Layout section several properties that are required in SBML and SBGN-ML are not explicitly specified in EscherrsquosJSON format and therefore need to be adjusted by the user These are the size of the drawing canvas the default boxsize for text labels the size of primary and secondary nodes In contrast to SBGN-ML and Escherrsquos JSON formatthe SBML layout extension supports three-dimensional displays When selecting this export file format it is thereforenecessary to also define the z-coordinate and the depth of all objects
Components and naming section Most settings in this section are specific for the SBML layout extension and areonly active if this output format is selected These are names and identifiers of the layout component and the in caseof SBML mandatory default compartment (a compartment without physical meaning a reaction space in which allmetabolites are located) EscherConverter can infer compartment bounds from metabolites but this is an experimentalfeature Just try it and see how the preview changes
77 EscherConverter 35
Escher Documentation Release 143
Figure 3 | A layout preview
The birds-eye view and the navigation component on the left help you navigate through the network display Thisgraph shows you how the converted pathway map will be rendered by software that supports SBGN-ML or the SBMLlayout extension This preview can be modified by moving arcs or nodes however none of those changes are storedwhen exporting the file In this current version EscherConver only exports layouts as given in the original JSON file
Included third-party software
EscherConverter includes several third-party libraries which we here list and acknowledge
bull ArgParser
bull JSBML
bull libSBGN
bull Pixel-Mixer icons
bull yFiles
772 Command-line interface API
You can launch EscherConverter from the command-line On a Unix system (such as Linux MacOS or Solaris etc)use a command like
bash$ java -jar -Xms8G -Xmx8G -Duserlanguage=en EscherConverter-05jar [options]
Under Window use a command like
Cgt javaw -jar -Xms8G -Xmx8G -Duserlanguage=en EscherConverter-05jar [options]
Escher has a large collection of command-line options (see below) which can be useful if you want to launch theprogram with specific settings or if multiple files are to be converted in a batch mode It is even possible to completelydisable the graphical user interface
36 Chapter 7 Contents
Escher Documentation Release 143
Input and output files
Definition of input and output data files as well as the format for the output
--input=ltFilegt
Specifies the JSON input file If a directory is given the conversion will be recursively performed Accepts JSON
--output=ltFilegt
The path to the file into which the output should be written If the input is a directory this must also be a directory inorder to perform a recursive conversion Accepts SBML SBGN
Escher layout
The options in this group allow you to influence how large certain elements should be displayed
--canvas-default-height=ltDoublegt
Just as in the case of the width of the canvas this value needs to be specified for cases where the JSON input file lacksan explicit specification of the canvas height Arguments must fit into the range [11E9] (Default value 2500)
--canvas-default-width=ltDoublegt
This value is used when no width has been defined for the canvas Since the width attribute is mandatory for the layouta default value must be provided in these cases Arguments must fit into the range [11E9] (Default value 2500)
--label-height=ltDoublegt
With this option you can specify the height of the bounding box of text labels Arguments must fit into the range[11E9] (Default value 500)
--label-width=ltDoublegt
This option defines the width of bounding boxes for text labels Arguments must fit into the range [11E9] (Defaultvalue 1600)
--node-depth=ltDoublegt
The length of nodes along z-coordinate Escher maps are actually two-dimensional but in general a layout can bethree-dimensional This value should be an arbitrary value greater than zero because some rendering engines mightnot display the node if its depth is zero Arguments must fit into the range [11E9] (Default value 10)
--node-label-height=ltDoublegt
Node labels can have a size different from general labels in the graph Here you can specify how height the boundingbox of the labels for nodes should be Arguments must fit into the range [11E9] (Default value 200)
--primary-node-height=ltDoublegt
The primary node should be bigger than the secondary node With this option you can specify the height of this typeof nodes Arguments must fit into the range [11E9] (Default value 300)
--primary-node-width=ltDoublegt
Escher maps distinguish between primary and secondary nodes Primary nodes should be larger than secondary nodesand display the main flow of matter through the network This option allows you to specify the width of primarynodes Arguments must fit into the range [11E9] (Default value 300)
77 EscherConverter 37
Escher Documentation Release 143
--reaction-label-height=ltDoublegt
Reaction label heightArguments must fit into the range [11E9] (Default value 300)
--reaction-node-ratio=ltDoublegt
This value is used as a conversion factor to determine the size of the reaction display box depending on the size ofprimary nodes Height and width of reaction nodes are determined by dividing the corresponding values from theprimary node size by this factor Arguments must fit into the range [01] (Default value 05)
--secondary-node-ratio=ltDoublegt
Similar to the reaction node ratio the size of secondary nodes (width and height) is determined by dividing thecorresponding values from the primary nodes by this value Arguments must fit into the range [01] (Default value06666666666666666)
--z=ltDoublegt
The position on the z-axis where the entire two-dimensional graph should be drawn Arguments must fit into the range[-1E91E9] (Default value 00)
Escher Components and their naming
Here you can influence which elements are to be included in the layout and how elements in the layout are to be calledor identified
--format=ltOutputFormatgt
The desired format for the conversion eg SBML All possible values for type ltOutputFormatgt are SBGN andSBML (Default value SBML)
--layout-id=ltStringgt
In contrast to the name this identifier does not have to be human-readable This is a machine identifier which muststart with a letter or underscore and can only contain ASCII characters (Default value Escher_Layout)
--layout-name=ltStringgt
This should be a human-readable name for the layout that is to be created This name might be displayed to describethe figure and should therefore be explanatory (Default value Escher Layout)
--compartment-id=ltStringgt
A compartment needs to have a unique identifier which needs to be a machine-readable Sting that must start with aletter or underscore and can only contain ASCII characters Since the JSON file does not provide this information thisoption allows you to specify the required identifier (Default value default)
--compartment-name=ltStringgt
With this option it is possible to define a name for the default compartment can be that needs to be generated for theconversion to SBML The name does not have any restrictions ie any UTF-8 character can be used (Default valueDefault compartment)
--infer-compartment-bounds
This converter can infer where the boundaries of compartments could be drawn To this end it uses each nodersquos BiGGids to identify the compartment of all metabolites Assuming that compartments have rectangular shapes the algorithmcan find the outermost node on each side of the box and hence obtain the boundaries of the compartment However
38 Chapter 7 Contents
Escher Documentation Release 143
this methods will fail when metabolites are drawn inside of such a box that belong to a different compartment that isactually further outside For this reason this option is deactivated by default (Default value false)
Options for the graphical user interface
--gui
If this option is given the program will display its graphical user interface (Default value false)
--log-level=ltStringgt
Change the log-level of this application This option will influence how fine-grained error and other log messages willbe that you receive while executing this program All possible values for type ltStringgt are ALL CONFIG FINEFINER FINEST INFO OFF SEVERE and WARNING (Default value INFO)
--log-file=ltFilegt
This option allows you to specify a log file to which all information of the program will be written Accepts (bp2bp3 log owl xml)
78 JavaScript API
class escherBuilder(map_data model_data embedded_css selection options)A Builder object contains all the UI and logic to generate a map builder or viewer
Arguments
bull map_data (object) ndash The data for a map to be passed to escherMapfrom_data() Ifnull then an empty Builder is initialized
bull model_data (object) ndash The data for a cobra model to be passed to es-cherCobraModel() Can be null
bull embedded_css (string) ndash The stylesheet for the SVG elements in the Escher map
bull selection (object) ndash (Optional Default In the body element) The d3 selection of anelement to place the Builder into The selection cannot be inside an SVG element
bull options (object) ndash (Optional) An object defining any of the following options
optionsmenu(Default rsquoallrsquo) The type of menu that will be displayed Can be lsquoallrsquo for the fullmenu or lsquozoomrsquo for just zoom buttons The lsquoallrsquo option requires the full set of Escherdependencies (D3js JQuery and Bootstrap) while the lsquozoomrsquo option requires only D3jsFor more details see Developing with Escher
optionsscroll_behavior(Default rsquopanrsquo) This option determines the effect that the scroll wheel will have onan Escher map Can be lsquopanrsquo to pan the map or lsquozoomrsquo to zoom the map when the usermoves the scroll wheel
optionsuse_3d_transform(Default Chooses a good option by testing the browser) If true then use CSS3 3D trans-forms to speed up panning and zooming This feature will only work on browsers thatsupport the 3D transforms It works best in the latest versions of Chrome Firefox andInternet Explorer Safari works better with this turned off
78 JavaScript API 39
Escher Documentation Release 143
optionsenable_editing(Default true) If true then display the map editing functions If false then hide themand only allow the user to view the map
optionenable_keys(Default true) If true then enable keyboard shortcuts
optionsenable_search(Default true) If true then enable indexing of the map for search Use false to disablesearching and potentially improve the map performance
optionsfill_screen(Default false) Use true to fill the screen when an Escher Builder is placed in a top-level container (eg a div in the body element)
optionsfull_screen_button(Default false) Include a button in the user interface for entering full screen mode
optionsignore_bootstrap(Default false) Do not use Bootstrap for buttons even if it available This is used toembed Escher in a Jupyter notebook where it conflicts with the Jupyter Boostrap installa-tion
Map model and styles
optionsstarting_reaction(Default null) The ID (as a string) of a reaction to draw when the Builder loads
optionsnever_ask_before_quit(Default false) If false then display a warning before the user closes an Eschermap If true then never display the warning This options is only respected if op-tionsenable_editing == true If enable_editing is false then the warnings are not dis-played
optionsunique_map_id(Default null) A unique ID that will be used to UI elements donrsquot interfere whenmultiple maps are in the same HTML document
optionsprimary_metabolite_radius(Default 15) The radius of primary metabolites in px
optionssecondary_metabolite_radius(Default 10) The radius of secondary metabolites in px
optionsmarker_radius(Default 5) The radius of marker nodes in px
optionsgene_font_size(Default 18) The font size of the gene reaction rules in px
optionshide_secondary_metabolites(Default false) If true then secondary nodes and segments are hidden This is conve-nient for generating simplified map figures
optionsshow_gene_reaction_rules(Default false) If true then show the gene reaction rules even without gene data
optionshide_all_labels(Default false) If checked hide all reaction gene and metabolite labels
Applied data
40 Chapter 7 Contents
Escher Documentation Release 143
optionsreaction_data(Default null) An object with reaction ids for keys and reaction data points for values
optionsreaction_stylesDefault [rsquocolorrsquo rsquosizersquo rsquotextrsquo]
An array of style types The array can contain any of the following lsquocolorrsquo lsquosizersquo lsquotextrsquolsquoabsrsquo The lsquocolorrsquo style means that the reactions will be colored according to the loadeddataset The lsquosizersquo style means that the reactions will be sized according to the loadeddataset The lsquotextrsquo style means that the data values will be displayed in the reactionlabels The lsquoabsrsquo style means the the absolute values of reaction values will be used fordata visualization
optionsreaction_compare_style(Default rsquodiffrsquo) How to compare to datasets Can be either lsquofold lsquolog2_foldrsquo orlsquodiffrsquo
optionsreaction_scaleDefault
[ type min color c8c8c8 size 12 type median color 9696ff size 20 type max color ff0000 size 25 ]
An array of objects that define points on the data scale
Each point is an object with a type attribute Types can be lsquominrsquo lsquomaxrsquo lsquomeanrsquo lsquoQ1rsquo (firstquartile) lsquomedianrsquo lsquoQ3rsquo (third quartile) or lsquovaluersquo Each point can have a color attributethat specifies a color with a string (any CSS color specification is allowed including hexrgb and rgba) Each point can have a size attirbute that specifies a reaction thickness as anumber Finally points with type lsquovaluersquo can have a value attribute that specifies an exactnumber for pont in the scale
NOTE If lsquominrsquo or lsquomaxrsquo is not provided Escher automatically adds them To be com-pletely clear about what you expect to see on the map it is best to provide lsquominrsquo andlsquomaxrsquo in addition to other scale points
Here are examples of each type
type rsquominrsquo color rsquoredrsquo size 12 Specifies that reactionsnear the minimum value are red and have thickness 12
type rsquoQ1rsquo color rsquorgba(100 100 50 05)rsquo size 12 Specifies that reactions near the first quartile have the given color opacity andthickness
type rsquomeanrsquo color rsquorgb(100 100 50)rsquo size 50 Specifies that reactions near the mean value have the given color and thickness
type rsquovaluersquo value 85 color rsquo333rsquo size 50 Specifies that reactions near 85 value have the given color and size
optionsreaction_no_data_color(Default rsquodcdcdcrsquo) The color of reactions with no data value
optionsreaction_no_data_size(Default 8) The size of reactions with no data value
optionsgene_data(Default null) An object with Gene ids for keys and gene data points for values
78 JavaScript API 41
Escher Documentation Release 143
optionsand_method_in_gene_reaction_rule(Default mean) When evaluating a gene reaction rule use this function to evaluate ANDrules Can be lsquomeanrsquo or lsquominrsquo
optionsmetabolite_data(Default null) An object with metabolite ids for keys and metabolite data points forvalues
optionsmetabolite_stylesDefault [rsquocolorrsquo rsquosizersquo rsquotextrsquo]
An array of style types The array can contain any of the following lsquocolorrsquo lsquosizersquo lsquotextrsquolsquoabsrsquo The lsquocolorrsquo style means that the metabolites will be colored according to the loadeddataset The lsquosizersquo style means that the metabolites will be sized according to the loadeddataset The lsquotextrsquo style means that the data values will be displayed in the metabolitelabels The lsquoabsrsquo style means the the absolute values of metabolite values will be used fordata visualization
optionsmetabolite_compare_style(Default rsquodiffrsquo) How to compare to datasets Can be either lsquofoldrsquo lsquolog2_foldrsquo orlsquodiffrsquo
optionsmetabolite_scaleDefault
[ type min color fffaf0 size 20 type median color f1c470 size 30 type max color 800000 size 40 ]
An array of objects that define points on the data scale See the description of op-tionsreaction_scale for an explanation of the format
optionsmetabolite_no_data_color(Default rsquoffffffrsquo) The color of metabolites with no data value
optionsmetabolite_no_data_size(Default 10) The size of metabolites with no data value
View and build options
optionsidentifiers_on_map(Default rsquobigg_idrsquo) The identifiers that will be displayed in reaction metabolite andgene labels Can be lsquobigg_idrsquo or lsquonamersquo
optionshighlight_missing(Default false) If true then highlight in red reactions that are not in the loaded COBRAmodel
optionsallow_building_duplicate_reactions(Default true) If true then building duplicate reactions is allowed If false then dupli-cate reactions are hidden in Add reaction mode
optionscofactors(Default [rsquoatprsquo rsquoadprsquo rsquonadrsquo rsquonadhrsquo rsquonadprsquo rsquonadphrsquorsquogtprsquo rsquogdprsquo rsquohrsquo rsquocoarsquo rsquoumprsquo rsquoh20rsquo rsquoppirsquo]) A list of metabo-lite IDs to treat as cofactors These will be secondary metabolites in new reactions
Callbacks
optionsfirst_load_callbackA function to run after loading the Builder
42 Chapter 7 Contents
Escher Documentation Release 143
load_map(map_data[ should_update_data])Load a map for the loaded data Also reloads most of the Builder content
Arguments
bull map_data ndash The data for a map
bull should_update_data (Boolean) ndash (Default true) Whether data should be ap-plied to the map
load_model(model_data[ should_update_data])Load the cobra model from model data
Arguments
bull model_data ndash The data for a Cobra model (Parsing in done by escherCobraModel)
bull should_update_data (Boolean) ndash (Default true) Whether data should be ap-plied to the model
view_mode()Enter view mode
build_mode()Enter build mode
brush_mode()Enter brush mode
zoom_mode()Enter zoom mode
rotate_mode()Enter rotate mode
text_mode()Enter text mode
set_reaction_data(data)
Arguments
bull data (array) ndash An array of 1 or 2 objects where each object has keys that are reactionIDrsquos and values that are data points (numbers)
set_metabolite_data(data)
Arguments
bull data (array) ndash An array of 1 or 2 objects where each object has keys that are metaboliteIDrsquos and values that are data points (numbers)
set_gene_data(data clear_gene_reaction_rules)
Arguments
bull data (array) ndash An array of 1 or 2 objects where each object has keys that are gene IDrsquosand values that are data points (numbers)
Arguments
bull clear_gene_reaction_rules (Boolean) ndash (Optional Default false) In addi-tion to setting the data also turn of the gene_reaction_rules
78 JavaScript API 43
Escher Documentation Release 143
79 Python API
class escherBuilder(map_name=None map_json=None model=None model_name=Nonemodel_json=None embedded_css=None reaction_data=None metabo-lite_data=None gene_data=None local_host=None id=None safe=Falsekwargs)
A metabolic map that can be viewed edited and used to visualize data
This map will also show metabolic fluxes passed in during consruction It can be viewed as a standalone htmlinside a browswer Alternately the respresentation inside an IPython notebook will also display the map
Maps are stored in json files and are stored in a cache directory Maps which are not found will be downloadedfrom a map repository if found
Parameters
bull map_name ndash A string specifying a map to be downloaded from the Escher web server orloaded from the cache
bull map_json ndash A JSON string or a file path to a JSON file or a URL specifying a JSON fileto be downloaded
bull model ndash A Cobra model
bull model_name ndash A string specifying a model to be downloaded from the Escher web serveror loaded from the cache
bull model_json ndash A JSON string or a file path to a JSON file or a URL specifying a JSONfile to be downloaded
bull embedded_css ndash The CSS (as a string) to be embedded with the Escher SVG
bull reaction_data ndash A dictionary with keys that correspond to reaction ids and values thatwill be mapped to reaction arrows and labels
bull metabolite_data ndash A dictionary with keys that correspond to metabolite ids and valuesthat will be mapped to metabolite nodes and labels
bull gene_data ndash A dictionary with keys that correspond to gene ids and values that will bemapped to corresponding reactions
bull local_host ndash A hostname that will be used for any local files This is generally usedfor using the notebook offline and for testing in the IPython Notebook with modified Eschercode An example value for local_host is lsquohttplocalhost7778lsquo
bull id ndash Specify an id to make the javascript data definitions unique A random id is chosen bydefault
bull safe ndash If True then loading files from the filesytem is not allowed This is to ensure thesafety of using Builder within a web server
Keyword Arguments
These are defined in the Javascript API
bulluse_3d_transform
bullenable_search
bullfill_screen
bullzoom_to_element
bullfull_screen_button
44 Chapter 7 Contents
Escher Documentation Release 143
bullstarting_reaction
bullunique_map_id
bullprimary_metabolite_radius
bullsecondary_metabolite_radius
bullmarker_radius
bullgene_font_size
bullhide_secondary_metabolites
bullshow_gene_reaction_rules
bullhide_all_labels
bullreaction_styles
bullreaction_compare_style
bullreaction_scale
bullreaction_no_data_color
bullreaction_no_data_size
bulland_method_in_gene_reaction_rule
bullmetabolite_styles
bullmetabolite_compare_style
bullmetabolite_scale
bullmetabolite_no_data_color
bullmetabolite_no_data_size
bullidentifiers_on_map
bullhighlight_missing
bullallow_building_duplicate_reactions
bullcofactors
All keyword arguments can also be set on an existing Builder object using setter functions eg
my_builderset_reaction_styles(new_styles)
display_in_browser(ip=lsquo127001rsquo port=7655 n_retries=50 js_source=rsquowebrsquo menu=rsquoallrsquoscroll_behavior=rsquopanrsquo enable_editing=True enable_keys=True mini-fied_js=True never_ask_before_quit=False)
Launch a web browser to view the map
Parameters
bull ip ndash The IP address to serve the map on
bull port ndash The port to serve the map on If specified the port is occupied then a random freeport will be used
bull n_retries (int) ndash The number of times the server will try to find a port before quitting
bull js_source (string) ndash Can be one of the following
ndash web (Default) - Use JavaScript files from eschergithubio
79 Python API 45
Escher Documentation Release 143
ndash local - Use compiled JavaScript files in the local Escher installation Works offline
ndash dev - No longer necessary with source maps This now gives the same behavior aslsquolocalrsquo
bull menu (string) ndash Menu bar options include
ndash none - No menu or buttons
ndash zoom - Just zoom buttons
ndash all (Default) - Menu and button bar (requires Bootstrap)
bull scroll_behavior (string) ndash Scroll behavior options
ndash pan - Pan the map
ndash zoom - Zoom the map
ndash none (Default) - No scroll events
bull enable_editing (Boolean) ndash Enable the map editing modes
bull enable_keys (Boolean) ndash Enable keyboard shortcuts
bull minified_js (Boolean) ndash If True use the minified version of JavaScript and CSSfiles
bull never_ask_before_quit (Boolean) ndash Never display an alert asking if you wantto leave the page By default this message is displayed if enable_editing is True
display_in_notebook(js_source=rsquowebrsquo menu=rsquozoomrsquo scroll_behavior=rsquononersquo mini-fied_js=True height=500 enable_editing=False)
Embed the Map within the current IPython Notebook
Parameters
bull js_source (string) ndash Can be one of the following
ndash web (Default) - Use JavaScript files from eschergithubio
ndash local - Use compiled JavaScript files in the local Escher installation Works offline
ndash dev - No longer necessary with source maps This now gives the same behav-ior as lsquolocalrsquo
bull menu (string) ndash Menu bar options include
ndash none - No menu or buttons
ndash zoom - Just zoom buttons
ndash Note The all menu option does not work in an IPython notebook
bull scroll_behavior (string) ndash Scroll behavior options
ndash pan - Pan the map
ndash zoom - Zoom the map
ndash none - (Default) No scroll events
bull minified_js (Boolean) ndash If True use the minified version of JavaScript andCSS files
bull height ndash Height of the HTML container
bull enable_editing (Boolean) ndash Enable the map editing modes
46 Chapter 7 Contents
Escher Documentation Release 143
save_html(filepath=None overwrite=False js_source=rsquowebrsquo protocol=rsquohttpsrsquo menu=rsquoallrsquoscroll_behavior=rsquopanrsquo enable_editing=True enable_keys=True minified_js=Truenever_ask_before_quit=False static_site_index_json=None)
Save an HTML file containing the map
Parameters
bull filepath (string) ndash The HTML file will be saved to this location Whenjs_source is lsquolocalrsquo then a new directory will be created with this name
bull overwrite (Boolean) ndash Overwrite existing files
bull js_source (string) ndash Can be one of the following
ndash web (Default) - Use JavaScript files from eschergithubio
ndash local - Use compiled JavaScript files in the local Escher installation Works of-fline To make the dependencies available to the downloaded file a new directorywill be made with the name specified by filepath
ndash dev - No longer necessary with source maps This now gives the same behav-ior as lsquolocalrsquo
bull protocol (string) ndash The protocol can be lsquohttprsquo lsquohttpsrsquo or None which indicatesa lsquoprotocol relative URLrsquo as in eschergithubio Ignored if source is local
bull menu (string) ndash Menu bar options include
ndash none - No menu or buttons
ndash zoom - Just zoom buttons
ndash all (Default) - Menu and button bar (requires Bootstrap)
bull scroll_behavior (string) ndash Scroll behavior options
ndash pan - Pan the map
ndash zoom - Zoom the map
ndash none (Default) - No scroll events
bull enable_editing (Boolean) ndash Enable the map editing modes
bull enable_keys (Boolean) ndash Enable keyboard shortcuts
bull minified_js (Boolean) ndash If True use the minified version of JavaScript andCSS files
bull height (number) ndash Height of the HTML container
bull never_ask_before_quit (Boolean) ndash Never display an alert asking if youwant to leave the page By default this message is displayed if enable_editing isTrue
bull static_site_index_json (string) ndash The index as a JSON string for thestatic site Use javascript to parse the URL options Used for generating static pages(see static_sitepy)
791 Cache
escherget_cache_dir(versioned=True name=None)Get the cache dir as a string and make the directory if it does not already exist
Parameters
79 Python API 47
Escher Documentation Release 143
bull versioned (Boolean) ndash Whether to return the versioned path in the cache Eschermaps for the latest version of Escher are found in the versioned directory (versioned= True) but maps for previous versions of Escher can be found by visiting the parentdirectory (versioned = False)
bull name (string) ndash An optional subdirectory within the cache If versioned is False thenname is ignored
escherclear_cache(different_cache_dir=None ask=True)Empty the contents of the cache directory including all versions of all maps and models
Parameters
bull different_cache_dir (string) ndash (Optional) The directory of another cacheThis is mainly for testing
bull ask (Boolean) ndash Whether to ask before deleting
escherlist_cached_maps()Return a list of all cached maps
escherlist_cached_models()Return a list of all cached models
escherlist_available_maps()Return a list of all maps available on the server
escherlist_available_models()Return a list of all models available on the server
710 License
Escher and EscherConverter are distributed under the MIT license
bull genindex
48 Chapter 7 Contents
Python Module Index
eescher 44
49
Escher Documentation Release 143
50 Python Module Index
Index
Bbrush_mode() (built-in function) 43build_mode() (built-in function) 43Builder (class in escher) 44
Cclear_cache() (in module escher) 48
Ddisplay_in_browser() (escherBuilder method) 45display_in_notebook() (escherBuilder method) 46
Eescher (module) 44escherBuilder() (class) 39
Gget_cache_dir() (in module escher) 47
Llist_available_maps() (in module escher) 48list_available_models() (in module escher) 48list_cached_maps() (in module escher) 48list_cached_models() (in module escher) 48load_map() (built-in function) 42load_model() (built-in function) 43
Ooptionenable_keys (option attribute) 40optionsallow_building_duplicate_reactions (options at-
tribute) 42optionsand_method_in_gene_reaction_rule (options at-
tribute) 41optionscofactors (options attribute) 42optionsenable_editing (options attribute) 39optionsenable_search (options attribute) 40optionsfill_screen (options attribute) 40optionsfirst_load_callback (options attribute) 42optionsfull_screen_button (options attribute) 40optionsgene_data (options attribute) 41
optionsgene_font_size (options attribute) 40optionshide_all_labels (options attribute) 40optionshide_secondary_metabolites (options attribute)
40optionshighlight_missing (options attribute) 42optionsidentifiers_on_map (options attribute) 42optionsignore_bootstrap (options attribute) 40optionsmarker_radius (options attribute) 40optionsmenu (options attribute) 39optionsmetabolite_compare_style (options attribute) 42optionsmetabolite_data (options attribute) 42optionsmetabolite_no_data_color (options attribute) 42optionsmetabolite_no_data_size (options attribute) 42optionsmetabolite_scale (options attribute) 42optionsmetabolite_styles (options attribute) 42optionsnever_ask_before_quit (options attribute) 40optionsprimary_metabolite_radius (options attribute) 40optionsreaction_compare_style (options attribute) 41optionsreaction_data (options attribute) 40optionsreaction_no_data_color (options attribute) 41optionsreaction_no_data_size (options attribute) 41optionsreaction_scale (options attribute) 41optionsreaction_styles (options attribute) 41optionsscroll_behavior (options attribute) 39optionssecondary_metabolite_radius (options attribute)
40optionsshow_gene_reaction_rules (options attribute) 40optionsstarting_reaction (options attribute) 40optionsunique_map_id (options attribute) 40optionsuse_3d_transform (options attribute) 39
Rrotate_mode() (built-in function) 43
Ssave_html() (escherBuilder method) 46set_gene_data() (built-in function) 43set_metabolite_data() (built-in function) 43set_reaction_data() (built-in function) 43
51
Escher Documentation Release 143
Ttext_mode() (built-in function) 43
Vview_mode() (built-in function) 43
Zzoom_mode() (built-in function) 43
52 Index

Escher Documentation Release 143
10 Chapter 4 Supported browsers
CHAPTER 5
Installation
Escher can be used without any installation by visiting the Escher website However you can install escher if youwould like to (1) run Escher offline (2) include your own maps and models in the launch page (3) view Escher mapsin an IPython Notebook or (4) modify the source code
To install the latest stable version of Escher run
pip install escher
For more information see the documentation on Run Escher locally and in IPython and Developing with Escher
11
Escher Documentation Release 143
12 Chapter 5 Installation
CHAPTER 6
Citing Escher
You can help support Escher by citing our publication when you use Escher or EscherConverter
Zachary A King Andreas Draumlger Ali Ebrahim Nikolaus Sonnenschein Nathan E Lewis and Bernhard O Pals-son (2015) Escher A web application for building sharing and embedding data-rich visualizations of biologicalpathways PLOS Computational Biology 11(8) e1004321 doi101371journalpcbi1004321
13
Escher Documentation Release 143
14 Chapter 6 Citing Escher
CHAPTER 7
Contents
71 Getting started
711 Introduction
Escher is here to help you visualize pathway maps But if you have never heard of a pathway map you mightappreciate a quick introduction
What are pathway maps
To understand pathway maps it is useful to think about the general organization of a cell At the smallest levelmolecules in a cell are arranged in three-dimensional structures and these structures determine many of the functionsthat take place in a cell For example the 3D structure of an enzyme determines the biochemical reactions that it cancatalyze These structures can be visualized in 3D using tools like Jmol (as in this example structure)
The DNA sequence is a second fundamental level of biological organization DNA sequences are the blueprints for allthe machinery of the cell and they can be visualized as a one-dimensional series of bases (ATCG) using tools like theUCSC genome browser
To use a football analogy the 3D molecular structures are akin to the players on the field and the information in theDNA sequence is like the playbook on the sidelines But football would not be very interesting if the players nevertook to the field and executed those plays So we are missing this level of detail the execution of biological plans bythe molecular players
What we are missing is the biochemical reaction network Proteins in the cell catalyze the conversion of substratemolecules into product molecules and these reactions are responsible for generating energy constructing cellularmachinery and structures detecting molecules in the environment signaling and more Biochemical reactions canbe grouped into pathways when they work in concert to carry out a function (If a reaction is a football play thenthe pathway is a drive) And Escher can be used to visualize these reactions and pathways Together we call thesevisualizations pathway maps
Escher to the rescue
Many Escher maps represent metabolic pathways and Escher was developed at the Systems Biology Research Groupwhere we have been building genome-scale models of metabolism over the past fifteen years However Escher is notlimited to metabolism It can be used to visualize any collection of biochemical reactions
Escher includes one more killer feature The ability to visualize datasets on a pathway map Many biological discov-eries are enabled by collecting and analyzing enormous datsets and so biologists are grappling with the challenges ofbig data By visualizing data in the context of pathway maps we can quickly spot trends which would not be apparent
15
Escher Documentation Release 143
with standard statistical tools And Escher visualizations can be adapted and shared to demonstrate those biologicaldiscoveries
The rest of this guide will introduce the Escher user interface and the major features of Escher
712 The launch page
When you open the Escher website you will see a launch page that looks like this
The options on the launch page are
bull Filter by organism Choose an organism to filter the Maps and Models
bull Map Choose a pre-built map or start from scratch with an empty builder by choosing None In parenthesesnext to the map name you will see the name of the model that was used to build this map
bull Model (Optional) If you choose a COBRA model to load then you can add new reactions to the pathway mapYou can also load your own model later after you launch the tool For an explanation of maps models andCOBRA see Escher COBRA and COBRApy
bull Tool
ndash The Viewer allows you to pan and zoom the map and to visualize data for reactions genes and metabo-lites
ndash The Builder in addition to the Viewer features allows you to add reactions move and rotate existingreactions add text annotations and adjust the map canvas
bull Options
ndash Scroll to zoom (instead of scroll to pan) Determines the effect of using the mousersquos scroll wheel overthe map
ndash Never ask before reloading If this is checked then you will not be warned before leaving the page evenif you have unsaved changes
Choose Load map to open the Escher viewer or builder in a new tab and prepare to be delighted by your very ownpathway map
16 Chapter 7 Contents
Escher Documentation Release 143
713 The menu bar
Once you have loaded an Escher map you will see a menu bar along the top of the screen Click the question mark tobring up the Escher documentation
714 Loading and saving maps
Using the map menu you can load and save maps at any time
Click Save map JSON to save the Escher map as a JSON file which is the standard file representing an Escher map
NOTE The JSON file does NOT save any datasets you have loaded This may be changed in a future version ofEscher
NOTE 2 In Safari saving files from Escher works a little differently than in the other major browsers After clickingSave map JSON Safari will load a new tab with the raw content of the Escher map file To save the file chooseFilegtSave As from the Safari menu A new dialog appears in the dropdown menu near the bottom select PageSource (rather than Web Archive) give your file an appropriate name (eg mapjson for an Escher map or mapsvgfor an SVG export) and click Save
Later you can can load a JSON file to view and edit a map by clicking Load map JSON
Click Export as SVG to generate a SVG file for editing in tools like Adobe Illustrator and Inkscape This is thebest way to generate figures for presentations and publications Unlike a JSON file a SVG file maintains the datavisualizations on the Escher map However you cannot load SVG files into Escher after you generate them
Click Clear Map to empty the whole map leaving a blank canvas NOTE You cannot undo Clear Map
715 Loading models
Use the model menu to manage the COBRA model loaded in Escher
71 Getting started 17
Escher Documentation Release 143
Choose Load COBRA model JSON to open a COBRA model Read more about COBRA models in Escher COBRAand COBRApy Once you have COBRApy v030 or later installed then you can generate a JSON model by followingthis example code
Once you have loaded a COBRA model there may be inconsistencies between the content in the map and the model(eg reaction IDs descriptive names and gene reaction rules) You click Update names and gene reaction rulesusing model to find matching reactions and metabolites between the map and the model (based on their IDs) andthen apply the names and gene reaction rules from the model to the map The reactions that do not match will behighlighted in red (This can be turned off again in the settings menu by deselecting Highlight reactions not in model)More advice on building maps is available in Building and contributing maps
Click Clear Model to clear the current model
716 Loading reaction gene and metabolite data
Datasets can be loaded as CSV files or JSON files using the Data Menu
In Escher reaction and gene datasets are visualized by changing the color thickness and labels of reaction arrowsMetabolite datasets are visualized by changing the color size and labels of metabolite circles The specific visualstyles can be modified in the Settings menu When data is not present for a specific reaction gene or metabolite thenthe text label will say lsquondrsquo which means lsquono datarsquo
18 Chapter 7 Contents
Escher Documentation Release 143
The structure of a CSV file
CSV files should have 1 header row 1 ID column and either 1 or 2 columns for data values The ID column cancontain BiGG IDs or descriptive names for the reactions metabolites or genes in the dataset Here is an example witha single data value columns
IDtime 0secglc__D_c54g6p__D_c23
Which might look like this is Excel
ID time 0secglc__D_c 54g6p_c 23
If two datasets are provided then the Escher map will display the difference between the datasets In the Settings menuthe Comparison setting allows you to choose between comparison functions (Fold Change Log2(Fold Change) andDifference) With two datasets the CSV file looks like this
ID time 0sec time 5sglc__D_c 54 102g6p_c 23 81
Data can also be loaded from a JSON file This Python code snippet provides an example of generating the properformat for single reaction data values and for reaction data comparisons
import json
save a single flux vector as JSONflux_dictionary = glc__D_c 54 g6p_c 23with open(outjson w) as f
jsondump(flux_dictionary f)
save a flux comparison as JSON
71 Getting started 19
Escher Documentation Release 143
flux_comp = [glc__D_c 54 g6p_c 23 glc__D_c 102 g6p_c 81]with open(out_compjson w) as f
jsondump(flux_comp f)
Gene data and gene reaction rules
Escher uses gene reaction rules to connect gene data to the reactions on a metabolic pathway You can see these genereaction rules on the map by selecting Show gene reaction rules in the Settings menu
Gene reaction rules show the genes whose gene products are required to catalyze a reaction Gene are connected usingAND and OR rules AND rules are used when two genes are required for enzymatic activity eg they are membersof a protein complex OR rules are used when either gene can catalyze the enzymatic activity eg they are isozymes
With OR rules Escher will take the sum of the data values for each gene With AND rules Escher will either takethe mean (the default) or the minimum of the components The AND behavior (mean vs minimum) is defined in theSettings menu
717 Editing and building
The Edit menu gives you access to function for editing the map
20 Chapter 7 Contents
Escher Documentation Release 143
Escher has five major modes and you can switch between those modes using the buttons in the Edit menu or usingthe buttons in the button bar on the left of the screen
1 Pan mode Drag the canvas to pan the map You can also use the mouse scroll wheel or trackpad scroll function(drag with 2 fingers) to pan the map (or to zoom if you selected Scroll to zoom in the settings)
2 Select mode Select nodes by clicking on them Shift-click to select multiple nodes or drag across the canvasto select multiple nodes using the selection brush
3 Add reaction mode If you have loaded a Model then click on the canvas to see a list of reactions that you candraw on the map Click on a node to see reactions that connect to that node In the input box you can search byreaction ID metabolite ID or gene ID (locus tag)
4 Rotate model Before entering rotate mode be sure to select one or more nodes in select mode Then afterentering rotate mode drag anywhere on the canvas to rotate the selection You can also drag the red crosshairsto change the center of the rotation
5 Text mode Use text mode to add text annotations to the map Click on the canvas to add a new text annotationor click an existing annotation to edit it When you are finished click Enter or Escape to save the changes
71 Getting started 21
Escher Documentation Release 143
In addition to the editing modes the Edit menu gives you access to the following commands
bull Delete Delete the currently selected node(s)
bull Undo Undo the last action NOTE Certain actions such as editing the canvas cannot be undone in the currentversion of Escher
bull Redo Redo the last action that was undone
bull Toggle primarysecondary node In Escher each metabolite node is either a primary node or a secondarynode Primary nodes are larger and secondary nodes can be hidden in the Settings menu Use this command totoggle the currently selected node(s) between primary and secondary
bull Rotate reactant locations When you draw a new reaction in Escher this command will rotate the new reactantsso that a new reactant is primary and centered This command is extremely useful when you are drawing a longpathway and you want to quickly switch which metabolite to ldquofollowrdquo eg make sure you are following thecarbon-containing metabolites
If you are confused then try drawing a new pathway and hitting the ldquocrdquo key to see the reactants rotate
bull Select all Select all nodes
bull Select none Unselect all nodes
bull Invert selection Select all the nodes that are currently unselected This feature is very useful when you wantto keep just one part of the map Simply drag to select the part you want to keep call the Invert selectioncommand then call the Delete command
718 Editing the canvas
A somewhat non-obvious feature of Escher is that you can edit the canvas by dragging the canvas edges This ispossible in Pan mode and Select mode
22 Chapter 7 Contents
Escher Documentation Release 143
719 View options
bull Zoom in Zoom in to the map
bull Zoom out Zoom out of the map
bull Zoom to nodes Zoom to see all the nodes on the map
bull Zoom to canvas Zoom to see the entire canvas
bull Find Search for a reaction metabolite or gene on the map
bull Show control points Show the control points you can drag these red and blue circle to adjust the shapes ofthe reactions curves
bull Settings Open the Settings menu
7110 The button bar
The button bar give you quick access to many of the common Escher functions
71 Getting started 23
Escher Documentation Release 143
24 Chapter 7 Contents
Escher Documentation Release 143
7111 Settings
View and build options
bull Identifiers Choose whether to show BiGG IDs or descriptive names for reactions metabolites and genes
bull Hide secondary metabolites This will simplify the map by hiding all secondary metabolites and the pathsconnected to them
bull Show gene reaction rules Show the gene reaction rules below the reaction labels even gene data is not loaded
bull Hide reaction gene and metabolite labels Another option to visually simplify the map this will hide alllabels that are not text annotations
bull Allow duplicate reactions By default duplicate reactions are hidden in the add reaction dropdown menuHowever you can turn this option on to show the duplicate reactions
bull Highlight reactions not in model Highlight in red any reactions that are on the map but are not in the modelThis is useful when you are adapting a map from one model for use with another model
71 Getting started 25
Escher Documentation Release 143
Reaction data settings
When reaction or gene data is loaded this section can be used to change visual settings for reactions
The color bar has individual control points and you can drag the control points (execpt min and max) left and right tochange their values Alternatively you can use the dropdown menu (next to the word median in the figure above) toattach a control point to a statistical measure (mean median first quartile (Q1) or third quartile (Q3)) This lets youchoose a color scale that will adapt to your dataset
For each control point you can choose a color by entering a CSS-style color (eg red ff0000 rgba(20 20 255 05)and you can choose a size that will scale the thickness of reactions
There are also color and size options for reactions that do not have any data value
Finally there are a few onoff settings for the loaded reaction or gene dataset
bull Options These determine how to visualize the datasets Check Absolute value to color and size reactions bythe absolute value of each data value The Size Color and Text options can be unselected to turn off sizingcoloring and data values in reaction labels individually
bull Comparison Determines the comparison algorithm to use when two datasets are loaded
bull Method for evaluating AND Determines the method that will be used to reconcile AND statements in genereaction rules when there is gene data loaded See Gene data and gene reaction rules for more details
Metabolite data settings
The data settings for metabolite data are analagous to those for reaction data The only difference is that size nowrefers to the size of the metabolite circles
26 Chapter 7 Contents
Escher Documentation Release 143
72 Escher COBRA and COBRApy
Escher can be used as an independent application but it draws heavily on the information in COBRA models ACOBRA model is a collection of all the reactions metabolites and genes known to exist in an organism (In theliterature these are generally called genome-scale models (GEMs) but we refer to them as COBRA models here toemphasize that Escher interoperates with models that are exported from COBRApy)
By loading a COBRA model into the Escher interface you have access to every reaction and metabolite in that modelYou also have the gene reaction rules for the reactions in the network which allow you to connect gene data toreactions and metabolites
COBRApy is a software package for COBRA modeling written in Python The Escher Python package uses CO-BRApy package for reading and writing COBRA models
721 Maps and models
In Escher you will see references to maps and models
A map contains the reactions and metabolites that you see in the Escher builder including their locations text annota-tions and the canvas
A model (a COBRA model) contains reactions and metabolites that you have not drawn yet Thus you can load aCOBRA model when you want to draw new reactions on the map
722 What is JSON and why do we use it
Both Escher maps and COBRA models are stored as JSON files JSON is a useful plain-text format for storing nesteddata structures We use JSON much like the SBML community uses XML You may notice that SBML files have axml extension and Escher maps and COBRA models have a json extension
You can use Python to explore a JSON file like this
import json
with open(mapjson r) as fmap_object = jsonload(f)
print map_object[0]print map_object[1][reactions]values()[0]
723 Escher SBML and SBGN
A tool has been developed for converting Escher maps to SBML Layout and SBGN and it will be released soon
COBRA models can be converted to SBML using COBRApy
73 Run Escher locally and in IPython
To run Escher on a local computer or to use Escher in PythonIPython first install it The Python package for Eschercan be installed using pip
pip install escher
72 Escher COBRA and COBRApy 27
Escher Documentation Release 143
Depending on your installation of Python you may need sudo
sudo pip install escher
Alternatively one can download the source files and install the package directly
python setuppy install
731 Escher in the IPython Notebook
Once you have installed Escher locally you can interact with Escher maps in an IPython Notebook
Here are example notebooks to get started with
bull COBRApy and Escher
bull JavaScript development and offline maps
bull Generate JSON models in COBRApy
Dependencies
bull Jinja2
bull Tornado
bull COBRApy 030 or later
732 Running the local server
You can run your own local server if you want to use Escher offline or explore your own maps with the homepagebrowser To get started install the Python package and run from any directory by calling
python -m escherserver
This starts a server at httplocalhost7778 You can also choose another port
python -m escherserver --port=8005
74 Validate and convert maps
741 Validate an Escher map
Escher maps follow a specification using the JSON Schema format Therefore any JSON Schema validator can beused to validate an Escher map by comparing it to the latest schema file For example the current schema is locatedhere
httpsgithubcomzakandrewkingescherblobmasterescherjsonschema1-0-0
To make this easier the Escher Python package includes a validation script To validate a map first install Escher
pip install escher
Then call the validator
python -m eschervalidate my_mapjson
Any errors in the map will print to the console
28 Chapter 7 Contents
Escher Documentation Release 143
742 Convert or upgrade an Escher map
Any Escher maps built with pre-release versions of Escher will not load right away in the stable v10 release Toconvert pre-release maps to the new format follow these steps
1 Install Escher
pip install escher
2 Find a COBRA model for your maps This COBRA model will be used to update the content of the mapin order to support all the new Escher features You can use a COBRA model encoded as SBML or JSON(generated with COBRApy v030b4 or later) The COBRA models currently available on the Escher websitecan be downloaded from the BiGG Models website
httpbiggucsdedu
For a refresher on the distinction between Escher maps COBRA models and their file types (SBML JSONSBML Layout) see Escher COBRA and COBRApy
3 Run the convert_map script to convert your existing Escher map (my_old_mapjson) to the new formatusing a COBRA model (model_filejson or model_filexml in these examples)
With a JSON file modelpython -m escherconvert_map my_old_mapjson pathtomodel_filejson
With an SBML modelpython -m escherconvert_map my_old_mapjson pathtomodel_filexml
Those commands will generate a new map called my_old_map_convertedjson that will load in Escher v10and later
75 Building and contributing maps
We are excited to collect pathway maps for every organism with a well characterized metabolic network This sectiondescribes the process of building a new map either from scratch or using a COBRA model with BiGG IDs
751 Building from scratch
To build a map from scratch you will first need a COBRA model for your map See the section Escher COBRA andCOBRApy for some background information on COBRA models
If you would like to eventually contribute your map to the Escher website it is important that your COBRA modeladheres to the identifiers in the BiGG Database Escher and BiGG are being developed together and we want tomaintain consistency and interoperability between them
Once you have a COBRA model you can follow these steps
1 Load your model in the Escher Builder
2 Begin building new reactions If you are familiar with the genes in your organism then try search for newreactions by their gene IDs
3 Limit each map to ~200 reactions Maps larger than this will slow down the Escher viewer especially on oldbrowsers Rather than building one giant map Escher is designed for building many smaller subsystem maps
4 When you have built a map for your a subsystem save the map as JSON with a name that includes the modelID followed by a period followed by the name of the subsystem For example
75 Building and contributing maps 29
Escher Documentation Release 143
iMM904Amino acid biosynthesisjson
5 (Optional) Once you have a set of subsystem maps you can set up a local Escher server so that subsystem mapsappear in the ldquoquick jumprdquo menu in the bottom right corner of the screen (as seen here for iJO1366) To setthis up you will need to start a local server as describe in Running the local server Next find your local cachedirectory by running this command in a terminal
python -c import escher print(escherget_cache_dir(name=maps))
This will print the location of the local maps cache Add your new subsystem maps to cache folder Now whenyou run the server (described in Running the local server) you should see that quick jump menu appear
NOTE The cache directory is organized into folders for organisms You can use these folder for filtering byorganism on the local launch page or you can place the maps in the top directory
NOTE 2 A similar approach can be used to access your models from the local launch page Place maps in thefolder indicated by
python -c import escher print(escherget_cache_dir(name=models))
752 Building from an existing map for a similar organism
Follow the instruction above except rather than starting from scratch load an existing Escher map for a differentorganism
Once you have the new model loaded use the Update names and gene reaction rules using model button in theModel menu to convert all descriptive names and gene reaction rules in the model to those in the map Reactions thatdo not match the model will be highlighted in red (This can be turned off again in the settings menu by deselectingHighlight reactions not in model)
Now visit each highlighted reaction and see if you can replace it with an equivalent biochemical pathway from themodel If not then delete the reaction and move on
Finally when there are no highlighted reactions left you can repeat this for other subsystems
753 Submitting maps to the Escher website
If you would like to contribute maps to Escher you can make a Pull Request to the GitHub repository eschergithubioMake sure there is a folder with the name of the organism in 1-0-0maps For example a new yeast map goes inthe folder
1-0-0mapsSaccharomyces cerevisiae
Then name your map by concatenating the model ID and the map name separated by a period For example a yeastmap built with the genome-scale model iMM904 could be named
iMM904Amino acid biosynthesisjson
Then add the JSON file for the model to the Pull Request if that model is not already available As before make afolder for your organism within 1-0-0models The model filename is just the model ID
In this example a correct Pull Request would include the following files
1-0-0mapsSaccharomyces cerevisiaeiMM904Amino acid biosynthesisjson1-0-0modelsSaccharomyces cerevisiaeiMM904json
30 Chapter 7 Contents
Escher Documentation Release 143
76 Developing with Escher
761 Using the static JavaScript and CSS files
You can include the compiled Escher JavaScript and CSS files in any HTML document The only dependencies ared3js and optionally Twitter Bootstrap if you are using the option menu=rsquoallrsquo
The compiled files are available form npmcdn
httpsnpmcdncomescher-visjsdistescherjshttpsnpmcdncomescher-visjsdistescherminjshttpsnpmcdncomescher-viscssdistbuildercsshttpsnpmcdncomescher-viscssdistbuildermincss
Source maps are also hosted there
httpsnpmcdncomescher-visjsdistescherjsmaphttpsnpmcdncomescher-visjsdistescherminjsmaphttpsnpmcdncomescher-viscssdistbuildermincssmap
If you want a particular version of escher add a version tag like this
httpsnpmcdncomescher-vis140-beta3jsdistescherjs
For an example of the boilerplate code that is required to begin developing with Escher have a look at the escher-demorepository For projects built with npm use the escher-test repository as a guide
762 Building and testing Escher
First install dependencies with npm
npm install
Escher uses grunt to manage the build process To run typical build steps just run
npm run compile
To test the JavaScript files run
npm run test
For Python testing run this in the py directory
python setuppy test
Build the static website
python setuppy build_gh
Clear static website files
python setuppy clean
Build and run the docs
cd docsmake htmlcd _buildhtml
76 Developing with Escher 31
Escher Documentation Release 143
python -m SimpleHTTPServer python 2python -m httpserver python 3
763 Generating and reading Escher and COBRA files
The Escher file format
Escher layouts are defined by JSON files that follow a specific schema using json schema The latest schemafor Escher JSON files is here The Escher schemas are versioned with inspiration from SchemaVer Theeschervalidate module can be used to validate models against the schema
The Escher layout schema is designed to be as simple as possible For example the core metabolism map of Es-cherichia coli is layed out like this
[
map_name E coli coreCore metabolismmap_id 2938hoq32a1map_description E coli core metabolic networknLast Modified Fri Dec 05 2014 163944 GMT-0800 (PST)homepage httpseschergithubioschema httpseschergithubioescherjsonschema1-0-0
reactions nodes text_label canvas
x 7857062530517567y 31436893920898433width 5894515691375733height 4860457037353515
]
The map_name includes the model that was used to build this layout followed by a period and then a readable namefor the map The map_id is a unique identifier for this map The map_description describes the map and thelast time it was modified Both the homepage and the schema entries must have exactly these values for the Eschermap to be valid
In the next section the reactions nodes labels and canvas are all defined For reactions nodes and text labels eachelement has a key that is an arbitrary integer As long as there are no repeated IDs (eg no 2 segments with the ID517) then everything should work fine
Read through the schema (here) for more detail on the format
The COBRA file format
COBRA models are also saved as JSON files This format has not been documented with a schema but you canbrowse through the core metabolism model as a guide to generating valid COBRA models
I still need help
If you are interested in developing with Escher and you need more information than what is provided in the documen-tation please contact Zachary King (zaking-AT-ucsd-DOT-edu)
32 Chapter 7 Contents
Escher Documentation Release 143
77 EscherConverter
EscherConverter is a standalone program that reads files created with the graphical network editor Escher and convertsthem to files in community standard formats
Download EscherConverter 05 (137 MB)
771 Using EscherConverter
Escher uses a JSON file format to represent its networks This format has been developed because of its very small filesize and its compatibility to online programs that are written in JavaScript In particular JSON is a JavaScript ObjectNotation or in other words a JSON file directly represents components of JavaScript programs This makes parsingvery simple and allows direct use of those files in web-based programs
However in systems biology specific file formats have been developed with the aim to be easily exchangeable betweensoftware implemented in diverse programming languages
To this end these formats support semantically clear annotations and are maintained by a large community of scientistsEscherConverter supports export to two particularly important XML-based community file formats SBML with layoutextension and SBGN-ML
While SBML has been mainly developed for dynamic simulation of biological networks it is nowadays also usablefor diverse other purposes Its layout extension facilitates the encoding the display of biological networks
SBGN-ML has been directly developed as a language for the display of biological pathway maps of diverse kinds Itstores the position and connection of entities similar to what is shown in Escher networks
EscherConverter takes Escherrsquos JSON files as input and generates equivalent SBML Level 3 Version 1 files with layoutextension or SBGN-ML files
In order to ensure that the conversion is correct EscherConverter provides its own display that gives users a previewof how the export data format will be rendered by other tools In this preview display you can zoom in and out movearcs and node positions However it is important to know that none of the changes made in this preview are stored inthe export file
Download and Installation
You can obtain local copy of EscherConverter by clicking here
As a Javatrade application no specific installation is required for EscherConverter
However make sure you have a recent Javatrade Runtime Environment (JRE) installed on your computer (at least JRE8) You can obtain Javatrade from the Oracle website There you can also find installation instructions for your respectiveoperating system
Once Javatrade has been installed you can simply place the EscherConverter JAR file somewhere on your local computerfor instance in the folder
bull Applications if you are working under Mac OS
77 EscherConverter 33
Escher Documentation Release 143
bull opt for Linux computers
bull CProgram Files if you are using Windows
Launching the program
You can launch EscherConverter simply by double-clicking on the application JAR file This will open a followinggraphical user interface as described in the following figures
Figure 1 | The graphical user interface of EscherConverter
bull Preferences opens a settings dialog (see next screenshot)
bull Open displays a file chooser to select an input file in JSON format
bull Save export the map that is displayed in the current tab to SBML or SBGN-ML
bull Discard closes the current tab without saving
bull Help opens the online help that displays all command-line options
bull License displays the license under which this software is distributed
bull About shows information about the authors of this software
bull Main the main panel of the software in which converted Escher maps will be displayed organized in tabs
bull Status the status bar shows information and logging messages during the conversion
34 Chapter 7 Contents
Escher Documentation Release 143
Figure 2 | The preferences dialog All settings in this dialog are also available through EscherConverterrsquos command-line interface
Layout section several properties that are required in SBML and SBGN-ML are not explicitly specified in EscherrsquosJSON format and therefore need to be adjusted by the user These are the size of the drawing canvas the default boxsize for text labels the size of primary and secondary nodes In contrast to SBGN-ML and Escherrsquos JSON formatthe SBML layout extension supports three-dimensional displays When selecting this export file format it is thereforenecessary to also define the z-coordinate and the depth of all objects
Components and naming section Most settings in this section are specific for the SBML layout extension and areonly active if this output format is selected These are names and identifiers of the layout component and the in caseof SBML mandatory default compartment (a compartment without physical meaning a reaction space in which allmetabolites are located) EscherConverter can infer compartment bounds from metabolites but this is an experimentalfeature Just try it and see how the preview changes
77 EscherConverter 35
Escher Documentation Release 143
Figure 3 | A layout preview
The birds-eye view and the navigation component on the left help you navigate through the network display Thisgraph shows you how the converted pathway map will be rendered by software that supports SBGN-ML or the SBMLlayout extension This preview can be modified by moving arcs or nodes however none of those changes are storedwhen exporting the file In this current version EscherConver only exports layouts as given in the original JSON file
Included third-party software
EscherConverter includes several third-party libraries which we here list and acknowledge
bull ArgParser
bull JSBML
bull libSBGN
bull Pixel-Mixer icons
bull yFiles
772 Command-line interface API
You can launch EscherConverter from the command-line On a Unix system (such as Linux MacOS or Solaris etc)use a command like
bash$ java -jar -Xms8G -Xmx8G -Duserlanguage=en EscherConverter-05jar [options]
Under Window use a command like
Cgt javaw -jar -Xms8G -Xmx8G -Duserlanguage=en EscherConverter-05jar [options]
Escher has a large collection of command-line options (see below) which can be useful if you want to launch theprogram with specific settings or if multiple files are to be converted in a batch mode It is even possible to completelydisable the graphical user interface
36 Chapter 7 Contents
Escher Documentation Release 143
Input and output files
Definition of input and output data files as well as the format for the output
--input=ltFilegt
Specifies the JSON input file If a directory is given the conversion will be recursively performed Accepts JSON
--output=ltFilegt
The path to the file into which the output should be written If the input is a directory this must also be a directory inorder to perform a recursive conversion Accepts SBML SBGN
Escher layout
The options in this group allow you to influence how large certain elements should be displayed
--canvas-default-height=ltDoublegt
Just as in the case of the width of the canvas this value needs to be specified for cases where the JSON input file lacksan explicit specification of the canvas height Arguments must fit into the range [11E9] (Default value 2500)
--canvas-default-width=ltDoublegt
This value is used when no width has been defined for the canvas Since the width attribute is mandatory for the layouta default value must be provided in these cases Arguments must fit into the range [11E9] (Default value 2500)
--label-height=ltDoublegt
With this option you can specify the height of the bounding box of text labels Arguments must fit into the range[11E9] (Default value 500)
--label-width=ltDoublegt
This option defines the width of bounding boxes for text labels Arguments must fit into the range [11E9] (Defaultvalue 1600)
--node-depth=ltDoublegt
The length of nodes along z-coordinate Escher maps are actually two-dimensional but in general a layout can bethree-dimensional This value should be an arbitrary value greater than zero because some rendering engines mightnot display the node if its depth is zero Arguments must fit into the range [11E9] (Default value 10)
--node-label-height=ltDoublegt
Node labels can have a size different from general labels in the graph Here you can specify how height the boundingbox of the labels for nodes should be Arguments must fit into the range [11E9] (Default value 200)
--primary-node-height=ltDoublegt
The primary node should be bigger than the secondary node With this option you can specify the height of this typeof nodes Arguments must fit into the range [11E9] (Default value 300)
--primary-node-width=ltDoublegt
Escher maps distinguish between primary and secondary nodes Primary nodes should be larger than secondary nodesand display the main flow of matter through the network This option allows you to specify the width of primarynodes Arguments must fit into the range [11E9] (Default value 300)
77 EscherConverter 37
Escher Documentation Release 143
--reaction-label-height=ltDoublegt
Reaction label heightArguments must fit into the range [11E9] (Default value 300)
--reaction-node-ratio=ltDoublegt
This value is used as a conversion factor to determine the size of the reaction display box depending on the size ofprimary nodes Height and width of reaction nodes are determined by dividing the corresponding values from theprimary node size by this factor Arguments must fit into the range [01] (Default value 05)
--secondary-node-ratio=ltDoublegt
Similar to the reaction node ratio the size of secondary nodes (width and height) is determined by dividing thecorresponding values from the primary nodes by this value Arguments must fit into the range [01] (Default value06666666666666666)
--z=ltDoublegt
The position on the z-axis where the entire two-dimensional graph should be drawn Arguments must fit into the range[-1E91E9] (Default value 00)
Escher Components and their naming
Here you can influence which elements are to be included in the layout and how elements in the layout are to be calledor identified
--format=ltOutputFormatgt
The desired format for the conversion eg SBML All possible values for type ltOutputFormatgt are SBGN andSBML (Default value SBML)
--layout-id=ltStringgt
In contrast to the name this identifier does not have to be human-readable This is a machine identifier which muststart with a letter or underscore and can only contain ASCII characters (Default value Escher_Layout)
--layout-name=ltStringgt
This should be a human-readable name for the layout that is to be created This name might be displayed to describethe figure and should therefore be explanatory (Default value Escher Layout)
--compartment-id=ltStringgt
A compartment needs to have a unique identifier which needs to be a machine-readable Sting that must start with aletter or underscore and can only contain ASCII characters Since the JSON file does not provide this information thisoption allows you to specify the required identifier (Default value default)
--compartment-name=ltStringgt
With this option it is possible to define a name for the default compartment can be that needs to be generated for theconversion to SBML The name does not have any restrictions ie any UTF-8 character can be used (Default valueDefault compartment)
--infer-compartment-bounds
This converter can infer where the boundaries of compartments could be drawn To this end it uses each nodersquos BiGGids to identify the compartment of all metabolites Assuming that compartments have rectangular shapes the algorithmcan find the outermost node on each side of the box and hence obtain the boundaries of the compartment However
38 Chapter 7 Contents
Escher Documentation Release 143
this methods will fail when metabolites are drawn inside of such a box that belong to a different compartment that isactually further outside For this reason this option is deactivated by default (Default value false)
Options for the graphical user interface
--gui
If this option is given the program will display its graphical user interface (Default value false)
--log-level=ltStringgt
Change the log-level of this application This option will influence how fine-grained error and other log messages willbe that you receive while executing this program All possible values for type ltStringgt are ALL CONFIG FINEFINER FINEST INFO OFF SEVERE and WARNING (Default value INFO)
--log-file=ltFilegt
This option allows you to specify a log file to which all information of the program will be written Accepts (bp2bp3 log owl xml)
78 JavaScript API
class escherBuilder(map_data model_data embedded_css selection options)A Builder object contains all the UI and logic to generate a map builder or viewer
Arguments
bull map_data (object) ndash The data for a map to be passed to escherMapfrom_data() Ifnull then an empty Builder is initialized
bull model_data (object) ndash The data for a cobra model to be passed to es-cherCobraModel() Can be null
bull embedded_css (string) ndash The stylesheet for the SVG elements in the Escher map
bull selection (object) ndash (Optional Default In the body element) The d3 selection of anelement to place the Builder into The selection cannot be inside an SVG element
bull options (object) ndash (Optional) An object defining any of the following options
optionsmenu(Default rsquoallrsquo) The type of menu that will be displayed Can be lsquoallrsquo for the fullmenu or lsquozoomrsquo for just zoom buttons The lsquoallrsquo option requires the full set of Escherdependencies (D3js JQuery and Bootstrap) while the lsquozoomrsquo option requires only D3jsFor more details see Developing with Escher
optionsscroll_behavior(Default rsquopanrsquo) This option determines the effect that the scroll wheel will have onan Escher map Can be lsquopanrsquo to pan the map or lsquozoomrsquo to zoom the map when the usermoves the scroll wheel
optionsuse_3d_transform(Default Chooses a good option by testing the browser) If true then use CSS3 3D trans-forms to speed up panning and zooming This feature will only work on browsers thatsupport the 3D transforms It works best in the latest versions of Chrome Firefox andInternet Explorer Safari works better with this turned off
78 JavaScript API 39
Escher Documentation Release 143
optionsenable_editing(Default true) If true then display the map editing functions If false then hide themand only allow the user to view the map
optionenable_keys(Default true) If true then enable keyboard shortcuts
optionsenable_search(Default true) If true then enable indexing of the map for search Use false to disablesearching and potentially improve the map performance
optionsfill_screen(Default false) Use true to fill the screen when an Escher Builder is placed in a top-level container (eg a div in the body element)
optionsfull_screen_button(Default false) Include a button in the user interface for entering full screen mode
optionsignore_bootstrap(Default false) Do not use Bootstrap for buttons even if it available This is used toembed Escher in a Jupyter notebook where it conflicts with the Jupyter Boostrap installa-tion
Map model and styles
optionsstarting_reaction(Default null) The ID (as a string) of a reaction to draw when the Builder loads
optionsnever_ask_before_quit(Default false) If false then display a warning before the user closes an Eschermap If true then never display the warning This options is only respected if op-tionsenable_editing == true If enable_editing is false then the warnings are not dis-played
optionsunique_map_id(Default null) A unique ID that will be used to UI elements donrsquot interfere whenmultiple maps are in the same HTML document
optionsprimary_metabolite_radius(Default 15) The radius of primary metabolites in px
optionssecondary_metabolite_radius(Default 10) The radius of secondary metabolites in px
optionsmarker_radius(Default 5) The radius of marker nodes in px
optionsgene_font_size(Default 18) The font size of the gene reaction rules in px
optionshide_secondary_metabolites(Default false) If true then secondary nodes and segments are hidden This is conve-nient for generating simplified map figures
optionsshow_gene_reaction_rules(Default false) If true then show the gene reaction rules even without gene data
optionshide_all_labels(Default false) If checked hide all reaction gene and metabolite labels
Applied data
40 Chapter 7 Contents
Escher Documentation Release 143
optionsreaction_data(Default null) An object with reaction ids for keys and reaction data points for values
optionsreaction_stylesDefault [rsquocolorrsquo rsquosizersquo rsquotextrsquo]
An array of style types The array can contain any of the following lsquocolorrsquo lsquosizersquo lsquotextrsquolsquoabsrsquo The lsquocolorrsquo style means that the reactions will be colored according to the loadeddataset The lsquosizersquo style means that the reactions will be sized according to the loadeddataset The lsquotextrsquo style means that the data values will be displayed in the reactionlabels The lsquoabsrsquo style means the the absolute values of reaction values will be used fordata visualization
optionsreaction_compare_style(Default rsquodiffrsquo) How to compare to datasets Can be either lsquofold lsquolog2_foldrsquo orlsquodiffrsquo
optionsreaction_scaleDefault
[ type min color c8c8c8 size 12 type median color 9696ff size 20 type max color ff0000 size 25 ]
An array of objects that define points on the data scale
Each point is an object with a type attribute Types can be lsquominrsquo lsquomaxrsquo lsquomeanrsquo lsquoQ1rsquo (firstquartile) lsquomedianrsquo lsquoQ3rsquo (third quartile) or lsquovaluersquo Each point can have a color attributethat specifies a color with a string (any CSS color specification is allowed including hexrgb and rgba) Each point can have a size attirbute that specifies a reaction thickness as anumber Finally points with type lsquovaluersquo can have a value attribute that specifies an exactnumber for pont in the scale
NOTE If lsquominrsquo or lsquomaxrsquo is not provided Escher automatically adds them To be com-pletely clear about what you expect to see on the map it is best to provide lsquominrsquo andlsquomaxrsquo in addition to other scale points
Here are examples of each type
type rsquominrsquo color rsquoredrsquo size 12 Specifies that reactionsnear the minimum value are red and have thickness 12
type rsquoQ1rsquo color rsquorgba(100 100 50 05)rsquo size 12 Specifies that reactions near the first quartile have the given color opacity andthickness
type rsquomeanrsquo color rsquorgb(100 100 50)rsquo size 50 Specifies that reactions near the mean value have the given color and thickness
type rsquovaluersquo value 85 color rsquo333rsquo size 50 Specifies that reactions near 85 value have the given color and size
optionsreaction_no_data_color(Default rsquodcdcdcrsquo) The color of reactions with no data value
optionsreaction_no_data_size(Default 8) The size of reactions with no data value
optionsgene_data(Default null) An object with Gene ids for keys and gene data points for values
78 JavaScript API 41
Escher Documentation Release 143
optionsand_method_in_gene_reaction_rule(Default mean) When evaluating a gene reaction rule use this function to evaluate ANDrules Can be lsquomeanrsquo or lsquominrsquo
optionsmetabolite_data(Default null) An object with metabolite ids for keys and metabolite data points forvalues
optionsmetabolite_stylesDefault [rsquocolorrsquo rsquosizersquo rsquotextrsquo]
An array of style types The array can contain any of the following lsquocolorrsquo lsquosizersquo lsquotextrsquolsquoabsrsquo The lsquocolorrsquo style means that the metabolites will be colored according to the loadeddataset The lsquosizersquo style means that the metabolites will be sized according to the loadeddataset The lsquotextrsquo style means that the data values will be displayed in the metabolitelabels The lsquoabsrsquo style means the the absolute values of metabolite values will be used fordata visualization
optionsmetabolite_compare_style(Default rsquodiffrsquo) How to compare to datasets Can be either lsquofoldrsquo lsquolog2_foldrsquo orlsquodiffrsquo
optionsmetabolite_scaleDefault
[ type min color fffaf0 size 20 type median color f1c470 size 30 type max color 800000 size 40 ]
An array of objects that define points on the data scale See the description of op-tionsreaction_scale for an explanation of the format
optionsmetabolite_no_data_color(Default rsquoffffffrsquo) The color of metabolites with no data value
optionsmetabolite_no_data_size(Default 10) The size of metabolites with no data value
View and build options
optionsidentifiers_on_map(Default rsquobigg_idrsquo) The identifiers that will be displayed in reaction metabolite andgene labels Can be lsquobigg_idrsquo or lsquonamersquo
optionshighlight_missing(Default false) If true then highlight in red reactions that are not in the loaded COBRAmodel
optionsallow_building_duplicate_reactions(Default true) If true then building duplicate reactions is allowed If false then dupli-cate reactions are hidden in Add reaction mode
optionscofactors(Default [rsquoatprsquo rsquoadprsquo rsquonadrsquo rsquonadhrsquo rsquonadprsquo rsquonadphrsquorsquogtprsquo rsquogdprsquo rsquohrsquo rsquocoarsquo rsquoumprsquo rsquoh20rsquo rsquoppirsquo]) A list of metabo-lite IDs to treat as cofactors These will be secondary metabolites in new reactions
Callbacks
optionsfirst_load_callbackA function to run after loading the Builder
42 Chapter 7 Contents
Escher Documentation Release 143
load_map(map_data[ should_update_data])Load a map for the loaded data Also reloads most of the Builder content
Arguments
bull map_data ndash The data for a map
bull should_update_data (Boolean) ndash (Default true) Whether data should be ap-plied to the map
load_model(model_data[ should_update_data])Load the cobra model from model data
Arguments
bull model_data ndash The data for a Cobra model (Parsing in done by escherCobraModel)
bull should_update_data (Boolean) ndash (Default true) Whether data should be ap-plied to the model
view_mode()Enter view mode
build_mode()Enter build mode
brush_mode()Enter brush mode
zoom_mode()Enter zoom mode
rotate_mode()Enter rotate mode
text_mode()Enter text mode
set_reaction_data(data)
Arguments
bull data (array) ndash An array of 1 or 2 objects where each object has keys that are reactionIDrsquos and values that are data points (numbers)
set_metabolite_data(data)
Arguments
bull data (array) ndash An array of 1 or 2 objects where each object has keys that are metaboliteIDrsquos and values that are data points (numbers)
set_gene_data(data clear_gene_reaction_rules)
Arguments
bull data (array) ndash An array of 1 or 2 objects where each object has keys that are gene IDrsquosand values that are data points (numbers)
Arguments
bull clear_gene_reaction_rules (Boolean) ndash (Optional Default false) In addi-tion to setting the data also turn of the gene_reaction_rules
78 JavaScript API 43
Escher Documentation Release 143
79 Python API
class escherBuilder(map_name=None map_json=None model=None model_name=Nonemodel_json=None embedded_css=None reaction_data=None metabo-lite_data=None gene_data=None local_host=None id=None safe=Falsekwargs)
A metabolic map that can be viewed edited and used to visualize data
This map will also show metabolic fluxes passed in during consruction It can be viewed as a standalone htmlinside a browswer Alternately the respresentation inside an IPython notebook will also display the map
Maps are stored in json files and are stored in a cache directory Maps which are not found will be downloadedfrom a map repository if found
Parameters
bull map_name ndash A string specifying a map to be downloaded from the Escher web server orloaded from the cache
bull map_json ndash A JSON string or a file path to a JSON file or a URL specifying a JSON fileto be downloaded
bull model ndash A Cobra model
bull model_name ndash A string specifying a model to be downloaded from the Escher web serveror loaded from the cache
bull model_json ndash A JSON string or a file path to a JSON file or a URL specifying a JSONfile to be downloaded
bull embedded_css ndash The CSS (as a string) to be embedded with the Escher SVG
bull reaction_data ndash A dictionary with keys that correspond to reaction ids and values thatwill be mapped to reaction arrows and labels
bull metabolite_data ndash A dictionary with keys that correspond to metabolite ids and valuesthat will be mapped to metabolite nodes and labels
bull gene_data ndash A dictionary with keys that correspond to gene ids and values that will bemapped to corresponding reactions
bull local_host ndash A hostname that will be used for any local files This is generally usedfor using the notebook offline and for testing in the IPython Notebook with modified Eschercode An example value for local_host is lsquohttplocalhost7778lsquo
bull id ndash Specify an id to make the javascript data definitions unique A random id is chosen bydefault
bull safe ndash If True then loading files from the filesytem is not allowed This is to ensure thesafety of using Builder within a web server
Keyword Arguments
These are defined in the Javascript API
bulluse_3d_transform
bullenable_search
bullfill_screen
bullzoom_to_element
bullfull_screen_button
44 Chapter 7 Contents
Escher Documentation Release 143
bullstarting_reaction
bullunique_map_id
bullprimary_metabolite_radius
bullsecondary_metabolite_radius
bullmarker_radius
bullgene_font_size
bullhide_secondary_metabolites
bullshow_gene_reaction_rules
bullhide_all_labels
bullreaction_styles
bullreaction_compare_style
bullreaction_scale
bullreaction_no_data_color
bullreaction_no_data_size
bulland_method_in_gene_reaction_rule
bullmetabolite_styles
bullmetabolite_compare_style
bullmetabolite_scale
bullmetabolite_no_data_color
bullmetabolite_no_data_size
bullidentifiers_on_map
bullhighlight_missing
bullallow_building_duplicate_reactions
bullcofactors
All keyword arguments can also be set on an existing Builder object using setter functions eg
my_builderset_reaction_styles(new_styles)
display_in_browser(ip=lsquo127001rsquo port=7655 n_retries=50 js_source=rsquowebrsquo menu=rsquoallrsquoscroll_behavior=rsquopanrsquo enable_editing=True enable_keys=True mini-fied_js=True never_ask_before_quit=False)
Launch a web browser to view the map
Parameters
bull ip ndash The IP address to serve the map on
bull port ndash The port to serve the map on If specified the port is occupied then a random freeport will be used
bull n_retries (int) ndash The number of times the server will try to find a port before quitting
bull js_source (string) ndash Can be one of the following
ndash web (Default) - Use JavaScript files from eschergithubio
79 Python API 45
Escher Documentation Release 143
ndash local - Use compiled JavaScript files in the local Escher installation Works offline
ndash dev - No longer necessary with source maps This now gives the same behavior aslsquolocalrsquo
bull menu (string) ndash Menu bar options include
ndash none - No menu or buttons
ndash zoom - Just zoom buttons
ndash all (Default) - Menu and button bar (requires Bootstrap)
bull scroll_behavior (string) ndash Scroll behavior options
ndash pan - Pan the map
ndash zoom - Zoom the map
ndash none (Default) - No scroll events
bull enable_editing (Boolean) ndash Enable the map editing modes
bull enable_keys (Boolean) ndash Enable keyboard shortcuts
bull minified_js (Boolean) ndash If True use the minified version of JavaScript and CSSfiles
bull never_ask_before_quit (Boolean) ndash Never display an alert asking if you wantto leave the page By default this message is displayed if enable_editing is True
display_in_notebook(js_source=rsquowebrsquo menu=rsquozoomrsquo scroll_behavior=rsquononersquo mini-fied_js=True height=500 enable_editing=False)
Embed the Map within the current IPython Notebook
Parameters
bull js_source (string) ndash Can be one of the following
ndash web (Default) - Use JavaScript files from eschergithubio
ndash local - Use compiled JavaScript files in the local Escher installation Works offline
ndash dev - No longer necessary with source maps This now gives the same behav-ior as lsquolocalrsquo
bull menu (string) ndash Menu bar options include
ndash none - No menu or buttons
ndash zoom - Just zoom buttons
ndash Note The all menu option does not work in an IPython notebook
bull scroll_behavior (string) ndash Scroll behavior options
ndash pan - Pan the map
ndash zoom - Zoom the map
ndash none - (Default) No scroll events
bull minified_js (Boolean) ndash If True use the minified version of JavaScript andCSS files
bull height ndash Height of the HTML container
bull enable_editing (Boolean) ndash Enable the map editing modes
46 Chapter 7 Contents
Escher Documentation Release 143
save_html(filepath=None overwrite=False js_source=rsquowebrsquo protocol=rsquohttpsrsquo menu=rsquoallrsquoscroll_behavior=rsquopanrsquo enable_editing=True enable_keys=True minified_js=Truenever_ask_before_quit=False static_site_index_json=None)
Save an HTML file containing the map
Parameters
bull filepath (string) ndash The HTML file will be saved to this location Whenjs_source is lsquolocalrsquo then a new directory will be created with this name
bull overwrite (Boolean) ndash Overwrite existing files
bull js_source (string) ndash Can be one of the following
ndash web (Default) - Use JavaScript files from eschergithubio
ndash local - Use compiled JavaScript files in the local Escher installation Works of-fline To make the dependencies available to the downloaded file a new directorywill be made with the name specified by filepath
ndash dev - No longer necessary with source maps This now gives the same behav-ior as lsquolocalrsquo
bull protocol (string) ndash The protocol can be lsquohttprsquo lsquohttpsrsquo or None which indicatesa lsquoprotocol relative URLrsquo as in eschergithubio Ignored if source is local
bull menu (string) ndash Menu bar options include
ndash none - No menu or buttons
ndash zoom - Just zoom buttons
ndash all (Default) - Menu and button bar (requires Bootstrap)
bull scroll_behavior (string) ndash Scroll behavior options
ndash pan - Pan the map
ndash zoom - Zoom the map
ndash none (Default) - No scroll events
bull enable_editing (Boolean) ndash Enable the map editing modes
bull enable_keys (Boolean) ndash Enable keyboard shortcuts
bull minified_js (Boolean) ndash If True use the minified version of JavaScript andCSS files
bull height (number) ndash Height of the HTML container
bull never_ask_before_quit (Boolean) ndash Never display an alert asking if youwant to leave the page By default this message is displayed if enable_editing isTrue
bull static_site_index_json (string) ndash The index as a JSON string for thestatic site Use javascript to parse the URL options Used for generating static pages(see static_sitepy)
791 Cache
escherget_cache_dir(versioned=True name=None)Get the cache dir as a string and make the directory if it does not already exist
Parameters
79 Python API 47
Escher Documentation Release 143
bull versioned (Boolean) ndash Whether to return the versioned path in the cache Eschermaps for the latest version of Escher are found in the versioned directory (versioned= True) but maps for previous versions of Escher can be found by visiting the parentdirectory (versioned = False)
bull name (string) ndash An optional subdirectory within the cache If versioned is False thenname is ignored
escherclear_cache(different_cache_dir=None ask=True)Empty the contents of the cache directory including all versions of all maps and models
Parameters
bull different_cache_dir (string) ndash (Optional) The directory of another cacheThis is mainly for testing
bull ask (Boolean) ndash Whether to ask before deleting
escherlist_cached_maps()Return a list of all cached maps
escherlist_cached_models()Return a list of all cached models
escherlist_available_maps()Return a list of all maps available on the server
escherlist_available_models()Return a list of all models available on the server
710 License
Escher and EscherConverter are distributed under the MIT license
bull genindex
48 Chapter 7 Contents
Python Module Index
eescher 44
49
Escher Documentation Release 143
50 Python Module Index
Index
Bbrush_mode() (built-in function) 43build_mode() (built-in function) 43Builder (class in escher) 44
Cclear_cache() (in module escher) 48
Ddisplay_in_browser() (escherBuilder method) 45display_in_notebook() (escherBuilder method) 46
Eescher (module) 44escherBuilder() (class) 39
Gget_cache_dir() (in module escher) 47
Llist_available_maps() (in module escher) 48list_available_models() (in module escher) 48list_cached_maps() (in module escher) 48list_cached_models() (in module escher) 48load_map() (built-in function) 42load_model() (built-in function) 43
Ooptionenable_keys (option attribute) 40optionsallow_building_duplicate_reactions (options at-
tribute) 42optionsand_method_in_gene_reaction_rule (options at-
tribute) 41optionscofactors (options attribute) 42optionsenable_editing (options attribute) 39optionsenable_search (options attribute) 40optionsfill_screen (options attribute) 40optionsfirst_load_callback (options attribute) 42optionsfull_screen_button (options attribute) 40optionsgene_data (options attribute) 41
optionsgene_font_size (options attribute) 40optionshide_all_labels (options attribute) 40optionshide_secondary_metabolites (options attribute)
40optionshighlight_missing (options attribute) 42optionsidentifiers_on_map (options attribute) 42optionsignore_bootstrap (options attribute) 40optionsmarker_radius (options attribute) 40optionsmenu (options attribute) 39optionsmetabolite_compare_style (options attribute) 42optionsmetabolite_data (options attribute) 42optionsmetabolite_no_data_color (options attribute) 42optionsmetabolite_no_data_size (options attribute) 42optionsmetabolite_scale (options attribute) 42optionsmetabolite_styles (options attribute) 42optionsnever_ask_before_quit (options attribute) 40optionsprimary_metabolite_radius (options attribute) 40optionsreaction_compare_style (options attribute) 41optionsreaction_data (options attribute) 40optionsreaction_no_data_color (options attribute) 41optionsreaction_no_data_size (options attribute) 41optionsreaction_scale (options attribute) 41optionsreaction_styles (options attribute) 41optionsscroll_behavior (options attribute) 39optionssecondary_metabolite_radius (options attribute)
40optionsshow_gene_reaction_rules (options attribute) 40optionsstarting_reaction (options attribute) 40optionsunique_map_id (options attribute) 40optionsuse_3d_transform (options attribute) 39
Rrotate_mode() (built-in function) 43
Ssave_html() (escherBuilder method) 46set_gene_data() (built-in function) 43set_metabolite_data() (built-in function) 43set_reaction_data() (built-in function) 43
51
Escher Documentation Release 143
Ttext_mode() (built-in function) 43
Vview_mode() (built-in function) 43
Zzoom_mode() (built-in function) 43
52 Index
Escher Documentation Release 143
12 Chapter 5 Installation
CHAPTER 6
Citing Escher
You can help support Escher by citing our publication when you use Escher or EscherConverter
Zachary A King Andreas Draumlger Ali Ebrahim Nikolaus Sonnenschein Nathan E Lewis and Bernhard O Pals-son (2015) Escher A web application for building sharing and embedding data-rich visualizations of biologicalpathways PLOS Computational Biology 11(8) e1004321 doi101371journalpcbi1004321
13
Escher Documentation Release 143
14 Chapter 6 Citing Escher
CHAPTER 7
Contents
71 Getting started
711 Introduction
Escher is here to help you visualize pathway maps But if you have never heard of a pathway map you mightappreciate a quick introduction
What are pathway maps
To understand pathway maps it is useful to think about the general organization of a cell At the smallest levelmolecules in a cell are arranged in three-dimensional structures and these structures determine many of the functionsthat take place in a cell For example the 3D structure of an enzyme determines the biochemical reactions that it cancatalyze These structures can be visualized in 3D using tools like Jmol (as in this example structure)
The DNA sequence is a second fundamental level of biological organization DNA sequences are the blueprints for allthe machinery of the cell and they can be visualized as a one-dimensional series of bases (ATCG) using tools like theUCSC genome browser
To use a football analogy the 3D molecular structures are akin to the players on the field and the information in theDNA sequence is like the playbook on the sidelines But football would not be very interesting if the players nevertook to the field and executed those plays So we are missing this level of detail the execution of biological plans bythe molecular players
What we are missing is the biochemical reaction network Proteins in the cell catalyze the conversion of substratemolecules into product molecules and these reactions are responsible for generating energy constructing cellularmachinery and structures detecting molecules in the environment signaling and more Biochemical reactions canbe grouped into pathways when they work in concert to carry out a function (If a reaction is a football play thenthe pathway is a drive) And Escher can be used to visualize these reactions and pathways Together we call thesevisualizations pathway maps
Escher to the rescue
Many Escher maps represent metabolic pathways and Escher was developed at the Systems Biology Research Groupwhere we have been building genome-scale models of metabolism over the past fifteen years However Escher is notlimited to metabolism It can be used to visualize any collection of biochemical reactions
Escher includes one more killer feature The ability to visualize datasets on a pathway map Many biological discov-eries are enabled by collecting and analyzing enormous datsets and so biologists are grappling with the challenges ofbig data By visualizing data in the context of pathway maps we can quickly spot trends which would not be apparent
15
Escher Documentation Release 143
with standard statistical tools And Escher visualizations can be adapted and shared to demonstrate those biologicaldiscoveries
The rest of this guide will introduce the Escher user interface and the major features of Escher
712 The launch page
When you open the Escher website you will see a launch page that looks like this
The options on the launch page are
bull Filter by organism Choose an organism to filter the Maps and Models
bull Map Choose a pre-built map or start from scratch with an empty builder by choosing None In parenthesesnext to the map name you will see the name of the model that was used to build this map
bull Model (Optional) If you choose a COBRA model to load then you can add new reactions to the pathway mapYou can also load your own model later after you launch the tool For an explanation of maps models andCOBRA see Escher COBRA and COBRApy
bull Tool
ndash The Viewer allows you to pan and zoom the map and to visualize data for reactions genes and metabo-lites
ndash The Builder in addition to the Viewer features allows you to add reactions move and rotate existingreactions add text annotations and adjust the map canvas
bull Options
ndash Scroll to zoom (instead of scroll to pan) Determines the effect of using the mousersquos scroll wheel overthe map
ndash Never ask before reloading If this is checked then you will not be warned before leaving the page evenif you have unsaved changes
Choose Load map to open the Escher viewer or builder in a new tab and prepare to be delighted by your very ownpathway map
16 Chapter 7 Contents
Escher Documentation Release 143
713 The menu bar
Once you have loaded an Escher map you will see a menu bar along the top of the screen Click the question mark tobring up the Escher documentation
714 Loading and saving maps
Using the map menu you can load and save maps at any time
Click Save map JSON to save the Escher map as a JSON file which is the standard file representing an Escher map
NOTE The JSON file does NOT save any datasets you have loaded This may be changed in a future version ofEscher
NOTE 2 In Safari saving files from Escher works a little differently than in the other major browsers After clickingSave map JSON Safari will load a new tab with the raw content of the Escher map file To save the file chooseFilegtSave As from the Safari menu A new dialog appears in the dropdown menu near the bottom select PageSource (rather than Web Archive) give your file an appropriate name (eg mapjson for an Escher map or mapsvgfor an SVG export) and click Save
Later you can can load a JSON file to view and edit a map by clicking Load map JSON
Click Export as SVG to generate a SVG file for editing in tools like Adobe Illustrator and Inkscape This is thebest way to generate figures for presentations and publications Unlike a JSON file a SVG file maintains the datavisualizations on the Escher map However you cannot load SVG files into Escher after you generate them
Click Clear Map to empty the whole map leaving a blank canvas NOTE You cannot undo Clear Map
715 Loading models
Use the model menu to manage the COBRA model loaded in Escher
71 Getting started 17
Escher Documentation Release 143
Choose Load COBRA model JSON to open a COBRA model Read more about COBRA models in Escher COBRAand COBRApy Once you have COBRApy v030 or later installed then you can generate a JSON model by followingthis example code
Once you have loaded a COBRA model there may be inconsistencies between the content in the map and the model(eg reaction IDs descriptive names and gene reaction rules) You click Update names and gene reaction rulesusing model to find matching reactions and metabolites between the map and the model (based on their IDs) andthen apply the names and gene reaction rules from the model to the map The reactions that do not match will behighlighted in red (This can be turned off again in the settings menu by deselecting Highlight reactions not in model)More advice on building maps is available in Building and contributing maps
Click Clear Model to clear the current model
716 Loading reaction gene and metabolite data
Datasets can be loaded as CSV files or JSON files using the Data Menu
In Escher reaction and gene datasets are visualized by changing the color thickness and labels of reaction arrowsMetabolite datasets are visualized by changing the color size and labels of metabolite circles The specific visualstyles can be modified in the Settings menu When data is not present for a specific reaction gene or metabolite thenthe text label will say lsquondrsquo which means lsquono datarsquo
18 Chapter 7 Contents
Escher Documentation Release 143
The structure of a CSV file
CSV files should have 1 header row 1 ID column and either 1 or 2 columns for data values The ID column cancontain BiGG IDs or descriptive names for the reactions metabolites or genes in the dataset Here is an example witha single data value columns
IDtime 0secglc__D_c54g6p__D_c23
Which might look like this is Excel
ID time 0secglc__D_c 54g6p_c 23
If two datasets are provided then the Escher map will display the difference between the datasets In the Settings menuthe Comparison setting allows you to choose between comparison functions (Fold Change Log2(Fold Change) andDifference) With two datasets the CSV file looks like this
ID time 0sec time 5sglc__D_c 54 102g6p_c 23 81
Data can also be loaded from a JSON file This Python code snippet provides an example of generating the properformat for single reaction data values and for reaction data comparisons
import json
save a single flux vector as JSONflux_dictionary = glc__D_c 54 g6p_c 23with open(outjson w) as f
jsondump(flux_dictionary f)
save a flux comparison as JSON
71 Getting started 19
Escher Documentation Release 143
flux_comp = [glc__D_c 54 g6p_c 23 glc__D_c 102 g6p_c 81]with open(out_compjson w) as f
jsondump(flux_comp f)
Gene data and gene reaction rules
Escher uses gene reaction rules to connect gene data to the reactions on a metabolic pathway You can see these genereaction rules on the map by selecting Show gene reaction rules in the Settings menu
Gene reaction rules show the genes whose gene products are required to catalyze a reaction Gene are connected usingAND and OR rules AND rules are used when two genes are required for enzymatic activity eg they are membersof a protein complex OR rules are used when either gene can catalyze the enzymatic activity eg they are isozymes
With OR rules Escher will take the sum of the data values for each gene With AND rules Escher will either takethe mean (the default) or the minimum of the components The AND behavior (mean vs minimum) is defined in theSettings menu
717 Editing and building
The Edit menu gives you access to function for editing the map
20 Chapter 7 Contents
Escher Documentation Release 143
Escher has five major modes and you can switch between those modes using the buttons in the Edit menu or usingthe buttons in the button bar on the left of the screen
1 Pan mode Drag the canvas to pan the map You can also use the mouse scroll wheel or trackpad scroll function(drag with 2 fingers) to pan the map (or to zoom if you selected Scroll to zoom in the settings)
2 Select mode Select nodes by clicking on them Shift-click to select multiple nodes or drag across the canvasto select multiple nodes using the selection brush
3 Add reaction mode If you have loaded a Model then click on the canvas to see a list of reactions that you candraw on the map Click on a node to see reactions that connect to that node In the input box you can search byreaction ID metabolite ID or gene ID (locus tag)
4 Rotate model Before entering rotate mode be sure to select one or more nodes in select mode Then afterentering rotate mode drag anywhere on the canvas to rotate the selection You can also drag the red crosshairsto change the center of the rotation
5 Text mode Use text mode to add text annotations to the map Click on the canvas to add a new text annotationor click an existing annotation to edit it When you are finished click Enter or Escape to save the changes
71 Getting started 21
Escher Documentation Release 143
In addition to the editing modes the Edit menu gives you access to the following commands
bull Delete Delete the currently selected node(s)
bull Undo Undo the last action NOTE Certain actions such as editing the canvas cannot be undone in the currentversion of Escher
bull Redo Redo the last action that was undone
bull Toggle primarysecondary node In Escher each metabolite node is either a primary node or a secondarynode Primary nodes are larger and secondary nodes can be hidden in the Settings menu Use this command totoggle the currently selected node(s) between primary and secondary
bull Rotate reactant locations When you draw a new reaction in Escher this command will rotate the new reactantsso that a new reactant is primary and centered This command is extremely useful when you are drawing a longpathway and you want to quickly switch which metabolite to ldquofollowrdquo eg make sure you are following thecarbon-containing metabolites
If you are confused then try drawing a new pathway and hitting the ldquocrdquo key to see the reactants rotate
bull Select all Select all nodes
bull Select none Unselect all nodes
bull Invert selection Select all the nodes that are currently unselected This feature is very useful when you wantto keep just one part of the map Simply drag to select the part you want to keep call the Invert selectioncommand then call the Delete command
718 Editing the canvas
A somewhat non-obvious feature of Escher is that you can edit the canvas by dragging the canvas edges This ispossible in Pan mode and Select mode
22 Chapter 7 Contents
Escher Documentation Release 143
719 View options
bull Zoom in Zoom in to the map
bull Zoom out Zoom out of the map
bull Zoom to nodes Zoom to see all the nodes on the map
bull Zoom to canvas Zoom to see the entire canvas
bull Find Search for a reaction metabolite or gene on the map
bull Show control points Show the control points you can drag these red and blue circle to adjust the shapes ofthe reactions curves
bull Settings Open the Settings menu
7110 The button bar
The button bar give you quick access to many of the common Escher functions
71 Getting started 23
Escher Documentation Release 143
24 Chapter 7 Contents
Escher Documentation Release 143
7111 Settings
View and build options
bull Identifiers Choose whether to show BiGG IDs or descriptive names for reactions metabolites and genes
bull Hide secondary metabolites This will simplify the map by hiding all secondary metabolites and the pathsconnected to them
bull Show gene reaction rules Show the gene reaction rules below the reaction labels even gene data is not loaded
bull Hide reaction gene and metabolite labels Another option to visually simplify the map this will hide alllabels that are not text annotations
bull Allow duplicate reactions By default duplicate reactions are hidden in the add reaction dropdown menuHowever you can turn this option on to show the duplicate reactions
bull Highlight reactions not in model Highlight in red any reactions that are on the map but are not in the modelThis is useful when you are adapting a map from one model for use with another model
71 Getting started 25
Escher Documentation Release 143
Reaction data settings
When reaction or gene data is loaded this section can be used to change visual settings for reactions
The color bar has individual control points and you can drag the control points (execpt min and max) left and right tochange their values Alternatively you can use the dropdown menu (next to the word median in the figure above) toattach a control point to a statistical measure (mean median first quartile (Q1) or third quartile (Q3)) This lets youchoose a color scale that will adapt to your dataset
For each control point you can choose a color by entering a CSS-style color (eg red ff0000 rgba(20 20 255 05)and you can choose a size that will scale the thickness of reactions
There are also color and size options for reactions that do not have any data value
Finally there are a few onoff settings for the loaded reaction or gene dataset
bull Options These determine how to visualize the datasets Check Absolute value to color and size reactions bythe absolute value of each data value The Size Color and Text options can be unselected to turn off sizingcoloring and data values in reaction labels individually
bull Comparison Determines the comparison algorithm to use when two datasets are loaded
bull Method for evaluating AND Determines the method that will be used to reconcile AND statements in genereaction rules when there is gene data loaded See Gene data and gene reaction rules for more details
Metabolite data settings
The data settings for metabolite data are analagous to those for reaction data The only difference is that size nowrefers to the size of the metabolite circles
26 Chapter 7 Contents
Escher Documentation Release 143
72 Escher COBRA and COBRApy
Escher can be used as an independent application but it draws heavily on the information in COBRA models ACOBRA model is a collection of all the reactions metabolites and genes known to exist in an organism (In theliterature these are generally called genome-scale models (GEMs) but we refer to them as COBRA models here toemphasize that Escher interoperates with models that are exported from COBRApy)
By loading a COBRA model into the Escher interface you have access to every reaction and metabolite in that modelYou also have the gene reaction rules for the reactions in the network which allow you to connect gene data toreactions and metabolites
COBRApy is a software package for COBRA modeling written in Python The Escher Python package uses CO-BRApy package for reading and writing COBRA models
721 Maps and models
In Escher you will see references to maps and models
A map contains the reactions and metabolites that you see in the Escher builder including their locations text annota-tions and the canvas
A model (a COBRA model) contains reactions and metabolites that you have not drawn yet Thus you can load aCOBRA model when you want to draw new reactions on the map
722 What is JSON and why do we use it
Both Escher maps and COBRA models are stored as JSON files JSON is a useful plain-text format for storing nesteddata structures We use JSON much like the SBML community uses XML You may notice that SBML files have axml extension and Escher maps and COBRA models have a json extension
You can use Python to explore a JSON file like this
import json
with open(mapjson r) as fmap_object = jsonload(f)
print map_object[0]print map_object[1][reactions]values()[0]
723 Escher SBML and SBGN
A tool has been developed for converting Escher maps to SBML Layout and SBGN and it will be released soon
COBRA models can be converted to SBML using COBRApy
73 Run Escher locally and in IPython
To run Escher on a local computer or to use Escher in PythonIPython first install it The Python package for Eschercan be installed using pip
pip install escher
72 Escher COBRA and COBRApy 27
Escher Documentation Release 143
Depending on your installation of Python you may need sudo
sudo pip install escher
Alternatively one can download the source files and install the package directly
python setuppy install
731 Escher in the IPython Notebook
Once you have installed Escher locally you can interact with Escher maps in an IPython Notebook
Here are example notebooks to get started with
bull COBRApy and Escher
bull JavaScript development and offline maps
bull Generate JSON models in COBRApy
Dependencies
bull Jinja2
bull Tornado
bull COBRApy 030 or later
732 Running the local server
You can run your own local server if you want to use Escher offline or explore your own maps with the homepagebrowser To get started install the Python package and run from any directory by calling
python -m escherserver
This starts a server at httplocalhost7778 You can also choose another port
python -m escherserver --port=8005
74 Validate and convert maps
741 Validate an Escher map
Escher maps follow a specification using the JSON Schema format Therefore any JSON Schema validator can beused to validate an Escher map by comparing it to the latest schema file For example the current schema is locatedhere
httpsgithubcomzakandrewkingescherblobmasterescherjsonschema1-0-0
To make this easier the Escher Python package includes a validation script To validate a map first install Escher
pip install escher
Then call the validator
python -m eschervalidate my_mapjson
Any errors in the map will print to the console
28 Chapter 7 Contents
Escher Documentation Release 143
742 Convert or upgrade an Escher map
Any Escher maps built with pre-release versions of Escher will not load right away in the stable v10 release Toconvert pre-release maps to the new format follow these steps
1 Install Escher
pip install escher
2 Find a COBRA model for your maps This COBRA model will be used to update the content of the mapin order to support all the new Escher features You can use a COBRA model encoded as SBML or JSON(generated with COBRApy v030b4 or later) The COBRA models currently available on the Escher websitecan be downloaded from the BiGG Models website
httpbiggucsdedu
For a refresher on the distinction between Escher maps COBRA models and their file types (SBML JSONSBML Layout) see Escher COBRA and COBRApy
3 Run the convert_map script to convert your existing Escher map (my_old_mapjson) to the new formatusing a COBRA model (model_filejson or model_filexml in these examples)
With a JSON file modelpython -m escherconvert_map my_old_mapjson pathtomodel_filejson
With an SBML modelpython -m escherconvert_map my_old_mapjson pathtomodel_filexml
Those commands will generate a new map called my_old_map_convertedjson that will load in Escher v10and later
75 Building and contributing maps
We are excited to collect pathway maps for every organism with a well characterized metabolic network This sectiondescribes the process of building a new map either from scratch or using a COBRA model with BiGG IDs
751 Building from scratch
To build a map from scratch you will first need a COBRA model for your map See the section Escher COBRA andCOBRApy for some background information on COBRA models
If you would like to eventually contribute your map to the Escher website it is important that your COBRA modeladheres to the identifiers in the BiGG Database Escher and BiGG are being developed together and we want tomaintain consistency and interoperability between them
Once you have a COBRA model you can follow these steps
1 Load your model in the Escher Builder
2 Begin building new reactions If you are familiar with the genes in your organism then try search for newreactions by their gene IDs
3 Limit each map to ~200 reactions Maps larger than this will slow down the Escher viewer especially on oldbrowsers Rather than building one giant map Escher is designed for building many smaller subsystem maps
4 When you have built a map for your a subsystem save the map as JSON with a name that includes the modelID followed by a period followed by the name of the subsystem For example
75 Building and contributing maps 29
Escher Documentation Release 143
iMM904Amino acid biosynthesisjson
5 (Optional) Once you have a set of subsystem maps you can set up a local Escher server so that subsystem mapsappear in the ldquoquick jumprdquo menu in the bottom right corner of the screen (as seen here for iJO1366) To setthis up you will need to start a local server as describe in Running the local server Next find your local cachedirectory by running this command in a terminal
python -c import escher print(escherget_cache_dir(name=maps))
This will print the location of the local maps cache Add your new subsystem maps to cache folder Now whenyou run the server (described in Running the local server) you should see that quick jump menu appear
NOTE The cache directory is organized into folders for organisms You can use these folder for filtering byorganism on the local launch page or you can place the maps in the top directory
NOTE 2 A similar approach can be used to access your models from the local launch page Place maps in thefolder indicated by
python -c import escher print(escherget_cache_dir(name=models))
752 Building from an existing map for a similar organism
Follow the instruction above except rather than starting from scratch load an existing Escher map for a differentorganism
Once you have the new model loaded use the Update names and gene reaction rules using model button in theModel menu to convert all descriptive names and gene reaction rules in the model to those in the map Reactions thatdo not match the model will be highlighted in red (This can be turned off again in the settings menu by deselectingHighlight reactions not in model)
Now visit each highlighted reaction and see if you can replace it with an equivalent biochemical pathway from themodel If not then delete the reaction and move on
Finally when there are no highlighted reactions left you can repeat this for other subsystems
753 Submitting maps to the Escher website
If you would like to contribute maps to Escher you can make a Pull Request to the GitHub repository eschergithubioMake sure there is a folder with the name of the organism in 1-0-0maps For example a new yeast map goes inthe folder
1-0-0mapsSaccharomyces cerevisiae
Then name your map by concatenating the model ID and the map name separated by a period For example a yeastmap built with the genome-scale model iMM904 could be named
iMM904Amino acid biosynthesisjson
Then add the JSON file for the model to the Pull Request if that model is not already available As before make afolder for your organism within 1-0-0models The model filename is just the model ID
In this example a correct Pull Request would include the following files
1-0-0mapsSaccharomyces cerevisiaeiMM904Amino acid biosynthesisjson1-0-0modelsSaccharomyces cerevisiaeiMM904json
30 Chapter 7 Contents
Escher Documentation Release 143
76 Developing with Escher
761 Using the static JavaScript and CSS files
You can include the compiled Escher JavaScript and CSS files in any HTML document The only dependencies ared3js and optionally Twitter Bootstrap if you are using the option menu=rsquoallrsquo
The compiled files are available form npmcdn
httpsnpmcdncomescher-visjsdistescherjshttpsnpmcdncomescher-visjsdistescherminjshttpsnpmcdncomescher-viscssdistbuildercsshttpsnpmcdncomescher-viscssdistbuildermincss
Source maps are also hosted there
httpsnpmcdncomescher-visjsdistescherjsmaphttpsnpmcdncomescher-visjsdistescherminjsmaphttpsnpmcdncomescher-viscssdistbuildermincssmap
If you want a particular version of escher add a version tag like this
httpsnpmcdncomescher-vis140-beta3jsdistescherjs
For an example of the boilerplate code that is required to begin developing with Escher have a look at the escher-demorepository For projects built with npm use the escher-test repository as a guide
762 Building and testing Escher
First install dependencies with npm
npm install
Escher uses grunt to manage the build process To run typical build steps just run
npm run compile
To test the JavaScript files run
npm run test
For Python testing run this in the py directory
python setuppy test
Build the static website
python setuppy build_gh
Clear static website files
python setuppy clean
Build and run the docs
cd docsmake htmlcd _buildhtml
76 Developing with Escher 31
Escher Documentation Release 143
python -m SimpleHTTPServer python 2python -m httpserver python 3
763 Generating and reading Escher and COBRA files
The Escher file format
Escher layouts are defined by JSON files that follow a specific schema using json schema The latest schemafor Escher JSON files is here The Escher schemas are versioned with inspiration from SchemaVer Theeschervalidate module can be used to validate models against the schema
The Escher layout schema is designed to be as simple as possible For example the core metabolism map of Es-cherichia coli is layed out like this
[
map_name E coli coreCore metabolismmap_id 2938hoq32a1map_description E coli core metabolic networknLast Modified Fri Dec 05 2014 163944 GMT-0800 (PST)homepage httpseschergithubioschema httpseschergithubioescherjsonschema1-0-0
reactions nodes text_label canvas
x 7857062530517567y 31436893920898433width 5894515691375733height 4860457037353515
]
The map_name includes the model that was used to build this layout followed by a period and then a readable namefor the map The map_id is a unique identifier for this map The map_description describes the map and thelast time it was modified Both the homepage and the schema entries must have exactly these values for the Eschermap to be valid
In the next section the reactions nodes labels and canvas are all defined For reactions nodes and text labels eachelement has a key that is an arbitrary integer As long as there are no repeated IDs (eg no 2 segments with the ID517) then everything should work fine
Read through the schema (here) for more detail on the format
The COBRA file format
COBRA models are also saved as JSON files This format has not been documented with a schema but you canbrowse through the core metabolism model as a guide to generating valid COBRA models
I still need help
If you are interested in developing with Escher and you need more information than what is provided in the documen-tation please contact Zachary King (zaking-AT-ucsd-DOT-edu)
32 Chapter 7 Contents
Escher Documentation Release 143
77 EscherConverter
EscherConverter is a standalone program that reads files created with the graphical network editor Escher and convertsthem to files in community standard formats
Download EscherConverter 05 (137 MB)
771 Using EscherConverter
Escher uses a JSON file format to represent its networks This format has been developed because of its very small filesize and its compatibility to online programs that are written in JavaScript In particular JSON is a JavaScript ObjectNotation or in other words a JSON file directly represents components of JavaScript programs This makes parsingvery simple and allows direct use of those files in web-based programs
However in systems biology specific file formats have been developed with the aim to be easily exchangeable betweensoftware implemented in diverse programming languages
To this end these formats support semantically clear annotations and are maintained by a large community of scientistsEscherConverter supports export to two particularly important XML-based community file formats SBML with layoutextension and SBGN-ML
While SBML has been mainly developed for dynamic simulation of biological networks it is nowadays also usablefor diverse other purposes Its layout extension facilitates the encoding the display of biological networks
SBGN-ML has been directly developed as a language for the display of biological pathway maps of diverse kinds Itstores the position and connection of entities similar to what is shown in Escher networks
EscherConverter takes Escherrsquos JSON files as input and generates equivalent SBML Level 3 Version 1 files with layoutextension or SBGN-ML files
In order to ensure that the conversion is correct EscherConverter provides its own display that gives users a previewof how the export data format will be rendered by other tools In this preview display you can zoom in and out movearcs and node positions However it is important to know that none of the changes made in this preview are stored inthe export file
Download and Installation
You can obtain local copy of EscherConverter by clicking here
As a Javatrade application no specific installation is required for EscherConverter
However make sure you have a recent Javatrade Runtime Environment (JRE) installed on your computer (at least JRE8) You can obtain Javatrade from the Oracle website There you can also find installation instructions for your respectiveoperating system
Once Javatrade has been installed you can simply place the EscherConverter JAR file somewhere on your local computerfor instance in the folder
bull Applications if you are working under Mac OS
77 EscherConverter 33
Escher Documentation Release 143
bull opt for Linux computers
bull CProgram Files if you are using Windows
Launching the program
You can launch EscherConverter simply by double-clicking on the application JAR file This will open a followinggraphical user interface as described in the following figures
Figure 1 | The graphical user interface of EscherConverter
bull Preferences opens a settings dialog (see next screenshot)
bull Open displays a file chooser to select an input file in JSON format
bull Save export the map that is displayed in the current tab to SBML or SBGN-ML
bull Discard closes the current tab without saving
bull Help opens the online help that displays all command-line options
bull License displays the license under which this software is distributed
bull About shows information about the authors of this software
bull Main the main panel of the software in which converted Escher maps will be displayed organized in tabs
bull Status the status bar shows information and logging messages during the conversion
34 Chapter 7 Contents
Escher Documentation Release 143
Figure 2 | The preferences dialog All settings in this dialog are also available through EscherConverterrsquos command-line interface
Layout section several properties that are required in SBML and SBGN-ML are not explicitly specified in EscherrsquosJSON format and therefore need to be adjusted by the user These are the size of the drawing canvas the default boxsize for text labels the size of primary and secondary nodes In contrast to SBGN-ML and Escherrsquos JSON formatthe SBML layout extension supports three-dimensional displays When selecting this export file format it is thereforenecessary to also define the z-coordinate and the depth of all objects
Components and naming section Most settings in this section are specific for the SBML layout extension and areonly active if this output format is selected These are names and identifiers of the layout component and the in caseof SBML mandatory default compartment (a compartment without physical meaning a reaction space in which allmetabolites are located) EscherConverter can infer compartment bounds from metabolites but this is an experimentalfeature Just try it and see how the preview changes
77 EscherConverter 35
Escher Documentation Release 143
Figure 3 | A layout preview
The birds-eye view and the navigation component on the left help you navigate through the network display Thisgraph shows you how the converted pathway map will be rendered by software that supports SBGN-ML or the SBMLlayout extension This preview can be modified by moving arcs or nodes however none of those changes are storedwhen exporting the file In this current version EscherConver only exports layouts as given in the original JSON file
Included third-party software
EscherConverter includes several third-party libraries which we here list and acknowledge
bull ArgParser
bull JSBML
bull libSBGN
bull Pixel-Mixer icons
bull yFiles
772 Command-line interface API
You can launch EscherConverter from the command-line On a Unix system (such as Linux MacOS or Solaris etc)use a command like
bash$ java -jar -Xms8G -Xmx8G -Duserlanguage=en EscherConverter-05jar [options]
Under Window use a command like
Cgt javaw -jar -Xms8G -Xmx8G -Duserlanguage=en EscherConverter-05jar [options]
Escher has a large collection of command-line options (see below) which can be useful if you want to launch theprogram with specific settings or if multiple files are to be converted in a batch mode It is even possible to completelydisable the graphical user interface
36 Chapter 7 Contents
Escher Documentation Release 143
Input and output files
Definition of input and output data files as well as the format for the output
--input=ltFilegt
Specifies the JSON input file If a directory is given the conversion will be recursively performed Accepts JSON
--output=ltFilegt
The path to the file into which the output should be written If the input is a directory this must also be a directory inorder to perform a recursive conversion Accepts SBML SBGN
Escher layout
The options in this group allow you to influence how large certain elements should be displayed
--canvas-default-height=ltDoublegt
Just as in the case of the width of the canvas this value needs to be specified for cases where the JSON input file lacksan explicit specification of the canvas height Arguments must fit into the range [11E9] (Default value 2500)
--canvas-default-width=ltDoublegt
This value is used when no width has been defined for the canvas Since the width attribute is mandatory for the layouta default value must be provided in these cases Arguments must fit into the range [11E9] (Default value 2500)
--label-height=ltDoublegt
With this option you can specify the height of the bounding box of text labels Arguments must fit into the range[11E9] (Default value 500)
--label-width=ltDoublegt
This option defines the width of bounding boxes for text labels Arguments must fit into the range [11E9] (Defaultvalue 1600)
--node-depth=ltDoublegt
The length of nodes along z-coordinate Escher maps are actually two-dimensional but in general a layout can bethree-dimensional This value should be an arbitrary value greater than zero because some rendering engines mightnot display the node if its depth is zero Arguments must fit into the range [11E9] (Default value 10)
--node-label-height=ltDoublegt
Node labels can have a size different from general labels in the graph Here you can specify how height the boundingbox of the labels for nodes should be Arguments must fit into the range [11E9] (Default value 200)
--primary-node-height=ltDoublegt
The primary node should be bigger than the secondary node With this option you can specify the height of this typeof nodes Arguments must fit into the range [11E9] (Default value 300)
--primary-node-width=ltDoublegt
Escher maps distinguish between primary and secondary nodes Primary nodes should be larger than secondary nodesand display the main flow of matter through the network This option allows you to specify the width of primarynodes Arguments must fit into the range [11E9] (Default value 300)
77 EscherConverter 37
Escher Documentation Release 143
--reaction-label-height=ltDoublegt
Reaction label heightArguments must fit into the range [11E9] (Default value 300)
--reaction-node-ratio=ltDoublegt
This value is used as a conversion factor to determine the size of the reaction display box depending on the size ofprimary nodes Height and width of reaction nodes are determined by dividing the corresponding values from theprimary node size by this factor Arguments must fit into the range [01] (Default value 05)
--secondary-node-ratio=ltDoublegt
Similar to the reaction node ratio the size of secondary nodes (width and height) is determined by dividing thecorresponding values from the primary nodes by this value Arguments must fit into the range [01] (Default value06666666666666666)
--z=ltDoublegt
The position on the z-axis where the entire two-dimensional graph should be drawn Arguments must fit into the range[-1E91E9] (Default value 00)
Escher Components and their naming
Here you can influence which elements are to be included in the layout and how elements in the layout are to be calledor identified
--format=ltOutputFormatgt
The desired format for the conversion eg SBML All possible values for type ltOutputFormatgt are SBGN andSBML (Default value SBML)
--layout-id=ltStringgt
In contrast to the name this identifier does not have to be human-readable This is a machine identifier which muststart with a letter or underscore and can only contain ASCII characters (Default value Escher_Layout)
--layout-name=ltStringgt
This should be a human-readable name for the layout that is to be created This name might be displayed to describethe figure and should therefore be explanatory (Default value Escher Layout)
--compartment-id=ltStringgt
A compartment needs to have a unique identifier which needs to be a machine-readable Sting that must start with aletter or underscore and can only contain ASCII characters Since the JSON file does not provide this information thisoption allows you to specify the required identifier (Default value default)
--compartment-name=ltStringgt
With this option it is possible to define a name for the default compartment can be that needs to be generated for theconversion to SBML The name does not have any restrictions ie any UTF-8 character can be used (Default valueDefault compartment)
--infer-compartment-bounds
This converter can infer where the boundaries of compartments could be drawn To this end it uses each nodersquos BiGGids to identify the compartment of all metabolites Assuming that compartments have rectangular shapes the algorithmcan find the outermost node on each side of the box and hence obtain the boundaries of the compartment However
38 Chapter 7 Contents
Escher Documentation Release 143
this methods will fail when metabolites are drawn inside of such a box that belong to a different compartment that isactually further outside For this reason this option is deactivated by default (Default value false)
Options for the graphical user interface
--gui
If this option is given the program will display its graphical user interface (Default value false)
--log-level=ltStringgt
Change the log-level of this application This option will influence how fine-grained error and other log messages willbe that you receive while executing this program All possible values for type ltStringgt are ALL CONFIG FINEFINER FINEST INFO OFF SEVERE and WARNING (Default value INFO)
--log-file=ltFilegt
This option allows you to specify a log file to which all information of the program will be written Accepts (bp2bp3 log owl xml)
78 JavaScript API
class escherBuilder(map_data model_data embedded_css selection options)A Builder object contains all the UI and logic to generate a map builder or viewer
Arguments
bull map_data (object) ndash The data for a map to be passed to escherMapfrom_data() Ifnull then an empty Builder is initialized
bull model_data (object) ndash The data for a cobra model to be passed to es-cherCobraModel() Can be null
bull embedded_css (string) ndash The stylesheet for the SVG elements in the Escher map
bull selection (object) ndash (Optional Default In the body element) The d3 selection of anelement to place the Builder into The selection cannot be inside an SVG element
bull options (object) ndash (Optional) An object defining any of the following options
optionsmenu(Default rsquoallrsquo) The type of menu that will be displayed Can be lsquoallrsquo for the fullmenu or lsquozoomrsquo for just zoom buttons The lsquoallrsquo option requires the full set of Escherdependencies (D3js JQuery and Bootstrap) while the lsquozoomrsquo option requires only D3jsFor more details see Developing with Escher
optionsscroll_behavior(Default rsquopanrsquo) This option determines the effect that the scroll wheel will have onan Escher map Can be lsquopanrsquo to pan the map or lsquozoomrsquo to zoom the map when the usermoves the scroll wheel
optionsuse_3d_transform(Default Chooses a good option by testing the browser) If true then use CSS3 3D trans-forms to speed up panning and zooming This feature will only work on browsers thatsupport the 3D transforms It works best in the latest versions of Chrome Firefox andInternet Explorer Safari works better with this turned off
78 JavaScript API 39
Escher Documentation Release 143
optionsenable_editing(Default true) If true then display the map editing functions If false then hide themand only allow the user to view the map
optionenable_keys(Default true) If true then enable keyboard shortcuts
optionsenable_search(Default true) If true then enable indexing of the map for search Use false to disablesearching and potentially improve the map performance
optionsfill_screen(Default false) Use true to fill the screen when an Escher Builder is placed in a top-level container (eg a div in the body element)
optionsfull_screen_button(Default false) Include a button in the user interface for entering full screen mode
optionsignore_bootstrap(Default false) Do not use Bootstrap for buttons even if it available This is used toembed Escher in a Jupyter notebook where it conflicts with the Jupyter Boostrap installa-tion
Map model and styles
optionsstarting_reaction(Default null) The ID (as a string) of a reaction to draw when the Builder loads
optionsnever_ask_before_quit(Default false) If false then display a warning before the user closes an Eschermap If true then never display the warning This options is only respected if op-tionsenable_editing == true If enable_editing is false then the warnings are not dis-played
optionsunique_map_id(Default null) A unique ID that will be used to UI elements donrsquot interfere whenmultiple maps are in the same HTML document
optionsprimary_metabolite_radius(Default 15) The radius of primary metabolites in px
optionssecondary_metabolite_radius(Default 10) The radius of secondary metabolites in px
optionsmarker_radius(Default 5) The radius of marker nodes in px
optionsgene_font_size(Default 18) The font size of the gene reaction rules in px
optionshide_secondary_metabolites(Default false) If true then secondary nodes and segments are hidden This is conve-nient for generating simplified map figures
optionsshow_gene_reaction_rules(Default false) If true then show the gene reaction rules even without gene data
optionshide_all_labels(Default false) If checked hide all reaction gene and metabolite labels
Applied data
40 Chapter 7 Contents
Escher Documentation Release 143
optionsreaction_data(Default null) An object with reaction ids for keys and reaction data points for values
optionsreaction_stylesDefault [rsquocolorrsquo rsquosizersquo rsquotextrsquo]
An array of style types The array can contain any of the following lsquocolorrsquo lsquosizersquo lsquotextrsquolsquoabsrsquo The lsquocolorrsquo style means that the reactions will be colored according to the loadeddataset The lsquosizersquo style means that the reactions will be sized according to the loadeddataset The lsquotextrsquo style means that the data values will be displayed in the reactionlabels The lsquoabsrsquo style means the the absolute values of reaction values will be used fordata visualization
optionsreaction_compare_style(Default rsquodiffrsquo) How to compare to datasets Can be either lsquofold lsquolog2_foldrsquo orlsquodiffrsquo
optionsreaction_scaleDefault
[ type min color c8c8c8 size 12 type median color 9696ff size 20 type max color ff0000 size 25 ]
An array of objects that define points on the data scale
Each point is an object with a type attribute Types can be lsquominrsquo lsquomaxrsquo lsquomeanrsquo lsquoQ1rsquo (firstquartile) lsquomedianrsquo lsquoQ3rsquo (third quartile) or lsquovaluersquo Each point can have a color attributethat specifies a color with a string (any CSS color specification is allowed including hexrgb and rgba) Each point can have a size attirbute that specifies a reaction thickness as anumber Finally points with type lsquovaluersquo can have a value attribute that specifies an exactnumber for pont in the scale
NOTE If lsquominrsquo or lsquomaxrsquo is not provided Escher automatically adds them To be com-pletely clear about what you expect to see on the map it is best to provide lsquominrsquo andlsquomaxrsquo in addition to other scale points
Here are examples of each type
type rsquominrsquo color rsquoredrsquo size 12 Specifies that reactionsnear the minimum value are red and have thickness 12
type rsquoQ1rsquo color rsquorgba(100 100 50 05)rsquo size 12 Specifies that reactions near the first quartile have the given color opacity andthickness
type rsquomeanrsquo color rsquorgb(100 100 50)rsquo size 50 Specifies that reactions near the mean value have the given color and thickness
type rsquovaluersquo value 85 color rsquo333rsquo size 50 Specifies that reactions near 85 value have the given color and size
optionsreaction_no_data_color(Default rsquodcdcdcrsquo) The color of reactions with no data value
optionsreaction_no_data_size(Default 8) The size of reactions with no data value
optionsgene_data(Default null) An object with Gene ids for keys and gene data points for values
78 JavaScript API 41
Escher Documentation Release 143
optionsand_method_in_gene_reaction_rule(Default mean) When evaluating a gene reaction rule use this function to evaluate ANDrules Can be lsquomeanrsquo or lsquominrsquo
optionsmetabolite_data(Default null) An object with metabolite ids for keys and metabolite data points forvalues
optionsmetabolite_stylesDefault [rsquocolorrsquo rsquosizersquo rsquotextrsquo]
An array of style types The array can contain any of the following lsquocolorrsquo lsquosizersquo lsquotextrsquolsquoabsrsquo The lsquocolorrsquo style means that the metabolites will be colored according to the loadeddataset The lsquosizersquo style means that the metabolites will be sized according to the loadeddataset The lsquotextrsquo style means that the data values will be displayed in the metabolitelabels The lsquoabsrsquo style means the the absolute values of metabolite values will be used fordata visualization
optionsmetabolite_compare_style(Default rsquodiffrsquo) How to compare to datasets Can be either lsquofoldrsquo lsquolog2_foldrsquo orlsquodiffrsquo
optionsmetabolite_scaleDefault
[ type min color fffaf0 size 20 type median color f1c470 size 30 type max color 800000 size 40 ]
An array of objects that define points on the data scale See the description of op-tionsreaction_scale for an explanation of the format
optionsmetabolite_no_data_color(Default rsquoffffffrsquo) The color of metabolites with no data value
optionsmetabolite_no_data_size(Default 10) The size of metabolites with no data value
View and build options
optionsidentifiers_on_map(Default rsquobigg_idrsquo) The identifiers that will be displayed in reaction metabolite andgene labels Can be lsquobigg_idrsquo or lsquonamersquo
optionshighlight_missing(Default false) If true then highlight in red reactions that are not in the loaded COBRAmodel
optionsallow_building_duplicate_reactions(Default true) If true then building duplicate reactions is allowed If false then dupli-cate reactions are hidden in Add reaction mode
optionscofactors(Default [rsquoatprsquo rsquoadprsquo rsquonadrsquo rsquonadhrsquo rsquonadprsquo rsquonadphrsquorsquogtprsquo rsquogdprsquo rsquohrsquo rsquocoarsquo rsquoumprsquo rsquoh20rsquo rsquoppirsquo]) A list of metabo-lite IDs to treat as cofactors These will be secondary metabolites in new reactions
Callbacks
optionsfirst_load_callbackA function to run after loading the Builder
42 Chapter 7 Contents
Escher Documentation Release 143
load_map(map_data[ should_update_data])Load a map for the loaded data Also reloads most of the Builder content
Arguments
bull map_data ndash The data for a map
bull should_update_data (Boolean) ndash (Default true) Whether data should be ap-plied to the map
load_model(model_data[ should_update_data])Load the cobra model from model data
Arguments
bull model_data ndash The data for a Cobra model (Parsing in done by escherCobraModel)
bull should_update_data (Boolean) ndash (Default true) Whether data should be ap-plied to the model
view_mode()Enter view mode
build_mode()Enter build mode
brush_mode()Enter brush mode
zoom_mode()Enter zoom mode
rotate_mode()Enter rotate mode
text_mode()Enter text mode
set_reaction_data(data)
Arguments
bull data (array) ndash An array of 1 or 2 objects where each object has keys that are reactionIDrsquos and values that are data points (numbers)
set_metabolite_data(data)
Arguments
bull data (array) ndash An array of 1 or 2 objects where each object has keys that are metaboliteIDrsquos and values that are data points (numbers)
set_gene_data(data clear_gene_reaction_rules)
Arguments
bull data (array) ndash An array of 1 or 2 objects where each object has keys that are gene IDrsquosand values that are data points (numbers)
Arguments
bull clear_gene_reaction_rules (Boolean) ndash (Optional Default false) In addi-tion to setting the data also turn of the gene_reaction_rules
78 JavaScript API 43
Escher Documentation Release 143
79 Python API
class escherBuilder(map_name=None map_json=None model=None model_name=Nonemodel_json=None embedded_css=None reaction_data=None metabo-lite_data=None gene_data=None local_host=None id=None safe=Falsekwargs)
A metabolic map that can be viewed edited and used to visualize data
This map will also show metabolic fluxes passed in during consruction It can be viewed as a standalone htmlinside a browswer Alternately the respresentation inside an IPython notebook will also display the map
Maps are stored in json files and are stored in a cache directory Maps which are not found will be downloadedfrom a map repository if found
Parameters
bull map_name ndash A string specifying a map to be downloaded from the Escher web server orloaded from the cache
bull map_json ndash A JSON string or a file path to a JSON file or a URL specifying a JSON fileto be downloaded
bull model ndash A Cobra model
bull model_name ndash A string specifying a model to be downloaded from the Escher web serveror loaded from the cache
bull model_json ndash A JSON string or a file path to a JSON file or a URL specifying a JSONfile to be downloaded
bull embedded_css ndash The CSS (as a string) to be embedded with the Escher SVG
bull reaction_data ndash A dictionary with keys that correspond to reaction ids and values thatwill be mapped to reaction arrows and labels
bull metabolite_data ndash A dictionary with keys that correspond to metabolite ids and valuesthat will be mapped to metabolite nodes and labels
bull gene_data ndash A dictionary with keys that correspond to gene ids and values that will bemapped to corresponding reactions
bull local_host ndash A hostname that will be used for any local files This is generally usedfor using the notebook offline and for testing in the IPython Notebook with modified Eschercode An example value for local_host is lsquohttplocalhost7778lsquo
bull id ndash Specify an id to make the javascript data definitions unique A random id is chosen bydefault
bull safe ndash If True then loading files from the filesytem is not allowed This is to ensure thesafety of using Builder within a web server
Keyword Arguments
These are defined in the Javascript API
bulluse_3d_transform
bullenable_search
bullfill_screen
bullzoom_to_element
bullfull_screen_button
44 Chapter 7 Contents
Escher Documentation Release 143
bullstarting_reaction
bullunique_map_id
bullprimary_metabolite_radius
bullsecondary_metabolite_radius
bullmarker_radius
bullgene_font_size
bullhide_secondary_metabolites
bullshow_gene_reaction_rules
bullhide_all_labels
bullreaction_styles
bullreaction_compare_style
bullreaction_scale
bullreaction_no_data_color
bullreaction_no_data_size
bulland_method_in_gene_reaction_rule
bullmetabolite_styles
bullmetabolite_compare_style
bullmetabolite_scale
bullmetabolite_no_data_color
bullmetabolite_no_data_size
bullidentifiers_on_map
bullhighlight_missing
bullallow_building_duplicate_reactions
bullcofactors
All keyword arguments can also be set on an existing Builder object using setter functions eg
my_builderset_reaction_styles(new_styles)
display_in_browser(ip=lsquo127001rsquo port=7655 n_retries=50 js_source=rsquowebrsquo menu=rsquoallrsquoscroll_behavior=rsquopanrsquo enable_editing=True enable_keys=True mini-fied_js=True never_ask_before_quit=False)
Launch a web browser to view the map
Parameters
bull ip ndash The IP address to serve the map on
bull port ndash The port to serve the map on If specified the port is occupied then a random freeport will be used
bull n_retries (int) ndash The number of times the server will try to find a port before quitting
bull js_source (string) ndash Can be one of the following
ndash web (Default) - Use JavaScript files from eschergithubio
79 Python API 45
Escher Documentation Release 143
ndash local - Use compiled JavaScript files in the local Escher installation Works offline
ndash dev - No longer necessary with source maps This now gives the same behavior aslsquolocalrsquo
bull menu (string) ndash Menu bar options include
ndash none - No menu or buttons
ndash zoom - Just zoom buttons
ndash all (Default) - Menu and button bar (requires Bootstrap)
bull scroll_behavior (string) ndash Scroll behavior options
ndash pan - Pan the map
ndash zoom - Zoom the map
ndash none (Default) - No scroll events
bull enable_editing (Boolean) ndash Enable the map editing modes
bull enable_keys (Boolean) ndash Enable keyboard shortcuts
bull minified_js (Boolean) ndash If True use the minified version of JavaScript and CSSfiles
bull never_ask_before_quit (Boolean) ndash Never display an alert asking if you wantto leave the page By default this message is displayed if enable_editing is True
display_in_notebook(js_source=rsquowebrsquo menu=rsquozoomrsquo scroll_behavior=rsquononersquo mini-fied_js=True height=500 enable_editing=False)
Embed the Map within the current IPython Notebook
Parameters
bull js_source (string) ndash Can be one of the following
ndash web (Default) - Use JavaScript files from eschergithubio
ndash local - Use compiled JavaScript files in the local Escher installation Works offline
ndash dev - No longer necessary with source maps This now gives the same behav-ior as lsquolocalrsquo
bull menu (string) ndash Menu bar options include
ndash none - No menu or buttons
ndash zoom - Just zoom buttons
ndash Note The all menu option does not work in an IPython notebook
bull scroll_behavior (string) ndash Scroll behavior options
ndash pan - Pan the map
ndash zoom - Zoom the map
ndash none - (Default) No scroll events
bull minified_js (Boolean) ndash If True use the minified version of JavaScript andCSS files
bull height ndash Height of the HTML container
bull enable_editing (Boolean) ndash Enable the map editing modes
46 Chapter 7 Contents
Escher Documentation Release 143
save_html(filepath=None overwrite=False js_source=rsquowebrsquo protocol=rsquohttpsrsquo menu=rsquoallrsquoscroll_behavior=rsquopanrsquo enable_editing=True enable_keys=True minified_js=Truenever_ask_before_quit=False static_site_index_json=None)
Save an HTML file containing the map
Parameters
bull filepath (string) ndash The HTML file will be saved to this location Whenjs_source is lsquolocalrsquo then a new directory will be created with this name
bull overwrite (Boolean) ndash Overwrite existing files
bull js_source (string) ndash Can be one of the following
ndash web (Default) - Use JavaScript files from eschergithubio
ndash local - Use compiled JavaScript files in the local Escher installation Works of-fline To make the dependencies available to the downloaded file a new directorywill be made with the name specified by filepath
ndash dev - No longer necessary with source maps This now gives the same behav-ior as lsquolocalrsquo
bull protocol (string) ndash The protocol can be lsquohttprsquo lsquohttpsrsquo or None which indicatesa lsquoprotocol relative URLrsquo as in eschergithubio Ignored if source is local
bull menu (string) ndash Menu bar options include
ndash none - No menu or buttons
ndash zoom - Just zoom buttons
ndash all (Default) - Menu and button bar (requires Bootstrap)
bull scroll_behavior (string) ndash Scroll behavior options
ndash pan - Pan the map
ndash zoom - Zoom the map
ndash none (Default) - No scroll events
bull enable_editing (Boolean) ndash Enable the map editing modes
bull enable_keys (Boolean) ndash Enable keyboard shortcuts
bull minified_js (Boolean) ndash If True use the minified version of JavaScript andCSS files
bull height (number) ndash Height of the HTML container
bull never_ask_before_quit (Boolean) ndash Never display an alert asking if youwant to leave the page By default this message is displayed if enable_editing isTrue
bull static_site_index_json (string) ndash The index as a JSON string for thestatic site Use javascript to parse the URL options Used for generating static pages(see static_sitepy)
791 Cache
escherget_cache_dir(versioned=True name=None)Get the cache dir as a string and make the directory if it does not already exist
Parameters
79 Python API 47
Escher Documentation Release 143
bull versioned (Boolean) ndash Whether to return the versioned path in the cache Eschermaps for the latest version of Escher are found in the versioned directory (versioned= True) but maps for previous versions of Escher can be found by visiting the parentdirectory (versioned = False)
bull name (string) ndash An optional subdirectory within the cache If versioned is False thenname is ignored
escherclear_cache(different_cache_dir=None ask=True)Empty the contents of the cache directory including all versions of all maps and models
Parameters
bull different_cache_dir (string) ndash (Optional) The directory of another cacheThis is mainly for testing
bull ask (Boolean) ndash Whether to ask before deleting
escherlist_cached_maps()Return a list of all cached maps
escherlist_cached_models()Return a list of all cached models
escherlist_available_maps()Return a list of all maps available on the server
escherlist_available_models()Return a list of all models available on the server
710 License
Escher and EscherConverter are distributed under the MIT license
bull genindex
48 Chapter 7 Contents
Python Module Index
eescher 44
49
Escher Documentation Release 143
50 Python Module Index
Index
Bbrush_mode() (built-in function) 43build_mode() (built-in function) 43Builder (class in escher) 44
Cclear_cache() (in module escher) 48
Ddisplay_in_browser() (escherBuilder method) 45display_in_notebook() (escherBuilder method) 46
Eescher (module) 44escherBuilder() (class) 39
Gget_cache_dir() (in module escher) 47
Llist_available_maps() (in module escher) 48list_available_models() (in module escher) 48list_cached_maps() (in module escher) 48list_cached_models() (in module escher) 48load_map() (built-in function) 42load_model() (built-in function) 43
Ooptionenable_keys (option attribute) 40optionsallow_building_duplicate_reactions (options at-
tribute) 42optionsand_method_in_gene_reaction_rule (options at-
tribute) 41optionscofactors (options attribute) 42optionsenable_editing (options attribute) 39optionsenable_search (options attribute) 40optionsfill_screen (options attribute) 40optionsfirst_load_callback (options attribute) 42optionsfull_screen_button (options attribute) 40optionsgene_data (options attribute) 41
optionsgene_font_size (options attribute) 40optionshide_all_labels (options attribute) 40optionshide_secondary_metabolites (options attribute)
40optionshighlight_missing (options attribute) 42optionsidentifiers_on_map (options attribute) 42optionsignore_bootstrap (options attribute) 40optionsmarker_radius (options attribute) 40optionsmenu (options attribute) 39optionsmetabolite_compare_style (options attribute) 42optionsmetabolite_data (options attribute) 42optionsmetabolite_no_data_color (options attribute) 42optionsmetabolite_no_data_size (options attribute) 42optionsmetabolite_scale (options attribute) 42optionsmetabolite_styles (options attribute) 42optionsnever_ask_before_quit (options attribute) 40optionsprimary_metabolite_radius (options attribute) 40optionsreaction_compare_style (options attribute) 41optionsreaction_data (options attribute) 40optionsreaction_no_data_color (options attribute) 41optionsreaction_no_data_size (options attribute) 41optionsreaction_scale (options attribute) 41optionsreaction_styles (options attribute) 41optionsscroll_behavior (options attribute) 39optionssecondary_metabolite_radius (options attribute)
40optionsshow_gene_reaction_rules (options attribute) 40optionsstarting_reaction (options attribute) 40optionsunique_map_id (options attribute) 40optionsuse_3d_transform (options attribute) 39
Rrotate_mode() (built-in function) 43
Ssave_html() (escherBuilder method) 46set_gene_data() (built-in function) 43set_metabolite_data() (built-in function) 43set_reaction_data() (built-in function) 43
51
Escher Documentation Release 143
Ttext_mode() (built-in function) 43
Vview_mode() (built-in function) 43
Zzoom_mode() (built-in function) 43
52 Index
Escher Documentation Release 143
14 Chapter 6 Citing Escher
CHAPTER 7
Contents
71 Getting started
711 Introduction
Escher is here to help you visualize pathway maps But if you have never heard of a pathway map you mightappreciate a quick introduction
What are pathway maps
To understand pathway maps it is useful to think about the general organization of a cell At the smallest levelmolecules in a cell are arranged in three-dimensional structures and these structures determine many of the functionsthat take place in a cell For example the 3D structure of an enzyme determines the biochemical reactions that it cancatalyze These structures can be visualized in 3D using tools like Jmol (as in this example structure)
The DNA sequence is a second fundamental level of biological organization DNA sequences are the blueprints for allthe machinery of the cell and they can be visualized as a one-dimensional series of bases (ATCG) using tools like theUCSC genome browser
To use a football analogy the 3D molecular structures are akin to the players on the field and the information in theDNA sequence is like the playbook on the sidelines But football would not be very interesting if the players nevertook to the field and executed those plays So we are missing this level of detail the execution of biological plans bythe molecular players
What we are missing is the biochemical reaction network Proteins in the cell catalyze the conversion of substratemolecules into product molecules and these reactions are responsible for generating energy constructing cellularmachinery and structures detecting molecules in the environment signaling and more Biochemical reactions canbe grouped into pathways when they work in concert to carry out a function (If a reaction is a football play thenthe pathway is a drive) And Escher can be used to visualize these reactions and pathways Together we call thesevisualizations pathway maps
Escher to the rescue
Many Escher maps represent metabolic pathways and Escher was developed at the Systems Biology Research Groupwhere we have been building genome-scale models of metabolism over the past fifteen years However Escher is notlimited to metabolism It can be used to visualize any collection of biochemical reactions
Escher includes one more killer feature The ability to visualize datasets on a pathway map Many biological discov-eries are enabled by collecting and analyzing enormous datsets and so biologists are grappling with the challenges ofbig data By visualizing data in the context of pathway maps we can quickly spot trends which would not be apparent
15
Escher Documentation Release 143
with standard statistical tools And Escher visualizations can be adapted and shared to demonstrate those biologicaldiscoveries
The rest of this guide will introduce the Escher user interface and the major features of Escher
712 The launch page
When you open the Escher website you will see a launch page that looks like this
The options on the launch page are
bull Filter by organism Choose an organism to filter the Maps and Models
bull Map Choose a pre-built map or start from scratch with an empty builder by choosing None In parenthesesnext to the map name you will see the name of the model that was used to build this map
bull Model (Optional) If you choose a COBRA model to load then you can add new reactions to the pathway mapYou can also load your own model later after you launch the tool For an explanation of maps models andCOBRA see Escher COBRA and COBRApy
bull Tool
ndash The Viewer allows you to pan and zoom the map and to visualize data for reactions genes and metabo-lites
ndash The Builder in addition to the Viewer features allows you to add reactions move and rotate existingreactions add text annotations and adjust the map canvas
bull Options
ndash Scroll to zoom (instead of scroll to pan) Determines the effect of using the mousersquos scroll wheel overthe map
ndash Never ask before reloading If this is checked then you will not be warned before leaving the page evenif you have unsaved changes
Choose Load map to open the Escher viewer or builder in a new tab and prepare to be delighted by your very ownpathway map
16 Chapter 7 Contents
Escher Documentation Release 143
713 The menu bar
Once you have loaded an Escher map you will see a menu bar along the top of the screen Click the question mark tobring up the Escher documentation
714 Loading and saving maps
Using the map menu you can load and save maps at any time
Click Save map JSON to save the Escher map as a JSON file which is the standard file representing an Escher map
NOTE The JSON file does NOT save any datasets you have loaded This may be changed in a future version ofEscher
NOTE 2 In Safari saving files from Escher works a little differently than in the other major browsers After clickingSave map JSON Safari will load a new tab with the raw content of the Escher map file To save the file chooseFilegtSave As from the Safari menu A new dialog appears in the dropdown menu near the bottom select PageSource (rather than Web Archive) give your file an appropriate name (eg mapjson for an Escher map or mapsvgfor an SVG export) and click Save
Later you can can load a JSON file to view and edit a map by clicking Load map JSON
Click Export as SVG to generate a SVG file for editing in tools like Adobe Illustrator and Inkscape This is thebest way to generate figures for presentations and publications Unlike a JSON file a SVG file maintains the datavisualizations on the Escher map However you cannot load SVG files into Escher after you generate them
Click Clear Map to empty the whole map leaving a blank canvas NOTE You cannot undo Clear Map
715 Loading models
Use the model menu to manage the COBRA model loaded in Escher
71 Getting started 17
Escher Documentation Release 143
Choose Load COBRA model JSON to open a COBRA model Read more about COBRA models in Escher COBRAand COBRApy Once you have COBRApy v030 or later installed then you can generate a JSON model by followingthis example code
Once you have loaded a COBRA model there may be inconsistencies between the content in the map and the model(eg reaction IDs descriptive names and gene reaction rules) You click Update names and gene reaction rulesusing model to find matching reactions and metabolites between the map and the model (based on their IDs) andthen apply the names and gene reaction rules from the model to the map The reactions that do not match will behighlighted in red (This can be turned off again in the settings menu by deselecting Highlight reactions not in model)More advice on building maps is available in Building and contributing maps
Click Clear Model to clear the current model
716 Loading reaction gene and metabolite data
Datasets can be loaded as CSV files or JSON files using the Data Menu
In Escher reaction and gene datasets are visualized by changing the color thickness and labels of reaction arrowsMetabolite datasets are visualized by changing the color size and labels of metabolite circles The specific visualstyles can be modified in the Settings menu When data is not present for a specific reaction gene or metabolite thenthe text label will say lsquondrsquo which means lsquono datarsquo
18 Chapter 7 Contents
Escher Documentation Release 143
The structure of a CSV file
CSV files should have 1 header row 1 ID column and either 1 or 2 columns for data values The ID column cancontain BiGG IDs or descriptive names for the reactions metabolites or genes in the dataset Here is an example witha single data value columns
IDtime 0secglc__D_c54g6p__D_c23
Which might look like this is Excel
ID time 0secglc__D_c 54g6p_c 23
If two datasets are provided then the Escher map will display the difference between the datasets In the Settings menuthe Comparison setting allows you to choose between comparison functions (Fold Change Log2(Fold Change) andDifference) With two datasets the CSV file looks like this
ID time 0sec time 5sglc__D_c 54 102g6p_c 23 81
Data can also be loaded from a JSON file This Python code snippet provides an example of generating the properformat for single reaction data values and for reaction data comparisons
import json
save a single flux vector as JSONflux_dictionary = glc__D_c 54 g6p_c 23with open(outjson w) as f
jsondump(flux_dictionary f)
save a flux comparison as JSON
71 Getting started 19
Escher Documentation Release 143
flux_comp = [glc__D_c 54 g6p_c 23 glc__D_c 102 g6p_c 81]with open(out_compjson w) as f
jsondump(flux_comp f)
Gene data and gene reaction rules
Escher uses gene reaction rules to connect gene data to the reactions on a metabolic pathway You can see these genereaction rules on the map by selecting Show gene reaction rules in the Settings menu
Gene reaction rules show the genes whose gene products are required to catalyze a reaction Gene are connected usingAND and OR rules AND rules are used when two genes are required for enzymatic activity eg they are membersof a protein complex OR rules are used when either gene can catalyze the enzymatic activity eg they are isozymes
With OR rules Escher will take the sum of the data values for each gene With AND rules Escher will either takethe mean (the default) or the minimum of the components The AND behavior (mean vs minimum) is defined in theSettings menu
717 Editing and building
The Edit menu gives you access to function for editing the map
20 Chapter 7 Contents
Escher Documentation Release 143
Escher has five major modes and you can switch between those modes using the buttons in the Edit menu or usingthe buttons in the button bar on the left of the screen
1 Pan mode Drag the canvas to pan the map You can also use the mouse scroll wheel or trackpad scroll function(drag with 2 fingers) to pan the map (or to zoom if you selected Scroll to zoom in the settings)
2 Select mode Select nodes by clicking on them Shift-click to select multiple nodes or drag across the canvasto select multiple nodes using the selection brush
3 Add reaction mode If you have loaded a Model then click on the canvas to see a list of reactions that you candraw on the map Click on a node to see reactions that connect to that node In the input box you can search byreaction ID metabolite ID or gene ID (locus tag)
4 Rotate model Before entering rotate mode be sure to select one or more nodes in select mode Then afterentering rotate mode drag anywhere on the canvas to rotate the selection You can also drag the red crosshairsto change the center of the rotation
5 Text mode Use text mode to add text annotations to the map Click on the canvas to add a new text annotationor click an existing annotation to edit it When you are finished click Enter or Escape to save the changes
71 Getting started 21
Escher Documentation Release 143
In addition to the editing modes the Edit menu gives you access to the following commands
bull Delete Delete the currently selected node(s)
bull Undo Undo the last action NOTE Certain actions such as editing the canvas cannot be undone in the currentversion of Escher
bull Redo Redo the last action that was undone
bull Toggle primarysecondary node In Escher each metabolite node is either a primary node or a secondarynode Primary nodes are larger and secondary nodes can be hidden in the Settings menu Use this command totoggle the currently selected node(s) between primary and secondary
bull Rotate reactant locations When you draw a new reaction in Escher this command will rotate the new reactantsso that a new reactant is primary and centered This command is extremely useful when you are drawing a longpathway and you want to quickly switch which metabolite to ldquofollowrdquo eg make sure you are following thecarbon-containing metabolites
If you are confused then try drawing a new pathway and hitting the ldquocrdquo key to see the reactants rotate
bull Select all Select all nodes
bull Select none Unselect all nodes
bull Invert selection Select all the nodes that are currently unselected This feature is very useful when you wantto keep just one part of the map Simply drag to select the part you want to keep call the Invert selectioncommand then call the Delete command
718 Editing the canvas
A somewhat non-obvious feature of Escher is that you can edit the canvas by dragging the canvas edges This ispossible in Pan mode and Select mode
22 Chapter 7 Contents
Escher Documentation Release 143
719 View options
bull Zoom in Zoom in to the map
bull Zoom out Zoom out of the map
bull Zoom to nodes Zoom to see all the nodes on the map
bull Zoom to canvas Zoom to see the entire canvas
bull Find Search for a reaction metabolite or gene on the map
bull Show control points Show the control points you can drag these red and blue circle to adjust the shapes ofthe reactions curves
bull Settings Open the Settings menu
7110 The button bar
The button bar give you quick access to many of the common Escher functions
71 Getting started 23
Escher Documentation Release 143
24 Chapter 7 Contents
Escher Documentation Release 143
7111 Settings
View and build options
bull Identifiers Choose whether to show BiGG IDs or descriptive names for reactions metabolites and genes
bull Hide secondary metabolites This will simplify the map by hiding all secondary metabolites and the pathsconnected to them
bull Show gene reaction rules Show the gene reaction rules below the reaction labels even gene data is not loaded
bull Hide reaction gene and metabolite labels Another option to visually simplify the map this will hide alllabels that are not text annotations
bull Allow duplicate reactions By default duplicate reactions are hidden in the add reaction dropdown menuHowever you can turn this option on to show the duplicate reactions
bull Highlight reactions not in model Highlight in red any reactions that are on the map but are not in the modelThis is useful when you are adapting a map from one model for use with another model
71 Getting started 25
Escher Documentation Release 143
Reaction data settings
When reaction or gene data is loaded this section can be used to change visual settings for reactions
The color bar has individual control points and you can drag the control points (execpt min and max) left and right tochange their values Alternatively you can use the dropdown menu (next to the word median in the figure above) toattach a control point to a statistical measure (mean median first quartile (Q1) or third quartile (Q3)) This lets youchoose a color scale that will adapt to your dataset
For each control point you can choose a color by entering a CSS-style color (eg red ff0000 rgba(20 20 255 05)and you can choose a size that will scale the thickness of reactions
There are also color and size options for reactions that do not have any data value
Finally there are a few onoff settings for the loaded reaction or gene dataset
bull Options These determine how to visualize the datasets Check Absolute value to color and size reactions bythe absolute value of each data value The Size Color and Text options can be unselected to turn off sizingcoloring and data values in reaction labels individually
bull Comparison Determines the comparison algorithm to use when two datasets are loaded
bull Method for evaluating AND Determines the method that will be used to reconcile AND statements in genereaction rules when there is gene data loaded See Gene data and gene reaction rules for more details
Metabolite data settings
The data settings for metabolite data are analagous to those for reaction data The only difference is that size nowrefers to the size of the metabolite circles
26 Chapter 7 Contents
Escher Documentation Release 143
72 Escher COBRA and COBRApy
Escher can be used as an independent application but it draws heavily on the information in COBRA models ACOBRA model is a collection of all the reactions metabolites and genes known to exist in an organism (In theliterature these are generally called genome-scale models (GEMs) but we refer to them as COBRA models here toemphasize that Escher interoperates with models that are exported from COBRApy)
By loading a COBRA model into the Escher interface you have access to every reaction and metabolite in that modelYou also have the gene reaction rules for the reactions in the network which allow you to connect gene data toreactions and metabolites
COBRApy is a software package for COBRA modeling written in Python The Escher Python package uses CO-BRApy package for reading and writing COBRA models
721 Maps and models
In Escher you will see references to maps and models
A map contains the reactions and metabolites that you see in the Escher builder including their locations text annota-tions and the canvas
A model (a COBRA model) contains reactions and metabolites that you have not drawn yet Thus you can load aCOBRA model when you want to draw new reactions on the map
722 What is JSON and why do we use it
Both Escher maps and COBRA models are stored as JSON files JSON is a useful plain-text format for storing nesteddata structures We use JSON much like the SBML community uses XML You may notice that SBML files have axml extension and Escher maps and COBRA models have a json extension
You can use Python to explore a JSON file like this
import json
with open(mapjson r) as fmap_object = jsonload(f)
print map_object[0]print map_object[1][reactions]values()[0]
723 Escher SBML and SBGN
A tool has been developed for converting Escher maps to SBML Layout and SBGN and it will be released soon
COBRA models can be converted to SBML using COBRApy
73 Run Escher locally and in IPython
To run Escher on a local computer or to use Escher in PythonIPython first install it The Python package for Eschercan be installed using pip
pip install escher
72 Escher COBRA and COBRApy 27
Escher Documentation Release 143
Depending on your installation of Python you may need sudo
sudo pip install escher
Alternatively one can download the source files and install the package directly
python setuppy install
731 Escher in the IPython Notebook
Once you have installed Escher locally you can interact with Escher maps in an IPython Notebook
Here are example notebooks to get started with
bull COBRApy and Escher
bull JavaScript development and offline maps
bull Generate JSON models in COBRApy
Dependencies
bull Jinja2
bull Tornado
bull COBRApy 030 or later
732 Running the local server
You can run your own local server if you want to use Escher offline or explore your own maps with the homepagebrowser To get started install the Python package and run from any directory by calling
python -m escherserver
This starts a server at httplocalhost7778 You can also choose another port
python -m escherserver --port=8005
74 Validate and convert maps
741 Validate an Escher map
Escher maps follow a specification using the JSON Schema format Therefore any JSON Schema validator can beused to validate an Escher map by comparing it to the latest schema file For example the current schema is locatedhere
httpsgithubcomzakandrewkingescherblobmasterescherjsonschema1-0-0
To make this easier the Escher Python package includes a validation script To validate a map first install Escher
pip install escher
Then call the validator
python -m eschervalidate my_mapjson
Any errors in the map will print to the console
28 Chapter 7 Contents
Escher Documentation Release 143
742 Convert or upgrade an Escher map
Any Escher maps built with pre-release versions of Escher will not load right away in the stable v10 release Toconvert pre-release maps to the new format follow these steps
1 Install Escher
pip install escher
2 Find a COBRA model for your maps This COBRA model will be used to update the content of the mapin order to support all the new Escher features You can use a COBRA model encoded as SBML or JSON(generated with COBRApy v030b4 or later) The COBRA models currently available on the Escher websitecan be downloaded from the BiGG Models website
httpbiggucsdedu
For a refresher on the distinction between Escher maps COBRA models and their file types (SBML JSONSBML Layout) see Escher COBRA and COBRApy
3 Run the convert_map script to convert your existing Escher map (my_old_mapjson) to the new formatusing a COBRA model (model_filejson or model_filexml in these examples)
With a JSON file modelpython -m escherconvert_map my_old_mapjson pathtomodel_filejson
With an SBML modelpython -m escherconvert_map my_old_mapjson pathtomodel_filexml
Those commands will generate a new map called my_old_map_convertedjson that will load in Escher v10and later
75 Building and contributing maps
We are excited to collect pathway maps for every organism with a well characterized metabolic network This sectiondescribes the process of building a new map either from scratch or using a COBRA model with BiGG IDs
751 Building from scratch
To build a map from scratch you will first need a COBRA model for your map See the section Escher COBRA andCOBRApy for some background information on COBRA models
If you would like to eventually contribute your map to the Escher website it is important that your COBRA modeladheres to the identifiers in the BiGG Database Escher and BiGG are being developed together and we want tomaintain consistency and interoperability between them
Once you have a COBRA model you can follow these steps
1 Load your model in the Escher Builder
2 Begin building new reactions If you are familiar with the genes in your organism then try search for newreactions by their gene IDs
3 Limit each map to ~200 reactions Maps larger than this will slow down the Escher viewer especially on oldbrowsers Rather than building one giant map Escher is designed for building many smaller subsystem maps
4 When you have built a map for your a subsystem save the map as JSON with a name that includes the modelID followed by a period followed by the name of the subsystem For example
75 Building and contributing maps 29
Escher Documentation Release 143
iMM904Amino acid biosynthesisjson
5 (Optional) Once you have a set of subsystem maps you can set up a local Escher server so that subsystem mapsappear in the ldquoquick jumprdquo menu in the bottom right corner of the screen (as seen here for iJO1366) To setthis up you will need to start a local server as describe in Running the local server Next find your local cachedirectory by running this command in a terminal
python -c import escher print(escherget_cache_dir(name=maps))
This will print the location of the local maps cache Add your new subsystem maps to cache folder Now whenyou run the server (described in Running the local server) you should see that quick jump menu appear
NOTE The cache directory is organized into folders for organisms You can use these folder for filtering byorganism on the local launch page or you can place the maps in the top directory
NOTE 2 A similar approach can be used to access your models from the local launch page Place maps in thefolder indicated by
python -c import escher print(escherget_cache_dir(name=models))
752 Building from an existing map for a similar organism
Follow the instruction above except rather than starting from scratch load an existing Escher map for a differentorganism
Once you have the new model loaded use the Update names and gene reaction rules using model button in theModel menu to convert all descriptive names and gene reaction rules in the model to those in the map Reactions thatdo not match the model will be highlighted in red (This can be turned off again in the settings menu by deselectingHighlight reactions not in model)
Now visit each highlighted reaction and see if you can replace it with an equivalent biochemical pathway from themodel If not then delete the reaction and move on
Finally when there are no highlighted reactions left you can repeat this for other subsystems
753 Submitting maps to the Escher website
If you would like to contribute maps to Escher you can make a Pull Request to the GitHub repository eschergithubioMake sure there is a folder with the name of the organism in 1-0-0maps For example a new yeast map goes inthe folder
1-0-0mapsSaccharomyces cerevisiae
Then name your map by concatenating the model ID and the map name separated by a period For example a yeastmap built with the genome-scale model iMM904 could be named
iMM904Amino acid biosynthesisjson
Then add the JSON file for the model to the Pull Request if that model is not already available As before make afolder for your organism within 1-0-0models The model filename is just the model ID
In this example a correct Pull Request would include the following files
1-0-0mapsSaccharomyces cerevisiaeiMM904Amino acid biosynthesisjson1-0-0modelsSaccharomyces cerevisiaeiMM904json
30 Chapter 7 Contents
Escher Documentation Release 143
76 Developing with Escher
761 Using the static JavaScript and CSS files
You can include the compiled Escher JavaScript and CSS files in any HTML document The only dependencies ared3js and optionally Twitter Bootstrap if you are using the option menu=rsquoallrsquo
The compiled files are available form npmcdn
httpsnpmcdncomescher-visjsdistescherjshttpsnpmcdncomescher-visjsdistescherminjshttpsnpmcdncomescher-viscssdistbuildercsshttpsnpmcdncomescher-viscssdistbuildermincss
Source maps are also hosted there
httpsnpmcdncomescher-visjsdistescherjsmaphttpsnpmcdncomescher-visjsdistescherminjsmaphttpsnpmcdncomescher-viscssdistbuildermincssmap
If you want a particular version of escher add a version tag like this
httpsnpmcdncomescher-vis140-beta3jsdistescherjs
For an example of the boilerplate code that is required to begin developing with Escher have a look at the escher-demorepository For projects built with npm use the escher-test repository as a guide
762 Building and testing Escher
First install dependencies with npm
npm install
Escher uses grunt to manage the build process To run typical build steps just run
npm run compile
To test the JavaScript files run
npm run test
For Python testing run this in the py directory
python setuppy test
Build the static website
python setuppy build_gh
Clear static website files
python setuppy clean
Build and run the docs
cd docsmake htmlcd _buildhtml
76 Developing with Escher 31
Escher Documentation Release 143
python -m SimpleHTTPServer python 2python -m httpserver python 3
763 Generating and reading Escher and COBRA files
The Escher file format
Escher layouts are defined by JSON files that follow a specific schema using json schema The latest schemafor Escher JSON files is here The Escher schemas are versioned with inspiration from SchemaVer Theeschervalidate module can be used to validate models against the schema
The Escher layout schema is designed to be as simple as possible For example the core metabolism map of Es-cherichia coli is layed out like this
[
map_name E coli coreCore metabolismmap_id 2938hoq32a1map_description E coli core metabolic networknLast Modified Fri Dec 05 2014 163944 GMT-0800 (PST)homepage httpseschergithubioschema httpseschergithubioescherjsonschema1-0-0
reactions nodes text_label canvas
x 7857062530517567y 31436893920898433width 5894515691375733height 4860457037353515
]
The map_name includes the model that was used to build this layout followed by a period and then a readable namefor the map The map_id is a unique identifier for this map The map_description describes the map and thelast time it was modified Both the homepage and the schema entries must have exactly these values for the Eschermap to be valid
In the next section the reactions nodes labels and canvas are all defined For reactions nodes and text labels eachelement has a key that is an arbitrary integer As long as there are no repeated IDs (eg no 2 segments with the ID517) then everything should work fine
Read through the schema (here) for more detail on the format
The COBRA file format
COBRA models are also saved as JSON files This format has not been documented with a schema but you canbrowse through the core metabolism model as a guide to generating valid COBRA models
I still need help
If you are interested in developing with Escher and you need more information than what is provided in the documen-tation please contact Zachary King (zaking-AT-ucsd-DOT-edu)
32 Chapter 7 Contents
Escher Documentation Release 143
77 EscherConverter
EscherConverter is a standalone program that reads files created with the graphical network editor Escher and convertsthem to files in community standard formats
Download EscherConverter 05 (137 MB)
771 Using EscherConverter
Escher uses a JSON file format to represent its networks This format has been developed because of its very small filesize and its compatibility to online programs that are written in JavaScript In particular JSON is a JavaScript ObjectNotation or in other words a JSON file directly represents components of JavaScript programs This makes parsingvery simple and allows direct use of those files in web-based programs
However in systems biology specific file formats have been developed with the aim to be easily exchangeable betweensoftware implemented in diverse programming languages
To this end these formats support semantically clear annotations and are maintained by a large community of scientistsEscherConverter supports export to two particularly important XML-based community file formats SBML with layoutextension and SBGN-ML
While SBML has been mainly developed for dynamic simulation of biological networks it is nowadays also usablefor diverse other purposes Its layout extension facilitates the encoding the display of biological networks
SBGN-ML has been directly developed as a language for the display of biological pathway maps of diverse kinds Itstores the position and connection of entities similar to what is shown in Escher networks
EscherConverter takes Escherrsquos JSON files as input and generates equivalent SBML Level 3 Version 1 files with layoutextension or SBGN-ML files
In order to ensure that the conversion is correct EscherConverter provides its own display that gives users a previewof how the export data format will be rendered by other tools In this preview display you can zoom in and out movearcs and node positions However it is important to know that none of the changes made in this preview are stored inthe export file
Download and Installation
You can obtain local copy of EscherConverter by clicking here
As a Javatrade application no specific installation is required for EscherConverter
However make sure you have a recent Javatrade Runtime Environment (JRE) installed on your computer (at least JRE8) You can obtain Javatrade from the Oracle website There you can also find installation instructions for your respectiveoperating system
Once Javatrade has been installed you can simply place the EscherConverter JAR file somewhere on your local computerfor instance in the folder
bull Applications if you are working under Mac OS
77 EscherConverter 33
Escher Documentation Release 143
bull opt for Linux computers
bull CProgram Files if you are using Windows
Launching the program
You can launch EscherConverter simply by double-clicking on the application JAR file This will open a followinggraphical user interface as described in the following figures
Figure 1 | The graphical user interface of EscherConverter
bull Preferences opens a settings dialog (see next screenshot)
bull Open displays a file chooser to select an input file in JSON format
bull Save export the map that is displayed in the current tab to SBML or SBGN-ML
bull Discard closes the current tab without saving
bull Help opens the online help that displays all command-line options
bull License displays the license under which this software is distributed
bull About shows information about the authors of this software
bull Main the main panel of the software in which converted Escher maps will be displayed organized in tabs
bull Status the status bar shows information and logging messages during the conversion
34 Chapter 7 Contents
Escher Documentation Release 143
Figure 2 | The preferences dialog All settings in this dialog are also available through EscherConverterrsquos command-line interface
Layout section several properties that are required in SBML and SBGN-ML are not explicitly specified in EscherrsquosJSON format and therefore need to be adjusted by the user These are the size of the drawing canvas the default boxsize for text labels the size of primary and secondary nodes In contrast to SBGN-ML and Escherrsquos JSON formatthe SBML layout extension supports three-dimensional displays When selecting this export file format it is thereforenecessary to also define the z-coordinate and the depth of all objects
Components and naming section Most settings in this section are specific for the SBML layout extension and areonly active if this output format is selected These are names and identifiers of the layout component and the in caseof SBML mandatory default compartment (a compartment without physical meaning a reaction space in which allmetabolites are located) EscherConverter can infer compartment bounds from metabolites but this is an experimentalfeature Just try it and see how the preview changes
77 EscherConverter 35
Escher Documentation Release 143
Figure 3 | A layout preview
The birds-eye view and the navigation component on the left help you navigate through the network display Thisgraph shows you how the converted pathway map will be rendered by software that supports SBGN-ML or the SBMLlayout extension This preview can be modified by moving arcs or nodes however none of those changes are storedwhen exporting the file In this current version EscherConver only exports layouts as given in the original JSON file
Included third-party software
EscherConverter includes several third-party libraries which we here list and acknowledge
bull ArgParser
bull JSBML
bull libSBGN
bull Pixel-Mixer icons
bull yFiles
772 Command-line interface API
You can launch EscherConverter from the command-line On a Unix system (such as Linux MacOS or Solaris etc)use a command like
bash$ java -jar -Xms8G -Xmx8G -Duserlanguage=en EscherConverter-05jar [options]
Under Window use a command like
Cgt javaw -jar -Xms8G -Xmx8G -Duserlanguage=en EscherConverter-05jar [options]
Escher has a large collection of command-line options (see below) which can be useful if you want to launch theprogram with specific settings or if multiple files are to be converted in a batch mode It is even possible to completelydisable the graphical user interface
36 Chapter 7 Contents
Escher Documentation Release 143
Input and output files
Definition of input and output data files as well as the format for the output
--input=ltFilegt
Specifies the JSON input file If a directory is given the conversion will be recursively performed Accepts JSON
--output=ltFilegt
The path to the file into which the output should be written If the input is a directory this must also be a directory inorder to perform a recursive conversion Accepts SBML SBGN
Escher layout
The options in this group allow you to influence how large certain elements should be displayed
--canvas-default-height=ltDoublegt
Just as in the case of the width of the canvas this value needs to be specified for cases where the JSON input file lacksan explicit specification of the canvas height Arguments must fit into the range [11E9] (Default value 2500)
--canvas-default-width=ltDoublegt
This value is used when no width has been defined for the canvas Since the width attribute is mandatory for the layouta default value must be provided in these cases Arguments must fit into the range [11E9] (Default value 2500)
--label-height=ltDoublegt
With this option you can specify the height of the bounding box of text labels Arguments must fit into the range[11E9] (Default value 500)
--label-width=ltDoublegt
This option defines the width of bounding boxes for text labels Arguments must fit into the range [11E9] (Defaultvalue 1600)
--node-depth=ltDoublegt
The length of nodes along z-coordinate Escher maps are actually two-dimensional but in general a layout can bethree-dimensional This value should be an arbitrary value greater than zero because some rendering engines mightnot display the node if its depth is zero Arguments must fit into the range [11E9] (Default value 10)
--node-label-height=ltDoublegt
Node labels can have a size different from general labels in the graph Here you can specify how height the boundingbox of the labels for nodes should be Arguments must fit into the range [11E9] (Default value 200)
--primary-node-height=ltDoublegt
The primary node should be bigger than the secondary node With this option you can specify the height of this typeof nodes Arguments must fit into the range [11E9] (Default value 300)
--primary-node-width=ltDoublegt
Escher maps distinguish between primary and secondary nodes Primary nodes should be larger than secondary nodesand display the main flow of matter through the network This option allows you to specify the width of primarynodes Arguments must fit into the range [11E9] (Default value 300)
77 EscherConverter 37
Escher Documentation Release 143
--reaction-label-height=ltDoublegt
Reaction label heightArguments must fit into the range [11E9] (Default value 300)
--reaction-node-ratio=ltDoublegt
This value is used as a conversion factor to determine the size of the reaction display box depending on the size ofprimary nodes Height and width of reaction nodes are determined by dividing the corresponding values from theprimary node size by this factor Arguments must fit into the range [01] (Default value 05)
--secondary-node-ratio=ltDoublegt
Similar to the reaction node ratio the size of secondary nodes (width and height) is determined by dividing thecorresponding values from the primary nodes by this value Arguments must fit into the range [01] (Default value06666666666666666)
--z=ltDoublegt
The position on the z-axis where the entire two-dimensional graph should be drawn Arguments must fit into the range[-1E91E9] (Default value 00)
Escher Components and their naming
Here you can influence which elements are to be included in the layout and how elements in the layout are to be calledor identified
--format=ltOutputFormatgt
The desired format for the conversion eg SBML All possible values for type ltOutputFormatgt are SBGN andSBML (Default value SBML)
--layout-id=ltStringgt
In contrast to the name this identifier does not have to be human-readable This is a machine identifier which muststart with a letter or underscore and can only contain ASCII characters (Default value Escher_Layout)
--layout-name=ltStringgt
This should be a human-readable name for the layout that is to be created This name might be displayed to describethe figure and should therefore be explanatory (Default value Escher Layout)
--compartment-id=ltStringgt
A compartment needs to have a unique identifier which needs to be a machine-readable Sting that must start with aletter or underscore and can only contain ASCII characters Since the JSON file does not provide this information thisoption allows you to specify the required identifier (Default value default)
--compartment-name=ltStringgt
With this option it is possible to define a name for the default compartment can be that needs to be generated for theconversion to SBML The name does not have any restrictions ie any UTF-8 character can be used (Default valueDefault compartment)
--infer-compartment-bounds
This converter can infer where the boundaries of compartments could be drawn To this end it uses each nodersquos BiGGids to identify the compartment of all metabolites Assuming that compartments have rectangular shapes the algorithmcan find the outermost node on each side of the box and hence obtain the boundaries of the compartment However
38 Chapter 7 Contents
Escher Documentation Release 143
this methods will fail when metabolites are drawn inside of such a box that belong to a different compartment that isactually further outside For this reason this option is deactivated by default (Default value false)
Options for the graphical user interface
--gui
If this option is given the program will display its graphical user interface (Default value false)
--log-level=ltStringgt
Change the log-level of this application This option will influence how fine-grained error and other log messages willbe that you receive while executing this program All possible values for type ltStringgt are ALL CONFIG FINEFINER FINEST INFO OFF SEVERE and WARNING (Default value INFO)
--log-file=ltFilegt
This option allows you to specify a log file to which all information of the program will be written Accepts (bp2bp3 log owl xml)
78 JavaScript API
class escherBuilder(map_data model_data embedded_css selection options)A Builder object contains all the UI and logic to generate a map builder or viewer
Arguments
bull map_data (object) ndash The data for a map to be passed to escherMapfrom_data() Ifnull then an empty Builder is initialized
bull model_data (object) ndash The data for a cobra model to be passed to es-cherCobraModel() Can be null
bull embedded_css (string) ndash The stylesheet for the SVG elements in the Escher map
bull selection (object) ndash (Optional Default In the body element) The d3 selection of anelement to place the Builder into The selection cannot be inside an SVG element
bull options (object) ndash (Optional) An object defining any of the following options
optionsmenu(Default rsquoallrsquo) The type of menu that will be displayed Can be lsquoallrsquo for the fullmenu or lsquozoomrsquo for just zoom buttons The lsquoallrsquo option requires the full set of Escherdependencies (D3js JQuery and Bootstrap) while the lsquozoomrsquo option requires only D3jsFor more details see Developing with Escher
optionsscroll_behavior(Default rsquopanrsquo) This option determines the effect that the scroll wheel will have onan Escher map Can be lsquopanrsquo to pan the map or lsquozoomrsquo to zoom the map when the usermoves the scroll wheel
optionsuse_3d_transform(Default Chooses a good option by testing the browser) If true then use CSS3 3D trans-forms to speed up panning and zooming This feature will only work on browsers thatsupport the 3D transforms It works best in the latest versions of Chrome Firefox andInternet Explorer Safari works better with this turned off
78 JavaScript API 39
Escher Documentation Release 143
optionsenable_editing(Default true) If true then display the map editing functions If false then hide themand only allow the user to view the map
optionenable_keys(Default true) If true then enable keyboard shortcuts
optionsenable_search(Default true) If true then enable indexing of the map for search Use false to disablesearching and potentially improve the map performance
optionsfill_screen(Default false) Use true to fill the screen when an Escher Builder is placed in a top-level container (eg a div in the body element)
optionsfull_screen_button(Default false) Include a button in the user interface for entering full screen mode
optionsignore_bootstrap(Default false) Do not use Bootstrap for buttons even if it available This is used toembed Escher in a Jupyter notebook where it conflicts with the Jupyter Boostrap installa-tion
Map model and styles
optionsstarting_reaction(Default null) The ID (as a string) of a reaction to draw when the Builder loads
optionsnever_ask_before_quit(Default false) If false then display a warning before the user closes an Eschermap If true then never display the warning This options is only respected if op-tionsenable_editing == true If enable_editing is false then the warnings are not dis-played
optionsunique_map_id(Default null) A unique ID that will be used to UI elements donrsquot interfere whenmultiple maps are in the same HTML document
optionsprimary_metabolite_radius(Default 15) The radius of primary metabolites in px
optionssecondary_metabolite_radius(Default 10) The radius of secondary metabolites in px
optionsmarker_radius(Default 5) The radius of marker nodes in px
optionsgene_font_size(Default 18) The font size of the gene reaction rules in px
optionshide_secondary_metabolites(Default false) If true then secondary nodes and segments are hidden This is conve-nient for generating simplified map figures
optionsshow_gene_reaction_rules(Default false) If true then show the gene reaction rules even without gene data
optionshide_all_labels(Default false) If checked hide all reaction gene and metabolite labels
Applied data
40 Chapter 7 Contents
Escher Documentation Release 143
optionsreaction_data(Default null) An object with reaction ids for keys and reaction data points for values
optionsreaction_stylesDefault [rsquocolorrsquo rsquosizersquo rsquotextrsquo]
An array of style types The array can contain any of the following lsquocolorrsquo lsquosizersquo lsquotextrsquolsquoabsrsquo The lsquocolorrsquo style means that the reactions will be colored according to the loadeddataset The lsquosizersquo style means that the reactions will be sized according to the loadeddataset The lsquotextrsquo style means that the data values will be displayed in the reactionlabels The lsquoabsrsquo style means the the absolute values of reaction values will be used fordata visualization
optionsreaction_compare_style(Default rsquodiffrsquo) How to compare to datasets Can be either lsquofold lsquolog2_foldrsquo orlsquodiffrsquo
optionsreaction_scaleDefault
[ type min color c8c8c8 size 12 type median color 9696ff size 20 type max color ff0000 size 25 ]
An array of objects that define points on the data scale
Each point is an object with a type attribute Types can be lsquominrsquo lsquomaxrsquo lsquomeanrsquo lsquoQ1rsquo (firstquartile) lsquomedianrsquo lsquoQ3rsquo (third quartile) or lsquovaluersquo Each point can have a color attributethat specifies a color with a string (any CSS color specification is allowed including hexrgb and rgba) Each point can have a size attirbute that specifies a reaction thickness as anumber Finally points with type lsquovaluersquo can have a value attribute that specifies an exactnumber for pont in the scale
NOTE If lsquominrsquo or lsquomaxrsquo is not provided Escher automatically adds them To be com-pletely clear about what you expect to see on the map it is best to provide lsquominrsquo andlsquomaxrsquo in addition to other scale points
Here are examples of each type
type rsquominrsquo color rsquoredrsquo size 12 Specifies that reactionsnear the minimum value are red and have thickness 12
type rsquoQ1rsquo color rsquorgba(100 100 50 05)rsquo size 12 Specifies that reactions near the first quartile have the given color opacity andthickness
type rsquomeanrsquo color rsquorgb(100 100 50)rsquo size 50 Specifies that reactions near the mean value have the given color and thickness
type rsquovaluersquo value 85 color rsquo333rsquo size 50 Specifies that reactions near 85 value have the given color and size
optionsreaction_no_data_color(Default rsquodcdcdcrsquo) The color of reactions with no data value
optionsreaction_no_data_size(Default 8) The size of reactions with no data value
optionsgene_data(Default null) An object with Gene ids for keys and gene data points for values
78 JavaScript API 41
Escher Documentation Release 143
optionsand_method_in_gene_reaction_rule(Default mean) When evaluating a gene reaction rule use this function to evaluate ANDrules Can be lsquomeanrsquo or lsquominrsquo
optionsmetabolite_data(Default null) An object with metabolite ids for keys and metabolite data points forvalues
optionsmetabolite_stylesDefault [rsquocolorrsquo rsquosizersquo rsquotextrsquo]
An array of style types The array can contain any of the following lsquocolorrsquo lsquosizersquo lsquotextrsquolsquoabsrsquo The lsquocolorrsquo style means that the metabolites will be colored according to the loadeddataset The lsquosizersquo style means that the metabolites will be sized according to the loadeddataset The lsquotextrsquo style means that the data values will be displayed in the metabolitelabels The lsquoabsrsquo style means the the absolute values of metabolite values will be used fordata visualization
optionsmetabolite_compare_style(Default rsquodiffrsquo) How to compare to datasets Can be either lsquofoldrsquo lsquolog2_foldrsquo orlsquodiffrsquo
optionsmetabolite_scaleDefault
[ type min color fffaf0 size 20 type median color f1c470 size 30 type max color 800000 size 40 ]
An array of objects that define points on the data scale See the description of op-tionsreaction_scale for an explanation of the format
optionsmetabolite_no_data_color(Default rsquoffffffrsquo) The color of metabolites with no data value
optionsmetabolite_no_data_size(Default 10) The size of metabolites with no data value
View and build options
optionsidentifiers_on_map(Default rsquobigg_idrsquo) The identifiers that will be displayed in reaction metabolite andgene labels Can be lsquobigg_idrsquo or lsquonamersquo
optionshighlight_missing(Default false) If true then highlight in red reactions that are not in the loaded COBRAmodel
optionsallow_building_duplicate_reactions(Default true) If true then building duplicate reactions is allowed If false then dupli-cate reactions are hidden in Add reaction mode
optionscofactors(Default [rsquoatprsquo rsquoadprsquo rsquonadrsquo rsquonadhrsquo rsquonadprsquo rsquonadphrsquorsquogtprsquo rsquogdprsquo rsquohrsquo rsquocoarsquo rsquoumprsquo rsquoh20rsquo rsquoppirsquo]) A list of metabo-lite IDs to treat as cofactors These will be secondary metabolites in new reactions
Callbacks
optionsfirst_load_callbackA function to run after loading the Builder
42 Chapter 7 Contents
Escher Documentation Release 143
load_map(map_data[ should_update_data])Load a map for the loaded data Also reloads most of the Builder content
Arguments
bull map_data ndash The data for a map
bull should_update_data (Boolean) ndash (Default true) Whether data should be ap-plied to the map
load_model(model_data[ should_update_data])Load the cobra model from model data
Arguments
bull model_data ndash The data for a Cobra model (Parsing in done by escherCobraModel)
bull should_update_data (Boolean) ndash (Default true) Whether data should be ap-plied to the model
view_mode()Enter view mode
build_mode()Enter build mode
brush_mode()Enter brush mode
zoom_mode()Enter zoom mode
rotate_mode()Enter rotate mode
text_mode()Enter text mode
set_reaction_data(data)
Arguments
bull data (array) ndash An array of 1 or 2 objects where each object has keys that are reactionIDrsquos and values that are data points (numbers)
set_metabolite_data(data)
Arguments
bull data (array) ndash An array of 1 or 2 objects where each object has keys that are metaboliteIDrsquos and values that are data points (numbers)
set_gene_data(data clear_gene_reaction_rules)
Arguments
bull data (array) ndash An array of 1 or 2 objects where each object has keys that are gene IDrsquosand values that are data points (numbers)
Arguments
bull clear_gene_reaction_rules (Boolean) ndash (Optional Default false) In addi-tion to setting the data also turn of the gene_reaction_rules
78 JavaScript API 43
Escher Documentation Release 143
79 Python API
class escherBuilder(map_name=None map_json=None model=None model_name=Nonemodel_json=None embedded_css=None reaction_data=None metabo-lite_data=None gene_data=None local_host=None id=None safe=Falsekwargs)
A metabolic map that can be viewed edited and used to visualize data
This map will also show metabolic fluxes passed in during consruction It can be viewed as a standalone htmlinside a browswer Alternately the respresentation inside an IPython notebook will also display the map
Maps are stored in json files and are stored in a cache directory Maps which are not found will be downloadedfrom a map repository if found
Parameters
bull map_name ndash A string specifying a map to be downloaded from the Escher web server orloaded from the cache
bull map_json ndash A JSON string or a file path to a JSON file or a URL specifying a JSON fileto be downloaded
bull model ndash A Cobra model
bull model_name ndash A string specifying a model to be downloaded from the Escher web serveror loaded from the cache
bull model_json ndash A JSON string or a file path to a JSON file or a URL specifying a JSONfile to be downloaded
bull embedded_css ndash The CSS (as a string) to be embedded with the Escher SVG
bull reaction_data ndash A dictionary with keys that correspond to reaction ids and values thatwill be mapped to reaction arrows and labels
bull metabolite_data ndash A dictionary with keys that correspond to metabolite ids and valuesthat will be mapped to metabolite nodes and labels
bull gene_data ndash A dictionary with keys that correspond to gene ids and values that will bemapped to corresponding reactions
bull local_host ndash A hostname that will be used for any local files This is generally usedfor using the notebook offline and for testing in the IPython Notebook with modified Eschercode An example value for local_host is lsquohttplocalhost7778lsquo
bull id ndash Specify an id to make the javascript data definitions unique A random id is chosen bydefault
bull safe ndash If True then loading files from the filesytem is not allowed This is to ensure thesafety of using Builder within a web server
Keyword Arguments
These are defined in the Javascript API
bulluse_3d_transform
bullenable_search
bullfill_screen
bullzoom_to_element
bullfull_screen_button
44 Chapter 7 Contents
Escher Documentation Release 143
bullstarting_reaction
bullunique_map_id
bullprimary_metabolite_radius
bullsecondary_metabolite_radius
bullmarker_radius
bullgene_font_size
bullhide_secondary_metabolites
bullshow_gene_reaction_rules
bullhide_all_labels
bullreaction_styles
bullreaction_compare_style
bullreaction_scale
bullreaction_no_data_color
bullreaction_no_data_size
bulland_method_in_gene_reaction_rule
bullmetabolite_styles
bullmetabolite_compare_style
bullmetabolite_scale
bullmetabolite_no_data_color
bullmetabolite_no_data_size
bullidentifiers_on_map
bullhighlight_missing
bullallow_building_duplicate_reactions
bullcofactors
All keyword arguments can also be set on an existing Builder object using setter functions eg
my_builderset_reaction_styles(new_styles)
display_in_browser(ip=lsquo127001rsquo port=7655 n_retries=50 js_source=rsquowebrsquo menu=rsquoallrsquoscroll_behavior=rsquopanrsquo enable_editing=True enable_keys=True mini-fied_js=True never_ask_before_quit=False)
Launch a web browser to view the map
Parameters
bull ip ndash The IP address to serve the map on
bull port ndash The port to serve the map on If specified the port is occupied then a random freeport will be used
bull n_retries (int) ndash The number of times the server will try to find a port before quitting
bull js_source (string) ndash Can be one of the following
ndash web (Default) - Use JavaScript files from eschergithubio
79 Python API 45
Escher Documentation Release 143
ndash local - Use compiled JavaScript files in the local Escher installation Works offline
ndash dev - No longer necessary with source maps This now gives the same behavior aslsquolocalrsquo
bull menu (string) ndash Menu bar options include
ndash none - No menu or buttons
ndash zoom - Just zoom buttons
ndash all (Default) - Menu and button bar (requires Bootstrap)
bull scroll_behavior (string) ndash Scroll behavior options
ndash pan - Pan the map
ndash zoom - Zoom the map
ndash none (Default) - No scroll events
bull enable_editing (Boolean) ndash Enable the map editing modes
bull enable_keys (Boolean) ndash Enable keyboard shortcuts
bull minified_js (Boolean) ndash If True use the minified version of JavaScript and CSSfiles
bull never_ask_before_quit (Boolean) ndash Never display an alert asking if you wantto leave the page By default this message is displayed if enable_editing is True
display_in_notebook(js_source=rsquowebrsquo menu=rsquozoomrsquo scroll_behavior=rsquononersquo mini-fied_js=True height=500 enable_editing=False)
Embed the Map within the current IPython Notebook
Parameters
bull js_source (string) ndash Can be one of the following
ndash web (Default) - Use JavaScript files from eschergithubio
ndash local - Use compiled JavaScript files in the local Escher installation Works offline
ndash dev - No longer necessary with source maps This now gives the same behav-ior as lsquolocalrsquo
bull menu (string) ndash Menu bar options include
ndash none - No menu or buttons
ndash zoom - Just zoom buttons
ndash Note The all menu option does not work in an IPython notebook
bull scroll_behavior (string) ndash Scroll behavior options
ndash pan - Pan the map
ndash zoom - Zoom the map
ndash none - (Default) No scroll events
bull minified_js (Boolean) ndash If True use the minified version of JavaScript andCSS files
bull height ndash Height of the HTML container
bull enable_editing (Boolean) ndash Enable the map editing modes
46 Chapter 7 Contents
Escher Documentation Release 143
save_html(filepath=None overwrite=False js_source=rsquowebrsquo protocol=rsquohttpsrsquo menu=rsquoallrsquoscroll_behavior=rsquopanrsquo enable_editing=True enable_keys=True minified_js=Truenever_ask_before_quit=False static_site_index_json=None)
Save an HTML file containing the map
Parameters
bull filepath (string) ndash The HTML file will be saved to this location Whenjs_source is lsquolocalrsquo then a new directory will be created with this name
bull overwrite (Boolean) ndash Overwrite existing files
bull js_source (string) ndash Can be one of the following
ndash web (Default) - Use JavaScript files from eschergithubio
ndash local - Use compiled JavaScript files in the local Escher installation Works of-fline To make the dependencies available to the downloaded file a new directorywill be made with the name specified by filepath
ndash dev - No longer necessary with source maps This now gives the same behav-ior as lsquolocalrsquo
bull protocol (string) ndash The protocol can be lsquohttprsquo lsquohttpsrsquo or None which indicatesa lsquoprotocol relative URLrsquo as in eschergithubio Ignored if source is local
bull menu (string) ndash Menu bar options include
ndash none - No menu or buttons
ndash zoom - Just zoom buttons
ndash all (Default) - Menu and button bar (requires Bootstrap)
bull scroll_behavior (string) ndash Scroll behavior options
ndash pan - Pan the map
ndash zoom - Zoom the map
ndash none (Default) - No scroll events
bull enable_editing (Boolean) ndash Enable the map editing modes
bull enable_keys (Boolean) ndash Enable keyboard shortcuts
bull minified_js (Boolean) ndash If True use the minified version of JavaScript andCSS files
bull height (number) ndash Height of the HTML container
bull never_ask_before_quit (Boolean) ndash Never display an alert asking if youwant to leave the page By default this message is displayed if enable_editing isTrue
bull static_site_index_json (string) ndash The index as a JSON string for thestatic site Use javascript to parse the URL options Used for generating static pages(see static_sitepy)
791 Cache
escherget_cache_dir(versioned=True name=None)Get the cache dir as a string and make the directory if it does not already exist
Parameters
79 Python API 47
Escher Documentation Release 143
bull versioned (Boolean) ndash Whether to return the versioned path in the cache Eschermaps for the latest version of Escher are found in the versioned directory (versioned= True) but maps for previous versions of Escher can be found by visiting the parentdirectory (versioned = False)
bull name (string) ndash An optional subdirectory within the cache If versioned is False thenname is ignored
escherclear_cache(different_cache_dir=None ask=True)Empty the contents of the cache directory including all versions of all maps and models
Parameters
bull different_cache_dir (string) ndash (Optional) The directory of another cacheThis is mainly for testing
bull ask (Boolean) ndash Whether to ask before deleting
escherlist_cached_maps()Return a list of all cached maps
escherlist_cached_models()Return a list of all cached models
escherlist_available_maps()Return a list of all maps available on the server
escherlist_available_models()Return a list of all models available on the server
710 License
Escher and EscherConverter are distributed under the MIT license
bull genindex
48 Chapter 7 Contents
Python Module Index
eescher 44
49
Escher Documentation Release 143
50 Python Module Index
Index
Bbrush_mode() (built-in function) 43build_mode() (built-in function) 43Builder (class in escher) 44
Cclear_cache() (in module escher) 48
Ddisplay_in_browser() (escherBuilder method) 45display_in_notebook() (escherBuilder method) 46
Eescher (module) 44escherBuilder() (class) 39
Gget_cache_dir() (in module escher) 47
Llist_available_maps() (in module escher) 48list_available_models() (in module escher) 48list_cached_maps() (in module escher) 48list_cached_models() (in module escher) 48load_map() (built-in function) 42load_model() (built-in function) 43
Ooptionenable_keys (option attribute) 40optionsallow_building_duplicate_reactions (options at-
tribute) 42optionsand_method_in_gene_reaction_rule (options at-
tribute) 41optionscofactors (options attribute) 42optionsenable_editing (options attribute) 39optionsenable_search (options attribute) 40optionsfill_screen (options attribute) 40optionsfirst_load_callback (options attribute) 42optionsfull_screen_button (options attribute) 40optionsgene_data (options attribute) 41
optionsgene_font_size (options attribute) 40optionshide_all_labels (options attribute) 40optionshide_secondary_metabolites (options attribute)
40optionshighlight_missing (options attribute) 42optionsidentifiers_on_map (options attribute) 42optionsignore_bootstrap (options attribute) 40optionsmarker_radius (options attribute) 40optionsmenu (options attribute) 39optionsmetabolite_compare_style (options attribute) 42optionsmetabolite_data (options attribute) 42optionsmetabolite_no_data_color (options attribute) 42optionsmetabolite_no_data_size (options attribute) 42optionsmetabolite_scale (options attribute) 42optionsmetabolite_styles (options attribute) 42optionsnever_ask_before_quit (options attribute) 40optionsprimary_metabolite_radius (options attribute) 40optionsreaction_compare_style (options attribute) 41optionsreaction_data (options attribute) 40optionsreaction_no_data_color (options attribute) 41optionsreaction_no_data_size (options attribute) 41optionsreaction_scale (options attribute) 41optionsreaction_styles (options attribute) 41optionsscroll_behavior (options attribute) 39optionssecondary_metabolite_radius (options attribute)
40optionsshow_gene_reaction_rules (options attribute) 40optionsstarting_reaction (options attribute) 40optionsunique_map_id (options attribute) 40optionsuse_3d_transform (options attribute) 39
Rrotate_mode() (built-in function) 43
Ssave_html() (escherBuilder method) 46set_gene_data() (built-in function) 43set_metabolite_data() (built-in function) 43set_reaction_data() (built-in function) 43
51
Escher Documentation Release 143
Ttext_mode() (built-in function) 43
Vview_mode() (built-in function) 43
Zzoom_mode() (built-in function) 43
52 Index
Escher Documentation Release 143
with standard statistical tools And Escher visualizations can be adapted and shared to demonstrate those biologicaldiscoveries
The rest of this guide will introduce the Escher user interface and the major features of Escher
712 The launch page
When you open the Escher website you will see a launch page that looks like this
The options on the launch page are
bull Filter by organism Choose an organism to filter the Maps and Models
bull Map Choose a pre-built map or start from scratch with an empty builder by choosing None In parenthesesnext to the map name you will see the name of the model that was used to build this map
bull Model (Optional) If you choose a COBRA model to load then you can add new reactions to the pathway mapYou can also load your own model later after you launch the tool For an explanation of maps models andCOBRA see Escher COBRA and COBRApy
bull Tool
ndash The Viewer allows you to pan and zoom the map and to visualize data for reactions genes and metabo-lites
ndash The Builder in addition to the Viewer features allows you to add reactions move and rotate existingreactions add text annotations and adjust the map canvas
bull Options
ndash Scroll to zoom (instead of scroll to pan) Determines the effect of using the mousersquos scroll wheel overthe map
ndash Never ask before reloading If this is checked then you will not be warned before leaving the page evenif you have unsaved changes
Choose Load map to open the Escher viewer or builder in a new tab and prepare to be delighted by your very ownpathway map
16 Chapter 7 Contents
Escher Documentation Release 143
713 The menu bar
Once you have loaded an Escher map you will see a menu bar along the top of the screen Click the question mark tobring up the Escher documentation
714 Loading and saving maps
Using the map menu you can load and save maps at any time
Click Save map JSON to save the Escher map as a JSON file which is the standard file representing an Escher map
NOTE The JSON file does NOT save any datasets you have loaded This may be changed in a future version ofEscher
NOTE 2 In Safari saving files from Escher works a little differently than in the other major browsers After clickingSave map JSON Safari will load a new tab with the raw content of the Escher map file To save the file chooseFilegtSave As from the Safari menu A new dialog appears in the dropdown menu near the bottom select PageSource (rather than Web Archive) give your file an appropriate name (eg mapjson for an Escher map or mapsvgfor an SVG export) and click Save
Later you can can load a JSON file to view and edit a map by clicking Load map JSON
Click Export as SVG to generate a SVG file for editing in tools like Adobe Illustrator and Inkscape This is thebest way to generate figures for presentations and publications Unlike a JSON file a SVG file maintains the datavisualizations on the Escher map However you cannot load SVG files into Escher after you generate them
Click Clear Map to empty the whole map leaving a blank canvas NOTE You cannot undo Clear Map
715 Loading models
Use the model menu to manage the COBRA model loaded in Escher
71 Getting started 17
Escher Documentation Release 143
Choose Load COBRA model JSON to open a COBRA model Read more about COBRA models in Escher COBRAand COBRApy Once you have COBRApy v030 or later installed then you can generate a JSON model by followingthis example code
Once you have loaded a COBRA model there may be inconsistencies between the content in the map and the model(eg reaction IDs descriptive names and gene reaction rules) You click Update names and gene reaction rulesusing model to find matching reactions and metabolites between the map and the model (based on their IDs) andthen apply the names and gene reaction rules from the model to the map The reactions that do not match will behighlighted in red (This can be turned off again in the settings menu by deselecting Highlight reactions not in model)More advice on building maps is available in Building and contributing maps
Click Clear Model to clear the current model
716 Loading reaction gene and metabolite data
Datasets can be loaded as CSV files or JSON files using the Data Menu
In Escher reaction and gene datasets are visualized by changing the color thickness and labels of reaction arrowsMetabolite datasets are visualized by changing the color size and labels of metabolite circles The specific visualstyles can be modified in the Settings menu When data is not present for a specific reaction gene or metabolite thenthe text label will say lsquondrsquo which means lsquono datarsquo
18 Chapter 7 Contents
Escher Documentation Release 143
The structure of a CSV file
CSV files should have 1 header row 1 ID column and either 1 or 2 columns for data values The ID column cancontain BiGG IDs or descriptive names for the reactions metabolites or genes in the dataset Here is an example witha single data value columns
IDtime 0secglc__D_c54g6p__D_c23
Which might look like this is Excel
ID time 0secglc__D_c 54g6p_c 23
If two datasets are provided then the Escher map will display the difference between the datasets In the Settings menuthe Comparison setting allows you to choose between comparison functions (Fold Change Log2(Fold Change) andDifference) With two datasets the CSV file looks like this
ID time 0sec time 5sglc__D_c 54 102g6p_c 23 81
Data can also be loaded from a JSON file This Python code snippet provides an example of generating the properformat for single reaction data values and for reaction data comparisons
import json
save a single flux vector as JSONflux_dictionary = glc__D_c 54 g6p_c 23with open(outjson w) as f
jsondump(flux_dictionary f)
save a flux comparison as JSON
71 Getting started 19
Escher Documentation Release 143
flux_comp = [glc__D_c 54 g6p_c 23 glc__D_c 102 g6p_c 81]with open(out_compjson w) as f
jsondump(flux_comp f)
Gene data and gene reaction rules
Escher uses gene reaction rules to connect gene data to the reactions on a metabolic pathway You can see these genereaction rules on the map by selecting Show gene reaction rules in the Settings menu
Gene reaction rules show the genes whose gene products are required to catalyze a reaction Gene are connected usingAND and OR rules AND rules are used when two genes are required for enzymatic activity eg they are membersof a protein complex OR rules are used when either gene can catalyze the enzymatic activity eg they are isozymes
With OR rules Escher will take the sum of the data values for each gene With AND rules Escher will either takethe mean (the default) or the minimum of the components The AND behavior (mean vs minimum) is defined in theSettings menu
717 Editing and building
The Edit menu gives you access to function for editing the map
20 Chapter 7 Contents
Escher Documentation Release 143
Escher has five major modes and you can switch between those modes using the buttons in the Edit menu or usingthe buttons in the button bar on the left of the screen
1 Pan mode Drag the canvas to pan the map You can also use the mouse scroll wheel or trackpad scroll function(drag with 2 fingers) to pan the map (or to zoom if you selected Scroll to zoom in the settings)
2 Select mode Select nodes by clicking on them Shift-click to select multiple nodes or drag across the canvasto select multiple nodes using the selection brush
3 Add reaction mode If you have loaded a Model then click on the canvas to see a list of reactions that you candraw on the map Click on a node to see reactions that connect to that node In the input box you can search byreaction ID metabolite ID or gene ID (locus tag)
4 Rotate model Before entering rotate mode be sure to select one or more nodes in select mode Then afterentering rotate mode drag anywhere on the canvas to rotate the selection You can also drag the red crosshairsto change the center of the rotation
5 Text mode Use text mode to add text annotations to the map Click on the canvas to add a new text annotationor click an existing annotation to edit it When you are finished click Enter or Escape to save the changes
71 Getting started 21
Escher Documentation Release 143
In addition to the editing modes the Edit menu gives you access to the following commands
bull Delete Delete the currently selected node(s)
bull Undo Undo the last action NOTE Certain actions such as editing the canvas cannot be undone in the currentversion of Escher
bull Redo Redo the last action that was undone
bull Toggle primarysecondary node In Escher each metabolite node is either a primary node or a secondarynode Primary nodes are larger and secondary nodes can be hidden in the Settings menu Use this command totoggle the currently selected node(s) between primary and secondary
bull Rotate reactant locations When you draw a new reaction in Escher this command will rotate the new reactantsso that a new reactant is primary and centered This command is extremely useful when you are drawing a longpathway and you want to quickly switch which metabolite to ldquofollowrdquo eg make sure you are following thecarbon-containing metabolites
If you are confused then try drawing a new pathway and hitting the ldquocrdquo key to see the reactants rotate
bull Select all Select all nodes
bull Select none Unselect all nodes
bull Invert selection Select all the nodes that are currently unselected This feature is very useful when you wantto keep just one part of the map Simply drag to select the part you want to keep call the Invert selectioncommand then call the Delete command
718 Editing the canvas
A somewhat non-obvious feature of Escher is that you can edit the canvas by dragging the canvas edges This ispossible in Pan mode and Select mode
22 Chapter 7 Contents
Escher Documentation Release 143
719 View options
bull Zoom in Zoom in to the map
bull Zoom out Zoom out of the map
bull Zoom to nodes Zoom to see all the nodes on the map
bull Zoom to canvas Zoom to see the entire canvas
bull Find Search for a reaction metabolite or gene on the map
bull Show control points Show the control points you can drag these red and blue circle to adjust the shapes ofthe reactions curves
bull Settings Open the Settings menu
7110 The button bar
The button bar give you quick access to many of the common Escher functions
71 Getting started 23
Escher Documentation Release 143
24 Chapter 7 Contents
Escher Documentation Release 143
7111 Settings
View and build options
bull Identifiers Choose whether to show BiGG IDs or descriptive names for reactions metabolites and genes
bull Hide secondary metabolites This will simplify the map by hiding all secondary metabolites and the pathsconnected to them
bull Show gene reaction rules Show the gene reaction rules below the reaction labels even gene data is not loaded
bull Hide reaction gene and metabolite labels Another option to visually simplify the map this will hide alllabels that are not text annotations
bull Allow duplicate reactions By default duplicate reactions are hidden in the add reaction dropdown menuHowever you can turn this option on to show the duplicate reactions
bull Highlight reactions not in model Highlight in red any reactions that are on the map but are not in the modelThis is useful when you are adapting a map from one model for use with another model
71 Getting started 25
Escher Documentation Release 143
Reaction data settings
When reaction or gene data is loaded this section can be used to change visual settings for reactions
The color bar has individual control points and you can drag the control points (execpt min and max) left and right tochange their values Alternatively you can use the dropdown menu (next to the word median in the figure above) toattach a control point to a statistical measure (mean median first quartile (Q1) or third quartile (Q3)) This lets youchoose a color scale that will adapt to your dataset
For each control point you can choose a color by entering a CSS-style color (eg red ff0000 rgba(20 20 255 05)and you can choose a size that will scale the thickness of reactions
There are also color and size options for reactions that do not have any data value
Finally there are a few onoff settings for the loaded reaction or gene dataset
bull Options These determine how to visualize the datasets Check Absolute value to color and size reactions bythe absolute value of each data value The Size Color and Text options can be unselected to turn off sizingcoloring and data values in reaction labels individually
bull Comparison Determines the comparison algorithm to use when two datasets are loaded
bull Method for evaluating AND Determines the method that will be used to reconcile AND statements in genereaction rules when there is gene data loaded See Gene data and gene reaction rules for more details
Metabolite data settings
The data settings for metabolite data are analagous to those for reaction data The only difference is that size nowrefers to the size of the metabolite circles
26 Chapter 7 Contents
Escher Documentation Release 143
72 Escher COBRA and COBRApy
Escher can be used as an independent application but it draws heavily on the information in COBRA models ACOBRA model is a collection of all the reactions metabolites and genes known to exist in an organism (In theliterature these are generally called genome-scale models (GEMs) but we refer to them as COBRA models here toemphasize that Escher interoperates with models that are exported from COBRApy)
By loading a COBRA model into the Escher interface you have access to every reaction and metabolite in that modelYou also have the gene reaction rules for the reactions in the network which allow you to connect gene data toreactions and metabolites
COBRApy is a software package for COBRA modeling written in Python The Escher Python package uses CO-BRApy package for reading and writing COBRA models
721 Maps and models
In Escher you will see references to maps and models
A map contains the reactions and metabolites that you see in the Escher builder including their locations text annota-tions and the canvas
A model (a COBRA model) contains reactions and metabolites that you have not drawn yet Thus you can load aCOBRA model when you want to draw new reactions on the map
722 What is JSON and why do we use it
Both Escher maps and COBRA models are stored as JSON files JSON is a useful plain-text format for storing nesteddata structures We use JSON much like the SBML community uses XML You may notice that SBML files have axml extension and Escher maps and COBRA models have a json extension
You can use Python to explore a JSON file like this
import json
with open(mapjson r) as fmap_object = jsonload(f)
print map_object[0]print map_object[1][reactions]values()[0]
723 Escher SBML and SBGN
A tool has been developed for converting Escher maps to SBML Layout and SBGN and it will be released soon
COBRA models can be converted to SBML using COBRApy
73 Run Escher locally and in IPython
To run Escher on a local computer or to use Escher in PythonIPython first install it The Python package for Eschercan be installed using pip
pip install escher
72 Escher COBRA and COBRApy 27
Escher Documentation Release 143
Depending on your installation of Python you may need sudo
sudo pip install escher
Alternatively one can download the source files and install the package directly
python setuppy install
731 Escher in the IPython Notebook
Once you have installed Escher locally you can interact with Escher maps in an IPython Notebook
Here are example notebooks to get started with
bull COBRApy and Escher
bull JavaScript development and offline maps
bull Generate JSON models in COBRApy
Dependencies
bull Jinja2
bull Tornado
bull COBRApy 030 or later
732 Running the local server
You can run your own local server if you want to use Escher offline or explore your own maps with the homepagebrowser To get started install the Python package and run from any directory by calling
python -m escherserver
This starts a server at httplocalhost7778 You can also choose another port
python -m escherserver --port=8005
74 Validate and convert maps
741 Validate an Escher map
Escher maps follow a specification using the JSON Schema format Therefore any JSON Schema validator can beused to validate an Escher map by comparing it to the latest schema file For example the current schema is locatedhere
httpsgithubcomzakandrewkingescherblobmasterescherjsonschema1-0-0
To make this easier the Escher Python package includes a validation script To validate a map first install Escher
pip install escher
Then call the validator
python -m eschervalidate my_mapjson
Any errors in the map will print to the console
28 Chapter 7 Contents
Escher Documentation Release 143
742 Convert or upgrade an Escher map
Any Escher maps built with pre-release versions of Escher will not load right away in the stable v10 release Toconvert pre-release maps to the new format follow these steps
1 Install Escher
pip install escher
2 Find a COBRA model for your maps This COBRA model will be used to update the content of the mapin order to support all the new Escher features You can use a COBRA model encoded as SBML or JSON(generated with COBRApy v030b4 or later) The COBRA models currently available on the Escher websitecan be downloaded from the BiGG Models website
httpbiggucsdedu
For a refresher on the distinction between Escher maps COBRA models and their file types (SBML JSONSBML Layout) see Escher COBRA and COBRApy
3 Run the convert_map script to convert your existing Escher map (my_old_mapjson) to the new formatusing a COBRA model (model_filejson or model_filexml in these examples)
With a JSON file modelpython -m escherconvert_map my_old_mapjson pathtomodel_filejson
With an SBML modelpython -m escherconvert_map my_old_mapjson pathtomodel_filexml
Those commands will generate a new map called my_old_map_convertedjson that will load in Escher v10and later
75 Building and contributing maps
We are excited to collect pathway maps for every organism with a well characterized metabolic network This sectiondescribes the process of building a new map either from scratch or using a COBRA model with BiGG IDs
751 Building from scratch
To build a map from scratch you will first need a COBRA model for your map See the section Escher COBRA andCOBRApy for some background information on COBRA models
If you would like to eventually contribute your map to the Escher website it is important that your COBRA modeladheres to the identifiers in the BiGG Database Escher and BiGG are being developed together and we want tomaintain consistency and interoperability between them
Once you have a COBRA model you can follow these steps
1 Load your model in the Escher Builder
2 Begin building new reactions If you are familiar with the genes in your organism then try search for newreactions by their gene IDs
3 Limit each map to ~200 reactions Maps larger than this will slow down the Escher viewer especially on oldbrowsers Rather than building one giant map Escher is designed for building many smaller subsystem maps
4 When you have built a map for your a subsystem save the map as JSON with a name that includes the modelID followed by a period followed by the name of the subsystem For example
75 Building and contributing maps 29
Escher Documentation Release 143
iMM904Amino acid biosynthesisjson
5 (Optional) Once you have a set of subsystem maps you can set up a local Escher server so that subsystem mapsappear in the ldquoquick jumprdquo menu in the bottom right corner of the screen (as seen here for iJO1366) To setthis up you will need to start a local server as describe in Running the local server Next find your local cachedirectory by running this command in a terminal
python -c import escher print(escherget_cache_dir(name=maps))
This will print the location of the local maps cache Add your new subsystem maps to cache folder Now whenyou run the server (described in Running the local server) you should see that quick jump menu appear
NOTE The cache directory is organized into folders for organisms You can use these folder for filtering byorganism on the local launch page or you can place the maps in the top directory
NOTE 2 A similar approach can be used to access your models from the local launch page Place maps in thefolder indicated by
python -c import escher print(escherget_cache_dir(name=models))
752 Building from an existing map for a similar organism
Follow the instruction above except rather than starting from scratch load an existing Escher map for a differentorganism
Once you have the new model loaded use the Update names and gene reaction rules using model button in theModel menu to convert all descriptive names and gene reaction rules in the model to those in the map Reactions thatdo not match the model will be highlighted in red (This can be turned off again in the settings menu by deselectingHighlight reactions not in model)
Now visit each highlighted reaction and see if you can replace it with an equivalent biochemical pathway from themodel If not then delete the reaction and move on
Finally when there are no highlighted reactions left you can repeat this for other subsystems
753 Submitting maps to the Escher website
If you would like to contribute maps to Escher you can make a Pull Request to the GitHub repository eschergithubioMake sure there is a folder with the name of the organism in 1-0-0maps For example a new yeast map goes inthe folder
1-0-0mapsSaccharomyces cerevisiae
Then name your map by concatenating the model ID and the map name separated by a period For example a yeastmap built with the genome-scale model iMM904 could be named
iMM904Amino acid biosynthesisjson
Then add the JSON file for the model to the Pull Request if that model is not already available As before make afolder for your organism within 1-0-0models The model filename is just the model ID
In this example a correct Pull Request would include the following files
1-0-0mapsSaccharomyces cerevisiaeiMM904Amino acid biosynthesisjson1-0-0modelsSaccharomyces cerevisiaeiMM904json
30 Chapter 7 Contents
Escher Documentation Release 143
76 Developing with Escher
761 Using the static JavaScript and CSS files
You can include the compiled Escher JavaScript and CSS files in any HTML document The only dependencies ared3js and optionally Twitter Bootstrap if you are using the option menu=rsquoallrsquo
The compiled files are available form npmcdn
httpsnpmcdncomescher-visjsdistescherjshttpsnpmcdncomescher-visjsdistescherminjshttpsnpmcdncomescher-viscssdistbuildercsshttpsnpmcdncomescher-viscssdistbuildermincss
Source maps are also hosted there
httpsnpmcdncomescher-visjsdistescherjsmaphttpsnpmcdncomescher-visjsdistescherminjsmaphttpsnpmcdncomescher-viscssdistbuildermincssmap
If you want a particular version of escher add a version tag like this
httpsnpmcdncomescher-vis140-beta3jsdistescherjs
For an example of the boilerplate code that is required to begin developing with Escher have a look at the escher-demorepository For projects built with npm use the escher-test repository as a guide
762 Building and testing Escher
First install dependencies with npm
npm install
Escher uses grunt to manage the build process To run typical build steps just run
npm run compile
To test the JavaScript files run
npm run test
For Python testing run this in the py directory
python setuppy test
Build the static website
python setuppy build_gh
Clear static website files
python setuppy clean
Build and run the docs
cd docsmake htmlcd _buildhtml
76 Developing with Escher 31
Escher Documentation Release 143
python -m SimpleHTTPServer python 2python -m httpserver python 3
763 Generating and reading Escher and COBRA files
The Escher file format
Escher layouts are defined by JSON files that follow a specific schema using json schema The latest schemafor Escher JSON files is here The Escher schemas are versioned with inspiration from SchemaVer Theeschervalidate module can be used to validate models against the schema
The Escher layout schema is designed to be as simple as possible For example the core metabolism map of Es-cherichia coli is layed out like this
[
map_name E coli coreCore metabolismmap_id 2938hoq32a1map_description E coli core metabolic networknLast Modified Fri Dec 05 2014 163944 GMT-0800 (PST)homepage httpseschergithubioschema httpseschergithubioescherjsonschema1-0-0
reactions nodes text_label canvas
x 7857062530517567y 31436893920898433width 5894515691375733height 4860457037353515
]
The map_name includes the model that was used to build this layout followed by a period and then a readable namefor the map The map_id is a unique identifier for this map The map_description describes the map and thelast time it was modified Both the homepage and the schema entries must have exactly these values for the Eschermap to be valid
In the next section the reactions nodes labels and canvas are all defined For reactions nodes and text labels eachelement has a key that is an arbitrary integer As long as there are no repeated IDs (eg no 2 segments with the ID517) then everything should work fine
Read through the schema (here) for more detail on the format
The COBRA file format
COBRA models are also saved as JSON files This format has not been documented with a schema but you canbrowse through the core metabolism model as a guide to generating valid COBRA models
I still need help
If you are interested in developing with Escher and you need more information than what is provided in the documen-tation please contact Zachary King (zaking-AT-ucsd-DOT-edu)
32 Chapter 7 Contents
Escher Documentation Release 143
77 EscherConverter
EscherConverter is a standalone program that reads files created with the graphical network editor Escher and convertsthem to files in community standard formats
Download EscherConverter 05 (137 MB)
771 Using EscherConverter
Escher uses a JSON file format to represent its networks This format has been developed because of its very small filesize and its compatibility to online programs that are written in JavaScript In particular JSON is a JavaScript ObjectNotation or in other words a JSON file directly represents components of JavaScript programs This makes parsingvery simple and allows direct use of those files in web-based programs
However in systems biology specific file formats have been developed with the aim to be easily exchangeable betweensoftware implemented in diverse programming languages
To this end these formats support semantically clear annotations and are maintained by a large community of scientistsEscherConverter supports export to two particularly important XML-based community file formats SBML with layoutextension and SBGN-ML
While SBML has been mainly developed for dynamic simulation of biological networks it is nowadays also usablefor diverse other purposes Its layout extension facilitates the encoding the display of biological networks
SBGN-ML has been directly developed as a language for the display of biological pathway maps of diverse kinds Itstores the position and connection of entities similar to what is shown in Escher networks
EscherConverter takes Escherrsquos JSON files as input and generates equivalent SBML Level 3 Version 1 files with layoutextension or SBGN-ML files
In order to ensure that the conversion is correct EscherConverter provides its own display that gives users a previewof how the export data format will be rendered by other tools In this preview display you can zoom in and out movearcs and node positions However it is important to know that none of the changes made in this preview are stored inthe export file
Download and Installation
You can obtain local copy of EscherConverter by clicking here
As a Javatrade application no specific installation is required for EscherConverter
However make sure you have a recent Javatrade Runtime Environment (JRE) installed on your computer (at least JRE8) You can obtain Javatrade from the Oracle website There you can also find installation instructions for your respectiveoperating system
Once Javatrade has been installed you can simply place the EscherConverter JAR file somewhere on your local computerfor instance in the folder
bull Applications if you are working under Mac OS
77 EscherConverter 33
Escher Documentation Release 143
bull opt for Linux computers
bull CProgram Files if you are using Windows
Launching the program
You can launch EscherConverter simply by double-clicking on the application JAR file This will open a followinggraphical user interface as described in the following figures
Figure 1 | The graphical user interface of EscherConverter
bull Preferences opens a settings dialog (see next screenshot)
bull Open displays a file chooser to select an input file in JSON format
bull Save export the map that is displayed in the current tab to SBML or SBGN-ML
bull Discard closes the current tab without saving
bull Help opens the online help that displays all command-line options
bull License displays the license under which this software is distributed
bull About shows information about the authors of this software
bull Main the main panel of the software in which converted Escher maps will be displayed organized in tabs
bull Status the status bar shows information and logging messages during the conversion
34 Chapter 7 Contents
Escher Documentation Release 143
Figure 2 | The preferences dialog All settings in this dialog are also available through EscherConverterrsquos command-line interface
Layout section several properties that are required in SBML and SBGN-ML are not explicitly specified in EscherrsquosJSON format and therefore need to be adjusted by the user These are the size of the drawing canvas the default boxsize for text labels the size of primary and secondary nodes In contrast to SBGN-ML and Escherrsquos JSON formatthe SBML layout extension supports three-dimensional displays When selecting this export file format it is thereforenecessary to also define the z-coordinate and the depth of all objects
Components and naming section Most settings in this section are specific for the SBML layout extension and areonly active if this output format is selected These are names and identifiers of the layout component and the in caseof SBML mandatory default compartment (a compartment without physical meaning a reaction space in which allmetabolites are located) EscherConverter can infer compartment bounds from metabolites but this is an experimentalfeature Just try it and see how the preview changes
77 EscherConverter 35
Escher Documentation Release 143
Figure 3 | A layout preview
The birds-eye view and the navigation component on the left help you navigate through the network display Thisgraph shows you how the converted pathway map will be rendered by software that supports SBGN-ML or the SBMLlayout extension This preview can be modified by moving arcs or nodes however none of those changes are storedwhen exporting the file In this current version EscherConver only exports layouts as given in the original JSON file
Included third-party software
EscherConverter includes several third-party libraries which we here list and acknowledge
bull ArgParser
bull JSBML
bull libSBGN
bull Pixel-Mixer icons
bull yFiles
772 Command-line interface API
You can launch EscherConverter from the command-line On a Unix system (such as Linux MacOS or Solaris etc)use a command like
bash$ java -jar -Xms8G -Xmx8G -Duserlanguage=en EscherConverter-05jar [options]
Under Window use a command like
Cgt javaw -jar -Xms8G -Xmx8G -Duserlanguage=en EscherConverter-05jar [options]
Escher has a large collection of command-line options (see below) which can be useful if you want to launch theprogram with specific settings or if multiple files are to be converted in a batch mode It is even possible to completelydisable the graphical user interface
36 Chapter 7 Contents
Escher Documentation Release 143
Input and output files
Definition of input and output data files as well as the format for the output
--input=ltFilegt
Specifies the JSON input file If a directory is given the conversion will be recursively performed Accepts JSON
--output=ltFilegt
The path to the file into which the output should be written If the input is a directory this must also be a directory inorder to perform a recursive conversion Accepts SBML SBGN
Escher layout
The options in this group allow you to influence how large certain elements should be displayed
--canvas-default-height=ltDoublegt
Just as in the case of the width of the canvas this value needs to be specified for cases where the JSON input file lacksan explicit specification of the canvas height Arguments must fit into the range [11E9] (Default value 2500)
--canvas-default-width=ltDoublegt
This value is used when no width has been defined for the canvas Since the width attribute is mandatory for the layouta default value must be provided in these cases Arguments must fit into the range [11E9] (Default value 2500)
--label-height=ltDoublegt
With this option you can specify the height of the bounding box of text labels Arguments must fit into the range[11E9] (Default value 500)
--label-width=ltDoublegt
This option defines the width of bounding boxes for text labels Arguments must fit into the range [11E9] (Defaultvalue 1600)
--node-depth=ltDoublegt
The length of nodes along z-coordinate Escher maps are actually two-dimensional but in general a layout can bethree-dimensional This value should be an arbitrary value greater than zero because some rendering engines mightnot display the node if its depth is zero Arguments must fit into the range [11E9] (Default value 10)
--node-label-height=ltDoublegt
Node labels can have a size different from general labels in the graph Here you can specify how height the boundingbox of the labels for nodes should be Arguments must fit into the range [11E9] (Default value 200)
--primary-node-height=ltDoublegt
The primary node should be bigger than the secondary node With this option you can specify the height of this typeof nodes Arguments must fit into the range [11E9] (Default value 300)
--primary-node-width=ltDoublegt
Escher maps distinguish between primary and secondary nodes Primary nodes should be larger than secondary nodesand display the main flow of matter through the network This option allows you to specify the width of primarynodes Arguments must fit into the range [11E9] (Default value 300)
77 EscherConverter 37
Escher Documentation Release 143
--reaction-label-height=ltDoublegt
Reaction label heightArguments must fit into the range [11E9] (Default value 300)
--reaction-node-ratio=ltDoublegt
This value is used as a conversion factor to determine the size of the reaction display box depending on the size ofprimary nodes Height and width of reaction nodes are determined by dividing the corresponding values from theprimary node size by this factor Arguments must fit into the range [01] (Default value 05)
--secondary-node-ratio=ltDoublegt
Similar to the reaction node ratio the size of secondary nodes (width and height) is determined by dividing thecorresponding values from the primary nodes by this value Arguments must fit into the range [01] (Default value06666666666666666)
--z=ltDoublegt
The position on the z-axis where the entire two-dimensional graph should be drawn Arguments must fit into the range[-1E91E9] (Default value 00)
Escher Components and their naming
Here you can influence which elements are to be included in the layout and how elements in the layout are to be calledor identified
--format=ltOutputFormatgt
The desired format for the conversion eg SBML All possible values for type ltOutputFormatgt are SBGN andSBML (Default value SBML)
--layout-id=ltStringgt
In contrast to the name this identifier does not have to be human-readable This is a machine identifier which muststart with a letter or underscore and can only contain ASCII characters (Default value Escher_Layout)
--layout-name=ltStringgt
This should be a human-readable name for the layout that is to be created This name might be displayed to describethe figure and should therefore be explanatory (Default value Escher Layout)
--compartment-id=ltStringgt
A compartment needs to have a unique identifier which needs to be a machine-readable Sting that must start with aletter or underscore and can only contain ASCII characters Since the JSON file does not provide this information thisoption allows you to specify the required identifier (Default value default)
--compartment-name=ltStringgt
With this option it is possible to define a name for the default compartment can be that needs to be generated for theconversion to SBML The name does not have any restrictions ie any UTF-8 character can be used (Default valueDefault compartment)
--infer-compartment-bounds
This converter can infer where the boundaries of compartments could be drawn To this end it uses each nodersquos BiGGids to identify the compartment of all metabolites Assuming that compartments have rectangular shapes the algorithmcan find the outermost node on each side of the box and hence obtain the boundaries of the compartment However
38 Chapter 7 Contents
Escher Documentation Release 143
this methods will fail when metabolites are drawn inside of such a box that belong to a different compartment that isactually further outside For this reason this option is deactivated by default (Default value false)
Options for the graphical user interface
--gui
If this option is given the program will display its graphical user interface (Default value false)
--log-level=ltStringgt
Change the log-level of this application This option will influence how fine-grained error and other log messages willbe that you receive while executing this program All possible values for type ltStringgt are ALL CONFIG FINEFINER FINEST INFO OFF SEVERE and WARNING (Default value INFO)
--log-file=ltFilegt
This option allows you to specify a log file to which all information of the program will be written Accepts (bp2bp3 log owl xml)
78 JavaScript API
class escherBuilder(map_data model_data embedded_css selection options)A Builder object contains all the UI and logic to generate a map builder or viewer
Arguments
bull map_data (object) ndash The data for a map to be passed to escherMapfrom_data() Ifnull then an empty Builder is initialized
bull model_data (object) ndash The data for a cobra model to be passed to es-cherCobraModel() Can be null
bull embedded_css (string) ndash The stylesheet for the SVG elements in the Escher map
bull selection (object) ndash (Optional Default In the body element) The d3 selection of anelement to place the Builder into The selection cannot be inside an SVG element
bull options (object) ndash (Optional) An object defining any of the following options
optionsmenu(Default rsquoallrsquo) The type of menu that will be displayed Can be lsquoallrsquo for the fullmenu or lsquozoomrsquo for just zoom buttons The lsquoallrsquo option requires the full set of Escherdependencies (D3js JQuery and Bootstrap) while the lsquozoomrsquo option requires only D3jsFor more details see Developing with Escher
optionsscroll_behavior(Default rsquopanrsquo) This option determines the effect that the scroll wheel will have onan Escher map Can be lsquopanrsquo to pan the map or lsquozoomrsquo to zoom the map when the usermoves the scroll wheel
optionsuse_3d_transform(Default Chooses a good option by testing the browser) If true then use CSS3 3D trans-forms to speed up panning and zooming This feature will only work on browsers thatsupport the 3D transforms It works best in the latest versions of Chrome Firefox andInternet Explorer Safari works better with this turned off
78 JavaScript API 39
Escher Documentation Release 143
optionsenable_editing(Default true) If true then display the map editing functions If false then hide themand only allow the user to view the map
optionenable_keys(Default true) If true then enable keyboard shortcuts
optionsenable_search(Default true) If true then enable indexing of the map for search Use false to disablesearching and potentially improve the map performance
optionsfill_screen(Default false) Use true to fill the screen when an Escher Builder is placed in a top-level container (eg a div in the body element)
optionsfull_screen_button(Default false) Include a button in the user interface for entering full screen mode
optionsignore_bootstrap(Default false) Do not use Bootstrap for buttons even if it available This is used toembed Escher in a Jupyter notebook where it conflicts with the Jupyter Boostrap installa-tion
Map model and styles
optionsstarting_reaction(Default null) The ID (as a string) of a reaction to draw when the Builder loads
optionsnever_ask_before_quit(Default false) If false then display a warning before the user closes an Eschermap If true then never display the warning This options is only respected if op-tionsenable_editing == true If enable_editing is false then the warnings are not dis-played
optionsunique_map_id(Default null) A unique ID that will be used to UI elements donrsquot interfere whenmultiple maps are in the same HTML document
optionsprimary_metabolite_radius(Default 15) The radius of primary metabolites in px
optionssecondary_metabolite_radius(Default 10) The radius of secondary metabolites in px
optionsmarker_radius(Default 5) The radius of marker nodes in px
optionsgene_font_size(Default 18) The font size of the gene reaction rules in px
optionshide_secondary_metabolites(Default false) If true then secondary nodes and segments are hidden This is conve-nient for generating simplified map figures
optionsshow_gene_reaction_rules(Default false) If true then show the gene reaction rules even without gene data
optionshide_all_labels(Default false) If checked hide all reaction gene and metabolite labels
Applied data
40 Chapter 7 Contents
Escher Documentation Release 143
optionsreaction_data(Default null) An object with reaction ids for keys and reaction data points for values
optionsreaction_stylesDefault [rsquocolorrsquo rsquosizersquo rsquotextrsquo]
An array of style types The array can contain any of the following lsquocolorrsquo lsquosizersquo lsquotextrsquolsquoabsrsquo The lsquocolorrsquo style means that the reactions will be colored according to the loadeddataset The lsquosizersquo style means that the reactions will be sized according to the loadeddataset The lsquotextrsquo style means that the data values will be displayed in the reactionlabels The lsquoabsrsquo style means the the absolute values of reaction values will be used fordata visualization
optionsreaction_compare_style(Default rsquodiffrsquo) How to compare to datasets Can be either lsquofold lsquolog2_foldrsquo orlsquodiffrsquo
optionsreaction_scaleDefault
[ type min color c8c8c8 size 12 type median color 9696ff size 20 type max color ff0000 size 25 ]
An array of objects that define points on the data scale
Each point is an object with a type attribute Types can be lsquominrsquo lsquomaxrsquo lsquomeanrsquo lsquoQ1rsquo (firstquartile) lsquomedianrsquo lsquoQ3rsquo (third quartile) or lsquovaluersquo Each point can have a color attributethat specifies a color with a string (any CSS color specification is allowed including hexrgb and rgba) Each point can have a size attirbute that specifies a reaction thickness as anumber Finally points with type lsquovaluersquo can have a value attribute that specifies an exactnumber for pont in the scale
NOTE If lsquominrsquo or lsquomaxrsquo is not provided Escher automatically adds them To be com-pletely clear about what you expect to see on the map it is best to provide lsquominrsquo andlsquomaxrsquo in addition to other scale points
Here are examples of each type
type rsquominrsquo color rsquoredrsquo size 12 Specifies that reactionsnear the minimum value are red and have thickness 12
type rsquoQ1rsquo color rsquorgba(100 100 50 05)rsquo size 12 Specifies that reactions near the first quartile have the given color opacity andthickness
type rsquomeanrsquo color rsquorgb(100 100 50)rsquo size 50 Specifies that reactions near the mean value have the given color and thickness
type rsquovaluersquo value 85 color rsquo333rsquo size 50 Specifies that reactions near 85 value have the given color and size
optionsreaction_no_data_color(Default rsquodcdcdcrsquo) The color of reactions with no data value
optionsreaction_no_data_size(Default 8) The size of reactions with no data value
optionsgene_data(Default null) An object with Gene ids for keys and gene data points for values
78 JavaScript API 41
Escher Documentation Release 143
optionsand_method_in_gene_reaction_rule(Default mean) When evaluating a gene reaction rule use this function to evaluate ANDrules Can be lsquomeanrsquo or lsquominrsquo
optionsmetabolite_data(Default null) An object with metabolite ids for keys and metabolite data points forvalues
optionsmetabolite_stylesDefault [rsquocolorrsquo rsquosizersquo rsquotextrsquo]
An array of style types The array can contain any of the following lsquocolorrsquo lsquosizersquo lsquotextrsquolsquoabsrsquo The lsquocolorrsquo style means that the metabolites will be colored according to the loadeddataset The lsquosizersquo style means that the metabolites will be sized according to the loadeddataset The lsquotextrsquo style means that the data values will be displayed in the metabolitelabels The lsquoabsrsquo style means the the absolute values of metabolite values will be used fordata visualization
optionsmetabolite_compare_style(Default rsquodiffrsquo) How to compare to datasets Can be either lsquofoldrsquo lsquolog2_foldrsquo orlsquodiffrsquo
optionsmetabolite_scaleDefault
[ type min color fffaf0 size 20 type median color f1c470 size 30 type max color 800000 size 40 ]
An array of objects that define points on the data scale See the description of op-tionsreaction_scale for an explanation of the format
optionsmetabolite_no_data_color(Default rsquoffffffrsquo) The color of metabolites with no data value
optionsmetabolite_no_data_size(Default 10) The size of metabolites with no data value
View and build options
optionsidentifiers_on_map(Default rsquobigg_idrsquo) The identifiers that will be displayed in reaction metabolite andgene labels Can be lsquobigg_idrsquo or lsquonamersquo
optionshighlight_missing(Default false) If true then highlight in red reactions that are not in the loaded COBRAmodel
optionsallow_building_duplicate_reactions(Default true) If true then building duplicate reactions is allowed If false then dupli-cate reactions are hidden in Add reaction mode
optionscofactors(Default [rsquoatprsquo rsquoadprsquo rsquonadrsquo rsquonadhrsquo rsquonadprsquo rsquonadphrsquorsquogtprsquo rsquogdprsquo rsquohrsquo rsquocoarsquo rsquoumprsquo rsquoh20rsquo rsquoppirsquo]) A list of metabo-lite IDs to treat as cofactors These will be secondary metabolites in new reactions
Callbacks
optionsfirst_load_callbackA function to run after loading the Builder
42 Chapter 7 Contents
Escher Documentation Release 143
load_map(map_data[ should_update_data])Load a map for the loaded data Also reloads most of the Builder content
Arguments
bull map_data ndash The data for a map
bull should_update_data (Boolean) ndash (Default true) Whether data should be ap-plied to the map
load_model(model_data[ should_update_data])Load the cobra model from model data
Arguments
bull model_data ndash The data for a Cobra model (Parsing in done by escherCobraModel)
bull should_update_data (Boolean) ndash (Default true) Whether data should be ap-plied to the model
view_mode()Enter view mode
build_mode()Enter build mode
brush_mode()Enter brush mode
zoom_mode()Enter zoom mode
rotate_mode()Enter rotate mode
text_mode()Enter text mode
set_reaction_data(data)
Arguments
bull data (array) ndash An array of 1 or 2 objects where each object has keys that are reactionIDrsquos and values that are data points (numbers)
set_metabolite_data(data)
Arguments
bull data (array) ndash An array of 1 or 2 objects where each object has keys that are metaboliteIDrsquos and values that are data points (numbers)
set_gene_data(data clear_gene_reaction_rules)
Arguments
bull data (array) ndash An array of 1 or 2 objects where each object has keys that are gene IDrsquosand values that are data points (numbers)
Arguments
bull clear_gene_reaction_rules (Boolean) ndash (Optional Default false) In addi-tion to setting the data also turn of the gene_reaction_rules
78 JavaScript API 43
Escher Documentation Release 143
79 Python API
class escherBuilder(map_name=None map_json=None model=None model_name=Nonemodel_json=None embedded_css=None reaction_data=None metabo-lite_data=None gene_data=None local_host=None id=None safe=Falsekwargs)
A metabolic map that can be viewed edited and used to visualize data
This map will also show metabolic fluxes passed in during consruction It can be viewed as a standalone htmlinside a browswer Alternately the respresentation inside an IPython notebook will also display the map
Maps are stored in json files and are stored in a cache directory Maps which are not found will be downloadedfrom a map repository if found
Parameters
bull map_name ndash A string specifying a map to be downloaded from the Escher web server orloaded from the cache
bull map_json ndash A JSON string or a file path to a JSON file or a URL specifying a JSON fileto be downloaded
bull model ndash A Cobra model
bull model_name ndash A string specifying a model to be downloaded from the Escher web serveror loaded from the cache
bull model_json ndash A JSON string or a file path to a JSON file or a URL specifying a JSONfile to be downloaded
bull embedded_css ndash The CSS (as a string) to be embedded with the Escher SVG
bull reaction_data ndash A dictionary with keys that correspond to reaction ids and values thatwill be mapped to reaction arrows and labels
bull metabolite_data ndash A dictionary with keys that correspond to metabolite ids and valuesthat will be mapped to metabolite nodes and labels
bull gene_data ndash A dictionary with keys that correspond to gene ids and values that will bemapped to corresponding reactions
bull local_host ndash A hostname that will be used for any local files This is generally usedfor using the notebook offline and for testing in the IPython Notebook with modified Eschercode An example value for local_host is lsquohttplocalhost7778lsquo
bull id ndash Specify an id to make the javascript data definitions unique A random id is chosen bydefault
bull safe ndash If True then loading files from the filesytem is not allowed This is to ensure thesafety of using Builder within a web server
Keyword Arguments
These are defined in the Javascript API
bulluse_3d_transform
bullenable_search
bullfill_screen
bullzoom_to_element
bullfull_screen_button
44 Chapter 7 Contents
Escher Documentation Release 143
bullstarting_reaction
bullunique_map_id
bullprimary_metabolite_radius
bullsecondary_metabolite_radius
bullmarker_radius
bullgene_font_size
bullhide_secondary_metabolites
bullshow_gene_reaction_rules
bullhide_all_labels
bullreaction_styles
bullreaction_compare_style
bullreaction_scale
bullreaction_no_data_color
bullreaction_no_data_size
bulland_method_in_gene_reaction_rule
bullmetabolite_styles
bullmetabolite_compare_style
bullmetabolite_scale
bullmetabolite_no_data_color
bullmetabolite_no_data_size
bullidentifiers_on_map
bullhighlight_missing
bullallow_building_duplicate_reactions
bullcofactors
All keyword arguments can also be set on an existing Builder object using setter functions eg
my_builderset_reaction_styles(new_styles)
display_in_browser(ip=lsquo127001rsquo port=7655 n_retries=50 js_source=rsquowebrsquo menu=rsquoallrsquoscroll_behavior=rsquopanrsquo enable_editing=True enable_keys=True mini-fied_js=True never_ask_before_quit=False)
Launch a web browser to view the map
Parameters
bull ip ndash The IP address to serve the map on
bull port ndash The port to serve the map on If specified the port is occupied then a random freeport will be used
bull n_retries (int) ndash The number of times the server will try to find a port before quitting
bull js_source (string) ndash Can be one of the following
ndash web (Default) - Use JavaScript files from eschergithubio
79 Python API 45
Escher Documentation Release 143
ndash local - Use compiled JavaScript files in the local Escher installation Works offline
ndash dev - No longer necessary with source maps This now gives the same behavior aslsquolocalrsquo
bull menu (string) ndash Menu bar options include
ndash none - No menu or buttons
ndash zoom - Just zoom buttons
ndash all (Default) - Menu and button bar (requires Bootstrap)
bull scroll_behavior (string) ndash Scroll behavior options
ndash pan - Pan the map
ndash zoom - Zoom the map
ndash none (Default) - No scroll events
bull enable_editing (Boolean) ndash Enable the map editing modes
bull enable_keys (Boolean) ndash Enable keyboard shortcuts
bull minified_js (Boolean) ndash If True use the minified version of JavaScript and CSSfiles
bull never_ask_before_quit (Boolean) ndash Never display an alert asking if you wantto leave the page By default this message is displayed if enable_editing is True
display_in_notebook(js_source=rsquowebrsquo menu=rsquozoomrsquo scroll_behavior=rsquononersquo mini-fied_js=True height=500 enable_editing=False)
Embed the Map within the current IPython Notebook
Parameters
bull js_source (string) ndash Can be one of the following
ndash web (Default) - Use JavaScript files from eschergithubio
ndash local - Use compiled JavaScript files in the local Escher installation Works offline
ndash dev - No longer necessary with source maps This now gives the same behav-ior as lsquolocalrsquo
bull menu (string) ndash Menu bar options include
ndash none - No menu or buttons
ndash zoom - Just zoom buttons
ndash Note The all menu option does not work in an IPython notebook
bull scroll_behavior (string) ndash Scroll behavior options
ndash pan - Pan the map
ndash zoom - Zoom the map
ndash none - (Default) No scroll events
bull minified_js (Boolean) ndash If True use the minified version of JavaScript andCSS files
bull height ndash Height of the HTML container
bull enable_editing (Boolean) ndash Enable the map editing modes
46 Chapter 7 Contents
Escher Documentation Release 143
save_html(filepath=None overwrite=False js_source=rsquowebrsquo protocol=rsquohttpsrsquo menu=rsquoallrsquoscroll_behavior=rsquopanrsquo enable_editing=True enable_keys=True minified_js=Truenever_ask_before_quit=False static_site_index_json=None)
Save an HTML file containing the map
Parameters
bull filepath (string) ndash The HTML file will be saved to this location Whenjs_source is lsquolocalrsquo then a new directory will be created with this name
bull overwrite (Boolean) ndash Overwrite existing files
bull js_source (string) ndash Can be one of the following
ndash web (Default) - Use JavaScript files from eschergithubio
ndash local - Use compiled JavaScript files in the local Escher installation Works of-fline To make the dependencies available to the downloaded file a new directorywill be made with the name specified by filepath
ndash dev - No longer necessary with source maps This now gives the same behav-ior as lsquolocalrsquo
bull protocol (string) ndash The protocol can be lsquohttprsquo lsquohttpsrsquo or None which indicatesa lsquoprotocol relative URLrsquo as in eschergithubio Ignored if source is local
bull menu (string) ndash Menu bar options include
ndash none - No menu or buttons
ndash zoom - Just zoom buttons
ndash all (Default) - Menu and button bar (requires Bootstrap)
bull scroll_behavior (string) ndash Scroll behavior options
ndash pan - Pan the map
ndash zoom - Zoom the map
ndash none (Default) - No scroll events
bull enable_editing (Boolean) ndash Enable the map editing modes
bull enable_keys (Boolean) ndash Enable keyboard shortcuts
bull minified_js (Boolean) ndash If True use the minified version of JavaScript andCSS files
bull height (number) ndash Height of the HTML container
bull never_ask_before_quit (Boolean) ndash Never display an alert asking if youwant to leave the page By default this message is displayed if enable_editing isTrue
bull static_site_index_json (string) ndash The index as a JSON string for thestatic site Use javascript to parse the URL options Used for generating static pages(see static_sitepy)
791 Cache
escherget_cache_dir(versioned=True name=None)Get the cache dir as a string and make the directory if it does not already exist
Parameters
79 Python API 47
Escher Documentation Release 143
bull versioned (Boolean) ndash Whether to return the versioned path in the cache Eschermaps for the latest version of Escher are found in the versioned directory (versioned= True) but maps for previous versions of Escher can be found by visiting the parentdirectory (versioned = False)
bull name (string) ndash An optional subdirectory within the cache If versioned is False thenname is ignored
escherclear_cache(different_cache_dir=None ask=True)Empty the contents of the cache directory including all versions of all maps and models
Parameters
bull different_cache_dir (string) ndash (Optional) The directory of another cacheThis is mainly for testing
bull ask (Boolean) ndash Whether to ask before deleting
escherlist_cached_maps()Return a list of all cached maps
escherlist_cached_models()Return a list of all cached models
escherlist_available_maps()Return a list of all maps available on the server
escherlist_available_models()Return a list of all models available on the server
710 License
Escher and EscherConverter are distributed under the MIT license
bull genindex
48 Chapter 7 Contents
Python Module Index
eescher 44
49
Escher Documentation Release 143
50 Python Module Index
Index
Bbrush_mode() (built-in function) 43build_mode() (built-in function) 43Builder (class in escher) 44
Cclear_cache() (in module escher) 48
Ddisplay_in_browser() (escherBuilder method) 45display_in_notebook() (escherBuilder method) 46
Eescher (module) 44escherBuilder() (class) 39
Gget_cache_dir() (in module escher) 47
Llist_available_maps() (in module escher) 48list_available_models() (in module escher) 48list_cached_maps() (in module escher) 48list_cached_models() (in module escher) 48load_map() (built-in function) 42load_model() (built-in function) 43
Ooptionenable_keys (option attribute) 40optionsallow_building_duplicate_reactions (options at-
tribute) 42optionsand_method_in_gene_reaction_rule (options at-
tribute) 41optionscofactors (options attribute) 42optionsenable_editing (options attribute) 39optionsenable_search (options attribute) 40optionsfill_screen (options attribute) 40optionsfirst_load_callback (options attribute) 42optionsfull_screen_button (options attribute) 40optionsgene_data (options attribute) 41
optionsgene_font_size (options attribute) 40optionshide_all_labels (options attribute) 40optionshide_secondary_metabolites (options attribute)
40optionshighlight_missing (options attribute) 42optionsidentifiers_on_map (options attribute) 42optionsignore_bootstrap (options attribute) 40optionsmarker_radius (options attribute) 40optionsmenu (options attribute) 39optionsmetabolite_compare_style (options attribute) 42optionsmetabolite_data (options attribute) 42optionsmetabolite_no_data_color (options attribute) 42optionsmetabolite_no_data_size (options attribute) 42optionsmetabolite_scale (options attribute) 42optionsmetabolite_styles (options attribute) 42optionsnever_ask_before_quit (options attribute) 40optionsprimary_metabolite_radius (options attribute) 40optionsreaction_compare_style (options attribute) 41optionsreaction_data (options attribute) 40optionsreaction_no_data_color (options attribute) 41optionsreaction_no_data_size (options attribute) 41optionsreaction_scale (options attribute) 41optionsreaction_styles (options attribute) 41optionsscroll_behavior (options attribute) 39optionssecondary_metabolite_radius (options attribute)
40optionsshow_gene_reaction_rules (options attribute) 40optionsstarting_reaction (options attribute) 40optionsunique_map_id (options attribute) 40optionsuse_3d_transform (options attribute) 39
Rrotate_mode() (built-in function) 43
Ssave_html() (escherBuilder method) 46set_gene_data() (built-in function) 43set_metabolite_data() (built-in function) 43set_reaction_data() (built-in function) 43
51
Escher Documentation Release 143
Ttext_mode() (built-in function) 43
Vview_mode() (built-in function) 43
Zzoom_mode() (built-in function) 43
52 Index
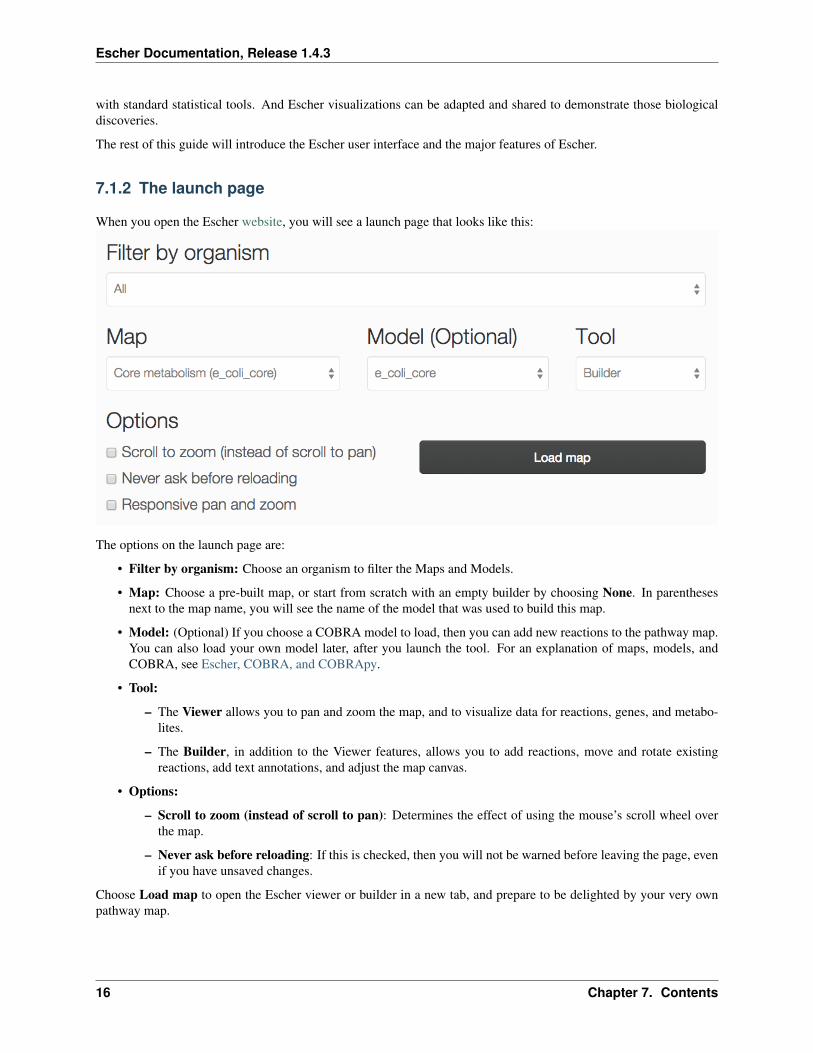
Escher Documentation Release 143
713 The menu bar
Once you have loaded an Escher map you will see a menu bar along the top of the screen Click the question mark tobring up the Escher documentation
714 Loading and saving maps
Using the map menu you can load and save maps at any time
Click Save map JSON to save the Escher map as a JSON file which is the standard file representing an Escher map
NOTE The JSON file does NOT save any datasets you have loaded This may be changed in a future version ofEscher
NOTE 2 In Safari saving files from Escher works a little differently than in the other major browsers After clickingSave map JSON Safari will load a new tab with the raw content of the Escher map file To save the file chooseFilegtSave As from the Safari menu A new dialog appears in the dropdown menu near the bottom select PageSource (rather than Web Archive) give your file an appropriate name (eg mapjson for an Escher map or mapsvgfor an SVG export) and click Save
Later you can can load a JSON file to view and edit a map by clicking Load map JSON
Click Export as SVG to generate a SVG file for editing in tools like Adobe Illustrator and Inkscape This is thebest way to generate figures for presentations and publications Unlike a JSON file a SVG file maintains the datavisualizations on the Escher map However you cannot load SVG files into Escher after you generate them
Click Clear Map to empty the whole map leaving a blank canvas NOTE You cannot undo Clear Map
715 Loading models
Use the model menu to manage the COBRA model loaded in Escher
71 Getting started 17
Escher Documentation Release 143
Choose Load COBRA model JSON to open a COBRA model Read more about COBRA models in Escher COBRAand COBRApy Once you have COBRApy v030 or later installed then you can generate a JSON model by followingthis example code
Once you have loaded a COBRA model there may be inconsistencies between the content in the map and the model(eg reaction IDs descriptive names and gene reaction rules) You click Update names and gene reaction rulesusing model to find matching reactions and metabolites between the map and the model (based on their IDs) andthen apply the names and gene reaction rules from the model to the map The reactions that do not match will behighlighted in red (This can be turned off again in the settings menu by deselecting Highlight reactions not in model)More advice on building maps is available in Building and contributing maps
Click Clear Model to clear the current model
716 Loading reaction gene and metabolite data
Datasets can be loaded as CSV files or JSON files using the Data Menu
In Escher reaction and gene datasets are visualized by changing the color thickness and labels of reaction arrowsMetabolite datasets are visualized by changing the color size and labels of metabolite circles The specific visualstyles can be modified in the Settings menu When data is not present for a specific reaction gene or metabolite thenthe text label will say lsquondrsquo which means lsquono datarsquo
18 Chapter 7 Contents
Escher Documentation Release 143
The structure of a CSV file
CSV files should have 1 header row 1 ID column and either 1 or 2 columns for data values The ID column cancontain BiGG IDs or descriptive names for the reactions metabolites or genes in the dataset Here is an example witha single data value columns
IDtime 0secglc__D_c54g6p__D_c23
Which might look like this is Excel
ID time 0secglc__D_c 54g6p_c 23
If two datasets are provided then the Escher map will display the difference between the datasets In the Settings menuthe Comparison setting allows you to choose between comparison functions (Fold Change Log2(Fold Change) andDifference) With two datasets the CSV file looks like this
ID time 0sec time 5sglc__D_c 54 102g6p_c 23 81
Data can also be loaded from a JSON file This Python code snippet provides an example of generating the properformat for single reaction data values and for reaction data comparisons
import json
save a single flux vector as JSONflux_dictionary = glc__D_c 54 g6p_c 23with open(outjson w) as f
jsondump(flux_dictionary f)
save a flux comparison as JSON
71 Getting started 19
Escher Documentation Release 143
flux_comp = [glc__D_c 54 g6p_c 23 glc__D_c 102 g6p_c 81]with open(out_compjson w) as f
jsondump(flux_comp f)
Gene data and gene reaction rules
Escher uses gene reaction rules to connect gene data to the reactions on a metabolic pathway You can see these genereaction rules on the map by selecting Show gene reaction rules in the Settings menu
Gene reaction rules show the genes whose gene products are required to catalyze a reaction Gene are connected usingAND and OR rules AND rules are used when two genes are required for enzymatic activity eg they are membersof a protein complex OR rules are used when either gene can catalyze the enzymatic activity eg they are isozymes
With OR rules Escher will take the sum of the data values for each gene With AND rules Escher will either takethe mean (the default) or the minimum of the components The AND behavior (mean vs minimum) is defined in theSettings menu
717 Editing and building
The Edit menu gives you access to function for editing the map
20 Chapter 7 Contents
Escher Documentation Release 143
Escher has five major modes and you can switch between those modes using the buttons in the Edit menu or usingthe buttons in the button bar on the left of the screen
1 Pan mode Drag the canvas to pan the map You can also use the mouse scroll wheel or trackpad scroll function(drag with 2 fingers) to pan the map (or to zoom if you selected Scroll to zoom in the settings)
2 Select mode Select nodes by clicking on them Shift-click to select multiple nodes or drag across the canvasto select multiple nodes using the selection brush
3 Add reaction mode If you have loaded a Model then click on the canvas to see a list of reactions that you candraw on the map Click on a node to see reactions that connect to that node In the input box you can search byreaction ID metabolite ID or gene ID (locus tag)
4 Rotate model Before entering rotate mode be sure to select one or more nodes in select mode Then afterentering rotate mode drag anywhere on the canvas to rotate the selection You can also drag the red crosshairsto change the center of the rotation
5 Text mode Use text mode to add text annotations to the map Click on the canvas to add a new text annotationor click an existing annotation to edit it When you are finished click Enter or Escape to save the changes
71 Getting started 21
Escher Documentation Release 143
In addition to the editing modes the Edit menu gives you access to the following commands
bull Delete Delete the currently selected node(s)
bull Undo Undo the last action NOTE Certain actions such as editing the canvas cannot be undone in the currentversion of Escher
bull Redo Redo the last action that was undone
bull Toggle primarysecondary node In Escher each metabolite node is either a primary node or a secondarynode Primary nodes are larger and secondary nodes can be hidden in the Settings menu Use this command totoggle the currently selected node(s) between primary and secondary
bull Rotate reactant locations When you draw a new reaction in Escher this command will rotate the new reactantsso that a new reactant is primary and centered This command is extremely useful when you are drawing a longpathway and you want to quickly switch which metabolite to ldquofollowrdquo eg make sure you are following thecarbon-containing metabolites
If you are confused then try drawing a new pathway and hitting the ldquocrdquo key to see the reactants rotate
bull Select all Select all nodes
bull Select none Unselect all nodes
bull Invert selection Select all the nodes that are currently unselected This feature is very useful when you wantto keep just one part of the map Simply drag to select the part you want to keep call the Invert selectioncommand then call the Delete command
718 Editing the canvas
A somewhat non-obvious feature of Escher is that you can edit the canvas by dragging the canvas edges This ispossible in Pan mode and Select mode
22 Chapter 7 Contents
Escher Documentation Release 143
719 View options
bull Zoom in Zoom in to the map
bull Zoom out Zoom out of the map
bull Zoom to nodes Zoom to see all the nodes on the map
bull Zoom to canvas Zoom to see the entire canvas
bull Find Search for a reaction metabolite or gene on the map
bull Show control points Show the control points you can drag these red and blue circle to adjust the shapes ofthe reactions curves
bull Settings Open the Settings menu
7110 The button bar
The button bar give you quick access to many of the common Escher functions
71 Getting started 23
Escher Documentation Release 143
24 Chapter 7 Contents
Escher Documentation Release 143
7111 Settings
View and build options
bull Identifiers Choose whether to show BiGG IDs or descriptive names for reactions metabolites and genes
bull Hide secondary metabolites This will simplify the map by hiding all secondary metabolites and the pathsconnected to them
bull Show gene reaction rules Show the gene reaction rules below the reaction labels even gene data is not loaded
bull Hide reaction gene and metabolite labels Another option to visually simplify the map this will hide alllabels that are not text annotations
bull Allow duplicate reactions By default duplicate reactions are hidden in the add reaction dropdown menuHowever you can turn this option on to show the duplicate reactions
bull Highlight reactions not in model Highlight in red any reactions that are on the map but are not in the modelThis is useful when you are adapting a map from one model for use with another model
71 Getting started 25
Escher Documentation Release 143
Reaction data settings
When reaction or gene data is loaded this section can be used to change visual settings for reactions
The color bar has individual control points and you can drag the control points (execpt min and max) left and right tochange their values Alternatively you can use the dropdown menu (next to the word median in the figure above) toattach a control point to a statistical measure (mean median first quartile (Q1) or third quartile (Q3)) This lets youchoose a color scale that will adapt to your dataset
For each control point you can choose a color by entering a CSS-style color (eg red ff0000 rgba(20 20 255 05)and you can choose a size that will scale the thickness of reactions
There are also color and size options for reactions that do not have any data value
Finally there are a few onoff settings for the loaded reaction or gene dataset
bull Options These determine how to visualize the datasets Check Absolute value to color and size reactions bythe absolute value of each data value The Size Color and Text options can be unselected to turn off sizingcoloring and data values in reaction labels individually
bull Comparison Determines the comparison algorithm to use when two datasets are loaded
bull Method for evaluating AND Determines the method that will be used to reconcile AND statements in genereaction rules when there is gene data loaded See Gene data and gene reaction rules for more details
Metabolite data settings
The data settings for metabolite data are analagous to those for reaction data The only difference is that size nowrefers to the size of the metabolite circles
26 Chapter 7 Contents
Escher Documentation Release 143
72 Escher COBRA and COBRApy
Escher can be used as an independent application but it draws heavily on the information in COBRA models ACOBRA model is a collection of all the reactions metabolites and genes known to exist in an organism (In theliterature these are generally called genome-scale models (GEMs) but we refer to them as COBRA models here toemphasize that Escher interoperates with models that are exported from COBRApy)
By loading a COBRA model into the Escher interface you have access to every reaction and metabolite in that modelYou also have the gene reaction rules for the reactions in the network which allow you to connect gene data toreactions and metabolites
COBRApy is a software package for COBRA modeling written in Python The Escher Python package uses CO-BRApy package for reading and writing COBRA models
721 Maps and models
In Escher you will see references to maps and models
A map contains the reactions and metabolites that you see in the Escher builder including their locations text annota-tions and the canvas
A model (a COBRA model) contains reactions and metabolites that you have not drawn yet Thus you can load aCOBRA model when you want to draw new reactions on the map
722 What is JSON and why do we use it
Both Escher maps and COBRA models are stored as JSON files JSON is a useful plain-text format for storing nesteddata structures We use JSON much like the SBML community uses XML You may notice that SBML files have axml extension and Escher maps and COBRA models have a json extension
You can use Python to explore a JSON file like this
import json
with open(mapjson r) as fmap_object = jsonload(f)
print map_object[0]print map_object[1][reactions]values()[0]
723 Escher SBML and SBGN
A tool has been developed for converting Escher maps to SBML Layout and SBGN and it will be released soon
COBRA models can be converted to SBML using COBRApy
73 Run Escher locally and in IPython
To run Escher on a local computer or to use Escher in PythonIPython first install it The Python package for Eschercan be installed using pip
pip install escher
72 Escher COBRA and COBRApy 27
Escher Documentation Release 143
Depending on your installation of Python you may need sudo
sudo pip install escher
Alternatively one can download the source files and install the package directly
python setuppy install
731 Escher in the IPython Notebook
Once you have installed Escher locally you can interact with Escher maps in an IPython Notebook
Here are example notebooks to get started with
bull COBRApy and Escher
bull JavaScript development and offline maps
bull Generate JSON models in COBRApy
Dependencies
bull Jinja2
bull Tornado
bull COBRApy 030 or later
732 Running the local server
You can run your own local server if you want to use Escher offline or explore your own maps with the homepagebrowser To get started install the Python package and run from any directory by calling
python -m escherserver
This starts a server at httplocalhost7778 You can also choose another port
python -m escherserver --port=8005
74 Validate and convert maps
741 Validate an Escher map
Escher maps follow a specification using the JSON Schema format Therefore any JSON Schema validator can beused to validate an Escher map by comparing it to the latest schema file For example the current schema is locatedhere
httpsgithubcomzakandrewkingescherblobmasterescherjsonschema1-0-0
To make this easier the Escher Python package includes a validation script To validate a map first install Escher
pip install escher
Then call the validator
python -m eschervalidate my_mapjson
Any errors in the map will print to the console
28 Chapter 7 Contents
Escher Documentation Release 143
742 Convert or upgrade an Escher map
Any Escher maps built with pre-release versions of Escher will not load right away in the stable v10 release Toconvert pre-release maps to the new format follow these steps
1 Install Escher
pip install escher
2 Find a COBRA model for your maps This COBRA model will be used to update the content of the mapin order to support all the new Escher features You can use a COBRA model encoded as SBML or JSON(generated with COBRApy v030b4 or later) The COBRA models currently available on the Escher websitecan be downloaded from the BiGG Models website
httpbiggucsdedu
For a refresher on the distinction between Escher maps COBRA models and their file types (SBML JSONSBML Layout) see Escher COBRA and COBRApy
3 Run the convert_map script to convert your existing Escher map (my_old_mapjson) to the new formatusing a COBRA model (model_filejson or model_filexml in these examples)
With a JSON file modelpython -m escherconvert_map my_old_mapjson pathtomodel_filejson
With an SBML modelpython -m escherconvert_map my_old_mapjson pathtomodel_filexml
Those commands will generate a new map called my_old_map_convertedjson that will load in Escher v10and later
75 Building and contributing maps
We are excited to collect pathway maps for every organism with a well characterized metabolic network This sectiondescribes the process of building a new map either from scratch or using a COBRA model with BiGG IDs
751 Building from scratch
To build a map from scratch you will first need a COBRA model for your map See the section Escher COBRA andCOBRApy for some background information on COBRA models
If you would like to eventually contribute your map to the Escher website it is important that your COBRA modeladheres to the identifiers in the BiGG Database Escher and BiGG are being developed together and we want tomaintain consistency and interoperability between them
Once you have a COBRA model you can follow these steps
1 Load your model in the Escher Builder
2 Begin building new reactions If you are familiar with the genes in your organism then try search for newreactions by their gene IDs
3 Limit each map to ~200 reactions Maps larger than this will slow down the Escher viewer especially on oldbrowsers Rather than building one giant map Escher is designed for building many smaller subsystem maps
4 When you have built a map for your a subsystem save the map as JSON with a name that includes the modelID followed by a period followed by the name of the subsystem For example
75 Building and contributing maps 29
Escher Documentation Release 143
iMM904Amino acid biosynthesisjson
5 (Optional) Once you have a set of subsystem maps you can set up a local Escher server so that subsystem mapsappear in the ldquoquick jumprdquo menu in the bottom right corner of the screen (as seen here for iJO1366) To setthis up you will need to start a local server as describe in Running the local server Next find your local cachedirectory by running this command in a terminal
python -c import escher print(escherget_cache_dir(name=maps))
This will print the location of the local maps cache Add your new subsystem maps to cache folder Now whenyou run the server (described in Running the local server) you should see that quick jump menu appear
NOTE The cache directory is organized into folders for organisms You can use these folder for filtering byorganism on the local launch page or you can place the maps in the top directory
NOTE 2 A similar approach can be used to access your models from the local launch page Place maps in thefolder indicated by
python -c import escher print(escherget_cache_dir(name=models))
752 Building from an existing map for a similar organism
Follow the instruction above except rather than starting from scratch load an existing Escher map for a differentorganism
Once you have the new model loaded use the Update names and gene reaction rules using model button in theModel menu to convert all descriptive names and gene reaction rules in the model to those in the map Reactions thatdo not match the model will be highlighted in red (This can be turned off again in the settings menu by deselectingHighlight reactions not in model)
Now visit each highlighted reaction and see if you can replace it with an equivalent biochemical pathway from themodel If not then delete the reaction and move on
Finally when there are no highlighted reactions left you can repeat this for other subsystems
753 Submitting maps to the Escher website
If you would like to contribute maps to Escher you can make a Pull Request to the GitHub repository eschergithubioMake sure there is a folder with the name of the organism in 1-0-0maps For example a new yeast map goes inthe folder
1-0-0mapsSaccharomyces cerevisiae
Then name your map by concatenating the model ID and the map name separated by a period For example a yeastmap built with the genome-scale model iMM904 could be named
iMM904Amino acid biosynthesisjson
Then add the JSON file for the model to the Pull Request if that model is not already available As before make afolder for your organism within 1-0-0models The model filename is just the model ID
In this example a correct Pull Request would include the following files
1-0-0mapsSaccharomyces cerevisiaeiMM904Amino acid biosynthesisjson1-0-0modelsSaccharomyces cerevisiaeiMM904json
30 Chapter 7 Contents
Escher Documentation Release 143
76 Developing with Escher
761 Using the static JavaScript and CSS files
You can include the compiled Escher JavaScript and CSS files in any HTML document The only dependencies ared3js and optionally Twitter Bootstrap if you are using the option menu=rsquoallrsquo
The compiled files are available form npmcdn
httpsnpmcdncomescher-visjsdistescherjshttpsnpmcdncomescher-visjsdistescherminjshttpsnpmcdncomescher-viscssdistbuildercsshttpsnpmcdncomescher-viscssdistbuildermincss
Source maps are also hosted there
httpsnpmcdncomescher-visjsdistescherjsmaphttpsnpmcdncomescher-visjsdistescherminjsmaphttpsnpmcdncomescher-viscssdistbuildermincssmap
If you want a particular version of escher add a version tag like this
httpsnpmcdncomescher-vis140-beta3jsdistescherjs
For an example of the boilerplate code that is required to begin developing with Escher have a look at the escher-demorepository For projects built with npm use the escher-test repository as a guide
762 Building and testing Escher
First install dependencies with npm
npm install
Escher uses grunt to manage the build process To run typical build steps just run
npm run compile
To test the JavaScript files run
npm run test
For Python testing run this in the py directory
python setuppy test
Build the static website
python setuppy build_gh
Clear static website files
python setuppy clean
Build and run the docs
cd docsmake htmlcd _buildhtml
76 Developing with Escher 31
Escher Documentation Release 143
python -m SimpleHTTPServer python 2python -m httpserver python 3
763 Generating and reading Escher and COBRA files
The Escher file format
Escher layouts are defined by JSON files that follow a specific schema using json schema The latest schemafor Escher JSON files is here The Escher schemas are versioned with inspiration from SchemaVer Theeschervalidate module can be used to validate models against the schema
The Escher layout schema is designed to be as simple as possible For example the core metabolism map of Es-cherichia coli is layed out like this
[
map_name E coli coreCore metabolismmap_id 2938hoq32a1map_description E coli core metabolic networknLast Modified Fri Dec 05 2014 163944 GMT-0800 (PST)homepage httpseschergithubioschema httpseschergithubioescherjsonschema1-0-0
reactions nodes text_label canvas
x 7857062530517567y 31436893920898433width 5894515691375733height 4860457037353515
]
The map_name includes the model that was used to build this layout followed by a period and then a readable namefor the map The map_id is a unique identifier for this map The map_description describes the map and thelast time it was modified Both the homepage and the schema entries must have exactly these values for the Eschermap to be valid
In the next section the reactions nodes labels and canvas are all defined For reactions nodes and text labels eachelement has a key that is an arbitrary integer As long as there are no repeated IDs (eg no 2 segments with the ID517) then everything should work fine
Read through the schema (here) for more detail on the format
The COBRA file format
COBRA models are also saved as JSON files This format has not been documented with a schema but you canbrowse through the core metabolism model as a guide to generating valid COBRA models
I still need help
If you are interested in developing with Escher and you need more information than what is provided in the documen-tation please contact Zachary King (zaking-AT-ucsd-DOT-edu)
32 Chapter 7 Contents
Escher Documentation Release 143
77 EscherConverter
EscherConverter is a standalone program that reads files created with the graphical network editor Escher and convertsthem to files in community standard formats
Download EscherConverter 05 (137 MB)
771 Using EscherConverter
Escher uses a JSON file format to represent its networks This format has been developed because of its very small filesize and its compatibility to online programs that are written in JavaScript In particular JSON is a JavaScript ObjectNotation or in other words a JSON file directly represents components of JavaScript programs This makes parsingvery simple and allows direct use of those files in web-based programs
However in systems biology specific file formats have been developed with the aim to be easily exchangeable betweensoftware implemented in diverse programming languages
To this end these formats support semantically clear annotations and are maintained by a large community of scientistsEscherConverter supports export to two particularly important XML-based community file formats SBML with layoutextension and SBGN-ML
While SBML has been mainly developed for dynamic simulation of biological networks it is nowadays also usablefor diverse other purposes Its layout extension facilitates the encoding the display of biological networks
SBGN-ML has been directly developed as a language for the display of biological pathway maps of diverse kinds Itstores the position and connection of entities similar to what is shown in Escher networks
EscherConverter takes Escherrsquos JSON files as input and generates equivalent SBML Level 3 Version 1 files with layoutextension or SBGN-ML files
In order to ensure that the conversion is correct EscherConverter provides its own display that gives users a previewof how the export data format will be rendered by other tools In this preview display you can zoom in and out movearcs and node positions However it is important to know that none of the changes made in this preview are stored inthe export file
Download and Installation
You can obtain local copy of EscherConverter by clicking here
As a Javatrade application no specific installation is required for EscherConverter
However make sure you have a recent Javatrade Runtime Environment (JRE) installed on your computer (at least JRE8) You can obtain Javatrade from the Oracle website There you can also find installation instructions for your respectiveoperating system
Once Javatrade has been installed you can simply place the EscherConverter JAR file somewhere on your local computerfor instance in the folder
bull Applications if you are working under Mac OS
77 EscherConverter 33
Escher Documentation Release 143
bull opt for Linux computers
bull CProgram Files if you are using Windows
Launching the program
You can launch EscherConverter simply by double-clicking on the application JAR file This will open a followinggraphical user interface as described in the following figures
Figure 1 | The graphical user interface of EscherConverter
bull Preferences opens a settings dialog (see next screenshot)
bull Open displays a file chooser to select an input file in JSON format
bull Save export the map that is displayed in the current tab to SBML or SBGN-ML
bull Discard closes the current tab without saving
bull Help opens the online help that displays all command-line options
bull License displays the license under which this software is distributed
bull About shows information about the authors of this software
bull Main the main panel of the software in which converted Escher maps will be displayed organized in tabs
bull Status the status bar shows information and logging messages during the conversion
34 Chapter 7 Contents
Escher Documentation Release 143
Figure 2 | The preferences dialog All settings in this dialog are also available through EscherConverterrsquos command-line interface
Layout section several properties that are required in SBML and SBGN-ML are not explicitly specified in EscherrsquosJSON format and therefore need to be adjusted by the user These are the size of the drawing canvas the default boxsize for text labels the size of primary and secondary nodes In contrast to SBGN-ML and Escherrsquos JSON formatthe SBML layout extension supports three-dimensional displays When selecting this export file format it is thereforenecessary to also define the z-coordinate and the depth of all objects
Components and naming section Most settings in this section are specific for the SBML layout extension and areonly active if this output format is selected These are names and identifiers of the layout component and the in caseof SBML mandatory default compartment (a compartment without physical meaning a reaction space in which allmetabolites are located) EscherConverter can infer compartment bounds from metabolites but this is an experimentalfeature Just try it and see how the preview changes
77 EscherConverter 35
Escher Documentation Release 143
Figure 3 | A layout preview
The birds-eye view and the navigation component on the left help you navigate through the network display Thisgraph shows you how the converted pathway map will be rendered by software that supports SBGN-ML or the SBMLlayout extension This preview can be modified by moving arcs or nodes however none of those changes are storedwhen exporting the file In this current version EscherConver only exports layouts as given in the original JSON file
Included third-party software
EscherConverter includes several third-party libraries which we here list and acknowledge
bull ArgParser
bull JSBML
bull libSBGN
bull Pixel-Mixer icons
bull yFiles
772 Command-line interface API
You can launch EscherConverter from the command-line On a Unix system (such as Linux MacOS or Solaris etc)use a command like
bash$ java -jar -Xms8G -Xmx8G -Duserlanguage=en EscherConverter-05jar [options]
Under Window use a command like
Cgt javaw -jar -Xms8G -Xmx8G -Duserlanguage=en EscherConverter-05jar [options]
Escher has a large collection of command-line options (see below) which can be useful if you want to launch theprogram with specific settings or if multiple files are to be converted in a batch mode It is even possible to completelydisable the graphical user interface
36 Chapter 7 Contents
Escher Documentation Release 143
Input and output files
Definition of input and output data files as well as the format for the output
--input=ltFilegt
Specifies the JSON input file If a directory is given the conversion will be recursively performed Accepts JSON
--output=ltFilegt
The path to the file into which the output should be written If the input is a directory this must also be a directory inorder to perform a recursive conversion Accepts SBML SBGN
Escher layout
The options in this group allow you to influence how large certain elements should be displayed
--canvas-default-height=ltDoublegt
Just as in the case of the width of the canvas this value needs to be specified for cases where the JSON input file lacksan explicit specification of the canvas height Arguments must fit into the range [11E9] (Default value 2500)
--canvas-default-width=ltDoublegt
This value is used when no width has been defined for the canvas Since the width attribute is mandatory for the layouta default value must be provided in these cases Arguments must fit into the range [11E9] (Default value 2500)
--label-height=ltDoublegt
With this option you can specify the height of the bounding box of text labels Arguments must fit into the range[11E9] (Default value 500)
--label-width=ltDoublegt
This option defines the width of bounding boxes for text labels Arguments must fit into the range [11E9] (Defaultvalue 1600)
--node-depth=ltDoublegt
The length of nodes along z-coordinate Escher maps are actually two-dimensional but in general a layout can bethree-dimensional This value should be an arbitrary value greater than zero because some rendering engines mightnot display the node if its depth is zero Arguments must fit into the range [11E9] (Default value 10)
--node-label-height=ltDoublegt
Node labels can have a size different from general labels in the graph Here you can specify how height the boundingbox of the labels for nodes should be Arguments must fit into the range [11E9] (Default value 200)
--primary-node-height=ltDoublegt
The primary node should be bigger than the secondary node With this option you can specify the height of this typeof nodes Arguments must fit into the range [11E9] (Default value 300)
--primary-node-width=ltDoublegt
Escher maps distinguish between primary and secondary nodes Primary nodes should be larger than secondary nodesand display the main flow of matter through the network This option allows you to specify the width of primarynodes Arguments must fit into the range [11E9] (Default value 300)
77 EscherConverter 37
Escher Documentation Release 143
--reaction-label-height=ltDoublegt
Reaction label heightArguments must fit into the range [11E9] (Default value 300)
--reaction-node-ratio=ltDoublegt
This value is used as a conversion factor to determine the size of the reaction display box depending on the size ofprimary nodes Height and width of reaction nodes are determined by dividing the corresponding values from theprimary node size by this factor Arguments must fit into the range [01] (Default value 05)
--secondary-node-ratio=ltDoublegt
Similar to the reaction node ratio the size of secondary nodes (width and height) is determined by dividing thecorresponding values from the primary nodes by this value Arguments must fit into the range [01] (Default value06666666666666666)
--z=ltDoublegt
The position on the z-axis where the entire two-dimensional graph should be drawn Arguments must fit into the range[-1E91E9] (Default value 00)
Escher Components and their naming
Here you can influence which elements are to be included in the layout and how elements in the layout are to be calledor identified
--format=ltOutputFormatgt
The desired format for the conversion eg SBML All possible values for type ltOutputFormatgt are SBGN andSBML (Default value SBML)
--layout-id=ltStringgt
In contrast to the name this identifier does not have to be human-readable This is a machine identifier which muststart with a letter or underscore and can only contain ASCII characters (Default value Escher_Layout)
--layout-name=ltStringgt
This should be a human-readable name for the layout that is to be created This name might be displayed to describethe figure and should therefore be explanatory (Default value Escher Layout)
--compartment-id=ltStringgt
A compartment needs to have a unique identifier which needs to be a machine-readable Sting that must start with aletter or underscore and can only contain ASCII characters Since the JSON file does not provide this information thisoption allows you to specify the required identifier (Default value default)
--compartment-name=ltStringgt
With this option it is possible to define a name for the default compartment can be that needs to be generated for theconversion to SBML The name does not have any restrictions ie any UTF-8 character can be used (Default valueDefault compartment)
--infer-compartment-bounds
This converter can infer where the boundaries of compartments could be drawn To this end it uses each nodersquos BiGGids to identify the compartment of all metabolites Assuming that compartments have rectangular shapes the algorithmcan find the outermost node on each side of the box and hence obtain the boundaries of the compartment However
38 Chapter 7 Contents
Escher Documentation Release 143
this methods will fail when metabolites are drawn inside of such a box that belong to a different compartment that isactually further outside For this reason this option is deactivated by default (Default value false)
Options for the graphical user interface
--gui
If this option is given the program will display its graphical user interface (Default value false)
--log-level=ltStringgt
Change the log-level of this application This option will influence how fine-grained error and other log messages willbe that you receive while executing this program All possible values for type ltStringgt are ALL CONFIG FINEFINER FINEST INFO OFF SEVERE and WARNING (Default value INFO)
--log-file=ltFilegt
This option allows you to specify a log file to which all information of the program will be written Accepts (bp2bp3 log owl xml)
78 JavaScript API
class escherBuilder(map_data model_data embedded_css selection options)A Builder object contains all the UI and logic to generate a map builder or viewer
Arguments
bull map_data (object) ndash The data for a map to be passed to escherMapfrom_data() Ifnull then an empty Builder is initialized
bull model_data (object) ndash The data for a cobra model to be passed to es-cherCobraModel() Can be null
bull embedded_css (string) ndash The stylesheet for the SVG elements in the Escher map
bull selection (object) ndash (Optional Default In the body element) The d3 selection of anelement to place the Builder into The selection cannot be inside an SVG element
bull options (object) ndash (Optional) An object defining any of the following options
optionsmenu(Default rsquoallrsquo) The type of menu that will be displayed Can be lsquoallrsquo for the fullmenu or lsquozoomrsquo for just zoom buttons The lsquoallrsquo option requires the full set of Escherdependencies (D3js JQuery and Bootstrap) while the lsquozoomrsquo option requires only D3jsFor more details see Developing with Escher
optionsscroll_behavior(Default rsquopanrsquo) This option determines the effect that the scroll wheel will have onan Escher map Can be lsquopanrsquo to pan the map or lsquozoomrsquo to zoom the map when the usermoves the scroll wheel
optionsuse_3d_transform(Default Chooses a good option by testing the browser) If true then use CSS3 3D trans-forms to speed up panning and zooming This feature will only work on browsers thatsupport the 3D transforms It works best in the latest versions of Chrome Firefox andInternet Explorer Safari works better with this turned off
78 JavaScript API 39
Escher Documentation Release 143
optionsenable_editing(Default true) If true then display the map editing functions If false then hide themand only allow the user to view the map
optionenable_keys(Default true) If true then enable keyboard shortcuts
optionsenable_search(Default true) If true then enable indexing of the map for search Use false to disablesearching and potentially improve the map performance
optionsfill_screen(Default false) Use true to fill the screen when an Escher Builder is placed in a top-level container (eg a div in the body element)
optionsfull_screen_button(Default false) Include a button in the user interface for entering full screen mode
optionsignore_bootstrap(Default false) Do not use Bootstrap for buttons even if it available This is used toembed Escher in a Jupyter notebook where it conflicts with the Jupyter Boostrap installa-tion
Map model and styles
optionsstarting_reaction(Default null) The ID (as a string) of a reaction to draw when the Builder loads
optionsnever_ask_before_quit(Default false) If false then display a warning before the user closes an Eschermap If true then never display the warning This options is only respected if op-tionsenable_editing == true If enable_editing is false then the warnings are not dis-played
optionsunique_map_id(Default null) A unique ID that will be used to UI elements donrsquot interfere whenmultiple maps are in the same HTML document
optionsprimary_metabolite_radius(Default 15) The radius of primary metabolites in px
optionssecondary_metabolite_radius(Default 10) The radius of secondary metabolites in px
optionsmarker_radius(Default 5) The radius of marker nodes in px
optionsgene_font_size(Default 18) The font size of the gene reaction rules in px
optionshide_secondary_metabolites(Default false) If true then secondary nodes and segments are hidden This is conve-nient for generating simplified map figures
optionsshow_gene_reaction_rules(Default false) If true then show the gene reaction rules even without gene data
optionshide_all_labels(Default false) If checked hide all reaction gene and metabolite labels
Applied data
40 Chapter 7 Contents
Escher Documentation Release 143
optionsreaction_data(Default null) An object with reaction ids for keys and reaction data points for values
optionsreaction_stylesDefault [rsquocolorrsquo rsquosizersquo rsquotextrsquo]
An array of style types The array can contain any of the following lsquocolorrsquo lsquosizersquo lsquotextrsquolsquoabsrsquo The lsquocolorrsquo style means that the reactions will be colored according to the loadeddataset The lsquosizersquo style means that the reactions will be sized according to the loadeddataset The lsquotextrsquo style means that the data values will be displayed in the reactionlabels The lsquoabsrsquo style means the the absolute values of reaction values will be used fordata visualization
optionsreaction_compare_style(Default rsquodiffrsquo) How to compare to datasets Can be either lsquofold lsquolog2_foldrsquo orlsquodiffrsquo
optionsreaction_scaleDefault
[ type min color c8c8c8 size 12 type median color 9696ff size 20 type max color ff0000 size 25 ]
An array of objects that define points on the data scale
Each point is an object with a type attribute Types can be lsquominrsquo lsquomaxrsquo lsquomeanrsquo lsquoQ1rsquo (firstquartile) lsquomedianrsquo lsquoQ3rsquo (third quartile) or lsquovaluersquo Each point can have a color attributethat specifies a color with a string (any CSS color specification is allowed including hexrgb and rgba) Each point can have a size attirbute that specifies a reaction thickness as anumber Finally points with type lsquovaluersquo can have a value attribute that specifies an exactnumber for pont in the scale
NOTE If lsquominrsquo or lsquomaxrsquo is not provided Escher automatically adds them To be com-pletely clear about what you expect to see on the map it is best to provide lsquominrsquo andlsquomaxrsquo in addition to other scale points
Here are examples of each type
type rsquominrsquo color rsquoredrsquo size 12 Specifies that reactionsnear the minimum value are red and have thickness 12
type rsquoQ1rsquo color rsquorgba(100 100 50 05)rsquo size 12 Specifies that reactions near the first quartile have the given color opacity andthickness
type rsquomeanrsquo color rsquorgb(100 100 50)rsquo size 50 Specifies that reactions near the mean value have the given color and thickness
type rsquovaluersquo value 85 color rsquo333rsquo size 50 Specifies that reactions near 85 value have the given color and size
optionsreaction_no_data_color(Default rsquodcdcdcrsquo) The color of reactions with no data value
optionsreaction_no_data_size(Default 8) The size of reactions with no data value
optionsgene_data(Default null) An object with Gene ids for keys and gene data points for values
78 JavaScript API 41
Escher Documentation Release 143
optionsand_method_in_gene_reaction_rule(Default mean) When evaluating a gene reaction rule use this function to evaluate ANDrules Can be lsquomeanrsquo or lsquominrsquo
optionsmetabolite_data(Default null) An object with metabolite ids for keys and metabolite data points forvalues
optionsmetabolite_stylesDefault [rsquocolorrsquo rsquosizersquo rsquotextrsquo]
An array of style types The array can contain any of the following lsquocolorrsquo lsquosizersquo lsquotextrsquolsquoabsrsquo The lsquocolorrsquo style means that the metabolites will be colored according to the loadeddataset The lsquosizersquo style means that the metabolites will be sized according to the loadeddataset The lsquotextrsquo style means that the data values will be displayed in the metabolitelabels The lsquoabsrsquo style means the the absolute values of metabolite values will be used fordata visualization
optionsmetabolite_compare_style(Default rsquodiffrsquo) How to compare to datasets Can be either lsquofoldrsquo lsquolog2_foldrsquo orlsquodiffrsquo
optionsmetabolite_scaleDefault
[ type min color fffaf0 size 20 type median color f1c470 size 30 type max color 800000 size 40 ]
An array of objects that define points on the data scale See the description of op-tionsreaction_scale for an explanation of the format
optionsmetabolite_no_data_color(Default rsquoffffffrsquo) The color of metabolites with no data value
optionsmetabolite_no_data_size(Default 10) The size of metabolites with no data value
View and build options
optionsidentifiers_on_map(Default rsquobigg_idrsquo) The identifiers that will be displayed in reaction metabolite andgene labels Can be lsquobigg_idrsquo or lsquonamersquo
optionshighlight_missing(Default false) If true then highlight in red reactions that are not in the loaded COBRAmodel
optionsallow_building_duplicate_reactions(Default true) If true then building duplicate reactions is allowed If false then dupli-cate reactions are hidden in Add reaction mode
optionscofactors(Default [rsquoatprsquo rsquoadprsquo rsquonadrsquo rsquonadhrsquo rsquonadprsquo rsquonadphrsquorsquogtprsquo rsquogdprsquo rsquohrsquo rsquocoarsquo rsquoumprsquo rsquoh20rsquo rsquoppirsquo]) A list of metabo-lite IDs to treat as cofactors These will be secondary metabolites in new reactions
Callbacks
optionsfirst_load_callbackA function to run after loading the Builder
42 Chapter 7 Contents
Escher Documentation Release 143
load_map(map_data[ should_update_data])Load a map for the loaded data Also reloads most of the Builder content
Arguments
bull map_data ndash The data for a map
bull should_update_data (Boolean) ndash (Default true) Whether data should be ap-plied to the map
load_model(model_data[ should_update_data])Load the cobra model from model data
Arguments
bull model_data ndash The data for a Cobra model (Parsing in done by escherCobraModel)
bull should_update_data (Boolean) ndash (Default true) Whether data should be ap-plied to the model
view_mode()Enter view mode
build_mode()Enter build mode
brush_mode()Enter brush mode
zoom_mode()Enter zoom mode
rotate_mode()Enter rotate mode
text_mode()Enter text mode
set_reaction_data(data)
Arguments
bull data (array) ndash An array of 1 or 2 objects where each object has keys that are reactionIDrsquos and values that are data points (numbers)
set_metabolite_data(data)
Arguments
bull data (array) ndash An array of 1 or 2 objects where each object has keys that are metaboliteIDrsquos and values that are data points (numbers)
set_gene_data(data clear_gene_reaction_rules)
Arguments
bull data (array) ndash An array of 1 or 2 objects where each object has keys that are gene IDrsquosand values that are data points (numbers)
Arguments
bull clear_gene_reaction_rules (Boolean) ndash (Optional Default false) In addi-tion to setting the data also turn of the gene_reaction_rules
78 JavaScript API 43
Escher Documentation Release 143
79 Python API
class escherBuilder(map_name=None map_json=None model=None model_name=Nonemodel_json=None embedded_css=None reaction_data=None metabo-lite_data=None gene_data=None local_host=None id=None safe=Falsekwargs)
A metabolic map that can be viewed edited and used to visualize data
This map will also show metabolic fluxes passed in during consruction It can be viewed as a standalone htmlinside a browswer Alternately the respresentation inside an IPython notebook will also display the map
Maps are stored in json files and are stored in a cache directory Maps which are not found will be downloadedfrom a map repository if found
Parameters
bull map_name ndash A string specifying a map to be downloaded from the Escher web server orloaded from the cache
bull map_json ndash A JSON string or a file path to a JSON file or a URL specifying a JSON fileto be downloaded
bull model ndash A Cobra model
bull model_name ndash A string specifying a model to be downloaded from the Escher web serveror loaded from the cache
bull model_json ndash A JSON string or a file path to a JSON file or a URL specifying a JSONfile to be downloaded
bull embedded_css ndash The CSS (as a string) to be embedded with the Escher SVG
bull reaction_data ndash A dictionary with keys that correspond to reaction ids and values thatwill be mapped to reaction arrows and labels
bull metabolite_data ndash A dictionary with keys that correspond to metabolite ids and valuesthat will be mapped to metabolite nodes and labels
bull gene_data ndash A dictionary with keys that correspond to gene ids and values that will bemapped to corresponding reactions
bull local_host ndash A hostname that will be used for any local files This is generally usedfor using the notebook offline and for testing in the IPython Notebook with modified Eschercode An example value for local_host is lsquohttplocalhost7778lsquo
bull id ndash Specify an id to make the javascript data definitions unique A random id is chosen bydefault
bull safe ndash If True then loading files from the filesytem is not allowed This is to ensure thesafety of using Builder within a web server
Keyword Arguments
These are defined in the Javascript API
bulluse_3d_transform
bullenable_search
bullfill_screen
bullzoom_to_element
bullfull_screen_button
44 Chapter 7 Contents
Escher Documentation Release 143
bullstarting_reaction
bullunique_map_id
bullprimary_metabolite_radius
bullsecondary_metabolite_radius
bullmarker_radius
bullgene_font_size
bullhide_secondary_metabolites
bullshow_gene_reaction_rules
bullhide_all_labels
bullreaction_styles
bullreaction_compare_style
bullreaction_scale
bullreaction_no_data_color
bullreaction_no_data_size
bulland_method_in_gene_reaction_rule
bullmetabolite_styles
bullmetabolite_compare_style
bullmetabolite_scale
bullmetabolite_no_data_color
bullmetabolite_no_data_size
bullidentifiers_on_map
bullhighlight_missing
bullallow_building_duplicate_reactions
bullcofactors
All keyword arguments can also be set on an existing Builder object using setter functions eg
my_builderset_reaction_styles(new_styles)
display_in_browser(ip=lsquo127001rsquo port=7655 n_retries=50 js_source=rsquowebrsquo menu=rsquoallrsquoscroll_behavior=rsquopanrsquo enable_editing=True enable_keys=True mini-fied_js=True never_ask_before_quit=False)
Launch a web browser to view the map
Parameters
bull ip ndash The IP address to serve the map on
bull port ndash The port to serve the map on If specified the port is occupied then a random freeport will be used
bull n_retries (int) ndash The number of times the server will try to find a port before quitting
bull js_source (string) ndash Can be one of the following
ndash web (Default) - Use JavaScript files from eschergithubio
79 Python API 45
Escher Documentation Release 143
ndash local - Use compiled JavaScript files in the local Escher installation Works offline
ndash dev - No longer necessary with source maps This now gives the same behavior aslsquolocalrsquo
bull menu (string) ndash Menu bar options include
ndash none - No menu or buttons
ndash zoom - Just zoom buttons
ndash all (Default) - Menu and button bar (requires Bootstrap)
bull scroll_behavior (string) ndash Scroll behavior options
ndash pan - Pan the map
ndash zoom - Zoom the map
ndash none (Default) - No scroll events
bull enable_editing (Boolean) ndash Enable the map editing modes
bull enable_keys (Boolean) ndash Enable keyboard shortcuts
bull minified_js (Boolean) ndash If True use the minified version of JavaScript and CSSfiles
bull never_ask_before_quit (Boolean) ndash Never display an alert asking if you wantto leave the page By default this message is displayed if enable_editing is True
display_in_notebook(js_source=rsquowebrsquo menu=rsquozoomrsquo scroll_behavior=rsquononersquo mini-fied_js=True height=500 enable_editing=False)
Embed the Map within the current IPython Notebook
Parameters
bull js_source (string) ndash Can be one of the following
ndash web (Default) - Use JavaScript files from eschergithubio
ndash local - Use compiled JavaScript files in the local Escher installation Works offline
ndash dev - No longer necessary with source maps This now gives the same behav-ior as lsquolocalrsquo
bull menu (string) ndash Menu bar options include
ndash none - No menu or buttons
ndash zoom - Just zoom buttons
ndash Note The all menu option does not work in an IPython notebook
bull scroll_behavior (string) ndash Scroll behavior options
ndash pan - Pan the map
ndash zoom - Zoom the map
ndash none - (Default) No scroll events
bull minified_js (Boolean) ndash If True use the minified version of JavaScript andCSS files
bull height ndash Height of the HTML container
bull enable_editing (Boolean) ndash Enable the map editing modes
46 Chapter 7 Contents
Escher Documentation Release 143
save_html(filepath=None overwrite=False js_source=rsquowebrsquo protocol=rsquohttpsrsquo menu=rsquoallrsquoscroll_behavior=rsquopanrsquo enable_editing=True enable_keys=True minified_js=Truenever_ask_before_quit=False static_site_index_json=None)
Save an HTML file containing the map
Parameters
bull filepath (string) ndash The HTML file will be saved to this location Whenjs_source is lsquolocalrsquo then a new directory will be created with this name
bull overwrite (Boolean) ndash Overwrite existing files
bull js_source (string) ndash Can be one of the following
ndash web (Default) - Use JavaScript files from eschergithubio
ndash local - Use compiled JavaScript files in the local Escher installation Works of-fline To make the dependencies available to the downloaded file a new directorywill be made with the name specified by filepath
ndash dev - No longer necessary with source maps This now gives the same behav-ior as lsquolocalrsquo
bull protocol (string) ndash The protocol can be lsquohttprsquo lsquohttpsrsquo or None which indicatesa lsquoprotocol relative URLrsquo as in eschergithubio Ignored if source is local
bull menu (string) ndash Menu bar options include
ndash none - No menu or buttons
ndash zoom - Just zoom buttons
ndash all (Default) - Menu and button bar (requires Bootstrap)
bull scroll_behavior (string) ndash Scroll behavior options
ndash pan - Pan the map
ndash zoom - Zoom the map
ndash none (Default) - No scroll events
bull enable_editing (Boolean) ndash Enable the map editing modes
bull enable_keys (Boolean) ndash Enable keyboard shortcuts
bull minified_js (Boolean) ndash If True use the minified version of JavaScript andCSS files
bull height (number) ndash Height of the HTML container
bull never_ask_before_quit (Boolean) ndash Never display an alert asking if youwant to leave the page By default this message is displayed if enable_editing isTrue
bull static_site_index_json (string) ndash The index as a JSON string for thestatic site Use javascript to parse the URL options Used for generating static pages(see static_sitepy)
791 Cache
escherget_cache_dir(versioned=True name=None)Get the cache dir as a string and make the directory if it does not already exist
Parameters
79 Python API 47
Escher Documentation Release 143
bull versioned (Boolean) ndash Whether to return the versioned path in the cache Eschermaps for the latest version of Escher are found in the versioned directory (versioned= True) but maps for previous versions of Escher can be found by visiting the parentdirectory (versioned = False)
bull name (string) ndash An optional subdirectory within the cache If versioned is False thenname is ignored
escherclear_cache(different_cache_dir=None ask=True)Empty the contents of the cache directory including all versions of all maps and models
Parameters
bull different_cache_dir (string) ndash (Optional) The directory of another cacheThis is mainly for testing
bull ask (Boolean) ndash Whether to ask before deleting
escherlist_cached_maps()Return a list of all cached maps
escherlist_cached_models()Return a list of all cached models
escherlist_available_maps()Return a list of all maps available on the server
escherlist_available_models()Return a list of all models available on the server
710 License
Escher and EscherConverter are distributed under the MIT license
bull genindex
48 Chapter 7 Contents
Python Module Index
eescher 44
49
Escher Documentation Release 143
50 Python Module Index
Index
Bbrush_mode() (built-in function) 43build_mode() (built-in function) 43Builder (class in escher) 44
Cclear_cache() (in module escher) 48
Ddisplay_in_browser() (escherBuilder method) 45display_in_notebook() (escherBuilder method) 46
Eescher (module) 44escherBuilder() (class) 39
Gget_cache_dir() (in module escher) 47
Llist_available_maps() (in module escher) 48list_available_models() (in module escher) 48list_cached_maps() (in module escher) 48list_cached_models() (in module escher) 48load_map() (built-in function) 42load_model() (built-in function) 43
Ooptionenable_keys (option attribute) 40optionsallow_building_duplicate_reactions (options at-
tribute) 42optionsand_method_in_gene_reaction_rule (options at-
tribute) 41optionscofactors (options attribute) 42optionsenable_editing (options attribute) 39optionsenable_search (options attribute) 40optionsfill_screen (options attribute) 40optionsfirst_load_callback (options attribute) 42optionsfull_screen_button (options attribute) 40optionsgene_data (options attribute) 41
optionsgene_font_size (options attribute) 40optionshide_all_labels (options attribute) 40optionshide_secondary_metabolites (options attribute)
40optionshighlight_missing (options attribute) 42optionsidentifiers_on_map (options attribute) 42optionsignore_bootstrap (options attribute) 40optionsmarker_radius (options attribute) 40optionsmenu (options attribute) 39optionsmetabolite_compare_style (options attribute) 42optionsmetabolite_data (options attribute) 42optionsmetabolite_no_data_color (options attribute) 42optionsmetabolite_no_data_size (options attribute) 42optionsmetabolite_scale (options attribute) 42optionsmetabolite_styles (options attribute) 42optionsnever_ask_before_quit (options attribute) 40optionsprimary_metabolite_radius (options attribute) 40optionsreaction_compare_style (options attribute) 41optionsreaction_data (options attribute) 40optionsreaction_no_data_color (options attribute) 41optionsreaction_no_data_size (options attribute) 41optionsreaction_scale (options attribute) 41optionsreaction_styles (options attribute) 41optionsscroll_behavior (options attribute) 39optionssecondary_metabolite_radius (options attribute)
40optionsshow_gene_reaction_rules (options attribute) 40optionsstarting_reaction (options attribute) 40optionsunique_map_id (options attribute) 40optionsuse_3d_transform (options attribute) 39
Rrotate_mode() (built-in function) 43
Ssave_html() (escherBuilder method) 46set_gene_data() (built-in function) 43set_metabolite_data() (built-in function) 43set_reaction_data() (built-in function) 43
51
Escher Documentation Release 143
Ttext_mode() (built-in function) 43
Vview_mode() (built-in function) 43
Zzoom_mode() (built-in function) 43
52 Index
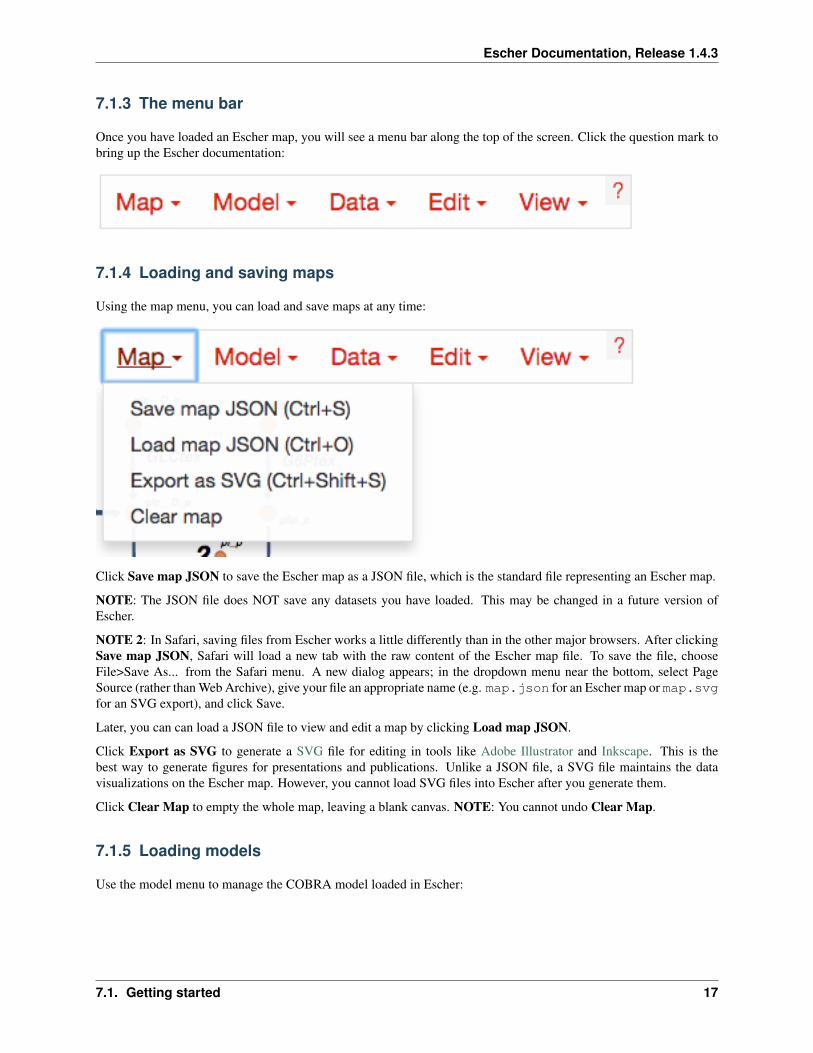
Escher Documentation Release 143
Choose Load COBRA model JSON to open a COBRA model Read more about COBRA models in Escher COBRAand COBRApy Once you have COBRApy v030 or later installed then you can generate a JSON model by followingthis example code
Once you have loaded a COBRA model there may be inconsistencies between the content in the map and the model(eg reaction IDs descriptive names and gene reaction rules) You click Update names and gene reaction rulesusing model to find matching reactions and metabolites between the map and the model (based on their IDs) andthen apply the names and gene reaction rules from the model to the map The reactions that do not match will behighlighted in red (This can be turned off again in the settings menu by deselecting Highlight reactions not in model)More advice on building maps is available in Building and contributing maps
Click Clear Model to clear the current model
716 Loading reaction gene and metabolite data
Datasets can be loaded as CSV files or JSON files using the Data Menu
In Escher reaction and gene datasets are visualized by changing the color thickness and labels of reaction arrowsMetabolite datasets are visualized by changing the color size and labels of metabolite circles The specific visualstyles can be modified in the Settings menu When data is not present for a specific reaction gene or metabolite thenthe text label will say lsquondrsquo which means lsquono datarsquo
18 Chapter 7 Contents
Escher Documentation Release 143
The structure of a CSV file
CSV files should have 1 header row 1 ID column and either 1 or 2 columns for data values The ID column cancontain BiGG IDs or descriptive names for the reactions metabolites or genes in the dataset Here is an example witha single data value columns
IDtime 0secglc__D_c54g6p__D_c23
Which might look like this is Excel
ID time 0secglc__D_c 54g6p_c 23
If two datasets are provided then the Escher map will display the difference between the datasets In the Settings menuthe Comparison setting allows you to choose between comparison functions (Fold Change Log2(Fold Change) andDifference) With two datasets the CSV file looks like this
ID time 0sec time 5sglc__D_c 54 102g6p_c 23 81
Data can also be loaded from a JSON file This Python code snippet provides an example of generating the properformat for single reaction data values and for reaction data comparisons
import json
save a single flux vector as JSONflux_dictionary = glc__D_c 54 g6p_c 23with open(outjson w) as f
jsondump(flux_dictionary f)
save a flux comparison as JSON
71 Getting started 19
Escher Documentation Release 143
flux_comp = [glc__D_c 54 g6p_c 23 glc__D_c 102 g6p_c 81]with open(out_compjson w) as f
jsondump(flux_comp f)
Gene data and gene reaction rules
Escher uses gene reaction rules to connect gene data to the reactions on a metabolic pathway You can see these genereaction rules on the map by selecting Show gene reaction rules in the Settings menu
Gene reaction rules show the genes whose gene products are required to catalyze a reaction Gene are connected usingAND and OR rules AND rules are used when two genes are required for enzymatic activity eg they are membersof a protein complex OR rules are used when either gene can catalyze the enzymatic activity eg they are isozymes
With OR rules Escher will take the sum of the data values for each gene With AND rules Escher will either takethe mean (the default) or the minimum of the components The AND behavior (mean vs minimum) is defined in theSettings menu
717 Editing and building
The Edit menu gives you access to function for editing the map
20 Chapter 7 Contents
Escher Documentation Release 143
Escher has five major modes and you can switch between those modes using the buttons in the Edit menu or usingthe buttons in the button bar on the left of the screen
1 Pan mode Drag the canvas to pan the map You can also use the mouse scroll wheel or trackpad scroll function(drag with 2 fingers) to pan the map (or to zoom if you selected Scroll to zoom in the settings)
2 Select mode Select nodes by clicking on them Shift-click to select multiple nodes or drag across the canvasto select multiple nodes using the selection brush
3 Add reaction mode If you have loaded a Model then click on the canvas to see a list of reactions that you candraw on the map Click on a node to see reactions that connect to that node In the input box you can search byreaction ID metabolite ID or gene ID (locus tag)
4 Rotate model Before entering rotate mode be sure to select one or more nodes in select mode Then afterentering rotate mode drag anywhere on the canvas to rotate the selection You can also drag the red crosshairsto change the center of the rotation
5 Text mode Use text mode to add text annotations to the map Click on the canvas to add a new text annotationor click an existing annotation to edit it When you are finished click Enter or Escape to save the changes
71 Getting started 21
Escher Documentation Release 143
In addition to the editing modes the Edit menu gives you access to the following commands
bull Delete Delete the currently selected node(s)
bull Undo Undo the last action NOTE Certain actions such as editing the canvas cannot be undone in the currentversion of Escher
bull Redo Redo the last action that was undone
bull Toggle primarysecondary node In Escher each metabolite node is either a primary node or a secondarynode Primary nodes are larger and secondary nodes can be hidden in the Settings menu Use this command totoggle the currently selected node(s) between primary and secondary
bull Rotate reactant locations When you draw a new reaction in Escher this command will rotate the new reactantsso that a new reactant is primary and centered This command is extremely useful when you are drawing a longpathway and you want to quickly switch which metabolite to ldquofollowrdquo eg make sure you are following thecarbon-containing metabolites
If you are confused then try drawing a new pathway and hitting the ldquocrdquo key to see the reactants rotate
bull Select all Select all nodes
bull Select none Unselect all nodes
bull Invert selection Select all the nodes that are currently unselected This feature is very useful when you wantto keep just one part of the map Simply drag to select the part you want to keep call the Invert selectioncommand then call the Delete command
718 Editing the canvas
A somewhat non-obvious feature of Escher is that you can edit the canvas by dragging the canvas edges This ispossible in Pan mode and Select mode
22 Chapter 7 Contents
Escher Documentation Release 143
719 View options
bull Zoom in Zoom in to the map
bull Zoom out Zoom out of the map
bull Zoom to nodes Zoom to see all the nodes on the map
bull Zoom to canvas Zoom to see the entire canvas
bull Find Search for a reaction metabolite or gene on the map
bull Show control points Show the control points you can drag these red and blue circle to adjust the shapes ofthe reactions curves
bull Settings Open the Settings menu
7110 The button bar
The button bar give you quick access to many of the common Escher functions
71 Getting started 23
Escher Documentation Release 143
24 Chapter 7 Contents
Escher Documentation Release 143
7111 Settings
View and build options
bull Identifiers Choose whether to show BiGG IDs or descriptive names for reactions metabolites and genes
bull Hide secondary metabolites This will simplify the map by hiding all secondary metabolites and the pathsconnected to them
bull Show gene reaction rules Show the gene reaction rules below the reaction labels even gene data is not loaded
bull Hide reaction gene and metabolite labels Another option to visually simplify the map this will hide alllabels that are not text annotations
bull Allow duplicate reactions By default duplicate reactions are hidden in the add reaction dropdown menuHowever you can turn this option on to show the duplicate reactions
bull Highlight reactions not in model Highlight in red any reactions that are on the map but are not in the modelThis is useful when you are adapting a map from one model for use with another model
71 Getting started 25
Escher Documentation Release 143
Reaction data settings
When reaction or gene data is loaded this section can be used to change visual settings for reactions
The color bar has individual control points and you can drag the control points (execpt min and max) left and right tochange their values Alternatively you can use the dropdown menu (next to the word median in the figure above) toattach a control point to a statistical measure (mean median first quartile (Q1) or third quartile (Q3)) This lets youchoose a color scale that will adapt to your dataset
For each control point you can choose a color by entering a CSS-style color (eg red ff0000 rgba(20 20 255 05)and you can choose a size that will scale the thickness of reactions
There are also color and size options for reactions that do not have any data value
Finally there are a few onoff settings for the loaded reaction or gene dataset
bull Options These determine how to visualize the datasets Check Absolute value to color and size reactions bythe absolute value of each data value The Size Color and Text options can be unselected to turn off sizingcoloring and data values in reaction labels individually
bull Comparison Determines the comparison algorithm to use when two datasets are loaded
bull Method for evaluating AND Determines the method that will be used to reconcile AND statements in genereaction rules when there is gene data loaded See Gene data and gene reaction rules for more details
Metabolite data settings
The data settings for metabolite data are analagous to those for reaction data The only difference is that size nowrefers to the size of the metabolite circles
26 Chapter 7 Contents
Escher Documentation Release 143
72 Escher COBRA and COBRApy
Escher can be used as an independent application but it draws heavily on the information in COBRA models ACOBRA model is a collection of all the reactions metabolites and genes known to exist in an organism (In theliterature these are generally called genome-scale models (GEMs) but we refer to them as COBRA models here toemphasize that Escher interoperates with models that are exported from COBRApy)
By loading a COBRA model into the Escher interface you have access to every reaction and metabolite in that modelYou also have the gene reaction rules for the reactions in the network which allow you to connect gene data toreactions and metabolites
COBRApy is a software package for COBRA modeling written in Python The Escher Python package uses CO-BRApy package for reading and writing COBRA models
721 Maps and models
In Escher you will see references to maps and models
A map contains the reactions and metabolites that you see in the Escher builder including their locations text annota-tions and the canvas
A model (a COBRA model) contains reactions and metabolites that you have not drawn yet Thus you can load aCOBRA model when you want to draw new reactions on the map
722 What is JSON and why do we use it
Both Escher maps and COBRA models are stored as JSON files JSON is a useful plain-text format for storing nesteddata structures We use JSON much like the SBML community uses XML You may notice that SBML files have axml extension and Escher maps and COBRA models have a json extension
You can use Python to explore a JSON file like this
import json
with open(mapjson r) as fmap_object = jsonload(f)
print map_object[0]print map_object[1][reactions]values()[0]
723 Escher SBML and SBGN
A tool has been developed for converting Escher maps to SBML Layout and SBGN and it will be released soon
COBRA models can be converted to SBML using COBRApy
73 Run Escher locally and in IPython
To run Escher on a local computer or to use Escher in PythonIPython first install it The Python package for Eschercan be installed using pip
pip install escher
72 Escher COBRA and COBRApy 27
Escher Documentation Release 143
Depending on your installation of Python you may need sudo
sudo pip install escher
Alternatively one can download the source files and install the package directly
python setuppy install
731 Escher in the IPython Notebook
Once you have installed Escher locally you can interact with Escher maps in an IPython Notebook
Here are example notebooks to get started with
bull COBRApy and Escher
bull JavaScript development and offline maps
bull Generate JSON models in COBRApy
Dependencies
bull Jinja2
bull Tornado
bull COBRApy 030 or later
732 Running the local server
You can run your own local server if you want to use Escher offline or explore your own maps with the homepagebrowser To get started install the Python package and run from any directory by calling
python -m escherserver
This starts a server at httplocalhost7778 You can also choose another port
python -m escherserver --port=8005
74 Validate and convert maps
741 Validate an Escher map
Escher maps follow a specification using the JSON Schema format Therefore any JSON Schema validator can beused to validate an Escher map by comparing it to the latest schema file For example the current schema is locatedhere
httpsgithubcomzakandrewkingescherblobmasterescherjsonschema1-0-0
To make this easier the Escher Python package includes a validation script To validate a map first install Escher
pip install escher
Then call the validator
python -m eschervalidate my_mapjson
Any errors in the map will print to the console
28 Chapter 7 Contents
Escher Documentation Release 143
742 Convert or upgrade an Escher map
Any Escher maps built with pre-release versions of Escher will not load right away in the stable v10 release Toconvert pre-release maps to the new format follow these steps
1 Install Escher
pip install escher
2 Find a COBRA model for your maps This COBRA model will be used to update the content of the mapin order to support all the new Escher features You can use a COBRA model encoded as SBML or JSON(generated with COBRApy v030b4 or later) The COBRA models currently available on the Escher websitecan be downloaded from the BiGG Models website
httpbiggucsdedu
For a refresher on the distinction between Escher maps COBRA models and their file types (SBML JSONSBML Layout) see Escher COBRA and COBRApy
3 Run the convert_map script to convert your existing Escher map (my_old_mapjson) to the new formatusing a COBRA model (model_filejson or model_filexml in these examples)
With a JSON file modelpython -m escherconvert_map my_old_mapjson pathtomodel_filejson
With an SBML modelpython -m escherconvert_map my_old_mapjson pathtomodel_filexml
Those commands will generate a new map called my_old_map_convertedjson that will load in Escher v10and later
75 Building and contributing maps
We are excited to collect pathway maps for every organism with a well characterized metabolic network This sectiondescribes the process of building a new map either from scratch or using a COBRA model with BiGG IDs
751 Building from scratch
To build a map from scratch you will first need a COBRA model for your map See the section Escher COBRA andCOBRApy for some background information on COBRA models
If you would like to eventually contribute your map to the Escher website it is important that your COBRA modeladheres to the identifiers in the BiGG Database Escher and BiGG are being developed together and we want tomaintain consistency and interoperability between them
Once you have a COBRA model you can follow these steps
1 Load your model in the Escher Builder
2 Begin building new reactions If you are familiar with the genes in your organism then try search for newreactions by their gene IDs
3 Limit each map to ~200 reactions Maps larger than this will slow down the Escher viewer especially on oldbrowsers Rather than building one giant map Escher is designed for building many smaller subsystem maps
4 When you have built a map for your a subsystem save the map as JSON with a name that includes the modelID followed by a period followed by the name of the subsystem For example
75 Building and contributing maps 29
Escher Documentation Release 143
iMM904Amino acid biosynthesisjson
5 (Optional) Once you have a set of subsystem maps you can set up a local Escher server so that subsystem mapsappear in the ldquoquick jumprdquo menu in the bottom right corner of the screen (as seen here for iJO1366) To setthis up you will need to start a local server as describe in Running the local server Next find your local cachedirectory by running this command in a terminal
python -c import escher print(escherget_cache_dir(name=maps))
This will print the location of the local maps cache Add your new subsystem maps to cache folder Now whenyou run the server (described in Running the local server) you should see that quick jump menu appear
NOTE The cache directory is organized into folders for organisms You can use these folder for filtering byorganism on the local launch page or you can place the maps in the top directory
NOTE 2 A similar approach can be used to access your models from the local launch page Place maps in thefolder indicated by
python -c import escher print(escherget_cache_dir(name=models))
752 Building from an existing map for a similar organism
Follow the instruction above except rather than starting from scratch load an existing Escher map for a differentorganism
Once you have the new model loaded use the Update names and gene reaction rules using model button in theModel menu to convert all descriptive names and gene reaction rules in the model to those in the map Reactions thatdo not match the model will be highlighted in red (This can be turned off again in the settings menu by deselectingHighlight reactions not in model)
Now visit each highlighted reaction and see if you can replace it with an equivalent biochemical pathway from themodel If not then delete the reaction and move on
Finally when there are no highlighted reactions left you can repeat this for other subsystems
753 Submitting maps to the Escher website
If you would like to contribute maps to Escher you can make a Pull Request to the GitHub repository eschergithubioMake sure there is a folder with the name of the organism in 1-0-0maps For example a new yeast map goes inthe folder
1-0-0mapsSaccharomyces cerevisiae
Then name your map by concatenating the model ID and the map name separated by a period For example a yeastmap built with the genome-scale model iMM904 could be named
iMM904Amino acid biosynthesisjson
Then add the JSON file for the model to the Pull Request if that model is not already available As before make afolder for your organism within 1-0-0models The model filename is just the model ID
In this example a correct Pull Request would include the following files
1-0-0mapsSaccharomyces cerevisiaeiMM904Amino acid biosynthesisjson1-0-0modelsSaccharomyces cerevisiaeiMM904json
30 Chapter 7 Contents
Escher Documentation Release 143
76 Developing with Escher
761 Using the static JavaScript and CSS files
You can include the compiled Escher JavaScript and CSS files in any HTML document The only dependencies ared3js and optionally Twitter Bootstrap if you are using the option menu=rsquoallrsquo
The compiled files are available form npmcdn
httpsnpmcdncomescher-visjsdistescherjshttpsnpmcdncomescher-visjsdistescherminjshttpsnpmcdncomescher-viscssdistbuildercsshttpsnpmcdncomescher-viscssdistbuildermincss
Source maps are also hosted there
httpsnpmcdncomescher-visjsdistescherjsmaphttpsnpmcdncomescher-visjsdistescherminjsmaphttpsnpmcdncomescher-viscssdistbuildermincssmap
If you want a particular version of escher add a version tag like this
httpsnpmcdncomescher-vis140-beta3jsdistescherjs
For an example of the boilerplate code that is required to begin developing with Escher have a look at the escher-demorepository For projects built with npm use the escher-test repository as a guide
762 Building and testing Escher
First install dependencies with npm
npm install
Escher uses grunt to manage the build process To run typical build steps just run
npm run compile
To test the JavaScript files run
npm run test
For Python testing run this in the py directory
python setuppy test
Build the static website
python setuppy build_gh
Clear static website files
python setuppy clean
Build and run the docs
cd docsmake htmlcd _buildhtml
76 Developing with Escher 31
Escher Documentation Release 143
python -m SimpleHTTPServer python 2python -m httpserver python 3
763 Generating and reading Escher and COBRA files
The Escher file format
Escher layouts are defined by JSON files that follow a specific schema using json schema The latest schemafor Escher JSON files is here The Escher schemas are versioned with inspiration from SchemaVer Theeschervalidate module can be used to validate models against the schema
The Escher layout schema is designed to be as simple as possible For example the core metabolism map of Es-cherichia coli is layed out like this
[
map_name E coli coreCore metabolismmap_id 2938hoq32a1map_description E coli core metabolic networknLast Modified Fri Dec 05 2014 163944 GMT-0800 (PST)homepage httpseschergithubioschema httpseschergithubioescherjsonschema1-0-0
reactions nodes text_label canvas
x 7857062530517567y 31436893920898433width 5894515691375733height 4860457037353515
]
The map_name includes the model that was used to build this layout followed by a period and then a readable namefor the map The map_id is a unique identifier for this map The map_description describes the map and thelast time it was modified Both the homepage and the schema entries must have exactly these values for the Eschermap to be valid
In the next section the reactions nodes labels and canvas are all defined For reactions nodes and text labels eachelement has a key that is an arbitrary integer As long as there are no repeated IDs (eg no 2 segments with the ID517) then everything should work fine
Read through the schema (here) for more detail on the format
The COBRA file format
COBRA models are also saved as JSON files This format has not been documented with a schema but you canbrowse through the core metabolism model as a guide to generating valid COBRA models
I still need help
If you are interested in developing with Escher and you need more information than what is provided in the documen-tation please contact Zachary King (zaking-AT-ucsd-DOT-edu)
32 Chapter 7 Contents
Escher Documentation Release 143
77 EscherConverter
EscherConverter is a standalone program that reads files created with the graphical network editor Escher and convertsthem to files in community standard formats
Download EscherConverter 05 (137 MB)
771 Using EscherConverter
Escher uses a JSON file format to represent its networks This format has been developed because of its very small filesize and its compatibility to online programs that are written in JavaScript In particular JSON is a JavaScript ObjectNotation or in other words a JSON file directly represents components of JavaScript programs This makes parsingvery simple and allows direct use of those files in web-based programs
However in systems biology specific file formats have been developed with the aim to be easily exchangeable betweensoftware implemented in diverse programming languages
To this end these formats support semantically clear annotations and are maintained by a large community of scientistsEscherConverter supports export to two particularly important XML-based community file formats SBML with layoutextension and SBGN-ML
While SBML has been mainly developed for dynamic simulation of biological networks it is nowadays also usablefor diverse other purposes Its layout extension facilitates the encoding the display of biological networks
SBGN-ML has been directly developed as a language for the display of biological pathway maps of diverse kinds Itstores the position and connection of entities similar to what is shown in Escher networks
EscherConverter takes Escherrsquos JSON files as input and generates equivalent SBML Level 3 Version 1 files with layoutextension or SBGN-ML files
In order to ensure that the conversion is correct EscherConverter provides its own display that gives users a previewof how the export data format will be rendered by other tools In this preview display you can zoom in and out movearcs and node positions However it is important to know that none of the changes made in this preview are stored inthe export file
Download and Installation
You can obtain local copy of EscherConverter by clicking here
As a Javatrade application no specific installation is required for EscherConverter
However make sure you have a recent Javatrade Runtime Environment (JRE) installed on your computer (at least JRE8) You can obtain Javatrade from the Oracle website There you can also find installation instructions for your respectiveoperating system
Once Javatrade has been installed you can simply place the EscherConverter JAR file somewhere on your local computerfor instance in the folder
bull Applications if you are working under Mac OS
77 EscherConverter 33
Escher Documentation Release 143
bull opt for Linux computers
bull CProgram Files if you are using Windows
Launching the program
You can launch EscherConverter simply by double-clicking on the application JAR file This will open a followinggraphical user interface as described in the following figures
Figure 1 | The graphical user interface of EscherConverter
bull Preferences opens a settings dialog (see next screenshot)
bull Open displays a file chooser to select an input file in JSON format
bull Save export the map that is displayed in the current tab to SBML or SBGN-ML
bull Discard closes the current tab without saving
bull Help opens the online help that displays all command-line options
bull License displays the license under which this software is distributed
bull About shows information about the authors of this software
bull Main the main panel of the software in which converted Escher maps will be displayed organized in tabs
bull Status the status bar shows information and logging messages during the conversion
34 Chapter 7 Contents
Escher Documentation Release 143
Figure 2 | The preferences dialog All settings in this dialog are also available through EscherConverterrsquos command-line interface
Layout section several properties that are required in SBML and SBGN-ML are not explicitly specified in EscherrsquosJSON format and therefore need to be adjusted by the user These are the size of the drawing canvas the default boxsize for text labels the size of primary and secondary nodes In contrast to SBGN-ML and Escherrsquos JSON formatthe SBML layout extension supports three-dimensional displays When selecting this export file format it is thereforenecessary to also define the z-coordinate and the depth of all objects
Components and naming section Most settings in this section are specific for the SBML layout extension and areonly active if this output format is selected These are names and identifiers of the layout component and the in caseof SBML mandatory default compartment (a compartment without physical meaning a reaction space in which allmetabolites are located) EscherConverter can infer compartment bounds from metabolites but this is an experimentalfeature Just try it and see how the preview changes
77 EscherConverter 35
Escher Documentation Release 143
Figure 3 | A layout preview
The birds-eye view and the navigation component on the left help you navigate through the network display Thisgraph shows you how the converted pathway map will be rendered by software that supports SBGN-ML or the SBMLlayout extension This preview can be modified by moving arcs or nodes however none of those changes are storedwhen exporting the file In this current version EscherConver only exports layouts as given in the original JSON file
Included third-party software
EscherConverter includes several third-party libraries which we here list and acknowledge
bull ArgParser
bull JSBML
bull libSBGN
bull Pixel-Mixer icons
bull yFiles
772 Command-line interface API
You can launch EscherConverter from the command-line On a Unix system (such as Linux MacOS or Solaris etc)use a command like
bash$ java -jar -Xms8G -Xmx8G -Duserlanguage=en EscherConverter-05jar [options]
Under Window use a command like
Cgt javaw -jar -Xms8G -Xmx8G -Duserlanguage=en EscherConverter-05jar [options]
Escher has a large collection of command-line options (see below) which can be useful if you want to launch theprogram with specific settings or if multiple files are to be converted in a batch mode It is even possible to completelydisable the graphical user interface
36 Chapter 7 Contents
Escher Documentation Release 143
Input and output files
Definition of input and output data files as well as the format for the output
--input=ltFilegt
Specifies the JSON input file If a directory is given the conversion will be recursively performed Accepts JSON
--output=ltFilegt
The path to the file into which the output should be written If the input is a directory this must also be a directory inorder to perform a recursive conversion Accepts SBML SBGN
Escher layout
The options in this group allow you to influence how large certain elements should be displayed
--canvas-default-height=ltDoublegt
Just as in the case of the width of the canvas this value needs to be specified for cases where the JSON input file lacksan explicit specification of the canvas height Arguments must fit into the range [11E9] (Default value 2500)
--canvas-default-width=ltDoublegt
This value is used when no width has been defined for the canvas Since the width attribute is mandatory for the layouta default value must be provided in these cases Arguments must fit into the range [11E9] (Default value 2500)
--label-height=ltDoublegt
With this option you can specify the height of the bounding box of text labels Arguments must fit into the range[11E9] (Default value 500)
--label-width=ltDoublegt
This option defines the width of bounding boxes for text labels Arguments must fit into the range [11E9] (Defaultvalue 1600)
--node-depth=ltDoublegt
The length of nodes along z-coordinate Escher maps are actually two-dimensional but in general a layout can bethree-dimensional This value should be an arbitrary value greater than zero because some rendering engines mightnot display the node if its depth is zero Arguments must fit into the range [11E9] (Default value 10)
--node-label-height=ltDoublegt
Node labels can have a size different from general labels in the graph Here you can specify how height the boundingbox of the labels for nodes should be Arguments must fit into the range [11E9] (Default value 200)
--primary-node-height=ltDoublegt
The primary node should be bigger than the secondary node With this option you can specify the height of this typeof nodes Arguments must fit into the range [11E9] (Default value 300)
--primary-node-width=ltDoublegt
Escher maps distinguish between primary and secondary nodes Primary nodes should be larger than secondary nodesand display the main flow of matter through the network This option allows you to specify the width of primarynodes Arguments must fit into the range [11E9] (Default value 300)
77 EscherConverter 37
Escher Documentation Release 143
--reaction-label-height=ltDoublegt
Reaction label heightArguments must fit into the range [11E9] (Default value 300)
--reaction-node-ratio=ltDoublegt
This value is used as a conversion factor to determine the size of the reaction display box depending on the size ofprimary nodes Height and width of reaction nodes are determined by dividing the corresponding values from theprimary node size by this factor Arguments must fit into the range [01] (Default value 05)
--secondary-node-ratio=ltDoublegt
Similar to the reaction node ratio the size of secondary nodes (width and height) is determined by dividing thecorresponding values from the primary nodes by this value Arguments must fit into the range [01] (Default value06666666666666666)
--z=ltDoublegt
The position on the z-axis where the entire two-dimensional graph should be drawn Arguments must fit into the range[-1E91E9] (Default value 00)
Escher Components and their naming
Here you can influence which elements are to be included in the layout and how elements in the layout are to be calledor identified
--format=ltOutputFormatgt
The desired format for the conversion eg SBML All possible values for type ltOutputFormatgt are SBGN andSBML (Default value SBML)
--layout-id=ltStringgt
In contrast to the name this identifier does not have to be human-readable This is a machine identifier which muststart with a letter or underscore and can only contain ASCII characters (Default value Escher_Layout)
--layout-name=ltStringgt
This should be a human-readable name for the layout that is to be created This name might be displayed to describethe figure and should therefore be explanatory (Default value Escher Layout)
--compartment-id=ltStringgt
A compartment needs to have a unique identifier which needs to be a machine-readable Sting that must start with aletter or underscore and can only contain ASCII characters Since the JSON file does not provide this information thisoption allows you to specify the required identifier (Default value default)
--compartment-name=ltStringgt
With this option it is possible to define a name for the default compartment can be that needs to be generated for theconversion to SBML The name does not have any restrictions ie any UTF-8 character can be used (Default valueDefault compartment)
--infer-compartment-bounds
This converter can infer where the boundaries of compartments could be drawn To this end it uses each nodersquos BiGGids to identify the compartment of all metabolites Assuming that compartments have rectangular shapes the algorithmcan find the outermost node on each side of the box and hence obtain the boundaries of the compartment However
38 Chapter 7 Contents
Escher Documentation Release 143
this methods will fail when metabolites are drawn inside of such a box that belong to a different compartment that isactually further outside For this reason this option is deactivated by default (Default value false)
Options for the graphical user interface
--gui
If this option is given the program will display its graphical user interface (Default value false)
--log-level=ltStringgt
Change the log-level of this application This option will influence how fine-grained error and other log messages willbe that you receive while executing this program All possible values for type ltStringgt are ALL CONFIG FINEFINER FINEST INFO OFF SEVERE and WARNING (Default value INFO)
--log-file=ltFilegt
This option allows you to specify a log file to which all information of the program will be written Accepts (bp2bp3 log owl xml)
78 JavaScript API
class escherBuilder(map_data model_data embedded_css selection options)A Builder object contains all the UI and logic to generate a map builder or viewer
Arguments
bull map_data (object) ndash The data for a map to be passed to escherMapfrom_data() Ifnull then an empty Builder is initialized
bull model_data (object) ndash The data for a cobra model to be passed to es-cherCobraModel() Can be null
bull embedded_css (string) ndash The stylesheet for the SVG elements in the Escher map
bull selection (object) ndash (Optional Default In the body element) The d3 selection of anelement to place the Builder into The selection cannot be inside an SVG element
bull options (object) ndash (Optional) An object defining any of the following options
optionsmenu(Default rsquoallrsquo) The type of menu that will be displayed Can be lsquoallrsquo for the fullmenu or lsquozoomrsquo for just zoom buttons The lsquoallrsquo option requires the full set of Escherdependencies (D3js JQuery and Bootstrap) while the lsquozoomrsquo option requires only D3jsFor more details see Developing with Escher
optionsscroll_behavior(Default rsquopanrsquo) This option determines the effect that the scroll wheel will have onan Escher map Can be lsquopanrsquo to pan the map or lsquozoomrsquo to zoom the map when the usermoves the scroll wheel
optionsuse_3d_transform(Default Chooses a good option by testing the browser) If true then use CSS3 3D trans-forms to speed up panning and zooming This feature will only work on browsers thatsupport the 3D transforms It works best in the latest versions of Chrome Firefox andInternet Explorer Safari works better with this turned off
78 JavaScript API 39
Escher Documentation Release 143
optionsenable_editing(Default true) If true then display the map editing functions If false then hide themand only allow the user to view the map
optionenable_keys(Default true) If true then enable keyboard shortcuts
optionsenable_search(Default true) If true then enable indexing of the map for search Use false to disablesearching and potentially improve the map performance
optionsfill_screen(Default false) Use true to fill the screen when an Escher Builder is placed in a top-level container (eg a div in the body element)
optionsfull_screen_button(Default false) Include a button in the user interface for entering full screen mode
optionsignore_bootstrap(Default false) Do not use Bootstrap for buttons even if it available This is used toembed Escher in a Jupyter notebook where it conflicts with the Jupyter Boostrap installa-tion
Map model and styles
optionsstarting_reaction(Default null) The ID (as a string) of a reaction to draw when the Builder loads
optionsnever_ask_before_quit(Default false) If false then display a warning before the user closes an Eschermap If true then never display the warning This options is only respected if op-tionsenable_editing == true If enable_editing is false then the warnings are not dis-played
optionsunique_map_id(Default null) A unique ID that will be used to UI elements donrsquot interfere whenmultiple maps are in the same HTML document
optionsprimary_metabolite_radius(Default 15) The radius of primary metabolites in px
optionssecondary_metabolite_radius(Default 10) The radius of secondary metabolites in px
optionsmarker_radius(Default 5) The radius of marker nodes in px
optionsgene_font_size(Default 18) The font size of the gene reaction rules in px
optionshide_secondary_metabolites(Default false) If true then secondary nodes and segments are hidden This is conve-nient for generating simplified map figures
optionsshow_gene_reaction_rules(Default false) If true then show the gene reaction rules even without gene data
optionshide_all_labels(Default false) If checked hide all reaction gene and metabolite labels
Applied data
40 Chapter 7 Contents
Escher Documentation Release 143
optionsreaction_data(Default null) An object with reaction ids for keys and reaction data points for values
optionsreaction_stylesDefault [rsquocolorrsquo rsquosizersquo rsquotextrsquo]
An array of style types The array can contain any of the following lsquocolorrsquo lsquosizersquo lsquotextrsquolsquoabsrsquo The lsquocolorrsquo style means that the reactions will be colored according to the loadeddataset The lsquosizersquo style means that the reactions will be sized according to the loadeddataset The lsquotextrsquo style means that the data values will be displayed in the reactionlabels The lsquoabsrsquo style means the the absolute values of reaction values will be used fordata visualization
optionsreaction_compare_style(Default rsquodiffrsquo) How to compare to datasets Can be either lsquofold lsquolog2_foldrsquo orlsquodiffrsquo
optionsreaction_scaleDefault
[ type min color c8c8c8 size 12 type median color 9696ff size 20 type max color ff0000 size 25 ]
An array of objects that define points on the data scale
Each point is an object with a type attribute Types can be lsquominrsquo lsquomaxrsquo lsquomeanrsquo lsquoQ1rsquo (firstquartile) lsquomedianrsquo lsquoQ3rsquo (third quartile) or lsquovaluersquo Each point can have a color attributethat specifies a color with a string (any CSS color specification is allowed including hexrgb and rgba) Each point can have a size attirbute that specifies a reaction thickness as anumber Finally points with type lsquovaluersquo can have a value attribute that specifies an exactnumber for pont in the scale
NOTE If lsquominrsquo or lsquomaxrsquo is not provided Escher automatically adds them To be com-pletely clear about what you expect to see on the map it is best to provide lsquominrsquo andlsquomaxrsquo in addition to other scale points
Here are examples of each type
type rsquominrsquo color rsquoredrsquo size 12 Specifies that reactionsnear the minimum value are red and have thickness 12
type rsquoQ1rsquo color rsquorgba(100 100 50 05)rsquo size 12 Specifies that reactions near the first quartile have the given color opacity andthickness
type rsquomeanrsquo color rsquorgb(100 100 50)rsquo size 50 Specifies that reactions near the mean value have the given color and thickness
type rsquovaluersquo value 85 color rsquo333rsquo size 50 Specifies that reactions near 85 value have the given color and size
optionsreaction_no_data_color(Default rsquodcdcdcrsquo) The color of reactions with no data value
optionsreaction_no_data_size(Default 8) The size of reactions with no data value
optionsgene_data(Default null) An object with Gene ids for keys and gene data points for values
78 JavaScript API 41
Escher Documentation Release 143
optionsand_method_in_gene_reaction_rule(Default mean) When evaluating a gene reaction rule use this function to evaluate ANDrules Can be lsquomeanrsquo or lsquominrsquo
optionsmetabolite_data(Default null) An object with metabolite ids for keys and metabolite data points forvalues
optionsmetabolite_stylesDefault [rsquocolorrsquo rsquosizersquo rsquotextrsquo]
An array of style types The array can contain any of the following lsquocolorrsquo lsquosizersquo lsquotextrsquolsquoabsrsquo The lsquocolorrsquo style means that the metabolites will be colored according to the loadeddataset The lsquosizersquo style means that the metabolites will be sized according to the loadeddataset The lsquotextrsquo style means that the data values will be displayed in the metabolitelabels The lsquoabsrsquo style means the the absolute values of metabolite values will be used fordata visualization
optionsmetabolite_compare_style(Default rsquodiffrsquo) How to compare to datasets Can be either lsquofoldrsquo lsquolog2_foldrsquo orlsquodiffrsquo
optionsmetabolite_scaleDefault
[ type min color fffaf0 size 20 type median color f1c470 size 30 type max color 800000 size 40 ]
An array of objects that define points on the data scale See the description of op-tionsreaction_scale for an explanation of the format
optionsmetabolite_no_data_color(Default rsquoffffffrsquo) The color of metabolites with no data value
optionsmetabolite_no_data_size(Default 10) The size of metabolites with no data value
View and build options
optionsidentifiers_on_map(Default rsquobigg_idrsquo) The identifiers that will be displayed in reaction metabolite andgene labels Can be lsquobigg_idrsquo or lsquonamersquo
optionshighlight_missing(Default false) If true then highlight in red reactions that are not in the loaded COBRAmodel
optionsallow_building_duplicate_reactions(Default true) If true then building duplicate reactions is allowed If false then dupli-cate reactions are hidden in Add reaction mode
optionscofactors(Default [rsquoatprsquo rsquoadprsquo rsquonadrsquo rsquonadhrsquo rsquonadprsquo rsquonadphrsquorsquogtprsquo rsquogdprsquo rsquohrsquo rsquocoarsquo rsquoumprsquo rsquoh20rsquo rsquoppirsquo]) A list of metabo-lite IDs to treat as cofactors These will be secondary metabolites in new reactions
Callbacks
optionsfirst_load_callbackA function to run after loading the Builder
42 Chapter 7 Contents
Escher Documentation Release 143
load_map(map_data[ should_update_data])Load a map for the loaded data Also reloads most of the Builder content
Arguments
bull map_data ndash The data for a map
bull should_update_data (Boolean) ndash (Default true) Whether data should be ap-plied to the map
load_model(model_data[ should_update_data])Load the cobra model from model data
Arguments
bull model_data ndash The data for a Cobra model (Parsing in done by escherCobraModel)
bull should_update_data (Boolean) ndash (Default true) Whether data should be ap-plied to the model
view_mode()Enter view mode
build_mode()Enter build mode
brush_mode()Enter brush mode
zoom_mode()Enter zoom mode
rotate_mode()Enter rotate mode
text_mode()Enter text mode
set_reaction_data(data)
Arguments
bull data (array) ndash An array of 1 or 2 objects where each object has keys that are reactionIDrsquos and values that are data points (numbers)
set_metabolite_data(data)
Arguments
bull data (array) ndash An array of 1 or 2 objects where each object has keys that are metaboliteIDrsquos and values that are data points (numbers)
set_gene_data(data clear_gene_reaction_rules)
Arguments
bull data (array) ndash An array of 1 or 2 objects where each object has keys that are gene IDrsquosand values that are data points (numbers)
Arguments
bull clear_gene_reaction_rules (Boolean) ndash (Optional Default false) In addi-tion to setting the data also turn of the gene_reaction_rules
78 JavaScript API 43
Escher Documentation Release 143
79 Python API
class escherBuilder(map_name=None map_json=None model=None model_name=Nonemodel_json=None embedded_css=None reaction_data=None metabo-lite_data=None gene_data=None local_host=None id=None safe=Falsekwargs)
A metabolic map that can be viewed edited and used to visualize data
This map will also show metabolic fluxes passed in during consruction It can be viewed as a standalone htmlinside a browswer Alternately the respresentation inside an IPython notebook will also display the map
Maps are stored in json files and are stored in a cache directory Maps which are not found will be downloadedfrom a map repository if found
Parameters
bull map_name ndash A string specifying a map to be downloaded from the Escher web server orloaded from the cache
bull map_json ndash A JSON string or a file path to a JSON file or a URL specifying a JSON fileto be downloaded
bull model ndash A Cobra model
bull model_name ndash A string specifying a model to be downloaded from the Escher web serveror loaded from the cache
bull model_json ndash A JSON string or a file path to a JSON file or a URL specifying a JSONfile to be downloaded
bull embedded_css ndash The CSS (as a string) to be embedded with the Escher SVG
bull reaction_data ndash A dictionary with keys that correspond to reaction ids and values thatwill be mapped to reaction arrows and labels
bull metabolite_data ndash A dictionary with keys that correspond to metabolite ids and valuesthat will be mapped to metabolite nodes and labels
bull gene_data ndash A dictionary with keys that correspond to gene ids and values that will bemapped to corresponding reactions
bull local_host ndash A hostname that will be used for any local files This is generally usedfor using the notebook offline and for testing in the IPython Notebook with modified Eschercode An example value for local_host is lsquohttplocalhost7778lsquo
bull id ndash Specify an id to make the javascript data definitions unique A random id is chosen bydefault
bull safe ndash If True then loading files from the filesytem is not allowed This is to ensure thesafety of using Builder within a web server
Keyword Arguments
These are defined in the Javascript API
bulluse_3d_transform
bullenable_search
bullfill_screen
bullzoom_to_element
bullfull_screen_button
44 Chapter 7 Contents
Escher Documentation Release 143
bullstarting_reaction
bullunique_map_id
bullprimary_metabolite_radius
bullsecondary_metabolite_radius
bullmarker_radius
bullgene_font_size
bullhide_secondary_metabolites
bullshow_gene_reaction_rules
bullhide_all_labels
bullreaction_styles
bullreaction_compare_style
bullreaction_scale
bullreaction_no_data_color
bullreaction_no_data_size
bulland_method_in_gene_reaction_rule
bullmetabolite_styles
bullmetabolite_compare_style
bullmetabolite_scale
bullmetabolite_no_data_color
bullmetabolite_no_data_size
bullidentifiers_on_map
bullhighlight_missing
bullallow_building_duplicate_reactions
bullcofactors
All keyword arguments can also be set on an existing Builder object using setter functions eg
my_builderset_reaction_styles(new_styles)
display_in_browser(ip=lsquo127001rsquo port=7655 n_retries=50 js_source=rsquowebrsquo menu=rsquoallrsquoscroll_behavior=rsquopanrsquo enable_editing=True enable_keys=True mini-fied_js=True never_ask_before_quit=False)
Launch a web browser to view the map
Parameters
bull ip ndash The IP address to serve the map on
bull port ndash The port to serve the map on If specified the port is occupied then a random freeport will be used
bull n_retries (int) ndash The number of times the server will try to find a port before quitting
bull js_source (string) ndash Can be one of the following
ndash web (Default) - Use JavaScript files from eschergithubio
79 Python API 45
Escher Documentation Release 143
ndash local - Use compiled JavaScript files in the local Escher installation Works offline
ndash dev - No longer necessary with source maps This now gives the same behavior aslsquolocalrsquo
bull menu (string) ndash Menu bar options include
ndash none - No menu or buttons
ndash zoom - Just zoom buttons
ndash all (Default) - Menu and button bar (requires Bootstrap)
bull scroll_behavior (string) ndash Scroll behavior options
ndash pan - Pan the map
ndash zoom - Zoom the map
ndash none (Default) - No scroll events
bull enable_editing (Boolean) ndash Enable the map editing modes
bull enable_keys (Boolean) ndash Enable keyboard shortcuts
bull minified_js (Boolean) ndash If True use the minified version of JavaScript and CSSfiles
bull never_ask_before_quit (Boolean) ndash Never display an alert asking if you wantto leave the page By default this message is displayed if enable_editing is True
display_in_notebook(js_source=rsquowebrsquo menu=rsquozoomrsquo scroll_behavior=rsquononersquo mini-fied_js=True height=500 enable_editing=False)
Embed the Map within the current IPython Notebook
Parameters
bull js_source (string) ndash Can be one of the following
ndash web (Default) - Use JavaScript files from eschergithubio
ndash local - Use compiled JavaScript files in the local Escher installation Works offline
ndash dev - No longer necessary with source maps This now gives the same behav-ior as lsquolocalrsquo
bull menu (string) ndash Menu bar options include
ndash none - No menu or buttons
ndash zoom - Just zoom buttons
ndash Note The all menu option does not work in an IPython notebook
bull scroll_behavior (string) ndash Scroll behavior options
ndash pan - Pan the map
ndash zoom - Zoom the map
ndash none - (Default) No scroll events
bull minified_js (Boolean) ndash If True use the minified version of JavaScript andCSS files
bull height ndash Height of the HTML container
bull enable_editing (Boolean) ndash Enable the map editing modes
46 Chapter 7 Contents
Escher Documentation Release 143
save_html(filepath=None overwrite=False js_source=rsquowebrsquo protocol=rsquohttpsrsquo menu=rsquoallrsquoscroll_behavior=rsquopanrsquo enable_editing=True enable_keys=True minified_js=Truenever_ask_before_quit=False static_site_index_json=None)
Save an HTML file containing the map
Parameters
bull filepath (string) ndash The HTML file will be saved to this location Whenjs_source is lsquolocalrsquo then a new directory will be created with this name
bull overwrite (Boolean) ndash Overwrite existing files
bull js_source (string) ndash Can be one of the following
ndash web (Default) - Use JavaScript files from eschergithubio
ndash local - Use compiled JavaScript files in the local Escher installation Works of-fline To make the dependencies available to the downloaded file a new directorywill be made with the name specified by filepath
ndash dev - No longer necessary with source maps This now gives the same behav-ior as lsquolocalrsquo
bull protocol (string) ndash The protocol can be lsquohttprsquo lsquohttpsrsquo or None which indicatesa lsquoprotocol relative URLrsquo as in eschergithubio Ignored if source is local
bull menu (string) ndash Menu bar options include
ndash none - No menu or buttons
ndash zoom - Just zoom buttons
ndash all (Default) - Menu and button bar (requires Bootstrap)
bull scroll_behavior (string) ndash Scroll behavior options
ndash pan - Pan the map
ndash zoom - Zoom the map
ndash none (Default) - No scroll events
bull enable_editing (Boolean) ndash Enable the map editing modes
bull enable_keys (Boolean) ndash Enable keyboard shortcuts
bull minified_js (Boolean) ndash If True use the minified version of JavaScript andCSS files
bull height (number) ndash Height of the HTML container
bull never_ask_before_quit (Boolean) ndash Never display an alert asking if youwant to leave the page By default this message is displayed if enable_editing isTrue
bull static_site_index_json (string) ndash The index as a JSON string for thestatic site Use javascript to parse the URL options Used for generating static pages(see static_sitepy)
791 Cache
escherget_cache_dir(versioned=True name=None)Get the cache dir as a string and make the directory if it does not already exist
Parameters
79 Python API 47
Escher Documentation Release 143
bull versioned (Boolean) ndash Whether to return the versioned path in the cache Eschermaps for the latest version of Escher are found in the versioned directory (versioned= True) but maps for previous versions of Escher can be found by visiting the parentdirectory (versioned = False)
bull name (string) ndash An optional subdirectory within the cache If versioned is False thenname is ignored
escherclear_cache(different_cache_dir=None ask=True)Empty the contents of the cache directory including all versions of all maps and models
Parameters
bull different_cache_dir (string) ndash (Optional) The directory of another cacheThis is mainly for testing
bull ask (Boolean) ndash Whether to ask before deleting
escherlist_cached_maps()Return a list of all cached maps
escherlist_cached_models()Return a list of all cached models
escherlist_available_maps()Return a list of all maps available on the server
escherlist_available_models()Return a list of all models available on the server
710 License
Escher and EscherConverter are distributed under the MIT license
bull genindex
48 Chapter 7 Contents
Python Module Index
eescher 44
49
Escher Documentation Release 143
50 Python Module Index
Index
Bbrush_mode() (built-in function) 43build_mode() (built-in function) 43Builder (class in escher) 44
Cclear_cache() (in module escher) 48
Ddisplay_in_browser() (escherBuilder method) 45display_in_notebook() (escherBuilder method) 46
Eescher (module) 44escherBuilder() (class) 39
Gget_cache_dir() (in module escher) 47
Llist_available_maps() (in module escher) 48list_available_models() (in module escher) 48list_cached_maps() (in module escher) 48list_cached_models() (in module escher) 48load_map() (built-in function) 42load_model() (built-in function) 43
Ooptionenable_keys (option attribute) 40optionsallow_building_duplicate_reactions (options at-
tribute) 42optionsand_method_in_gene_reaction_rule (options at-
tribute) 41optionscofactors (options attribute) 42optionsenable_editing (options attribute) 39optionsenable_search (options attribute) 40optionsfill_screen (options attribute) 40optionsfirst_load_callback (options attribute) 42optionsfull_screen_button (options attribute) 40optionsgene_data (options attribute) 41
optionsgene_font_size (options attribute) 40optionshide_all_labels (options attribute) 40optionshide_secondary_metabolites (options attribute)
40optionshighlight_missing (options attribute) 42optionsidentifiers_on_map (options attribute) 42optionsignore_bootstrap (options attribute) 40optionsmarker_radius (options attribute) 40optionsmenu (options attribute) 39optionsmetabolite_compare_style (options attribute) 42optionsmetabolite_data (options attribute) 42optionsmetabolite_no_data_color (options attribute) 42optionsmetabolite_no_data_size (options attribute) 42optionsmetabolite_scale (options attribute) 42optionsmetabolite_styles (options attribute) 42optionsnever_ask_before_quit (options attribute) 40optionsprimary_metabolite_radius (options attribute) 40optionsreaction_compare_style (options attribute) 41optionsreaction_data (options attribute) 40optionsreaction_no_data_color (options attribute) 41optionsreaction_no_data_size (options attribute) 41optionsreaction_scale (options attribute) 41optionsreaction_styles (options attribute) 41optionsscroll_behavior (options attribute) 39optionssecondary_metabolite_radius (options attribute)
40optionsshow_gene_reaction_rules (options attribute) 40optionsstarting_reaction (options attribute) 40optionsunique_map_id (options attribute) 40optionsuse_3d_transform (options attribute) 39
Rrotate_mode() (built-in function) 43
Ssave_html() (escherBuilder method) 46set_gene_data() (built-in function) 43set_metabolite_data() (built-in function) 43set_reaction_data() (built-in function) 43
51
Escher Documentation Release 143
Ttext_mode() (built-in function) 43
Vview_mode() (built-in function) 43
Zzoom_mode() (built-in function) 43
52 Index
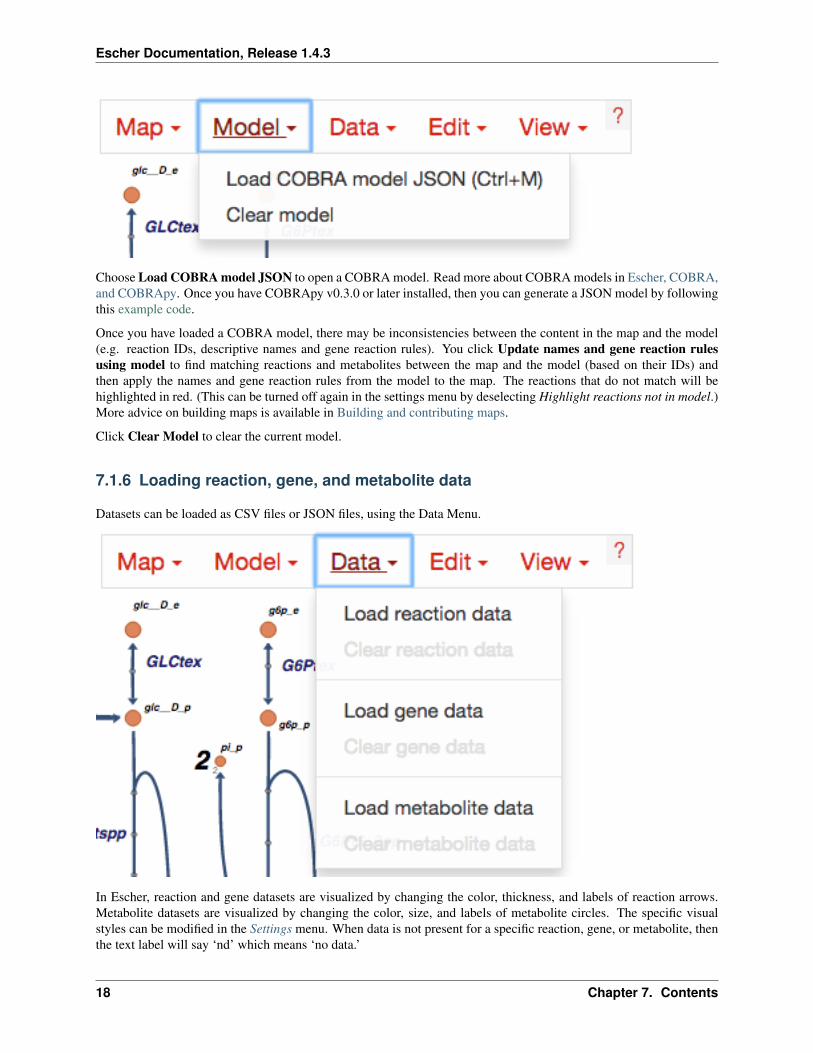
Escher Documentation Release 143
The structure of a CSV file
CSV files should have 1 header row 1 ID column and either 1 or 2 columns for data values The ID column cancontain BiGG IDs or descriptive names for the reactions metabolites or genes in the dataset Here is an example witha single data value columns
IDtime 0secglc__D_c54g6p__D_c23
Which might look like this is Excel
ID time 0secglc__D_c 54g6p_c 23
If two datasets are provided then the Escher map will display the difference between the datasets In the Settings menuthe Comparison setting allows you to choose between comparison functions (Fold Change Log2(Fold Change) andDifference) With two datasets the CSV file looks like this
ID time 0sec time 5sglc__D_c 54 102g6p_c 23 81
Data can also be loaded from a JSON file This Python code snippet provides an example of generating the properformat for single reaction data values and for reaction data comparisons
import json
save a single flux vector as JSONflux_dictionary = glc__D_c 54 g6p_c 23with open(outjson w) as f
jsondump(flux_dictionary f)
save a flux comparison as JSON
71 Getting started 19
Escher Documentation Release 143
flux_comp = [glc__D_c 54 g6p_c 23 glc__D_c 102 g6p_c 81]with open(out_compjson w) as f
jsondump(flux_comp f)
Gene data and gene reaction rules
Escher uses gene reaction rules to connect gene data to the reactions on a metabolic pathway You can see these genereaction rules on the map by selecting Show gene reaction rules in the Settings menu
Gene reaction rules show the genes whose gene products are required to catalyze a reaction Gene are connected usingAND and OR rules AND rules are used when two genes are required for enzymatic activity eg they are membersof a protein complex OR rules are used when either gene can catalyze the enzymatic activity eg they are isozymes
With OR rules Escher will take the sum of the data values for each gene With AND rules Escher will either takethe mean (the default) or the minimum of the components The AND behavior (mean vs minimum) is defined in theSettings menu
717 Editing and building
The Edit menu gives you access to function for editing the map
20 Chapter 7 Contents
Escher Documentation Release 143
Escher has five major modes and you can switch between those modes using the buttons in the Edit menu or usingthe buttons in the button bar on the left of the screen
1 Pan mode Drag the canvas to pan the map You can also use the mouse scroll wheel or trackpad scroll function(drag with 2 fingers) to pan the map (or to zoom if you selected Scroll to zoom in the settings)
2 Select mode Select nodes by clicking on them Shift-click to select multiple nodes or drag across the canvasto select multiple nodes using the selection brush
3 Add reaction mode If you have loaded a Model then click on the canvas to see a list of reactions that you candraw on the map Click on a node to see reactions that connect to that node In the input box you can search byreaction ID metabolite ID or gene ID (locus tag)
4 Rotate model Before entering rotate mode be sure to select one or more nodes in select mode Then afterentering rotate mode drag anywhere on the canvas to rotate the selection You can also drag the red crosshairsto change the center of the rotation
5 Text mode Use text mode to add text annotations to the map Click on the canvas to add a new text annotationor click an existing annotation to edit it When you are finished click Enter or Escape to save the changes
71 Getting started 21
Escher Documentation Release 143
In addition to the editing modes the Edit menu gives you access to the following commands
bull Delete Delete the currently selected node(s)
bull Undo Undo the last action NOTE Certain actions such as editing the canvas cannot be undone in the currentversion of Escher
bull Redo Redo the last action that was undone
bull Toggle primarysecondary node In Escher each metabolite node is either a primary node or a secondarynode Primary nodes are larger and secondary nodes can be hidden in the Settings menu Use this command totoggle the currently selected node(s) between primary and secondary
bull Rotate reactant locations When you draw a new reaction in Escher this command will rotate the new reactantsso that a new reactant is primary and centered This command is extremely useful when you are drawing a longpathway and you want to quickly switch which metabolite to ldquofollowrdquo eg make sure you are following thecarbon-containing metabolites
If you are confused then try drawing a new pathway and hitting the ldquocrdquo key to see the reactants rotate
bull Select all Select all nodes
bull Select none Unselect all nodes
bull Invert selection Select all the nodes that are currently unselected This feature is very useful when you wantto keep just one part of the map Simply drag to select the part you want to keep call the Invert selectioncommand then call the Delete command
718 Editing the canvas
A somewhat non-obvious feature of Escher is that you can edit the canvas by dragging the canvas edges This ispossible in Pan mode and Select mode
22 Chapter 7 Contents
Escher Documentation Release 143
719 View options
bull Zoom in Zoom in to the map
bull Zoom out Zoom out of the map
bull Zoom to nodes Zoom to see all the nodes on the map
bull Zoom to canvas Zoom to see the entire canvas
bull Find Search for a reaction metabolite or gene on the map
bull Show control points Show the control points you can drag these red and blue circle to adjust the shapes ofthe reactions curves
bull Settings Open the Settings menu
7110 The button bar
The button bar give you quick access to many of the common Escher functions
71 Getting started 23
Escher Documentation Release 143
24 Chapter 7 Contents
Escher Documentation Release 143
7111 Settings
View and build options
bull Identifiers Choose whether to show BiGG IDs or descriptive names for reactions metabolites and genes
bull Hide secondary metabolites This will simplify the map by hiding all secondary metabolites and the pathsconnected to them
bull Show gene reaction rules Show the gene reaction rules below the reaction labels even gene data is not loaded
bull Hide reaction gene and metabolite labels Another option to visually simplify the map this will hide alllabels that are not text annotations
bull Allow duplicate reactions By default duplicate reactions are hidden in the add reaction dropdown menuHowever you can turn this option on to show the duplicate reactions
bull Highlight reactions not in model Highlight in red any reactions that are on the map but are not in the modelThis is useful when you are adapting a map from one model for use with another model
71 Getting started 25
Escher Documentation Release 143
Reaction data settings
When reaction or gene data is loaded this section can be used to change visual settings for reactions
The color bar has individual control points and you can drag the control points (execpt min and max) left and right tochange their values Alternatively you can use the dropdown menu (next to the word median in the figure above) toattach a control point to a statistical measure (mean median first quartile (Q1) or third quartile (Q3)) This lets youchoose a color scale that will adapt to your dataset
For each control point you can choose a color by entering a CSS-style color (eg red ff0000 rgba(20 20 255 05)and you can choose a size that will scale the thickness of reactions
There are also color and size options for reactions that do not have any data value
Finally there are a few onoff settings for the loaded reaction or gene dataset
bull Options These determine how to visualize the datasets Check Absolute value to color and size reactions bythe absolute value of each data value The Size Color and Text options can be unselected to turn off sizingcoloring and data values in reaction labels individually
bull Comparison Determines the comparison algorithm to use when two datasets are loaded
bull Method for evaluating AND Determines the method that will be used to reconcile AND statements in genereaction rules when there is gene data loaded See Gene data and gene reaction rules for more details
Metabolite data settings
The data settings for metabolite data are analagous to those for reaction data The only difference is that size nowrefers to the size of the metabolite circles
26 Chapter 7 Contents
Escher Documentation Release 143
72 Escher COBRA and COBRApy
Escher can be used as an independent application but it draws heavily on the information in COBRA models ACOBRA model is a collection of all the reactions metabolites and genes known to exist in an organism (In theliterature these are generally called genome-scale models (GEMs) but we refer to them as COBRA models here toemphasize that Escher interoperates with models that are exported from COBRApy)
By loading a COBRA model into the Escher interface you have access to every reaction and metabolite in that modelYou also have the gene reaction rules for the reactions in the network which allow you to connect gene data toreactions and metabolites
COBRApy is a software package for COBRA modeling written in Python The Escher Python package uses CO-BRApy package for reading and writing COBRA models
721 Maps and models
In Escher you will see references to maps and models
A map contains the reactions and metabolites that you see in the Escher builder including their locations text annota-tions and the canvas
A model (a COBRA model) contains reactions and metabolites that you have not drawn yet Thus you can load aCOBRA model when you want to draw new reactions on the map
722 What is JSON and why do we use it
Both Escher maps and COBRA models are stored as JSON files JSON is a useful plain-text format for storing nesteddata structures We use JSON much like the SBML community uses XML You may notice that SBML files have axml extension and Escher maps and COBRA models have a json extension
You can use Python to explore a JSON file like this
import json
with open(mapjson r) as fmap_object = jsonload(f)
print map_object[0]print map_object[1][reactions]values()[0]
723 Escher SBML and SBGN
A tool has been developed for converting Escher maps to SBML Layout and SBGN and it will be released soon
COBRA models can be converted to SBML using COBRApy
73 Run Escher locally and in IPython
To run Escher on a local computer or to use Escher in PythonIPython first install it The Python package for Eschercan be installed using pip
pip install escher
72 Escher COBRA and COBRApy 27
Escher Documentation Release 143
Depending on your installation of Python you may need sudo
sudo pip install escher
Alternatively one can download the source files and install the package directly
python setuppy install
731 Escher in the IPython Notebook
Once you have installed Escher locally you can interact with Escher maps in an IPython Notebook
Here are example notebooks to get started with
bull COBRApy and Escher
bull JavaScript development and offline maps
bull Generate JSON models in COBRApy
Dependencies
bull Jinja2
bull Tornado
bull COBRApy 030 or later
732 Running the local server
You can run your own local server if you want to use Escher offline or explore your own maps with the homepagebrowser To get started install the Python package and run from any directory by calling
python -m escherserver
This starts a server at httplocalhost7778 You can also choose another port
python -m escherserver --port=8005
74 Validate and convert maps
741 Validate an Escher map
Escher maps follow a specification using the JSON Schema format Therefore any JSON Schema validator can beused to validate an Escher map by comparing it to the latest schema file For example the current schema is locatedhere
httpsgithubcomzakandrewkingescherblobmasterescherjsonschema1-0-0
To make this easier the Escher Python package includes a validation script To validate a map first install Escher
pip install escher
Then call the validator
python -m eschervalidate my_mapjson
Any errors in the map will print to the console
28 Chapter 7 Contents
Escher Documentation Release 143
742 Convert or upgrade an Escher map
Any Escher maps built with pre-release versions of Escher will not load right away in the stable v10 release Toconvert pre-release maps to the new format follow these steps
1 Install Escher
pip install escher
2 Find a COBRA model for your maps This COBRA model will be used to update the content of the mapin order to support all the new Escher features You can use a COBRA model encoded as SBML or JSON(generated with COBRApy v030b4 or later) The COBRA models currently available on the Escher websitecan be downloaded from the BiGG Models website
httpbiggucsdedu
For a refresher on the distinction between Escher maps COBRA models and their file types (SBML JSONSBML Layout) see Escher COBRA and COBRApy
3 Run the convert_map script to convert your existing Escher map (my_old_mapjson) to the new formatusing a COBRA model (model_filejson or model_filexml in these examples)
With a JSON file modelpython -m escherconvert_map my_old_mapjson pathtomodel_filejson
With an SBML modelpython -m escherconvert_map my_old_mapjson pathtomodel_filexml
Those commands will generate a new map called my_old_map_convertedjson that will load in Escher v10and later
75 Building and contributing maps
We are excited to collect pathway maps for every organism with a well characterized metabolic network This sectiondescribes the process of building a new map either from scratch or using a COBRA model with BiGG IDs
751 Building from scratch
To build a map from scratch you will first need a COBRA model for your map See the section Escher COBRA andCOBRApy for some background information on COBRA models
If you would like to eventually contribute your map to the Escher website it is important that your COBRA modeladheres to the identifiers in the BiGG Database Escher and BiGG are being developed together and we want tomaintain consistency and interoperability between them
Once you have a COBRA model you can follow these steps
1 Load your model in the Escher Builder
2 Begin building new reactions If you are familiar with the genes in your organism then try search for newreactions by their gene IDs
3 Limit each map to ~200 reactions Maps larger than this will slow down the Escher viewer especially on oldbrowsers Rather than building one giant map Escher is designed for building many smaller subsystem maps
4 When you have built a map for your a subsystem save the map as JSON with a name that includes the modelID followed by a period followed by the name of the subsystem For example
75 Building and contributing maps 29
Escher Documentation Release 143
iMM904Amino acid biosynthesisjson
5 (Optional) Once you have a set of subsystem maps you can set up a local Escher server so that subsystem mapsappear in the ldquoquick jumprdquo menu in the bottom right corner of the screen (as seen here for iJO1366) To setthis up you will need to start a local server as describe in Running the local server Next find your local cachedirectory by running this command in a terminal
python -c import escher print(escherget_cache_dir(name=maps))
This will print the location of the local maps cache Add your new subsystem maps to cache folder Now whenyou run the server (described in Running the local server) you should see that quick jump menu appear
NOTE The cache directory is organized into folders for organisms You can use these folder for filtering byorganism on the local launch page or you can place the maps in the top directory
NOTE 2 A similar approach can be used to access your models from the local launch page Place maps in thefolder indicated by
python -c import escher print(escherget_cache_dir(name=models))
752 Building from an existing map for a similar organism
Follow the instruction above except rather than starting from scratch load an existing Escher map for a differentorganism
Once you have the new model loaded use the Update names and gene reaction rules using model button in theModel menu to convert all descriptive names and gene reaction rules in the model to those in the map Reactions thatdo not match the model will be highlighted in red (This can be turned off again in the settings menu by deselectingHighlight reactions not in model)
Now visit each highlighted reaction and see if you can replace it with an equivalent biochemical pathway from themodel If not then delete the reaction and move on
Finally when there are no highlighted reactions left you can repeat this for other subsystems
753 Submitting maps to the Escher website
If you would like to contribute maps to Escher you can make a Pull Request to the GitHub repository eschergithubioMake sure there is a folder with the name of the organism in 1-0-0maps For example a new yeast map goes inthe folder
1-0-0mapsSaccharomyces cerevisiae
Then name your map by concatenating the model ID and the map name separated by a period For example a yeastmap built with the genome-scale model iMM904 could be named
iMM904Amino acid biosynthesisjson
Then add the JSON file for the model to the Pull Request if that model is not already available As before make afolder for your organism within 1-0-0models The model filename is just the model ID
In this example a correct Pull Request would include the following files
1-0-0mapsSaccharomyces cerevisiaeiMM904Amino acid biosynthesisjson1-0-0modelsSaccharomyces cerevisiaeiMM904json
30 Chapter 7 Contents
Escher Documentation Release 143
76 Developing with Escher
761 Using the static JavaScript and CSS files
You can include the compiled Escher JavaScript and CSS files in any HTML document The only dependencies ared3js and optionally Twitter Bootstrap if you are using the option menu=rsquoallrsquo
The compiled files are available form npmcdn
httpsnpmcdncomescher-visjsdistescherjshttpsnpmcdncomescher-visjsdistescherminjshttpsnpmcdncomescher-viscssdistbuildercsshttpsnpmcdncomescher-viscssdistbuildermincss
Source maps are also hosted there
httpsnpmcdncomescher-visjsdistescherjsmaphttpsnpmcdncomescher-visjsdistescherminjsmaphttpsnpmcdncomescher-viscssdistbuildermincssmap
If you want a particular version of escher add a version tag like this
httpsnpmcdncomescher-vis140-beta3jsdistescherjs
For an example of the boilerplate code that is required to begin developing with Escher have a look at the escher-demorepository For projects built with npm use the escher-test repository as a guide
762 Building and testing Escher
First install dependencies with npm
npm install
Escher uses grunt to manage the build process To run typical build steps just run
npm run compile
To test the JavaScript files run
npm run test
For Python testing run this in the py directory
python setuppy test
Build the static website
python setuppy build_gh
Clear static website files
python setuppy clean
Build and run the docs
cd docsmake htmlcd _buildhtml
76 Developing with Escher 31
Escher Documentation Release 143
python -m SimpleHTTPServer python 2python -m httpserver python 3
763 Generating and reading Escher and COBRA files
The Escher file format
Escher layouts are defined by JSON files that follow a specific schema using json schema The latest schemafor Escher JSON files is here The Escher schemas are versioned with inspiration from SchemaVer Theeschervalidate module can be used to validate models against the schema
The Escher layout schema is designed to be as simple as possible For example the core metabolism map of Es-cherichia coli is layed out like this
[
map_name E coli coreCore metabolismmap_id 2938hoq32a1map_description E coli core metabolic networknLast Modified Fri Dec 05 2014 163944 GMT-0800 (PST)homepage httpseschergithubioschema httpseschergithubioescherjsonschema1-0-0
reactions nodes text_label canvas
x 7857062530517567y 31436893920898433width 5894515691375733height 4860457037353515
]
The map_name includes the model that was used to build this layout followed by a period and then a readable namefor the map The map_id is a unique identifier for this map The map_description describes the map and thelast time it was modified Both the homepage and the schema entries must have exactly these values for the Eschermap to be valid
In the next section the reactions nodes labels and canvas are all defined For reactions nodes and text labels eachelement has a key that is an arbitrary integer As long as there are no repeated IDs (eg no 2 segments with the ID517) then everything should work fine
Read through the schema (here) for more detail on the format
The COBRA file format
COBRA models are also saved as JSON files This format has not been documented with a schema but you canbrowse through the core metabolism model as a guide to generating valid COBRA models
I still need help
If you are interested in developing with Escher and you need more information than what is provided in the documen-tation please contact Zachary King (zaking-AT-ucsd-DOT-edu)
32 Chapter 7 Contents
Escher Documentation Release 143
77 EscherConverter
EscherConverter is a standalone program that reads files created with the graphical network editor Escher and convertsthem to files in community standard formats
Download EscherConverter 05 (137 MB)
771 Using EscherConverter
Escher uses a JSON file format to represent its networks This format has been developed because of its very small filesize and its compatibility to online programs that are written in JavaScript In particular JSON is a JavaScript ObjectNotation or in other words a JSON file directly represents components of JavaScript programs This makes parsingvery simple and allows direct use of those files in web-based programs
However in systems biology specific file formats have been developed with the aim to be easily exchangeable betweensoftware implemented in diverse programming languages
To this end these formats support semantically clear annotations and are maintained by a large community of scientistsEscherConverter supports export to two particularly important XML-based community file formats SBML with layoutextension and SBGN-ML
While SBML has been mainly developed for dynamic simulation of biological networks it is nowadays also usablefor diverse other purposes Its layout extension facilitates the encoding the display of biological networks
SBGN-ML has been directly developed as a language for the display of biological pathway maps of diverse kinds Itstores the position and connection of entities similar to what is shown in Escher networks
EscherConverter takes Escherrsquos JSON files as input and generates equivalent SBML Level 3 Version 1 files with layoutextension or SBGN-ML files
In order to ensure that the conversion is correct EscherConverter provides its own display that gives users a previewof how the export data format will be rendered by other tools In this preview display you can zoom in and out movearcs and node positions However it is important to know that none of the changes made in this preview are stored inthe export file
Download and Installation
You can obtain local copy of EscherConverter by clicking here
As a Javatrade application no specific installation is required for EscherConverter
However make sure you have a recent Javatrade Runtime Environment (JRE) installed on your computer (at least JRE8) You can obtain Javatrade from the Oracle website There you can also find installation instructions for your respectiveoperating system
Once Javatrade has been installed you can simply place the EscherConverter JAR file somewhere on your local computerfor instance in the folder
bull Applications if you are working under Mac OS
77 EscherConverter 33
Escher Documentation Release 143
bull opt for Linux computers
bull CProgram Files if you are using Windows
Launching the program
You can launch EscherConverter simply by double-clicking on the application JAR file This will open a followinggraphical user interface as described in the following figures
Figure 1 | The graphical user interface of EscherConverter
bull Preferences opens a settings dialog (see next screenshot)
bull Open displays a file chooser to select an input file in JSON format
bull Save export the map that is displayed in the current tab to SBML or SBGN-ML
bull Discard closes the current tab without saving
bull Help opens the online help that displays all command-line options
bull License displays the license under which this software is distributed
bull About shows information about the authors of this software
bull Main the main panel of the software in which converted Escher maps will be displayed organized in tabs
bull Status the status bar shows information and logging messages during the conversion
34 Chapter 7 Contents
Escher Documentation Release 143
Figure 2 | The preferences dialog All settings in this dialog are also available through EscherConverterrsquos command-line interface
Layout section several properties that are required in SBML and SBGN-ML are not explicitly specified in EscherrsquosJSON format and therefore need to be adjusted by the user These are the size of the drawing canvas the default boxsize for text labels the size of primary and secondary nodes In contrast to SBGN-ML and Escherrsquos JSON formatthe SBML layout extension supports three-dimensional displays When selecting this export file format it is thereforenecessary to also define the z-coordinate and the depth of all objects
Components and naming section Most settings in this section are specific for the SBML layout extension and areonly active if this output format is selected These are names and identifiers of the layout component and the in caseof SBML mandatory default compartment (a compartment without physical meaning a reaction space in which allmetabolites are located) EscherConverter can infer compartment bounds from metabolites but this is an experimentalfeature Just try it and see how the preview changes
77 EscherConverter 35
Escher Documentation Release 143
Figure 3 | A layout preview
The birds-eye view and the navigation component on the left help you navigate through the network display Thisgraph shows you how the converted pathway map will be rendered by software that supports SBGN-ML or the SBMLlayout extension This preview can be modified by moving arcs or nodes however none of those changes are storedwhen exporting the file In this current version EscherConver only exports layouts as given in the original JSON file
Included third-party software
EscherConverter includes several third-party libraries which we here list and acknowledge
bull ArgParser
bull JSBML
bull libSBGN
bull Pixel-Mixer icons
bull yFiles
772 Command-line interface API
You can launch EscherConverter from the command-line On a Unix system (such as Linux MacOS or Solaris etc)use a command like
bash$ java -jar -Xms8G -Xmx8G -Duserlanguage=en EscherConverter-05jar [options]
Under Window use a command like
Cgt javaw -jar -Xms8G -Xmx8G -Duserlanguage=en EscherConverter-05jar [options]
Escher has a large collection of command-line options (see below) which can be useful if you want to launch theprogram with specific settings or if multiple files are to be converted in a batch mode It is even possible to completelydisable the graphical user interface
36 Chapter 7 Contents
Escher Documentation Release 143
Input and output files
Definition of input and output data files as well as the format for the output
--input=ltFilegt
Specifies the JSON input file If a directory is given the conversion will be recursively performed Accepts JSON
--output=ltFilegt
The path to the file into which the output should be written If the input is a directory this must also be a directory inorder to perform a recursive conversion Accepts SBML SBGN
Escher layout
The options in this group allow you to influence how large certain elements should be displayed
--canvas-default-height=ltDoublegt
Just as in the case of the width of the canvas this value needs to be specified for cases where the JSON input file lacksan explicit specification of the canvas height Arguments must fit into the range [11E9] (Default value 2500)
--canvas-default-width=ltDoublegt
This value is used when no width has been defined for the canvas Since the width attribute is mandatory for the layouta default value must be provided in these cases Arguments must fit into the range [11E9] (Default value 2500)
--label-height=ltDoublegt
With this option you can specify the height of the bounding box of text labels Arguments must fit into the range[11E9] (Default value 500)
--label-width=ltDoublegt
This option defines the width of bounding boxes for text labels Arguments must fit into the range [11E9] (Defaultvalue 1600)
--node-depth=ltDoublegt
The length of nodes along z-coordinate Escher maps are actually two-dimensional but in general a layout can bethree-dimensional This value should be an arbitrary value greater than zero because some rendering engines mightnot display the node if its depth is zero Arguments must fit into the range [11E9] (Default value 10)
--node-label-height=ltDoublegt
Node labels can have a size different from general labels in the graph Here you can specify how height the boundingbox of the labels for nodes should be Arguments must fit into the range [11E9] (Default value 200)
--primary-node-height=ltDoublegt
The primary node should be bigger than the secondary node With this option you can specify the height of this typeof nodes Arguments must fit into the range [11E9] (Default value 300)
--primary-node-width=ltDoublegt
Escher maps distinguish between primary and secondary nodes Primary nodes should be larger than secondary nodesand display the main flow of matter through the network This option allows you to specify the width of primarynodes Arguments must fit into the range [11E9] (Default value 300)
77 EscherConverter 37
Escher Documentation Release 143
--reaction-label-height=ltDoublegt
Reaction label heightArguments must fit into the range [11E9] (Default value 300)
--reaction-node-ratio=ltDoublegt
This value is used as a conversion factor to determine the size of the reaction display box depending on the size ofprimary nodes Height and width of reaction nodes are determined by dividing the corresponding values from theprimary node size by this factor Arguments must fit into the range [01] (Default value 05)
--secondary-node-ratio=ltDoublegt
Similar to the reaction node ratio the size of secondary nodes (width and height) is determined by dividing thecorresponding values from the primary nodes by this value Arguments must fit into the range [01] (Default value06666666666666666)
--z=ltDoublegt
The position on the z-axis where the entire two-dimensional graph should be drawn Arguments must fit into the range[-1E91E9] (Default value 00)
Escher Components and their naming
Here you can influence which elements are to be included in the layout and how elements in the layout are to be calledor identified
--format=ltOutputFormatgt
The desired format for the conversion eg SBML All possible values for type ltOutputFormatgt are SBGN andSBML (Default value SBML)
--layout-id=ltStringgt
In contrast to the name this identifier does not have to be human-readable This is a machine identifier which muststart with a letter or underscore and can only contain ASCII characters (Default value Escher_Layout)
--layout-name=ltStringgt
This should be a human-readable name for the layout that is to be created This name might be displayed to describethe figure and should therefore be explanatory (Default value Escher Layout)
--compartment-id=ltStringgt
A compartment needs to have a unique identifier which needs to be a machine-readable Sting that must start with aletter or underscore and can only contain ASCII characters Since the JSON file does not provide this information thisoption allows you to specify the required identifier (Default value default)
--compartment-name=ltStringgt
With this option it is possible to define a name for the default compartment can be that needs to be generated for theconversion to SBML The name does not have any restrictions ie any UTF-8 character can be used (Default valueDefault compartment)
--infer-compartment-bounds
This converter can infer where the boundaries of compartments could be drawn To this end it uses each nodersquos BiGGids to identify the compartment of all metabolites Assuming that compartments have rectangular shapes the algorithmcan find the outermost node on each side of the box and hence obtain the boundaries of the compartment However
38 Chapter 7 Contents
Escher Documentation Release 143
this methods will fail when metabolites are drawn inside of such a box that belong to a different compartment that isactually further outside For this reason this option is deactivated by default (Default value false)
Options for the graphical user interface
--gui
If this option is given the program will display its graphical user interface (Default value false)
--log-level=ltStringgt
Change the log-level of this application This option will influence how fine-grained error and other log messages willbe that you receive while executing this program All possible values for type ltStringgt are ALL CONFIG FINEFINER FINEST INFO OFF SEVERE and WARNING (Default value INFO)
--log-file=ltFilegt
This option allows you to specify a log file to which all information of the program will be written Accepts (bp2bp3 log owl xml)
78 JavaScript API
class escherBuilder(map_data model_data embedded_css selection options)A Builder object contains all the UI and logic to generate a map builder or viewer
Arguments
bull map_data (object) ndash The data for a map to be passed to escherMapfrom_data() Ifnull then an empty Builder is initialized
bull model_data (object) ndash The data for a cobra model to be passed to es-cherCobraModel() Can be null
bull embedded_css (string) ndash The stylesheet for the SVG elements in the Escher map
bull selection (object) ndash (Optional Default In the body element) The d3 selection of anelement to place the Builder into The selection cannot be inside an SVG element
bull options (object) ndash (Optional) An object defining any of the following options
optionsmenu(Default rsquoallrsquo) The type of menu that will be displayed Can be lsquoallrsquo for the fullmenu or lsquozoomrsquo for just zoom buttons The lsquoallrsquo option requires the full set of Escherdependencies (D3js JQuery and Bootstrap) while the lsquozoomrsquo option requires only D3jsFor more details see Developing with Escher
optionsscroll_behavior(Default rsquopanrsquo) This option determines the effect that the scroll wheel will have onan Escher map Can be lsquopanrsquo to pan the map or lsquozoomrsquo to zoom the map when the usermoves the scroll wheel
optionsuse_3d_transform(Default Chooses a good option by testing the browser) If true then use CSS3 3D trans-forms to speed up panning and zooming This feature will only work on browsers thatsupport the 3D transforms It works best in the latest versions of Chrome Firefox andInternet Explorer Safari works better with this turned off
78 JavaScript API 39
Escher Documentation Release 143
optionsenable_editing(Default true) If true then display the map editing functions If false then hide themand only allow the user to view the map
optionenable_keys(Default true) If true then enable keyboard shortcuts
optionsenable_search(Default true) If true then enable indexing of the map for search Use false to disablesearching and potentially improve the map performance
optionsfill_screen(Default false) Use true to fill the screen when an Escher Builder is placed in a top-level container (eg a div in the body element)
optionsfull_screen_button(Default false) Include a button in the user interface for entering full screen mode
optionsignore_bootstrap(Default false) Do not use Bootstrap for buttons even if it available This is used toembed Escher in a Jupyter notebook where it conflicts with the Jupyter Boostrap installa-tion
Map model and styles
optionsstarting_reaction(Default null) The ID (as a string) of a reaction to draw when the Builder loads
optionsnever_ask_before_quit(Default false) If false then display a warning before the user closes an Eschermap If true then never display the warning This options is only respected if op-tionsenable_editing == true If enable_editing is false then the warnings are not dis-played
optionsunique_map_id(Default null) A unique ID that will be used to UI elements donrsquot interfere whenmultiple maps are in the same HTML document
optionsprimary_metabolite_radius(Default 15) The radius of primary metabolites in px
optionssecondary_metabolite_radius(Default 10) The radius of secondary metabolites in px
optionsmarker_radius(Default 5) The radius of marker nodes in px
optionsgene_font_size(Default 18) The font size of the gene reaction rules in px
optionshide_secondary_metabolites(Default false) If true then secondary nodes and segments are hidden This is conve-nient for generating simplified map figures
optionsshow_gene_reaction_rules(Default false) If true then show the gene reaction rules even without gene data
optionshide_all_labels(Default false) If checked hide all reaction gene and metabolite labels
Applied data
40 Chapter 7 Contents
Escher Documentation Release 143
optionsreaction_data(Default null) An object with reaction ids for keys and reaction data points for values
optionsreaction_stylesDefault [rsquocolorrsquo rsquosizersquo rsquotextrsquo]
An array of style types The array can contain any of the following lsquocolorrsquo lsquosizersquo lsquotextrsquolsquoabsrsquo The lsquocolorrsquo style means that the reactions will be colored according to the loadeddataset The lsquosizersquo style means that the reactions will be sized according to the loadeddataset The lsquotextrsquo style means that the data values will be displayed in the reactionlabels The lsquoabsrsquo style means the the absolute values of reaction values will be used fordata visualization
optionsreaction_compare_style(Default rsquodiffrsquo) How to compare to datasets Can be either lsquofold lsquolog2_foldrsquo orlsquodiffrsquo
optionsreaction_scaleDefault
[ type min color c8c8c8 size 12 type median color 9696ff size 20 type max color ff0000 size 25 ]
An array of objects that define points on the data scale
Each point is an object with a type attribute Types can be lsquominrsquo lsquomaxrsquo lsquomeanrsquo lsquoQ1rsquo (firstquartile) lsquomedianrsquo lsquoQ3rsquo (third quartile) or lsquovaluersquo Each point can have a color attributethat specifies a color with a string (any CSS color specification is allowed including hexrgb and rgba) Each point can have a size attirbute that specifies a reaction thickness as anumber Finally points with type lsquovaluersquo can have a value attribute that specifies an exactnumber for pont in the scale
NOTE If lsquominrsquo or lsquomaxrsquo is not provided Escher automatically adds them To be com-pletely clear about what you expect to see on the map it is best to provide lsquominrsquo andlsquomaxrsquo in addition to other scale points
Here are examples of each type
type rsquominrsquo color rsquoredrsquo size 12 Specifies that reactionsnear the minimum value are red and have thickness 12
type rsquoQ1rsquo color rsquorgba(100 100 50 05)rsquo size 12 Specifies that reactions near the first quartile have the given color opacity andthickness
type rsquomeanrsquo color rsquorgb(100 100 50)rsquo size 50 Specifies that reactions near the mean value have the given color and thickness
type rsquovaluersquo value 85 color rsquo333rsquo size 50 Specifies that reactions near 85 value have the given color and size
optionsreaction_no_data_color(Default rsquodcdcdcrsquo) The color of reactions with no data value
optionsreaction_no_data_size(Default 8) The size of reactions with no data value
optionsgene_data(Default null) An object with Gene ids for keys and gene data points for values
78 JavaScript API 41
Escher Documentation Release 143
optionsand_method_in_gene_reaction_rule(Default mean) When evaluating a gene reaction rule use this function to evaluate ANDrules Can be lsquomeanrsquo or lsquominrsquo
optionsmetabolite_data(Default null) An object with metabolite ids for keys and metabolite data points forvalues
optionsmetabolite_stylesDefault [rsquocolorrsquo rsquosizersquo rsquotextrsquo]
An array of style types The array can contain any of the following lsquocolorrsquo lsquosizersquo lsquotextrsquolsquoabsrsquo The lsquocolorrsquo style means that the metabolites will be colored according to the loadeddataset The lsquosizersquo style means that the metabolites will be sized according to the loadeddataset The lsquotextrsquo style means that the data values will be displayed in the metabolitelabels The lsquoabsrsquo style means the the absolute values of metabolite values will be used fordata visualization
optionsmetabolite_compare_style(Default rsquodiffrsquo) How to compare to datasets Can be either lsquofoldrsquo lsquolog2_foldrsquo orlsquodiffrsquo
optionsmetabolite_scaleDefault
[ type min color fffaf0 size 20 type median color f1c470 size 30 type max color 800000 size 40 ]
An array of objects that define points on the data scale See the description of op-tionsreaction_scale for an explanation of the format
optionsmetabolite_no_data_color(Default rsquoffffffrsquo) The color of metabolites with no data value
optionsmetabolite_no_data_size(Default 10) The size of metabolites with no data value
View and build options
optionsidentifiers_on_map(Default rsquobigg_idrsquo) The identifiers that will be displayed in reaction metabolite andgene labels Can be lsquobigg_idrsquo or lsquonamersquo
optionshighlight_missing(Default false) If true then highlight in red reactions that are not in the loaded COBRAmodel
optionsallow_building_duplicate_reactions(Default true) If true then building duplicate reactions is allowed If false then dupli-cate reactions are hidden in Add reaction mode
optionscofactors(Default [rsquoatprsquo rsquoadprsquo rsquonadrsquo rsquonadhrsquo rsquonadprsquo rsquonadphrsquorsquogtprsquo rsquogdprsquo rsquohrsquo rsquocoarsquo rsquoumprsquo rsquoh20rsquo rsquoppirsquo]) A list of metabo-lite IDs to treat as cofactors These will be secondary metabolites in new reactions
Callbacks
optionsfirst_load_callbackA function to run after loading the Builder
42 Chapter 7 Contents
Escher Documentation Release 143
load_map(map_data[ should_update_data])Load a map for the loaded data Also reloads most of the Builder content
Arguments
bull map_data ndash The data for a map
bull should_update_data (Boolean) ndash (Default true) Whether data should be ap-plied to the map
load_model(model_data[ should_update_data])Load the cobra model from model data
Arguments
bull model_data ndash The data for a Cobra model (Parsing in done by escherCobraModel)
bull should_update_data (Boolean) ndash (Default true) Whether data should be ap-plied to the model
view_mode()Enter view mode
build_mode()Enter build mode
brush_mode()Enter brush mode
zoom_mode()Enter zoom mode
rotate_mode()Enter rotate mode
text_mode()Enter text mode
set_reaction_data(data)
Arguments
bull data (array) ndash An array of 1 or 2 objects where each object has keys that are reactionIDrsquos and values that are data points (numbers)
set_metabolite_data(data)
Arguments
bull data (array) ndash An array of 1 or 2 objects where each object has keys that are metaboliteIDrsquos and values that are data points (numbers)
set_gene_data(data clear_gene_reaction_rules)
Arguments
bull data (array) ndash An array of 1 or 2 objects where each object has keys that are gene IDrsquosand values that are data points (numbers)
Arguments
bull clear_gene_reaction_rules (Boolean) ndash (Optional Default false) In addi-tion to setting the data also turn of the gene_reaction_rules
78 JavaScript API 43
Escher Documentation Release 143
79 Python API
class escherBuilder(map_name=None map_json=None model=None model_name=Nonemodel_json=None embedded_css=None reaction_data=None metabo-lite_data=None gene_data=None local_host=None id=None safe=Falsekwargs)
A metabolic map that can be viewed edited and used to visualize data
This map will also show metabolic fluxes passed in during consruction It can be viewed as a standalone htmlinside a browswer Alternately the respresentation inside an IPython notebook will also display the map
Maps are stored in json files and are stored in a cache directory Maps which are not found will be downloadedfrom a map repository if found
Parameters
bull map_name ndash A string specifying a map to be downloaded from the Escher web server orloaded from the cache
bull map_json ndash A JSON string or a file path to a JSON file or a URL specifying a JSON fileto be downloaded
bull model ndash A Cobra model
bull model_name ndash A string specifying a model to be downloaded from the Escher web serveror loaded from the cache
bull model_json ndash A JSON string or a file path to a JSON file or a URL specifying a JSONfile to be downloaded
bull embedded_css ndash The CSS (as a string) to be embedded with the Escher SVG
bull reaction_data ndash A dictionary with keys that correspond to reaction ids and values thatwill be mapped to reaction arrows and labels
bull metabolite_data ndash A dictionary with keys that correspond to metabolite ids and valuesthat will be mapped to metabolite nodes and labels
bull gene_data ndash A dictionary with keys that correspond to gene ids and values that will bemapped to corresponding reactions
bull local_host ndash A hostname that will be used for any local files This is generally usedfor using the notebook offline and for testing in the IPython Notebook with modified Eschercode An example value for local_host is lsquohttplocalhost7778lsquo
bull id ndash Specify an id to make the javascript data definitions unique A random id is chosen bydefault
bull safe ndash If True then loading files from the filesytem is not allowed This is to ensure thesafety of using Builder within a web server
Keyword Arguments
These are defined in the Javascript API
bulluse_3d_transform
bullenable_search
bullfill_screen
bullzoom_to_element
bullfull_screen_button
44 Chapter 7 Contents
Escher Documentation Release 143
bullstarting_reaction
bullunique_map_id
bullprimary_metabolite_radius
bullsecondary_metabolite_radius
bullmarker_radius
bullgene_font_size
bullhide_secondary_metabolites
bullshow_gene_reaction_rules
bullhide_all_labels
bullreaction_styles
bullreaction_compare_style
bullreaction_scale
bullreaction_no_data_color
bullreaction_no_data_size
bulland_method_in_gene_reaction_rule
bullmetabolite_styles
bullmetabolite_compare_style
bullmetabolite_scale
bullmetabolite_no_data_color
bullmetabolite_no_data_size
bullidentifiers_on_map
bullhighlight_missing
bullallow_building_duplicate_reactions
bullcofactors
All keyword arguments can also be set on an existing Builder object using setter functions eg
my_builderset_reaction_styles(new_styles)
display_in_browser(ip=lsquo127001rsquo port=7655 n_retries=50 js_source=rsquowebrsquo menu=rsquoallrsquoscroll_behavior=rsquopanrsquo enable_editing=True enable_keys=True mini-fied_js=True never_ask_before_quit=False)
Launch a web browser to view the map
Parameters
bull ip ndash The IP address to serve the map on
bull port ndash The port to serve the map on If specified the port is occupied then a random freeport will be used
bull n_retries (int) ndash The number of times the server will try to find a port before quitting
bull js_source (string) ndash Can be one of the following
ndash web (Default) - Use JavaScript files from eschergithubio
79 Python API 45
Escher Documentation Release 143
ndash local - Use compiled JavaScript files in the local Escher installation Works offline
ndash dev - No longer necessary with source maps This now gives the same behavior aslsquolocalrsquo
bull menu (string) ndash Menu bar options include
ndash none - No menu or buttons
ndash zoom - Just zoom buttons
ndash all (Default) - Menu and button bar (requires Bootstrap)
bull scroll_behavior (string) ndash Scroll behavior options
ndash pan - Pan the map
ndash zoom - Zoom the map
ndash none (Default) - No scroll events
bull enable_editing (Boolean) ndash Enable the map editing modes
bull enable_keys (Boolean) ndash Enable keyboard shortcuts
bull minified_js (Boolean) ndash If True use the minified version of JavaScript and CSSfiles
bull never_ask_before_quit (Boolean) ndash Never display an alert asking if you wantto leave the page By default this message is displayed if enable_editing is True
display_in_notebook(js_source=rsquowebrsquo menu=rsquozoomrsquo scroll_behavior=rsquononersquo mini-fied_js=True height=500 enable_editing=False)
Embed the Map within the current IPython Notebook
Parameters
bull js_source (string) ndash Can be one of the following
ndash web (Default) - Use JavaScript files from eschergithubio
ndash local - Use compiled JavaScript files in the local Escher installation Works offline
ndash dev - No longer necessary with source maps This now gives the same behav-ior as lsquolocalrsquo
bull menu (string) ndash Menu bar options include
ndash none - No menu or buttons
ndash zoom - Just zoom buttons
ndash Note The all menu option does not work in an IPython notebook
bull scroll_behavior (string) ndash Scroll behavior options
ndash pan - Pan the map
ndash zoom - Zoom the map
ndash none - (Default) No scroll events
bull minified_js (Boolean) ndash If True use the minified version of JavaScript andCSS files
bull height ndash Height of the HTML container
bull enable_editing (Boolean) ndash Enable the map editing modes
46 Chapter 7 Contents
Escher Documentation Release 143
save_html(filepath=None overwrite=False js_source=rsquowebrsquo protocol=rsquohttpsrsquo menu=rsquoallrsquoscroll_behavior=rsquopanrsquo enable_editing=True enable_keys=True minified_js=Truenever_ask_before_quit=False static_site_index_json=None)
Save an HTML file containing the map
Parameters
bull filepath (string) ndash The HTML file will be saved to this location Whenjs_source is lsquolocalrsquo then a new directory will be created with this name
bull overwrite (Boolean) ndash Overwrite existing files
bull js_source (string) ndash Can be one of the following
ndash web (Default) - Use JavaScript files from eschergithubio
ndash local - Use compiled JavaScript files in the local Escher installation Works of-fline To make the dependencies available to the downloaded file a new directorywill be made with the name specified by filepath
ndash dev - No longer necessary with source maps This now gives the same behav-ior as lsquolocalrsquo
bull protocol (string) ndash The protocol can be lsquohttprsquo lsquohttpsrsquo or None which indicatesa lsquoprotocol relative URLrsquo as in eschergithubio Ignored if source is local
bull menu (string) ndash Menu bar options include
ndash none - No menu or buttons
ndash zoom - Just zoom buttons
ndash all (Default) - Menu and button bar (requires Bootstrap)
bull scroll_behavior (string) ndash Scroll behavior options
ndash pan - Pan the map
ndash zoom - Zoom the map
ndash none (Default) - No scroll events
bull enable_editing (Boolean) ndash Enable the map editing modes
bull enable_keys (Boolean) ndash Enable keyboard shortcuts
bull minified_js (Boolean) ndash If True use the minified version of JavaScript andCSS files
bull height (number) ndash Height of the HTML container
bull never_ask_before_quit (Boolean) ndash Never display an alert asking if youwant to leave the page By default this message is displayed if enable_editing isTrue
bull static_site_index_json (string) ndash The index as a JSON string for thestatic site Use javascript to parse the URL options Used for generating static pages(see static_sitepy)
791 Cache
escherget_cache_dir(versioned=True name=None)Get the cache dir as a string and make the directory if it does not already exist
Parameters
79 Python API 47
Escher Documentation Release 143
bull versioned (Boolean) ndash Whether to return the versioned path in the cache Eschermaps for the latest version of Escher are found in the versioned directory (versioned= True) but maps for previous versions of Escher can be found by visiting the parentdirectory (versioned = False)
bull name (string) ndash An optional subdirectory within the cache If versioned is False thenname is ignored
escherclear_cache(different_cache_dir=None ask=True)Empty the contents of the cache directory including all versions of all maps and models
Parameters
bull different_cache_dir (string) ndash (Optional) The directory of another cacheThis is mainly for testing
bull ask (Boolean) ndash Whether to ask before deleting
escherlist_cached_maps()Return a list of all cached maps
escherlist_cached_models()Return a list of all cached models
escherlist_available_maps()Return a list of all maps available on the server
escherlist_available_models()Return a list of all models available on the server
710 License
Escher and EscherConverter are distributed under the MIT license
bull genindex
48 Chapter 7 Contents
Python Module Index
eescher 44
49
Escher Documentation Release 143
50 Python Module Index
Index
Bbrush_mode() (built-in function) 43build_mode() (built-in function) 43Builder (class in escher) 44
Cclear_cache() (in module escher) 48
Ddisplay_in_browser() (escherBuilder method) 45display_in_notebook() (escherBuilder method) 46
Eescher (module) 44escherBuilder() (class) 39
Gget_cache_dir() (in module escher) 47
Llist_available_maps() (in module escher) 48list_available_models() (in module escher) 48list_cached_maps() (in module escher) 48list_cached_models() (in module escher) 48load_map() (built-in function) 42load_model() (built-in function) 43
Ooptionenable_keys (option attribute) 40optionsallow_building_duplicate_reactions (options at-
tribute) 42optionsand_method_in_gene_reaction_rule (options at-
tribute) 41optionscofactors (options attribute) 42optionsenable_editing (options attribute) 39optionsenable_search (options attribute) 40optionsfill_screen (options attribute) 40optionsfirst_load_callback (options attribute) 42optionsfull_screen_button (options attribute) 40optionsgene_data (options attribute) 41
optionsgene_font_size (options attribute) 40optionshide_all_labels (options attribute) 40optionshide_secondary_metabolites (options attribute)
40optionshighlight_missing (options attribute) 42optionsidentifiers_on_map (options attribute) 42optionsignore_bootstrap (options attribute) 40optionsmarker_radius (options attribute) 40optionsmenu (options attribute) 39optionsmetabolite_compare_style (options attribute) 42optionsmetabolite_data (options attribute) 42optionsmetabolite_no_data_color (options attribute) 42optionsmetabolite_no_data_size (options attribute) 42optionsmetabolite_scale (options attribute) 42optionsmetabolite_styles (options attribute) 42optionsnever_ask_before_quit (options attribute) 40optionsprimary_metabolite_radius (options attribute) 40optionsreaction_compare_style (options attribute) 41optionsreaction_data (options attribute) 40optionsreaction_no_data_color (options attribute) 41optionsreaction_no_data_size (options attribute) 41optionsreaction_scale (options attribute) 41optionsreaction_styles (options attribute) 41optionsscroll_behavior (options attribute) 39optionssecondary_metabolite_radius (options attribute)
40optionsshow_gene_reaction_rules (options attribute) 40optionsstarting_reaction (options attribute) 40optionsunique_map_id (options attribute) 40optionsuse_3d_transform (options attribute) 39
Rrotate_mode() (built-in function) 43
Ssave_html() (escherBuilder method) 46set_gene_data() (built-in function) 43set_metabolite_data() (built-in function) 43set_reaction_data() (built-in function) 43
51
Escher Documentation Release 143
Ttext_mode() (built-in function) 43
Vview_mode() (built-in function) 43
Zzoom_mode() (built-in function) 43
52 Index
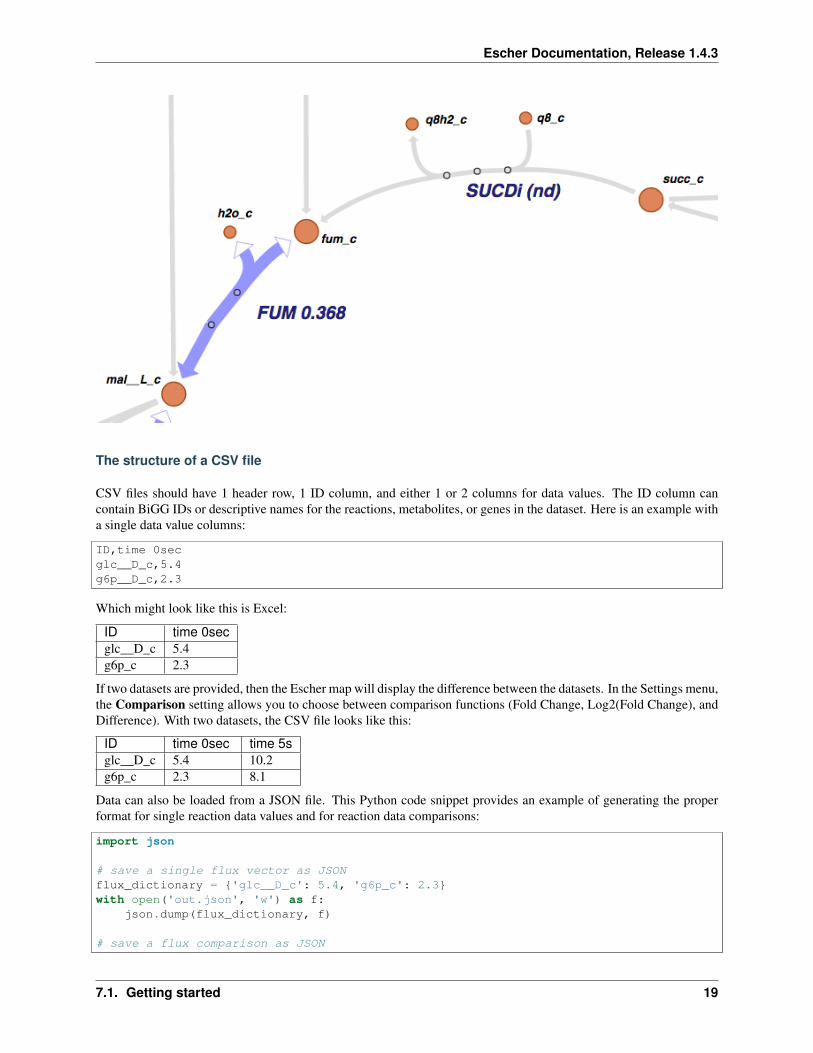
Escher Documentation Release 143
flux_comp = [glc__D_c 54 g6p_c 23 glc__D_c 102 g6p_c 81]with open(out_compjson w) as f
jsondump(flux_comp f)
Gene data and gene reaction rules
Escher uses gene reaction rules to connect gene data to the reactions on a metabolic pathway You can see these genereaction rules on the map by selecting Show gene reaction rules in the Settings menu
Gene reaction rules show the genes whose gene products are required to catalyze a reaction Gene are connected usingAND and OR rules AND rules are used when two genes are required for enzymatic activity eg they are membersof a protein complex OR rules are used when either gene can catalyze the enzymatic activity eg they are isozymes
With OR rules Escher will take the sum of the data values for each gene With AND rules Escher will either takethe mean (the default) or the minimum of the components The AND behavior (mean vs minimum) is defined in theSettings menu
717 Editing and building
The Edit menu gives you access to function for editing the map
20 Chapter 7 Contents
Escher Documentation Release 143
Escher has five major modes and you can switch between those modes using the buttons in the Edit menu or usingthe buttons in the button bar on the left of the screen
1 Pan mode Drag the canvas to pan the map You can also use the mouse scroll wheel or trackpad scroll function(drag with 2 fingers) to pan the map (or to zoom if you selected Scroll to zoom in the settings)
2 Select mode Select nodes by clicking on them Shift-click to select multiple nodes or drag across the canvasto select multiple nodes using the selection brush
3 Add reaction mode If you have loaded a Model then click on the canvas to see a list of reactions that you candraw on the map Click on a node to see reactions that connect to that node In the input box you can search byreaction ID metabolite ID or gene ID (locus tag)
4 Rotate model Before entering rotate mode be sure to select one or more nodes in select mode Then afterentering rotate mode drag anywhere on the canvas to rotate the selection You can also drag the red crosshairsto change the center of the rotation
5 Text mode Use text mode to add text annotations to the map Click on the canvas to add a new text annotationor click an existing annotation to edit it When you are finished click Enter or Escape to save the changes
71 Getting started 21
Escher Documentation Release 143
In addition to the editing modes the Edit menu gives you access to the following commands
bull Delete Delete the currently selected node(s)
bull Undo Undo the last action NOTE Certain actions such as editing the canvas cannot be undone in the currentversion of Escher
bull Redo Redo the last action that was undone
bull Toggle primarysecondary node In Escher each metabolite node is either a primary node or a secondarynode Primary nodes are larger and secondary nodes can be hidden in the Settings menu Use this command totoggle the currently selected node(s) between primary and secondary
bull Rotate reactant locations When you draw a new reaction in Escher this command will rotate the new reactantsso that a new reactant is primary and centered This command is extremely useful when you are drawing a longpathway and you want to quickly switch which metabolite to ldquofollowrdquo eg make sure you are following thecarbon-containing metabolites
If you are confused then try drawing a new pathway and hitting the ldquocrdquo key to see the reactants rotate
bull Select all Select all nodes
bull Select none Unselect all nodes
bull Invert selection Select all the nodes that are currently unselected This feature is very useful when you wantto keep just one part of the map Simply drag to select the part you want to keep call the Invert selectioncommand then call the Delete command
718 Editing the canvas
A somewhat non-obvious feature of Escher is that you can edit the canvas by dragging the canvas edges This ispossible in Pan mode and Select mode
22 Chapter 7 Contents
Escher Documentation Release 143
719 View options
bull Zoom in Zoom in to the map
bull Zoom out Zoom out of the map
bull Zoom to nodes Zoom to see all the nodes on the map
bull Zoom to canvas Zoom to see the entire canvas
bull Find Search for a reaction metabolite or gene on the map
bull Show control points Show the control points you can drag these red and blue circle to adjust the shapes ofthe reactions curves
bull Settings Open the Settings menu
7110 The button bar
The button bar give you quick access to many of the common Escher functions
71 Getting started 23
Escher Documentation Release 143
24 Chapter 7 Contents
Escher Documentation Release 143
7111 Settings
View and build options
bull Identifiers Choose whether to show BiGG IDs or descriptive names for reactions metabolites and genes
bull Hide secondary metabolites This will simplify the map by hiding all secondary metabolites and the pathsconnected to them
bull Show gene reaction rules Show the gene reaction rules below the reaction labels even gene data is not loaded
bull Hide reaction gene and metabolite labels Another option to visually simplify the map this will hide alllabels that are not text annotations
bull Allow duplicate reactions By default duplicate reactions are hidden in the add reaction dropdown menuHowever you can turn this option on to show the duplicate reactions
bull Highlight reactions not in model Highlight in red any reactions that are on the map but are not in the modelThis is useful when you are adapting a map from one model for use with another model
71 Getting started 25
Escher Documentation Release 143
Reaction data settings
When reaction or gene data is loaded this section can be used to change visual settings for reactions
The color bar has individual control points and you can drag the control points (execpt min and max) left and right tochange their values Alternatively you can use the dropdown menu (next to the word median in the figure above) toattach a control point to a statistical measure (mean median first quartile (Q1) or third quartile (Q3)) This lets youchoose a color scale that will adapt to your dataset
For each control point you can choose a color by entering a CSS-style color (eg red ff0000 rgba(20 20 255 05)and you can choose a size that will scale the thickness of reactions
There are also color and size options for reactions that do not have any data value
Finally there are a few onoff settings for the loaded reaction or gene dataset
bull Options These determine how to visualize the datasets Check Absolute value to color and size reactions bythe absolute value of each data value The Size Color and Text options can be unselected to turn off sizingcoloring and data values in reaction labels individually
bull Comparison Determines the comparison algorithm to use when two datasets are loaded
bull Method for evaluating AND Determines the method that will be used to reconcile AND statements in genereaction rules when there is gene data loaded See Gene data and gene reaction rules for more details
Metabolite data settings
The data settings for metabolite data are analagous to those for reaction data The only difference is that size nowrefers to the size of the metabolite circles
26 Chapter 7 Contents
Escher Documentation Release 143
72 Escher COBRA and COBRApy
Escher can be used as an independent application but it draws heavily on the information in COBRA models ACOBRA model is a collection of all the reactions metabolites and genes known to exist in an organism (In theliterature these are generally called genome-scale models (GEMs) but we refer to them as COBRA models here toemphasize that Escher interoperates with models that are exported from COBRApy)
By loading a COBRA model into the Escher interface you have access to every reaction and metabolite in that modelYou also have the gene reaction rules for the reactions in the network which allow you to connect gene data toreactions and metabolites
COBRApy is a software package for COBRA modeling written in Python The Escher Python package uses CO-BRApy package for reading and writing COBRA models
721 Maps and models
In Escher you will see references to maps and models
A map contains the reactions and metabolites that you see in the Escher builder including their locations text annota-tions and the canvas
A model (a COBRA model) contains reactions and metabolites that you have not drawn yet Thus you can load aCOBRA model when you want to draw new reactions on the map
722 What is JSON and why do we use it
Both Escher maps and COBRA models are stored as JSON files JSON is a useful plain-text format for storing nesteddata structures We use JSON much like the SBML community uses XML You may notice that SBML files have axml extension and Escher maps and COBRA models have a json extension
You can use Python to explore a JSON file like this
import json
with open(mapjson r) as fmap_object = jsonload(f)
print map_object[0]print map_object[1][reactions]values()[0]
723 Escher SBML and SBGN
A tool has been developed for converting Escher maps to SBML Layout and SBGN and it will be released soon
COBRA models can be converted to SBML using COBRApy
73 Run Escher locally and in IPython
To run Escher on a local computer or to use Escher in PythonIPython first install it The Python package for Eschercan be installed using pip
pip install escher
72 Escher COBRA and COBRApy 27
Escher Documentation Release 143
Depending on your installation of Python you may need sudo
sudo pip install escher
Alternatively one can download the source files and install the package directly
python setuppy install
731 Escher in the IPython Notebook
Once you have installed Escher locally you can interact with Escher maps in an IPython Notebook
Here are example notebooks to get started with
bull COBRApy and Escher
bull JavaScript development and offline maps
bull Generate JSON models in COBRApy
Dependencies
bull Jinja2
bull Tornado
bull COBRApy 030 or later
732 Running the local server
You can run your own local server if you want to use Escher offline or explore your own maps with the homepagebrowser To get started install the Python package and run from any directory by calling
python -m escherserver
This starts a server at httplocalhost7778 You can also choose another port
python -m escherserver --port=8005
74 Validate and convert maps
741 Validate an Escher map
Escher maps follow a specification using the JSON Schema format Therefore any JSON Schema validator can beused to validate an Escher map by comparing it to the latest schema file For example the current schema is locatedhere
httpsgithubcomzakandrewkingescherblobmasterescherjsonschema1-0-0
To make this easier the Escher Python package includes a validation script To validate a map first install Escher
pip install escher
Then call the validator
python -m eschervalidate my_mapjson
Any errors in the map will print to the console
28 Chapter 7 Contents
Escher Documentation Release 143
742 Convert or upgrade an Escher map
Any Escher maps built with pre-release versions of Escher will not load right away in the stable v10 release Toconvert pre-release maps to the new format follow these steps
1 Install Escher
pip install escher
2 Find a COBRA model for your maps This COBRA model will be used to update the content of the mapin order to support all the new Escher features You can use a COBRA model encoded as SBML or JSON(generated with COBRApy v030b4 or later) The COBRA models currently available on the Escher websitecan be downloaded from the BiGG Models website
httpbiggucsdedu
For a refresher on the distinction between Escher maps COBRA models and their file types (SBML JSONSBML Layout) see Escher COBRA and COBRApy
3 Run the convert_map script to convert your existing Escher map (my_old_mapjson) to the new formatusing a COBRA model (model_filejson or model_filexml in these examples)
With a JSON file modelpython -m escherconvert_map my_old_mapjson pathtomodel_filejson
With an SBML modelpython -m escherconvert_map my_old_mapjson pathtomodel_filexml
Those commands will generate a new map called my_old_map_convertedjson that will load in Escher v10and later
75 Building and contributing maps
We are excited to collect pathway maps for every organism with a well characterized metabolic network This sectiondescribes the process of building a new map either from scratch or using a COBRA model with BiGG IDs
751 Building from scratch
To build a map from scratch you will first need a COBRA model for your map See the section Escher COBRA andCOBRApy for some background information on COBRA models
If you would like to eventually contribute your map to the Escher website it is important that your COBRA modeladheres to the identifiers in the BiGG Database Escher and BiGG are being developed together and we want tomaintain consistency and interoperability between them
Once you have a COBRA model you can follow these steps
1 Load your model in the Escher Builder
2 Begin building new reactions If you are familiar with the genes in your organism then try search for newreactions by their gene IDs
3 Limit each map to ~200 reactions Maps larger than this will slow down the Escher viewer especially on oldbrowsers Rather than building one giant map Escher is designed for building many smaller subsystem maps
4 When you have built a map for your a subsystem save the map as JSON with a name that includes the modelID followed by a period followed by the name of the subsystem For example
75 Building and contributing maps 29
Escher Documentation Release 143
iMM904Amino acid biosynthesisjson
5 (Optional) Once you have a set of subsystem maps you can set up a local Escher server so that subsystem mapsappear in the ldquoquick jumprdquo menu in the bottom right corner of the screen (as seen here for iJO1366) To setthis up you will need to start a local server as describe in Running the local server Next find your local cachedirectory by running this command in a terminal
python -c import escher print(escherget_cache_dir(name=maps))
This will print the location of the local maps cache Add your new subsystem maps to cache folder Now whenyou run the server (described in Running the local server) you should see that quick jump menu appear
NOTE The cache directory is organized into folders for organisms You can use these folder for filtering byorganism on the local launch page or you can place the maps in the top directory
NOTE 2 A similar approach can be used to access your models from the local launch page Place maps in thefolder indicated by
python -c import escher print(escherget_cache_dir(name=models))
752 Building from an existing map for a similar organism
Follow the instruction above except rather than starting from scratch load an existing Escher map for a differentorganism
Once you have the new model loaded use the Update names and gene reaction rules using model button in theModel menu to convert all descriptive names and gene reaction rules in the model to those in the map Reactions thatdo not match the model will be highlighted in red (This can be turned off again in the settings menu by deselectingHighlight reactions not in model)
Now visit each highlighted reaction and see if you can replace it with an equivalent biochemical pathway from themodel If not then delete the reaction and move on
Finally when there are no highlighted reactions left you can repeat this for other subsystems
753 Submitting maps to the Escher website
If you would like to contribute maps to Escher you can make a Pull Request to the GitHub repository eschergithubioMake sure there is a folder with the name of the organism in 1-0-0maps For example a new yeast map goes inthe folder
1-0-0mapsSaccharomyces cerevisiae
Then name your map by concatenating the model ID and the map name separated by a period For example a yeastmap built with the genome-scale model iMM904 could be named
iMM904Amino acid biosynthesisjson
Then add the JSON file for the model to the Pull Request if that model is not already available As before make afolder for your organism within 1-0-0models The model filename is just the model ID
In this example a correct Pull Request would include the following files
1-0-0mapsSaccharomyces cerevisiaeiMM904Amino acid biosynthesisjson1-0-0modelsSaccharomyces cerevisiaeiMM904json
30 Chapter 7 Contents
Escher Documentation Release 143
76 Developing with Escher
761 Using the static JavaScript and CSS files
You can include the compiled Escher JavaScript and CSS files in any HTML document The only dependencies ared3js and optionally Twitter Bootstrap if you are using the option menu=rsquoallrsquo
The compiled files are available form npmcdn
httpsnpmcdncomescher-visjsdistescherjshttpsnpmcdncomescher-visjsdistescherminjshttpsnpmcdncomescher-viscssdistbuildercsshttpsnpmcdncomescher-viscssdistbuildermincss
Source maps are also hosted there
httpsnpmcdncomescher-visjsdistescherjsmaphttpsnpmcdncomescher-visjsdistescherminjsmaphttpsnpmcdncomescher-viscssdistbuildermincssmap
If you want a particular version of escher add a version tag like this
httpsnpmcdncomescher-vis140-beta3jsdistescherjs
For an example of the boilerplate code that is required to begin developing with Escher have a look at the escher-demorepository For projects built with npm use the escher-test repository as a guide
762 Building and testing Escher
First install dependencies with npm
npm install
Escher uses grunt to manage the build process To run typical build steps just run
npm run compile
To test the JavaScript files run
npm run test
For Python testing run this in the py directory
python setuppy test
Build the static website
python setuppy build_gh
Clear static website files
python setuppy clean
Build and run the docs
cd docsmake htmlcd _buildhtml
76 Developing with Escher 31
Escher Documentation Release 143
python -m SimpleHTTPServer python 2python -m httpserver python 3
763 Generating and reading Escher and COBRA files
The Escher file format
Escher layouts are defined by JSON files that follow a specific schema using json schema The latest schemafor Escher JSON files is here The Escher schemas are versioned with inspiration from SchemaVer Theeschervalidate module can be used to validate models against the schema
The Escher layout schema is designed to be as simple as possible For example the core metabolism map of Es-cherichia coli is layed out like this
[
map_name E coli coreCore metabolismmap_id 2938hoq32a1map_description E coli core metabolic networknLast Modified Fri Dec 05 2014 163944 GMT-0800 (PST)homepage httpseschergithubioschema httpseschergithubioescherjsonschema1-0-0
reactions nodes text_label canvas
x 7857062530517567y 31436893920898433width 5894515691375733height 4860457037353515
]
The map_name includes the model that was used to build this layout followed by a period and then a readable namefor the map The map_id is a unique identifier for this map The map_description describes the map and thelast time it was modified Both the homepage and the schema entries must have exactly these values for the Eschermap to be valid
In the next section the reactions nodes labels and canvas are all defined For reactions nodes and text labels eachelement has a key that is an arbitrary integer As long as there are no repeated IDs (eg no 2 segments with the ID517) then everything should work fine
Read through the schema (here) for more detail on the format
The COBRA file format
COBRA models are also saved as JSON files This format has not been documented with a schema but you canbrowse through the core metabolism model as a guide to generating valid COBRA models
I still need help
If you are interested in developing with Escher and you need more information than what is provided in the documen-tation please contact Zachary King (zaking-AT-ucsd-DOT-edu)
32 Chapter 7 Contents
Escher Documentation Release 143
77 EscherConverter
EscherConverter is a standalone program that reads files created with the graphical network editor Escher and convertsthem to files in community standard formats
Download EscherConverter 05 (137 MB)
771 Using EscherConverter
Escher uses a JSON file format to represent its networks This format has been developed because of its very small filesize and its compatibility to online programs that are written in JavaScript In particular JSON is a JavaScript ObjectNotation or in other words a JSON file directly represents components of JavaScript programs This makes parsingvery simple and allows direct use of those files in web-based programs
However in systems biology specific file formats have been developed with the aim to be easily exchangeable betweensoftware implemented in diverse programming languages
To this end these formats support semantically clear annotations and are maintained by a large community of scientistsEscherConverter supports export to two particularly important XML-based community file formats SBML with layoutextension and SBGN-ML
While SBML has been mainly developed for dynamic simulation of biological networks it is nowadays also usablefor diverse other purposes Its layout extension facilitates the encoding the display of biological networks
SBGN-ML has been directly developed as a language for the display of biological pathway maps of diverse kinds Itstores the position and connection of entities similar to what is shown in Escher networks
EscherConverter takes Escherrsquos JSON files as input and generates equivalent SBML Level 3 Version 1 files with layoutextension or SBGN-ML files
In order to ensure that the conversion is correct EscherConverter provides its own display that gives users a previewof how the export data format will be rendered by other tools In this preview display you can zoom in and out movearcs and node positions However it is important to know that none of the changes made in this preview are stored inthe export file
Download and Installation
You can obtain local copy of EscherConverter by clicking here
As a Javatrade application no specific installation is required for EscherConverter
However make sure you have a recent Javatrade Runtime Environment (JRE) installed on your computer (at least JRE8) You can obtain Javatrade from the Oracle website There you can also find installation instructions for your respectiveoperating system
Once Javatrade has been installed you can simply place the EscherConverter JAR file somewhere on your local computerfor instance in the folder
bull Applications if you are working under Mac OS
77 EscherConverter 33
Escher Documentation Release 143
bull opt for Linux computers
bull CProgram Files if you are using Windows
Launching the program
You can launch EscherConverter simply by double-clicking on the application JAR file This will open a followinggraphical user interface as described in the following figures
Figure 1 | The graphical user interface of EscherConverter
bull Preferences opens a settings dialog (see next screenshot)
bull Open displays a file chooser to select an input file in JSON format
bull Save export the map that is displayed in the current tab to SBML or SBGN-ML
bull Discard closes the current tab without saving
bull Help opens the online help that displays all command-line options
bull License displays the license under which this software is distributed
bull About shows information about the authors of this software
bull Main the main panel of the software in which converted Escher maps will be displayed organized in tabs
bull Status the status bar shows information and logging messages during the conversion
34 Chapter 7 Contents
Escher Documentation Release 143
Figure 2 | The preferences dialog All settings in this dialog are also available through EscherConverterrsquos command-line interface
Layout section several properties that are required in SBML and SBGN-ML are not explicitly specified in EscherrsquosJSON format and therefore need to be adjusted by the user These are the size of the drawing canvas the default boxsize for text labels the size of primary and secondary nodes In contrast to SBGN-ML and Escherrsquos JSON formatthe SBML layout extension supports three-dimensional displays When selecting this export file format it is thereforenecessary to also define the z-coordinate and the depth of all objects
Components and naming section Most settings in this section are specific for the SBML layout extension and areonly active if this output format is selected These are names and identifiers of the layout component and the in caseof SBML mandatory default compartment (a compartment without physical meaning a reaction space in which allmetabolites are located) EscherConverter can infer compartment bounds from metabolites but this is an experimentalfeature Just try it and see how the preview changes
77 EscherConverter 35
Escher Documentation Release 143
Figure 3 | A layout preview
The birds-eye view and the navigation component on the left help you navigate through the network display Thisgraph shows you how the converted pathway map will be rendered by software that supports SBGN-ML or the SBMLlayout extension This preview can be modified by moving arcs or nodes however none of those changes are storedwhen exporting the file In this current version EscherConver only exports layouts as given in the original JSON file
Included third-party software
EscherConverter includes several third-party libraries which we here list and acknowledge
bull ArgParser
bull JSBML
bull libSBGN
bull Pixel-Mixer icons
bull yFiles
772 Command-line interface API
You can launch EscherConverter from the command-line On a Unix system (such as Linux MacOS or Solaris etc)use a command like
bash$ java -jar -Xms8G -Xmx8G -Duserlanguage=en EscherConverter-05jar [options]
Under Window use a command like
Cgt javaw -jar -Xms8G -Xmx8G -Duserlanguage=en EscherConverter-05jar [options]
Escher has a large collection of command-line options (see below) which can be useful if you want to launch theprogram with specific settings or if multiple files are to be converted in a batch mode It is even possible to completelydisable the graphical user interface
36 Chapter 7 Contents
Escher Documentation Release 143
Input and output files
Definition of input and output data files as well as the format for the output
--input=ltFilegt
Specifies the JSON input file If a directory is given the conversion will be recursively performed Accepts JSON
--output=ltFilegt
The path to the file into which the output should be written If the input is a directory this must also be a directory inorder to perform a recursive conversion Accepts SBML SBGN
Escher layout
The options in this group allow you to influence how large certain elements should be displayed
--canvas-default-height=ltDoublegt
Just as in the case of the width of the canvas this value needs to be specified for cases where the JSON input file lacksan explicit specification of the canvas height Arguments must fit into the range [11E9] (Default value 2500)
--canvas-default-width=ltDoublegt
This value is used when no width has been defined for the canvas Since the width attribute is mandatory for the layouta default value must be provided in these cases Arguments must fit into the range [11E9] (Default value 2500)
--label-height=ltDoublegt
With this option you can specify the height of the bounding box of text labels Arguments must fit into the range[11E9] (Default value 500)
--label-width=ltDoublegt
This option defines the width of bounding boxes for text labels Arguments must fit into the range [11E9] (Defaultvalue 1600)
--node-depth=ltDoublegt
The length of nodes along z-coordinate Escher maps are actually two-dimensional but in general a layout can bethree-dimensional This value should be an arbitrary value greater than zero because some rendering engines mightnot display the node if its depth is zero Arguments must fit into the range [11E9] (Default value 10)
--node-label-height=ltDoublegt
Node labels can have a size different from general labels in the graph Here you can specify how height the boundingbox of the labels for nodes should be Arguments must fit into the range [11E9] (Default value 200)
--primary-node-height=ltDoublegt
The primary node should be bigger than the secondary node With this option you can specify the height of this typeof nodes Arguments must fit into the range [11E9] (Default value 300)
--primary-node-width=ltDoublegt
Escher maps distinguish between primary and secondary nodes Primary nodes should be larger than secondary nodesand display the main flow of matter through the network This option allows you to specify the width of primarynodes Arguments must fit into the range [11E9] (Default value 300)
77 EscherConverter 37
Escher Documentation Release 143
--reaction-label-height=ltDoublegt
Reaction label heightArguments must fit into the range [11E9] (Default value 300)
--reaction-node-ratio=ltDoublegt
This value is used as a conversion factor to determine the size of the reaction display box depending on the size ofprimary nodes Height and width of reaction nodes are determined by dividing the corresponding values from theprimary node size by this factor Arguments must fit into the range [01] (Default value 05)
--secondary-node-ratio=ltDoublegt
Similar to the reaction node ratio the size of secondary nodes (width and height) is determined by dividing thecorresponding values from the primary nodes by this value Arguments must fit into the range [01] (Default value06666666666666666)
--z=ltDoublegt
The position on the z-axis where the entire two-dimensional graph should be drawn Arguments must fit into the range[-1E91E9] (Default value 00)
Escher Components and their naming
Here you can influence which elements are to be included in the layout and how elements in the layout are to be calledor identified
--format=ltOutputFormatgt
The desired format for the conversion eg SBML All possible values for type ltOutputFormatgt are SBGN andSBML (Default value SBML)
--layout-id=ltStringgt
In contrast to the name this identifier does not have to be human-readable This is a machine identifier which muststart with a letter or underscore and can only contain ASCII characters (Default value Escher_Layout)
--layout-name=ltStringgt
This should be a human-readable name for the layout that is to be created This name might be displayed to describethe figure and should therefore be explanatory (Default value Escher Layout)
--compartment-id=ltStringgt
A compartment needs to have a unique identifier which needs to be a machine-readable Sting that must start with aletter or underscore and can only contain ASCII characters Since the JSON file does not provide this information thisoption allows you to specify the required identifier (Default value default)
--compartment-name=ltStringgt
With this option it is possible to define a name for the default compartment can be that needs to be generated for theconversion to SBML The name does not have any restrictions ie any UTF-8 character can be used (Default valueDefault compartment)
--infer-compartment-bounds
This converter can infer where the boundaries of compartments could be drawn To this end it uses each nodersquos BiGGids to identify the compartment of all metabolites Assuming that compartments have rectangular shapes the algorithmcan find the outermost node on each side of the box and hence obtain the boundaries of the compartment However
38 Chapter 7 Contents
Escher Documentation Release 143
this methods will fail when metabolites are drawn inside of such a box that belong to a different compartment that isactually further outside For this reason this option is deactivated by default (Default value false)
Options for the graphical user interface
--gui
If this option is given the program will display its graphical user interface (Default value false)
--log-level=ltStringgt
Change the log-level of this application This option will influence how fine-grained error and other log messages willbe that you receive while executing this program All possible values for type ltStringgt are ALL CONFIG FINEFINER FINEST INFO OFF SEVERE and WARNING (Default value INFO)
--log-file=ltFilegt
This option allows you to specify a log file to which all information of the program will be written Accepts (bp2bp3 log owl xml)
78 JavaScript API
class escherBuilder(map_data model_data embedded_css selection options)A Builder object contains all the UI and logic to generate a map builder or viewer
Arguments
bull map_data (object) ndash The data for a map to be passed to escherMapfrom_data() Ifnull then an empty Builder is initialized
bull model_data (object) ndash The data for a cobra model to be passed to es-cherCobraModel() Can be null
bull embedded_css (string) ndash The stylesheet for the SVG elements in the Escher map
bull selection (object) ndash (Optional Default In the body element) The d3 selection of anelement to place the Builder into The selection cannot be inside an SVG element
bull options (object) ndash (Optional) An object defining any of the following options
optionsmenu(Default rsquoallrsquo) The type of menu that will be displayed Can be lsquoallrsquo for the fullmenu or lsquozoomrsquo for just zoom buttons The lsquoallrsquo option requires the full set of Escherdependencies (D3js JQuery and Bootstrap) while the lsquozoomrsquo option requires only D3jsFor more details see Developing with Escher
optionsscroll_behavior(Default rsquopanrsquo) This option determines the effect that the scroll wheel will have onan Escher map Can be lsquopanrsquo to pan the map or lsquozoomrsquo to zoom the map when the usermoves the scroll wheel
optionsuse_3d_transform(Default Chooses a good option by testing the browser) If true then use CSS3 3D trans-forms to speed up panning and zooming This feature will only work on browsers thatsupport the 3D transforms It works best in the latest versions of Chrome Firefox andInternet Explorer Safari works better with this turned off
78 JavaScript API 39
Escher Documentation Release 143
optionsenable_editing(Default true) If true then display the map editing functions If false then hide themand only allow the user to view the map
optionenable_keys(Default true) If true then enable keyboard shortcuts
optionsenable_search(Default true) If true then enable indexing of the map for search Use false to disablesearching and potentially improve the map performance
optionsfill_screen(Default false) Use true to fill the screen when an Escher Builder is placed in a top-level container (eg a div in the body element)
optionsfull_screen_button(Default false) Include a button in the user interface for entering full screen mode
optionsignore_bootstrap(Default false) Do not use Bootstrap for buttons even if it available This is used toembed Escher in a Jupyter notebook where it conflicts with the Jupyter Boostrap installa-tion
Map model and styles
optionsstarting_reaction(Default null) The ID (as a string) of a reaction to draw when the Builder loads
optionsnever_ask_before_quit(Default false) If false then display a warning before the user closes an Eschermap If true then never display the warning This options is only respected if op-tionsenable_editing == true If enable_editing is false then the warnings are not dis-played
optionsunique_map_id(Default null) A unique ID that will be used to UI elements donrsquot interfere whenmultiple maps are in the same HTML document
optionsprimary_metabolite_radius(Default 15) The radius of primary metabolites in px
optionssecondary_metabolite_radius(Default 10) The radius of secondary metabolites in px
optionsmarker_radius(Default 5) The radius of marker nodes in px
optionsgene_font_size(Default 18) The font size of the gene reaction rules in px
optionshide_secondary_metabolites(Default false) If true then secondary nodes and segments are hidden This is conve-nient for generating simplified map figures
optionsshow_gene_reaction_rules(Default false) If true then show the gene reaction rules even without gene data
optionshide_all_labels(Default false) If checked hide all reaction gene and metabolite labels
Applied data
40 Chapter 7 Contents
Escher Documentation Release 143
optionsreaction_data(Default null) An object with reaction ids for keys and reaction data points for values
optionsreaction_stylesDefault [rsquocolorrsquo rsquosizersquo rsquotextrsquo]
An array of style types The array can contain any of the following lsquocolorrsquo lsquosizersquo lsquotextrsquolsquoabsrsquo The lsquocolorrsquo style means that the reactions will be colored according to the loadeddataset The lsquosizersquo style means that the reactions will be sized according to the loadeddataset The lsquotextrsquo style means that the data values will be displayed in the reactionlabels The lsquoabsrsquo style means the the absolute values of reaction values will be used fordata visualization
optionsreaction_compare_style(Default rsquodiffrsquo) How to compare to datasets Can be either lsquofold lsquolog2_foldrsquo orlsquodiffrsquo
optionsreaction_scaleDefault
[ type min color c8c8c8 size 12 type median color 9696ff size 20 type max color ff0000 size 25 ]
An array of objects that define points on the data scale
Each point is an object with a type attribute Types can be lsquominrsquo lsquomaxrsquo lsquomeanrsquo lsquoQ1rsquo (firstquartile) lsquomedianrsquo lsquoQ3rsquo (third quartile) or lsquovaluersquo Each point can have a color attributethat specifies a color with a string (any CSS color specification is allowed including hexrgb and rgba) Each point can have a size attirbute that specifies a reaction thickness as anumber Finally points with type lsquovaluersquo can have a value attribute that specifies an exactnumber for pont in the scale
NOTE If lsquominrsquo or lsquomaxrsquo is not provided Escher automatically adds them To be com-pletely clear about what you expect to see on the map it is best to provide lsquominrsquo andlsquomaxrsquo in addition to other scale points
Here are examples of each type
type rsquominrsquo color rsquoredrsquo size 12 Specifies that reactionsnear the minimum value are red and have thickness 12
type rsquoQ1rsquo color rsquorgba(100 100 50 05)rsquo size 12 Specifies that reactions near the first quartile have the given color opacity andthickness
type rsquomeanrsquo color rsquorgb(100 100 50)rsquo size 50 Specifies that reactions near the mean value have the given color and thickness
type rsquovaluersquo value 85 color rsquo333rsquo size 50 Specifies that reactions near 85 value have the given color and size
optionsreaction_no_data_color(Default rsquodcdcdcrsquo) The color of reactions with no data value
optionsreaction_no_data_size(Default 8) The size of reactions with no data value
optionsgene_data(Default null) An object with Gene ids for keys and gene data points for values
78 JavaScript API 41
Escher Documentation Release 143
optionsand_method_in_gene_reaction_rule(Default mean) When evaluating a gene reaction rule use this function to evaluate ANDrules Can be lsquomeanrsquo or lsquominrsquo
optionsmetabolite_data(Default null) An object with metabolite ids for keys and metabolite data points forvalues
optionsmetabolite_stylesDefault [rsquocolorrsquo rsquosizersquo rsquotextrsquo]
An array of style types The array can contain any of the following lsquocolorrsquo lsquosizersquo lsquotextrsquolsquoabsrsquo The lsquocolorrsquo style means that the metabolites will be colored according to the loadeddataset The lsquosizersquo style means that the metabolites will be sized according to the loadeddataset The lsquotextrsquo style means that the data values will be displayed in the metabolitelabels The lsquoabsrsquo style means the the absolute values of metabolite values will be used fordata visualization
optionsmetabolite_compare_style(Default rsquodiffrsquo) How to compare to datasets Can be either lsquofoldrsquo lsquolog2_foldrsquo orlsquodiffrsquo
optionsmetabolite_scaleDefault
[ type min color fffaf0 size 20 type median color f1c470 size 30 type max color 800000 size 40 ]
An array of objects that define points on the data scale See the description of op-tionsreaction_scale for an explanation of the format
optionsmetabolite_no_data_color(Default rsquoffffffrsquo) The color of metabolites with no data value
optionsmetabolite_no_data_size(Default 10) The size of metabolites with no data value
View and build options
optionsidentifiers_on_map(Default rsquobigg_idrsquo) The identifiers that will be displayed in reaction metabolite andgene labels Can be lsquobigg_idrsquo or lsquonamersquo
optionshighlight_missing(Default false) If true then highlight in red reactions that are not in the loaded COBRAmodel
optionsallow_building_duplicate_reactions(Default true) If true then building duplicate reactions is allowed If false then dupli-cate reactions are hidden in Add reaction mode
optionscofactors(Default [rsquoatprsquo rsquoadprsquo rsquonadrsquo rsquonadhrsquo rsquonadprsquo rsquonadphrsquorsquogtprsquo rsquogdprsquo rsquohrsquo rsquocoarsquo rsquoumprsquo rsquoh20rsquo rsquoppirsquo]) A list of metabo-lite IDs to treat as cofactors These will be secondary metabolites in new reactions
Callbacks
optionsfirst_load_callbackA function to run after loading the Builder
42 Chapter 7 Contents
Escher Documentation Release 143
load_map(map_data[ should_update_data])Load a map for the loaded data Also reloads most of the Builder content
Arguments
bull map_data ndash The data for a map
bull should_update_data (Boolean) ndash (Default true) Whether data should be ap-plied to the map
load_model(model_data[ should_update_data])Load the cobra model from model data
Arguments
bull model_data ndash The data for a Cobra model (Parsing in done by escherCobraModel)
bull should_update_data (Boolean) ndash (Default true) Whether data should be ap-plied to the model
view_mode()Enter view mode
build_mode()Enter build mode
brush_mode()Enter brush mode
zoom_mode()Enter zoom mode
rotate_mode()Enter rotate mode
text_mode()Enter text mode
set_reaction_data(data)
Arguments
bull data (array) ndash An array of 1 or 2 objects where each object has keys that are reactionIDrsquos and values that are data points (numbers)
set_metabolite_data(data)
Arguments
bull data (array) ndash An array of 1 or 2 objects where each object has keys that are metaboliteIDrsquos and values that are data points (numbers)
set_gene_data(data clear_gene_reaction_rules)
Arguments
bull data (array) ndash An array of 1 or 2 objects where each object has keys that are gene IDrsquosand values that are data points (numbers)
Arguments
bull clear_gene_reaction_rules (Boolean) ndash (Optional Default false) In addi-tion to setting the data also turn of the gene_reaction_rules
78 JavaScript API 43
Escher Documentation Release 143
79 Python API
class escherBuilder(map_name=None map_json=None model=None model_name=Nonemodel_json=None embedded_css=None reaction_data=None metabo-lite_data=None gene_data=None local_host=None id=None safe=Falsekwargs)
A metabolic map that can be viewed edited and used to visualize data
This map will also show metabolic fluxes passed in during consruction It can be viewed as a standalone htmlinside a browswer Alternately the respresentation inside an IPython notebook will also display the map
Maps are stored in json files and are stored in a cache directory Maps which are not found will be downloadedfrom a map repository if found
Parameters
bull map_name ndash A string specifying a map to be downloaded from the Escher web server orloaded from the cache
bull map_json ndash A JSON string or a file path to a JSON file or a URL specifying a JSON fileto be downloaded
bull model ndash A Cobra model
bull model_name ndash A string specifying a model to be downloaded from the Escher web serveror loaded from the cache
bull model_json ndash A JSON string or a file path to a JSON file or a URL specifying a JSONfile to be downloaded
bull embedded_css ndash The CSS (as a string) to be embedded with the Escher SVG
bull reaction_data ndash A dictionary with keys that correspond to reaction ids and values thatwill be mapped to reaction arrows and labels
bull metabolite_data ndash A dictionary with keys that correspond to metabolite ids and valuesthat will be mapped to metabolite nodes and labels
bull gene_data ndash A dictionary with keys that correspond to gene ids and values that will bemapped to corresponding reactions
bull local_host ndash A hostname that will be used for any local files This is generally usedfor using the notebook offline and for testing in the IPython Notebook with modified Eschercode An example value for local_host is lsquohttplocalhost7778lsquo
bull id ndash Specify an id to make the javascript data definitions unique A random id is chosen bydefault
bull safe ndash If True then loading files from the filesytem is not allowed This is to ensure thesafety of using Builder within a web server
Keyword Arguments
These are defined in the Javascript API
bulluse_3d_transform
bullenable_search
bullfill_screen
bullzoom_to_element
bullfull_screen_button
44 Chapter 7 Contents
Escher Documentation Release 143
bullstarting_reaction
bullunique_map_id
bullprimary_metabolite_radius
bullsecondary_metabolite_radius
bullmarker_radius
bullgene_font_size
bullhide_secondary_metabolites
bullshow_gene_reaction_rules
bullhide_all_labels
bullreaction_styles
bullreaction_compare_style
bullreaction_scale
bullreaction_no_data_color
bullreaction_no_data_size
bulland_method_in_gene_reaction_rule
bullmetabolite_styles
bullmetabolite_compare_style
bullmetabolite_scale
bullmetabolite_no_data_color
bullmetabolite_no_data_size
bullidentifiers_on_map
bullhighlight_missing
bullallow_building_duplicate_reactions
bullcofactors
All keyword arguments can also be set on an existing Builder object using setter functions eg
my_builderset_reaction_styles(new_styles)
display_in_browser(ip=lsquo127001rsquo port=7655 n_retries=50 js_source=rsquowebrsquo menu=rsquoallrsquoscroll_behavior=rsquopanrsquo enable_editing=True enable_keys=True mini-fied_js=True never_ask_before_quit=False)
Launch a web browser to view the map
Parameters
bull ip ndash The IP address to serve the map on
bull port ndash The port to serve the map on If specified the port is occupied then a random freeport will be used
bull n_retries (int) ndash The number of times the server will try to find a port before quitting
bull js_source (string) ndash Can be one of the following
ndash web (Default) - Use JavaScript files from eschergithubio
79 Python API 45
Escher Documentation Release 143
ndash local - Use compiled JavaScript files in the local Escher installation Works offline
ndash dev - No longer necessary with source maps This now gives the same behavior aslsquolocalrsquo
bull menu (string) ndash Menu bar options include
ndash none - No menu or buttons
ndash zoom - Just zoom buttons
ndash all (Default) - Menu and button bar (requires Bootstrap)
bull scroll_behavior (string) ndash Scroll behavior options
ndash pan - Pan the map
ndash zoom - Zoom the map
ndash none (Default) - No scroll events
bull enable_editing (Boolean) ndash Enable the map editing modes
bull enable_keys (Boolean) ndash Enable keyboard shortcuts
bull minified_js (Boolean) ndash If True use the minified version of JavaScript and CSSfiles
bull never_ask_before_quit (Boolean) ndash Never display an alert asking if you wantto leave the page By default this message is displayed if enable_editing is True
display_in_notebook(js_source=rsquowebrsquo menu=rsquozoomrsquo scroll_behavior=rsquononersquo mini-fied_js=True height=500 enable_editing=False)
Embed the Map within the current IPython Notebook
Parameters
bull js_source (string) ndash Can be one of the following
ndash web (Default) - Use JavaScript files from eschergithubio
ndash local - Use compiled JavaScript files in the local Escher installation Works offline
ndash dev - No longer necessary with source maps This now gives the same behav-ior as lsquolocalrsquo
bull menu (string) ndash Menu bar options include
ndash none - No menu or buttons
ndash zoom - Just zoom buttons
ndash Note The all menu option does not work in an IPython notebook
bull scroll_behavior (string) ndash Scroll behavior options
ndash pan - Pan the map
ndash zoom - Zoom the map
ndash none - (Default) No scroll events
bull minified_js (Boolean) ndash If True use the minified version of JavaScript andCSS files
bull height ndash Height of the HTML container
bull enable_editing (Boolean) ndash Enable the map editing modes
46 Chapter 7 Contents
Escher Documentation Release 143
save_html(filepath=None overwrite=False js_source=rsquowebrsquo protocol=rsquohttpsrsquo menu=rsquoallrsquoscroll_behavior=rsquopanrsquo enable_editing=True enable_keys=True minified_js=Truenever_ask_before_quit=False static_site_index_json=None)
Save an HTML file containing the map
Parameters
bull filepath (string) ndash The HTML file will be saved to this location Whenjs_source is lsquolocalrsquo then a new directory will be created with this name
bull overwrite (Boolean) ndash Overwrite existing files
bull js_source (string) ndash Can be one of the following
ndash web (Default) - Use JavaScript files from eschergithubio
ndash local - Use compiled JavaScript files in the local Escher installation Works of-fline To make the dependencies available to the downloaded file a new directorywill be made with the name specified by filepath
ndash dev - No longer necessary with source maps This now gives the same behav-ior as lsquolocalrsquo
bull protocol (string) ndash The protocol can be lsquohttprsquo lsquohttpsrsquo or None which indicatesa lsquoprotocol relative URLrsquo as in eschergithubio Ignored if source is local
bull menu (string) ndash Menu bar options include
ndash none - No menu or buttons
ndash zoom - Just zoom buttons
ndash all (Default) - Menu and button bar (requires Bootstrap)
bull scroll_behavior (string) ndash Scroll behavior options
ndash pan - Pan the map
ndash zoom - Zoom the map
ndash none (Default) - No scroll events
bull enable_editing (Boolean) ndash Enable the map editing modes
bull enable_keys (Boolean) ndash Enable keyboard shortcuts
bull minified_js (Boolean) ndash If True use the minified version of JavaScript andCSS files
bull height (number) ndash Height of the HTML container
bull never_ask_before_quit (Boolean) ndash Never display an alert asking if youwant to leave the page By default this message is displayed if enable_editing isTrue
bull static_site_index_json (string) ndash The index as a JSON string for thestatic site Use javascript to parse the URL options Used for generating static pages(see static_sitepy)
791 Cache
escherget_cache_dir(versioned=True name=None)Get the cache dir as a string and make the directory if it does not already exist
Parameters
79 Python API 47
Escher Documentation Release 143
bull versioned (Boolean) ndash Whether to return the versioned path in the cache Eschermaps for the latest version of Escher are found in the versioned directory (versioned= True) but maps for previous versions of Escher can be found by visiting the parentdirectory (versioned = False)
bull name (string) ndash An optional subdirectory within the cache If versioned is False thenname is ignored
escherclear_cache(different_cache_dir=None ask=True)Empty the contents of the cache directory including all versions of all maps and models
Parameters
bull different_cache_dir (string) ndash (Optional) The directory of another cacheThis is mainly for testing
bull ask (Boolean) ndash Whether to ask before deleting
escherlist_cached_maps()Return a list of all cached maps
escherlist_cached_models()Return a list of all cached models
escherlist_available_maps()Return a list of all maps available on the server
escherlist_available_models()Return a list of all models available on the server
710 License
Escher and EscherConverter are distributed under the MIT license
bull genindex
48 Chapter 7 Contents
Python Module Index
eescher 44
49
Escher Documentation Release 143
50 Python Module Index
Index
Bbrush_mode() (built-in function) 43build_mode() (built-in function) 43Builder (class in escher) 44
Cclear_cache() (in module escher) 48
Ddisplay_in_browser() (escherBuilder method) 45display_in_notebook() (escherBuilder method) 46
Eescher (module) 44escherBuilder() (class) 39
Gget_cache_dir() (in module escher) 47
Llist_available_maps() (in module escher) 48list_available_models() (in module escher) 48list_cached_maps() (in module escher) 48list_cached_models() (in module escher) 48load_map() (built-in function) 42load_model() (built-in function) 43
Ooptionenable_keys (option attribute) 40optionsallow_building_duplicate_reactions (options at-
tribute) 42optionsand_method_in_gene_reaction_rule (options at-
tribute) 41optionscofactors (options attribute) 42optionsenable_editing (options attribute) 39optionsenable_search (options attribute) 40optionsfill_screen (options attribute) 40optionsfirst_load_callback (options attribute) 42optionsfull_screen_button (options attribute) 40optionsgene_data (options attribute) 41
optionsgene_font_size (options attribute) 40optionshide_all_labels (options attribute) 40optionshide_secondary_metabolites (options attribute)
40optionshighlight_missing (options attribute) 42optionsidentifiers_on_map (options attribute) 42optionsignore_bootstrap (options attribute) 40optionsmarker_radius (options attribute) 40optionsmenu (options attribute) 39optionsmetabolite_compare_style (options attribute) 42optionsmetabolite_data (options attribute) 42optionsmetabolite_no_data_color (options attribute) 42optionsmetabolite_no_data_size (options attribute) 42optionsmetabolite_scale (options attribute) 42optionsmetabolite_styles (options attribute) 42optionsnever_ask_before_quit (options attribute) 40optionsprimary_metabolite_radius (options attribute) 40optionsreaction_compare_style (options attribute) 41optionsreaction_data (options attribute) 40optionsreaction_no_data_color (options attribute) 41optionsreaction_no_data_size (options attribute) 41optionsreaction_scale (options attribute) 41optionsreaction_styles (options attribute) 41optionsscroll_behavior (options attribute) 39optionssecondary_metabolite_radius (options attribute)
40optionsshow_gene_reaction_rules (options attribute) 40optionsstarting_reaction (options attribute) 40optionsunique_map_id (options attribute) 40optionsuse_3d_transform (options attribute) 39
Rrotate_mode() (built-in function) 43
Ssave_html() (escherBuilder method) 46set_gene_data() (built-in function) 43set_metabolite_data() (built-in function) 43set_reaction_data() (built-in function) 43
51
Escher Documentation Release 143
Ttext_mode() (built-in function) 43
Vview_mode() (built-in function) 43
Zzoom_mode() (built-in function) 43
52 Index
Escher Documentation Release 143
Escher has five major modes and you can switch between those modes using the buttons in the Edit menu or usingthe buttons in the button bar on the left of the screen
1 Pan mode Drag the canvas to pan the map You can also use the mouse scroll wheel or trackpad scroll function(drag with 2 fingers) to pan the map (or to zoom if you selected Scroll to zoom in the settings)
2 Select mode Select nodes by clicking on them Shift-click to select multiple nodes or drag across the canvasto select multiple nodes using the selection brush
3 Add reaction mode If you have loaded a Model then click on the canvas to see a list of reactions that you candraw on the map Click on a node to see reactions that connect to that node In the input box you can search byreaction ID metabolite ID or gene ID (locus tag)
4 Rotate model Before entering rotate mode be sure to select one or more nodes in select mode Then afterentering rotate mode drag anywhere on the canvas to rotate the selection You can also drag the red crosshairsto change the center of the rotation
5 Text mode Use text mode to add text annotations to the map Click on the canvas to add a new text annotationor click an existing annotation to edit it When you are finished click Enter or Escape to save the changes
71 Getting started 21
Escher Documentation Release 143
In addition to the editing modes the Edit menu gives you access to the following commands
bull Delete Delete the currently selected node(s)
bull Undo Undo the last action NOTE Certain actions such as editing the canvas cannot be undone in the currentversion of Escher
bull Redo Redo the last action that was undone
bull Toggle primarysecondary node In Escher each metabolite node is either a primary node or a secondarynode Primary nodes are larger and secondary nodes can be hidden in the Settings menu Use this command totoggle the currently selected node(s) between primary and secondary
bull Rotate reactant locations When you draw a new reaction in Escher this command will rotate the new reactantsso that a new reactant is primary and centered This command is extremely useful when you are drawing a longpathway and you want to quickly switch which metabolite to ldquofollowrdquo eg make sure you are following thecarbon-containing metabolites
If you are confused then try drawing a new pathway and hitting the ldquocrdquo key to see the reactants rotate
bull Select all Select all nodes
bull Select none Unselect all nodes
bull Invert selection Select all the nodes that are currently unselected This feature is very useful when you wantto keep just one part of the map Simply drag to select the part you want to keep call the Invert selectioncommand then call the Delete command
718 Editing the canvas
A somewhat non-obvious feature of Escher is that you can edit the canvas by dragging the canvas edges This ispossible in Pan mode and Select mode
22 Chapter 7 Contents
Escher Documentation Release 143
719 View options
bull Zoom in Zoom in to the map
bull Zoom out Zoom out of the map
bull Zoom to nodes Zoom to see all the nodes on the map
bull Zoom to canvas Zoom to see the entire canvas
bull Find Search for a reaction metabolite or gene on the map
bull Show control points Show the control points you can drag these red and blue circle to adjust the shapes ofthe reactions curves
bull Settings Open the Settings menu
7110 The button bar
The button bar give you quick access to many of the common Escher functions
71 Getting started 23
Escher Documentation Release 143
24 Chapter 7 Contents
Escher Documentation Release 143
7111 Settings
View and build options
bull Identifiers Choose whether to show BiGG IDs or descriptive names for reactions metabolites and genes
bull Hide secondary metabolites This will simplify the map by hiding all secondary metabolites and the pathsconnected to them
bull Show gene reaction rules Show the gene reaction rules below the reaction labels even gene data is not loaded
bull Hide reaction gene and metabolite labels Another option to visually simplify the map this will hide alllabels that are not text annotations
bull Allow duplicate reactions By default duplicate reactions are hidden in the add reaction dropdown menuHowever you can turn this option on to show the duplicate reactions
bull Highlight reactions not in model Highlight in red any reactions that are on the map but are not in the modelThis is useful when you are adapting a map from one model for use with another model
71 Getting started 25
Escher Documentation Release 143
Reaction data settings
When reaction or gene data is loaded this section can be used to change visual settings for reactions
The color bar has individual control points and you can drag the control points (execpt min and max) left and right tochange their values Alternatively you can use the dropdown menu (next to the word median in the figure above) toattach a control point to a statistical measure (mean median first quartile (Q1) or third quartile (Q3)) This lets youchoose a color scale that will adapt to your dataset
For each control point you can choose a color by entering a CSS-style color (eg red ff0000 rgba(20 20 255 05)and you can choose a size that will scale the thickness of reactions
There are also color and size options for reactions that do not have any data value
Finally there are a few onoff settings for the loaded reaction or gene dataset
bull Options These determine how to visualize the datasets Check Absolute value to color and size reactions bythe absolute value of each data value The Size Color and Text options can be unselected to turn off sizingcoloring and data values in reaction labels individually
bull Comparison Determines the comparison algorithm to use when two datasets are loaded
bull Method for evaluating AND Determines the method that will be used to reconcile AND statements in genereaction rules when there is gene data loaded See Gene data and gene reaction rules for more details
Metabolite data settings
The data settings for metabolite data are analagous to those for reaction data The only difference is that size nowrefers to the size of the metabolite circles
26 Chapter 7 Contents
Escher Documentation Release 143
72 Escher COBRA and COBRApy
Escher can be used as an independent application but it draws heavily on the information in COBRA models ACOBRA model is a collection of all the reactions metabolites and genes known to exist in an organism (In theliterature these are generally called genome-scale models (GEMs) but we refer to them as COBRA models here toemphasize that Escher interoperates with models that are exported from COBRApy)
By loading a COBRA model into the Escher interface you have access to every reaction and metabolite in that modelYou also have the gene reaction rules for the reactions in the network which allow you to connect gene data toreactions and metabolites
COBRApy is a software package for COBRA modeling written in Python The Escher Python package uses CO-BRApy package for reading and writing COBRA models
721 Maps and models
In Escher you will see references to maps and models
A map contains the reactions and metabolites that you see in the Escher builder including their locations text annota-tions and the canvas
A model (a COBRA model) contains reactions and metabolites that you have not drawn yet Thus you can load aCOBRA model when you want to draw new reactions on the map
722 What is JSON and why do we use it
Both Escher maps and COBRA models are stored as JSON files JSON is a useful plain-text format for storing nesteddata structures We use JSON much like the SBML community uses XML You may notice that SBML files have axml extension and Escher maps and COBRA models have a json extension
You can use Python to explore a JSON file like this
import json
with open(mapjson r) as fmap_object = jsonload(f)
print map_object[0]print map_object[1][reactions]values()[0]
723 Escher SBML and SBGN
A tool has been developed for converting Escher maps to SBML Layout and SBGN and it will be released soon
COBRA models can be converted to SBML using COBRApy
73 Run Escher locally and in IPython
To run Escher on a local computer or to use Escher in PythonIPython first install it The Python package for Eschercan be installed using pip
pip install escher
72 Escher COBRA and COBRApy 27
Escher Documentation Release 143
Depending on your installation of Python you may need sudo
sudo pip install escher
Alternatively one can download the source files and install the package directly
python setuppy install
731 Escher in the IPython Notebook
Once you have installed Escher locally you can interact with Escher maps in an IPython Notebook
Here are example notebooks to get started with
bull COBRApy and Escher
bull JavaScript development and offline maps
bull Generate JSON models in COBRApy
Dependencies
bull Jinja2
bull Tornado
bull COBRApy 030 or later
732 Running the local server
You can run your own local server if you want to use Escher offline or explore your own maps with the homepagebrowser To get started install the Python package and run from any directory by calling
python -m escherserver
This starts a server at httplocalhost7778 You can also choose another port
python -m escherserver --port=8005
74 Validate and convert maps
741 Validate an Escher map
Escher maps follow a specification using the JSON Schema format Therefore any JSON Schema validator can beused to validate an Escher map by comparing it to the latest schema file For example the current schema is locatedhere
httpsgithubcomzakandrewkingescherblobmasterescherjsonschema1-0-0
To make this easier the Escher Python package includes a validation script To validate a map first install Escher
pip install escher
Then call the validator
python -m eschervalidate my_mapjson
Any errors in the map will print to the console
28 Chapter 7 Contents
Escher Documentation Release 143
742 Convert or upgrade an Escher map
Any Escher maps built with pre-release versions of Escher will not load right away in the stable v10 release Toconvert pre-release maps to the new format follow these steps
1 Install Escher
pip install escher
2 Find a COBRA model for your maps This COBRA model will be used to update the content of the mapin order to support all the new Escher features You can use a COBRA model encoded as SBML or JSON(generated with COBRApy v030b4 or later) The COBRA models currently available on the Escher websitecan be downloaded from the BiGG Models website
httpbiggucsdedu
For a refresher on the distinction between Escher maps COBRA models and their file types (SBML JSONSBML Layout) see Escher COBRA and COBRApy
3 Run the convert_map script to convert your existing Escher map (my_old_mapjson) to the new formatusing a COBRA model (model_filejson or model_filexml in these examples)
With a JSON file modelpython -m escherconvert_map my_old_mapjson pathtomodel_filejson
With an SBML modelpython -m escherconvert_map my_old_mapjson pathtomodel_filexml
Those commands will generate a new map called my_old_map_convertedjson that will load in Escher v10and later
75 Building and contributing maps
We are excited to collect pathway maps for every organism with a well characterized metabolic network This sectiondescribes the process of building a new map either from scratch or using a COBRA model with BiGG IDs
751 Building from scratch
To build a map from scratch you will first need a COBRA model for your map See the section Escher COBRA andCOBRApy for some background information on COBRA models
If you would like to eventually contribute your map to the Escher website it is important that your COBRA modeladheres to the identifiers in the BiGG Database Escher and BiGG are being developed together and we want tomaintain consistency and interoperability between them
Once you have a COBRA model you can follow these steps
1 Load your model in the Escher Builder
2 Begin building new reactions If you are familiar with the genes in your organism then try search for newreactions by their gene IDs
3 Limit each map to ~200 reactions Maps larger than this will slow down the Escher viewer especially on oldbrowsers Rather than building one giant map Escher is designed for building many smaller subsystem maps
4 When you have built a map for your a subsystem save the map as JSON with a name that includes the modelID followed by a period followed by the name of the subsystem For example
75 Building and contributing maps 29
Escher Documentation Release 143
iMM904Amino acid biosynthesisjson
5 (Optional) Once you have a set of subsystem maps you can set up a local Escher server so that subsystem mapsappear in the ldquoquick jumprdquo menu in the bottom right corner of the screen (as seen here for iJO1366) To setthis up you will need to start a local server as describe in Running the local server Next find your local cachedirectory by running this command in a terminal
python -c import escher print(escherget_cache_dir(name=maps))
This will print the location of the local maps cache Add your new subsystem maps to cache folder Now whenyou run the server (described in Running the local server) you should see that quick jump menu appear
NOTE The cache directory is organized into folders for organisms You can use these folder for filtering byorganism on the local launch page or you can place the maps in the top directory
NOTE 2 A similar approach can be used to access your models from the local launch page Place maps in thefolder indicated by
python -c import escher print(escherget_cache_dir(name=models))
752 Building from an existing map for a similar organism
Follow the instruction above except rather than starting from scratch load an existing Escher map for a differentorganism
Once you have the new model loaded use the Update names and gene reaction rules using model button in theModel menu to convert all descriptive names and gene reaction rules in the model to those in the map Reactions thatdo not match the model will be highlighted in red (This can be turned off again in the settings menu by deselectingHighlight reactions not in model)
Now visit each highlighted reaction and see if you can replace it with an equivalent biochemical pathway from themodel If not then delete the reaction and move on
Finally when there are no highlighted reactions left you can repeat this for other subsystems
753 Submitting maps to the Escher website
If you would like to contribute maps to Escher you can make a Pull Request to the GitHub repository eschergithubioMake sure there is a folder with the name of the organism in 1-0-0maps For example a new yeast map goes inthe folder
1-0-0mapsSaccharomyces cerevisiae
Then name your map by concatenating the model ID and the map name separated by a period For example a yeastmap built with the genome-scale model iMM904 could be named
iMM904Amino acid biosynthesisjson
Then add the JSON file for the model to the Pull Request if that model is not already available As before make afolder for your organism within 1-0-0models The model filename is just the model ID
In this example a correct Pull Request would include the following files
1-0-0mapsSaccharomyces cerevisiaeiMM904Amino acid biosynthesisjson1-0-0modelsSaccharomyces cerevisiaeiMM904json
30 Chapter 7 Contents
Escher Documentation Release 143
76 Developing with Escher
761 Using the static JavaScript and CSS files
You can include the compiled Escher JavaScript and CSS files in any HTML document The only dependencies ared3js and optionally Twitter Bootstrap if you are using the option menu=rsquoallrsquo
The compiled files are available form npmcdn
httpsnpmcdncomescher-visjsdistescherjshttpsnpmcdncomescher-visjsdistescherminjshttpsnpmcdncomescher-viscssdistbuildercsshttpsnpmcdncomescher-viscssdistbuildermincss
Source maps are also hosted there
httpsnpmcdncomescher-visjsdistescherjsmaphttpsnpmcdncomescher-visjsdistescherminjsmaphttpsnpmcdncomescher-viscssdistbuildermincssmap
If you want a particular version of escher add a version tag like this
httpsnpmcdncomescher-vis140-beta3jsdistescherjs
For an example of the boilerplate code that is required to begin developing with Escher have a look at the escher-demorepository For projects built with npm use the escher-test repository as a guide
762 Building and testing Escher
First install dependencies with npm
npm install
Escher uses grunt to manage the build process To run typical build steps just run
npm run compile
To test the JavaScript files run
npm run test
For Python testing run this in the py directory
python setuppy test
Build the static website
python setuppy build_gh
Clear static website files
python setuppy clean
Build and run the docs
cd docsmake htmlcd _buildhtml
76 Developing with Escher 31
Escher Documentation Release 143
python -m SimpleHTTPServer python 2python -m httpserver python 3
763 Generating and reading Escher and COBRA files
The Escher file format
Escher layouts are defined by JSON files that follow a specific schema using json schema The latest schemafor Escher JSON files is here The Escher schemas are versioned with inspiration from SchemaVer Theeschervalidate module can be used to validate models against the schema
The Escher layout schema is designed to be as simple as possible For example the core metabolism map of Es-cherichia coli is layed out like this
[
map_name E coli coreCore metabolismmap_id 2938hoq32a1map_description E coli core metabolic networknLast Modified Fri Dec 05 2014 163944 GMT-0800 (PST)homepage httpseschergithubioschema httpseschergithubioescherjsonschema1-0-0
reactions nodes text_label canvas
x 7857062530517567y 31436893920898433width 5894515691375733height 4860457037353515
]
The map_name includes the model that was used to build this layout followed by a period and then a readable namefor the map The map_id is a unique identifier for this map The map_description describes the map and thelast time it was modified Both the homepage and the schema entries must have exactly these values for the Eschermap to be valid
In the next section the reactions nodes labels and canvas are all defined For reactions nodes and text labels eachelement has a key that is an arbitrary integer As long as there are no repeated IDs (eg no 2 segments with the ID517) then everything should work fine
Read through the schema (here) for more detail on the format
The COBRA file format
COBRA models are also saved as JSON files This format has not been documented with a schema but you canbrowse through the core metabolism model as a guide to generating valid COBRA models
I still need help
If you are interested in developing with Escher and you need more information than what is provided in the documen-tation please contact Zachary King (zaking-AT-ucsd-DOT-edu)
32 Chapter 7 Contents
Escher Documentation Release 143
77 EscherConverter
EscherConverter is a standalone program that reads files created with the graphical network editor Escher and convertsthem to files in community standard formats
Download EscherConverter 05 (137 MB)
771 Using EscherConverter
Escher uses a JSON file format to represent its networks This format has been developed because of its very small filesize and its compatibility to online programs that are written in JavaScript In particular JSON is a JavaScript ObjectNotation or in other words a JSON file directly represents components of JavaScript programs This makes parsingvery simple and allows direct use of those files in web-based programs
However in systems biology specific file formats have been developed with the aim to be easily exchangeable betweensoftware implemented in diverse programming languages
To this end these formats support semantically clear annotations and are maintained by a large community of scientistsEscherConverter supports export to two particularly important XML-based community file formats SBML with layoutextension and SBGN-ML
While SBML has been mainly developed for dynamic simulation of biological networks it is nowadays also usablefor diverse other purposes Its layout extension facilitates the encoding the display of biological networks
SBGN-ML has been directly developed as a language for the display of biological pathway maps of diverse kinds Itstores the position and connection of entities similar to what is shown in Escher networks
EscherConverter takes Escherrsquos JSON files as input and generates equivalent SBML Level 3 Version 1 files with layoutextension or SBGN-ML files
In order to ensure that the conversion is correct EscherConverter provides its own display that gives users a previewof how the export data format will be rendered by other tools In this preview display you can zoom in and out movearcs and node positions However it is important to know that none of the changes made in this preview are stored inthe export file
Download and Installation
You can obtain local copy of EscherConverter by clicking here
As a Javatrade application no specific installation is required for EscherConverter
However make sure you have a recent Javatrade Runtime Environment (JRE) installed on your computer (at least JRE8) You can obtain Javatrade from the Oracle website There you can also find installation instructions for your respectiveoperating system
Once Javatrade has been installed you can simply place the EscherConverter JAR file somewhere on your local computerfor instance in the folder
bull Applications if you are working under Mac OS
77 EscherConverter 33
Escher Documentation Release 143
bull opt for Linux computers
bull CProgram Files if you are using Windows
Launching the program
You can launch EscherConverter simply by double-clicking on the application JAR file This will open a followinggraphical user interface as described in the following figures
Figure 1 | The graphical user interface of EscherConverter
bull Preferences opens a settings dialog (see next screenshot)
bull Open displays a file chooser to select an input file in JSON format
bull Save export the map that is displayed in the current tab to SBML or SBGN-ML
bull Discard closes the current tab without saving
bull Help opens the online help that displays all command-line options
bull License displays the license under which this software is distributed
bull About shows information about the authors of this software
bull Main the main panel of the software in which converted Escher maps will be displayed organized in tabs
bull Status the status bar shows information and logging messages during the conversion
34 Chapter 7 Contents
Escher Documentation Release 143
Figure 2 | The preferences dialog All settings in this dialog are also available through EscherConverterrsquos command-line interface
Layout section several properties that are required in SBML and SBGN-ML are not explicitly specified in EscherrsquosJSON format and therefore need to be adjusted by the user These are the size of the drawing canvas the default boxsize for text labels the size of primary and secondary nodes In contrast to SBGN-ML and Escherrsquos JSON formatthe SBML layout extension supports three-dimensional displays When selecting this export file format it is thereforenecessary to also define the z-coordinate and the depth of all objects
Components and naming section Most settings in this section are specific for the SBML layout extension and areonly active if this output format is selected These are names and identifiers of the layout component and the in caseof SBML mandatory default compartment (a compartment without physical meaning a reaction space in which allmetabolites are located) EscherConverter can infer compartment bounds from metabolites but this is an experimentalfeature Just try it and see how the preview changes
77 EscherConverter 35
Escher Documentation Release 143
Figure 3 | A layout preview
The birds-eye view and the navigation component on the left help you navigate through the network display Thisgraph shows you how the converted pathway map will be rendered by software that supports SBGN-ML or the SBMLlayout extension This preview can be modified by moving arcs or nodes however none of those changes are storedwhen exporting the file In this current version EscherConver only exports layouts as given in the original JSON file
Included third-party software
EscherConverter includes several third-party libraries which we here list and acknowledge
bull ArgParser
bull JSBML
bull libSBGN
bull Pixel-Mixer icons
bull yFiles
772 Command-line interface API
You can launch EscherConverter from the command-line On a Unix system (such as Linux MacOS or Solaris etc)use a command like
bash$ java -jar -Xms8G -Xmx8G -Duserlanguage=en EscherConverter-05jar [options]
Under Window use a command like
Cgt javaw -jar -Xms8G -Xmx8G -Duserlanguage=en EscherConverter-05jar [options]
Escher has a large collection of command-line options (see below) which can be useful if you want to launch theprogram with specific settings or if multiple files are to be converted in a batch mode It is even possible to completelydisable the graphical user interface
36 Chapter 7 Contents
Escher Documentation Release 143
Input and output files
Definition of input and output data files as well as the format for the output
--input=ltFilegt
Specifies the JSON input file If a directory is given the conversion will be recursively performed Accepts JSON
--output=ltFilegt
The path to the file into which the output should be written If the input is a directory this must also be a directory inorder to perform a recursive conversion Accepts SBML SBGN
Escher layout
The options in this group allow you to influence how large certain elements should be displayed
--canvas-default-height=ltDoublegt
Just as in the case of the width of the canvas this value needs to be specified for cases where the JSON input file lacksan explicit specification of the canvas height Arguments must fit into the range [11E9] (Default value 2500)
--canvas-default-width=ltDoublegt
This value is used when no width has been defined for the canvas Since the width attribute is mandatory for the layouta default value must be provided in these cases Arguments must fit into the range [11E9] (Default value 2500)
--label-height=ltDoublegt
With this option you can specify the height of the bounding box of text labels Arguments must fit into the range[11E9] (Default value 500)
--label-width=ltDoublegt
This option defines the width of bounding boxes for text labels Arguments must fit into the range [11E9] (Defaultvalue 1600)
--node-depth=ltDoublegt
The length of nodes along z-coordinate Escher maps are actually two-dimensional but in general a layout can bethree-dimensional This value should be an arbitrary value greater than zero because some rendering engines mightnot display the node if its depth is zero Arguments must fit into the range [11E9] (Default value 10)
--node-label-height=ltDoublegt
Node labels can have a size different from general labels in the graph Here you can specify how height the boundingbox of the labels for nodes should be Arguments must fit into the range [11E9] (Default value 200)
--primary-node-height=ltDoublegt
The primary node should be bigger than the secondary node With this option you can specify the height of this typeof nodes Arguments must fit into the range [11E9] (Default value 300)
--primary-node-width=ltDoublegt
Escher maps distinguish between primary and secondary nodes Primary nodes should be larger than secondary nodesand display the main flow of matter through the network This option allows you to specify the width of primarynodes Arguments must fit into the range [11E9] (Default value 300)
77 EscherConverter 37
Escher Documentation Release 143
--reaction-label-height=ltDoublegt
Reaction label heightArguments must fit into the range [11E9] (Default value 300)
--reaction-node-ratio=ltDoublegt
This value is used as a conversion factor to determine the size of the reaction display box depending on the size ofprimary nodes Height and width of reaction nodes are determined by dividing the corresponding values from theprimary node size by this factor Arguments must fit into the range [01] (Default value 05)
--secondary-node-ratio=ltDoublegt
Similar to the reaction node ratio the size of secondary nodes (width and height) is determined by dividing thecorresponding values from the primary nodes by this value Arguments must fit into the range [01] (Default value06666666666666666)
--z=ltDoublegt
The position on the z-axis where the entire two-dimensional graph should be drawn Arguments must fit into the range[-1E91E9] (Default value 00)
Escher Components and their naming
Here you can influence which elements are to be included in the layout and how elements in the layout are to be calledor identified
--format=ltOutputFormatgt
The desired format for the conversion eg SBML All possible values for type ltOutputFormatgt are SBGN andSBML (Default value SBML)
--layout-id=ltStringgt
In contrast to the name this identifier does not have to be human-readable This is a machine identifier which muststart with a letter or underscore and can only contain ASCII characters (Default value Escher_Layout)
--layout-name=ltStringgt
This should be a human-readable name for the layout that is to be created This name might be displayed to describethe figure and should therefore be explanatory (Default value Escher Layout)
--compartment-id=ltStringgt
A compartment needs to have a unique identifier which needs to be a machine-readable Sting that must start with aletter or underscore and can only contain ASCII characters Since the JSON file does not provide this information thisoption allows you to specify the required identifier (Default value default)
--compartment-name=ltStringgt
With this option it is possible to define a name for the default compartment can be that needs to be generated for theconversion to SBML The name does not have any restrictions ie any UTF-8 character can be used (Default valueDefault compartment)
--infer-compartment-bounds
This converter can infer where the boundaries of compartments could be drawn To this end it uses each nodersquos BiGGids to identify the compartment of all metabolites Assuming that compartments have rectangular shapes the algorithmcan find the outermost node on each side of the box and hence obtain the boundaries of the compartment However
38 Chapter 7 Contents
Escher Documentation Release 143
this methods will fail when metabolites are drawn inside of such a box that belong to a different compartment that isactually further outside For this reason this option is deactivated by default (Default value false)
Options for the graphical user interface
--gui
If this option is given the program will display its graphical user interface (Default value false)
--log-level=ltStringgt
Change the log-level of this application This option will influence how fine-grained error and other log messages willbe that you receive while executing this program All possible values for type ltStringgt are ALL CONFIG FINEFINER FINEST INFO OFF SEVERE and WARNING (Default value INFO)
--log-file=ltFilegt
This option allows you to specify a log file to which all information of the program will be written Accepts (bp2bp3 log owl xml)
78 JavaScript API
class escherBuilder(map_data model_data embedded_css selection options)A Builder object contains all the UI and logic to generate a map builder or viewer
Arguments
bull map_data (object) ndash The data for a map to be passed to escherMapfrom_data() Ifnull then an empty Builder is initialized
bull model_data (object) ndash The data for a cobra model to be passed to es-cherCobraModel() Can be null
bull embedded_css (string) ndash The stylesheet for the SVG elements in the Escher map
bull selection (object) ndash (Optional Default In the body element) The d3 selection of anelement to place the Builder into The selection cannot be inside an SVG element
bull options (object) ndash (Optional) An object defining any of the following options
optionsmenu(Default rsquoallrsquo) The type of menu that will be displayed Can be lsquoallrsquo for the fullmenu or lsquozoomrsquo for just zoom buttons The lsquoallrsquo option requires the full set of Escherdependencies (D3js JQuery and Bootstrap) while the lsquozoomrsquo option requires only D3jsFor more details see Developing with Escher
optionsscroll_behavior(Default rsquopanrsquo) This option determines the effect that the scroll wheel will have onan Escher map Can be lsquopanrsquo to pan the map or lsquozoomrsquo to zoom the map when the usermoves the scroll wheel
optionsuse_3d_transform(Default Chooses a good option by testing the browser) If true then use CSS3 3D trans-forms to speed up panning and zooming This feature will only work on browsers thatsupport the 3D transforms It works best in the latest versions of Chrome Firefox andInternet Explorer Safari works better with this turned off
78 JavaScript API 39
Escher Documentation Release 143
optionsenable_editing(Default true) If true then display the map editing functions If false then hide themand only allow the user to view the map
optionenable_keys(Default true) If true then enable keyboard shortcuts
optionsenable_search(Default true) If true then enable indexing of the map for search Use false to disablesearching and potentially improve the map performance
optionsfill_screen(Default false) Use true to fill the screen when an Escher Builder is placed in a top-level container (eg a div in the body element)
optionsfull_screen_button(Default false) Include a button in the user interface for entering full screen mode
optionsignore_bootstrap(Default false) Do not use Bootstrap for buttons even if it available This is used toembed Escher in a Jupyter notebook where it conflicts with the Jupyter Boostrap installa-tion
Map model and styles
optionsstarting_reaction(Default null) The ID (as a string) of a reaction to draw when the Builder loads
optionsnever_ask_before_quit(Default false) If false then display a warning before the user closes an Eschermap If true then never display the warning This options is only respected if op-tionsenable_editing == true If enable_editing is false then the warnings are not dis-played
optionsunique_map_id(Default null) A unique ID that will be used to UI elements donrsquot interfere whenmultiple maps are in the same HTML document
optionsprimary_metabolite_radius(Default 15) The radius of primary metabolites in px
optionssecondary_metabolite_radius(Default 10) The radius of secondary metabolites in px
optionsmarker_radius(Default 5) The radius of marker nodes in px
optionsgene_font_size(Default 18) The font size of the gene reaction rules in px
optionshide_secondary_metabolites(Default false) If true then secondary nodes and segments are hidden This is conve-nient for generating simplified map figures
optionsshow_gene_reaction_rules(Default false) If true then show the gene reaction rules even without gene data
optionshide_all_labels(Default false) If checked hide all reaction gene and metabolite labels
Applied data
40 Chapter 7 Contents
Escher Documentation Release 143
optionsreaction_data(Default null) An object with reaction ids for keys and reaction data points for values
optionsreaction_stylesDefault [rsquocolorrsquo rsquosizersquo rsquotextrsquo]
An array of style types The array can contain any of the following lsquocolorrsquo lsquosizersquo lsquotextrsquolsquoabsrsquo The lsquocolorrsquo style means that the reactions will be colored according to the loadeddataset The lsquosizersquo style means that the reactions will be sized according to the loadeddataset The lsquotextrsquo style means that the data values will be displayed in the reactionlabels The lsquoabsrsquo style means the the absolute values of reaction values will be used fordata visualization
optionsreaction_compare_style(Default rsquodiffrsquo) How to compare to datasets Can be either lsquofold lsquolog2_foldrsquo orlsquodiffrsquo
optionsreaction_scaleDefault
[ type min color c8c8c8 size 12 type median color 9696ff size 20 type max color ff0000 size 25 ]
An array of objects that define points on the data scale
Each point is an object with a type attribute Types can be lsquominrsquo lsquomaxrsquo lsquomeanrsquo lsquoQ1rsquo (firstquartile) lsquomedianrsquo lsquoQ3rsquo (third quartile) or lsquovaluersquo Each point can have a color attributethat specifies a color with a string (any CSS color specification is allowed including hexrgb and rgba) Each point can have a size attirbute that specifies a reaction thickness as anumber Finally points with type lsquovaluersquo can have a value attribute that specifies an exactnumber for pont in the scale
NOTE If lsquominrsquo or lsquomaxrsquo is not provided Escher automatically adds them To be com-pletely clear about what you expect to see on the map it is best to provide lsquominrsquo andlsquomaxrsquo in addition to other scale points
Here are examples of each type
type rsquominrsquo color rsquoredrsquo size 12 Specifies that reactionsnear the minimum value are red and have thickness 12
type rsquoQ1rsquo color rsquorgba(100 100 50 05)rsquo size 12 Specifies that reactions near the first quartile have the given color opacity andthickness
type rsquomeanrsquo color rsquorgb(100 100 50)rsquo size 50 Specifies that reactions near the mean value have the given color and thickness
type rsquovaluersquo value 85 color rsquo333rsquo size 50 Specifies that reactions near 85 value have the given color and size
optionsreaction_no_data_color(Default rsquodcdcdcrsquo) The color of reactions with no data value
optionsreaction_no_data_size(Default 8) The size of reactions with no data value
optionsgene_data(Default null) An object with Gene ids for keys and gene data points for values
78 JavaScript API 41
Escher Documentation Release 143
optionsand_method_in_gene_reaction_rule(Default mean) When evaluating a gene reaction rule use this function to evaluate ANDrules Can be lsquomeanrsquo or lsquominrsquo
optionsmetabolite_data(Default null) An object with metabolite ids for keys and metabolite data points forvalues
optionsmetabolite_stylesDefault [rsquocolorrsquo rsquosizersquo rsquotextrsquo]
An array of style types The array can contain any of the following lsquocolorrsquo lsquosizersquo lsquotextrsquolsquoabsrsquo The lsquocolorrsquo style means that the metabolites will be colored according to the loadeddataset The lsquosizersquo style means that the metabolites will be sized according to the loadeddataset The lsquotextrsquo style means that the data values will be displayed in the metabolitelabels The lsquoabsrsquo style means the the absolute values of metabolite values will be used fordata visualization
optionsmetabolite_compare_style(Default rsquodiffrsquo) How to compare to datasets Can be either lsquofoldrsquo lsquolog2_foldrsquo orlsquodiffrsquo
optionsmetabolite_scaleDefault
[ type min color fffaf0 size 20 type median color f1c470 size 30 type max color 800000 size 40 ]
An array of objects that define points on the data scale See the description of op-tionsreaction_scale for an explanation of the format
optionsmetabolite_no_data_color(Default rsquoffffffrsquo) The color of metabolites with no data value
optionsmetabolite_no_data_size(Default 10) The size of metabolites with no data value
View and build options
optionsidentifiers_on_map(Default rsquobigg_idrsquo) The identifiers that will be displayed in reaction metabolite andgene labels Can be lsquobigg_idrsquo or lsquonamersquo
optionshighlight_missing(Default false) If true then highlight in red reactions that are not in the loaded COBRAmodel
optionsallow_building_duplicate_reactions(Default true) If true then building duplicate reactions is allowed If false then dupli-cate reactions are hidden in Add reaction mode
optionscofactors(Default [rsquoatprsquo rsquoadprsquo rsquonadrsquo rsquonadhrsquo rsquonadprsquo rsquonadphrsquorsquogtprsquo rsquogdprsquo rsquohrsquo rsquocoarsquo rsquoumprsquo rsquoh20rsquo rsquoppirsquo]) A list of metabo-lite IDs to treat as cofactors These will be secondary metabolites in new reactions
Callbacks
optionsfirst_load_callbackA function to run after loading the Builder
42 Chapter 7 Contents
Escher Documentation Release 143
load_map(map_data[ should_update_data])Load a map for the loaded data Also reloads most of the Builder content
Arguments
bull map_data ndash The data for a map
bull should_update_data (Boolean) ndash (Default true) Whether data should be ap-plied to the map
load_model(model_data[ should_update_data])Load the cobra model from model data
Arguments
bull model_data ndash The data for a Cobra model (Parsing in done by escherCobraModel)
bull should_update_data (Boolean) ndash (Default true) Whether data should be ap-plied to the model
view_mode()Enter view mode
build_mode()Enter build mode
brush_mode()Enter brush mode
zoom_mode()Enter zoom mode
rotate_mode()Enter rotate mode
text_mode()Enter text mode
set_reaction_data(data)
Arguments
bull data (array) ndash An array of 1 or 2 objects where each object has keys that are reactionIDrsquos and values that are data points (numbers)
set_metabolite_data(data)
Arguments
bull data (array) ndash An array of 1 or 2 objects where each object has keys that are metaboliteIDrsquos and values that are data points (numbers)
set_gene_data(data clear_gene_reaction_rules)
Arguments
bull data (array) ndash An array of 1 or 2 objects where each object has keys that are gene IDrsquosand values that are data points (numbers)
Arguments
bull clear_gene_reaction_rules (Boolean) ndash (Optional Default false) In addi-tion to setting the data also turn of the gene_reaction_rules
78 JavaScript API 43
Escher Documentation Release 143
79 Python API
class escherBuilder(map_name=None map_json=None model=None model_name=Nonemodel_json=None embedded_css=None reaction_data=None metabo-lite_data=None gene_data=None local_host=None id=None safe=Falsekwargs)
A metabolic map that can be viewed edited and used to visualize data
This map will also show metabolic fluxes passed in during consruction It can be viewed as a standalone htmlinside a browswer Alternately the respresentation inside an IPython notebook will also display the map
Maps are stored in json files and are stored in a cache directory Maps which are not found will be downloadedfrom a map repository if found
Parameters
bull map_name ndash A string specifying a map to be downloaded from the Escher web server orloaded from the cache
bull map_json ndash A JSON string or a file path to a JSON file or a URL specifying a JSON fileto be downloaded
bull model ndash A Cobra model
bull model_name ndash A string specifying a model to be downloaded from the Escher web serveror loaded from the cache
bull model_json ndash A JSON string or a file path to a JSON file or a URL specifying a JSONfile to be downloaded
bull embedded_css ndash The CSS (as a string) to be embedded with the Escher SVG
bull reaction_data ndash A dictionary with keys that correspond to reaction ids and values thatwill be mapped to reaction arrows and labels
bull metabolite_data ndash A dictionary with keys that correspond to metabolite ids and valuesthat will be mapped to metabolite nodes and labels
bull gene_data ndash A dictionary with keys that correspond to gene ids and values that will bemapped to corresponding reactions
bull local_host ndash A hostname that will be used for any local files This is generally usedfor using the notebook offline and for testing in the IPython Notebook with modified Eschercode An example value for local_host is lsquohttplocalhost7778lsquo
bull id ndash Specify an id to make the javascript data definitions unique A random id is chosen bydefault
bull safe ndash If True then loading files from the filesytem is not allowed This is to ensure thesafety of using Builder within a web server
Keyword Arguments
These are defined in the Javascript API
bulluse_3d_transform
bullenable_search
bullfill_screen
bullzoom_to_element
bullfull_screen_button
44 Chapter 7 Contents
Escher Documentation Release 143
bullstarting_reaction
bullunique_map_id
bullprimary_metabolite_radius
bullsecondary_metabolite_radius
bullmarker_radius
bullgene_font_size
bullhide_secondary_metabolites
bullshow_gene_reaction_rules
bullhide_all_labels
bullreaction_styles
bullreaction_compare_style
bullreaction_scale
bullreaction_no_data_color
bullreaction_no_data_size
bulland_method_in_gene_reaction_rule
bullmetabolite_styles
bullmetabolite_compare_style
bullmetabolite_scale
bullmetabolite_no_data_color
bullmetabolite_no_data_size
bullidentifiers_on_map
bullhighlight_missing
bullallow_building_duplicate_reactions
bullcofactors
All keyword arguments can also be set on an existing Builder object using setter functions eg
my_builderset_reaction_styles(new_styles)
display_in_browser(ip=lsquo127001rsquo port=7655 n_retries=50 js_source=rsquowebrsquo menu=rsquoallrsquoscroll_behavior=rsquopanrsquo enable_editing=True enable_keys=True mini-fied_js=True never_ask_before_quit=False)
Launch a web browser to view the map
Parameters
bull ip ndash The IP address to serve the map on
bull port ndash The port to serve the map on If specified the port is occupied then a random freeport will be used
bull n_retries (int) ndash The number of times the server will try to find a port before quitting
bull js_source (string) ndash Can be one of the following
ndash web (Default) - Use JavaScript files from eschergithubio
79 Python API 45
Escher Documentation Release 143
ndash local - Use compiled JavaScript files in the local Escher installation Works offline
ndash dev - No longer necessary with source maps This now gives the same behavior aslsquolocalrsquo
bull menu (string) ndash Menu bar options include
ndash none - No menu or buttons
ndash zoom - Just zoom buttons
ndash all (Default) - Menu and button bar (requires Bootstrap)
bull scroll_behavior (string) ndash Scroll behavior options
ndash pan - Pan the map
ndash zoom - Zoom the map
ndash none (Default) - No scroll events
bull enable_editing (Boolean) ndash Enable the map editing modes
bull enable_keys (Boolean) ndash Enable keyboard shortcuts
bull minified_js (Boolean) ndash If True use the minified version of JavaScript and CSSfiles
bull never_ask_before_quit (Boolean) ndash Never display an alert asking if you wantto leave the page By default this message is displayed if enable_editing is True
display_in_notebook(js_source=rsquowebrsquo menu=rsquozoomrsquo scroll_behavior=rsquononersquo mini-fied_js=True height=500 enable_editing=False)
Embed the Map within the current IPython Notebook
Parameters
bull js_source (string) ndash Can be one of the following
ndash web (Default) - Use JavaScript files from eschergithubio
ndash local - Use compiled JavaScript files in the local Escher installation Works offline
ndash dev - No longer necessary with source maps This now gives the same behav-ior as lsquolocalrsquo
bull menu (string) ndash Menu bar options include
ndash none - No menu or buttons
ndash zoom - Just zoom buttons
ndash Note The all menu option does not work in an IPython notebook
bull scroll_behavior (string) ndash Scroll behavior options
ndash pan - Pan the map
ndash zoom - Zoom the map
ndash none - (Default) No scroll events
bull minified_js (Boolean) ndash If True use the minified version of JavaScript andCSS files
bull height ndash Height of the HTML container
bull enable_editing (Boolean) ndash Enable the map editing modes
46 Chapter 7 Contents
Escher Documentation Release 143
save_html(filepath=None overwrite=False js_source=rsquowebrsquo protocol=rsquohttpsrsquo menu=rsquoallrsquoscroll_behavior=rsquopanrsquo enable_editing=True enable_keys=True minified_js=Truenever_ask_before_quit=False static_site_index_json=None)
Save an HTML file containing the map
Parameters
bull filepath (string) ndash The HTML file will be saved to this location Whenjs_source is lsquolocalrsquo then a new directory will be created with this name
bull overwrite (Boolean) ndash Overwrite existing files
bull js_source (string) ndash Can be one of the following
ndash web (Default) - Use JavaScript files from eschergithubio
ndash local - Use compiled JavaScript files in the local Escher installation Works of-fline To make the dependencies available to the downloaded file a new directorywill be made with the name specified by filepath
ndash dev - No longer necessary with source maps This now gives the same behav-ior as lsquolocalrsquo
bull protocol (string) ndash The protocol can be lsquohttprsquo lsquohttpsrsquo or None which indicatesa lsquoprotocol relative URLrsquo as in eschergithubio Ignored if source is local
bull menu (string) ndash Menu bar options include
ndash none - No menu or buttons
ndash zoom - Just zoom buttons
ndash all (Default) - Menu and button bar (requires Bootstrap)
bull scroll_behavior (string) ndash Scroll behavior options
ndash pan - Pan the map
ndash zoom - Zoom the map
ndash none (Default) - No scroll events
bull enable_editing (Boolean) ndash Enable the map editing modes
bull enable_keys (Boolean) ndash Enable keyboard shortcuts
bull minified_js (Boolean) ndash If True use the minified version of JavaScript andCSS files
bull height (number) ndash Height of the HTML container
bull never_ask_before_quit (Boolean) ndash Never display an alert asking if youwant to leave the page By default this message is displayed if enable_editing isTrue
bull static_site_index_json (string) ndash The index as a JSON string for thestatic site Use javascript to parse the URL options Used for generating static pages(see static_sitepy)
791 Cache
escherget_cache_dir(versioned=True name=None)Get the cache dir as a string and make the directory if it does not already exist
Parameters
79 Python API 47
Escher Documentation Release 143
bull versioned (Boolean) ndash Whether to return the versioned path in the cache Eschermaps for the latest version of Escher are found in the versioned directory (versioned= True) but maps for previous versions of Escher can be found by visiting the parentdirectory (versioned = False)
bull name (string) ndash An optional subdirectory within the cache If versioned is False thenname is ignored
escherclear_cache(different_cache_dir=None ask=True)Empty the contents of the cache directory including all versions of all maps and models
Parameters
bull different_cache_dir (string) ndash (Optional) The directory of another cacheThis is mainly for testing
bull ask (Boolean) ndash Whether to ask before deleting
escherlist_cached_maps()Return a list of all cached maps
escherlist_cached_models()Return a list of all cached models
escherlist_available_maps()Return a list of all maps available on the server
escherlist_available_models()Return a list of all models available on the server
710 License
Escher and EscherConverter are distributed under the MIT license
bull genindex
48 Chapter 7 Contents
Python Module Index
eescher 44
49
Escher Documentation Release 143
50 Python Module Index
Index
Bbrush_mode() (built-in function) 43build_mode() (built-in function) 43Builder (class in escher) 44
Cclear_cache() (in module escher) 48
Ddisplay_in_browser() (escherBuilder method) 45display_in_notebook() (escherBuilder method) 46
Eescher (module) 44escherBuilder() (class) 39
Gget_cache_dir() (in module escher) 47
Llist_available_maps() (in module escher) 48list_available_models() (in module escher) 48list_cached_maps() (in module escher) 48list_cached_models() (in module escher) 48load_map() (built-in function) 42load_model() (built-in function) 43
Ooptionenable_keys (option attribute) 40optionsallow_building_duplicate_reactions (options at-
tribute) 42optionsand_method_in_gene_reaction_rule (options at-
tribute) 41optionscofactors (options attribute) 42optionsenable_editing (options attribute) 39optionsenable_search (options attribute) 40optionsfill_screen (options attribute) 40optionsfirst_load_callback (options attribute) 42optionsfull_screen_button (options attribute) 40optionsgene_data (options attribute) 41
optionsgene_font_size (options attribute) 40optionshide_all_labels (options attribute) 40optionshide_secondary_metabolites (options attribute)
40optionshighlight_missing (options attribute) 42optionsidentifiers_on_map (options attribute) 42optionsignore_bootstrap (options attribute) 40optionsmarker_radius (options attribute) 40optionsmenu (options attribute) 39optionsmetabolite_compare_style (options attribute) 42optionsmetabolite_data (options attribute) 42optionsmetabolite_no_data_color (options attribute) 42optionsmetabolite_no_data_size (options attribute) 42optionsmetabolite_scale (options attribute) 42optionsmetabolite_styles (options attribute) 42optionsnever_ask_before_quit (options attribute) 40optionsprimary_metabolite_radius (options attribute) 40optionsreaction_compare_style (options attribute) 41optionsreaction_data (options attribute) 40optionsreaction_no_data_color (options attribute) 41optionsreaction_no_data_size (options attribute) 41optionsreaction_scale (options attribute) 41optionsreaction_styles (options attribute) 41optionsscroll_behavior (options attribute) 39optionssecondary_metabolite_radius (options attribute)
40optionsshow_gene_reaction_rules (options attribute) 40optionsstarting_reaction (options attribute) 40optionsunique_map_id (options attribute) 40optionsuse_3d_transform (options attribute) 39
Rrotate_mode() (built-in function) 43
Ssave_html() (escherBuilder method) 46set_gene_data() (built-in function) 43set_metabolite_data() (built-in function) 43set_reaction_data() (built-in function) 43
51
Escher Documentation Release 143
Ttext_mode() (built-in function) 43
Vview_mode() (built-in function) 43
Zzoom_mode() (built-in function) 43
52 Index
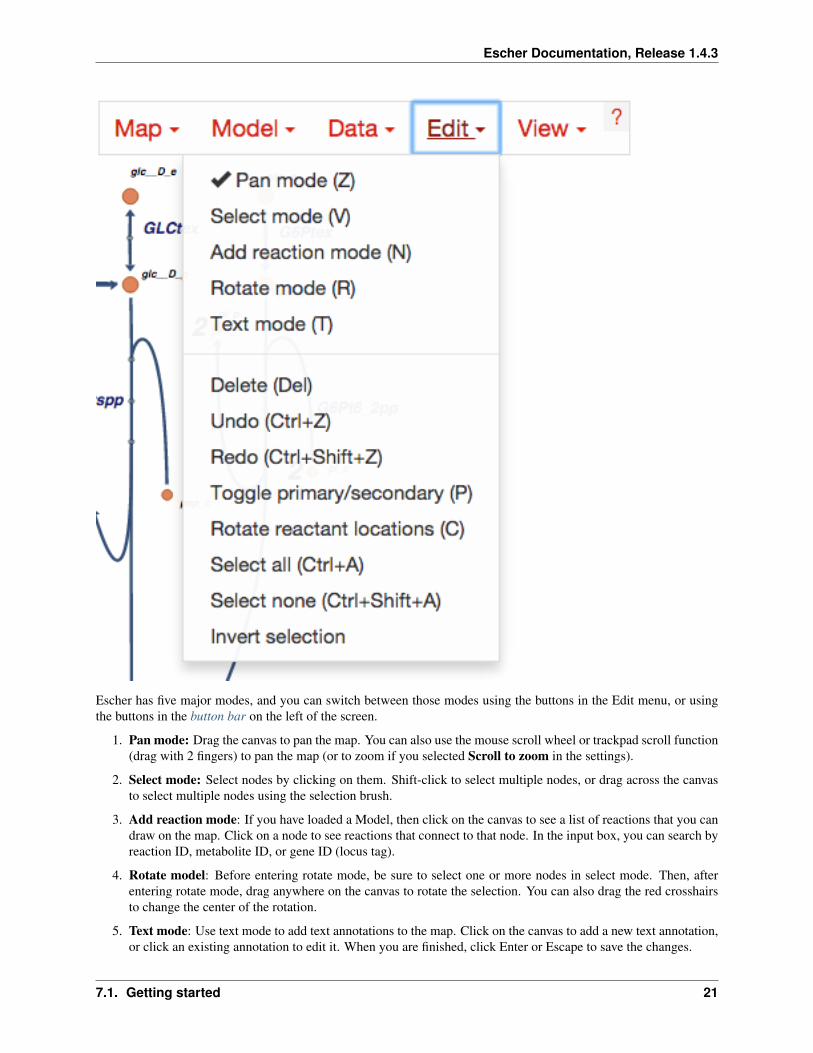
Escher Documentation Release 143
In addition to the editing modes the Edit menu gives you access to the following commands
bull Delete Delete the currently selected node(s)
bull Undo Undo the last action NOTE Certain actions such as editing the canvas cannot be undone in the currentversion of Escher
bull Redo Redo the last action that was undone
bull Toggle primarysecondary node In Escher each metabolite node is either a primary node or a secondarynode Primary nodes are larger and secondary nodes can be hidden in the Settings menu Use this command totoggle the currently selected node(s) between primary and secondary
bull Rotate reactant locations When you draw a new reaction in Escher this command will rotate the new reactantsso that a new reactant is primary and centered This command is extremely useful when you are drawing a longpathway and you want to quickly switch which metabolite to ldquofollowrdquo eg make sure you are following thecarbon-containing metabolites
If you are confused then try drawing a new pathway and hitting the ldquocrdquo key to see the reactants rotate
bull Select all Select all nodes
bull Select none Unselect all nodes
bull Invert selection Select all the nodes that are currently unselected This feature is very useful when you wantto keep just one part of the map Simply drag to select the part you want to keep call the Invert selectioncommand then call the Delete command
718 Editing the canvas
A somewhat non-obvious feature of Escher is that you can edit the canvas by dragging the canvas edges This ispossible in Pan mode and Select mode
22 Chapter 7 Contents
Escher Documentation Release 143
719 View options
bull Zoom in Zoom in to the map
bull Zoom out Zoom out of the map
bull Zoom to nodes Zoom to see all the nodes on the map
bull Zoom to canvas Zoom to see the entire canvas
bull Find Search for a reaction metabolite or gene on the map
bull Show control points Show the control points you can drag these red and blue circle to adjust the shapes ofthe reactions curves
bull Settings Open the Settings menu
7110 The button bar
The button bar give you quick access to many of the common Escher functions
71 Getting started 23
Escher Documentation Release 143
24 Chapter 7 Contents
Escher Documentation Release 143
7111 Settings
View and build options
bull Identifiers Choose whether to show BiGG IDs or descriptive names for reactions metabolites and genes
bull Hide secondary metabolites This will simplify the map by hiding all secondary metabolites and the pathsconnected to them
bull Show gene reaction rules Show the gene reaction rules below the reaction labels even gene data is not loaded
bull Hide reaction gene and metabolite labels Another option to visually simplify the map this will hide alllabels that are not text annotations
bull Allow duplicate reactions By default duplicate reactions are hidden in the add reaction dropdown menuHowever you can turn this option on to show the duplicate reactions
bull Highlight reactions not in model Highlight in red any reactions that are on the map but are not in the modelThis is useful when you are adapting a map from one model for use with another model
71 Getting started 25
Escher Documentation Release 143
Reaction data settings
When reaction or gene data is loaded this section can be used to change visual settings for reactions
The color bar has individual control points and you can drag the control points (execpt min and max) left and right tochange their values Alternatively you can use the dropdown menu (next to the word median in the figure above) toattach a control point to a statistical measure (mean median first quartile (Q1) or third quartile (Q3)) This lets youchoose a color scale that will adapt to your dataset
For each control point you can choose a color by entering a CSS-style color (eg red ff0000 rgba(20 20 255 05)and you can choose a size that will scale the thickness of reactions
There are also color and size options for reactions that do not have any data value
Finally there are a few onoff settings for the loaded reaction or gene dataset
bull Options These determine how to visualize the datasets Check Absolute value to color and size reactions bythe absolute value of each data value The Size Color and Text options can be unselected to turn off sizingcoloring and data values in reaction labels individually
bull Comparison Determines the comparison algorithm to use when two datasets are loaded
bull Method for evaluating AND Determines the method that will be used to reconcile AND statements in genereaction rules when there is gene data loaded See Gene data and gene reaction rules for more details
Metabolite data settings
The data settings for metabolite data are analagous to those for reaction data The only difference is that size nowrefers to the size of the metabolite circles
26 Chapter 7 Contents
Escher Documentation Release 143
72 Escher COBRA and COBRApy
Escher can be used as an independent application but it draws heavily on the information in COBRA models ACOBRA model is a collection of all the reactions metabolites and genes known to exist in an organism (In theliterature these are generally called genome-scale models (GEMs) but we refer to them as COBRA models here toemphasize that Escher interoperates with models that are exported from COBRApy)
By loading a COBRA model into the Escher interface you have access to every reaction and metabolite in that modelYou also have the gene reaction rules for the reactions in the network which allow you to connect gene data toreactions and metabolites
COBRApy is a software package for COBRA modeling written in Python The Escher Python package uses CO-BRApy package for reading and writing COBRA models
721 Maps and models
In Escher you will see references to maps and models
A map contains the reactions and metabolites that you see in the Escher builder including their locations text annota-tions and the canvas
A model (a COBRA model) contains reactions and metabolites that you have not drawn yet Thus you can load aCOBRA model when you want to draw new reactions on the map
722 What is JSON and why do we use it
Both Escher maps and COBRA models are stored as JSON files JSON is a useful plain-text format for storing nesteddata structures We use JSON much like the SBML community uses XML You may notice that SBML files have axml extension and Escher maps and COBRA models have a json extension
You can use Python to explore a JSON file like this
import json
with open(mapjson r) as fmap_object = jsonload(f)
print map_object[0]print map_object[1][reactions]values()[0]
723 Escher SBML and SBGN
A tool has been developed for converting Escher maps to SBML Layout and SBGN and it will be released soon
COBRA models can be converted to SBML using COBRApy
73 Run Escher locally and in IPython
To run Escher on a local computer or to use Escher in PythonIPython first install it The Python package for Eschercan be installed using pip
pip install escher
72 Escher COBRA and COBRApy 27
Escher Documentation Release 143
Depending on your installation of Python you may need sudo
sudo pip install escher
Alternatively one can download the source files and install the package directly
python setuppy install
731 Escher in the IPython Notebook
Once you have installed Escher locally you can interact with Escher maps in an IPython Notebook
Here are example notebooks to get started with
bull COBRApy and Escher
bull JavaScript development and offline maps
bull Generate JSON models in COBRApy
Dependencies
bull Jinja2
bull Tornado
bull COBRApy 030 or later
732 Running the local server
You can run your own local server if you want to use Escher offline or explore your own maps with the homepagebrowser To get started install the Python package and run from any directory by calling
python -m escherserver
This starts a server at httplocalhost7778 You can also choose another port
python -m escherserver --port=8005
74 Validate and convert maps
741 Validate an Escher map
Escher maps follow a specification using the JSON Schema format Therefore any JSON Schema validator can beused to validate an Escher map by comparing it to the latest schema file For example the current schema is locatedhere
httpsgithubcomzakandrewkingescherblobmasterescherjsonschema1-0-0
To make this easier the Escher Python package includes a validation script To validate a map first install Escher
pip install escher
Then call the validator
python -m eschervalidate my_mapjson
Any errors in the map will print to the console
28 Chapter 7 Contents
Escher Documentation Release 143
742 Convert or upgrade an Escher map
Any Escher maps built with pre-release versions of Escher will not load right away in the stable v10 release Toconvert pre-release maps to the new format follow these steps
1 Install Escher
pip install escher
2 Find a COBRA model for your maps This COBRA model will be used to update the content of the mapin order to support all the new Escher features You can use a COBRA model encoded as SBML or JSON(generated with COBRApy v030b4 or later) The COBRA models currently available on the Escher websitecan be downloaded from the BiGG Models website
httpbiggucsdedu
For a refresher on the distinction between Escher maps COBRA models and their file types (SBML JSONSBML Layout) see Escher COBRA and COBRApy
3 Run the convert_map script to convert your existing Escher map (my_old_mapjson) to the new formatusing a COBRA model (model_filejson or model_filexml in these examples)
With a JSON file modelpython -m escherconvert_map my_old_mapjson pathtomodel_filejson
With an SBML modelpython -m escherconvert_map my_old_mapjson pathtomodel_filexml
Those commands will generate a new map called my_old_map_convertedjson that will load in Escher v10and later
75 Building and contributing maps
We are excited to collect pathway maps for every organism with a well characterized metabolic network This sectiondescribes the process of building a new map either from scratch or using a COBRA model with BiGG IDs
751 Building from scratch
To build a map from scratch you will first need a COBRA model for your map See the section Escher COBRA andCOBRApy for some background information on COBRA models
If you would like to eventually contribute your map to the Escher website it is important that your COBRA modeladheres to the identifiers in the BiGG Database Escher and BiGG are being developed together and we want tomaintain consistency and interoperability between them
Once you have a COBRA model you can follow these steps
1 Load your model in the Escher Builder
2 Begin building new reactions If you are familiar with the genes in your organism then try search for newreactions by their gene IDs
3 Limit each map to ~200 reactions Maps larger than this will slow down the Escher viewer especially on oldbrowsers Rather than building one giant map Escher is designed for building many smaller subsystem maps
4 When you have built a map for your a subsystem save the map as JSON with a name that includes the modelID followed by a period followed by the name of the subsystem For example
75 Building and contributing maps 29
Escher Documentation Release 143
iMM904Amino acid biosynthesisjson
5 (Optional) Once you have a set of subsystem maps you can set up a local Escher server so that subsystem mapsappear in the ldquoquick jumprdquo menu in the bottom right corner of the screen (as seen here for iJO1366) To setthis up you will need to start a local server as describe in Running the local server Next find your local cachedirectory by running this command in a terminal
python -c import escher print(escherget_cache_dir(name=maps))
This will print the location of the local maps cache Add your new subsystem maps to cache folder Now whenyou run the server (described in Running the local server) you should see that quick jump menu appear
NOTE The cache directory is organized into folders for organisms You can use these folder for filtering byorganism on the local launch page or you can place the maps in the top directory
NOTE 2 A similar approach can be used to access your models from the local launch page Place maps in thefolder indicated by
python -c import escher print(escherget_cache_dir(name=models))
752 Building from an existing map for a similar organism
Follow the instruction above except rather than starting from scratch load an existing Escher map for a differentorganism
Once you have the new model loaded use the Update names and gene reaction rules using model button in theModel menu to convert all descriptive names and gene reaction rules in the model to those in the map Reactions thatdo not match the model will be highlighted in red (This can be turned off again in the settings menu by deselectingHighlight reactions not in model)
Now visit each highlighted reaction and see if you can replace it with an equivalent biochemical pathway from themodel If not then delete the reaction and move on
Finally when there are no highlighted reactions left you can repeat this for other subsystems
753 Submitting maps to the Escher website
If you would like to contribute maps to Escher you can make a Pull Request to the GitHub repository eschergithubioMake sure there is a folder with the name of the organism in 1-0-0maps For example a new yeast map goes inthe folder
1-0-0mapsSaccharomyces cerevisiae
Then name your map by concatenating the model ID and the map name separated by a period For example a yeastmap built with the genome-scale model iMM904 could be named
iMM904Amino acid biosynthesisjson
Then add the JSON file for the model to the Pull Request if that model is not already available As before make afolder for your organism within 1-0-0models The model filename is just the model ID
In this example a correct Pull Request would include the following files
1-0-0mapsSaccharomyces cerevisiaeiMM904Amino acid biosynthesisjson1-0-0modelsSaccharomyces cerevisiaeiMM904json
30 Chapter 7 Contents
Escher Documentation Release 143
76 Developing with Escher
761 Using the static JavaScript and CSS files
You can include the compiled Escher JavaScript and CSS files in any HTML document The only dependencies ared3js and optionally Twitter Bootstrap if you are using the option menu=rsquoallrsquo
The compiled files are available form npmcdn
httpsnpmcdncomescher-visjsdistescherjshttpsnpmcdncomescher-visjsdistescherminjshttpsnpmcdncomescher-viscssdistbuildercsshttpsnpmcdncomescher-viscssdistbuildermincss
Source maps are also hosted there
httpsnpmcdncomescher-visjsdistescherjsmaphttpsnpmcdncomescher-visjsdistescherminjsmaphttpsnpmcdncomescher-viscssdistbuildermincssmap
If you want a particular version of escher add a version tag like this
httpsnpmcdncomescher-vis140-beta3jsdistescherjs
For an example of the boilerplate code that is required to begin developing with Escher have a look at the escher-demorepository For projects built with npm use the escher-test repository as a guide
762 Building and testing Escher
First install dependencies with npm
npm install
Escher uses grunt to manage the build process To run typical build steps just run
npm run compile
To test the JavaScript files run
npm run test
For Python testing run this in the py directory
python setuppy test
Build the static website
python setuppy build_gh
Clear static website files
python setuppy clean
Build and run the docs
cd docsmake htmlcd _buildhtml
76 Developing with Escher 31
Escher Documentation Release 143
python -m SimpleHTTPServer python 2python -m httpserver python 3
763 Generating and reading Escher and COBRA files
The Escher file format
Escher layouts are defined by JSON files that follow a specific schema using json schema The latest schemafor Escher JSON files is here The Escher schemas are versioned with inspiration from SchemaVer Theeschervalidate module can be used to validate models against the schema
The Escher layout schema is designed to be as simple as possible For example the core metabolism map of Es-cherichia coli is layed out like this
[
map_name E coli coreCore metabolismmap_id 2938hoq32a1map_description E coli core metabolic networknLast Modified Fri Dec 05 2014 163944 GMT-0800 (PST)homepage httpseschergithubioschema httpseschergithubioescherjsonschema1-0-0
reactions nodes text_label canvas
x 7857062530517567y 31436893920898433width 5894515691375733height 4860457037353515
]
The map_name includes the model that was used to build this layout followed by a period and then a readable namefor the map The map_id is a unique identifier for this map The map_description describes the map and thelast time it was modified Both the homepage and the schema entries must have exactly these values for the Eschermap to be valid
In the next section the reactions nodes labels and canvas are all defined For reactions nodes and text labels eachelement has a key that is an arbitrary integer As long as there are no repeated IDs (eg no 2 segments with the ID517) then everything should work fine
Read through the schema (here) for more detail on the format
The COBRA file format
COBRA models are also saved as JSON files This format has not been documented with a schema but you canbrowse through the core metabolism model as a guide to generating valid COBRA models
I still need help
If you are interested in developing with Escher and you need more information than what is provided in the documen-tation please contact Zachary King (zaking-AT-ucsd-DOT-edu)
32 Chapter 7 Contents
Escher Documentation Release 143
77 EscherConverter
EscherConverter is a standalone program that reads files created with the graphical network editor Escher and convertsthem to files in community standard formats
Download EscherConverter 05 (137 MB)
771 Using EscherConverter
Escher uses a JSON file format to represent its networks This format has been developed because of its very small filesize and its compatibility to online programs that are written in JavaScript In particular JSON is a JavaScript ObjectNotation or in other words a JSON file directly represents components of JavaScript programs This makes parsingvery simple and allows direct use of those files in web-based programs
However in systems biology specific file formats have been developed with the aim to be easily exchangeable betweensoftware implemented in diverse programming languages
To this end these formats support semantically clear annotations and are maintained by a large community of scientistsEscherConverter supports export to two particularly important XML-based community file formats SBML with layoutextension and SBGN-ML
While SBML has been mainly developed for dynamic simulation of biological networks it is nowadays also usablefor diverse other purposes Its layout extension facilitates the encoding the display of biological networks
SBGN-ML has been directly developed as a language for the display of biological pathway maps of diverse kinds Itstores the position and connection of entities similar to what is shown in Escher networks
EscherConverter takes Escherrsquos JSON files as input and generates equivalent SBML Level 3 Version 1 files with layoutextension or SBGN-ML files
In order to ensure that the conversion is correct EscherConverter provides its own display that gives users a previewof how the export data format will be rendered by other tools In this preview display you can zoom in and out movearcs and node positions However it is important to know that none of the changes made in this preview are stored inthe export file
Download and Installation
You can obtain local copy of EscherConverter by clicking here
As a Javatrade application no specific installation is required for EscherConverter
However make sure you have a recent Javatrade Runtime Environment (JRE) installed on your computer (at least JRE8) You can obtain Javatrade from the Oracle website There you can also find installation instructions for your respectiveoperating system
Once Javatrade has been installed you can simply place the EscherConverter JAR file somewhere on your local computerfor instance in the folder
bull Applications if you are working under Mac OS
77 EscherConverter 33
Escher Documentation Release 143
bull opt for Linux computers
bull CProgram Files if you are using Windows
Launching the program
You can launch EscherConverter simply by double-clicking on the application JAR file This will open a followinggraphical user interface as described in the following figures
Figure 1 | The graphical user interface of EscherConverter
bull Preferences opens a settings dialog (see next screenshot)
bull Open displays a file chooser to select an input file in JSON format
bull Save export the map that is displayed in the current tab to SBML or SBGN-ML
bull Discard closes the current tab without saving
bull Help opens the online help that displays all command-line options
bull License displays the license under which this software is distributed
bull About shows information about the authors of this software
bull Main the main panel of the software in which converted Escher maps will be displayed organized in tabs
bull Status the status bar shows information and logging messages during the conversion
34 Chapter 7 Contents
Escher Documentation Release 143
Figure 2 | The preferences dialog All settings in this dialog are also available through EscherConverterrsquos command-line interface
Layout section several properties that are required in SBML and SBGN-ML are not explicitly specified in EscherrsquosJSON format and therefore need to be adjusted by the user These are the size of the drawing canvas the default boxsize for text labels the size of primary and secondary nodes In contrast to SBGN-ML and Escherrsquos JSON formatthe SBML layout extension supports three-dimensional displays When selecting this export file format it is thereforenecessary to also define the z-coordinate and the depth of all objects
Components and naming section Most settings in this section are specific for the SBML layout extension and areonly active if this output format is selected These are names and identifiers of the layout component and the in caseof SBML mandatory default compartment (a compartment without physical meaning a reaction space in which allmetabolites are located) EscherConverter can infer compartment bounds from metabolites but this is an experimentalfeature Just try it and see how the preview changes
77 EscherConverter 35
Escher Documentation Release 143
Figure 3 | A layout preview
The birds-eye view and the navigation component on the left help you navigate through the network display Thisgraph shows you how the converted pathway map will be rendered by software that supports SBGN-ML or the SBMLlayout extension This preview can be modified by moving arcs or nodes however none of those changes are storedwhen exporting the file In this current version EscherConver only exports layouts as given in the original JSON file
Included third-party software
EscherConverter includes several third-party libraries which we here list and acknowledge
bull ArgParser
bull JSBML
bull libSBGN
bull Pixel-Mixer icons
bull yFiles
772 Command-line interface API
You can launch EscherConverter from the command-line On a Unix system (such as Linux MacOS or Solaris etc)use a command like
bash$ java -jar -Xms8G -Xmx8G -Duserlanguage=en EscherConverter-05jar [options]
Under Window use a command like
Cgt javaw -jar -Xms8G -Xmx8G -Duserlanguage=en EscherConverter-05jar [options]
Escher has a large collection of command-line options (see below) which can be useful if you want to launch theprogram with specific settings or if multiple files are to be converted in a batch mode It is even possible to completelydisable the graphical user interface
36 Chapter 7 Contents
Escher Documentation Release 143
Input and output files
Definition of input and output data files as well as the format for the output
--input=ltFilegt
Specifies the JSON input file If a directory is given the conversion will be recursively performed Accepts JSON
--output=ltFilegt
The path to the file into which the output should be written If the input is a directory this must also be a directory inorder to perform a recursive conversion Accepts SBML SBGN
Escher layout
The options in this group allow you to influence how large certain elements should be displayed
--canvas-default-height=ltDoublegt
Just as in the case of the width of the canvas this value needs to be specified for cases where the JSON input file lacksan explicit specification of the canvas height Arguments must fit into the range [11E9] (Default value 2500)
--canvas-default-width=ltDoublegt
This value is used when no width has been defined for the canvas Since the width attribute is mandatory for the layouta default value must be provided in these cases Arguments must fit into the range [11E9] (Default value 2500)
--label-height=ltDoublegt
With this option you can specify the height of the bounding box of text labels Arguments must fit into the range[11E9] (Default value 500)
--label-width=ltDoublegt
This option defines the width of bounding boxes for text labels Arguments must fit into the range [11E9] (Defaultvalue 1600)
--node-depth=ltDoublegt
The length of nodes along z-coordinate Escher maps are actually two-dimensional but in general a layout can bethree-dimensional This value should be an arbitrary value greater than zero because some rendering engines mightnot display the node if its depth is zero Arguments must fit into the range [11E9] (Default value 10)
--node-label-height=ltDoublegt
Node labels can have a size different from general labels in the graph Here you can specify how height the boundingbox of the labels for nodes should be Arguments must fit into the range [11E9] (Default value 200)
--primary-node-height=ltDoublegt
The primary node should be bigger than the secondary node With this option you can specify the height of this typeof nodes Arguments must fit into the range [11E9] (Default value 300)
--primary-node-width=ltDoublegt
Escher maps distinguish between primary and secondary nodes Primary nodes should be larger than secondary nodesand display the main flow of matter through the network This option allows you to specify the width of primarynodes Arguments must fit into the range [11E9] (Default value 300)
77 EscherConverter 37
Escher Documentation Release 143
--reaction-label-height=ltDoublegt
Reaction label heightArguments must fit into the range [11E9] (Default value 300)
--reaction-node-ratio=ltDoublegt
This value is used as a conversion factor to determine the size of the reaction display box depending on the size ofprimary nodes Height and width of reaction nodes are determined by dividing the corresponding values from theprimary node size by this factor Arguments must fit into the range [01] (Default value 05)
--secondary-node-ratio=ltDoublegt
Similar to the reaction node ratio the size of secondary nodes (width and height) is determined by dividing thecorresponding values from the primary nodes by this value Arguments must fit into the range [01] (Default value06666666666666666)
--z=ltDoublegt
The position on the z-axis where the entire two-dimensional graph should be drawn Arguments must fit into the range[-1E91E9] (Default value 00)
Escher Components and their naming
Here you can influence which elements are to be included in the layout and how elements in the layout are to be calledor identified
--format=ltOutputFormatgt
The desired format for the conversion eg SBML All possible values for type ltOutputFormatgt are SBGN andSBML (Default value SBML)
--layout-id=ltStringgt
In contrast to the name this identifier does not have to be human-readable This is a machine identifier which muststart with a letter or underscore and can only contain ASCII characters (Default value Escher_Layout)
--layout-name=ltStringgt
This should be a human-readable name for the layout that is to be created This name might be displayed to describethe figure and should therefore be explanatory (Default value Escher Layout)
--compartment-id=ltStringgt
A compartment needs to have a unique identifier which needs to be a machine-readable Sting that must start with aletter or underscore and can only contain ASCII characters Since the JSON file does not provide this information thisoption allows you to specify the required identifier (Default value default)
--compartment-name=ltStringgt
With this option it is possible to define a name for the default compartment can be that needs to be generated for theconversion to SBML The name does not have any restrictions ie any UTF-8 character can be used (Default valueDefault compartment)
--infer-compartment-bounds
This converter can infer where the boundaries of compartments could be drawn To this end it uses each nodersquos BiGGids to identify the compartment of all metabolites Assuming that compartments have rectangular shapes the algorithmcan find the outermost node on each side of the box and hence obtain the boundaries of the compartment However
38 Chapter 7 Contents
Escher Documentation Release 143
this methods will fail when metabolites are drawn inside of such a box that belong to a different compartment that isactually further outside For this reason this option is deactivated by default (Default value false)
Options for the graphical user interface
--gui
If this option is given the program will display its graphical user interface (Default value false)
--log-level=ltStringgt
Change the log-level of this application This option will influence how fine-grained error and other log messages willbe that you receive while executing this program All possible values for type ltStringgt are ALL CONFIG FINEFINER FINEST INFO OFF SEVERE and WARNING (Default value INFO)
--log-file=ltFilegt
This option allows you to specify a log file to which all information of the program will be written Accepts (bp2bp3 log owl xml)
78 JavaScript API
class escherBuilder(map_data model_data embedded_css selection options)A Builder object contains all the UI and logic to generate a map builder or viewer
Arguments
bull map_data (object) ndash The data for a map to be passed to escherMapfrom_data() Ifnull then an empty Builder is initialized
bull model_data (object) ndash The data for a cobra model to be passed to es-cherCobraModel() Can be null
bull embedded_css (string) ndash The stylesheet for the SVG elements in the Escher map
bull selection (object) ndash (Optional Default In the body element) The d3 selection of anelement to place the Builder into The selection cannot be inside an SVG element
bull options (object) ndash (Optional) An object defining any of the following options
optionsmenu(Default rsquoallrsquo) The type of menu that will be displayed Can be lsquoallrsquo for the fullmenu or lsquozoomrsquo for just zoom buttons The lsquoallrsquo option requires the full set of Escherdependencies (D3js JQuery and Bootstrap) while the lsquozoomrsquo option requires only D3jsFor more details see Developing with Escher
optionsscroll_behavior(Default rsquopanrsquo) This option determines the effect that the scroll wheel will have onan Escher map Can be lsquopanrsquo to pan the map or lsquozoomrsquo to zoom the map when the usermoves the scroll wheel
optionsuse_3d_transform(Default Chooses a good option by testing the browser) If true then use CSS3 3D trans-forms to speed up panning and zooming This feature will only work on browsers thatsupport the 3D transforms It works best in the latest versions of Chrome Firefox andInternet Explorer Safari works better with this turned off
78 JavaScript API 39
Escher Documentation Release 143
optionsenable_editing(Default true) If true then display the map editing functions If false then hide themand only allow the user to view the map
optionenable_keys(Default true) If true then enable keyboard shortcuts
optionsenable_search(Default true) If true then enable indexing of the map for search Use false to disablesearching and potentially improve the map performance
optionsfill_screen(Default false) Use true to fill the screen when an Escher Builder is placed in a top-level container (eg a div in the body element)
optionsfull_screen_button(Default false) Include a button in the user interface for entering full screen mode
optionsignore_bootstrap(Default false) Do not use Bootstrap for buttons even if it available This is used toembed Escher in a Jupyter notebook where it conflicts with the Jupyter Boostrap installa-tion
Map model and styles
optionsstarting_reaction(Default null) The ID (as a string) of a reaction to draw when the Builder loads
optionsnever_ask_before_quit(Default false) If false then display a warning before the user closes an Eschermap If true then never display the warning This options is only respected if op-tionsenable_editing == true If enable_editing is false then the warnings are not dis-played
optionsunique_map_id(Default null) A unique ID that will be used to UI elements donrsquot interfere whenmultiple maps are in the same HTML document
optionsprimary_metabolite_radius(Default 15) The radius of primary metabolites in px
optionssecondary_metabolite_radius(Default 10) The radius of secondary metabolites in px
optionsmarker_radius(Default 5) The radius of marker nodes in px
optionsgene_font_size(Default 18) The font size of the gene reaction rules in px
optionshide_secondary_metabolites(Default false) If true then secondary nodes and segments are hidden This is conve-nient for generating simplified map figures
optionsshow_gene_reaction_rules(Default false) If true then show the gene reaction rules even without gene data
optionshide_all_labels(Default false) If checked hide all reaction gene and metabolite labels
Applied data
40 Chapter 7 Contents
Escher Documentation Release 143
optionsreaction_data(Default null) An object with reaction ids for keys and reaction data points for values
optionsreaction_stylesDefault [rsquocolorrsquo rsquosizersquo rsquotextrsquo]
An array of style types The array can contain any of the following lsquocolorrsquo lsquosizersquo lsquotextrsquolsquoabsrsquo The lsquocolorrsquo style means that the reactions will be colored according to the loadeddataset The lsquosizersquo style means that the reactions will be sized according to the loadeddataset The lsquotextrsquo style means that the data values will be displayed in the reactionlabels The lsquoabsrsquo style means the the absolute values of reaction values will be used fordata visualization
optionsreaction_compare_style(Default rsquodiffrsquo) How to compare to datasets Can be either lsquofold lsquolog2_foldrsquo orlsquodiffrsquo
optionsreaction_scaleDefault
[ type min color c8c8c8 size 12 type median color 9696ff size 20 type max color ff0000 size 25 ]
An array of objects that define points on the data scale
Each point is an object with a type attribute Types can be lsquominrsquo lsquomaxrsquo lsquomeanrsquo lsquoQ1rsquo (firstquartile) lsquomedianrsquo lsquoQ3rsquo (third quartile) or lsquovaluersquo Each point can have a color attributethat specifies a color with a string (any CSS color specification is allowed including hexrgb and rgba) Each point can have a size attirbute that specifies a reaction thickness as anumber Finally points with type lsquovaluersquo can have a value attribute that specifies an exactnumber for pont in the scale
NOTE If lsquominrsquo or lsquomaxrsquo is not provided Escher automatically adds them To be com-pletely clear about what you expect to see on the map it is best to provide lsquominrsquo andlsquomaxrsquo in addition to other scale points
Here are examples of each type
type rsquominrsquo color rsquoredrsquo size 12 Specifies that reactionsnear the minimum value are red and have thickness 12
type rsquoQ1rsquo color rsquorgba(100 100 50 05)rsquo size 12 Specifies that reactions near the first quartile have the given color opacity andthickness
type rsquomeanrsquo color rsquorgb(100 100 50)rsquo size 50 Specifies that reactions near the mean value have the given color and thickness
type rsquovaluersquo value 85 color rsquo333rsquo size 50 Specifies that reactions near 85 value have the given color and size
optionsreaction_no_data_color(Default rsquodcdcdcrsquo) The color of reactions with no data value
optionsreaction_no_data_size(Default 8) The size of reactions with no data value
optionsgene_data(Default null) An object with Gene ids for keys and gene data points for values
78 JavaScript API 41
Escher Documentation Release 143
optionsand_method_in_gene_reaction_rule(Default mean) When evaluating a gene reaction rule use this function to evaluate ANDrules Can be lsquomeanrsquo or lsquominrsquo
optionsmetabolite_data(Default null) An object with metabolite ids for keys and metabolite data points forvalues
optionsmetabolite_stylesDefault [rsquocolorrsquo rsquosizersquo rsquotextrsquo]
An array of style types The array can contain any of the following lsquocolorrsquo lsquosizersquo lsquotextrsquolsquoabsrsquo The lsquocolorrsquo style means that the metabolites will be colored according to the loadeddataset The lsquosizersquo style means that the metabolites will be sized according to the loadeddataset The lsquotextrsquo style means that the data values will be displayed in the metabolitelabels The lsquoabsrsquo style means the the absolute values of metabolite values will be used fordata visualization
optionsmetabolite_compare_style(Default rsquodiffrsquo) How to compare to datasets Can be either lsquofoldrsquo lsquolog2_foldrsquo orlsquodiffrsquo
optionsmetabolite_scaleDefault
[ type min color fffaf0 size 20 type median color f1c470 size 30 type max color 800000 size 40 ]
An array of objects that define points on the data scale See the description of op-tionsreaction_scale for an explanation of the format
optionsmetabolite_no_data_color(Default rsquoffffffrsquo) The color of metabolites with no data value
optionsmetabolite_no_data_size(Default 10) The size of metabolites with no data value
View and build options
optionsidentifiers_on_map(Default rsquobigg_idrsquo) The identifiers that will be displayed in reaction metabolite andgene labels Can be lsquobigg_idrsquo or lsquonamersquo
optionshighlight_missing(Default false) If true then highlight in red reactions that are not in the loaded COBRAmodel
optionsallow_building_duplicate_reactions(Default true) If true then building duplicate reactions is allowed If false then dupli-cate reactions are hidden in Add reaction mode
optionscofactors(Default [rsquoatprsquo rsquoadprsquo rsquonadrsquo rsquonadhrsquo rsquonadprsquo rsquonadphrsquorsquogtprsquo rsquogdprsquo rsquohrsquo rsquocoarsquo rsquoumprsquo rsquoh20rsquo rsquoppirsquo]) A list of metabo-lite IDs to treat as cofactors These will be secondary metabolites in new reactions
Callbacks
optionsfirst_load_callbackA function to run after loading the Builder
42 Chapter 7 Contents
Escher Documentation Release 143
load_map(map_data[ should_update_data])Load a map for the loaded data Also reloads most of the Builder content
Arguments
bull map_data ndash The data for a map
bull should_update_data (Boolean) ndash (Default true) Whether data should be ap-plied to the map
load_model(model_data[ should_update_data])Load the cobra model from model data
Arguments
bull model_data ndash The data for a Cobra model (Parsing in done by escherCobraModel)
bull should_update_data (Boolean) ndash (Default true) Whether data should be ap-plied to the model
view_mode()Enter view mode
build_mode()Enter build mode
brush_mode()Enter brush mode
zoom_mode()Enter zoom mode
rotate_mode()Enter rotate mode
text_mode()Enter text mode
set_reaction_data(data)
Arguments
bull data (array) ndash An array of 1 or 2 objects where each object has keys that are reactionIDrsquos and values that are data points (numbers)
set_metabolite_data(data)
Arguments
bull data (array) ndash An array of 1 or 2 objects where each object has keys that are metaboliteIDrsquos and values that are data points (numbers)
set_gene_data(data clear_gene_reaction_rules)
Arguments
bull data (array) ndash An array of 1 or 2 objects where each object has keys that are gene IDrsquosand values that are data points (numbers)
Arguments
bull clear_gene_reaction_rules (Boolean) ndash (Optional Default false) In addi-tion to setting the data also turn of the gene_reaction_rules
78 JavaScript API 43
Escher Documentation Release 143
79 Python API
class escherBuilder(map_name=None map_json=None model=None model_name=Nonemodel_json=None embedded_css=None reaction_data=None metabo-lite_data=None gene_data=None local_host=None id=None safe=Falsekwargs)
A metabolic map that can be viewed edited and used to visualize data
This map will also show metabolic fluxes passed in during consruction It can be viewed as a standalone htmlinside a browswer Alternately the respresentation inside an IPython notebook will also display the map
Maps are stored in json files and are stored in a cache directory Maps which are not found will be downloadedfrom a map repository if found
Parameters
bull map_name ndash A string specifying a map to be downloaded from the Escher web server orloaded from the cache
bull map_json ndash A JSON string or a file path to a JSON file or a URL specifying a JSON fileto be downloaded
bull model ndash A Cobra model
bull model_name ndash A string specifying a model to be downloaded from the Escher web serveror loaded from the cache
bull model_json ndash A JSON string or a file path to a JSON file or a URL specifying a JSONfile to be downloaded
bull embedded_css ndash The CSS (as a string) to be embedded with the Escher SVG
bull reaction_data ndash A dictionary with keys that correspond to reaction ids and values thatwill be mapped to reaction arrows and labels
bull metabolite_data ndash A dictionary with keys that correspond to metabolite ids and valuesthat will be mapped to metabolite nodes and labels
bull gene_data ndash A dictionary with keys that correspond to gene ids and values that will bemapped to corresponding reactions
bull local_host ndash A hostname that will be used for any local files This is generally usedfor using the notebook offline and for testing in the IPython Notebook with modified Eschercode An example value for local_host is lsquohttplocalhost7778lsquo
bull id ndash Specify an id to make the javascript data definitions unique A random id is chosen bydefault
bull safe ndash If True then loading files from the filesytem is not allowed This is to ensure thesafety of using Builder within a web server
Keyword Arguments
These are defined in the Javascript API
bulluse_3d_transform
bullenable_search
bullfill_screen
bullzoom_to_element
bullfull_screen_button
44 Chapter 7 Contents
Escher Documentation Release 143
bullstarting_reaction
bullunique_map_id
bullprimary_metabolite_radius
bullsecondary_metabolite_radius
bullmarker_radius
bullgene_font_size
bullhide_secondary_metabolites
bullshow_gene_reaction_rules
bullhide_all_labels
bullreaction_styles
bullreaction_compare_style
bullreaction_scale
bullreaction_no_data_color
bullreaction_no_data_size
bulland_method_in_gene_reaction_rule
bullmetabolite_styles
bullmetabolite_compare_style
bullmetabolite_scale
bullmetabolite_no_data_color
bullmetabolite_no_data_size
bullidentifiers_on_map
bullhighlight_missing
bullallow_building_duplicate_reactions
bullcofactors
All keyword arguments can also be set on an existing Builder object using setter functions eg
my_builderset_reaction_styles(new_styles)
display_in_browser(ip=lsquo127001rsquo port=7655 n_retries=50 js_source=rsquowebrsquo menu=rsquoallrsquoscroll_behavior=rsquopanrsquo enable_editing=True enable_keys=True mini-fied_js=True never_ask_before_quit=False)
Launch a web browser to view the map
Parameters
bull ip ndash The IP address to serve the map on
bull port ndash The port to serve the map on If specified the port is occupied then a random freeport will be used
bull n_retries (int) ndash The number of times the server will try to find a port before quitting
bull js_source (string) ndash Can be one of the following
ndash web (Default) - Use JavaScript files from eschergithubio
79 Python API 45
Escher Documentation Release 143
ndash local - Use compiled JavaScript files in the local Escher installation Works offline
ndash dev - No longer necessary with source maps This now gives the same behavior aslsquolocalrsquo
bull menu (string) ndash Menu bar options include
ndash none - No menu or buttons
ndash zoom - Just zoom buttons
ndash all (Default) - Menu and button bar (requires Bootstrap)
bull scroll_behavior (string) ndash Scroll behavior options
ndash pan - Pan the map
ndash zoom - Zoom the map
ndash none (Default) - No scroll events
bull enable_editing (Boolean) ndash Enable the map editing modes
bull enable_keys (Boolean) ndash Enable keyboard shortcuts
bull minified_js (Boolean) ndash If True use the minified version of JavaScript and CSSfiles
bull never_ask_before_quit (Boolean) ndash Never display an alert asking if you wantto leave the page By default this message is displayed if enable_editing is True
display_in_notebook(js_source=rsquowebrsquo menu=rsquozoomrsquo scroll_behavior=rsquononersquo mini-fied_js=True height=500 enable_editing=False)
Embed the Map within the current IPython Notebook
Parameters
bull js_source (string) ndash Can be one of the following
ndash web (Default) - Use JavaScript files from eschergithubio
ndash local - Use compiled JavaScript files in the local Escher installation Works offline
ndash dev - No longer necessary with source maps This now gives the same behav-ior as lsquolocalrsquo
bull menu (string) ndash Menu bar options include
ndash none - No menu or buttons
ndash zoom - Just zoom buttons
ndash Note The all menu option does not work in an IPython notebook
bull scroll_behavior (string) ndash Scroll behavior options
ndash pan - Pan the map
ndash zoom - Zoom the map
ndash none - (Default) No scroll events
bull minified_js (Boolean) ndash If True use the minified version of JavaScript andCSS files
bull height ndash Height of the HTML container
bull enable_editing (Boolean) ndash Enable the map editing modes
46 Chapter 7 Contents
Escher Documentation Release 143
save_html(filepath=None overwrite=False js_source=rsquowebrsquo protocol=rsquohttpsrsquo menu=rsquoallrsquoscroll_behavior=rsquopanrsquo enable_editing=True enable_keys=True minified_js=Truenever_ask_before_quit=False static_site_index_json=None)
Save an HTML file containing the map
Parameters
bull filepath (string) ndash The HTML file will be saved to this location Whenjs_source is lsquolocalrsquo then a new directory will be created with this name
bull overwrite (Boolean) ndash Overwrite existing files
bull js_source (string) ndash Can be one of the following
ndash web (Default) - Use JavaScript files from eschergithubio
ndash local - Use compiled JavaScript files in the local Escher installation Works of-fline To make the dependencies available to the downloaded file a new directorywill be made with the name specified by filepath
ndash dev - No longer necessary with source maps This now gives the same behav-ior as lsquolocalrsquo
bull protocol (string) ndash The protocol can be lsquohttprsquo lsquohttpsrsquo or None which indicatesa lsquoprotocol relative URLrsquo as in eschergithubio Ignored if source is local
bull menu (string) ndash Menu bar options include
ndash none - No menu or buttons
ndash zoom - Just zoom buttons
ndash all (Default) - Menu and button bar (requires Bootstrap)
bull scroll_behavior (string) ndash Scroll behavior options
ndash pan - Pan the map
ndash zoom - Zoom the map
ndash none (Default) - No scroll events
bull enable_editing (Boolean) ndash Enable the map editing modes
bull enable_keys (Boolean) ndash Enable keyboard shortcuts
bull minified_js (Boolean) ndash If True use the minified version of JavaScript andCSS files
bull height (number) ndash Height of the HTML container
bull never_ask_before_quit (Boolean) ndash Never display an alert asking if youwant to leave the page By default this message is displayed if enable_editing isTrue
bull static_site_index_json (string) ndash The index as a JSON string for thestatic site Use javascript to parse the URL options Used for generating static pages(see static_sitepy)
791 Cache
escherget_cache_dir(versioned=True name=None)Get the cache dir as a string and make the directory if it does not already exist
Parameters
79 Python API 47
Escher Documentation Release 143
bull versioned (Boolean) ndash Whether to return the versioned path in the cache Eschermaps for the latest version of Escher are found in the versioned directory (versioned= True) but maps for previous versions of Escher can be found by visiting the parentdirectory (versioned = False)
bull name (string) ndash An optional subdirectory within the cache If versioned is False thenname is ignored
escherclear_cache(different_cache_dir=None ask=True)Empty the contents of the cache directory including all versions of all maps and models
Parameters
bull different_cache_dir (string) ndash (Optional) The directory of another cacheThis is mainly for testing
bull ask (Boolean) ndash Whether to ask before deleting
escherlist_cached_maps()Return a list of all cached maps
escherlist_cached_models()Return a list of all cached models
escherlist_available_maps()Return a list of all maps available on the server
escherlist_available_models()Return a list of all models available on the server
710 License
Escher and EscherConverter are distributed under the MIT license
bull genindex
48 Chapter 7 Contents
Python Module Index
eescher 44
49
Escher Documentation Release 143
50 Python Module Index
Index
Bbrush_mode() (built-in function) 43build_mode() (built-in function) 43Builder (class in escher) 44
Cclear_cache() (in module escher) 48
Ddisplay_in_browser() (escherBuilder method) 45display_in_notebook() (escherBuilder method) 46
Eescher (module) 44escherBuilder() (class) 39
Gget_cache_dir() (in module escher) 47
Llist_available_maps() (in module escher) 48list_available_models() (in module escher) 48list_cached_maps() (in module escher) 48list_cached_models() (in module escher) 48load_map() (built-in function) 42load_model() (built-in function) 43
Ooptionenable_keys (option attribute) 40optionsallow_building_duplicate_reactions (options at-
tribute) 42optionsand_method_in_gene_reaction_rule (options at-
tribute) 41optionscofactors (options attribute) 42optionsenable_editing (options attribute) 39optionsenable_search (options attribute) 40optionsfill_screen (options attribute) 40optionsfirst_load_callback (options attribute) 42optionsfull_screen_button (options attribute) 40optionsgene_data (options attribute) 41
optionsgene_font_size (options attribute) 40optionshide_all_labels (options attribute) 40optionshide_secondary_metabolites (options attribute)
40optionshighlight_missing (options attribute) 42optionsidentifiers_on_map (options attribute) 42optionsignore_bootstrap (options attribute) 40optionsmarker_radius (options attribute) 40optionsmenu (options attribute) 39optionsmetabolite_compare_style (options attribute) 42optionsmetabolite_data (options attribute) 42optionsmetabolite_no_data_color (options attribute) 42optionsmetabolite_no_data_size (options attribute) 42optionsmetabolite_scale (options attribute) 42optionsmetabolite_styles (options attribute) 42optionsnever_ask_before_quit (options attribute) 40optionsprimary_metabolite_radius (options attribute) 40optionsreaction_compare_style (options attribute) 41optionsreaction_data (options attribute) 40optionsreaction_no_data_color (options attribute) 41optionsreaction_no_data_size (options attribute) 41optionsreaction_scale (options attribute) 41optionsreaction_styles (options attribute) 41optionsscroll_behavior (options attribute) 39optionssecondary_metabolite_radius (options attribute)
40optionsshow_gene_reaction_rules (options attribute) 40optionsstarting_reaction (options attribute) 40optionsunique_map_id (options attribute) 40optionsuse_3d_transform (options attribute) 39
Rrotate_mode() (built-in function) 43
Ssave_html() (escherBuilder method) 46set_gene_data() (built-in function) 43set_metabolite_data() (built-in function) 43set_reaction_data() (built-in function) 43
51
Escher Documentation Release 143
Ttext_mode() (built-in function) 43
Vview_mode() (built-in function) 43
Zzoom_mode() (built-in function) 43
52 Index
Escher Documentation Release 143
719 View options
bull Zoom in Zoom in to the map
bull Zoom out Zoom out of the map
bull Zoom to nodes Zoom to see all the nodes on the map
bull Zoom to canvas Zoom to see the entire canvas
bull Find Search for a reaction metabolite or gene on the map
bull Show control points Show the control points you can drag these red and blue circle to adjust the shapes ofthe reactions curves
bull Settings Open the Settings menu
7110 The button bar
The button bar give you quick access to many of the common Escher functions
71 Getting started 23
Escher Documentation Release 143
24 Chapter 7 Contents
Escher Documentation Release 143
7111 Settings
View and build options
bull Identifiers Choose whether to show BiGG IDs or descriptive names for reactions metabolites and genes
bull Hide secondary metabolites This will simplify the map by hiding all secondary metabolites and the pathsconnected to them
bull Show gene reaction rules Show the gene reaction rules below the reaction labels even gene data is not loaded
bull Hide reaction gene and metabolite labels Another option to visually simplify the map this will hide alllabels that are not text annotations
bull Allow duplicate reactions By default duplicate reactions are hidden in the add reaction dropdown menuHowever you can turn this option on to show the duplicate reactions
bull Highlight reactions not in model Highlight in red any reactions that are on the map but are not in the modelThis is useful when you are adapting a map from one model for use with another model
71 Getting started 25
Escher Documentation Release 143
Reaction data settings
When reaction or gene data is loaded this section can be used to change visual settings for reactions
The color bar has individual control points and you can drag the control points (execpt min and max) left and right tochange their values Alternatively you can use the dropdown menu (next to the word median in the figure above) toattach a control point to a statistical measure (mean median first quartile (Q1) or third quartile (Q3)) This lets youchoose a color scale that will adapt to your dataset
For each control point you can choose a color by entering a CSS-style color (eg red ff0000 rgba(20 20 255 05)and you can choose a size that will scale the thickness of reactions
There are also color and size options for reactions that do not have any data value
Finally there are a few onoff settings for the loaded reaction or gene dataset
bull Options These determine how to visualize the datasets Check Absolute value to color and size reactions bythe absolute value of each data value The Size Color and Text options can be unselected to turn off sizingcoloring and data values in reaction labels individually
bull Comparison Determines the comparison algorithm to use when two datasets are loaded
bull Method for evaluating AND Determines the method that will be used to reconcile AND statements in genereaction rules when there is gene data loaded See Gene data and gene reaction rules for more details
Metabolite data settings
The data settings for metabolite data are analagous to those for reaction data The only difference is that size nowrefers to the size of the metabolite circles
26 Chapter 7 Contents
Escher Documentation Release 143
72 Escher COBRA and COBRApy
Escher can be used as an independent application but it draws heavily on the information in COBRA models ACOBRA model is a collection of all the reactions metabolites and genes known to exist in an organism (In theliterature these are generally called genome-scale models (GEMs) but we refer to them as COBRA models here toemphasize that Escher interoperates with models that are exported from COBRApy)
By loading a COBRA model into the Escher interface you have access to every reaction and metabolite in that modelYou also have the gene reaction rules for the reactions in the network which allow you to connect gene data toreactions and metabolites
COBRApy is a software package for COBRA modeling written in Python The Escher Python package uses CO-BRApy package for reading and writing COBRA models
721 Maps and models
In Escher you will see references to maps and models
A map contains the reactions and metabolites that you see in the Escher builder including their locations text annota-tions and the canvas
A model (a COBRA model) contains reactions and metabolites that you have not drawn yet Thus you can load aCOBRA model when you want to draw new reactions on the map
722 What is JSON and why do we use it
Both Escher maps and COBRA models are stored as JSON files JSON is a useful plain-text format for storing nesteddata structures We use JSON much like the SBML community uses XML You may notice that SBML files have axml extension and Escher maps and COBRA models have a json extension
You can use Python to explore a JSON file like this
import json
with open(mapjson r) as fmap_object = jsonload(f)
print map_object[0]print map_object[1][reactions]values()[0]
723 Escher SBML and SBGN
A tool has been developed for converting Escher maps to SBML Layout and SBGN and it will be released soon
COBRA models can be converted to SBML using COBRApy
73 Run Escher locally and in IPython
To run Escher on a local computer or to use Escher in PythonIPython first install it The Python package for Eschercan be installed using pip
pip install escher
72 Escher COBRA and COBRApy 27
Escher Documentation Release 143
Depending on your installation of Python you may need sudo
sudo pip install escher
Alternatively one can download the source files and install the package directly
python setuppy install
731 Escher in the IPython Notebook
Once you have installed Escher locally you can interact with Escher maps in an IPython Notebook
Here are example notebooks to get started with
bull COBRApy and Escher
bull JavaScript development and offline maps
bull Generate JSON models in COBRApy
Dependencies
bull Jinja2
bull Tornado
bull COBRApy 030 or later
732 Running the local server
You can run your own local server if you want to use Escher offline or explore your own maps with the homepagebrowser To get started install the Python package and run from any directory by calling
python -m escherserver
This starts a server at httplocalhost7778 You can also choose another port
python -m escherserver --port=8005
74 Validate and convert maps
741 Validate an Escher map
Escher maps follow a specification using the JSON Schema format Therefore any JSON Schema validator can beused to validate an Escher map by comparing it to the latest schema file For example the current schema is locatedhere
httpsgithubcomzakandrewkingescherblobmasterescherjsonschema1-0-0
To make this easier the Escher Python package includes a validation script To validate a map first install Escher
pip install escher
Then call the validator
python -m eschervalidate my_mapjson
Any errors in the map will print to the console
28 Chapter 7 Contents
Escher Documentation Release 143
742 Convert or upgrade an Escher map
Any Escher maps built with pre-release versions of Escher will not load right away in the stable v10 release Toconvert pre-release maps to the new format follow these steps
1 Install Escher
pip install escher
2 Find a COBRA model for your maps This COBRA model will be used to update the content of the mapin order to support all the new Escher features You can use a COBRA model encoded as SBML or JSON(generated with COBRApy v030b4 or later) The COBRA models currently available on the Escher websitecan be downloaded from the BiGG Models website
httpbiggucsdedu
For a refresher on the distinction between Escher maps COBRA models and their file types (SBML JSONSBML Layout) see Escher COBRA and COBRApy
3 Run the convert_map script to convert your existing Escher map (my_old_mapjson) to the new formatusing a COBRA model (model_filejson or model_filexml in these examples)
With a JSON file modelpython -m escherconvert_map my_old_mapjson pathtomodel_filejson
With an SBML modelpython -m escherconvert_map my_old_mapjson pathtomodel_filexml
Those commands will generate a new map called my_old_map_convertedjson that will load in Escher v10and later
75 Building and contributing maps
We are excited to collect pathway maps for every organism with a well characterized metabolic network This sectiondescribes the process of building a new map either from scratch or using a COBRA model with BiGG IDs
751 Building from scratch
To build a map from scratch you will first need a COBRA model for your map See the section Escher COBRA andCOBRApy for some background information on COBRA models
If you would like to eventually contribute your map to the Escher website it is important that your COBRA modeladheres to the identifiers in the BiGG Database Escher and BiGG are being developed together and we want tomaintain consistency and interoperability between them
Once you have a COBRA model you can follow these steps
1 Load your model in the Escher Builder
2 Begin building new reactions If you are familiar with the genes in your organism then try search for newreactions by their gene IDs
3 Limit each map to ~200 reactions Maps larger than this will slow down the Escher viewer especially on oldbrowsers Rather than building one giant map Escher is designed for building many smaller subsystem maps
4 When you have built a map for your a subsystem save the map as JSON with a name that includes the modelID followed by a period followed by the name of the subsystem For example
75 Building and contributing maps 29
Escher Documentation Release 143
iMM904Amino acid biosynthesisjson
5 (Optional) Once you have a set of subsystem maps you can set up a local Escher server so that subsystem mapsappear in the ldquoquick jumprdquo menu in the bottom right corner of the screen (as seen here for iJO1366) To setthis up you will need to start a local server as describe in Running the local server Next find your local cachedirectory by running this command in a terminal
python -c import escher print(escherget_cache_dir(name=maps))
This will print the location of the local maps cache Add your new subsystem maps to cache folder Now whenyou run the server (described in Running the local server) you should see that quick jump menu appear
NOTE The cache directory is organized into folders for organisms You can use these folder for filtering byorganism on the local launch page or you can place the maps in the top directory
NOTE 2 A similar approach can be used to access your models from the local launch page Place maps in thefolder indicated by
python -c import escher print(escherget_cache_dir(name=models))
752 Building from an existing map for a similar organism
Follow the instruction above except rather than starting from scratch load an existing Escher map for a differentorganism
Once you have the new model loaded use the Update names and gene reaction rules using model button in theModel menu to convert all descriptive names and gene reaction rules in the model to those in the map Reactions thatdo not match the model will be highlighted in red (This can be turned off again in the settings menu by deselectingHighlight reactions not in model)
Now visit each highlighted reaction and see if you can replace it with an equivalent biochemical pathway from themodel If not then delete the reaction and move on
Finally when there are no highlighted reactions left you can repeat this for other subsystems
753 Submitting maps to the Escher website
If you would like to contribute maps to Escher you can make a Pull Request to the GitHub repository eschergithubioMake sure there is a folder with the name of the organism in 1-0-0maps For example a new yeast map goes inthe folder
1-0-0mapsSaccharomyces cerevisiae
Then name your map by concatenating the model ID and the map name separated by a period For example a yeastmap built with the genome-scale model iMM904 could be named
iMM904Amino acid biosynthesisjson
Then add the JSON file for the model to the Pull Request if that model is not already available As before make afolder for your organism within 1-0-0models The model filename is just the model ID
In this example a correct Pull Request would include the following files
1-0-0mapsSaccharomyces cerevisiaeiMM904Amino acid biosynthesisjson1-0-0modelsSaccharomyces cerevisiaeiMM904json
30 Chapter 7 Contents
Escher Documentation Release 143
76 Developing with Escher
761 Using the static JavaScript and CSS files
You can include the compiled Escher JavaScript and CSS files in any HTML document The only dependencies ared3js and optionally Twitter Bootstrap if you are using the option menu=rsquoallrsquo
The compiled files are available form npmcdn
httpsnpmcdncomescher-visjsdistescherjshttpsnpmcdncomescher-visjsdistescherminjshttpsnpmcdncomescher-viscssdistbuildercsshttpsnpmcdncomescher-viscssdistbuildermincss
Source maps are also hosted there
httpsnpmcdncomescher-visjsdistescherjsmaphttpsnpmcdncomescher-visjsdistescherminjsmaphttpsnpmcdncomescher-viscssdistbuildermincssmap
If you want a particular version of escher add a version tag like this
httpsnpmcdncomescher-vis140-beta3jsdistescherjs
For an example of the boilerplate code that is required to begin developing with Escher have a look at the escher-demorepository For projects built with npm use the escher-test repository as a guide
762 Building and testing Escher
First install dependencies with npm
npm install
Escher uses grunt to manage the build process To run typical build steps just run
npm run compile
To test the JavaScript files run
npm run test
For Python testing run this in the py directory
python setuppy test
Build the static website
python setuppy build_gh
Clear static website files
python setuppy clean
Build and run the docs
cd docsmake htmlcd _buildhtml
76 Developing with Escher 31
Escher Documentation Release 143
python -m SimpleHTTPServer python 2python -m httpserver python 3
763 Generating and reading Escher and COBRA files
The Escher file format
Escher layouts are defined by JSON files that follow a specific schema using json schema The latest schemafor Escher JSON files is here The Escher schemas are versioned with inspiration from SchemaVer Theeschervalidate module can be used to validate models against the schema
The Escher layout schema is designed to be as simple as possible For example the core metabolism map of Es-cherichia coli is layed out like this
[
map_name E coli coreCore metabolismmap_id 2938hoq32a1map_description E coli core metabolic networknLast Modified Fri Dec 05 2014 163944 GMT-0800 (PST)homepage httpseschergithubioschema httpseschergithubioescherjsonschema1-0-0
reactions nodes text_label canvas
x 7857062530517567y 31436893920898433width 5894515691375733height 4860457037353515
]
The map_name includes the model that was used to build this layout followed by a period and then a readable namefor the map The map_id is a unique identifier for this map The map_description describes the map and thelast time it was modified Both the homepage and the schema entries must have exactly these values for the Eschermap to be valid
In the next section the reactions nodes labels and canvas are all defined For reactions nodes and text labels eachelement has a key that is an arbitrary integer As long as there are no repeated IDs (eg no 2 segments with the ID517) then everything should work fine
Read through the schema (here) for more detail on the format
The COBRA file format
COBRA models are also saved as JSON files This format has not been documented with a schema but you canbrowse through the core metabolism model as a guide to generating valid COBRA models
I still need help
If you are interested in developing with Escher and you need more information than what is provided in the documen-tation please contact Zachary King (zaking-AT-ucsd-DOT-edu)
32 Chapter 7 Contents
Escher Documentation Release 143
77 EscherConverter
EscherConverter is a standalone program that reads files created with the graphical network editor Escher and convertsthem to files in community standard formats
Download EscherConverter 05 (137 MB)
771 Using EscherConverter
Escher uses a JSON file format to represent its networks This format has been developed because of its very small filesize and its compatibility to online programs that are written in JavaScript In particular JSON is a JavaScript ObjectNotation or in other words a JSON file directly represents components of JavaScript programs This makes parsingvery simple and allows direct use of those files in web-based programs
However in systems biology specific file formats have been developed with the aim to be easily exchangeable betweensoftware implemented in diverse programming languages
To this end these formats support semantically clear annotations and are maintained by a large community of scientistsEscherConverter supports export to two particularly important XML-based community file formats SBML with layoutextension and SBGN-ML
While SBML has been mainly developed for dynamic simulation of biological networks it is nowadays also usablefor diverse other purposes Its layout extension facilitates the encoding the display of biological networks
SBGN-ML has been directly developed as a language for the display of biological pathway maps of diverse kinds Itstores the position and connection of entities similar to what is shown in Escher networks
EscherConverter takes Escherrsquos JSON files as input and generates equivalent SBML Level 3 Version 1 files with layoutextension or SBGN-ML files
In order to ensure that the conversion is correct EscherConverter provides its own display that gives users a previewof how the export data format will be rendered by other tools In this preview display you can zoom in and out movearcs and node positions However it is important to know that none of the changes made in this preview are stored inthe export file
Download and Installation
You can obtain local copy of EscherConverter by clicking here
As a Javatrade application no specific installation is required for EscherConverter
However make sure you have a recent Javatrade Runtime Environment (JRE) installed on your computer (at least JRE8) You can obtain Javatrade from the Oracle website There you can also find installation instructions for your respectiveoperating system
Once Javatrade has been installed you can simply place the EscherConverter JAR file somewhere on your local computerfor instance in the folder
bull Applications if you are working under Mac OS
77 EscherConverter 33
Escher Documentation Release 143
bull opt for Linux computers
bull CProgram Files if you are using Windows
Launching the program
You can launch EscherConverter simply by double-clicking on the application JAR file This will open a followinggraphical user interface as described in the following figures
Figure 1 | The graphical user interface of EscherConverter
bull Preferences opens a settings dialog (see next screenshot)
bull Open displays a file chooser to select an input file in JSON format
bull Save export the map that is displayed in the current tab to SBML or SBGN-ML
bull Discard closes the current tab without saving
bull Help opens the online help that displays all command-line options
bull License displays the license under which this software is distributed
bull About shows information about the authors of this software
bull Main the main panel of the software in which converted Escher maps will be displayed organized in tabs
bull Status the status bar shows information and logging messages during the conversion
34 Chapter 7 Contents
Escher Documentation Release 143
Figure 2 | The preferences dialog All settings in this dialog are also available through EscherConverterrsquos command-line interface
Layout section several properties that are required in SBML and SBGN-ML are not explicitly specified in EscherrsquosJSON format and therefore need to be adjusted by the user These are the size of the drawing canvas the default boxsize for text labels the size of primary and secondary nodes In contrast to SBGN-ML and Escherrsquos JSON formatthe SBML layout extension supports three-dimensional displays When selecting this export file format it is thereforenecessary to also define the z-coordinate and the depth of all objects
Components and naming section Most settings in this section are specific for the SBML layout extension and areonly active if this output format is selected These are names and identifiers of the layout component and the in caseof SBML mandatory default compartment (a compartment without physical meaning a reaction space in which allmetabolites are located) EscherConverter can infer compartment bounds from metabolites but this is an experimentalfeature Just try it and see how the preview changes
77 EscherConverter 35
Escher Documentation Release 143
Figure 3 | A layout preview
The birds-eye view and the navigation component on the left help you navigate through the network display Thisgraph shows you how the converted pathway map will be rendered by software that supports SBGN-ML or the SBMLlayout extension This preview can be modified by moving arcs or nodes however none of those changes are storedwhen exporting the file In this current version EscherConver only exports layouts as given in the original JSON file
Included third-party software
EscherConverter includes several third-party libraries which we here list and acknowledge
bull ArgParser
bull JSBML
bull libSBGN
bull Pixel-Mixer icons
bull yFiles
772 Command-line interface API
You can launch EscherConverter from the command-line On a Unix system (such as Linux MacOS or Solaris etc)use a command like
bash$ java -jar -Xms8G -Xmx8G -Duserlanguage=en EscherConverter-05jar [options]
Under Window use a command like
Cgt javaw -jar -Xms8G -Xmx8G -Duserlanguage=en EscherConverter-05jar [options]
Escher has a large collection of command-line options (see below) which can be useful if you want to launch theprogram with specific settings or if multiple files are to be converted in a batch mode It is even possible to completelydisable the graphical user interface
36 Chapter 7 Contents
Escher Documentation Release 143
Input and output files
Definition of input and output data files as well as the format for the output
--input=ltFilegt
Specifies the JSON input file If a directory is given the conversion will be recursively performed Accepts JSON
--output=ltFilegt
The path to the file into which the output should be written If the input is a directory this must also be a directory inorder to perform a recursive conversion Accepts SBML SBGN
Escher layout
The options in this group allow you to influence how large certain elements should be displayed
--canvas-default-height=ltDoublegt
Just as in the case of the width of the canvas this value needs to be specified for cases where the JSON input file lacksan explicit specification of the canvas height Arguments must fit into the range [11E9] (Default value 2500)
--canvas-default-width=ltDoublegt
This value is used when no width has been defined for the canvas Since the width attribute is mandatory for the layouta default value must be provided in these cases Arguments must fit into the range [11E9] (Default value 2500)
--label-height=ltDoublegt
With this option you can specify the height of the bounding box of text labels Arguments must fit into the range[11E9] (Default value 500)
--label-width=ltDoublegt
This option defines the width of bounding boxes for text labels Arguments must fit into the range [11E9] (Defaultvalue 1600)
--node-depth=ltDoublegt
The length of nodes along z-coordinate Escher maps are actually two-dimensional but in general a layout can bethree-dimensional This value should be an arbitrary value greater than zero because some rendering engines mightnot display the node if its depth is zero Arguments must fit into the range [11E9] (Default value 10)
--node-label-height=ltDoublegt
Node labels can have a size different from general labels in the graph Here you can specify how height the boundingbox of the labels for nodes should be Arguments must fit into the range [11E9] (Default value 200)
--primary-node-height=ltDoublegt
The primary node should be bigger than the secondary node With this option you can specify the height of this typeof nodes Arguments must fit into the range [11E9] (Default value 300)
--primary-node-width=ltDoublegt
Escher maps distinguish between primary and secondary nodes Primary nodes should be larger than secondary nodesand display the main flow of matter through the network This option allows you to specify the width of primarynodes Arguments must fit into the range [11E9] (Default value 300)
77 EscherConverter 37
Escher Documentation Release 143
--reaction-label-height=ltDoublegt
Reaction label heightArguments must fit into the range [11E9] (Default value 300)
--reaction-node-ratio=ltDoublegt
This value is used as a conversion factor to determine the size of the reaction display box depending on the size ofprimary nodes Height and width of reaction nodes are determined by dividing the corresponding values from theprimary node size by this factor Arguments must fit into the range [01] (Default value 05)
--secondary-node-ratio=ltDoublegt
Similar to the reaction node ratio the size of secondary nodes (width and height) is determined by dividing thecorresponding values from the primary nodes by this value Arguments must fit into the range [01] (Default value06666666666666666)
--z=ltDoublegt
The position on the z-axis where the entire two-dimensional graph should be drawn Arguments must fit into the range[-1E91E9] (Default value 00)
Escher Components and their naming
Here you can influence which elements are to be included in the layout and how elements in the layout are to be calledor identified
--format=ltOutputFormatgt
The desired format for the conversion eg SBML All possible values for type ltOutputFormatgt are SBGN andSBML (Default value SBML)
--layout-id=ltStringgt
In contrast to the name this identifier does not have to be human-readable This is a machine identifier which muststart with a letter or underscore and can only contain ASCII characters (Default value Escher_Layout)
--layout-name=ltStringgt
This should be a human-readable name for the layout that is to be created This name might be displayed to describethe figure and should therefore be explanatory (Default value Escher Layout)
--compartment-id=ltStringgt
A compartment needs to have a unique identifier which needs to be a machine-readable Sting that must start with aletter or underscore and can only contain ASCII characters Since the JSON file does not provide this information thisoption allows you to specify the required identifier (Default value default)
--compartment-name=ltStringgt
With this option it is possible to define a name for the default compartment can be that needs to be generated for theconversion to SBML The name does not have any restrictions ie any UTF-8 character can be used (Default valueDefault compartment)
--infer-compartment-bounds
This converter can infer where the boundaries of compartments could be drawn To this end it uses each nodersquos BiGGids to identify the compartment of all metabolites Assuming that compartments have rectangular shapes the algorithmcan find the outermost node on each side of the box and hence obtain the boundaries of the compartment However
38 Chapter 7 Contents
Escher Documentation Release 143
this methods will fail when metabolites are drawn inside of such a box that belong to a different compartment that isactually further outside For this reason this option is deactivated by default (Default value false)
Options for the graphical user interface
--gui
If this option is given the program will display its graphical user interface (Default value false)
--log-level=ltStringgt
Change the log-level of this application This option will influence how fine-grained error and other log messages willbe that you receive while executing this program All possible values for type ltStringgt are ALL CONFIG FINEFINER FINEST INFO OFF SEVERE and WARNING (Default value INFO)
--log-file=ltFilegt
This option allows you to specify a log file to which all information of the program will be written Accepts (bp2bp3 log owl xml)
78 JavaScript API
class escherBuilder(map_data model_data embedded_css selection options)A Builder object contains all the UI and logic to generate a map builder or viewer
Arguments
bull map_data (object) ndash The data for a map to be passed to escherMapfrom_data() Ifnull then an empty Builder is initialized
bull model_data (object) ndash The data for a cobra model to be passed to es-cherCobraModel() Can be null
bull embedded_css (string) ndash The stylesheet for the SVG elements in the Escher map
bull selection (object) ndash (Optional Default In the body element) The d3 selection of anelement to place the Builder into The selection cannot be inside an SVG element
bull options (object) ndash (Optional) An object defining any of the following options
optionsmenu(Default rsquoallrsquo) The type of menu that will be displayed Can be lsquoallrsquo for the fullmenu or lsquozoomrsquo for just zoom buttons The lsquoallrsquo option requires the full set of Escherdependencies (D3js JQuery and Bootstrap) while the lsquozoomrsquo option requires only D3jsFor more details see Developing with Escher
optionsscroll_behavior(Default rsquopanrsquo) This option determines the effect that the scroll wheel will have onan Escher map Can be lsquopanrsquo to pan the map or lsquozoomrsquo to zoom the map when the usermoves the scroll wheel
optionsuse_3d_transform(Default Chooses a good option by testing the browser) If true then use CSS3 3D trans-forms to speed up panning and zooming This feature will only work on browsers thatsupport the 3D transforms It works best in the latest versions of Chrome Firefox andInternet Explorer Safari works better with this turned off
78 JavaScript API 39
Escher Documentation Release 143
optionsenable_editing(Default true) If true then display the map editing functions If false then hide themand only allow the user to view the map
optionenable_keys(Default true) If true then enable keyboard shortcuts
optionsenable_search(Default true) If true then enable indexing of the map for search Use false to disablesearching and potentially improve the map performance
optionsfill_screen(Default false) Use true to fill the screen when an Escher Builder is placed in a top-level container (eg a div in the body element)
optionsfull_screen_button(Default false) Include a button in the user interface for entering full screen mode
optionsignore_bootstrap(Default false) Do not use Bootstrap for buttons even if it available This is used toembed Escher in a Jupyter notebook where it conflicts with the Jupyter Boostrap installa-tion
Map model and styles
optionsstarting_reaction(Default null) The ID (as a string) of a reaction to draw when the Builder loads
optionsnever_ask_before_quit(Default false) If false then display a warning before the user closes an Eschermap If true then never display the warning This options is only respected if op-tionsenable_editing == true If enable_editing is false then the warnings are not dis-played
optionsunique_map_id(Default null) A unique ID that will be used to UI elements donrsquot interfere whenmultiple maps are in the same HTML document
optionsprimary_metabolite_radius(Default 15) The radius of primary metabolites in px
optionssecondary_metabolite_radius(Default 10) The radius of secondary metabolites in px
optionsmarker_radius(Default 5) The radius of marker nodes in px
optionsgene_font_size(Default 18) The font size of the gene reaction rules in px
optionshide_secondary_metabolites(Default false) If true then secondary nodes and segments are hidden This is conve-nient for generating simplified map figures
optionsshow_gene_reaction_rules(Default false) If true then show the gene reaction rules even without gene data
optionshide_all_labels(Default false) If checked hide all reaction gene and metabolite labels
Applied data
40 Chapter 7 Contents
Escher Documentation Release 143
optionsreaction_data(Default null) An object with reaction ids for keys and reaction data points for values
optionsreaction_stylesDefault [rsquocolorrsquo rsquosizersquo rsquotextrsquo]
An array of style types The array can contain any of the following lsquocolorrsquo lsquosizersquo lsquotextrsquolsquoabsrsquo The lsquocolorrsquo style means that the reactions will be colored according to the loadeddataset The lsquosizersquo style means that the reactions will be sized according to the loadeddataset The lsquotextrsquo style means that the data values will be displayed in the reactionlabels The lsquoabsrsquo style means the the absolute values of reaction values will be used fordata visualization
optionsreaction_compare_style(Default rsquodiffrsquo) How to compare to datasets Can be either lsquofold lsquolog2_foldrsquo orlsquodiffrsquo
optionsreaction_scaleDefault
[ type min color c8c8c8 size 12 type median color 9696ff size 20 type max color ff0000 size 25 ]
An array of objects that define points on the data scale
Each point is an object with a type attribute Types can be lsquominrsquo lsquomaxrsquo lsquomeanrsquo lsquoQ1rsquo (firstquartile) lsquomedianrsquo lsquoQ3rsquo (third quartile) or lsquovaluersquo Each point can have a color attributethat specifies a color with a string (any CSS color specification is allowed including hexrgb and rgba) Each point can have a size attirbute that specifies a reaction thickness as anumber Finally points with type lsquovaluersquo can have a value attribute that specifies an exactnumber for pont in the scale
NOTE If lsquominrsquo or lsquomaxrsquo is not provided Escher automatically adds them To be com-pletely clear about what you expect to see on the map it is best to provide lsquominrsquo andlsquomaxrsquo in addition to other scale points
Here are examples of each type
type rsquominrsquo color rsquoredrsquo size 12 Specifies that reactionsnear the minimum value are red and have thickness 12
type rsquoQ1rsquo color rsquorgba(100 100 50 05)rsquo size 12 Specifies that reactions near the first quartile have the given color opacity andthickness
type rsquomeanrsquo color rsquorgb(100 100 50)rsquo size 50 Specifies that reactions near the mean value have the given color and thickness
type rsquovaluersquo value 85 color rsquo333rsquo size 50 Specifies that reactions near 85 value have the given color and size
optionsreaction_no_data_color(Default rsquodcdcdcrsquo) The color of reactions with no data value
optionsreaction_no_data_size(Default 8) The size of reactions with no data value
optionsgene_data(Default null) An object with Gene ids for keys and gene data points for values
78 JavaScript API 41
Escher Documentation Release 143
optionsand_method_in_gene_reaction_rule(Default mean) When evaluating a gene reaction rule use this function to evaluate ANDrules Can be lsquomeanrsquo or lsquominrsquo
optionsmetabolite_data(Default null) An object with metabolite ids for keys and metabolite data points forvalues
optionsmetabolite_stylesDefault [rsquocolorrsquo rsquosizersquo rsquotextrsquo]
An array of style types The array can contain any of the following lsquocolorrsquo lsquosizersquo lsquotextrsquolsquoabsrsquo The lsquocolorrsquo style means that the metabolites will be colored according to the loadeddataset The lsquosizersquo style means that the metabolites will be sized according to the loadeddataset The lsquotextrsquo style means that the data values will be displayed in the metabolitelabels The lsquoabsrsquo style means the the absolute values of metabolite values will be used fordata visualization
optionsmetabolite_compare_style(Default rsquodiffrsquo) How to compare to datasets Can be either lsquofoldrsquo lsquolog2_foldrsquo orlsquodiffrsquo
optionsmetabolite_scaleDefault
[ type min color fffaf0 size 20 type median color f1c470 size 30 type max color 800000 size 40 ]
An array of objects that define points on the data scale See the description of op-tionsreaction_scale for an explanation of the format
optionsmetabolite_no_data_color(Default rsquoffffffrsquo) The color of metabolites with no data value
optionsmetabolite_no_data_size(Default 10) The size of metabolites with no data value
View and build options
optionsidentifiers_on_map(Default rsquobigg_idrsquo) The identifiers that will be displayed in reaction metabolite andgene labels Can be lsquobigg_idrsquo or lsquonamersquo
optionshighlight_missing(Default false) If true then highlight in red reactions that are not in the loaded COBRAmodel
optionsallow_building_duplicate_reactions(Default true) If true then building duplicate reactions is allowed If false then dupli-cate reactions are hidden in Add reaction mode
optionscofactors(Default [rsquoatprsquo rsquoadprsquo rsquonadrsquo rsquonadhrsquo rsquonadprsquo rsquonadphrsquorsquogtprsquo rsquogdprsquo rsquohrsquo rsquocoarsquo rsquoumprsquo rsquoh20rsquo rsquoppirsquo]) A list of metabo-lite IDs to treat as cofactors These will be secondary metabolites in new reactions
Callbacks
optionsfirst_load_callbackA function to run after loading the Builder
42 Chapter 7 Contents
Escher Documentation Release 143
load_map(map_data[ should_update_data])Load a map for the loaded data Also reloads most of the Builder content
Arguments
bull map_data ndash The data for a map
bull should_update_data (Boolean) ndash (Default true) Whether data should be ap-plied to the map
load_model(model_data[ should_update_data])Load the cobra model from model data
Arguments
bull model_data ndash The data for a Cobra model (Parsing in done by escherCobraModel)
bull should_update_data (Boolean) ndash (Default true) Whether data should be ap-plied to the model
view_mode()Enter view mode
build_mode()Enter build mode
brush_mode()Enter brush mode
zoom_mode()Enter zoom mode
rotate_mode()Enter rotate mode
text_mode()Enter text mode
set_reaction_data(data)
Arguments
bull data (array) ndash An array of 1 or 2 objects where each object has keys that are reactionIDrsquos and values that are data points (numbers)
set_metabolite_data(data)
Arguments
bull data (array) ndash An array of 1 or 2 objects where each object has keys that are metaboliteIDrsquos and values that are data points (numbers)
set_gene_data(data clear_gene_reaction_rules)
Arguments
bull data (array) ndash An array of 1 or 2 objects where each object has keys that are gene IDrsquosand values that are data points (numbers)
Arguments
bull clear_gene_reaction_rules (Boolean) ndash (Optional Default false) In addi-tion to setting the data also turn of the gene_reaction_rules
78 JavaScript API 43
Escher Documentation Release 143
79 Python API
class escherBuilder(map_name=None map_json=None model=None model_name=Nonemodel_json=None embedded_css=None reaction_data=None metabo-lite_data=None gene_data=None local_host=None id=None safe=Falsekwargs)
A metabolic map that can be viewed edited and used to visualize data
This map will also show metabolic fluxes passed in during consruction It can be viewed as a standalone htmlinside a browswer Alternately the respresentation inside an IPython notebook will also display the map
Maps are stored in json files and are stored in a cache directory Maps which are not found will be downloadedfrom a map repository if found
Parameters
bull map_name ndash A string specifying a map to be downloaded from the Escher web server orloaded from the cache
bull map_json ndash A JSON string or a file path to a JSON file or a URL specifying a JSON fileto be downloaded
bull model ndash A Cobra model
bull model_name ndash A string specifying a model to be downloaded from the Escher web serveror loaded from the cache
bull model_json ndash A JSON string or a file path to a JSON file or a URL specifying a JSONfile to be downloaded
bull embedded_css ndash The CSS (as a string) to be embedded with the Escher SVG
bull reaction_data ndash A dictionary with keys that correspond to reaction ids and values thatwill be mapped to reaction arrows and labels
bull metabolite_data ndash A dictionary with keys that correspond to metabolite ids and valuesthat will be mapped to metabolite nodes and labels
bull gene_data ndash A dictionary with keys that correspond to gene ids and values that will bemapped to corresponding reactions
bull local_host ndash A hostname that will be used for any local files This is generally usedfor using the notebook offline and for testing in the IPython Notebook with modified Eschercode An example value for local_host is lsquohttplocalhost7778lsquo
bull id ndash Specify an id to make the javascript data definitions unique A random id is chosen bydefault
bull safe ndash If True then loading files from the filesytem is not allowed This is to ensure thesafety of using Builder within a web server
Keyword Arguments
These are defined in the Javascript API
bulluse_3d_transform
bullenable_search
bullfill_screen
bullzoom_to_element
bullfull_screen_button
44 Chapter 7 Contents
Escher Documentation Release 143
bullstarting_reaction
bullunique_map_id
bullprimary_metabolite_radius
bullsecondary_metabolite_radius
bullmarker_radius
bullgene_font_size
bullhide_secondary_metabolites
bullshow_gene_reaction_rules
bullhide_all_labels
bullreaction_styles
bullreaction_compare_style
bullreaction_scale
bullreaction_no_data_color
bullreaction_no_data_size
bulland_method_in_gene_reaction_rule
bullmetabolite_styles
bullmetabolite_compare_style
bullmetabolite_scale
bullmetabolite_no_data_color
bullmetabolite_no_data_size
bullidentifiers_on_map
bullhighlight_missing
bullallow_building_duplicate_reactions
bullcofactors
All keyword arguments can also be set on an existing Builder object using setter functions eg
my_builderset_reaction_styles(new_styles)
display_in_browser(ip=lsquo127001rsquo port=7655 n_retries=50 js_source=rsquowebrsquo menu=rsquoallrsquoscroll_behavior=rsquopanrsquo enable_editing=True enable_keys=True mini-fied_js=True never_ask_before_quit=False)
Launch a web browser to view the map
Parameters
bull ip ndash The IP address to serve the map on
bull port ndash The port to serve the map on If specified the port is occupied then a random freeport will be used
bull n_retries (int) ndash The number of times the server will try to find a port before quitting
bull js_source (string) ndash Can be one of the following
ndash web (Default) - Use JavaScript files from eschergithubio
79 Python API 45
Escher Documentation Release 143
ndash local - Use compiled JavaScript files in the local Escher installation Works offline
ndash dev - No longer necessary with source maps This now gives the same behavior aslsquolocalrsquo
bull menu (string) ndash Menu bar options include
ndash none - No menu or buttons
ndash zoom - Just zoom buttons
ndash all (Default) - Menu and button bar (requires Bootstrap)
bull scroll_behavior (string) ndash Scroll behavior options
ndash pan - Pan the map
ndash zoom - Zoom the map
ndash none (Default) - No scroll events
bull enable_editing (Boolean) ndash Enable the map editing modes
bull enable_keys (Boolean) ndash Enable keyboard shortcuts
bull minified_js (Boolean) ndash If True use the minified version of JavaScript and CSSfiles
bull never_ask_before_quit (Boolean) ndash Never display an alert asking if you wantto leave the page By default this message is displayed if enable_editing is True
display_in_notebook(js_source=rsquowebrsquo menu=rsquozoomrsquo scroll_behavior=rsquononersquo mini-fied_js=True height=500 enable_editing=False)
Embed the Map within the current IPython Notebook
Parameters
bull js_source (string) ndash Can be one of the following
ndash web (Default) - Use JavaScript files from eschergithubio
ndash local - Use compiled JavaScript files in the local Escher installation Works offline
ndash dev - No longer necessary with source maps This now gives the same behav-ior as lsquolocalrsquo
bull menu (string) ndash Menu bar options include
ndash none - No menu or buttons
ndash zoom - Just zoom buttons
ndash Note The all menu option does not work in an IPython notebook
bull scroll_behavior (string) ndash Scroll behavior options
ndash pan - Pan the map
ndash zoom - Zoom the map
ndash none - (Default) No scroll events
bull minified_js (Boolean) ndash If True use the minified version of JavaScript andCSS files
bull height ndash Height of the HTML container
bull enable_editing (Boolean) ndash Enable the map editing modes
46 Chapter 7 Contents
Escher Documentation Release 143
save_html(filepath=None overwrite=False js_source=rsquowebrsquo protocol=rsquohttpsrsquo menu=rsquoallrsquoscroll_behavior=rsquopanrsquo enable_editing=True enable_keys=True minified_js=Truenever_ask_before_quit=False static_site_index_json=None)
Save an HTML file containing the map
Parameters
bull filepath (string) ndash The HTML file will be saved to this location Whenjs_source is lsquolocalrsquo then a new directory will be created with this name
bull overwrite (Boolean) ndash Overwrite existing files
bull js_source (string) ndash Can be one of the following
ndash web (Default) - Use JavaScript files from eschergithubio
ndash local - Use compiled JavaScript files in the local Escher installation Works of-fline To make the dependencies available to the downloaded file a new directorywill be made with the name specified by filepath
ndash dev - No longer necessary with source maps This now gives the same behav-ior as lsquolocalrsquo
bull protocol (string) ndash The protocol can be lsquohttprsquo lsquohttpsrsquo or None which indicatesa lsquoprotocol relative URLrsquo as in eschergithubio Ignored if source is local
bull menu (string) ndash Menu bar options include
ndash none - No menu or buttons
ndash zoom - Just zoom buttons
ndash all (Default) - Menu and button bar (requires Bootstrap)
bull scroll_behavior (string) ndash Scroll behavior options
ndash pan - Pan the map
ndash zoom - Zoom the map
ndash none (Default) - No scroll events
bull enable_editing (Boolean) ndash Enable the map editing modes
bull enable_keys (Boolean) ndash Enable keyboard shortcuts
bull minified_js (Boolean) ndash If True use the minified version of JavaScript andCSS files
bull height (number) ndash Height of the HTML container
bull never_ask_before_quit (Boolean) ndash Never display an alert asking if youwant to leave the page By default this message is displayed if enable_editing isTrue
bull static_site_index_json (string) ndash The index as a JSON string for thestatic site Use javascript to parse the URL options Used for generating static pages(see static_sitepy)
791 Cache
escherget_cache_dir(versioned=True name=None)Get the cache dir as a string and make the directory if it does not already exist
Parameters
79 Python API 47
Escher Documentation Release 143
bull versioned (Boolean) ndash Whether to return the versioned path in the cache Eschermaps for the latest version of Escher are found in the versioned directory (versioned= True) but maps for previous versions of Escher can be found by visiting the parentdirectory (versioned = False)
bull name (string) ndash An optional subdirectory within the cache If versioned is False thenname is ignored
escherclear_cache(different_cache_dir=None ask=True)Empty the contents of the cache directory including all versions of all maps and models
Parameters
bull different_cache_dir (string) ndash (Optional) The directory of another cacheThis is mainly for testing
bull ask (Boolean) ndash Whether to ask before deleting
escherlist_cached_maps()Return a list of all cached maps
escherlist_cached_models()Return a list of all cached models
escherlist_available_maps()Return a list of all maps available on the server
escherlist_available_models()Return a list of all models available on the server
710 License
Escher and EscherConverter are distributed under the MIT license
bull genindex
48 Chapter 7 Contents
Python Module Index
eescher 44
49
Escher Documentation Release 143
50 Python Module Index
Index
Bbrush_mode() (built-in function) 43build_mode() (built-in function) 43Builder (class in escher) 44
Cclear_cache() (in module escher) 48
Ddisplay_in_browser() (escherBuilder method) 45display_in_notebook() (escherBuilder method) 46
Eescher (module) 44escherBuilder() (class) 39
Gget_cache_dir() (in module escher) 47
Llist_available_maps() (in module escher) 48list_available_models() (in module escher) 48list_cached_maps() (in module escher) 48list_cached_models() (in module escher) 48load_map() (built-in function) 42load_model() (built-in function) 43
Ooptionenable_keys (option attribute) 40optionsallow_building_duplicate_reactions (options at-
tribute) 42optionsand_method_in_gene_reaction_rule (options at-
tribute) 41optionscofactors (options attribute) 42optionsenable_editing (options attribute) 39optionsenable_search (options attribute) 40optionsfill_screen (options attribute) 40optionsfirst_load_callback (options attribute) 42optionsfull_screen_button (options attribute) 40optionsgene_data (options attribute) 41
optionsgene_font_size (options attribute) 40optionshide_all_labels (options attribute) 40optionshide_secondary_metabolites (options attribute)
40optionshighlight_missing (options attribute) 42optionsidentifiers_on_map (options attribute) 42optionsignore_bootstrap (options attribute) 40optionsmarker_radius (options attribute) 40optionsmenu (options attribute) 39optionsmetabolite_compare_style (options attribute) 42optionsmetabolite_data (options attribute) 42optionsmetabolite_no_data_color (options attribute) 42optionsmetabolite_no_data_size (options attribute) 42optionsmetabolite_scale (options attribute) 42optionsmetabolite_styles (options attribute) 42optionsnever_ask_before_quit (options attribute) 40optionsprimary_metabolite_radius (options attribute) 40optionsreaction_compare_style (options attribute) 41optionsreaction_data (options attribute) 40optionsreaction_no_data_color (options attribute) 41optionsreaction_no_data_size (options attribute) 41optionsreaction_scale (options attribute) 41optionsreaction_styles (options attribute) 41optionsscroll_behavior (options attribute) 39optionssecondary_metabolite_radius (options attribute)
40optionsshow_gene_reaction_rules (options attribute) 40optionsstarting_reaction (options attribute) 40optionsunique_map_id (options attribute) 40optionsuse_3d_transform (options attribute) 39
Rrotate_mode() (built-in function) 43
Ssave_html() (escherBuilder method) 46set_gene_data() (built-in function) 43set_metabolite_data() (built-in function) 43set_reaction_data() (built-in function) 43
51
Escher Documentation Release 143
Ttext_mode() (built-in function) 43
Vview_mode() (built-in function) 43
Zzoom_mode() (built-in function) 43
52 Index
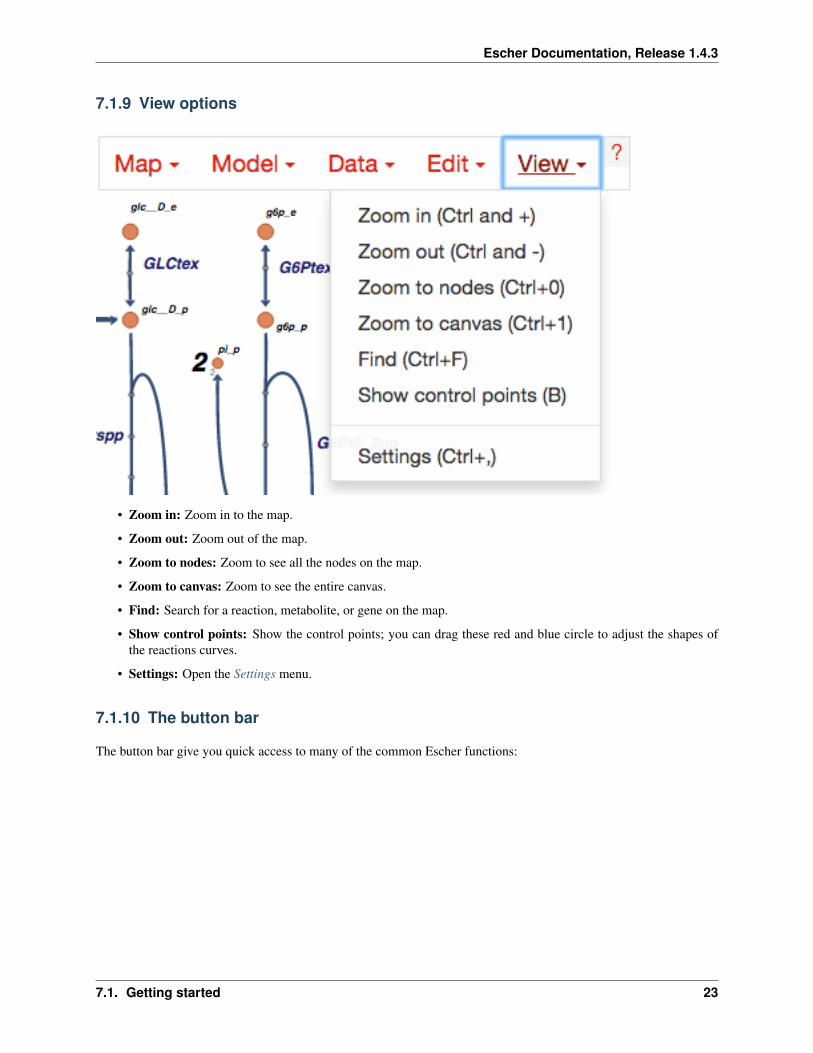
Escher Documentation Release 143
24 Chapter 7 Contents
Escher Documentation Release 143
7111 Settings
View and build options
bull Identifiers Choose whether to show BiGG IDs or descriptive names for reactions metabolites and genes
bull Hide secondary metabolites This will simplify the map by hiding all secondary metabolites and the pathsconnected to them
bull Show gene reaction rules Show the gene reaction rules below the reaction labels even gene data is not loaded
bull Hide reaction gene and metabolite labels Another option to visually simplify the map this will hide alllabels that are not text annotations
bull Allow duplicate reactions By default duplicate reactions are hidden in the add reaction dropdown menuHowever you can turn this option on to show the duplicate reactions
bull Highlight reactions not in model Highlight in red any reactions that are on the map but are not in the modelThis is useful when you are adapting a map from one model for use with another model
71 Getting started 25
Escher Documentation Release 143
Reaction data settings
When reaction or gene data is loaded this section can be used to change visual settings for reactions
The color bar has individual control points and you can drag the control points (execpt min and max) left and right tochange their values Alternatively you can use the dropdown menu (next to the word median in the figure above) toattach a control point to a statistical measure (mean median first quartile (Q1) or third quartile (Q3)) This lets youchoose a color scale that will adapt to your dataset
For each control point you can choose a color by entering a CSS-style color (eg red ff0000 rgba(20 20 255 05)and you can choose a size that will scale the thickness of reactions
There are also color and size options for reactions that do not have any data value
Finally there are a few onoff settings for the loaded reaction or gene dataset
bull Options These determine how to visualize the datasets Check Absolute value to color and size reactions bythe absolute value of each data value The Size Color and Text options can be unselected to turn off sizingcoloring and data values in reaction labels individually
bull Comparison Determines the comparison algorithm to use when two datasets are loaded
bull Method for evaluating AND Determines the method that will be used to reconcile AND statements in genereaction rules when there is gene data loaded See Gene data and gene reaction rules for more details
Metabolite data settings
The data settings for metabolite data are analagous to those for reaction data The only difference is that size nowrefers to the size of the metabolite circles
26 Chapter 7 Contents
Escher Documentation Release 143
72 Escher COBRA and COBRApy
Escher can be used as an independent application but it draws heavily on the information in COBRA models ACOBRA model is a collection of all the reactions metabolites and genes known to exist in an organism (In theliterature these are generally called genome-scale models (GEMs) but we refer to them as COBRA models here toemphasize that Escher interoperates with models that are exported from COBRApy)
By loading a COBRA model into the Escher interface you have access to every reaction and metabolite in that modelYou also have the gene reaction rules for the reactions in the network which allow you to connect gene data toreactions and metabolites
COBRApy is a software package for COBRA modeling written in Python The Escher Python package uses CO-BRApy package for reading and writing COBRA models
721 Maps and models
In Escher you will see references to maps and models
A map contains the reactions and metabolites that you see in the Escher builder including their locations text annota-tions and the canvas
A model (a COBRA model) contains reactions and metabolites that you have not drawn yet Thus you can load aCOBRA model when you want to draw new reactions on the map
722 What is JSON and why do we use it
Both Escher maps and COBRA models are stored as JSON files JSON is a useful plain-text format for storing nesteddata structures We use JSON much like the SBML community uses XML You may notice that SBML files have axml extension and Escher maps and COBRA models have a json extension
You can use Python to explore a JSON file like this
import json
with open(mapjson r) as fmap_object = jsonload(f)
print map_object[0]print map_object[1][reactions]values()[0]
723 Escher SBML and SBGN
A tool has been developed for converting Escher maps to SBML Layout and SBGN and it will be released soon
COBRA models can be converted to SBML using COBRApy
73 Run Escher locally and in IPython
To run Escher on a local computer or to use Escher in PythonIPython first install it The Python package for Eschercan be installed using pip
pip install escher
72 Escher COBRA and COBRApy 27
Escher Documentation Release 143
Depending on your installation of Python you may need sudo
sudo pip install escher
Alternatively one can download the source files and install the package directly
python setuppy install
731 Escher in the IPython Notebook
Once you have installed Escher locally you can interact with Escher maps in an IPython Notebook
Here are example notebooks to get started with
bull COBRApy and Escher
bull JavaScript development and offline maps
bull Generate JSON models in COBRApy
Dependencies
bull Jinja2
bull Tornado
bull COBRApy 030 or later
732 Running the local server
You can run your own local server if you want to use Escher offline or explore your own maps with the homepagebrowser To get started install the Python package and run from any directory by calling
python -m escherserver
This starts a server at httplocalhost7778 You can also choose another port
python -m escherserver --port=8005
74 Validate and convert maps
741 Validate an Escher map
Escher maps follow a specification using the JSON Schema format Therefore any JSON Schema validator can beused to validate an Escher map by comparing it to the latest schema file For example the current schema is locatedhere
httpsgithubcomzakandrewkingescherblobmasterescherjsonschema1-0-0
To make this easier the Escher Python package includes a validation script To validate a map first install Escher
pip install escher
Then call the validator
python -m eschervalidate my_mapjson
Any errors in the map will print to the console
28 Chapter 7 Contents
Escher Documentation Release 143
742 Convert or upgrade an Escher map
Any Escher maps built with pre-release versions of Escher will not load right away in the stable v10 release Toconvert pre-release maps to the new format follow these steps
1 Install Escher
pip install escher
2 Find a COBRA model for your maps This COBRA model will be used to update the content of the mapin order to support all the new Escher features You can use a COBRA model encoded as SBML or JSON(generated with COBRApy v030b4 or later) The COBRA models currently available on the Escher websitecan be downloaded from the BiGG Models website
httpbiggucsdedu
For a refresher on the distinction between Escher maps COBRA models and their file types (SBML JSONSBML Layout) see Escher COBRA and COBRApy
3 Run the convert_map script to convert your existing Escher map (my_old_mapjson) to the new formatusing a COBRA model (model_filejson or model_filexml in these examples)
With a JSON file modelpython -m escherconvert_map my_old_mapjson pathtomodel_filejson
With an SBML modelpython -m escherconvert_map my_old_mapjson pathtomodel_filexml
Those commands will generate a new map called my_old_map_convertedjson that will load in Escher v10and later
75 Building and contributing maps
We are excited to collect pathway maps for every organism with a well characterized metabolic network This sectiondescribes the process of building a new map either from scratch or using a COBRA model with BiGG IDs
751 Building from scratch
To build a map from scratch you will first need a COBRA model for your map See the section Escher COBRA andCOBRApy for some background information on COBRA models
If you would like to eventually contribute your map to the Escher website it is important that your COBRA modeladheres to the identifiers in the BiGG Database Escher and BiGG are being developed together and we want tomaintain consistency and interoperability between them
Once you have a COBRA model you can follow these steps
1 Load your model in the Escher Builder
2 Begin building new reactions If you are familiar with the genes in your organism then try search for newreactions by their gene IDs
3 Limit each map to ~200 reactions Maps larger than this will slow down the Escher viewer especially on oldbrowsers Rather than building one giant map Escher is designed for building many smaller subsystem maps
4 When you have built a map for your a subsystem save the map as JSON with a name that includes the modelID followed by a period followed by the name of the subsystem For example
75 Building and contributing maps 29
Escher Documentation Release 143
iMM904Amino acid biosynthesisjson
5 (Optional) Once you have a set of subsystem maps you can set up a local Escher server so that subsystem mapsappear in the ldquoquick jumprdquo menu in the bottom right corner of the screen (as seen here for iJO1366) To setthis up you will need to start a local server as describe in Running the local server Next find your local cachedirectory by running this command in a terminal
python -c import escher print(escherget_cache_dir(name=maps))
This will print the location of the local maps cache Add your new subsystem maps to cache folder Now whenyou run the server (described in Running the local server) you should see that quick jump menu appear
NOTE The cache directory is organized into folders for organisms You can use these folder for filtering byorganism on the local launch page or you can place the maps in the top directory
NOTE 2 A similar approach can be used to access your models from the local launch page Place maps in thefolder indicated by
python -c import escher print(escherget_cache_dir(name=models))
752 Building from an existing map for a similar organism
Follow the instruction above except rather than starting from scratch load an existing Escher map for a differentorganism
Once you have the new model loaded use the Update names and gene reaction rules using model button in theModel menu to convert all descriptive names and gene reaction rules in the model to those in the map Reactions thatdo not match the model will be highlighted in red (This can be turned off again in the settings menu by deselectingHighlight reactions not in model)
Now visit each highlighted reaction and see if you can replace it with an equivalent biochemical pathway from themodel If not then delete the reaction and move on
Finally when there are no highlighted reactions left you can repeat this for other subsystems
753 Submitting maps to the Escher website
If you would like to contribute maps to Escher you can make a Pull Request to the GitHub repository eschergithubioMake sure there is a folder with the name of the organism in 1-0-0maps For example a new yeast map goes inthe folder
1-0-0mapsSaccharomyces cerevisiae
Then name your map by concatenating the model ID and the map name separated by a period For example a yeastmap built with the genome-scale model iMM904 could be named
iMM904Amino acid biosynthesisjson
Then add the JSON file for the model to the Pull Request if that model is not already available As before make afolder for your organism within 1-0-0models The model filename is just the model ID
In this example a correct Pull Request would include the following files
1-0-0mapsSaccharomyces cerevisiaeiMM904Amino acid biosynthesisjson1-0-0modelsSaccharomyces cerevisiaeiMM904json
30 Chapter 7 Contents
Escher Documentation Release 143
76 Developing with Escher
761 Using the static JavaScript and CSS files
You can include the compiled Escher JavaScript and CSS files in any HTML document The only dependencies ared3js and optionally Twitter Bootstrap if you are using the option menu=rsquoallrsquo
The compiled files are available form npmcdn
httpsnpmcdncomescher-visjsdistescherjshttpsnpmcdncomescher-visjsdistescherminjshttpsnpmcdncomescher-viscssdistbuildercsshttpsnpmcdncomescher-viscssdistbuildermincss
Source maps are also hosted there
httpsnpmcdncomescher-visjsdistescherjsmaphttpsnpmcdncomescher-visjsdistescherminjsmaphttpsnpmcdncomescher-viscssdistbuildermincssmap
If you want a particular version of escher add a version tag like this
httpsnpmcdncomescher-vis140-beta3jsdistescherjs
For an example of the boilerplate code that is required to begin developing with Escher have a look at the escher-demorepository For projects built with npm use the escher-test repository as a guide
762 Building and testing Escher
First install dependencies with npm
npm install
Escher uses grunt to manage the build process To run typical build steps just run
npm run compile
To test the JavaScript files run
npm run test
For Python testing run this in the py directory
python setuppy test
Build the static website
python setuppy build_gh
Clear static website files
python setuppy clean
Build and run the docs
cd docsmake htmlcd _buildhtml
76 Developing with Escher 31
Escher Documentation Release 143
python -m SimpleHTTPServer python 2python -m httpserver python 3
763 Generating and reading Escher and COBRA files
The Escher file format
Escher layouts are defined by JSON files that follow a specific schema using json schema The latest schemafor Escher JSON files is here The Escher schemas are versioned with inspiration from SchemaVer Theeschervalidate module can be used to validate models against the schema
The Escher layout schema is designed to be as simple as possible For example the core metabolism map of Es-cherichia coli is layed out like this
[
map_name E coli coreCore metabolismmap_id 2938hoq32a1map_description E coli core metabolic networknLast Modified Fri Dec 05 2014 163944 GMT-0800 (PST)homepage httpseschergithubioschema httpseschergithubioescherjsonschema1-0-0
reactions nodes text_label canvas
x 7857062530517567y 31436893920898433width 5894515691375733height 4860457037353515
]
The map_name includes the model that was used to build this layout followed by a period and then a readable namefor the map The map_id is a unique identifier for this map The map_description describes the map and thelast time it was modified Both the homepage and the schema entries must have exactly these values for the Eschermap to be valid
In the next section the reactions nodes labels and canvas are all defined For reactions nodes and text labels eachelement has a key that is an arbitrary integer As long as there are no repeated IDs (eg no 2 segments with the ID517) then everything should work fine
Read through the schema (here) for more detail on the format
The COBRA file format
COBRA models are also saved as JSON files This format has not been documented with a schema but you canbrowse through the core metabolism model as a guide to generating valid COBRA models
I still need help
If you are interested in developing with Escher and you need more information than what is provided in the documen-tation please contact Zachary King (zaking-AT-ucsd-DOT-edu)
32 Chapter 7 Contents
Escher Documentation Release 143
77 EscherConverter
EscherConverter is a standalone program that reads files created with the graphical network editor Escher and convertsthem to files in community standard formats
Download EscherConverter 05 (137 MB)
771 Using EscherConverter
Escher uses a JSON file format to represent its networks This format has been developed because of its very small filesize and its compatibility to online programs that are written in JavaScript In particular JSON is a JavaScript ObjectNotation or in other words a JSON file directly represents components of JavaScript programs This makes parsingvery simple and allows direct use of those files in web-based programs
However in systems biology specific file formats have been developed with the aim to be easily exchangeable betweensoftware implemented in diverse programming languages
To this end these formats support semantically clear annotations and are maintained by a large community of scientistsEscherConverter supports export to two particularly important XML-based community file formats SBML with layoutextension and SBGN-ML
While SBML has been mainly developed for dynamic simulation of biological networks it is nowadays also usablefor diverse other purposes Its layout extension facilitates the encoding the display of biological networks
SBGN-ML has been directly developed as a language for the display of biological pathway maps of diverse kinds Itstores the position and connection of entities similar to what is shown in Escher networks
EscherConverter takes Escherrsquos JSON files as input and generates equivalent SBML Level 3 Version 1 files with layoutextension or SBGN-ML files
In order to ensure that the conversion is correct EscherConverter provides its own display that gives users a previewof how the export data format will be rendered by other tools In this preview display you can zoom in and out movearcs and node positions However it is important to know that none of the changes made in this preview are stored inthe export file
Download and Installation
You can obtain local copy of EscherConverter by clicking here
As a Javatrade application no specific installation is required for EscherConverter
However make sure you have a recent Javatrade Runtime Environment (JRE) installed on your computer (at least JRE8) You can obtain Javatrade from the Oracle website There you can also find installation instructions for your respectiveoperating system
Once Javatrade has been installed you can simply place the EscherConverter JAR file somewhere on your local computerfor instance in the folder
bull Applications if you are working under Mac OS
77 EscherConverter 33
Escher Documentation Release 143
bull opt for Linux computers
bull CProgram Files if you are using Windows
Launching the program
You can launch EscherConverter simply by double-clicking on the application JAR file This will open a followinggraphical user interface as described in the following figures
Figure 1 | The graphical user interface of EscherConverter
bull Preferences opens a settings dialog (see next screenshot)
bull Open displays a file chooser to select an input file in JSON format
bull Save export the map that is displayed in the current tab to SBML or SBGN-ML
bull Discard closes the current tab without saving
bull Help opens the online help that displays all command-line options
bull License displays the license under which this software is distributed
bull About shows information about the authors of this software
bull Main the main panel of the software in which converted Escher maps will be displayed organized in tabs
bull Status the status bar shows information and logging messages during the conversion
34 Chapter 7 Contents
Escher Documentation Release 143
Figure 2 | The preferences dialog All settings in this dialog are also available through EscherConverterrsquos command-line interface
Layout section several properties that are required in SBML and SBGN-ML are not explicitly specified in EscherrsquosJSON format and therefore need to be adjusted by the user These are the size of the drawing canvas the default boxsize for text labels the size of primary and secondary nodes In contrast to SBGN-ML and Escherrsquos JSON formatthe SBML layout extension supports three-dimensional displays When selecting this export file format it is thereforenecessary to also define the z-coordinate and the depth of all objects
Components and naming section Most settings in this section are specific for the SBML layout extension and areonly active if this output format is selected These are names and identifiers of the layout component and the in caseof SBML mandatory default compartment (a compartment without physical meaning a reaction space in which allmetabolites are located) EscherConverter can infer compartment bounds from metabolites but this is an experimentalfeature Just try it and see how the preview changes
77 EscherConverter 35
Escher Documentation Release 143
Figure 3 | A layout preview
The birds-eye view and the navigation component on the left help you navigate through the network display Thisgraph shows you how the converted pathway map will be rendered by software that supports SBGN-ML or the SBMLlayout extension This preview can be modified by moving arcs or nodes however none of those changes are storedwhen exporting the file In this current version EscherConver only exports layouts as given in the original JSON file
Included third-party software
EscherConverter includes several third-party libraries which we here list and acknowledge
bull ArgParser
bull JSBML
bull libSBGN
bull Pixel-Mixer icons
bull yFiles
772 Command-line interface API
You can launch EscherConverter from the command-line On a Unix system (such as Linux MacOS or Solaris etc)use a command like
bash$ java -jar -Xms8G -Xmx8G -Duserlanguage=en EscherConverter-05jar [options]
Under Window use a command like
Cgt javaw -jar -Xms8G -Xmx8G -Duserlanguage=en EscherConverter-05jar [options]
Escher has a large collection of command-line options (see below) which can be useful if you want to launch theprogram with specific settings or if multiple files are to be converted in a batch mode It is even possible to completelydisable the graphical user interface
36 Chapter 7 Contents
Escher Documentation Release 143
Input and output files
Definition of input and output data files as well as the format for the output
--input=ltFilegt
Specifies the JSON input file If a directory is given the conversion will be recursively performed Accepts JSON
--output=ltFilegt
The path to the file into which the output should be written If the input is a directory this must also be a directory inorder to perform a recursive conversion Accepts SBML SBGN
Escher layout
The options in this group allow you to influence how large certain elements should be displayed
--canvas-default-height=ltDoublegt
Just as in the case of the width of the canvas this value needs to be specified for cases where the JSON input file lacksan explicit specification of the canvas height Arguments must fit into the range [11E9] (Default value 2500)
--canvas-default-width=ltDoublegt
This value is used when no width has been defined for the canvas Since the width attribute is mandatory for the layouta default value must be provided in these cases Arguments must fit into the range [11E9] (Default value 2500)
--label-height=ltDoublegt
With this option you can specify the height of the bounding box of text labels Arguments must fit into the range[11E9] (Default value 500)
--label-width=ltDoublegt
This option defines the width of bounding boxes for text labels Arguments must fit into the range [11E9] (Defaultvalue 1600)
--node-depth=ltDoublegt
The length of nodes along z-coordinate Escher maps are actually two-dimensional but in general a layout can bethree-dimensional This value should be an arbitrary value greater than zero because some rendering engines mightnot display the node if its depth is zero Arguments must fit into the range [11E9] (Default value 10)
--node-label-height=ltDoublegt
Node labels can have a size different from general labels in the graph Here you can specify how height the boundingbox of the labels for nodes should be Arguments must fit into the range [11E9] (Default value 200)
--primary-node-height=ltDoublegt
The primary node should be bigger than the secondary node With this option you can specify the height of this typeof nodes Arguments must fit into the range [11E9] (Default value 300)
--primary-node-width=ltDoublegt
Escher maps distinguish between primary and secondary nodes Primary nodes should be larger than secondary nodesand display the main flow of matter through the network This option allows you to specify the width of primarynodes Arguments must fit into the range [11E9] (Default value 300)
77 EscherConverter 37
Escher Documentation Release 143
--reaction-label-height=ltDoublegt
Reaction label heightArguments must fit into the range [11E9] (Default value 300)
--reaction-node-ratio=ltDoublegt
This value is used as a conversion factor to determine the size of the reaction display box depending on the size ofprimary nodes Height and width of reaction nodes are determined by dividing the corresponding values from theprimary node size by this factor Arguments must fit into the range [01] (Default value 05)
--secondary-node-ratio=ltDoublegt
Similar to the reaction node ratio the size of secondary nodes (width and height) is determined by dividing thecorresponding values from the primary nodes by this value Arguments must fit into the range [01] (Default value06666666666666666)
--z=ltDoublegt
The position on the z-axis where the entire two-dimensional graph should be drawn Arguments must fit into the range[-1E91E9] (Default value 00)
Escher Components and their naming
Here you can influence which elements are to be included in the layout and how elements in the layout are to be calledor identified
--format=ltOutputFormatgt
The desired format for the conversion eg SBML All possible values for type ltOutputFormatgt are SBGN andSBML (Default value SBML)
--layout-id=ltStringgt
In contrast to the name this identifier does not have to be human-readable This is a machine identifier which muststart with a letter or underscore and can only contain ASCII characters (Default value Escher_Layout)
--layout-name=ltStringgt
This should be a human-readable name for the layout that is to be created This name might be displayed to describethe figure and should therefore be explanatory (Default value Escher Layout)
--compartment-id=ltStringgt
A compartment needs to have a unique identifier which needs to be a machine-readable Sting that must start with aletter or underscore and can only contain ASCII characters Since the JSON file does not provide this information thisoption allows you to specify the required identifier (Default value default)
--compartment-name=ltStringgt
With this option it is possible to define a name for the default compartment can be that needs to be generated for theconversion to SBML The name does not have any restrictions ie any UTF-8 character can be used (Default valueDefault compartment)
--infer-compartment-bounds
This converter can infer where the boundaries of compartments could be drawn To this end it uses each nodersquos BiGGids to identify the compartment of all metabolites Assuming that compartments have rectangular shapes the algorithmcan find the outermost node on each side of the box and hence obtain the boundaries of the compartment However
38 Chapter 7 Contents
Escher Documentation Release 143
this methods will fail when metabolites are drawn inside of such a box that belong to a different compartment that isactually further outside For this reason this option is deactivated by default (Default value false)
Options for the graphical user interface
--gui
If this option is given the program will display its graphical user interface (Default value false)
--log-level=ltStringgt
Change the log-level of this application This option will influence how fine-grained error and other log messages willbe that you receive while executing this program All possible values for type ltStringgt are ALL CONFIG FINEFINER FINEST INFO OFF SEVERE and WARNING (Default value INFO)
--log-file=ltFilegt
This option allows you to specify a log file to which all information of the program will be written Accepts (bp2bp3 log owl xml)
78 JavaScript API
class escherBuilder(map_data model_data embedded_css selection options)A Builder object contains all the UI and logic to generate a map builder or viewer
Arguments
bull map_data (object) ndash The data for a map to be passed to escherMapfrom_data() Ifnull then an empty Builder is initialized
bull model_data (object) ndash The data for a cobra model to be passed to es-cherCobraModel() Can be null
bull embedded_css (string) ndash The stylesheet for the SVG elements in the Escher map
bull selection (object) ndash (Optional Default In the body element) The d3 selection of anelement to place the Builder into The selection cannot be inside an SVG element
bull options (object) ndash (Optional) An object defining any of the following options
optionsmenu(Default rsquoallrsquo) The type of menu that will be displayed Can be lsquoallrsquo for the fullmenu or lsquozoomrsquo for just zoom buttons The lsquoallrsquo option requires the full set of Escherdependencies (D3js JQuery and Bootstrap) while the lsquozoomrsquo option requires only D3jsFor more details see Developing with Escher
optionsscroll_behavior(Default rsquopanrsquo) This option determines the effect that the scroll wheel will have onan Escher map Can be lsquopanrsquo to pan the map or lsquozoomrsquo to zoom the map when the usermoves the scroll wheel
optionsuse_3d_transform(Default Chooses a good option by testing the browser) If true then use CSS3 3D trans-forms to speed up panning and zooming This feature will only work on browsers thatsupport the 3D transforms It works best in the latest versions of Chrome Firefox andInternet Explorer Safari works better with this turned off
78 JavaScript API 39
Escher Documentation Release 143
optionsenable_editing(Default true) If true then display the map editing functions If false then hide themand only allow the user to view the map
optionenable_keys(Default true) If true then enable keyboard shortcuts
optionsenable_search(Default true) If true then enable indexing of the map for search Use false to disablesearching and potentially improve the map performance
optionsfill_screen(Default false) Use true to fill the screen when an Escher Builder is placed in a top-level container (eg a div in the body element)
optionsfull_screen_button(Default false) Include a button in the user interface for entering full screen mode
optionsignore_bootstrap(Default false) Do not use Bootstrap for buttons even if it available This is used toembed Escher in a Jupyter notebook where it conflicts with the Jupyter Boostrap installa-tion
Map model and styles
optionsstarting_reaction(Default null) The ID (as a string) of a reaction to draw when the Builder loads
optionsnever_ask_before_quit(Default false) If false then display a warning before the user closes an Eschermap If true then never display the warning This options is only respected if op-tionsenable_editing == true If enable_editing is false then the warnings are not dis-played
optionsunique_map_id(Default null) A unique ID that will be used to UI elements donrsquot interfere whenmultiple maps are in the same HTML document
optionsprimary_metabolite_radius(Default 15) The radius of primary metabolites in px
optionssecondary_metabolite_radius(Default 10) The radius of secondary metabolites in px
optionsmarker_radius(Default 5) The radius of marker nodes in px
optionsgene_font_size(Default 18) The font size of the gene reaction rules in px
optionshide_secondary_metabolites(Default false) If true then secondary nodes and segments are hidden This is conve-nient for generating simplified map figures
optionsshow_gene_reaction_rules(Default false) If true then show the gene reaction rules even without gene data
optionshide_all_labels(Default false) If checked hide all reaction gene and metabolite labels
Applied data
40 Chapter 7 Contents
Escher Documentation Release 143
optionsreaction_data(Default null) An object with reaction ids for keys and reaction data points for values
optionsreaction_stylesDefault [rsquocolorrsquo rsquosizersquo rsquotextrsquo]
An array of style types The array can contain any of the following lsquocolorrsquo lsquosizersquo lsquotextrsquolsquoabsrsquo The lsquocolorrsquo style means that the reactions will be colored according to the loadeddataset The lsquosizersquo style means that the reactions will be sized according to the loadeddataset The lsquotextrsquo style means that the data values will be displayed in the reactionlabels The lsquoabsrsquo style means the the absolute values of reaction values will be used fordata visualization
optionsreaction_compare_style(Default rsquodiffrsquo) How to compare to datasets Can be either lsquofold lsquolog2_foldrsquo orlsquodiffrsquo
optionsreaction_scaleDefault
[ type min color c8c8c8 size 12 type median color 9696ff size 20 type max color ff0000 size 25 ]
An array of objects that define points on the data scale
Each point is an object with a type attribute Types can be lsquominrsquo lsquomaxrsquo lsquomeanrsquo lsquoQ1rsquo (firstquartile) lsquomedianrsquo lsquoQ3rsquo (third quartile) or lsquovaluersquo Each point can have a color attributethat specifies a color with a string (any CSS color specification is allowed including hexrgb and rgba) Each point can have a size attirbute that specifies a reaction thickness as anumber Finally points with type lsquovaluersquo can have a value attribute that specifies an exactnumber for pont in the scale
NOTE If lsquominrsquo or lsquomaxrsquo is not provided Escher automatically adds them To be com-pletely clear about what you expect to see on the map it is best to provide lsquominrsquo andlsquomaxrsquo in addition to other scale points
Here are examples of each type
type rsquominrsquo color rsquoredrsquo size 12 Specifies that reactionsnear the minimum value are red and have thickness 12
type rsquoQ1rsquo color rsquorgba(100 100 50 05)rsquo size 12 Specifies that reactions near the first quartile have the given color opacity andthickness
type rsquomeanrsquo color rsquorgb(100 100 50)rsquo size 50 Specifies that reactions near the mean value have the given color and thickness
type rsquovaluersquo value 85 color rsquo333rsquo size 50 Specifies that reactions near 85 value have the given color and size
optionsreaction_no_data_color(Default rsquodcdcdcrsquo) The color of reactions with no data value
optionsreaction_no_data_size(Default 8) The size of reactions with no data value
optionsgene_data(Default null) An object with Gene ids for keys and gene data points for values
78 JavaScript API 41
Escher Documentation Release 143
optionsand_method_in_gene_reaction_rule(Default mean) When evaluating a gene reaction rule use this function to evaluate ANDrules Can be lsquomeanrsquo or lsquominrsquo
optionsmetabolite_data(Default null) An object with metabolite ids for keys and metabolite data points forvalues
optionsmetabolite_stylesDefault [rsquocolorrsquo rsquosizersquo rsquotextrsquo]
An array of style types The array can contain any of the following lsquocolorrsquo lsquosizersquo lsquotextrsquolsquoabsrsquo The lsquocolorrsquo style means that the metabolites will be colored according to the loadeddataset The lsquosizersquo style means that the metabolites will be sized according to the loadeddataset The lsquotextrsquo style means that the data values will be displayed in the metabolitelabels The lsquoabsrsquo style means the the absolute values of metabolite values will be used fordata visualization
optionsmetabolite_compare_style(Default rsquodiffrsquo) How to compare to datasets Can be either lsquofoldrsquo lsquolog2_foldrsquo orlsquodiffrsquo
optionsmetabolite_scaleDefault
[ type min color fffaf0 size 20 type median color f1c470 size 30 type max color 800000 size 40 ]
An array of objects that define points on the data scale See the description of op-tionsreaction_scale for an explanation of the format
optionsmetabolite_no_data_color(Default rsquoffffffrsquo) The color of metabolites with no data value
optionsmetabolite_no_data_size(Default 10) The size of metabolites with no data value
View and build options
optionsidentifiers_on_map(Default rsquobigg_idrsquo) The identifiers that will be displayed in reaction metabolite andgene labels Can be lsquobigg_idrsquo or lsquonamersquo
optionshighlight_missing(Default false) If true then highlight in red reactions that are not in the loaded COBRAmodel
optionsallow_building_duplicate_reactions(Default true) If true then building duplicate reactions is allowed If false then dupli-cate reactions are hidden in Add reaction mode
optionscofactors(Default [rsquoatprsquo rsquoadprsquo rsquonadrsquo rsquonadhrsquo rsquonadprsquo rsquonadphrsquorsquogtprsquo rsquogdprsquo rsquohrsquo rsquocoarsquo rsquoumprsquo rsquoh20rsquo rsquoppirsquo]) A list of metabo-lite IDs to treat as cofactors These will be secondary metabolites in new reactions
Callbacks
optionsfirst_load_callbackA function to run after loading the Builder
42 Chapter 7 Contents
Escher Documentation Release 143
load_map(map_data[ should_update_data])Load a map for the loaded data Also reloads most of the Builder content
Arguments
bull map_data ndash The data for a map
bull should_update_data (Boolean) ndash (Default true) Whether data should be ap-plied to the map
load_model(model_data[ should_update_data])Load the cobra model from model data
Arguments
bull model_data ndash The data for a Cobra model (Parsing in done by escherCobraModel)
bull should_update_data (Boolean) ndash (Default true) Whether data should be ap-plied to the model
view_mode()Enter view mode
build_mode()Enter build mode
brush_mode()Enter brush mode
zoom_mode()Enter zoom mode
rotate_mode()Enter rotate mode
text_mode()Enter text mode
set_reaction_data(data)
Arguments
bull data (array) ndash An array of 1 or 2 objects where each object has keys that are reactionIDrsquos and values that are data points (numbers)
set_metabolite_data(data)
Arguments
bull data (array) ndash An array of 1 or 2 objects where each object has keys that are metaboliteIDrsquos and values that are data points (numbers)
set_gene_data(data clear_gene_reaction_rules)
Arguments
bull data (array) ndash An array of 1 or 2 objects where each object has keys that are gene IDrsquosand values that are data points (numbers)
Arguments
bull clear_gene_reaction_rules (Boolean) ndash (Optional Default false) In addi-tion to setting the data also turn of the gene_reaction_rules
78 JavaScript API 43
Escher Documentation Release 143
79 Python API
class escherBuilder(map_name=None map_json=None model=None model_name=Nonemodel_json=None embedded_css=None reaction_data=None metabo-lite_data=None gene_data=None local_host=None id=None safe=Falsekwargs)
A metabolic map that can be viewed edited and used to visualize data
This map will also show metabolic fluxes passed in during consruction It can be viewed as a standalone htmlinside a browswer Alternately the respresentation inside an IPython notebook will also display the map
Maps are stored in json files and are stored in a cache directory Maps which are not found will be downloadedfrom a map repository if found
Parameters
bull map_name ndash A string specifying a map to be downloaded from the Escher web server orloaded from the cache
bull map_json ndash A JSON string or a file path to a JSON file or a URL specifying a JSON fileto be downloaded
bull model ndash A Cobra model
bull model_name ndash A string specifying a model to be downloaded from the Escher web serveror loaded from the cache
bull model_json ndash A JSON string or a file path to a JSON file or a URL specifying a JSONfile to be downloaded
bull embedded_css ndash The CSS (as a string) to be embedded with the Escher SVG
bull reaction_data ndash A dictionary with keys that correspond to reaction ids and values thatwill be mapped to reaction arrows and labels
bull metabolite_data ndash A dictionary with keys that correspond to metabolite ids and valuesthat will be mapped to metabolite nodes and labels
bull gene_data ndash A dictionary with keys that correspond to gene ids and values that will bemapped to corresponding reactions
bull local_host ndash A hostname that will be used for any local files This is generally usedfor using the notebook offline and for testing in the IPython Notebook with modified Eschercode An example value for local_host is lsquohttplocalhost7778lsquo
bull id ndash Specify an id to make the javascript data definitions unique A random id is chosen bydefault
bull safe ndash If True then loading files from the filesytem is not allowed This is to ensure thesafety of using Builder within a web server
Keyword Arguments
These are defined in the Javascript API
bulluse_3d_transform
bullenable_search
bullfill_screen
bullzoom_to_element
bullfull_screen_button
44 Chapter 7 Contents
Escher Documentation Release 143
bullstarting_reaction
bullunique_map_id
bullprimary_metabolite_radius
bullsecondary_metabolite_radius
bullmarker_radius
bullgene_font_size
bullhide_secondary_metabolites
bullshow_gene_reaction_rules
bullhide_all_labels
bullreaction_styles
bullreaction_compare_style
bullreaction_scale
bullreaction_no_data_color
bullreaction_no_data_size
bulland_method_in_gene_reaction_rule
bullmetabolite_styles
bullmetabolite_compare_style
bullmetabolite_scale
bullmetabolite_no_data_color
bullmetabolite_no_data_size
bullidentifiers_on_map
bullhighlight_missing
bullallow_building_duplicate_reactions
bullcofactors
All keyword arguments can also be set on an existing Builder object using setter functions eg
my_builderset_reaction_styles(new_styles)
display_in_browser(ip=lsquo127001rsquo port=7655 n_retries=50 js_source=rsquowebrsquo menu=rsquoallrsquoscroll_behavior=rsquopanrsquo enable_editing=True enable_keys=True mini-fied_js=True never_ask_before_quit=False)
Launch a web browser to view the map
Parameters
bull ip ndash The IP address to serve the map on
bull port ndash The port to serve the map on If specified the port is occupied then a random freeport will be used
bull n_retries (int) ndash The number of times the server will try to find a port before quitting
bull js_source (string) ndash Can be one of the following
ndash web (Default) - Use JavaScript files from eschergithubio
79 Python API 45
Escher Documentation Release 143
ndash local - Use compiled JavaScript files in the local Escher installation Works offline
ndash dev - No longer necessary with source maps This now gives the same behavior aslsquolocalrsquo
bull menu (string) ndash Menu bar options include
ndash none - No menu or buttons
ndash zoom - Just zoom buttons
ndash all (Default) - Menu and button bar (requires Bootstrap)
bull scroll_behavior (string) ndash Scroll behavior options
ndash pan - Pan the map
ndash zoom - Zoom the map
ndash none (Default) - No scroll events
bull enable_editing (Boolean) ndash Enable the map editing modes
bull enable_keys (Boolean) ndash Enable keyboard shortcuts
bull minified_js (Boolean) ndash If True use the minified version of JavaScript and CSSfiles
bull never_ask_before_quit (Boolean) ndash Never display an alert asking if you wantto leave the page By default this message is displayed if enable_editing is True
display_in_notebook(js_source=rsquowebrsquo menu=rsquozoomrsquo scroll_behavior=rsquononersquo mini-fied_js=True height=500 enable_editing=False)
Embed the Map within the current IPython Notebook
Parameters
bull js_source (string) ndash Can be one of the following
ndash web (Default) - Use JavaScript files from eschergithubio
ndash local - Use compiled JavaScript files in the local Escher installation Works offline
ndash dev - No longer necessary with source maps This now gives the same behav-ior as lsquolocalrsquo
bull menu (string) ndash Menu bar options include
ndash none - No menu or buttons
ndash zoom - Just zoom buttons
ndash Note The all menu option does not work in an IPython notebook
bull scroll_behavior (string) ndash Scroll behavior options
ndash pan - Pan the map
ndash zoom - Zoom the map
ndash none - (Default) No scroll events
bull minified_js (Boolean) ndash If True use the minified version of JavaScript andCSS files
bull height ndash Height of the HTML container
bull enable_editing (Boolean) ndash Enable the map editing modes
46 Chapter 7 Contents
Escher Documentation Release 143
save_html(filepath=None overwrite=False js_source=rsquowebrsquo protocol=rsquohttpsrsquo menu=rsquoallrsquoscroll_behavior=rsquopanrsquo enable_editing=True enable_keys=True minified_js=Truenever_ask_before_quit=False static_site_index_json=None)
Save an HTML file containing the map
Parameters
bull filepath (string) ndash The HTML file will be saved to this location Whenjs_source is lsquolocalrsquo then a new directory will be created with this name
bull overwrite (Boolean) ndash Overwrite existing files
bull js_source (string) ndash Can be one of the following
ndash web (Default) - Use JavaScript files from eschergithubio
ndash local - Use compiled JavaScript files in the local Escher installation Works of-fline To make the dependencies available to the downloaded file a new directorywill be made with the name specified by filepath
ndash dev - No longer necessary with source maps This now gives the same behav-ior as lsquolocalrsquo
bull protocol (string) ndash The protocol can be lsquohttprsquo lsquohttpsrsquo or None which indicatesa lsquoprotocol relative URLrsquo as in eschergithubio Ignored if source is local
bull menu (string) ndash Menu bar options include
ndash none - No menu or buttons
ndash zoom - Just zoom buttons
ndash all (Default) - Menu and button bar (requires Bootstrap)
bull scroll_behavior (string) ndash Scroll behavior options
ndash pan - Pan the map
ndash zoom - Zoom the map
ndash none (Default) - No scroll events
bull enable_editing (Boolean) ndash Enable the map editing modes
bull enable_keys (Boolean) ndash Enable keyboard shortcuts
bull minified_js (Boolean) ndash If True use the minified version of JavaScript andCSS files
bull height (number) ndash Height of the HTML container
bull never_ask_before_quit (Boolean) ndash Never display an alert asking if youwant to leave the page By default this message is displayed if enable_editing isTrue
bull static_site_index_json (string) ndash The index as a JSON string for thestatic site Use javascript to parse the URL options Used for generating static pages(see static_sitepy)
791 Cache
escherget_cache_dir(versioned=True name=None)Get the cache dir as a string and make the directory if it does not already exist
Parameters
79 Python API 47
Escher Documentation Release 143
bull versioned (Boolean) ndash Whether to return the versioned path in the cache Eschermaps for the latest version of Escher are found in the versioned directory (versioned= True) but maps for previous versions of Escher can be found by visiting the parentdirectory (versioned = False)
bull name (string) ndash An optional subdirectory within the cache If versioned is False thenname is ignored
escherclear_cache(different_cache_dir=None ask=True)Empty the contents of the cache directory including all versions of all maps and models
Parameters
bull different_cache_dir (string) ndash (Optional) The directory of another cacheThis is mainly for testing
bull ask (Boolean) ndash Whether to ask before deleting
escherlist_cached_maps()Return a list of all cached maps
escherlist_cached_models()Return a list of all cached models
escherlist_available_maps()Return a list of all maps available on the server
escherlist_available_models()Return a list of all models available on the server
710 License
Escher and EscherConverter are distributed under the MIT license
bull genindex
48 Chapter 7 Contents
Python Module Index
eescher 44
49
Escher Documentation Release 143
50 Python Module Index
Index
Bbrush_mode() (built-in function) 43build_mode() (built-in function) 43Builder (class in escher) 44
Cclear_cache() (in module escher) 48
Ddisplay_in_browser() (escherBuilder method) 45display_in_notebook() (escherBuilder method) 46
Eescher (module) 44escherBuilder() (class) 39
Gget_cache_dir() (in module escher) 47
Llist_available_maps() (in module escher) 48list_available_models() (in module escher) 48list_cached_maps() (in module escher) 48list_cached_models() (in module escher) 48load_map() (built-in function) 42load_model() (built-in function) 43
Ooptionenable_keys (option attribute) 40optionsallow_building_duplicate_reactions (options at-
tribute) 42optionsand_method_in_gene_reaction_rule (options at-
tribute) 41optionscofactors (options attribute) 42optionsenable_editing (options attribute) 39optionsenable_search (options attribute) 40optionsfill_screen (options attribute) 40optionsfirst_load_callback (options attribute) 42optionsfull_screen_button (options attribute) 40optionsgene_data (options attribute) 41
optionsgene_font_size (options attribute) 40optionshide_all_labels (options attribute) 40optionshide_secondary_metabolites (options attribute)
40optionshighlight_missing (options attribute) 42optionsidentifiers_on_map (options attribute) 42optionsignore_bootstrap (options attribute) 40optionsmarker_radius (options attribute) 40optionsmenu (options attribute) 39optionsmetabolite_compare_style (options attribute) 42optionsmetabolite_data (options attribute) 42optionsmetabolite_no_data_color (options attribute) 42optionsmetabolite_no_data_size (options attribute) 42optionsmetabolite_scale (options attribute) 42optionsmetabolite_styles (options attribute) 42optionsnever_ask_before_quit (options attribute) 40optionsprimary_metabolite_radius (options attribute) 40optionsreaction_compare_style (options attribute) 41optionsreaction_data (options attribute) 40optionsreaction_no_data_color (options attribute) 41optionsreaction_no_data_size (options attribute) 41optionsreaction_scale (options attribute) 41optionsreaction_styles (options attribute) 41optionsscroll_behavior (options attribute) 39optionssecondary_metabolite_radius (options attribute)
40optionsshow_gene_reaction_rules (options attribute) 40optionsstarting_reaction (options attribute) 40optionsunique_map_id (options attribute) 40optionsuse_3d_transform (options attribute) 39
Rrotate_mode() (built-in function) 43
Ssave_html() (escherBuilder method) 46set_gene_data() (built-in function) 43set_metabolite_data() (built-in function) 43set_reaction_data() (built-in function) 43
51
Escher Documentation Release 143
Ttext_mode() (built-in function) 43
Vview_mode() (built-in function) 43
Zzoom_mode() (built-in function) 43
52 Index
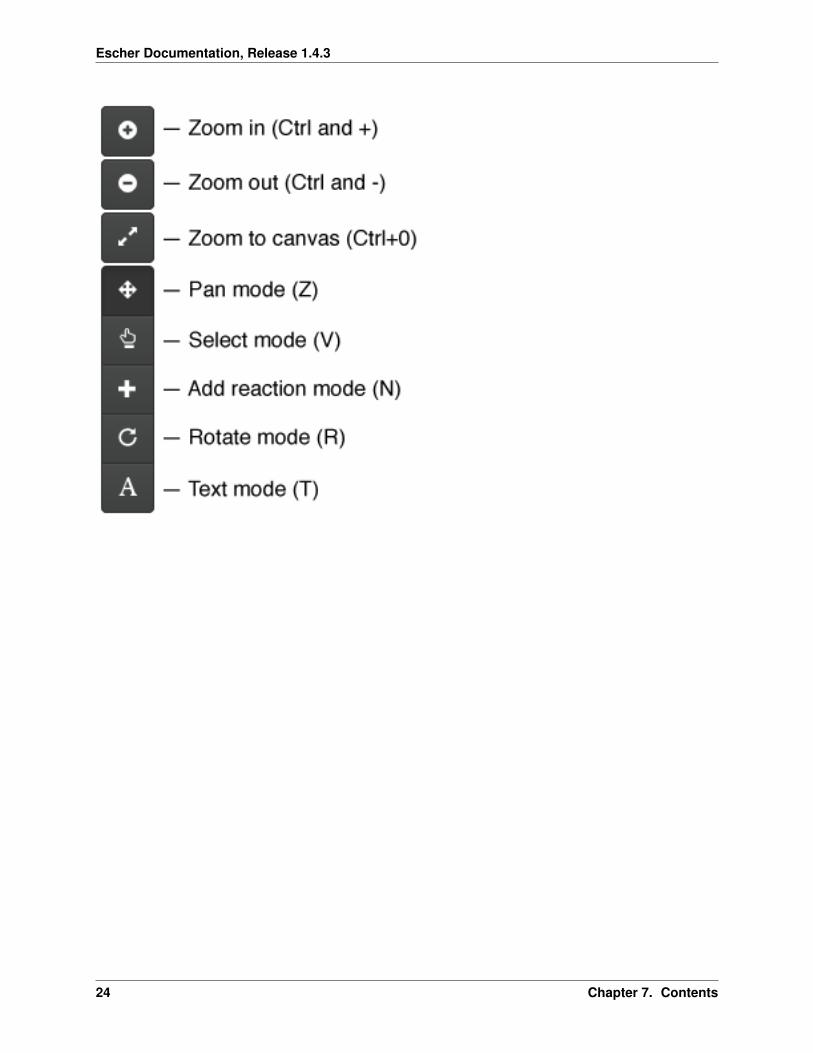
Escher Documentation Release 143
7111 Settings
View and build options
bull Identifiers Choose whether to show BiGG IDs or descriptive names for reactions metabolites and genes
bull Hide secondary metabolites This will simplify the map by hiding all secondary metabolites and the pathsconnected to them
bull Show gene reaction rules Show the gene reaction rules below the reaction labels even gene data is not loaded
bull Hide reaction gene and metabolite labels Another option to visually simplify the map this will hide alllabels that are not text annotations
bull Allow duplicate reactions By default duplicate reactions are hidden in the add reaction dropdown menuHowever you can turn this option on to show the duplicate reactions
bull Highlight reactions not in model Highlight in red any reactions that are on the map but are not in the modelThis is useful when you are adapting a map from one model for use with another model
71 Getting started 25
Escher Documentation Release 143
Reaction data settings
When reaction or gene data is loaded this section can be used to change visual settings for reactions
The color bar has individual control points and you can drag the control points (execpt min and max) left and right tochange their values Alternatively you can use the dropdown menu (next to the word median in the figure above) toattach a control point to a statistical measure (mean median first quartile (Q1) or third quartile (Q3)) This lets youchoose a color scale that will adapt to your dataset
For each control point you can choose a color by entering a CSS-style color (eg red ff0000 rgba(20 20 255 05)and you can choose a size that will scale the thickness of reactions
There are also color and size options for reactions that do not have any data value
Finally there are a few onoff settings for the loaded reaction or gene dataset
bull Options These determine how to visualize the datasets Check Absolute value to color and size reactions bythe absolute value of each data value The Size Color and Text options can be unselected to turn off sizingcoloring and data values in reaction labels individually
bull Comparison Determines the comparison algorithm to use when two datasets are loaded
bull Method for evaluating AND Determines the method that will be used to reconcile AND statements in genereaction rules when there is gene data loaded See Gene data and gene reaction rules for more details
Metabolite data settings
The data settings for metabolite data are analagous to those for reaction data The only difference is that size nowrefers to the size of the metabolite circles
26 Chapter 7 Contents
Escher Documentation Release 143
72 Escher COBRA and COBRApy
Escher can be used as an independent application but it draws heavily on the information in COBRA models ACOBRA model is a collection of all the reactions metabolites and genes known to exist in an organism (In theliterature these are generally called genome-scale models (GEMs) but we refer to them as COBRA models here toemphasize that Escher interoperates with models that are exported from COBRApy)
By loading a COBRA model into the Escher interface you have access to every reaction and metabolite in that modelYou also have the gene reaction rules for the reactions in the network which allow you to connect gene data toreactions and metabolites
COBRApy is a software package for COBRA modeling written in Python The Escher Python package uses CO-BRApy package for reading and writing COBRA models
721 Maps and models
In Escher you will see references to maps and models
A map contains the reactions and metabolites that you see in the Escher builder including their locations text annota-tions and the canvas
A model (a COBRA model) contains reactions and metabolites that you have not drawn yet Thus you can load aCOBRA model when you want to draw new reactions on the map
722 What is JSON and why do we use it
Both Escher maps and COBRA models are stored as JSON files JSON is a useful plain-text format for storing nesteddata structures We use JSON much like the SBML community uses XML You may notice that SBML files have axml extension and Escher maps and COBRA models have a json extension
You can use Python to explore a JSON file like this
import json
with open(mapjson r) as fmap_object = jsonload(f)
print map_object[0]print map_object[1][reactions]values()[0]
723 Escher SBML and SBGN
A tool has been developed for converting Escher maps to SBML Layout and SBGN and it will be released soon
COBRA models can be converted to SBML using COBRApy
73 Run Escher locally and in IPython
To run Escher on a local computer or to use Escher in PythonIPython first install it The Python package for Eschercan be installed using pip
pip install escher
72 Escher COBRA and COBRApy 27
Escher Documentation Release 143
Depending on your installation of Python you may need sudo
sudo pip install escher
Alternatively one can download the source files and install the package directly
python setuppy install
731 Escher in the IPython Notebook
Once you have installed Escher locally you can interact with Escher maps in an IPython Notebook
Here are example notebooks to get started with
bull COBRApy and Escher
bull JavaScript development and offline maps
bull Generate JSON models in COBRApy
Dependencies
bull Jinja2
bull Tornado
bull COBRApy 030 or later
732 Running the local server
You can run your own local server if you want to use Escher offline or explore your own maps with the homepagebrowser To get started install the Python package and run from any directory by calling
python -m escherserver
This starts a server at httplocalhost7778 You can also choose another port
python -m escherserver --port=8005
74 Validate and convert maps
741 Validate an Escher map
Escher maps follow a specification using the JSON Schema format Therefore any JSON Schema validator can beused to validate an Escher map by comparing it to the latest schema file For example the current schema is locatedhere
httpsgithubcomzakandrewkingescherblobmasterescherjsonschema1-0-0
To make this easier the Escher Python package includes a validation script To validate a map first install Escher
pip install escher
Then call the validator
python -m eschervalidate my_mapjson
Any errors in the map will print to the console
28 Chapter 7 Contents
Escher Documentation Release 143
742 Convert or upgrade an Escher map
Any Escher maps built with pre-release versions of Escher will not load right away in the stable v10 release Toconvert pre-release maps to the new format follow these steps
1 Install Escher
pip install escher
2 Find a COBRA model for your maps This COBRA model will be used to update the content of the mapin order to support all the new Escher features You can use a COBRA model encoded as SBML or JSON(generated with COBRApy v030b4 or later) The COBRA models currently available on the Escher websitecan be downloaded from the BiGG Models website
httpbiggucsdedu
For a refresher on the distinction between Escher maps COBRA models and their file types (SBML JSONSBML Layout) see Escher COBRA and COBRApy
3 Run the convert_map script to convert your existing Escher map (my_old_mapjson) to the new formatusing a COBRA model (model_filejson or model_filexml in these examples)
With a JSON file modelpython -m escherconvert_map my_old_mapjson pathtomodel_filejson
With an SBML modelpython -m escherconvert_map my_old_mapjson pathtomodel_filexml
Those commands will generate a new map called my_old_map_convertedjson that will load in Escher v10and later
75 Building and contributing maps
We are excited to collect pathway maps for every organism with a well characterized metabolic network This sectiondescribes the process of building a new map either from scratch or using a COBRA model with BiGG IDs
751 Building from scratch
To build a map from scratch you will first need a COBRA model for your map See the section Escher COBRA andCOBRApy for some background information on COBRA models
If you would like to eventually contribute your map to the Escher website it is important that your COBRA modeladheres to the identifiers in the BiGG Database Escher and BiGG are being developed together and we want tomaintain consistency and interoperability between them
Once you have a COBRA model you can follow these steps
1 Load your model in the Escher Builder
2 Begin building new reactions If you are familiar with the genes in your organism then try search for newreactions by their gene IDs
3 Limit each map to ~200 reactions Maps larger than this will slow down the Escher viewer especially on oldbrowsers Rather than building one giant map Escher is designed for building many smaller subsystem maps
4 When you have built a map for your a subsystem save the map as JSON with a name that includes the modelID followed by a period followed by the name of the subsystem For example
75 Building and contributing maps 29
Escher Documentation Release 143
iMM904Amino acid biosynthesisjson
5 (Optional) Once you have a set of subsystem maps you can set up a local Escher server so that subsystem mapsappear in the ldquoquick jumprdquo menu in the bottom right corner of the screen (as seen here for iJO1366) To setthis up you will need to start a local server as describe in Running the local server Next find your local cachedirectory by running this command in a terminal
python -c import escher print(escherget_cache_dir(name=maps))
This will print the location of the local maps cache Add your new subsystem maps to cache folder Now whenyou run the server (described in Running the local server) you should see that quick jump menu appear
NOTE The cache directory is organized into folders for organisms You can use these folder for filtering byorganism on the local launch page or you can place the maps in the top directory
NOTE 2 A similar approach can be used to access your models from the local launch page Place maps in thefolder indicated by
python -c import escher print(escherget_cache_dir(name=models))
752 Building from an existing map for a similar organism
Follow the instruction above except rather than starting from scratch load an existing Escher map for a differentorganism
Once you have the new model loaded use the Update names and gene reaction rules using model button in theModel menu to convert all descriptive names and gene reaction rules in the model to those in the map Reactions thatdo not match the model will be highlighted in red (This can be turned off again in the settings menu by deselectingHighlight reactions not in model)
Now visit each highlighted reaction and see if you can replace it with an equivalent biochemical pathway from themodel If not then delete the reaction and move on
Finally when there are no highlighted reactions left you can repeat this for other subsystems
753 Submitting maps to the Escher website
If you would like to contribute maps to Escher you can make a Pull Request to the GitHub repository eschergithubioMake sure there is a folder with the name of the organism in 1-0-0maps For example a new yeast map goes inthe folder
1-0-0mapsSaccharomyces cerevisiae
Then name your map by concatenating the model ID and the map name separated by a period For example a yeastmap built with the genome-scale model iMM904 could be named
iMM904Amino acid biosynthesisjson
Then add the JSON file for the model to the Pull Request if that model is not already available As before make afolder for your organism within 1-0-0models The model filename is just the model ID
In this example a correct Pull Request would include the following files
1-0-0mapsSaccharomyces cerevisiaeiMM904Amino acid biosynthesisjson1-0-0modelsSaccharomyces cerevisiaeiMM904json
30 Chapter 7 Contents
Escher Documentation Release 143
76 Developing with Escher
761 Using the static JavaScript and CSS files
You can include the compiled Escher JavaScript and CSS files in any HTML document The only dependencies ared3js and optionally Twitter Bootstrap if you are using the option menu=rsquoallrsquo
The compiled files are available form npmcdn
httpsnpmcdncomescher-visjsdistescherjshttpsnpmcdncomescher-visjsdistescherminjshttpsnpmcdncomescher-viscssdistbuildercsshttpsnpmcdncomescher-viscssdistbuildermincss
Source maps are also hosted there
httpsnpmcdncomescher-visjsdistescherjsmaphttpsnpmcdncomescher-visjsdistescherminjsmaphttpsnpmcdncomescher-viscssdistbuildermincssmap
If you want a particular version of escher add a version tag like this
httpsnpmcdncomescher-vis140-beta3jsdistescherjs
For an example of the boilerplate code that is required to begin developing with Escher have a look at the escher-demorepository For projects built with npm use the escher-test repository as a guide
762 Building and testing Escher
First install dependencies with npm
npm install
Escher uses grunt to manage the build process To run typical build steps just run
npm run compile
To test the JavaScript files run
npm run test
For Python testing run this in the py directory
python setuppy test
Build the static website
python setuppy build_gh
Clear static website files
python setuppy clean
Build and run the docs
cd docsmake htmlcd _buildhtml
76 Developing with Escher 31
Escher Documentation Release 143
python -m SimpleHTTPServer python 2python -m httpserver python 3
763 Generating and reading Escher and COBRA files
The Escher file format
Escher layouts are defined by JSON files that follow a specific schema using json schema The latest schemafor Escher JSON files is here The Escher schemas are versioned with inspiration from SchemaVer Theeschervalidate module can be used to validate models against the schema
The Escher layout schema is designed to be as simple as possible For example the core metabolism map of Es-cherichia coli is layed out like this
[
map_name E coli coreCore metabolismmap_id 2938hoq32a1map_description E coli core metabolic networknLast Modified Fri Dec 05 2014 163944 GMT-0800 (PST)homepage httpseschergithubioschema httpseschergithubioescherjsonschema1-0-0
reactions nodes text_label canvas
x 7857062530517567y 31436893920898433width 5894515691375733height 4860457037353515
]
The map_name includes the model that was used to build this layout followed by a period and then a readable namefor the map The map_id is a unique identifier for this map The map_description describes the map and thelast time it was modified Both the homepage and the schema entries must have exactly these values for the Eschermap to be valid
In the next section the reactions nodes labels and canvas are all defined For reactions nodes and text labels eachelement has a key that is an arbitrary integer As long as there are no repeated IDs (eg no 2 segments with the ID517) then everything should work fine
Read through the schema (here) for more detail on the format
The COBRA file format
COBRA models are also saved as JSON files This format has not been documented with a schema but you canbrowse through the core metabolism model as a guide to generating valid COBRA models
I still need help
If you are interested in developing with Escher and you need more information than what is provided in the documen-tation please contact Zachary King (zaking-AT-ucsd-DOT-edu)
32 Chapter 7 Contents
Escher Documentation Release 143
77 EscherConverter
EscherConverter is a standalone program that reads files created with the graphical network editor Escher and convertsthem to files in community standard formats
Download EscherConverter 05 (137 MB)
771 Using EscherConverter
Escher uses a JSON file format to represent its networks This format has been developed because of its very small filesize and its compatibility to online programs that are written in JavaScript In particular JSON is a JavaScript ObjectNotation or in other words a JSON file directly represents components of JavaScript programs This makes parsingvery simple and allows direct use of those files in web-based programs
However in systems biology specific file formats have been developed with the aim to be easily exchangeable betweensoftware implemented in diverse programming languages
To this end these formats support semantically clear annotations and are maintained by a large community of scientistsEscherConverter supports export to two particularly important XML-based community file formats SBML with layoutextension and SBGN-ML
While SBML has been mainly developed for dynamic simulation of biological networks it is nowadays also usablefor diverse other purposes Its layout extension facilitates the encoding the display of biological networks
SBGN-ML has been directly developed as a language for the display of biological pathway maps of diverse kinds Itstores the position and connection of entities similar to what is shown in Escher networks
EscherConverter takes Escherrsquos JSON files as input and generates equivalent SBML Level 3 Version 1 files with layoutextension or SBGN-ML files
In order to ensure that the conversion is correct EscherConverter provides its own display that gives users a previewof how the export data format will be rendered by other tools In this preview display you can zoom in and out movearcs and node positions However it is important to know that none of the changes made in this preview are stored inthe export file
Download and Installation
You can obtain local copy of EscherConverter by clicking here
As a Javatrade application no specific installation is required for EscherConverter
However make sure you have a recent Javatrade Runtime Environment (JRE) installed on your computer (at least JRE8) You can obtain Javatrade from the Oracle website There you can also find installation instructions for your respectiveoperating system
Once Javatrade has been installed you can simply place the EscherConverter JAR file somewhere on your local computerfor instance in the folder
bull Applications if you are working under Mac OS
77 EscherConverter 33
Escher Documentation Release 143
bull opt for Linux computers
bull CProgram Files if you are using Windows
Launching the program
You can launch EscherConverter simply by double-clicking on the application JAR file This will open a followinggraphical user interface as described in the following figures
Figure 1 | The graphical user interface of EscherConverter
bull Preferences opens a settings dialog (see next screenshot)
bull Open displays a file chooser to select an input file in JSON format
bull Save export the map that is displayed in the current tab to SBML or SBGN-ML
bull Discard closes the current tab without saving
bull Help opens the online help that displays all command-line options
bull License displays the license under which this software is distributed
bull About shows information about the authors of this software
bull Main the main panel of the software in which converted Escher maps will be displayed organized in tabs
bull Status the status bar shows information and logging messages during the conversion
34 Chapter 7 Contents
Escher Documentation Release 143
Figure 2 | The preferences dialog All settings in this dialog are also available through EscherConverterrsquos command-line interface
Layout section several properties that are required in SBML and SBGN-ML are not explicitly specified in EscherrsquosJSON format and therefore need to be adjusted by the user These are the size of the drawing canvas the default boxsize for text labels the size of primary and secondary nodes In contrast to SBGN-ML and Escherrsquos JSON formatthe SBML layout extension supports three-dimensional displays When selecting this export file format it is thereforenecessary to also define the z-coordinate and the depth of all objects
Components and naming section Most settings in this section are specific for the SBML layout extension and areonly active if this output format is selected These are names and identifiers of the layout component and the in caseof SBML mandatory default compartment (a compartment without physical meaning a reaction space in which allmetabolites are located) EscherConverter can infer compartment bounds from metabolites but this is an experimentalfeature Just try it and see how the preview changes
77 EscherConverter 35
Escher Documentation Release 143
Figure 3 | A layout preview
The birds-eye view and the navigation component on the left help you navigate through the network display Thisgraph shows you how the converted pathway map will be rendered by software that supports SBGN-ML or the SBMLlayout extension This preview can be modified by moving arcs or nodes however none of those changes are storedwhen exporting the file In this current version EscherConver only exports layouts as given in the original JSON file
Included third-party software
EscherConverter includes several third-party libraries which we here list and acknowledge
bull ArgParser
bull JSBML
bull libSBGN
bull Pixel-Mixer icons
bull yFiles
772 Command-line interface API
You can launch EscherConverter from the command-line On a Unix system (such as Linux MacOS or Solaris etc)use a command like
bash$ java -jar -Xms8G -Xmx8G -Duserlanguage=en EscherConverter-05jar [options]
Under Window use a command like
Cgt javaw -jar -Xms8G -Xmx8G -Duserlanguage=en EscherConverter-05jar [options]
Escher has a large collection of command-line options (see below) which can be useful if you want to launch theprogram with specific settings or if multiple files are to be converted in a batch mode It is even possible to completelydisable the graphical user interface
36 Chapter 7 Contents
Escher Documentation Release 143
Input and output files
Definition of input and output data files as well as the format for the output
--input=ltFilegt
Specifies the JSON input file If a directory is given the conversion will be recursively performed Accepts JSON
--output=ltFilegt
The path to the file into which the output should be written If the input is a directory this must also be a directory inorder to perform a recursive conversion Accepts SBML SBGN
Escher layout
The options in this group allow you to influence how large certain elements should be displayed
--canvas-default-height=ltDoublegt
Just as in the case of the width of the canvas this value needs to be specified for cases where the JSON input file lacksan explicit specification of the canvas height Arguments must fit into the range [11E9] (Default value 2500)
--canvas-default-width=ltDoublegt
This value is used when no width has been defined for the canvas Since the width attribute is mandatory for the layouta default value must be provided in these cases Arguments must fit into the range [11E9] (Default value 2500)
--label-height=ltDoublegt
With this option you can specify the height of the bounding box of text labels Arguments must fit into the range[11E9] (Default value 500)
--label-width=ltDoublegt
This option defines the width of bounding boxes for text labels Arguments must fit into the range [11E9] (Defaultvalue 1600)
--node-depth=ltDoublegt
The length of nodes along z-coordinate Escher maps are actually two-dimensional but in general a layout can bethree-dimensional This value should be an arbitrary value greater than zero because some rendering engines mightnot display the node if its depth is zero Arguments must fit into the range [11E9] (Default value 10)
--node-label-height=ltDoublegt
Node labels can have a size different from general labels in the graph Here you can specify how height the boundingbox of the labels for nodes should be Arguments must fit into the range [11E9] (Default value 200)
--primary-node-height=ltDoublegt
The primary node should be bigger than the secondary node With this option you can specify the height of this typeof nodes Arguments must fit into the range [11E9] (Default value 300)
--primary-node-width=ltDoublegt
Escher maps distinguish between primary and secondary nodes Primary nodes should be larger than secondary nodesand display the main flow of matter through the network This option allows you to specify the width of primarynodes Arguments must fit into the range [11E9] (Default value 300)
77 EscherConverter 37
Escher Documentation Release 143
--reaction-label-height=ltDoublegt
Reaction label heightArguments must fit into the range [11E9] (Default value 300)
--reaction-node-ratio=ltDoublegt
This value is used as a conversion factor to determine the size of the reaction display box depending on the size ofprimary nodes Height and width of reaction nodes are determined by dividing the corresponding values from theprimary node size by this factor Arguments must fit into the range [01] (Default value 05)
--secondary-node-ratio=ltDoublegt
Similar to the reaction node ratio the size of secondary nodes (width and height) is determined by dividing thecorresponding values from the primary nodes by this value Arguments must fit into the range [01] (Default value06666666666666666)
--z=ltDoublegt
The position on the z-axis where the entire two-dimensional graph should be drawn Arguments must fit into the range[-1E91E9] (Default value 00)
Escher Components and their naming
Here you can influence which elements are to be included in the layout and how elements in the layout are to be calledor identified
--format=ltOutputFormatgt
The desired format for the conversion eg SBML All possible values for type ltOutputFormatgt are SBGN andSBML (Default value SBML)
--layout-id=ltStringgt
In contrast to the name this identifier does not have to be human-readable This is a machine identifier which muststart with a letter or underscore and can only contain ASCII characters (Default value Escher_Layout)
--layout-name=ltStringgt
This should be a human-readable name for the layout that is to be created This name might be displayed to describethe figure and should therefore be explanatory (Default value Escher Layout)
--compartment-id=ltStringgt
A compartment needs to have a unique identifier which needs to be a machine-readable Sting that must start with aletter or underscore and can only contain ASCII characters Since the JSON file does not provide this information thisoption allows you to specify the required identifier (Default value default)
--compartment-name=ltStringgt
With this option it is possible to define a name for the default compartment can be that needs to be generated for theconversion to SBML The name does not have any restrictions ie any UTF-8 character can be used (Default valueDefault compartment)
--infer-compartment-bounds
This converter can infer where the boundaries of compartments could be drawn To this end it uses each nodersquos BiGGids to identify the compartment of all metabolites Assuming that compartments have rectangular shapes the algorithmcan find the outermost node on each side of the box and hence obtain the boundaries of the compartment However
38 Chapter 7 Contents
Escher Documentation Release 143
this methods will fail when metabolites are drawn inside of such a box that belong to a different compartment that isactually further outside For this reason this option is deactivated by default (Default value false)
Options for the graphical user interface
--gui
If this option is given the program will display its graphical user interface (Default value false)
--log-level=ltStringgt
Change the log-level of this application This option will influence how fine-grained error and other log messages willbe that you receive while executing this program All possible values for type ltStringgt are ALL CONFIG FINEFINER FINEST INFO OFF SEVERE and WARNING (Default value INFO)
--log-file=ltFilegt
This option allows you to specify a log file to which all information of the program will be written Accepts (bp2bp3 log owl xml)
78 JavaScript API
class escherBuilder(map_data model_data embedded_css selection options)A Builder object contains all the UI and logic to generate a map builder or viewer
Arguments
bull map_data (object) ndash The data for a map to be passed to escherMapfrom_data() Ifnull then an empty Builder is initialized
bull model_data (object) ndash The data for a cobra model to be passed to es-cherCobraModel() Can be null
bull embedded_css (string) ndash The stylesheet for the SVG elements in the Escher map
bull selection (object) ndash (Optional Default In the body element) The d3 selection of anelement to place the Builder into The selection cannot be inside an SVG element
bull options (object) ndash (Optional) An object defining any of the following options
optionsmenu(Default rsquoallrsquo) The type of menu that will be displayed Can be lsquoallrsquo for the fullmenu or lsquozoomrsquo for just zoom buttons The lsquoallrsquo option requires the full set of Escherdependencies (D3js JQuery and Bootstrap) while the lsquozoomrsquo option requires only D3jsFor more details see Developing with Escher
optionsscroll_behavior(Default rsquopanrsquo) This option determines the effect that the scroll wheel will have onan Escher map Can be lsquopanrsquo to pan the map or lsquozoomrsquo to zoom the map when the usermoves the scroll wheel
optionsuse_3d_transform(Default Chooses a good option by testing the browser) If true then use CSS3 3D trans-forms to speed up panning and zooming This feature will only work on browsers thatsupport the 3D transforms It works best in the latest versions of Chrome Firefox andInternet Explorer Safari works better with this turned off
78 JavaScript API 39
Escher Documentation Release 143
optionsenable_editing(Default true) If true then display the map editing functions If false then hide themand only allow the user to view the map
optionenable_keys(Default true) If true then enable keyboard shortcuts
optionsenable_search(Default true) If true then enable indexing of the map for search Use false to disablesearching and potentially improve the map performance
optionsfill_screen(Default false) Use true to fill the screen when an Escher Builder is placed in a top-level container (eg a div in the body element)
optionsfull_screen_button(Default false) Include a button in the user interface for entering full screen mode
optionsignore_bootstrap(Default false) Do not use Bootstrap for buttons even if it available This is used toembed Escher in a Jupyter notebook where it conflicts with the Jupyter Boostrap installa-tion
Map model and styles
optionsstarting_reaction(Default null) The ID (as a string) of a reaction to draw when the Builder loads
optionsnever_ask_before_quit(Default false) If false then display a warning before the user closes an Eschermap If true then never display the warning This options is only respected if op-tionsenable_editing == true If enable_editing is false then the warnings are not dis-played
optionsunique_map_id(Default null) A unique ID that will be used to UI elements donrsquot interfere whenmultiple maps are in the same HTML document
optionsprimary_metabolite_radius(Default 15) The radius of primary metabolites in px
optionssecondary_metabolite_radius(Default 10) The radius of secondary metabolites in px
optionsmarker_radius(Default 5) The radius of marker nodes in px
optionsgene_font_size(Default 18) The font size of the gene reaction rules in px
optionshide_secondary_metabolites(Default false) If true then secondary nodes and segments are hidden This is conve-nient for generating simplified map figures
optionsshow_gene_reaction_rules(Default false) If true then show the gene reaction rules even without gene data
optionshide_all_labels(Default false) If checked hide all reaction gene and metabolite labels
Applied data
40 Chapter 7 Contents
Escher Documentation Release 143
optionsreaction_data(Default null) An object with reaction ids for keys and reaction data points for values
optionsreaction_stylesDefault [rsquocolorrsquo rsquosizersquo rsquotextrsquo]
An array of style types The array can contain any of the following lsquocolorrsquo lsquosizersquo lsquotextrsquolsquoabsrsquo The lsquocolorrsquo style means that the reactions will be colored according to the loadeddataset The lsquosizersquo style means that the reactions will be sized according to the loadeddataset The lsquotextrsquo style means that the data values will be displayed in the reactionlabels The lsquoabsrsquo style means the the absolute values of reaction values will be used fordata visualization
optionsreaction_compare_style(Default rsquodiffrsquo) How to compare to datasets Can be either lsquofold lsquolog2_foldrsquo orlsquodiffrsquo
optionsreaction_scaleDefault
[ type min color c8c8c8 size 12 type median color 9696ff size 20 type max color ff0000 size 25 ]
An array of objects that define points on the data scale
Each point is an object with a type attribute Types can be lsquominrsquo lsquomaxrsquo lsquomeanrsquo lsquoQ1rsquo (firstquartile) lsquomedianrsquo lsquoQ3rsquo (third quartile) or lsquovaluersquo Each point can have a color attributethat specifies a color with a string (any CSS color specification is allowed including hexrgb and rgba) Each point can have a size attirbute that specifies a reaction thickness as anumber Finally points with type lsquovaluersquo can have a value attribute that specifies an exactnumber for pont in the scale
NOTE If lsquominrsquo or lsquomaxrsquo is not provided Escher automatically adds them To be com-pletely clear about what you expect to see on the map it is best to provide lsquominrsquo andlsquomaxrsquo in addition to other scale points
Here are examples of each type
type rsquominrsquo color rsquoredrsquo size 12 Specifies that reactionsnear the minimum value are red and have thickness 12
type rsquoQ1rsquo color rsquorgba(100 100 50 05)rsquo size 12 Specifies that reactions near the first quartile have the given color opacity andthickness
type rsquomeanrsquo color rsquorgb(100 100 50)rsquo size 50 Specifies that reactions near the mean value have the given color and thickness
type rsquovaluersquo value 85 color rsquo333rsquo size 50 Specifies that reactions near 85 value have the given color and size
optionsreaction_no_data_color(Default rsquodcdcdcrsquo) The color of reactions with no data value
optionsreaction_no_data_size(Default 8) The size of reactions with no data value
optionsgene_data(Default null) An object with Gene ids for keys and gene data points for values
78 JavaScript API 41
Escher Documentation Release 143
optionsand_method_in_gene_reaction_rule(Default mean) When evaluating a gene reaction rule use this function to evaluate ANDrules Can be lsquomeanrsquo or lsquominrsquo
optionsmetabolite_data(Default null) An object with metabolite ids for keys and metabolite data points forvalues
optionsmetabolite_stylesDefault [rsquocolorrsquo rsquosizersquo rsquotextrsquo]
An array of style types The array can contain any of the following lsquocolorrsquo lsquosizersquo lsquotextrsquolsquoabsrsquo The lsquocolorrsquo style means that the metabolites will be colored according to the loadeddataset The lsquosizersquo style means that the metabolites will be sized according to the loadeddataset The lsquotextrsquo style means that the data values will be displayed in the metabolitelabels The lsquoabsrsquo style means the the absolute values of metabolite values will be used fordata visualization
optionsmetabolite_compare_style(Default rsquodiffrsquo) How to compare to datasets Can be either lsquofoldrsquo lsquolog2_foldrsquo orlsquodiffrsquo
optionsmetabolite_scaleDefault
[ type min color fffaf0 size 20 type median color f1c470 size 30 type max color 800000 size 40 ]
An array of objects that define points on the data scale See the description of op-tionsreaction_scale for an explanation of the format
optionsmetabolite_no_data_color(Default rsquoffffffrsquo) The color of metabolites with no data value
optionsmetabolite_no_data_size(Default 10) The size of metabolites with no data value
View and build options
optionsidentifiers_on_map(Default rsquobigg_idrsquo) The identifiers that will be displayed in reaction metabolite andgene labels Can be lsquobigg_idrsquo or lsquonamersquo
optionshighlight_missing(Default false) If true then highlight in red reactions that are not in the loaded COBRAmodel
optionsallow_building_duplicate_reactions(Default true) If true then building duplicate reactions is allowed If false then dupli-cate reactions are hidden in Add reaction mode
optionscofactors(Default [rsquoatprsquo rsquoadprsquo rsquonadrsquo rsquonadhrsquo rsquonadprsquo rsquonadphrsquorsquogtprsquo rsquogdprsquo rsquohrsquo rsquocoarsquo rsquoumprsquo rsquoh20rsquo rsquoppirsquo]) A list of metabo-lite IDs to treat as cofactors These will be secondary metabolites in new reactions
Callbacks
optionsfirst_load_callbackA function to run after loading the Builder
42 Chapter 7 Contents
Escher Documentation Release 143
load_map(map_data[ should_update_data])Load a map for the loaded data Also reloads most of the Builder content
Arguments
bull map_data ndash The data for a map
bull should_update_data (Boolean) ndash (Default true) Whether data should be ap-plied to the map
load_model(model_data[ should_update_data])Load the cobra model from model data
Arguments
bull model_data ndash The data for a Cobra model (Parsing in done by escherCobraModel)
bull should_update_data (Boolean) ndash (Default true) Whether data should be ap-plied to the model
view_mode()Enter view mode
build_mode()Enter build mode
brush_mode()Enter brush mode
zoom_mode()Enter zoom mode
rotate_mode()Enter rotate mode
text_mode()Enter text mode
set_reaction_data(data)
Arguments
bull data (array) ndash An array of 1 or 2 objects where each object has keys that are reactionIDrsquos and values that are data points (numbers)
set_metabolite_data(data)
Arguments
bull data (array) ndash An array of 1 or 2 objects where each object has keys that are metaboliteIDrsquos and values that are data points (numbers)
set_gene_data(data clear_gene_reaction_rules)
Arguments
bull data (array) ndash An array of 1 or 2 objects where each object has keys that are gene IDrsquosand values that are data points (numbers)
Arguments
bull clear_gene_reaction_rules (Boolean) ndash (Optional Default false) In addi-tion to setting the data also turn of the gene_reaction_rules
78 JavaScript API 43
Escher Documentation Release 143
79 Python API
class escherBuilder(map_name=None map_json=None model=None model_name=Nonemodel_json=None embedded_css=None reaction_data=None metabo-lite_data=None gene_data=None local_host=None id=None safe=Falsekwargs)
A metabolic map that can be viewed edited and used to visualize data
This map will also show metabolic fluxes passed in during consruction It can be viewed as a standalone htmlinside a browswer Alternately the respresentation inside an IPython notebook will also display the map
Maps are stored in json files and are stored in a cache directory Maps which are not found will be downloadedfrom a map repository if found
Parameters
bull map_name ndash A string specifying a map to be downloaded from the Escher web server orloaded from the cache
bull map_json ndash A JSON string or a file path to a JSON file or a URL specifying a JSON fileto be downloaded
bull model ndash A Cobra model
bull model_name ndash A string specifying a model to be downloaded from the Escher web serveror loaded from the cache
bull model_json ndash A JSON string or a file path to a JSON file or a URL specifying a JSONfile to be downloaded
bull embedded_css ndash The CSS (as a string) to be embedded with the Escher SVG
bull reaction_data ndash A dictionary with keys that correspond to reaction ids and values thatwill be mapped to reaction arrows and labels
bull metabolite_data ndash A dictionary with keys that correspond to metabolite ids and valuesthat will be mapped to metabolite nodes and labels
bull gene_data ndash A dictionary with keys that correspond to gene ids and values that will bemapped to corresponding reactions
bull local_host ndash A hostname that will be used for any local files This is generally usedfor using the notebook offline and for testing in the IPython Notebook with modified Eschercode An example value for local_host is lsquohttplocalhost7778lsquo
bull id ndash Specify an id to make the javascript data definitions unique A random id is chosen bydefault
bull safe ndash If True then loading files from the filesytem is not allowed This is to ensure thesafety of using Builder within a web server
Keyword Arguments
These are defined in the Javascript API
bulluse_3d_transform
bullenable_search
bullfill_screen
bullzoom_to_element
bullfull_screen_button
44 Chapter 7 Contents
Escher Documentation Release 143
bullstarting_reaction
bullunique_map_id
bullprimary_metabolite_radius
bullsecondary_metabolite_radius
bullmarker_radius
bullgene_font_size
bullhide_secondary_metabolites
bullshow_gene_reaction_rules
bullhide_all_labels
bullreaction_styles
bullreaction_compare_style
bullreaction_scale
bullreaction_no_data_color
bullreaction_no_data_size
bulland_method_in_gene_reaction_rule
bullmetabolite_styles
bullmetabolite_compare_style
bullmetabolite_scale
bullmetabolite_no_data_color
bullmetabolite_no_data_size
bullidentifiers_on_map
bullhighlight_missing
bullallow_building_duplicate_reactions
bullcofactors
All keyword arguments can also be set on an existing Builder object using setter functions eg
my_builderset_reaction_styles(new_styles)
display_in_browser(ip=lsquo127001rsquo port=7655 n_retries=50 js_source=rsquowebrsquo menu=rsquoallrsquoscroll_behavior=rsquopanrsquo enable_editing=True enable_keys=True mini-fied_js=True never_ask_before_quit=False)
Launch a web browser to view the map
Parameters
bull ip ndash The IP address to serve the map on
bull port ndash The port to serve the map on If specified the port is occupied then a random freeport will be used
bull n_retries (int) ndash The number of times the server will try to find a port before quitting
bull js_source (string) ndash Can be one of the following
ndash web (Default) - Use JavaScript files from eschergithubio
79 Python API 45
Escher Documentation Release 143
ndash local - Use compiled JavaScript files in the local Escher installation Works offline
ndash dev - No longer necessary with source maps This now gives the same behavior aslsquolocalrsquo
bull menu (string) ndash Menu bar options include
ndash none - No menu or buttons
ndash zoom - Just zoom buttons
ndash all (Default) - Menu and button bar (requires Bootstrap)
bull scroll_behavior (string) ndash Scroll behavior options
ndash pan - Pan the map
ndash zoom - Zoom the map
ndash none (Default) - No scroll events
bull enable_editing (Boolean) ndash Enable the map editing modes
bull enable_keys (Boolean) ndash Enable keyboard shortcuts
bull minified_js (Boolean) ndash If True use the minified version of JavaScript and CSSfiles
bull never_ask_before_quit (Boolean) ndash Never display an alert asking if you wantto leave the page By default this message is displayed if enable_editing is True
display_in_notebook(js_source=rsquowebrsquo menu=rsquozoomrsquo scroll_behavior=rsquononersquo mini-fied_js=True height=500 enable_editing=False)
Embed the Map within the current IPython Notebook
Parameters
bull js_source (string) ndash Can be one of the following
ndash web (Default) - Use JavaScript files from eschergithubio
ndash local - Use compiled JavaScript files in the local Escher installation Works offline
ndash dev - No longer necessary with source maps This now gives the same behav-ior as lsquolocalrsquo
bull menu (string) ndash Menu bar options include
ndash none - No menu or buttons
ndash zoom - Just zoom buttons
ndash Note The all menu option does not work in an IPython notebook
bull scroll_behavior (string) ndash Scroll behavior options
ndash pan - Pan the map
ndash zoom - Zoom the map
ndash none - (Default) No scroll events
bull minified_js (Boolean) ndash If True use the minified version of JavaScript andCSS files
bull height ndash Height of the HTML container
bull enable_editing (Boolean) ndash Enable the map editing modes
46 Chapter 7 Contents
Escher Documentation Release 143
save_html(filepath=None overwrite=False js_source=rsquowebrsquo protocol=rsquohttpsrsquo menu=rsquoallrsquoscroll_behavior=rsquopanrsquo enable_editing=True enable_keys=True minified_js=Truenever_ask_before_quit=False static_site_index_json=None)
Save an HTML file containing the map
Parameters
bull filepath (string) ndash The HTML file will be saved to this location Whenjs_source is lsquolocalrsquo then a new directory will be created with this name
bull overwrite (Boolean) ndash Overwrite existing files
bull js_source (string) ndash Can be one of the following
ndash web (Default) - Use JavaScript files from eschergithubio
ndash local - Use compiled JavaScript files in the local Escher installation Works of-fline To make the dependencies available to the downloaded file a new directorywill be made with the name specified by filepath
ndash dev - No longer necessary with source maps This now gives the same behav-ior as lsquolocalrsquo
bull protocol (string) ndash The protocol can be lsquohttprsquo lsquohttpsrsquo or None which indicatesa lsquoprotocol relative URLrsquo as in eschergithubio Ignored if source is local
bull menu (string) ndash Menu bar options include
ndash none - No menu or buttons
ndash zoom - Just zoom buttons
ndash all (Default) - Menu and button bar (requires Bootstrap)
bull scroll_behavior (string) ndash Scroll behavior options
ndash pan - Pan the map
ndash zoom - Zoom the map
ndash none (Default) - No scroll events
bull enable_editing (Boolean) ndash Enable the map editing modes
bull enable_keys (Boolean) ndash Enable keyboard shortcuts
bull minified_js (Boolean) ndash If True use the minified version of JavaScript andCSS files
bull height (number) ndash Height of the HTML container
bull never_ask_before_quit (Boolean) ndash Never display an alert asking if youwant to leave the page By default this message is displayed if enable_editing isTrue
bull static_site_index_json (string) ndash The index as a JSON string for thestatic site Use javascript to parse the URL options Used for generating static pages(see static_sitepy)
791 Cache
escherget_cache_dir(versioned=True name=None)Get the cache dir as a string and make the directory if it does not already exist
Parameters
79 Python API 47
Escher Documentation Release 143
bull versioned (Boolean) ndash Whether to return the versioned path in the cache Eschermaps for the latest version of Escher are found in the versioned directory (versioned= True) but maps for previous versions of Escher can be found by visiting the parentdirectory (versioned = False)
bull name (string) ndash An optional subdirectory within the cache If versioned is False thenname is ignored
escherclear_cache(different_cache_dir=None ask=True)Empty the contents of the cache directory including all versions of all maps and models
Parameters
bull different_cache_dir (string) ndash (Optional) The directory of another cacheThis is mainly for testing
bull ask (Boolean) ndash Whether to ask before deleting
escherlist_cached_maps()Return a list of all cached maps
escherlist_cached_models()Return a list of all cached models
escherlist_available_maps()Return a list of all maps available on the server
escherlist_available_models()Return a list of all models available on the server
710 License
Escher and EscherConverter are distributed under the MIT license
bull genindex
48 Chapter 7 Contents
Python Module Index
eescher 44
49
Escher Documentation Release 143
50 Python Module Index
Index
Bbrush_mode() (built-in function) 43build_mode() (built-in function) 43Builder (class in escher) 44
Cclear_cache() (in module escher) 48
Ddisplay_in_browser() (escherBuilder method) 45display_in_notebook() (escherBuilder method) 46
Eescher (module) 44escherBuilder() (class) 39
Gget_cache_dir() (in module escher) 47
Llist_available_maps() (in module escher) 48list_available_models() (in module escher) 48list_cached_maps() (in module escher) 48list_cached_models() (in module escher) 48load_map() (built-in function) 42load_model() (built-in function) 43
Ooptionenable_keys (option attribute) 40optionsallow_building_duplicate_reactions (options at-
tribute) 42optionsand_method_in_gene_reaction_rule (options at-
tribute) 41optionscofactors (options attribute) 42optionsenable_editing (options attribute) 39optionsenable_search (options attribute) 40optionsfill_screen (options attribute) 40optionsfirst_load_callback (options attribute) 42optionsfull_screen_button (options attribute) 40optionsgene_data (options attribute) 41
optionsgene_font_size (options attribute) 40optionshide_all_labels (options attribute) 40optionshide_secondary_metabolites (options attribute)
40optionshighlight_missing (options attribute) 42optionsidentifiers_on_map (options attribute) 42optionsignore_bootstrap (options attribute) 40optionsmarker_radius (options attribute) 40optionsmenu (options attribute) 39optionsmetabolite_compare_style (options attribute) 42optionsmetabolite_data (options attribute) 42optionsmetabolite_no_data_color (options attribute) 42optionsmetabolite_no_data_size (options attribute) 42optionsmetabolite_scale (options attribute) 42optionsmetabolite_styles (options attribute) 42optionsnever_ask_before_quit (options attribute) 40optionsprimary_metabolite_radius (options attribute) 40optionsreaction_compare_style (options attribute) 41optionsreaction_data (options attribute) 40optionsreaction_no_data_color (options attribute) 41optionsreaction_no_data_size (options attribute) 41optionsreaction_scale (options attribute) 41optionsreaction_styles (options attribute) 41optionsscroll_behavior (options attribute) 39optionssecondary_metabolite_radius (options attribute)
40optionsshow_gene_reaction_rules (options attribute) 40optionsstarting_reaction (options attribute) 40optionsunique_map_id (options attribute) 40optionsuse_3d_transform (options attribute) 39
Rrotate_mode() (built-in function) 43
Ssave_html() (escherBuilder method) 46set_gene_data() (built-in function) 43set_metabolite_data() (built-in function) 43set_reaction_data() (built-in function) 43
51
Escher Documentation Release 143
Ttext_mode() (built-in function) 43
Vview_mode() (built-in function) 43
Zzoom_mode() (built-in function) 43
52 Index
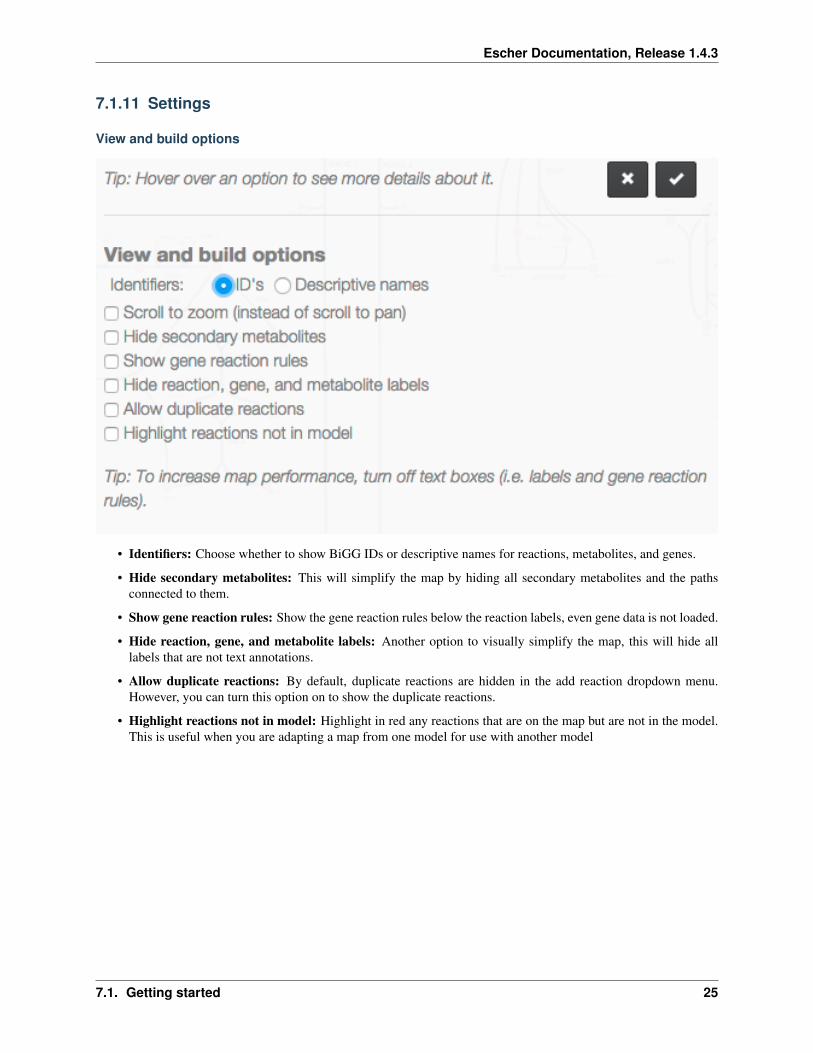
Escher Documentation Release 143
Reaction data settings
When reaction or gene data is loaded this section can be used to change visual settings for reactions
The color bar has individual control points and you can drag the control points (execpt min and max) left and right tochange their values Alternatively you can use the dropdown menu (next to the word median in the figure above) toattach a control point to a statistical measure (mean median first quartile (Q1) or third quartile (Q3)) This lets youchoose a color scale that will adapt to your dataset
For each control point you can choose a color by entering a CSS-style color (eg red ff0000 rgba(20 20 255 05)and you can choose a size that will scale the thickness of reactions
There are also color and size options for reactions that do not have any data value
Finally there are a few onoff settings for the loaded reaction or gene dataset
bull Options These determine how to visualize the datasets Check Absolute value to color and size reactions bythe absolute value of each data value The Size Color and Text options can be unselected to turn off sizingcoloring and data values in reaction labels individually
bull Comparison Determines the comparison algorithm to use when two datasets are loaded
bull Method for evaluating AND Determines the method that will be used to reconcile AND statements in genereaction rules when there is gene data loaded See Gene data and gene reaction rules for more details
Metabolite data settings
The data settings for metabolite data are analagous to those for reaction data The only difference is that size nowrefers to the size of the metabolite circles
26 Chapter 7 Contents
Escher Documentation Release 143
72 Escher COBRA and COBRApy
Escher can be used as an independent application but it draws heavily on the information in COBRA models ACOBRA model is a collection of all the reactions metabolites and genes known to exist in an organism (In theliterature these are generally called genome-scale models (GEMs) but we refer to them as COBRA models here toemphasize that Escher interoperates with models that are exported from COBRApy)
By loading a COBRA model into the Escher interface you have access to every reaction and metabolite in that modelYou also have the gene reaction rules for the reactions in the network which allow you to connect gene data toreactions and metabolites
COBRApy is a software package for COBRA modeling written in Python The Escher Python package uses CO-BRApy package for reading and writing COBRA models
721 Maps and models
In Escher you will see references to maps and models
A map contains the reactions and metabolites that you see in the Escher builder including their locations text annota-tions and the canvas
A model (a COBRA model) contains reactions and metabolites that you have not drawn yet Thus you can load aCOBRA model when you want to draw new reactions on the map
722 What is JSON and why do we use it
Both Escher maps and COBRA models are stored as JSON files JSON is a useful plain-text format for storing nesteddata structures We use JSON much like the SBML community uses XML You may notice that SBML files have axml extension and Escher maps and COBRA models have a json extension
You can use Python to explore a JSON file like this
import json
with open(mapjson r) as fmap_object = jsonload(f)
print map_object[0]print map_object[1][reactions]values()[0]
723 Escher SBML and SBGN
A tool has been developed for converting Escher maps to SBML Layout and SBGN and it will be released soon
COBRA models can be converted to SBML using COBRApy
73 Run Escher locally and in IPython
To run Escher on a local computer or to use Escher in PythonIPython first install it The Python package for Eschercan be installed using pip
pip install escher
72 Escher COBRA and COBRApy 27
Escher Documentation Release 143
Depending on your installation of Python you may need sudo
sudo pip install escher
Alternatively one can download the source files and install the package directly
python setuppy install
731 Escher in the IPython Notebook
Once you have installed Escher locally you can interact with Escher maps in an IPython Notebook
Here are example notebooks to get started with
bull COBRApy and Escher
bull JavaScript development and offline maps
bull Generate JSON models in COBRApy
Dependencies
bull Jinja2
bull Tornado
bull COBRApy 030 or later
732 Running the local server
You can run your own local server if you want to use Escher offline or explore your own maps with the homepagebrowser To get started install the Python package and run from any directory by calling
python -m escherserver
This starts a server at httplocalhost7778 You can also choose another port
python -m escherserver --port=8005
74 Validate and convert maps
741 Validate an Escher map
Escher maps follow a specification using the JSON Schema format Therefore any JSON Schema validator can beused to validate an Escher map by comparing it to the latest schema file For example the current schema is locatedhere
httpsgithubcomzakandrewkingescherblobmasterescherjsonschema1-0-0
To make this easier the Escher Python package includes a validation script To validate a map first install Escher
pip install escher
Then call the validator
python -m eschervalidate my_mapjson
Any errors in the map will print to the console
28 Chapter 7 Contents
Escher Documentation Release 143
742 Convert or upgrade an Escher map
Any Escher maps built with pre-release versions of Escher will not load right away in the stable v10 release Toconvert pre-release maps to the new format follow these steps
1 Install Escher
pip install escher
2 Find a COBRA model for your maps This COBRA model will be used to update the content of the mapin order to support all the new Escher features You can use a COBRA model encoded as SBML or JSON(generated with COBRApy v030b4 or later) The COBRA models currently available on the Escher websitecan be downloaded from the BiGG Models website
httpbiggucsdedu
For a refresher on the distinction between Escher maps COBRA models and their file types (SBML JSONSBML Layout) see Escher COBRA and COBRApy
3 Run the convert_map script to convert your existing Escher map (my_old_mapjson) to the new formatusing a COBRA model (model_filejson or model_filexml in these examples)
With a JSON file modelpython -m escherconvert_map my_old_mapjson pathtomodel_filejson
With an SBML modelpython -m escherconvert_map my_old_mapjson pathtomodel_filexml
Those commands will generate a new map called my_old_map_convertedjson that will load in Escher v10and later
75 Building and contributing maps
We are excited to collect pathway maps for every organism with a well characterized metabolic network This sectiondescribes the process of building a new map either from scratch or using a COBRA model with BiGG IDs
751 Building from scratch
To build a map from scratch you will first need a COBRA model for your map See the section Escher COBRA andCOBRApy for some background information on COBRA models
If you would like to eventually contribute your map to the Escher website it is important that your COBRA modeladheres to the identifiers in the BiGG Database Escher and BiGG are being developed together and we want tomaintain consistency and interoperability between them
Once you have a COBRA model you can follow these steps
1 Load your model in the Escher Builder
2 Begin building new reactions If you are familiar with the genes in your organism then try search for newreactions by their gene IDs
3 Limit each map to ~200 reactions Maps larger than this will slow down the Escher viewer especially on oldbrowsers Rather than building one giant map Escher is designed for building many smaller subsystem maps
4 When you have built a map for your a subsystem save the map as JSON with a name that includes the modelID followed by a period followed by the name of the subsystem For example
75 Building and contributing maps 29
Escher Documentation Release 143
iMM904Amino acid biosynthesisjson
5 (Optional) Once you have a set of subsystem maps you can set up a local Escher server so that subsystem mapsappear in the ldquoquick jumprdquo menu in the bottom right corner of the screen (as seen here for iJO1366) To setthis up you will need to start a local server as describe in Running the local server Next find your local cachedirectory by running this command in a terminal
python -c import escher print(escherget_cache_dir(name=maps))
This will print the location of the local maps cache Add your new subsystem maps to cache folder Now whenyou run the server (described in Running the local server) you should see that quick jump menu appear
NOTE The cache directory is organized into folders for organisms You can use these folder for filtering byorganism on the local launch page or you can place the maps in the top directory
NOTE 2 A similar approach can be used to access your models from the local launch page Place maps in thefolder indicated by
python -c import escher print(escherget_cache_dir(name=models))
752 Building from an existing map for a similar organism
Follow the instruction above except rather than starting from scratch load an existing Escher map for a differentorganism
Once you have the new model loaded use the Update names and gene reaction rules using model button in theModel menu to convert all descriptive names and gene reaction rules in the model to those in the map Reactions thatdo not match the model will be highlighted in red (This can be turned off again in the settings menu by deselectingHighlight reactions not in model)
Now visit each highlighted reaction and see if you can replace it with an equivalent biochemical pathway from themodel If not then delete the reaction and move on
Finally when there are no highlighted reactions left you can repeat this for other subsystems
753 Submitting maps to the Escher website
If you would like to contribute maps to Escher you can make a Pull Request to the GitHub repository eschergithubioMake sure there is a folder with the name of the organism in 1-0-0maps For example a new yeast map goes inthe folder
1-0-0mapsSaccharomyces cerevisiae
Then name your map by concatenating the model ID and the map name separated by a period For example a yeastmap built with the genome-scale model iMM904 could be named
iMM904Amino acid biosynthesisjson
Then add the JSON file for the model to the Pull Request if that model is not already available As before make afolder for your organism within 1-0-0models The model filename is just the model ID
In this example a correct Pull Request would include the following files
1-0-0mapsSaccharomyces cerevisiaeiMM904Amino acid biosynthesisjson1-0-0modelsSaccharomyces cerevisiaeiMM904json
30 Chapter 7 Contents
Escher Documentation Release 143
76 Developing with Escher
761 Using the static JavaScript and CSS files
You can include the compiled Escher JavaScript and CSS files in any HTML document The only dependencies ared3js and optionally Twitter Bootstrap if you are using the option menu=rsquoallrsquo
The compiled files are available form npmcdn
httpsnpmcdncomescher-visjsdistescherjshttpsnpmcdncomescher-visjsdistescherminjshttpsnpmcdncomescher-viscssdistbuildercsshttpsnpmcdncomescher-viscssdistbuildermincss
Source maps are also hosted there
httpsnpmcdncomescher-visjsdistescherjsmaphttpsnpmcdncomescher-visjsdistescherminjsmaphttpsnpmcdncomescher-viscssdistbuildermincssmap
If you want a particular version of escher add a version tag like this
httpsnpmcdncomescher-vis140-beta3jsdistescherjs
For an example of the boilerplate code that is required to begin developing with Escher have a look at the escher-demorepository For projects built with npm use the escher-test repository as a guide
762 Building and testing Escher
First install dependencies with npm
npm install
Escher uses grunt to manage the build process To run typical build steps just run
npm run compile
To test the JavaScript files run
npm run test
For Python testing run this in the py directory
python setuppy test
Build the static website
python setuppy build_gh
Clear static website files
python setuppy clean
Build and run the docs
cd docsmake htmlcd _buildhtml
76 Developing with Escher 31
Escher Documentation Release 143
python -m SimpleHTTPServer python 2python -m httpserver python 3
763 Generating and reading Escher and COBRA files
The Escher file format
Escher layouts are defined by JSON files that follow a specific schema using json schema The latest schemafor Escher JSON files is here The Escher schemas are versioned with inspiration from SchemaVer Theeschervalidate module can be used to validate models against the schema
The Escher layout schema is designed to be as simple as possible For example the core metabolism map of Es-cherichia coli is layed out like this
[
map_name E coli coreCore metabolismmap_id 2938hoq32a1map_description E coli core metabolic networknLast Modified Fri Dec 05 2014 163944 GMT-0800 (PST)homepage httpseschergithubioschema httpseschergithubioescherjsonschema1-0-0
reactions nodes text_label canvas
x 7857062530517567y 31436893920898433width 5894515691375733height 4860457037353515
]
The map_name includes the model that was used to build this layout followed by a period and then a readable namefor the map The map_id is a unique identifier for this map The map_description describes the map and thelast time it was modified Both the homepage and the schema entries must have exactly these values for the Eschermap to be valid
In the next section the reactions nodes labels and canvas are all defined For reactions nodes and text labels eachelement has a key that is an arbitrary integer As long as there are no repeated IDs (eg no 2 segments with the ID517) then everything should work fine
Read through the schema (here) for more detail on the format
The COBRA file format
COBRA models are also saved as JSON files This format has not been documented with a schema but you canbrowse through the core metabolism model as a guide to generating valid COBRA models
I still need help
If you are interested in developing with Escher and you need more information than what is provided in the documen-tation please contact Zachary King (zaking-AT-ucsd-DOT-edu)
32 Chapter 7 Contents
Escher Documentation Release 143
77 EscherConverter
EscherConverter is a standalone program that reads files created with the graphical network editor Escher and convertsthem to files in community standard formats
Download EscherConverter 05 (137 MB)
771 Using EscherConverter
Escher uses a JSON file format to represent its networks This format has been developed because of its very small filesize and its compatibility to online programs that are written in JavaScript In particular JSON is a JavaScript ObjectNotation or in other words a JSON file directly represents components of JavaScript programs This makes parsingvery simple and allows direct use of those files in web-based programs
However in systems biology specific file formats have been developed with the aim to be easily exchangeable betweensoftware implemented in diverse programming languages
To this end these formats support semantically clear annotations and are maintained by a large community of scientistsEscherConverter supports export to two particularly important XML-based community file formats SBML with layoutextension and SBGN-ML
While SBML has been mainly developed for dynamic simulation of biological networks it is nowadays also usablefor diverse other purposes Its layout extension facilitates the encoding the display of biological networks
SBGN-ML has been directly developed as a language for the display of biological pathway maps of diverse kinds Itstores the position and connection of entities similar to what is shown in Escher networks
EscherConverter takes Escherrsquos JSON files as input and generates equivalent SBML Level 3 Version 1 files with layoutextension or SBGN-ML files
In order to ensure that the conversion is correct EscherConverter provides its own display that gives users a previewof how the export data format will be rendered by other tools In this preview display you can zoom in and out movearcs and node positions However it is important to know that none of the changes made in this preview are stored inthe export file
Download and Installation
You can obtain local copy of EscherConverter by clicking here
As a Javatrade application no specific installation is required for EscherConverter
However make sure you have a recent Javatrade Runtime Environment (JRE) installed on your computer (at least JRE8) You can obtain Javatrade from the Oracle website There you can also find installation instructions for your respectiveoperating system
Once Javatrade has been installed you can simply place the EscherConverter JAR file somewhere on your local computerfor instance in the folder
bull Applications if you are working under Mac OS
77 EscherConverter 33
Escher Documentation Release 143
bull opt for Linux computers
bull CProgram Files if you are using Windows
Launching the program
You can launch EscherConverter simply by double-clicking on the application JAR file This will open a followinggraphical user interface as described in the following figures
Figure 1 | The graphical user interface of EscherConverter
bull Preferences opens a settings dialog (see next screenshot)
bull Open displays a file chooser to select an input file in JSON format
bull Save export the map that is displayed in the current tab to SBML or SBGN-ML
bull Discard closes the current tab without saving
bull Help opens the online help that displays all command-line options
bull License displays the license under which this software is distributed
bull About shows information about the authors of this software
bull Main the main panel of the software in which converted Escher maps will be displayed organized in tabs
bull Status the status bar shows information and logging messages during the conversion
34 Chapter 7 Contents
Escher Documentation Release 143
Figure 2 | The preferences dialog All settings in this dialog are also available through EscherConverterrsquos command-line interface
Layout section several properties that are required in SBML and SBGN-ML are not explicitly specified in EscherrsquosJSON format and therefore need to be adjusted by the user These are the size of the drawing canvas the default boxsize for text labels the size of primary and secondary nodes In contrast to SBGN-ML and Escherrsquos JSON formatthe SBML layout extension supports three-dimensional displays When selecting this export file format it is thereforenecessary to also define the z-coordinate and the depth of all objects
Components and naming section Most settings in this section are specific for the SBML layout extension and areonly active if this output format is selected These are names and identifiers of the layout component and the in caseof SBML mandatory default compartment (a compartment without physical meaning a reaction space in which allmetabolites are located) EscherConverter can infer compartment bounds from metabolites but this is an experimentalfeature Just try it and see how the preview changes
77 EscherConverter 35
Escher Documentation Release 143
Figure 3 | A layout preview
The birds-eye view and the navigation component on the left help you navigate through the network display Thisgraph shows you how the converted pathway map will be rendered by software that supports SBGN-ML or the SBMLlayout extension This preview can be modified by moving arcs or nodes however none of those changes are storedwhen exporting the file In this current version EscherConver only exports layouts as given in the original JSON file
Included third-party software
EscherConverter includes several third-party libraries which we here list and acknowledge
bull ArgParser
bull JSBML
bull libSBGN
bull Pixel-Mixer icons
bull yFiles
772 Command-line interface API
You can launch EscherConverter from the command-line On a Unix system (such as Linux MacOS or Solaris etc)use a command like
bash$ java -jar -Xms8G -Xmx8G -Duserlanguage=en EscherConverter-05jar [options]
Under Window use a command like
Cgt javaw -jar -Xms8G -Xmx8G -Duserlanguage=en EscherConverter-05jar [options]
Escher has a large collection of command-line options (see below) which can be useful if you want to launch theprogram with specific settings or if multiple files are to be converted in a batch mode It is even possible to completelydisable the graphical user interface
36 Chapter 7 Contents
Escher Documentation Release 143
Input and output files
Definition of input and output data files as well as the format for the output
--input=ltFilegt
Specifies the JSON input file If a directory is given the conversion will be recursively performed Accepts JSON
--output=ltFilegt
The path to the file into which the output should be written If the input is a directory this must also be a directory inorder to perform a recursive conversion Accepts SBML SBGN
Escher layout
The options in this group allow you to influence how large certain elements should be displayed
--canvas-default-height=ltDoublegt
Just as in the case of the width of the canvas this value needs to be specified for cases where the JSON input file lacksan explicit specification of the canvas height Arguments must fit into the range [11E9] (Default value 2500)
--canvas-default-width=ltDoublegt
This value is used when no width has been defined for the canvas Since the width attribute is mandatory for the layouta default value must be provided in these cases Arguments must fit into the range [11E9] (Default value 2500)
--label-height=ltDoublegt
With this option you can specify the height of the bounding box of text labels Arguments must fit into the range[11E9] (Default value 500)
--label-width=ltDoublegt
This option defines the width of bounding boxes for text labels Arguments must fit into the range [11E9] (Defaultvalue 1600)
--node-depth=ltDoublegt
The length of nodes along z-coordinate Escher maps are actually two-dimensional but in general a layout can bethree-dimensional This value should be an arbitrary value greater than zero because some rendering engines mightnot display the node if its depth is zero Arguments must fit into the range [11E9] (Default value 10)
--node-label-height=ltDoublegt
Node labels can have a size different from general labels in the graph Here you can specify how height the boundingbox of the labels for nodes should be Arguments must fit into the range [11E9] (Default value 200)
--primary-node-height=ltDoublegt
The primary node should be bigger than the secondary node With this option you can specify the height of this typeof nodes Arguments must fit into the range [11E9] (Default value 300)
--primary-node-width=ltDoublegt
Escher maps distinguish between primary and secondary nodes Primary nodes should be larger than secondary nodesand display the main flow of matter through the network This option allows you to specify the width of primarynodes Arguments must fit into the range [11E9] (Default value 300)
77 EscherConverter 37
Escher Documentation Release 143
--reaction-label-height=ltDoublegt
Reaction label heightArguments must fit into the range [11E9] (Default value 300)
--reaction-node-ratio=ltDoublegt
This value is used as a conversion factor to determine the size of the reaction display box depending on the size ofprimary nodes Height and width of reaction nodes are determined by dividing the corresponding values from theprimary node size by this factor Arguments must fit into the range [01] (Default value 05)
--secondary-node-ratio=ltDoublegt
Similar to the reaction node ratio the size of secondary nodes (width and height) is determined by dividing thecorresponding values from the primary nodes by this value Arguments must fit into the range [01] (Default value06666666666666666)
--z=ltDoublegt
The position on the z-axis where the entire two-dimensional graph should be drawn Arguments must fit into the range[-1E91E9] (Default value 00)
Escher Components and their naming
Here you can influence which elements are to be included in the layout and how elements in the layout are to be calledor identified
--format=ltOutputFormatgt
The desired format for the conversion eg SBML All possible values for type ltOutputFormatgt are SBGN andSBML (Default value SBML)
--layout-id=ltStringgt
In contrast to the name this identifier does not have to be human-readable This is a machine identifier which muststart with a letter or underscore and can only contain ASCII characters (Default value Escher_Layout)
--layout-name=ltStringgt
This should be a human-readable name for the layout that is to be created This name might be displayed to describethe figure and should therefore be explanatory (Default value Escher Layout)
--compartment-id=ltStringgt
A compartment needs to have a unique identifier which needs to be a machine-readable Sting that must start with aletter or underscore and can only contain ASCII characters Since the JSON file does not provide this information thisoption allows you to specify the required identifier (Default value default)
--compartment-name=ltStringgt
With this option it is possible to define a name for the default compartment can be that needs to be generated for theconversion to SBML The name does not have any restrictions ie any UTF-8 character can be used (Default valueDefault compartment)
--infer-compartment-bounds
This converter can infer where the boundaries of compartments could be drawn To this end it uses each nodersquos BiGGids to identify the compartment of all metabolites Assuming that compartments have rectangular shapes the algorithmcan find the outermost node on each side of the box and hence obtain the boundaries of the compartment However
38 Chapter 7 Contents
Escher Documentation Release 143
this methods will fail when metabolites are drawn inside of such a box that belong to a different compartment that isactually further outside For this reason this option is deactivated by default (Default value false)
Options for the graphical user interface
--gui
If this option is given the program will display its graphical user interface (Default value false)
--log-level=ltStringgt
Change the log-level of this application This option will influence how fine-grained error and other log messages willbe that you receive while executing this program All possible values for type ltStringgt are ALL CONFIG FINEFINER FINEST INFO OFF SEVERE and WARNING (Default value INFO)
--log-file=ltFilegt
This option allows you to specify a log file to which all information of the program will be written Accepts (bp2bp3 log owl xml)
78 JavaScript API
class escherBuilder(map_data model_data embedded_css selection options)A Builder object contains all the UI and logic to generate a map builder or viewer
Arguments
bull map_data (object) ndash The data for a map to be passed to escherMapfrom_data() Ifnull then an empty Builder is initialized
bull model_data (object) ndash The data for a cobra model to be passed to es-cherCobraModel() Can be null
bull embedded_css (string) ndash The stylesheet for the SVG elements in the Escher map
bull selection (object) ndash (Optional Default In the body element) The d3 selection of anelement to place the Builder into The selection cannot be inside an SVG element
bull options (object) ndash (Optional) An object defining any of the following options
optionsmenu(Default rsquoallrsquo) The type of menu that will be displayed Can be lsquoallrsquo for the fullmenu or lsquozoomrsquo for just zoom buttons The lsquoallrsquo option requires the full set of Escherdependencies (D3js JQuery and Bootstrap) while the lsquozoomrsquo option requires only D3jsFor more details see Developing with Escher
optionsscroll_behavior(Default rsquopanrsquo) This option determines the effect that the scroll wheel will have onan Escher map Can be lsquopanrsquo to pan the map or lsquozoomrsquo to zoom the map when the usermoves the scroll wheel
optionsuse_3d_transform(Default Chooses a good option by testing the browser) If true then use CSS3 3D trans-forms to speed up panning and zooming This feature will only work on browsers thatsupport the 3D transforms It works best in the latest versions of Chrome Firefox andInternet Explorer Safari works better with this turned off
78 JavaScript API 39
Escher Documentation Release 143
optionsenable_editing(Default true) If true then display the map editing functions If false then hide themand only allow the user to view the map
optionenable_keys(Default true) If true then enable keyboard shortcuts
optionsenable_search(Default true) If true then enable indexing of the map for search Use false to disablesearching and potentially improve the map performance
optionsfill_screen(Default false) Use true to fill the screen when an Escher Builder is placed in a top-level container (eg a div in the body element)
optionsfull_screen_button(Default false) Include a button in the user interface for entering full screen mode
optionsignore_bootstrap(Default false) Do not use Bootstrap for buttons even if it available This is used toembed Escher in a Jupyter notebook where it conflicts with the Jupyter Boostrap installa-tion
Map model and styles
optionsstarting_reaction(Default null) The ID (as a string) of a reaction to draw when the Builder loads
optionsnever_ask_before_quit(Default false) If false then display a warning before the user closes an Eschermap If true then never display the warning This options is only respected if op-tionsenable_editing == true If enable_editing is false then the warnings are not dis-played
optionsunique_map_id(Default null) A unique ID that will be used to UI elements donrsquot interfere whenmultiple maps are in the same HTML document
optionsprimary_metabolite_radius(Default 15) The radius of primary metabolites in px
optionssecondary_metabolite_radius(Default 10) The radius of secondary metabolites in px
optionsmarker_radius(Default 5) The radius of marker nodes in px
optionsgene_font_size(Default 18) The font size of the gene reaction rules in px
optionshide_secondary_metabolites(Default false) If true then secondary nodes and segments are hidden This is conve-nient for generating simplified map figures
optionsshow_gene_reaction_rules(Default false) If true then show the gene reaction rules even without gene data
optionshide_all_labels(Default false) If checked hide all reaction gene and metabolite labels
Applied data
40 Chapter 7 Contents
Escher Documentation Release 143
optionsreaction_data(Default null) An object with reaction ids for keys and reaction data points for values
optionsreaction_stylesDefault [rsquocolorrsquo rsquosizersquo rsquotextrsquo]
An array of style types The array can contain any of the following lsquocolorrsquo lsquosizersquo lsquotextrsquolsquoabsrsquo The lsquocolorrsquo style means that the reactions will be colored according to the loadeddataset The lsquosizersquo style means that the reactions will be sized according to the loadeddataset The lsquotextrsquo style means that the data values will be displayed in the reactionlabels The lsquoabsrsquo style means the the absolute values of reaction values will be used fordata visualization
optionsreaction_compare_style(Default rsquodiffrsquo) How to compare to datasets Can be either lsquofold lsquolog2_foldrsquo orlsquodiffrsquo
optionsreaction_scaleDefault
[ type min color c8c8c8 size 12 type median color 9696ff size 20 type max color ff0000 size 25 ]
An array of objects that define points on the data scale
Each point is an object with a type attribute Types can be lsquominrsquo lsquomaxrsquo lsquomeanrsquo lsquoQ1rsquo (firstquartile) lsquomedianrsquo lsquoQ3rsquo (third quartile) or lsquovaluersquo Each point can have a color attributethat specifies a color with a string (any CSS color specification is allowed including hexrgb and rgba) Each point can have a size attirbute that specifies a reaction thickness as anumber Finally points with type lsquovaluersquo can have a value attribute that specifies an exactnumber for pont in the scale
NOTE If lsquominrsquo or lsquomaxrsquo is not provided Escher automatically adds them To be com-pletely clear about what you expect to see on the map it is best to provide lsquominrsquo andlsquomaxrsquo in addition to other scale points
Here are examples of each type
type rsquominrsquo color rsquoredrsquo size 12 Specifies that reactionsnear the minimum value are red and have thickness 12
type rsquoQ1rsquo color rsquorgba(100 100 50 05)rsquo size 12 Specifies that reactions near the first quartile have the given color opacity andthickness
type rsquomeanrsquo color rsquorgb(100 100 50)rsquo size 50 Specifies that reactions near the mean value have the given color and thickness
type rsquovaluersquo value 85 color rsquo333rsquo size 50 Specifies that reactions near 85 value have the given color and size
optionsreaction_no_data_color(Default rsquodcdcdcrsquo) The color of reactions with no data value
optionsreaction_no_data_size(Default 8) The size of reactions with no data value
optionsgene_data(Default null) An object with Gene ids for keys and gene data points for values
78 JavaScript API 41
Escher Documentation Release 143
optionsand_method_in_gene_reaction_rule(Default mean) When evaluating a gene reaction rule use this function to evaluate ANDrules Can be lsquomeanrsquo or lsquominrsquo
optionsmetabolite_data(Default null) An object with metabolite ids for keys and metabolite data points forvalues
optionsmetabolite_stylesDefault [rsquocolorrsquo rsquosizersquo rsquotextrsquo]
An array of style types The array can contain any of the following lsquocolorrsquo lsquosizersquo lsquotextrsquolsquoabsrsquo The lsquocolorrsquo style means that the metabolites will be colored according to the loadeddataset The lsquosizersquo style means that the metabolites will be sized according to the loadeddataset The lsquotextrsquo style means that the data values will be displayed in the metabolitelabels The lsquoabsrsquo style means the the absolute values of metabolite values will be used fordata visualization
optionsmetabolite_compare_style(Default rsquodiffrsquo) How to compare to datasets Can be either lsquofoldrsquo lsquolog2_foldrsquo orlsquodiffrsquo
optionsmetabolite_scaleDefault
[ type min color fffaf0 size 20 type median color f1c470 size 30 type max color 800000 size 40 ]
An array of objects that define points on the data scale See the description of op-tionsreaction_scale for an explanation of the format
optionsmetabolite_no_data_color(Default rsquoffffffrsquo) The color of metabolites with no data value
optionsmetabolite_no_data_size(Default 10) The size of metabolites with no data value
View and build options
optionsidentifiers_on_map(Default rsquobigg_idrsquo) The identifiers that will be displayed in reaction metabolite andgene labels Can be lsquobigg_idrsquo or lsquonamersquo
optionshighlight_missing(Default false) If true then highlight in red reactions that are not in the loaded COBRAmodel
optionsallow_building_duplicate_reactions(Default true) If true then building duplicate reactions is allowed If false then dupli-cate reactions are hidden in Add reaction mode
optionscofactors(Default [rsquoatprsquo rsquoadprsquo rsquonadrsquo rsquonadhrsquo rsquonadprsquo rsquonadphrsquorsquogtprsquo rsquogdprsquo rsquohrsquo rsquocoarsquo rsquoumprsquo rsquoh20rsquo rsquoppirsquo]) A list of metabo-lite IDs to treat as cofactors These will be secondary metabolites in new reactions
Callbacks
optionsfirst_load_callbackA function to run after loading the Builder
42 Chapter 7 Contents
Escher Documentation Release 143
load_map(map_data[ should_update_data])Load a map for the loaded data Also reloads most of the Builder content
Arguments
bull map_data ndash The data for a map
bull should_update_data (Boolean) ndash (Default true) Whether data should be ap-plied to the map
load_model(model_data[ should_update_data])Load the cobra model from model data
Arguments
bull model_data ndash The data for a Cobra model (Parsing in done by escherCobraModel)
bull should_update_data (Boolean) ndash (Default true) Whether data should be ap-plied to the model
view_mode()Enter view mode
build_mode()Enter build mode
brush_mode()Enter brush mode
zoom_mode()Enter zoom mode
rotate_mode()Enter rotate mode
text_mode()Enter text mode
set_reaction_data(data)
Arguments
bull data (array) ndash An array of 1 or 2 objects where each object has keys that are reactionIDrsquos and values that are data points (numbers)
set_metabolite_data(data)
Arguments
bull data (array) ndash An array of 1 or 2 objects where each object has keys that are metaboliteIDrsquos and values that are data points (numbers)
set_gene_data(data clear_gene_reaction_rules)
Arguments
bull data (array) ndash An array of 1 or 2 objects where each object has keys that are gene IDrsquosand values that are data points (numbers)
Arguments
bull clear_gene_reaction_rules (Boolean) ndash (Optional Default false) In addi-tion to setting the data also turn of the gene_reaction_rules
78 JavaScript API 43
Escher Documentation Release 143
79 Python API
class escherBuilder(map_name=None map_json=None model=None model_name=Nonemodel_json=None embedded_css=None reaction_data=None metabo-lite_data=None gene_data=None local_host=None id=None safe=Falsekwargs)
A metabolic map that can be viewed edited and used to visualize data
This map will also show metabolic fluxes passed in during consruction It can be viewed as a standalone htmlinside a browswer Alternately the respresentation inside an IPython notebook will also display the map
Maps are stored in json files and are stored in a cache directory Maps which are not found will be downloadedfrom a map repository if found
Parameters
bull map_name ndash A string specifying a map to be downloaded from the Escher web server orloaded from the cache
bull map_json ndash A JSON string or a file path to a JSON file or a URL specifying a JSON fileto be downloaded
bull model ndash A Cobra model
bull model_name ndash A string specifying a model to be downloaded from the Escher web serveror loaded from the cache
bull model_json ndash A JSON string or a file path to a JSON file or a URL specifying a JSONfile to be downloaded
bull embedded_css ndash The CSS (as a string) to be embedded with the Escher SVG
bull reaction_data ndash A dictionary with keys that correspond to reaction ids and values thatwill be mapped to reaction arrows and labels
bull metabolite_data ndash A dictionary with keys that correspond to metabolite ids and valuesthat will be mapped to metabolite nodes and labels
bull gene_data ndash A dictionary with keys that correspond to gene ids and values that will bemapped to corresponding reactions
bull local_host ndash A hostname that will be used for any local files This is generally usedfor using the notebook offline and for testing in the IPython Notebook with modified Eschercode An example value for local_host is lsquohttplocalhost7778lsquo
bull id ndash Specify an id to make the javascript data definitions unique A random id is chosen bydefault
bull safe ndash If True then loading files from the filesytem is not allowed This is to ensure thesafety of using Builder within a web server
Keyword Arguments
These are defined in the Javascript API
bulluse_3d_transform
bullenable_search
bullfill_screen
bullzoom_to_element
bullfull_screen_button
44 Chapter 7 Contents
Escher Documentation Release 143
bullstarting_reaction
bullunique_map_id
bullprimary_metabolite_radius
bullsecondary_metabolite_radius
bullmarker_radius
bullgene_font_size
bullhide_secondary_metabolites
bullshow_gene_reaction_rules
bullhide_all_labels
bullreaction_styles
bullreaction_compare_style
bullreaction_scale
bullreaction_no_data_color
bullreaction_no_data_size
bulland_method_in_gene_reaction_rule
bullmetabolite_styles
bullmetabolite_compare_style
bullmetabolite_scale
bullmetabolite_no_data_color
bullmetabolite_no_data_size
bullidentifiers_on_map
bullhighlight_missing
bullallow_building_duplicate_reactions
bullcofactors
All keyword arguments can also be set on an existing Builder object using setter functions eg
my_builderset_reaction_styles(new_styles)
display_in_browser(ip=lsquo127001rsquo port=7655 n_retries=50 js_source=rsquowebrsquo menu=rsquoallrsquoscroll_behavior=rsquopanrsquo enable_editing=True enable_keys=True mini-fied_js=True never_ask_before_quit=False)
Launch a web browser to view the map
Parameters
bull ip ndash The IP address to serve the map on
bull port ndash The port to serve the map on If specified the port is occupied then a random freeport will be used
bull n_retries (int) ndash The number of times the server will try to find a port before quitting
bull js_source (string) ndash Can be one of the following
ndash web (Default) - Use JavaScript files from eschergithubio
79 Python API 45
Escher Documentation Release 143
ndash local - Use compiled JavaScript files in the local Escher installation Works offline
ndash dev - No longer necessary with source maps This now gives the same behavior aslsquolocalrsquo
bull menu (string) ndash Menu bar options include
ndash none - No menu or buttons
ndash zoom - Just zoom buttons
ndash all (Default) - Menu and button bar (requires Bootstrap)
bull scroll_behavior (string) ndash Scroll behavior options
ndash pan - Pan the map
ndash zoom - Zoom the map
ndash none (Default) - No scroll events
bull enable_editing (Boolean) ndash Enable the map editing modes
bull enable_keys (Boolean) ndash Enable keyboard shortcuts
bull minified_js (Boolean) ndash If True use the minified version of JavaScript and CSSfiles
bull never_ask_before_quit (Boolean) ndash Never display an alert asking if you wantto leave the page By default this message is displayed if enable_editing is True
display_in_notebook(js_source=rsquowebrsquo menu=rsquozoomrsquo scroll_behavior=rsquononersquo mini-fied_js=True height=500 enable_editing=False)
Embed the Map within the current IPython Notebook
Parameters
bull js_source (string) ndash Can be one of the following
ndash web (Default) - Use JavaScript files from eschergithubio
ndash local - Use compiled JavaScript files in the local Escher installation Works offline
ndash dev - No longer necessary with source maps This now gives the same behav-ior as lsquolocalrsquo
bull menu (string) ndash Menu bar options include
ndash none - No menu or buttons
ndash zoom - Just zoom buttons
ndash Note The all menu option does not work in an IPython notebook
bull scroll_behavior (string) ndash Scroll behavior options
ndash pan - Pan the map
ndash zoom - Zoom the map
ndash none - (Default) No scroll events
bull minified_js (Boolean) ndash If True use the minified version of JavaScript andCSS files
bull height ndash Height of the HTML container
bull enable_editing (Boolean) ndash Enable the map editing modes
46 Chapter 7 Contents
Escher Documentation Release 143
save_html(filepath=None overwrite=False js_source=rsquowebrsquo protocol=rsquohttpsrsquo menu=rsquoallrsquoscroll_behavior=rsquopanrsquo enable_editing=True enable_keys=True minified_js=Truenever_ask_before_quit=False static_site_index_json=None)
Save an HTML file containing the map
Parameters
bull filepath (string) ndash The HTML file will be saved to this location Whenjs_source is lsquolocalrsquo then a new directory will be created with this name
bull overwrite (Boolean) ndash Overwrite existing files
bull js_source (string) ndash Can be one of the following
ndash web (Default) - Use JavaScript files from eschergithubio
ndash local - Use compiled JavaScript files in the local Escher installation Works of-fline To make the dependencies available to the downloaded file a new directorywill be made with the name specified by filepath
ndash dev - No longer necessary with source maps This now gives the same behav-ior as lsquolocalrsquo
bull protocol (string) ndash The protocol can be lsquohttprsquo lsquohttpsrsquo or None which indicatesa lsquoprotocol relative URLrsquo as in eschergithubio Ignored if source is local
bull menu (string) ndash Menu bar options include
ndash none - No menu or buttons
ndash zoom - Just zoom buttons
ndash all (Default) - Menu and button bar (requires Bootstrap)
bull scroll_behavior (string) ndash Scroll behavior options
ndash pan - Pan the map
ndash zoom - Zoom the map
ndash none (Default) - No scroll events
bull enable_editing (Boolean) ndash Enable the map editing modes
bull enable_keys (Boolean) ndash Enable keyboard shortcuts
bull minified_js (Boolean) ndash If True use the minified version of JavaScript andCSS files
bull height (number) ndash Height of the HTML container
bull never_ask_before_quit (Boolean) ndash Never display an alert asking if youwant to leave the page By default this message is displayed if enable_editing isTrue
bull static_site_index_json (string) ndash The index as a JSON string for thestatic site Use javascript to parse the URL options Used for generating static pages(see static_sitepy)
791 Cache
escherget_cache_dir(versioned=True name=None)Get the cache dir as a string and make the directory if it does not already exist
Parameters
79 Python API 47
Escher Documentation Release 143
bull versioned (Boolean) ndash Whether to return the versioned path in the cache Eschermaps for the latest version of Escher are found in the versioned directory (versioned= True) but maps for previous versions of Escher can be found by visiting the parentdirectory (versioned = False)
bull name (string) ndash An optional subdirectory within the cache If versioned is False thenname is ignored
escherclear_cache(different_cache_dir=None ask=True)Empty the contents of the cache directory including all versions of all maps and models
Parameters
bull different_cache_dir (string) ndash (Optional) The directory of another cacheThis is mainly for testing
bull ask (Boolean) ndash Whether to ask before deleting
escherlist_cached_maps()Return a list of all cached maps
escherlist_cached_models()Return a list of all cached models
escherlist_available_maps()Return a list of all maps available on the server
escherlist_available_models()Return a list of all models available on the server
710 License
Escher and EscherConverter are distributed under the MIT license
bull genindex
48 Chapter 7 Contents
Python Module Index
eescher 44
49
Escher Documentation Release 143
50 Python Module Index
Index
Bbrush_mode() (built-in function) 43build_mode() (built-in function) 43Builder (class in escher) 44
Cclear_cache() (in module escher) 48
Ddisplay_in_browser() (escherBuilder method) 45display_in_notebook() (escherBuilder method) 46
Eescher (module) 44escherBuilder() (class) 39
Gget_cache_dir() (in module escher) 47
Llist_available_maps() (in module escher) 48list_available_models() (in module escher) 48list_cached_maps() (in module escher) 48list_cached_models() (in module escher) 48load_map() (built-in function) 42load_model() (built-in function) 43
Ooptionenable_keys (option attribute) 40optionsallow_building_duplicate_reactions (options at-
tribute) 42optionsand_method_in_gene_reaction_rule (options at-
tribute) 41optionscofactors (options attribute) 42optionsenable_editing (options attribute) 39optionsenable_search (options attribute) 40optionsfill_screen (options attribute) 40optionsfirst_load_callback (options attribute) 42optionsfull_screen_button (options attribute) 40optionsgene_data (options attribute) 41
optionsgene_font_size (options attribute) 40optionshide_all_labels (options attribute) 40optionshide_secondary_metabolites (options attribute)
40optionshighlight_missing (options attribute) 42optionsidentifiers_on_map (options attribute) 42optionsignore_bootstrap (options attribute) 40optionsmarker_radius (options attribute) 40optionsmenu (options attribute) 39optionsmetabolite_compare_style (options attribute) 42optionsmetabolite_data (options attribute) 42optionsmetabolite_no_data_color (options attribute) 42optionsmetabolite_no_data_size (options attribute) 42optionsmetabolite_scale (options attribute) 42optionsmetabolite_styles (options attribute) 42optionsnever_ask_before_quit (options attribute) 40optionsprimary_metabolite_radius (options attribute) 40optionsreaction_compare_style (options attribute) 41optionsreaction_data (options attribute) 40optionsreaction_no_data_color (options attribute) 41optionsreaction_no_data_size (options attribute) 41optionsreaction_scale (options attribute) 41optionsreaction_styles (options attribute) 41optionsscroll_behavior (options attribute) 39optionssecondary_metabolite_radius (options attribute)
40optionsshow_gene_reaction_rules (options attribute) 40optionsstarting_reaction (options attribute) 40optionsunique_map_id (options attribute) 40optionsuse_3d_transform (options attribute) 39
Rrotate_mode() (built-in function) 43
Ssave_html() (escherBuilder method) 46set_gene_data() (built-in function) 43set_metabolite_data() (built-in function) 43set_reaction_data() (built-in function) 43
51
Escher Documentation Release 143
Ttext_mode() (built-in function) 43
Vview_mode() (built-in function) 43
Zzoom_mode() (built-in function) 43
52 Index
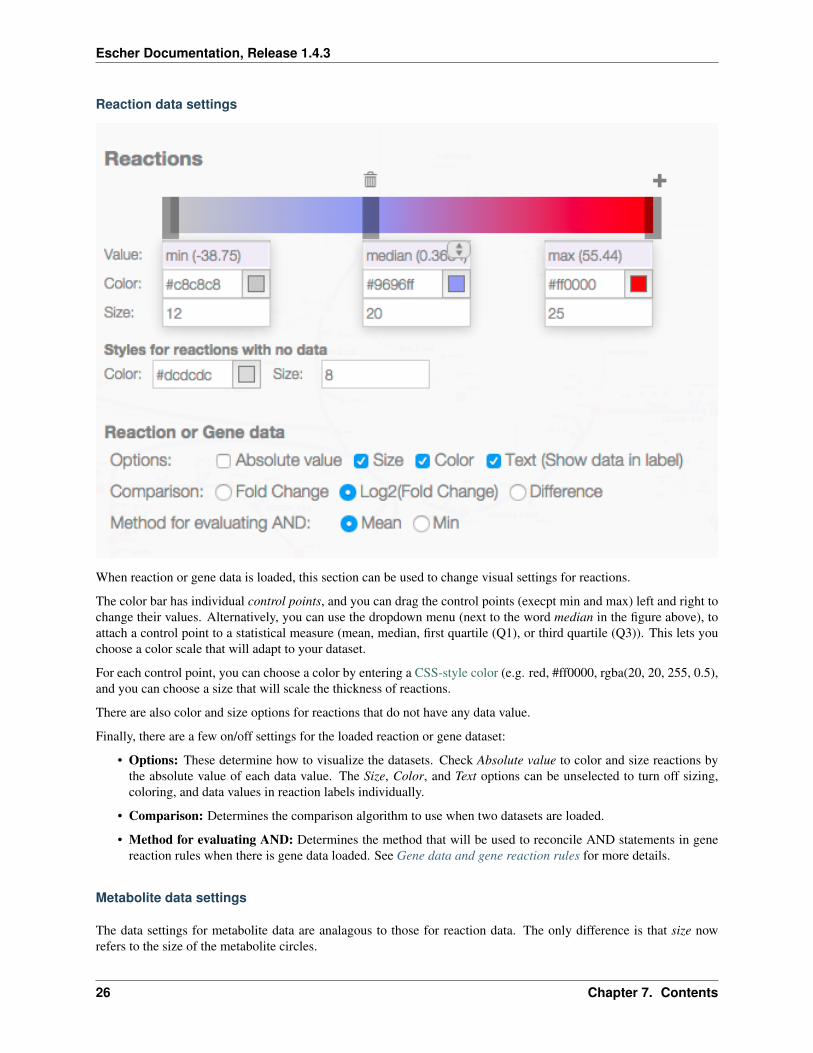
Escher Documentation Release 143
72 Escher COBRA and COBRApy
Escher can be used as an independent application but it draws heavily on the information in COBRA models ACOBRA model is a collection of all the reactions metabolites and genes known to exist in an organism (In theliterature these are generally called genome-scale models (GEMs) but we refer to them as COBRA models here toemphasize that Escher interoperates with models that are exported from COBRApy)
By loading a COBRA model into the Escher interface you have access to every reaction and metabolite in that modelYou also have the gene reaction rules for the reactions in the network which allow you to connect gene data toreactions and metabolites
COBRApy is a software package for COBRA modeling written in Python The Escher Python package uses CO-BRApy package for reading and writing COBRA models
721 Maps and models
In Escher you will see references to maps and models
A map contains the reactions and metabolites that you see in the Escher builder including their locations text annota-tions and the canvas
A model (a COBRA model) contains reactions and metabolites that you have not drawn yet Thus you can load aCOBRA model when you want to draw new reactions on the map
722 What is JSON and why do we use it
Both Escher maps and COBRA models are stored as JSON files JSON is a useful plain-text format for storing nesteddata structures We use JSON much like the SBML community uses XML You may notice that SBML files have axml extension and Escher maps and COBRA models have a json extension
You can use Python to explore a JSON file like this
import json
with open(mapjson r) as fmap_object = jsonload(f)
print map_object[0]print map_object[1][reactions]values()[0]
723 Escher SBML and SBGN
A tool has been developed for converting Escher maps to SBML Layout and SBGN and it will be released soon
COBRA models can be converted to SBML using COBRApy
73 Run Escher locally and in IPython
To run Escher on a local computer or to use Escher in PythonIPython first install it The Python package for Eschercan be installed using pip
pip install escher
72 Escher COBRA and COBRApy 27
Escher Documentation Release 143
Depending on your installation of Python you may need sudo
sudo pip install escher
Alternatively one can download the source files and install the package directly
python setuppy install
731 Escher in the IPython Notebook
Once you have installed Escher locally you can interact with Escher maps in an IPython Notebook
Here are example notebooks to get started with
bull COBRApy and Escher
bull JavaScript development and offline maps
bull Generate JSON models in COBRApy
Dependencies
bull Jinja2
bull Tornado
bull COBRApy 030 or later
732 Running the local server
You can run your own local server if you want to use Escher offline or explore your own maps with the homepagebrowser To get started install the Python package and run from any directory by calling
python -m escherserver
This starts a server at httplocalhost7778 You can also choose another port
python -m escherserver --port=8005
74 Validate and convert maps
741 Validate an Escher map
Escher maps follow a specification using the JSON Schema format Therefore any JSON Schema validator can beused to validate an Escher map by comparing it to the latest schema file For example the current schema is locatedhere
httpsgithubcomzakandrewkingescherblobmasterescherjsonschema1-0-0
To make this easier the Escher Python package includes a validation script To validate a map first install Escher
pip install escher
Then call the validator
python -m eschervalidate my_mapjson
Any errors in the map will print to the console
28 Chapter 7 Contents
Escher Documentation Release 143
742 Convert or upgrade an Escher map
Any Escher maps built with pre-release versions of Escher will not load right away in the stable v10 release Toconvert pre-release maps to the new format follow these steps
1 Install Escher
pip install escher
2 Find a COBRA model for your maps This COBRA model will be used to update the content of the mapin order to support all the new Escher features You can use a COBRA model encoded as SBML or JSON(generated with COBRApy v030b4 or later) The COBRA models currently available on the Escher websitecan be downloaded from the BiGG Models website
httpbiggucsdedu
For a refresher on the distinction between Escher maps COBRA models and their file types (SBML JSONSBML Layout) see Escher COBRA and COBRApy
3 Run the convert_map script to convert your existing Escher map (my_old_mapjson) to the new formatusing a COBRA model (model_filejson or model_filexml in these examples)
With a JSON file modelpython -m escherconvert_map my_old_mapjson pathtomodel_filejson
With an SBML modelpython -m escherconvert_map my_old_mapjson pathtomodel_filexml
Those commands will generate a new map called my_old_map_convertedjson that will load in Escher v10and later
75 Building and contributing maps
We are excited to collect pathway maps for every organism with a well characterized metabolic network This sectiondescribes the process of building a new map either from scratch or using a COBRA model with BiGG IDs
751 Building from scratch
To build a map from scratch you will first need a COBRA model for your map See the section Escher COBRA andCOBRApy for some background information on COBRA models
If you would like to eventually contribute your map to the Escher website it is important that your COBRA modeladheres to the identifiers in the BiGG Database Escher and BiGG are being developed together and we want tomaintain consistency and interoperability between them
Once you have a COBRA model you can follow these steps
1 Load your model in the Escher Builder
2 Begin building new reactions If you are familiar with the genes in your organism then try search for newreactions by their gene IDs
3 Limit each map to ~200 reactions Maps larger than this will slow down the Escher viewer especially on oldbrowsers Rather than building one giant map Escher is designed for building many smaller subsystem maps
4 When you have built a map for your a subsystem save the map as JSON with a name that includes the modelID followed by a period followed by the name of the subsystem For example
75 Building and contributing maps 29
Escher Documentation Release 143
iMM904Amino acid biosynthesisjson
5 (Optional) Once you have a set of subsystem maps you can set up a local Escher server so that subsystem mapsappear in the ldquoquick jumprdquo menu in the bottom right corner of the screen (as seen here for iJO1366) To setthis up you will need to start a local server as describe in Running the local server Next find your local cachedirectory by running this command in a terminal
python -c import escher print(escherget_cache_dir(name=maps))
This will print the location of the local maps cache Add your new subsystem maps to cache folder Now whenyou run the server (described in Running the local server) you should see that quick jump menu appear
NOTE The cache directory is organized into folders for organisms You can use these folder for filtering byorganism on the local launch page or you can place the maps in the top directory
NOTE 2 A similar approach can be used to access your models from the local launch page Place maps in thefolder indicated by
python -c import escher print(escherget_cache_dir(name=models))
752 Building from an existing map for a similar organism
Follow the instruction above except rather than starting from scratch load an existing Escher map for a differentorganism
Once you have the new model loaded use the Update names and gene reaction rules using model button in theModel menu to convert all descriptive names and gene reaction rules in the model to those in the map Reactions thatdo not match the model will be highlighted in red (This can be turned off again in the settings menu by deselectingHighlight reactions not in model)
Now visit each highlighted reaction and see if you can replace it with an equivalent biochemical pathway from themodel If not then delete the reaction and move on
Finally when there are no highlighted reactions left you can repeat this for other subsystems
753 Submitting maps to the Escher website
If you would like to contribute maps to Escher you can make a Pull Request to the GitHub repository eschergithubioMake sure there is a folder with the name of the organism in 1-0-0maps For example a new yeast map goes inthe folder
1-0-0mapsSaccharomyces cerevisiae
Then name your map by concatenating the model ID and the map name separated by a period For example a yeastmap built with the genome-scale model iMM904 could be named
iMM904Amino acid biosynthesisjson
Then add the JSON file for the model to the Pull Request if that model is not already available As before make afolder for your organism within 1-0-0models The model filename is just the model ID
In this example a correct Pull Request would include the following files
1-0-0mapsSaccharomyces cerevisiaeiMM904Amino acid biosynthesisjson1-0-0modelsSaccharomyces cerevisiaeiMM904json
30 Chapter 7 Contents
Escher Documentation Release 143
76 Developing with Escher
761 Using the static JavaScript and CSS files
You can include the compiled Escher JavaScript and CSS files in any HTML document The only dependencies ared3js and optionally Twitter Bootstrap if you are using the option menu=rsquoallrsquo
The compiled files are available form npmcdn
httpsnpmcdncomescher-visjsdistescherjshttpsnpmcdncomescher-visjsdistescherminjshttpsnpmcdncomescher-viscssdistbuildercsshttpsnpmcdncomescher-viscssdistbuildermincss
Source maps are also hosted there
httpsnpmcdncomescher-visjsdistescherjsmaphttpsnpmcdncomescher-visjsdistescherminjsmaphttpsnpmcdncomescher-viscssdistbuildermincssmap
If you want a particular version of escher add a version tag like this
httpsnpmcdncomescher-vis140-beta3jsdistescherjs
For an example of the boilerplate code that is required to begin developing with Escher have a look at the escher-demorepository For projects built with npm use the escher-test repository as a guide
762 Building and testing Escher
First install dependencies with npm
npm install
Escher uses grunt to manage the build process To run typical build steps just run
npm run compile
To test the JavaScript files run
npm run test
For Python testing run this in the py directory
python setuppy test
Build the static website
python setuppy build_gh
Clear static website files
python setuppy clean
Build and run the docs
cd docsmake htmlcd _buildhtml
76 Developing with Escher 31
Escher Documentation Release 143
python -m SimpleHTTPServer python 2python -m httpserver python 3
763 Generating and reading Escher and COBRA files
The Escher file format
Escher layouts are defined by JSON files that follow a specific schema using json schema The latest schemafor Escher JSON files is here The Escher schemas are versioned with inspiration from SchemaVer Theeschervalidate module can be used to validate models against the schema
The Escher layout schema is designed to be as simple as possible For example the core metabolism map of Es-cherichia coli is layed out like this
[
map_name E coli coreCore metabolismmap_id 2938hoq32a1map_description E coli core metabolic networknLast Modified Fri Dec 05 2014 163944 GMT-0800 (PST)homepage httpseschergithubioschema httpseschergithubioescherjsonschema1-0-0
reactions nodes text_label canvas
x 7857062530517567y 31436893920898433width 5894515691375733height 4860457037353515
]
The map_name includes the model that was used to build this layout followed by a period and then a readable namefor the map The map_id is a unique identifier for this map The map_description describes the map and thelast time it was modified Both the homepage and the schema entries must have exactly these values for the Eschermap to be valid
In the next section the reactions nodes labels and canvas are all defined For reactions nodes and text labels eachelement has a key that is an arbitrary integer As long as there are no repeated IDs (eg no 2 segments with the ID517) then everything should work fine
Read through the schema (here) for more detail on the format
The COBRA file format
COBRA models are also saved as JSON files This format has not been documented with a schema but you canbrowse through the core metabolism model as a guide to generating valid COBRA models
I still need help
If you are interested in developing with Escher and you need more information than what is provided in the documen-tation please contact Zachary King (zaking-AT-ucsd-DOT-edu)
32 Chapter 7 Contents
Escher Documentation Release 143
77 EscherConverter
EscherConverter is a standalone program that reads files created with the graphical network editor Escher and convertsthem to files in community standard formats
Download EscherConverter 05 (137 MB)
771 Using EscherConverter
Escher uses a JSON file format to represent its networks This format has been developed because of its very small filesize and its compatibility to online programs that are written in JavaScript In particular JSON is a JavaScript ObjectNotation or in other words a JSON file directly represents components of JavaScript programs This makes parsingvery simple and allows direct use of those files in web-based programs
However in systems biology specific file formats have been developed with the aim to be easily exchangeable betweensoftware implemented in diverse programming languages
To this end these formats support semantically clear annotations and are maintained by a large community of scientistsEscherConverter supports export to two particularly important XML-based community file formats SBML with layoutextension and SBGN-ML
While SBML has been mainly developed for dynamic simulation of biological networks it is nowadays also usablefor diverse other purposes Its layout extension facilitates the encoding the display of biological networks
SBGN-ML has been directly developed as a language for the display of biological pathway maps of diverse kinds Itstores the position and connection of entities similar to what is shown in Escher networks
EscherConverter takes Escherrsquos JSON files as input and generates equivalent SBML Level 3 Version 1 files with layoutextension or SBGN-ML files
In order to ensure that the conversion is correct EscherConverter provides its own display that gives users a previewof how the export data format will be rendered by other tools In this preview display you can zoom in and out movearcs and node positions However it is important to know that none of the changes made in this preview are stored inthe export file
Download and Installation
You can obtain local copy of EscherConverter by clicking here
As a Javatrade application no specific installation is required for EscherConverter
However make sure you have a recent Javatrade Runtime Environment (JRE) installed on your computer (at least JRE8) You can obtain Javatrade from the Oracle website There you can also find installation instructions for your respectiveoperating system
Once Javatrade has been installed you can simply place the EscherConverter JAR file somewhere on your local computerfor instance in the folder
bull Applications if you are working under Mac OS
77 EscherConverter 33
Escher Documentation Release 143
bull opt for Linux computers
bull CProgram Files if you are using Windows
Launching the program
You can launch EscherConverter simply by double-clicking on the application JAR file This will open a followinggraphical user interface as described in the following figures
Figure 1 | The graphical user interface of EscherConverter
bull Preferences opens a settings dialog (see next screenshot)
bull Open displays a file chooser to select an input file in JSON format
bull Save export the map that is displayed in the current tab to SBML or SBGN-ML
bull Discard closes the current tab without saving
bull Help opens the online help that displays all command-line options
bull License displays the license under which this software is distributed
bull About shows information about the authors of this software
bull Main the main panel of the software in which converted Escher maps will be displayed organized in tabs
bull Status the status bar shows information and logging messages during the conversion
34 Chapter 7 Contents
Escher Documentation Release 143
Figure 2 | The preferences dialog All settings in this dialog are also available through EscherConverterrsquos command-line interface
Layout section several properties that are required in SBML and SBGN-ML are not explicitly specified in EscherrsquosJSON format and therefore need to be adjusted by the user These are the size of the drawing canvas the default boxsize for text labels the size of primary and secondary nodes In contrast to SBGN-ML and Escherrsquos JSON formatthe SBML layout extension supports three-dimensional displays When selecting this export file format it is thereforenecessary to also define the z-coordinate and the depth of all objects
Components and naming section Most settings in this section are specific for the SBML layout extension and areonly active if this output format is selected These are names and identifiers of the layout component and the in caseof SBML mandatory default compartment (a compartment without physical meaning a reaction space in which allmetabolites are located) EscherConverter can infer compartment bounds from metabolites but this is an experimentalfeature Just try it and see how the preview changes
77 EscherConverter 35
Escher Documentation Release 143
Figure 3 | A layout preview
The birds-eye view and the navigation component on the left help you navigate through the network display Thisgraph shows you how the converted pathway map will be rendered by software that supports SBGN-ML or the SBMLlayout extension This preview can be modified by moving arcs or nodes however none of those changes are storedwhen exporting the file In this current version EscherConver only exports layouts as given in the original JSON file
Included third-party software
EscherConverter includes several third-party libraries which we here list and acknowledge
bull ArgParser
bull JSBML
bull libSBGN
bull Pixel-Mixer icons
bull yFiles
772 Command-line interface API
You can launch EscherConverter from the command-line On a Unix system (such as Linux MacOS or Solaris etc)use a command like
bash$ java -jar -Xms8G -Xmx8G -Duserlanguage=en EscherConverter-05jar [options]
Under Window use a command like
Cgt javaw -jar -Xms8G -Xmx8G -Duserlanguage=en EscherConverter-05jar [options]
Escher has a large collection of command-line options (see below) which can be useful if you want to launch theprogram with specific settings or if multiple files are to be converted in a batch mode It is even possible to completelydisable the graphical user interface
36 Chapter 7 Contents
Escher Documentation Release 143
Input and output files
Definition of input and output data files as well as the format for the output
--input=ltFilegt
Specifies the JSON input file If a directory is given the conversion will be recursively performed Accepts JSON
--output=ltFilegt
The path to the file into which the output should be written If the input is a directory this must also be a directory inorder to perform a recursive conversion Accepts SBML SBGN
Escher layout
The options in this group allow you to influence how large certain elements should be displayed
--canvas-default-height=ltDoublegt
Just as in the case of the width of the canvas this value needs to be specified for cases where the JSON input file lacksan explicit specification of the canvas height Arguments must fit into the range [11E9] (Default value 2500)
--canvas-default-width=ltDoublegt
This value is used when no width has been defined for the canvas Since the width attribute is mandatory for the layouta default value must be provided in these cases Arguments must fit into the range [11E9] (Default value 2500)
--label-height=ltDoublegt
With this option you can specify the height of the bounding box of text labels Arguments must fit into the range[11E9] (Default value 500)
--label-width=ltDoublegt
This option defines the width of bounding boxes for text labels Arguments must fit into the range [11E9] (Defaultvalue 1600)
--node-depth=ltDoublegt
The length of nodes along z-coordinate Escher maps are actually two-dimensional but in general a layout can bethree-dimensional This value should be an arbitrary value greater than zero because some rendering engines mightnot display the node if its depth is zero Arguments must fit into the range [11E9] (Default value 10)
--node-label-height=ltDoublegt
Node labels can have a size different from general labels in the graph Here you can specify how height the boundingbox of the labels for nodes should be Arguments must fit into the range [11E9] (Default value 200)
--primary-node-height=ltDoublegt
The primary node should be bigger than the secondary node With this option you can specify the height of this typeof nodes Arguments must fit into the range [11E9] (Default value 300)
--primary-node-width=ltDoublegt
Escher maps distinguish between primary and secondary nodes Primary nodes should be larger than secondary nodesand display the main flow of matter through the network This option allows you to specify the width of primarynodes Arguments must fit into the range [11E9] (Default value 300)
77 EscherConverter 37
Escher Documentation Release 143
--reaction-label-height=ltDoublegt
Reaction label heightArguments must fit into the range [11E9] (Default value 300)
--reaction-node-ratio=ltDoublegt
This value is used as a conversion factor to determine the size of the reaction display box depending on the size ofprimary nodes Height and width of reaction nodes are determined by dividing the corresponding values from theprimary node size by this factor Arguments must fit into the range [01] (Default value 05)
--secondary-node-ratio=ltDoublegt
Similar to the reaction node ratio the size of secondary nodes (width and height) is determined by dividing thecorresponding values from the primary nodes by this value Arguments must fit into the range [01] (Default value06666666666666666)
--z=ltDoublegt
The position on the z-axis where the entire two-dimensional graph should be drawn Arguments must fit into the range[-1E91E9] (Default value 00)
Escher Components and their naming
Here you can influence which elements are to be included in the layout and how elements in the layout are to be calledor identified
--format=ltOutputFormatgt
The desired format for the conversion eg SBML All possible values for type ltOutputFormatgt are SBGN andSBML (Default value SBML)
--layout-id=ltStringgt
In contrast to the name this identifier does not have to be human-readable This is a machine identifier which muststart with a letter or underscore and can only contain ASCII characters (Default value Escher_Layout)
--layout-name=ltStringgt
This should be a human-readable name for the layout that is to be created This name might be displayed to describethe figure and should therefore be explanatory (Default value Escher Layout)
--compartment-id=ltStringgt
A compartment needs to have a unique identifier which needs to be a machine-readable Sting that must start with aletter or underscore and can only contain ASCII characters Since the JSON file does not provide this information thisoption allows you to specify the required identifier (Default value default)
--compartment-name=ltStringgt
With this option it is possible to define a name for the default compartment can be that needs to be generated for theconversion to SBML The name does not have any restrictions ie any UTF-8 character can be used (Default valueDefault compartment)
--infer-compartment-bounds
This converter can infer where the boundaries of compartments could be drawn To this end it uses each nodersquos BiGGids to identify the compartment of all metabolites Assuming that compartments have rectangular shapes the algorithmcan find the outermost node on each side of the box and hence obtain the boundaries of the compartment However
38 Chapter 7 Contents
Escher Documentation Release 143
this methods will fail when metabolites are drawn inside of such a box that belong to a different compartment that isactually further outside For this reason this option is deactivated by default (Default value false)
Options for the graphical user interface
--gui
If this option is given the program will display its graphical user interface (Default value false)
--log-level=ltStringgt
Change the log-level of this application This option will influence how fine-grained error and other log messages willbe that you receive while executing this program All possible values for type ltStringgt are ALL CONFIG FINEFINER FINEST INFO OFF SEVERE and WARNING (Default value INFO)
--log-file=ltFilegt
This option allows you to specify a log file to which all information of the program will be written Accepts (bp2bp3 log owl xml)
78 JavaScript API
class escherBuilder(map_data model_data embedded_css selection options)A Builder object contains all the UI and logic to generate a map builder or viewer
Arguments
bull map_data (object) ndash The data for a map to be passed to escherMapfrom_data() Ifnull then an empty Builder is initialized
bull model_data (object) ndash The data for a cobra model to be passed to es-cherCobraModel() Can be null
bull embedded_css (string) ndash The stylesheet for the SVG elements in the Escher map
bull selection (object) ndash (Optional Default In the body element) The d3 selection of anelement to place the Builder into The selection cannot be inside an SVG element
bull options (object) ndash (Optional) An object defining any of the following options
optionsmenu(Default rsquoallrsquo) The type of menu that will be displayed Can be lsquoallrsquo for the fullmenu or lsquozoomrsquo for just zoom buttons The lsquoallrsquo option requires the full set of Escherdependencies (D3js JQuery and Bootstrap) while the lsquozoomrsquo option requires only D3jsFor more details see Developing with Escher
optionsscroll_behavior(Default rsquopanrsquo) This option determines the effect that the scroll wheel will have onan Escher map Can be lsquopanrsquo to pan the map or lsquozoomrsquo to zoom the map when the usermoves the scroll wheel
optionsuse_3d_transform(Default Chooses a good option by testing the browser) If true then use CSS3 3D trans-forms to speed up panning and zooming This feature will only work on browsers thatsupport the 3D transforms It works best in the latest versions of Chrome Firefox andInternet Explorer Safari works better with this turned off
78 JavaScript API 39
Escher Documentation Release 143
optionsenable_editing(Default true) If true then display the map editing functions If false then hide themand only allow the user to view the map
optionenable_keys(Default true) If true then enable keyboard shortcuts
optionsenable_search(Default true) If true then enable indexing of the map for search Use false to disablesearching and potentially improve the map performance
optionsfill_screen(Default false) Use true to fill the screen when an Escher Builder is placed in a top-level container (eg a div in the body element)
optionsfull_screen_button(Default false) Include a button in the user interface for entering full screen mode
optionsignore_bootstrap(Default false) Do not use Bootstrap for buttons even if it available This is used toembed Escher in a Jupyter notebook where it conflicts with the Jupyter Boostrap installa-tion
Map model and styles
optionsstarting_reaction(Default null) The ID (as a string) of a reaction to draw when the Builder loads
optionsnever_ask_before_quit(Default false) If false then display a warning before the user closes an Eschermap If true then never display the warning This options is only respected if op-tionsenable_editing == true If enable_editing is false then the warnings are not dis-played
optionsunique_map_id(Default null) A unique ID that will be used to UI elements donrsquot interfere whenmultiple maps are in the same HTML document
optionsprimary_metabolite_radius(Default 15) The radius of primary metabolites in px
optionssecondary_metabolite_radius(Default 10) The radius of secondary metabolites in px
optionsmarker_radius(Default 5) The radius of marker nodes in px
optionsgene_font_size(Default 18) The font size of the gene reaction rules in px
optionshide_secondary_metabolites(Default false) If true then secondary nodes and segments are hidden This is conve-nient for generating simplified map figures
optionsshow_gene_reaction_rules(Default false) If true then show the gene reaction rules even without gene data
optionshide_all_labels(Default false) If checked hide all reaction gene and metabolite labels
Applied data
40 Chapter 7 Contents
Escher Documentation Release 143
optionsreaction_data(Default null) An object with reaction ids for keys and reaction data points for values
optionsreaction_stylesDefault [rsquocolorrsquo rsquosizersquo rsquotextrsquo]
An array of style types The array can contain any of the following lsquocolorrsquo lsquosizersquo lsquotextrsquolsquoabsrsquo The lsquocolorrsquo style means that the reactions will be colored according to the loadeddataset The lsquosizersquo style means that the reactions will be sized according to the loadeddataset The lsquotextrsquo style means that the data values will be displayed in the reactionlabels The lsquoabsrsquo style means the the absolute values of reaction values will be used fordata visualization
optionsreaction_compare_style(Default rsquodiffrsquo) How to compare to datasets Can be either lsquofold lsquolog2_foldrsquo orlsquodiffrsquo
optionsreaction_scaleDefault
[ type min color c8c8c8 size 12 type median color 9696ff size 20 type max color ff0000 size 25 ]
An array of objects that define points on the data scale
Each point is an object with a type attribute Types can be lsquominrsquo lsquomaxrsquo lsquomeanrsquo lsquoQ1rsquo (firstquartile) lsquomedianrsquo lsquoQ3rsquo (third quartile) or lsquovaluersquo Each point can have a color attributethat specifies a color with a string (any CSS color specification is allowed including hexrgb and rgba) Each point can have a size attirbute that specifies a reaction thickness as anumber Finally points with type lsquovaluersquo can have a value attribute that specifies an exactnumber for pont in the scale
NOTE If lsquominrsquo or lsquomaxrsquo is not provided Escher automatically adds them To be com-pletely clear about what you expect to see on the map it is best to provide lsquominrsquo andlsquomaxrsquo in addition to other scale points
Here are examples of each type
type rsquominrsquo color rsquoredrsquo size 12 Specifies that reactionsnear the minimum value are red and have thickness 12
type rsquoQ1rsquo color rsquorgba(100 100 50 05)rsquo size 12 Specifies that reactions near the first quartile have the given color opacity andthickness
type rsquomeanrsquo color rsquorgb(100 100 50)rsquo size 50 Specifies that reactions near the mean value have the given color and thickness
type rsquovaluersquo value 85 color rsquo333rsquo size 50 Specifies that reactions near 85 value have the given color and size
optionsreaction_no_data_color(Default rsquodcdcdcrsquo) The color of reactions with no data value
optionsreaction_no_data_size(Default 8) The size of reactions with no data value
optionsgene_data(Default null) An object with Gene ids for keys and gene data points for values
78 JavaScript API 41
Escher Documentation Release 143
optionsand_method_in_gene_reaction_rule(Default mean) When evaluating a gene reaction rule use this function to evaluate ANDrules Can be lsquomeanrsquo or lsquominrsquo
optionsmetabolite_data(Default null) An object with metabolite ids for keys and metabolite data points forvalues
optionsmetabolite_stylesDefault [rsquocolorrsquo rsquosizersquo rsquotextrsquo]
An array of style types The array can contain any of the following lsquocolorrsquo lsquosizersquo lsquotextrsquolsquoabsrsquo The lsquocolorrsquo style means that the metabolites will be colored according to the loadeddataset The lsquosizersquo style means that the metabolites will be sized according to the loadeddataset The lsquotextrsquo style means that the data values will be displayed in the metabolitelabels The lsquoabsrsquo style means the the absolute values of metabolite values will be used fordata visualization
optionsmetabolite_compare_style(Default rsquodiffrsquo) How to compare to datasets Can be either lsquofoldrsquo lsquolog2_foldrsquo orlsquodiffrsquo
optionsmetabolite_scaleDefault
[ type min color fffaf0 size 20 type median color f1c470 size 30 type max color 800000 size 40 ]
An array of objects that define points on the data scale See the description of op-tionsreaction_scale for an explanation of the format
optionsmetabolite_no_data_color(Default rsquoffffffrsquo) The color of metabolites with no data value
optionsmetabolite_no_data_size(Default 10) The size of metabolites with no data value
View and build options
optionsidentifiers_on_map(Default rsquobigg_idrsquo) The identifiers that will be displayed in reaction metabolite andgene labels Can be lsquobigg_idrsquo or lsquonamersquo
optionshighlight_missing(Default false) If true then highlight in red reactions that are not in the loaded COBRAmodel
optionsallow_building_duplicate_reactions(Default true) If true then building duplicate reactions is allowed If false then dupli-cate reactions are hidden in Add reaction mode
optionscofactors(Default [rsquoatprsquo rsquoadprsquo rsquonadrsquo rsquonadhrsquo rsquonadprsquo rsquonadphrsquorsquogtprsquo rsquogdprsquo rsquohrsquo rsquocoarsquo rsquoumprsquo rsquoh20rsquo rsquoppirsquo]) A list of metabo-lite IDs to treat as cofactors These will be secondary metabolites in new reactions
Callbacks
optionsfirst_load_callbackA function to run after loading the Builder
42 Chapter 7 Contents
Escher Documentation Release 143
load_map(map_data[ should_update_data])Load a map for the loaded data Also reloads most of the Builder content
Arguments
bull map_data ndash The data for a map
bull should_update_data (Boolean) ndash (Default true) Whether data should be ap-plied to the map
load_model(model_data[ should_update_data])Load the cobra model from model data
Arguments
bull model_data ndash The data for a Cobra model (Parsing in done by escherCobraModel)
bull should_update_data (Boolean) ndash (Default true) Whether data should be ap-plied to the model
view_mode()Enter view mode
build_mode()Enter build mode
brush_mode()Enter brush mode
zoom_mode()Enter zoom mode
rotate_mode()Enter rotate mode
text_mode()Enter text mode
set_reaction_data(data)
Arguments
bull data (array) ndash An array of 1 or 2 objects where each object has keys that are reactionIDrsquos and values that are data points (numbers)
set_metabolite_data(data)
Arguments
bull data (array) ndash An array of 1 or 2 objects where each object has keys that are metaboliteIDrsquos and values that are data points (numbers)
set_gene_data(data clear_gene_reaction_rules)
Arguments
bull data (array) ndash An array of 1 or 2 objects where each object has keys that are gene IDrsquosand values that are data points (numbers)
Arguments
bull clear_gene_reaction_rules (Boolean) ndash (Optional Default false) In addi-tion to setting the data also turn of the gene_reaction_rules
78 JavaScript API 43
Escher Documentation Release 143
79 Python API
class escherBuilder(map_name=None map_json=None model=None model_name=Nonemodel_json=None embedded_css=None reaction_data=None metabo-lite_data=None gene_data=None local_host=None id=None safe=Falsekwargs)
A metabolic map that can be viewed edited and used to visualize data
This map will also show metabolic fluxes passed in during consruction It can be viewed as a standalone htmlinside a browswer Alternately the respresentation inside an IPython notebook will also display the map
Maps are stored in json files and are stored in a cache directory Maps which are not found will be downloadedfrom a map repository if found
Parameters
bull map_name ndash A string specifying a map to be downloaded from the Escher web server orloaded from the cache
bull map_json ndash A JSON string or a file path to a JSON file or a URL specifying a JSON fileto be downloaded
bull model ndash A Cobra model
bull model_name ndash A string specifying a model to be downloaded from the Escher web serveror loaded from the cache
bull model_json ndash A JSON string or a file path to a JSON file or a URL specifying a JSONfile to be downloaded
bull embedded_css ndash The CSS (as a string) to be embedded with the Escher SVG
bull reaction_data ndash A dictionary with keys that correspond to reaction ids and values thatwill be mapped to reaction arrows and labels
bull metabolite_data ndash A dictionary with keys that correspond to metabolite ids and valuesthat will be mapped to metabolite nodes and labels
bull gene_data ndash A dictionary with keys that correspond to gene ids and values that will bemapped to corresponding reactions
bull local_host ndash A hostname that will be used for any local files This is generally usedfor using the notebook offline and for testing in the IPython Notebook with modified Eschercode An example value for local_host is lsquohttplocalhost7778lsquo
bull id ndash Specify an id to make the javascript data definitions unique A random id is chosen bydefault
bull safe ndash If True then loading files from the filesytem is not allowed This is to ensure thesafety of using Builder within a web server
Keyword Arguments
These are defined in the Javascript API
bulluse_3d_transform
bullenable_search
bullfill_screen
bullzoom_to_element
bullfull_screen_button
44 Chapter 7 Contents
Escher Documentation Release 143
bullstarting_reaction
bullunique_map_id
bullprimary_metabolite_radius
bullsecondary_metabolite_radius
bullmarker_radius
bullgene_font_size
bullhide_secondary_metabolites
bullshow_gene_reaction_rules
bullhide_all_labels
bullreaction_styles
bullreaction_compare_style
bullreaction_scale
bullreaction_no_data_color
bullreaction_no_data_size
bulland_method_in_gene_reaction_rule
bullmetabolite_styles
bullmetabolite_compare_style
bullmetabolite_scale
bullmetabolite_no_data_color
bullmetabolite_no_data_size
bullidentifiers_on_map
bullhighlight_missing
bullallow_building_duplicate_reactions
bullcofactors
All keyword arguments can also be set on an existing Builder object using setter functions eg
my_builderset_reaction_styles(new_styles)
display_in_browser(ip=lsquo127001rsquo port=7655 n_retries=50 js_source=rsquowebrsquo menu=rsquoallrsquoscroll_behavior=rsquopanrsquo enable_editing=True enable_keys=True mini-fied_js=True never_ask_before_quit=False)
Launch a web browser to view the map
Parameters
bull ip ndash The IP address to serve the map on
bull port ndash The port to serve the map on If specified the port is occupied then a random freeport will be used
bull n_retries (int) ndash The number of times the server will try to find a port before quitting
bull js_source (string) ndash Can be one of the following
ndash web (Default) - Use JavaScript files from eschergithubio
79 Python API 45
Escher Documentation Release 143
ndash local - Use compiled JavaScript files in the local Escher installation Works offline
ndash dev - No longer necessary with source maps This now gives the same behavior aslsquolocalrsquo
bull menu (string) ndash Menu bar options include
ndash none - No menu or buttons
ndash zoom - Just zoom buttons
ndash all (Default) - Menu and button bar (requires Bootstrap)
bull scroll_behavior (string) ndash Scroll behavior options
ndash pan - Pan the map
ndash zoom - Zoom the map
ndash none (Default) - No scroll events
bull enable_editing (Boolean) ndash Enable the map editing modes
bull enable_keys (Boolean) ndash Enable keyboard shortcuts
bull minified_js (Boolean) ndash If True use the minified version of JavaScript and CSSfiles
bull never_ask_before_quit (Boolean) ndash Never display an alert asking if you wantto leave the page By default this message is displayed if enable_editing is True
display_in_notebook(js_source=rsquowebrsquo menu=rsquozoomrsquo scroll_behavior=rsquononersquo mini-fied_js=True height=500 enable_editing=False)
Embed the Map within the current IPython Notebook
Parameters
bull js_source (string) ndash Can be one of the following
ndash web (Default) - Use JavaScript files from eschergithubio
ndash local - Use compiled JavaScript files in the local Escher installation Works offline
ndash dev - No longer necessary with source maps This now gives the same behav-ior as lsquolocalrsquo
bull menu (string) ndash Menu bar options include
ndash none - No menu or buttons
ndash zoom - Just zoom buttons
ndash Note The all menu option does not work in an IPython notebook
bull scroll_behavior (string) ndash Scroll behavior options
ndash pan - Pan the map
ndash zoom - Zoom the map
ndash none - (Default) No scroll events
bull minified_js (Boolean) ndash If True use the minified version of JavaScript andCSS files
bull height ndash Height of the HTML container
bull enable_editing (Boolean) ndash Enable the map editing modes
46 Chapter 7 Contents
Escher Documentation Release 143
save_html(filepath=None overwrite=False js_source=rsquowebrsquo protocol=rsquohttpsrsquo menu=rsquoallrsquoscroll_behavior=rsquopanrsquo enable_editing=True enable_keys=True minified_js=Truenever_ask_before_quit=False static_site_index_json=None)
Save an HTML file containing the map
Parameters
bull filepath (string) ndash The HTML file will be saved to this location Whenjs_source is lsquolocalrsquo then a new directory will be created with this name
bull overwrite (Boolean) ndash Overwrite existing files
bull js_source (string) ndash Can be one of the following
ndash web (Default) - Use JavaScript files from eschergithubio
ndash local - Use compiled JavaScript files in the local Escher installation Works of-fline To make the dependencies available to the downloaded file a new directorywill be made with the name specified by filepath
ndash dev - No longer necessary with source maps This now gives the same behav-ior as lsquolocalrsquo
bull protocol (string) ndash The protocol can be lsquohttprsquo lsquohttpsrsquo or None which indicatesa lsquoprotocol relative URLrsquo as in eschergithubio Ignored if source is local
bull menu (string) ndash Menu bar options include
ndash none - No menu or buttons
ndash zoom - Just zoom buttons
ndash all (Default) - Menu and button bar (requires Bootstrap)
bull scroll_behavior (string) ndash Scroll behavior options
ndash pan - Pan the map
ndash zoom - Zoom the map
ndash none (Default) - No scroll events
bull enable_editing (Boolean) ndash Enable the map editing modes
bull enable_keys (Boolean) ndash Enable keyboard shortcuts
bull minified_js (Boolean) ndash If True use the minified version of JavaScript andCSS files
bull height (number) ndash Height of the HTML container
bull never_ask_before_quit (Boolean) ndash Never display an alert asking if youwant to leave the page By default this message is displayed if enable_editing isTrue
bull static_site_index_json (string) ndash The index as a JSON string for thestatic site Use javascript to parse the URL options Used for generating static pages(see static_sitepy)
791 Cache
escherget_cache_dir(versioned=True name=None)Get the cache dir as a string and make the directory if it does not already exist
Parameters
79 Python API 47
Escher Documentation Release 143
bull versioned (Boolean) ndash Whether to return the versioned path in the cache Eschermaps for the latest version of Escher are found in the versioned directory (versioned= True) but maps for previous versions of Escher can be found by visiting the parentdirectory (versioned = False)
bull name (string) ndash An optional subdirectory within the cache If versioned is False thenname is ignored
escherclear_cache(different_cache_dir=None ask=True)Empty the contents of the cache directory including all versions of all maps and models
Parameters
bull different_cache_dir (string) ndash (Optional) The directory of another cacheThis is mainly for testing
bull ask (Boolean) ndash Whether to ask before deleting
escherlist_cached_maps()Return a list of all cached maps
escherlist_cached_models()Return a list of all cached models
escherlist_available_maps()Return a list of all maps available on the server
escherlist_available_models()Return a list of all models available on the server
710 License
Escher and EscherConverter are distributed under the MIT license
bull genindex
48 Chapter 7 Contents
Python Module Index
eescher 44
49
Escher Documentation Release 143
50 Python Module Index
Index
Bbrush_mode() (built-in function) 43build_mode() (built-in function) 43Builder (class in escher) 44
Cclear_cache() (in module escher) 48
Ddisplay_in_browser() (escherBuilder method) 45display_in_notebook() (escherBuilder method) 46
Eescher (module) 44escherBuilder() (class) 39
Gget_cache_dir() (in module escher) 47
Llist_available_maps() (in module escher) 48list_available_models() (in module escher) 48list_cached_maps() (in module escher) 48list_cached_models() (in module escher) 48load_map() (built-in function) 42load_model() (built-in function) 43
Ooptionenable_keys (option attribute) 40optionsallow_building_duplicate_reactions (options at-
tribute) 42optionsand_method_in_gene_reaction_rule (options at-
tribute) 41optionscofactors (options attribute) 42optionsenable_editing (options attribute) 39optionsenable_search (options attribute) 40optionsfill_screen (options attribute) 40optionsfirst_load_callback (options attribute) 42optionsfull_screen_button (options attribute) 40optionsgene_data (options attribute) 41
optionsgene_font_size (options attribute) 40optionshide_all_labels (options attribute) 40optionshide_secondary_metabolites (options attribute)
40optionshighlight_missing (options attribute) 42optionsidentifiers_on_map (options attribute) 42optionsignore_bootstrap (options attribute) 40optionsmarker_radius (options attribute) 40optionsmenu (options attribute) 39optionsmetabolite_compare_style (options attribute) 42optionsmetabolite_data (options attribute) 42optionsmetabolite_no_data_color (options attribute) 42optionsmetabolite_no_data_size (options attribute) 42optionsmetabolite_scale (options attribute) 42optionsmetabolite_styles (options attribute) 42optionsnever_ask_before_quit (options attribute) 40optionsprimary_metabolite_radius (options attribute) 40optionsreaction_compare_style (options attribute) 41optionsreaction_data (options attribute) 40optionsreaction_no_data_color (options attribute) 41optionsreaction_no_data_size (options attribute) 41optionsreaction_scale (options attribute) 41optionsreaction_styles (options attribute) 41optionsscroll_behavior (options attribute) 39optionssecondary_metabolite_radius (options attribute)
40optionsshow_gene_reaction_rules (options attribute) 40optionsstarting_reaction (options attribute) 40optionsunique_map_id (options attribute) 40optionsuse_3d_transform (options attribute) 39
Rrotate_mode() (built-in function) 43
Ssave_html() (escherBuilder method) 46set_gene_data() (built-in function) 43set_metabolite_data() (built-in function) 43set_reaction_data() (built-in function) 43
51
Escher Documentation Release 143
Ttext_mode() (built-in function) 43
Vview_mode() (built-in function) 43
Zzoom_mode() (built-in function) 43
52 Index
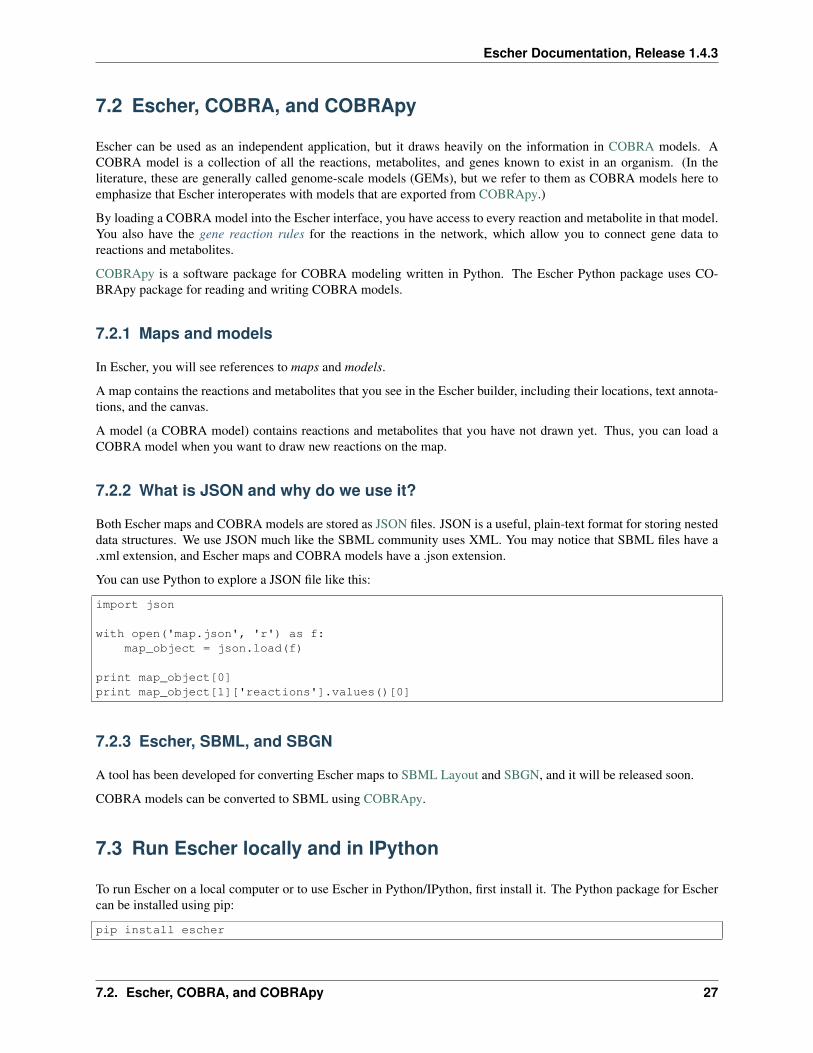
Escher Documentation Release 143
Depending on your installation of Python you may need sudo
sudo pip install escher
Alternatively one can download the source files and install the package directly
python setuppy install
731 Escher in the IPython Notebook
Once you have installed Escher locally you can interact with Escher maps in an IPython Notebook
Here are example notebooks to get started with
bull COBRApy and Escher
bull JavaScript development and offline maps
bull Generate JSON models in COBRApy
Dependencies
bull Jinja2
bull Tornado
bull COBRApy 030 or later
732 Running the local server
You can run your own local server if you want to use Escher offline or explore your own maps with the homepagebrowser To get started install the Python package and run from any directory by calling
python -m escherserver
This starts a server at httplocalhost7778 You can also choose another port
python -m escherserver --port=8005
74 Validate and convert maps
741 Validate an Escher map
Escher maps follow a specification using the JSON Schema format Therefore any JSON Schema validator can beused to validate an Escher map by comparing it to the latest schema file For example the current schema is locatedhere
httpsgithubcomzakandrewkingescherblobmasterescherjsonschema1-0-0
To make this easier the Escher Python package includes a validation script To validate a map first install Escher
pip install escher
Then call the validator
python -m eschervalidate my_mapjson
Any errors in the map will print to the console
28 Chapter 7 Contents
Escher Documentation Release 143
742 Convert or upgrade an Escher map
Any Escher maps built with pre-release versions of Escher will not load right away in the stable v10 release Toconvert pre-release maps to the new format follow these steps
1 Install Escher
pip install escher
2 Find a COBRA model for your maps This COBRA model will be used to update the content of the mapin order to support all the new Escher features You can use a COBRA model encoded as SBML or JSON(generated with COBRApy v030b4 or later) The COBRA models currently available on the Escher websitecan be downloaded from the BiGG Models website
httpbiggucsdedu
For a refresher on the distinction between Escher maps COBRA models and their file types (SBML JSONSBML Layout) see Escher COBRA and COBRApy
3 Run the convert_map script to convert your existing Escher map (my_old_mapjson) to the new formatusing a COBRA model (model_filejson or model_filexml in these examples)
With a JSON file modelpython -m escherconvert_map my_old_mapjson pathtomodel_filejson
With an SBML modelpython -m escherconvert_map my_old_mapjson pathtomodel_filexml
Those commands will generate a new map called my_old_map_convertedjson that will load in Escher v10and later
75 Building and contributing maps
We are excited to collect pathway maps for every organism with a well characterized metabolic network This sectiondescribes the process of building a new map either from scratch or using a COBRA model with BiGG IDs
751 Building from scratch
To build a map from scratch you will first need a COBRA model for your map See the section Escher COBRA andCOBRApy for some background information on COBRA models
If you would like to eventually contribute your map to the Escher website it is important that your COBRA modeladheres to the identifiers in the BiGG Database Escher and BiGG are being developed together and we want tomaintain consistency and interoperability between them
Once you have a COBRA model you can follow these steps
1 Load your model in the Escher Builder
2 Begin building new reactions If you are familiar with the genes in your organism then try search for newreactions by their gene IDs
3 Limit each map to ~200 reactions Maps larger than this will slow down the Escher viewer especially on oldbrowsers Rather than building one giant map Escher is designed for building many smaller subsystem maps
4 When you have built a map for your a subsystem save the map as JSON with a name that includes the modelID followed by a period followed by the name of the subsystem For example
75 Building and contributing maps 29
Escher Documentation Release 143
iMM904Amino acid biosynthesisjson
5 (Optional) Once you have a set of subsystem maps you can set up a local Escher server so that subsystem mapsappear in the ldquoquick jumprdquo menu in the bottom right corner of the screen (as seen here for iJO1366) To setthis up you will need to start a local server as describe in Running the local server Next find your local cachedirectory by running this command in a terminal
python -c import escher print(escherget_cache_dir(name=maps))
This will print the location of the local maps cache Add your new subsystem maps to cache folder Now whenyou run the server (described in Running the local server) you should see that quick jump menu appear
NOTE The cache directory is organized into folders for organisms You can use these folder for filtering byorganism on the local launch page or you can place the maps in the top directory
NOTE 2 A similar approach can be used to access your models from the local launch page Place maps in thefolder indicated by
python -c import escher print(escherget_cache_dir(name=models))
752 Building from an existing map for a similar organism
Follow the instruction above except rather than starting from scratch load an existing Escher map for a differentorganism
Once you have the new model loaded use the Update names and gene reaction rules using model button in theModel menu to convert all descriptive names and gene reaction rules in the model to those in the map Reactions thatdo not match the model will be highlighted in red (This can be turned off again in the settings menu by deselectingHighlight reactions not in model)
Now visit each highlighted reaction and see if you can replace it with an equivalent biochemical pathway from themodel If not then delete the reaction and move on
Finally when there are no highlighted reactions left you can repeat this for other subsystems
753 Submitting maps to the Escher website
If you would like to contribute maps to Escher you can make a Pull Request to the GitHub repository eschergithubioMake sure there is a folder with the name of the organism in 1-0-0maps For example a new yeast map goes inthe folder
1-0-0mapsSaccharomyces cerevisiae
Then name your map by concatenating the model ID and the map name separated by a period For example a yeastmap built with the genome-scale model iMM904 could be named
iMM904Amino acid biosynthesisjson
Then add the JSON file for the model to the Pull Request if that model is not already available As before make afolder for your organism within 1-0-0models The model filename is just the model ID
In this example a correct Pull Request would include the following files
1-0-0mapsSaccharomyces cerevisiaeiMM904Amino acid biosynthesisjson1-0-0modelsSaccharomyces cerevisiaeiMM904json
30 Chapter 7 Contents
Escher Documentation Release 143
76 Developing with Escher
761 Using the static JavaScript and CSS files
You can include the compiled Escher JavaScript and CSS files in any HTML document The only dependencies ared3js and optionally Twitter Bootstrap if you are using the option menu=rsquoallrsquo
The compiled files are available form npmcdn
httpsnpmcdncomescher-visjsdistescherjshttpsnpmcdncomescher-visjsdistescherminjshttpsnpmcdncomescher-viscssdistbuildercsshttpsnpmcdncomescher-viscssdistbuildermincss
Source maps are also hosted there
httpsnpmcdncomescher-visjsdistescherjsmaphttpsnpmcdncomescher-visjsdistescherminjsmaphttpsnpmcdncomescher-viscssdistbuildermincssmap
If you want a particular version of escher add a version tag like this
httpsnpmcdncomescher-vis140-beta3jsdistescherjs
For an example of the boilerplate code that is required to begin developing with Escher have a look at the escher-demorepository For projects built with npm use the escher-test repository as a guide
762 Building and testing Escher
First install dependencies with npm
npm install
Escher uses grunt to manage the build process To run typical build steps just run
npm run compile
To test the JavaScript files run
npm run test
For Python testing run this in the py directory
python setuppy test
Build the static website
python setuppy build_gh
Clear static website files
python setuppy clean
Build and run the docs
cd docsmake htmlcd _buildhtml
76 Developing with Escher 31
Escher Documentation Release 143
python -m SimpleHTTPServer python 2python -m httpserver python 3
763 Generating and reading Escher and COBRA files
The Escher file format
Escher layouts are defined by JSON files that follow a specific schema using json schema The latest schemafor Escher JSON files is here The Escher schemas are versioned with inspiration from SchemaVer Theeschervalidate module can be used to validate models against the schema
The Escher layout schema is designed to be as simple as possible For example the core metabolism map of Es-cherichia coli is layed out like this
[
map_name E coli coreCore metabolismmap_id 2938hoq32a1map_description E coli core metabolic networknLast Modified Fri Dec 05 2014 163944 GMT-0800 (PST)homepage httpseschergithubioschema httpseschergithubioescherjsonschema1-0-0
reactions nodes text_label canvas
x 7857062530517567y 31436893920898433width 5894515691375733height 4860457037353515
]
The map_name includes the model that was used to build this layout followed by a period and then a readable namefor the map The map_id is a unique identifier for this map The map_description describes the map and thelast time it was modified Both the homepage and the schema entries must have exactly these values for the Eschermap to be valid
In the next section the reactions nodes labels and canvas are all defined For reactions nodes and text labels eachelement has a key that is an arbitrary integer As long as there are no repeated IDs (eg no 2 segments with the ID517) then everything should work fine
Read through the schema (here) for more detail on the format
The COBRA file format
COBRA models are also saved as JSON files This format has not been documented with a schema but you canbrowse through the core metabolism model as a guide to generating valid COBRA models
I still need help
If you are interested in developing with Escher and you need more information than what is provided in the documen-tation please contact Zachary King (zaking-AT-ucsd-DOT-edu)
32 Chapter 7 Contents
Escher Documentation Release 143
77 EscherConverter
EscherConverter is a standalone program that reads files created with the graphical network editor Escher and convertsthem to files in community standard formats
Download EscherConverter 05 (137 MB)
771 Using EscherConverter
Escher uses a JSON file format to represent its networks This format has been developed because of its very small filesize and its compatibility to online programs that are written in JavaScript In particular JSON is a JavaScript ObjectNotation or in other words a JSON file directly represents components of JavaScript programs This makes parsingvery simple and allows direct use of those files in web-based programs
However in systems biology specific file formats have been developed with the aim to be easily exchangeable betweensoftware implemented in diverse programming languages
To this end these formats support semantically clear annotations and are maintained by a large community of scientistsEscherConverter supports export to two particularly important XML-based community file formats SBML with layoutextension and SBGN-ML
While SBML has been mainly developed for dynamic simulation of biological networks it is nowadays also usablefor diverse other purposes Its layout extension facilitates the encoding the display of biological networks
SBGN-ML has been directly developed as a language for the display of biological pathway maps of diverse kinds Itstores the position and connection of entities similar to what is shown in Escher networks
EscherConverter takes Escherrsquos JSON files as input and generates equivalent SBML Level 3 Version 1 files with layoutextension or SBGN-ML files
In order to ensure that the conversion is correct EscherConverter provides its own display that gives users a previewof how the export data format will be rendered by other tools In this preview display you can zoom in and out movearcs and node positions However it is important to know that none of the changes made in this preview are stored inthe export file
Download and Installation
You can obtain local copy of EscherConverter by clicking here
As a Javatrade application no specific installation is required for EscherConverter
However make sure you have a recent Javatrade Runtime Environment (JRE) installed on your computer (at least JRE8) You can obtain Javatrade from the Oracle website There you can also find installation instructions for your respectiveoperating system
Once Javatrade has been installed you can simply place the EscherConverter JAR file somewhere on your local computerfor instance in the folder
bull Applications if you are working under Mac OS
77 EscherConverter 33
Escher Documentation Release 143
bull opt for Linux computers
bull CProgram Files if you are using Windows
Launching the program
You can launch EscherConverter simply by double-clicking on the application JAR file This will open a followinggraphical user interface as described in the following figures
Figure 1 | The graphical user interface of EscherConverter
bull Preferences opens a settings dialog (see next screenshot)
bull Open displays a file chooser to select an input file in JSON format
bull Save export the map that is displayed in the current tab to SBML or SBGN-ML
bull Discard closes the current tab without saving
bull Help opens the online help that displays all command-line options
bull License displays the license under which this software is distributed
bull About shows information about the authors of this software
bull Main the main panel of the software in which converted Escher maps will be displayed organized in tabs
bull Status the status bar shows information and logging messages during the conversion
34 Chapter 7 Contents
Escher Documentation Release 143
Figure 2 | The preferences dialog All settings in this dialog are also available through EscherConverterrsquos command-line interface
Layout section several properties that are required in SBML and SBGN-ML are not explicitly specified in EscherrsquosJSON format and therefore need to be adjusted by the user These are the size of the drawing canvas the default boxsize for text labels the size of primary and secondary nodes In contrast to SBGN-ML and Escherrsquos JSON formatthe SBML layout extension supports three-dimensional displays When selecting this export file format it is thereforenecessary to also define the z-coordinate and the depth of all objects
Components and naming section Most settings in this section are specific for the SBML layout extension and areonly active if this output format is selected These are names and identifiers of the layout component and the in caseof SBML mandatory default compartment (a compartment without physical meaning a reaction space in which allmetabolites are located) EscherConverter can infer compartment bounds from metabolites but this is an experimentalfeature Just try it and see how the preview changes
77 EscherConverter 35
Escher Documentation Release 143
Figure 3 | A layout preview
The birds-eye view and the navigation component on the left help you navigate through the network display Thisgraph shows you how the converted pathway map will be rendered by software that supports SBGN-ML or the SBMLlayout extension This preview can be modified by moving arcs or nodes however none of those changes are storedwhen exporting the file In this current version EscherConver only exports layouts as given in the original JSON file
Included third-party software
EscherConverter includes several third-party libraries which we here list and acknowledge
bull ArgParser
bull JSBML
bull libSBGN
bull Pixel-Mixer icons
bull yFiles
772 Command-line interface API
You can launch EscherConverter from the command-line On a Unix system (such as Linux MacOS or Solaris etc)use a command like
bash$ java -jar -Xms8G -Xmx8G -Duserlanguage=en EscherConverter-05jar [options]
Under Window use a command like
Cgt javaw -jar -Xms8G -Xmx8G -Duserlanguage=en EscherConverter-05jar [options]
Escher has a large collection of command-line options (see below) which can be useful if you want to launch theprogram with specific settings or if multiple files are to be converted in a batch mode It is even possible to completelydisable the graphical user interface
36 Chapter 7 Contents
Escher Documentation Release 143
Input and output files
Definition of input and output data files as well as the format for the output
--input=ltFilegt
Specifies the JSON input file If a directory is given the conversion will be recursively performed Accepts JSON
--output=ltFilegt
The path to the file into which the output should be written If the input is a directory this must also be a directory inorder to perform a recursive conversion Accepts SBML SBGN
Escher layout
The options in this group allow you to influence how large certain elements should be displayed
--canvas-default-height=ltDoublegt
Just as in the case of the width of the canvas this value needs to be specified for cases where the JSON input file lacksan explicit specification of the canvas height Arguments must fit into the range [11E9] (Default value 2500)
--canvas-default-width=ltDoublegt
This value is used when no width has been defined for the canvas Since the width attribute is mandatory for the layouta default value must be provided in these cases Arguments must fit into the range [11E9] (Default value 2500)
--label-height=ltDoublegt
With this option you can specify the height of the bounding box of text labels Arguments must fit into the range[11E9] (Default value 500)
--label-width=ltDoublegt
This option defines the width of bounding boxes for text labels Arguments must fit into the range [11E9] (Defaultvalue 1600)
--node-depth=ltDoublegt
The length of nodes along z-coordinate Escher maps are actually two-dimensional but in general a layout can bethree-dimensional This value should be an arbitrary value greater than zero because some rendering engines mightnot display the node if its depth is zero Arguments must fit into the range [11E9] (Default value 10)
--node-label-height=ltDoublegt
Node labels can have a size different from general labels in the graph Here you can specify how height the boundingbox of the labels for nodes should be Arguments must fit into the range [11E9] (Default value 200)
--primary-node-height=ltDoublegt
The primary node should be bigger than the secondary node With this option you can specify the height of this typeof nodes Arguments must fit into the range [11E9] (Default value 300)
--primary-node-width=ltDoublegt
Escher maps distinguish between primary and secondary nodes Primary nodes should be larger than secondary nodesand display the main flow of matter through the network This option allows you to specify the width of primarynodes Arguments must fit into the range [11E9] (Default value 300)
77 EscherConverter 37
Escher Documentation Release 143
--reaction-label-height=ltDoublegt
Reaction label heightArguments must fit into the range [11E9] (Default value 300)
--reaction-node-ratio=ltDoublegt
This value is used as a conversion factor to determine the size of the reaction display box depending on the size ofprimary nodes Height and width of reaction nodes are determined by dividing the corresponding values from theprimary node size by this factor Arguments must fit into the range [01] (Default value 05)
--secondary-node-ratio=ltDoublegt
Similar to the reaction node ratio the size of secondary nodes (width and height) is determined by dividing thecorresponding values from the primary nodes by this value Arguments must fit into the range [01] (Default value06666666666666666)
--z=ltDoublegt
The position on the z-axis where the entire two-dimensional graph should be drawn Arguments must fit into the range[-1E91E9] (Default value 00)
Escher Components and their naming
Here you can influence which elements are to be included in the layout and how elements in the layout are to be calledor identified
--format=ltOutputFormatgt
The desired format for the conversion eg SBML All possible values for type ltOutputFormatgt are SBGN andSBML (Default value SBML)
--layout-id=ltStringgt
In contrast to the name this identifier does not have to be human-readable This is a machine identifier which muststart with a letter or underscore and can only contain ASCII characters (Default value Escher_Layout)
--layout-name=ltStringgt
This should be a human-readable name for the layout that is to be created This name might be displayed to describethe figure and should therefore be explanatory (Default value Escher Layout)
--compartment-id=ltStringgt
A compartment needs to have a unique identifier which needs to be a machine-readable Sting that must start with aletter or underscore and can only contain ASCII characters Since the JSON file does not provide this information thisoption allows you to specify the required identifier (Default value default)
--compartment-name=ltStringgt
With this option it is possible to define a name for the default compartment can be that needs to be generated for theconversion to SBML The name does not have any restrictions ie any UTF-8 character can be used (Default valueDefault compartment)
--infer-compartment-bounds
This converter can infer where the boundaries of compartments could be drawn To this end it uses each nodersquos BiGGids to identify the compartment of all metabolites Assuming that compartments have rectangular shapes the algorithmcan find the outermost node on each side of the box and hence obtain the boundaries of the compartment However
38 Chapter 7 Contents
Escher Documentation Release 143
this methods will fail when metabolites are drawn inside of such a box that belong to a different compartment that isactually further outside For this reason this option is deactivated by default (Default value false)
Options for the graphical user interface
--gui
If this option is given the program will display its graphical user interface (Default value false)
--log-level=ltStringgt
Change the log-level of this application This option will influence how fine-grained error and other log messages willbe that you receive while executing this program All possible values for type ltStringgt are ALL CONFIG FINEFINER FINEST INFO OFF SEVERE and WARNING (Default value INFO)
--log-file=ltFilegt
This option allows you to specify a log file to which all information of the program will be written Accepts (bp2bp3 log owl xml)
78 JavaScript API
class escherBuilder(map_data model_data embedded_css selection options)A Builder object contains all the UI and logic to generate a map builder or viewer
Arguments
bull map_data (object) ndash The data for a map to be passed to escherMapfrom_data() Ifnull then an empty Builder is initialized
bull model_data (object) ndash The data for a cobra model to be passed to es-cherCobraModel() Can be null
bull embedded_css (string) ndash The stylesheet for the SVG elements in the Escher map
bull selection (object) ndash (Optional Default In the body element) The d3 selection of anelement to place the Builder into The selection cannot be inside an SVG element
bull options (object) ndash (Optional) An object defining any of the following options
optionsmenu(Default rsquoallrsquo) The type of menu that will be displayed Can be lsquoallrsquo for the fullmenu or lsquozoomrsquo for just zoom buttons The lsquoallrsquo option requires the full set of Escherdependencies (D3js JQuery and Bootstrap) while the lsquozoomrsquo option requires only D3jsFor more details see Developing with Escher
optionsscroll_behavior(Default rsquopanrsquo) This option determines the effect that the scroll wheel will have onan Escher map Can be lsquopanrsquo to pan the map or lsquozoomrsquo to zoom the map when the usermoves the scroll wheel
optionsuse_3d_transform(Default Chooses a good option by testing the browser) If true then use CSS3 3D trans-forms to speed up panning and zooming This feature will only work on browsers thatsupport the 3D transforms It works best in the latest versions of Chrome Firefox andInternet Explorer Safari works better with this turned off
78 JavaScript API 39
Escher Documentation Release 143
optionsenable_editing(Default true) If true then display the map editing functions If false then hide themand only allow the user to view the map
optionenable_keys(Default true) If true then enable keyboard shortcuts
optionsenable_search(Default true) If true then enable indexing of the map for search Use false to disablesearching and potentially improve the map performance
optionsfill_screen(Default false) Use true to fill the screen when an Escher Builder is placed in a top-level container (eg a div in the body element)
optionsfull_screen_button(Default false) Include a button in the user interface for entering full screen mode
optionsignore_bootstrap(Default false) Do not use Bootstrap for buttons even if it available This is used toembed Escher in a Jupyter notebook where it conflicts with the Jupyter Boostrap installa-tion
Map model and styles
optionsstarting_reaction(Default null) The ID (as a string) of a reaction to draw when the Builder loads
optionsnever_ask_before_quit(Default false) If false then display a warning before the user closes an Eschermap If true then never display the warning This options is only respected if op-tionsenable_editing == true If enable_editing is false then the warnings are not dis-played
optionsunique_map_id(Default null) A unique ID that will be used to UI elements donrsquot interfere whenmultiple maps are in the same HTML document
optionsprimary_metabolite_radius(Default 15) The radius of primary metabolites in px
optionssecondary_metabolite_radius(Default 10) The radius of secondary metabolites in px
optionsmarker_radius(Default 5) The radius of marker nodes in px
optionsgene_font_size(Default 18) The font size of the gene reaction rules in px
optionshide_secondary_metabolites(Default false) If true then secondary nodes and segments are hidden This is conve-nient for generating simplified map figures
optionsshow_gene_reaction_rules(Default false) If true then show the gene reaction rules even without gene data
optionshide_all_labels(Default false) If checked hide all reaction gene and metabolite labels
Applied data
40 Chapter 7 Contents
Escher Documentation Release 143
optionsreaction_data(Default null) An object with reaction ids for keys and reaction data points for values
optionsreaction_stylesDefault [rsquocolorrsquo rsquosizersquo rsquotextrsquo]
An array of style types The array can contain any of the following lsquocolorrsquo lsquosizersquo lsquotextrsquolsquoabsrsquo The lsquocolorrsquo style means that the reactions will be colored according to the loadeddataset The lsquosizersquo style means that the reactions will be sized according to the loadeddataset The lsquotextrsquo style means that the data values will be displayed in the reactionlabels The lsquoabsrsquo style means the the absolute values of reaction values will be used fordata visualization
optionsreaction_compare_style(Default rsquodiffrsquo) How to compare to datasets Can be either lsquofold lsquolog2_foldrsquo orlsquodiffrsquo
optionsreaction_scaleDefault
[ type min color c8c8c8 size 12 type median color 9696ff size 20 type max color ff0000 size 25 ]
An array of objects that define points on the data scale
Each point is an object with a type attribute Types can be lsquominrsquo lsquomaxrsquo lsquomeanrsquo lsquoQ1rsquo (firstquartile) lsquomedianrsquo lsquoQ3rsquo (third quartile) or lsquovaluersquo Each point can have a color attributethat specifies a color with a string (any CSS color specification is allowed including hexrgb and rgba) Each point can have a size attirbute that specifies a reaction thickness as anumber Finally points with type lsquovaluersquo can have a value attribute that specifies an exactnumber for pont in the scale
NOTE If lsquominrsquo or lsquomaxrsquo is not provided Escher automatically adds them To be com-pletely clear about what you expect to see on the map it is best to provide lsquominrsquo andlsquomaxrsquo in addition to other scale points
Here are examples of each type
type rsquominrsquo color rsquoredrsquo size 12 Specifies that reactionsnear the minimum value are red and have thickness 12
type rsquoQ1rsquo color rsquorgba(100 100 50 05)rsquo size 12 Specifies that reactions near the first quartile have the given color opacity andthickness
type rsquomeanrsquo color rsquorgb(100 100 50)rsquo size 50 Specifies that reactions near the mean value have the given color and thickness
type rsquovaluersquo value 85 color rsquo333rsquo size 50 Specifies that reactions near 85 value have the given color and size
optionsreaction_no_data_color(Default rsquodcdcdcrsquo) The color of reactions with no data value
optionsreaction_no_data_size(Default 8) The size of reactions with no data value
optionsgene_data(Default null) An object with Gene ids for keys and gene data points for values
78 JavaScript API 41
Escher Documentation Release 143
optionsand_method_in_gene_reaction_rule(Default mean) When evaluating a gene reaction rule use this function to evaluate ANDrules Can be lsquomeanrsquo or lsquominrsquo
optionsmetabolite_data(Default null) An object with metabolite ids for keys and metabolite data points forvalues
optionsmetabolite_stylesDefault [rsquocolorrsquo rsquosizersquo rsquotextrsquo]
An array of style types The array can contain any of the following lsquocolorrsquo lsquosizersquo lsquotextrsquolsquoabsrsquo The lsquocolorrsquo style means that the metabolites will be colored according to the loadeddataset The lsquosizersquo style means that the metabolites will be sized according to the loadeddataset The lsquotextrsquo style means that the data values will be displayed in the metabolitelabels The lsquoabsrsquo style means the the absolute values of metabolite values will be used fordata visualization
optionsmetabolite_compare_style(Default rsquodiffrsquo) How to compare to datasets Can be either lsquofoldrsquo lsquolog2_foldrsquo orlsquodiffrsquo
optionsmetabolite_scaleDefault
[ type min color fffaf0 size 20 type median color f1c470 size 30 type max color 800000 size 40 ]
An array of objects that define points on the data scale See the description of op-tionsreaction_scale for an explanation of the format
optionsmetabolite_no_data_color(Default rsquoffffffrsquo) The color of metabolites with no data value
optionsmetabolite_no_data_size(Default 10) The size of metabolites with no data value
View and build options
optionsidentifiers_on_map(Default rsquobigg_idrsquo) The identifiers that will be displayed in reaction metabolite andgene labels Can be lsquobigg_idrsquo or lsquonamersquo
optionshighlight_missing(Default false) If true then highlight in red reactions that are not in the loaded COBRAmodel
optionsallow_building_duplicate_reactions(Default true) If true then building duplicate reactions is allowed If false then dupli-cate reactions are hidden in Add reaction mode
optionscofactors(Default [rsquoatprsquo rsquoadprsquo rsquonadrsquo rsquonadhrsquo rsquonadprsquo rsquonadphrsquorsquogtprsquo rsquogdprsquo rsquohrsquo rsquocoarsquo rsquoumprsquo rsquoh20rsquo rsquoppirsquo]) A list of metabo-lite IDs to treat as cofactors These will be secondary metabolites in new reactions
Callbacks
optionsfirst_load_callbackA function to run after loading the Builder
42 Chapter 7 Contents
Escher Documentation Release 143
load_map(map_data[ should_update_data])Load a map for the loaded data Also reloads most of the Builder content
Arguments
bull map_data ndash The data for a map
bull should_update_data (Boolean) ndash (Default true) Whether data should be ap-plied to the map
load_model(model_data[ should_update_data])Load the cobra model from model data
Arguments
bull model_data ndash The data for a Cobra model (Parsing in done by escherCobraModel)
bull should_update_data (Boolean) ndash (Default true) Whether data should be ap-plied to the model
view_mode()Enter view mode
build_mode()Enter build mode
brush_mode()Enter brush mode
zoom_mode()Enter zoom mode
rotate_mode()Enter rotate mode
text_mode()Enter text mode
set_reaction_data(data)
Arguments
bull data (array) ndash An array of 1 or 2 objects where each object has keys that are reactionIDrsquos and values that are data points (numbers)
set_metabolite_data(data)
Arguments
bull data (array) ndash An array of 1 or 2 objects where each object has keys that are metaboliteIDrsquos and values that are data points (numbers)
set_gene_data(data clear_gene_reaction_rules)
Arguments
bull data (array) ndash An array of 1 or 2 objects where each object has keys that are gene IDrsquosand values that are data points (numbers)
Arguments
bull clear_gene_reaction_rules (Boolean) ndash (Optional Default false) In addi-tion to setting the data also turn of the gene_reaction_rules
78 JavaScript API 43
Escher Documentation Release 143
79 Python API
class escherBuilder(map_name=None map_json=None model=None model_name=Nonemodel_json=None embedded_css=None reaction_data=None metabo-lite_data=None gene_data=None local_host=None id=None safe=Falsekwargs)
A metabolic map that can be viewed edited and used to visualize data
This map will also show metabolic fluxes passed in during consruction It can be viewed as a standalone htmlinside a browswer Alternately the respresentation inside an IPython notebook will also display the map
Maps are stored in json files and are stored in a cache directory Maps which are not found will be downloadedfrom a map repository if found
Parameters
bull map_name ndash A string specifying a map to be downloaded from the Escher web server orloaded from the cache
bull map_json ndash A JSON string or a file path to a JSON file or a URL specifying a JSON fileto be downloaded
bull model ndash A Cobra model
bull model_name ndash A string specifying a model to be downloaded from the Escher web serveror loaded from the cache
bull model_json ndash A JSON string or a file path to a JSON file or a URL specifying a JSONfile to be downloaded
bull embedded_css ndash The CSS (as a string) to be embedded with the Escher SVG
bull reaction_data ndash A dictionary with keys that correspond to reaction ids and values thatwill be mapped to reaction arrows and labels
bull metabolite_data ndash A dictionary with keys that correspond to metabolite ids and valuesthat will be mapped to metabolite nodes and labels
bull gene_data ndash A dictionary with keys that correspond to gene ids and values that will bemapped to corresponding reactions
bull local_host ndash A hostname that will be used for any local files This is generally usedfor using the notebook offline and for testing in the IPython Notebook with modified Eschercode An example value for local_host is lsquohttplocalhost7778lsquo
bull id ndash Specify an id to make the javascript data definitions unique A random id is chosen bydefault
bull safe ndash If True then loading files from the filesytem is not allowed This is to ensure thesafety of using Builder within a web server
Keyword Arguments
These are defined in the Javascript API
bulluse_3d_transform
bullenable_search
bullfill_screen
bullzoom_to_element
bullfull_screen_button
44 Chapter 7 Contents
Escher Documentation Release 143
bullstarting_reaction
bullunique_map_id
bullprimary_metabolite_radius
bullsecondary_metabolite_radius
bullmarker_radius
bullgene_font_size
bullhide_secondary_metabolites
bullshow_gene_reaction_rules
bullhide_all_labels
bullreaction_styles
bullreaction_compare_style
bullreaction_scale
bullreaction_no_data_color
bullreaction_no_data_size
bulland_method_in_gene_reaction_rule
bullmetabolite_styles
bullmetabolite_compare_style
bullmetabolite_scale
bullmetabolite_no_data_color
bullmetabolite_no_data_size
bullidentifiers_on_map
bullhighlight_missing
bullallow_building_duplicate_reactions
bullcofactors
All keyword arguments can also be set on an existing Builder object using setter functions eg
my_builderset_reaction_styles(new_styles)
display_in_browser(ip=lsquo127001rsquo port=7655 n_retries=50 js_source=rsquowebrsquo menu=rsquoallrsquoscroll_behavior=rsquopanrsquo enable_editing=True enable_keys=True mini-fied_js=True never_ask_before_quit=False)
Launch a web browser to view the map
Parameters
bull ip ndash The IP address to serve the map on
bull port ndash The port to serve the map on If specified the port is occupied then a random freeport will be used
bull n_retries (int) ndash The number of times the server will try to find a port before quitting
bull js_source (string) ndash Can be one of the following
ndash web (Default) - Use JavaScript files from eschergithubio
79 Python API 45
Escher Documentation Release 143
ndash local - Use compiled JavaScript files in the local Escher installation Works offline
ndash dev - No longer necessary with source maps This now gives the same behavior aslsquolocalrsquo
bull menu (string) ndash Menu bar options include
ndash none - No menu or buttons
ndash zoom - Just zoom buttons
ndash all (Default) - Menu and button bar (requires Bootstrap)
bull scroll_behavior (string) ndash Scroll behavior options
ndash pan - Pan the map
ndash zoom - Zoom the map
ndash none (Default) - No scroll events
bull enable_editing (Boolean) ndash Enable the map editing modes
bull enable_keys (Boolean) ndash Enable keyboard shortcuts
bull minified_js (Boolean) ndash If True use the minified version of JavaScript and CSSfiles
bull never_ask_before_quit (Boolean) ndash Never display an alert asking if you wantto leave the page By default this message is displayed if enable_editing is True
display_in_notebook(js_source=rsquowebrsquo menu=rsquozoomrsquo scroll_behavior=rsquononersquo mini-fied_js=True height=500 enable_editing=False)
Embed the Map within the current IPython Notebook
Parameters
bull js_source (string) ndash Can be one of the following
ndash web (Default) - Use JavaScript files from eschergithubio
ndash local - Use compiled JavaScript files in the local Escher installation Works offline
ndash dev - No longer necessary with source maps This now gives the same behav-ior as lsquolocalrsquo
bull menu (string) ndash Menu bar options include
ndash none - No menu or buttons
ndash zoom - Just zoom buttons
ndash Note The all menu option does not work in an IPython notebook
bull scroll_behavior (string) ndash Scroll behavior options
ndash pan - Pan the map
ndash zoom - Zoom the map
ndash none - (Default) No scroll events
bull minified_js (Boolean) ndash If True use the minified version of JavaScript andCSS files
bull height ndash Height of the HTML container
bull enable_editing (Boolean) ndash Enable the map editing modes
46 Chapter 7 Contents
Escher Documentation Release 143
save_html(filepath=None overwrite=False js_source=rsquowebrsquo protocol=rsquohttpsrsquo menu=rsquoallrsquoscroll_behavior=rsquopanrsquo enable_editing=True enable_keys=True minified_js=Truenever_ask_before_quit=False static_site_index_json=None)
Save an HTML file containing the map
Parameters
bull filepath (string) ndash The HTML file will be saved to this location Whenjs_source is lsquolocalrsquo then a new directory will be created with this name
bull overwrite (Boolean) ndash Overwrite existing files
bull js_source (string) ndash Can be one of the following
ndash web (Default) - Use JavaScript files from eschergithubio
ndash local - Use compiled JavaScript files in the local Escher installation Works of-fline To make the dependencies available to the downloaded file a new directorywill be made with the name specified by filepath
ndash dev - No longer necessary with source maps This now gives the same behav-ior as lsquolocalrsquo
bull protocol (string) ndash The protocol can be lsquohttprsquo lsquohttpsrsquo or None which indicatesa lsquoprotocol relative URLrsquo as in eschergithubio Ignored if source is local
bull menu (string) ndash Menu bar options include
ndash none - No menu or buttons
ndash zoom - Just zoom buttons
ndash all (Default) - Menu and button bar (requires Bootstrap)
bull scroll_behavior (string) ndash Scroll behavior options
ndash pan - Pan the map
ndash zoom - Zoom the map
ndash none (Default) - No scroll events
bull enable_editing (Boolean) ndash Enable the map editing modes
bull enable_keys (Boolean) ndash Enable keyboard shortcuts
bull minified_js (Boolean) ndash If True use the minified version of JavaScript andCSS files
bull height (number) ndash Height of the HTML container
bull never_ask_before_quit (Boolean) ndash Never display an alert asking if youwant to leave the page By default this message is displayed if enable_editing isTrue
bull static_site_index_json (string) ndash The index as a JSON string for thestatic site Use javascript to parse the URL options Used for generating static pages(see static_sitepy)
791 Cache
escherget_cache_dir(versioned=True name=None)Get the cache dir as a string and make the directory if it does not already exist
Parameters
79 Python API 47
Escher Documentation Release 143
bull versioned (Boolean) ndash Whether to return the versioned path in the cache Eschermaps for the latest version of Escher are found in the versioned directory (versioned= True) but maps for previous versions of Escher can be found by visiting the parentdirectory (versioned = False)
bull name (string) ndash An optional subdirectory within the cache If versioned is False thenname is ignored
escherclear_cache(different_cache_dir=None ask=True)Empty the contents of the cache directory including all versions of all maps and models
Parameters
bull different_cache_dir (string) ndash (Optional) The directory of another cacheThis is mainly for testing
bull ask (Boolean) ndash Whether to ask before deleting
escherlist_cached_maps()Return a list of all cached maps
escherlist_cached_models()Return a list of all cached models
escherlist_available_maps()Return a list of all maps available on the server
escherlist_available_models()Return a list of all models available on the server
710 License
Escher and EscherConverter are distributed under the MIT license
bull genindex
48 Chapter 7 Contents
Python Module Index
eescher 44
49
Escher Documentation Release 143
50 Python Module Index
Index
Bbrush_mode() (built-in function) 43build_mode() (built-in function) 43Builder (class in escher) 44
Cclear_cache() (in module escher) 48
Ddisplay_in_browser() (escherBuilder method) 45display_in_notebook() (escherBuilder method) 46
Eescher (module) 44escherBuilder() (class) 39
Gget_cache_dir() (in module escher) 47
Llist_available_maps() (in module escher) 48list_available_models() (in module escher) 48list_cached_maps() (in module escher) 48list_cached_models() (in module escher) 48load_map() (built-in function) 42load_model() (built-in function) 43
Ooptionenable_keys (option attribute) 40optionsallow_building_duplicate_reactions (options at-
tribute) 42optionsand_method_in_gene_reaction_rule (options at-
tribute) 41optionscofactors (options attribute) 42optionsenable_editing (options attribute) 39optionsenable_search (options attribute) 40optionsfill_screen (options attribute) 40optionsfirst_load_callback (options attribute) 42optionsfull_screen_button (options attribute) 40optionsgene_data (options attribute) 41
optionsgene_font_size (options attribute) 40optionshide_all_labels (options attribute) 40optionshide_secondary_metabolites (options attribute)
40optionshighlight_missing (options attribute) 42optionsidentifiers_on_map (options attribute) 42optionsignore_bootstrap (options attribute) 40optionsmarker_radius (options attribute) 40optionsmenu (options attribute) 39optionsmetabolite_compare_style (options attribute) 42optionsmetabolite_data (options attribute) 42optionsmetabolite_no_data_color (options attribute) 42optionsmetabolite_no_data_size (options attribute) 42optionsmetabolite_scale (options attribute) 42optionsmetabolite_styles (options attribute) 42optionsnever_ask_before_quit (options attribute) 40optionsprimary_metabolite_radius (options attribute) 40optionsreaction_compare_style (options attribute) 41optionsreaction_data (options attribute) 40optionsreaction_no_data_color (options attribute) 41optionsreaction_no_data_size (options attribute) 41optionsreaction_scale (options attribute) 41optionsreaction_styles (options attribute) 41optionsscroll_behavior (options attribute) 39optionssecondary_metabolite_radius (options attribute)
40optionsshow_gene_reaction_rules (options attribute) 40optionsstarting_reaction (options attribute) 40optionsunique_map_id (options attribute) 40optionsuse_3d_transform (options attribute) 39
Rrotate_mode() (built-in function) 43
Ssave_html() (escherBuilder method) 46set_gene_data() (built-in function) 43set_metabolite_data() (built-in function) 43set_reaction_data() (built-in function) 43
51
Escher Documentation Release 143
Ttext_mode() (built-in function) 43
Vview_mode() (built-in function) 43
Zzoom_mode() (built-in function) 43
52 Index
Escher Documentation Release 143
iMM904Amino acid biosynthesisjson
5 (Optional) Once you have a set of subsystem maps you can set up a local Escher server so that subsystem mapsappear in the ldquoquick jumprdquo menu in the bottom right corner of the screen (as seen here for iJO1366) To setthis up you will need to start a local server as describe in Running the local server Next find your local cachedirectory by running this command in a terminal
python -c import escher print(escherget_cache_dir(name=maps))
This will print the location of the local maps cache Add your new subsystem maps to cache folder Now whenyou run the server (described in Running the local server) you should see that quick jump menu appear
NOTE The cache directory is organized into folders for organisms You can use these folder for filtering byorganism on the local launch page or you can place the maps in the top directory
NOTE 2 A similar approach can be used to access your models from the local launch page Place maps in thefolder indicated by
python -c import escher print(escherget_cache_dir(name=models))
752 Building from an existing map for a similar organism
Follow the instruction above except rather than starting from scratch load an existing Escher map for a differentorganism
Once you have the new model loaded use the Update names and gene reaction rules using model button in theModel menu to convert all descriptive names and gene reaction rules in the model to those in the map Reactions thatdo not match the model will be highlighted in red (This can be turned off again in the settings menu by deselectingHighlight reactions not in model)
Now visit each highlighted reaction and see if you can replace it with an equivalent biochemical pathway from themodel If not then delete the reaction and move on
Finally when there are no highlighted reactions left you can repeat this for other subsystems
753 Submitting maps to the Escher website
If you would like to contribute maps to Escher you can make a Pull Request to the GitHub repository eschergithubioMake sure there is a folder with the name of the organism in 1-0-0maps For example a new yeast map goes inthe folder
1-0-0mapsSaccharomyces cerevisiae
Then name your map by concatenating the model ID and the map name separated by a period For example a yeastmap built with the genome-scale model iMM904 could be named
iMM904Amino acid biosynthesisjson
Then add the JSON file for the model to the Pull Request if that model is not already available As before make afolder for your organism within 1-0-0models The model filename is just the model ID
In this example a correct Pull Request would include the following files
1-0-0mapsSaccharomyces cerevisiaeiMM904Amino acid biosynthesisjson1-0-0modelsSaccharomyces cerevisiaeiMM904json
30 Chapter 7 Contents
Escher Documentation Release 143
76 Developing with Escher
761 Using the static JavaScript and CSS files
You can include the compiled Escher JavaScript and CSS files in any HTML document The only dependencies ared3js and optionally Twitter Bootstrap if you are using the option menu=rsquoallrsquo
The compiled files are available form npmcdn
httpsnpmcdncomescher-visjsdistescherjshttpsnpmcdncomescher-visjsdistescherminjshttpsnpmcdncomescher-viscssdistbuildercsshttpsnpmcdncomescher-viscssdistbuildermincss
Source maps are also hosted there
httpsnpmcdncomescher-visjsdistescherjsmaphttpsnpmcdncomescher-visjsdistescherminjsmaphttpsnpmcdncomescher-viscssdistbuildermincssmap
If you want a particular version of escher add a version tag like this
httpsnpmcdncomescher-vis140-beta3jsdistescherjs
For an example of the boilerplate code that is required to begin developing with Escher have a look at the escher-demorepository For projects built with npm use the escher-test repository as a guide
762 Building and testing Escher
First install dependencies with npm
npm install
Escher uses grunt to manage the build process To run typical build steps just run
npm run compile
To test the JavaScript files run
npm run test
For Python testing run this in the py directory
python setuppy test
Build the static website
python setuppy build_gh
Clear static website files
python setuppy clean
Build and run the docs
cd docsmake htmlcd _buildhtml
76 Developing with Escher 31
Escher Documentation Release 143
python -m SimpleHTTPServer python 2python -m httpserver python 3
763 Generating and reading Escher and COBRA files
The Escher file format
Escher layouts are defined by JSON files that follow a specific schema using json schema The latest schemafor Escher JSON files is here The Escher schemas are versioned with inspiration from SchemaVer Theeschervalidate module can be used to validate models against the schema
The Escher layout schema is designed to be as simple as possible For example the core metabolism map of Es-cherichia coli is layed out like this
[
map_name E coli coreCore metabolismmap_id 2938hoq32a1map_description E coli core metabolic networknLast Modified Fri Dec 05 2014 163944 GMT-0800 (PST)homepage httpseschergithubioschema httpseschergithubioescherjsonschema1-0-0
reactions nodes text_label canvas
x 7857062530517567y 31436893920898433width 5894515691375733height 4860457037353515
]
The map_name includes the model that was used to build this layout followed by a period and then a readable namefor the map The map_id is a unique identifier for this map The map_description describes the map and thelast time it was modified Both the homepage and the schema entries must have exactly these values for the Eschermap to be valid
In the next section the reactions nodes labels and canvas are all defined For reactions nodes and text labels eachelement has a key that is an arbitrary integer As long as there are no repeated IDs (eg no 2 segments with the ID517) then everything should work fine
Read through the schema (here) for more detail on the format
The COBRA file format
COBRA models are also saved as JSON files This format has not been documented with a schema but you canbrowse through the core metabolism model as a guide to generating valid COBRA models
I still need help
If you are interested in developing with Escher and you need more information than what is provided in the documen-tation please contact Zachary King (zaking-AT-ucsd-DOT-edu)
32 Chapter 7 Contents
Escher Documentation Release 143
77 EscherConverter
EscherConverter is a standalone program that reads files created with the graphical network editor Escher and convertsthem to files in community standard formats
Download EscherConverter 05 (137 MB)
771 Using EscherConverter
Escher uses a JSON file format to represent its networks This format has been developed because of its very small filesize and its compatibility to online programs that are written in JavaScript In particular JSON is a JavaScript ObjectNotation or in other words a JSON file directly represents components of JavaScript programs This makes parsingvery simple and allows direct use of those files in web-based programs
However in systems biology specific file formats have been developed with the aim to be easily exchangeable betweensoftware implemented in diverse programming languages
To this end these formats support semantically clear annotations and are maintained by a large community of scientistsEscherConverter supports export to two particularly important XML-based community file formats SBML with layoutextension and SBGN-ML
While SBML has been mainly developed for dynamic simulation of biological networks it is nowadays also usablefor diverse other purposes Its layout extension facilitates the encoding the display of biological networks
SBGN-ML has been directly developed as a language for the display of biological pathway maps of diverse kinds Itstores the position and connection of entities similar to what is shown in Escher networks
EscherConverter takes Escherrsquos JSON files as input and generates equivalent SBML Level 3 Version 1 files with layoutextension or SBGN-ML files
In order to ensure that the conversion is correct EscherConverter provides its own display that gives users a previewof how the export data format will be rendered by other tools In this preview display you can zoom in and out movearcs and node positions However it is important to know that none of the changes made in this preview are stored inthe export file
Download and Installation
You can obtain local copy of EscherConverter by clicking here
As a Javatrade application no specific installation is required for EscherConverter
However make sure you have a recent Javatrade Runtime Environment (JRE) installed on your computer (at least JRE8) You can obtain Javatrade from the Oracle website There you can also find installation instructions for your respectiveoperating system
Once Javatrade has been installed you can simply place the EscherConverter JAR file somewhere on your local computerfor instance in the folder
bull Applications if you are working under Mac OS
77 EscherConverter 33
Escher Documentation Release 143
bull opt for Linux computers
bull CProgram Files if you are using Windows
Launching the program
You can launch EscherConverter simply by double-clicking on the application JAR file This will open a followinggraphical user interface as described in the following figures
Figure 1 | The graphical user interface of EscherConverter
bull Preferences opens a settings dialog (see next screenshot)
bull Open displays a file chooser to select an input file in JSON format
bull Save export the map that is displayed in the current tab to SBML or SBGN-ML
bull Discard closes the current tab without saving
bull Help opens the online help that displays all command-line options
bull License displays the license under which this software is distributed
bull About shows information about the authors of this software
bull Main the main panel of the software in which converted Escher maps will be displayed organized in tabs
bull Status the status bar shows information and logging messages during the conversion
34 Chapter 7 Contents
Escher Documentation Release 143
Figure 2 | The preferences dialog All settings in this dialog are also available through EscherConverterrsquos command-line interface
Layout section several properties that are required in SBML and SBGN-ML are not explicitly specified in EscherrsquosJSON format and therefore need to be adjusted by the user These are the size of the drawing canvas the default boxsize for text labels the size of primary and secondary nodes In contrast to SBGN-ML and Escherrsquos JSON formatthe SBML layout extension supports three-dimensional displays When selecting this export file format it is thereforenecessary to also define the z-coordinate and the depth of all objects
Components and naming section Most settings in this section are specific for the SBML layout extension and areonly active if this output format is selected These are names and identifiers of the layout component and the in caseof SBML mandatory default compartment (a compartment without physical meaning a reaction space in which allmetabolites are located) EscherConverter can infer compartment bounds from metabolites but this is an experimentalfeature Just try it and see how the preview changes
77 EscherConverter 35
Escher Documentation Release 143
Figure 3 | A layout preview
The birds-eye view and the navigation component on the left help you navigate through the network display Thisgraph shows you how the converted pathway map will be rendered by software that supports SBGN-ML or the SBMLlayout extension This preview can be modified by moving arcs or nodes however none of those changes are storedwhen exporting the file In this current version EscherConver only exports layouts as given in the original JSON file
Included third-party software
EscherConverter includes several third-party libraries which we here list and acknowledge
bull ArgParser
bull JSBML
bull libSBGN
bull Pixel-Mixer icons
bull yFiles
772 Command-line interface API
You can launch EscherConverter from the command-line On a Unix system (such as Linux MacOS or Solaris etc)use a command like
bash$ java -jar -Xms8G -Xmx8G -Duserlanguage=en EscherConverter-05jar [options]
Under Window use a command like
Cgt javaw -jar -Xms8G -Xmx8G -Duserlanguage=en EscherConverter-05jar [options]
Escher has a large collection of command-line options (see below) which can be useful if you want to launch theprogram with specific settings or if multiple files are to be converted in a batch mode It is even possible to completelydisable the graphical user interface
36 Chapter 7 Contents
Escher Documentation Release 143
Input and output files
Definition of input and output data files as well as the format for the output
--input=ltFilegt
Specifies the JSON input file If a directory is given the conversion will be recursively performed Accepts JSON
--output=ltFilegt
The path to the file into which the output should be written If the input is a directory this must also be a directory inorder to perform a recursive conversion Accepts SBML SBGN
Escher layout
The options in this group allow you to influence how large certain elements should be displayed
--canvas-default-height=ltDoublegt
Just as in the case of the width of the canvas this value needs to be specified for cases where the JSON input file lacksan explicit specification of the canvas height Arguments must fit into the range [11E9] (Default value 2500)
--canvas-default-width=ltDoublegt
This value is used when no width has been defined for the canvas Since the width attribute is mandatory for the layouta default value must be provided in these cases Arguments must fit into the range [11E9] (Default value 2500)
--label-height=ltDoublegt
With this option you can specify the height of the bounding box of text labels Arguments must fit into the range[11E9] (Default value 500)
--label-width=ltDoublegt
This option defines the width of bounding boxes for text labels Arguments must fit into the range [11E9] (Defaultvalue 1600)
--node-depth=ltDoublegt
The length of nodes along z-coordinate Escher maps are actually two-dimensional but in general a layout can bethree-dimensional This value should be an arbitrary value greater than zero because some rendering engines mightnot display the node if its depth is zero Arguments must fit into the range [11E9] (Default value 10)
--node-label-height=ltDoublegt
Node labels can have a size different from general labels in the graph Here you can specify how height the boundingbox of the labels for nodes should be Arguments must fit into the range [11E9] (Default value 200)
--primary-node-height=ltDoublegt
The primary node should be bigger than the secondary node With this option you can specify the height of this typeof nodes Arguments must fit into the range [11E9] (Default value 300)
--primary-node-width=ltDoublegt
Escher maps distinguish between primary and secondary nodes Primary nodes should be larger than secondary nodesand display the main flow of matter through the network This option allows you to specify the width of primarynodes Arguments must fit into the range [11E9] (Default value 300)
77 EscherConverter 37
Escher Documentation Release 143
--reaction-label-height=ltDoublegt
Reaction label heightArguments must fit into the range [11E9] (Default value 300)
--reaction-node-ratio=ltDoublegt
This value is used as a conversion factor to determine the size of the reaction display box depending on the size ofprimary nodes Height and width of reaction nodes are determined by dividing the corresponding values from theprimary node size by this factor Arguments must fit into the range [01] (Default value 05)
--secondary-node-ratio=ltDoublegt
Similar to the reaction node ratio the size of secondary nodes (width and height) is determined by dividing thecorresponding values from the primary nodes by this value Arguments must fit into the range [01] (Default value06666666666666666)
--z=ltDoublegt
The position on the z-axis where the entire two-dimensional graph should be drawn Arguments must fit into the range[-1E91E9] (Default value 00)
Escher Components and their naming
Here you can influence which elements are to be included in the layout and how elements in the layout are to be calledor identified
--format=ltOutputFormatgt
The desired format for the conversion eg SBML All possible values for type ltOutputFormatgt are SBGN andSBML (Default value SBML)
--layout-id=ltStringgt
In contrast to the name this identifier does not have to be human-readable This is a machine identifier which muststart with a letter or underscore and can only contain ASCII characters (Default value Escher_Layout)
--layout-name=ltStringgt
This should be a human-readable name for the layout that is to be created This name might be displayed to describethe figure and should therefore be explanatory (Default value Escher Layout)
--compartment-id=ltStringgt
A compartment needs to have a unique identifier which needs to be a machine-readable Sting that must start with aletter or underscore and can only contain ASCII characters Since the JSON file does not provide this information thisoption allows you to specify the required identifier (Default value default)
--compartment-name=ltStringgt
With this option it is possible to define a name for the default compartment can be that needs to be generated for theconversion to SBML The name does not have any restrictions ie any UTF-8 character can be used (Default valueDefault compartment)
--infer-compartment-bounds
This converter can infer where the boundaries of compartments could be drawn To this end it uses each nodersquos BiGGids to identify the compartment of all metabolites Assuming that compartments have rectangular shapes the algorithmcan find the outermost node on each side of the box and hence obtain the boundaries of the compartment However
38 Chapter 7 Contents
Escher Documentation Release 143
this methods will fail when metabolites are drawn inside of such a box that belong to a different compartment that isactually further outside For this reason this option is deactivated by default (Default value false)
Options for the graphical user interface
--gui
If this option is given the program will display its graphical user interface (Default value false)
--log-level=ltStringgt
Change the log-level of this application This option will influence how fine-grained error and other log messages willbe that you receive while executing this program All possible values for type ltStringgt are ALL CONFIG FINEFINER FINEST INFO OFF SEVERE and WARNING (Default value INFO)
--log-file=ltFilegt
This option allows you to specify a log file to which all information of the program will be written Accepts (bp2bp3 log owl xml)
78 JavaScript API
class escherBuilder(map_data model_data embedded_css selection options)A Builder object contains all the UI and logic to generate a map builder or viewer
Arguments
bull map_data (object) ndash The data for a map to be passed to escherMapfrom_data() Ifnull then an empty Builder is initialized
bull model_data (object) ndash The data for a cobra model to be passed to es-cherCobraModel() Can be null
bull embedded_css (string) ndash The stylesheet for the SVG elements in the Escher map
bull selection (object) ndash (Optional Default In the body element) The d3 selection of anelement to place the Builder into The selection cannot be inside an SVG element
bull options (object) ndash (Optional) An object defining any of the following options
optionsmenu(Default rsquoallrsquo) The type of menu that will be displayed Can be lsquoallrsquo for the fullmenu or lsquozoomrsquo for just zoom buttons The lsquoallrsquo option requires the full set of Escherdependencies (D3js JQuery and Bootstrap) while the lsquozoomrsquo option requires only D3jsFor more details see Developing with Escher
optionsscroll_behavior(Default rsquopanrsquo) This option determines the effect that the scroll wheel will have onan Escher map Can be lsquopanrsquo to pan the map or lsquozoomrsquo to zoom the map when the usermoves the scroll wheel
optionsuse_3d_transform(Default Chooses a good option by testing the browser) If true then use CSS3 3D trans-forms to speed up panning and zooming This feature will only work on browsers thatsupport the 3D transforms It works best in the latest versions of Chrome Firefox andInternet Explorer Safari works better with this turned off
78 JavaScript API 39
Escher Documentation Release 143
optionsenable_editing(Default true) If true then display the map editing functions If false then hide themand only allow the user to view the map
optionenable_keys(Default true) If true then enable keyboard shortcuts
optionsenable_search(Default true) If true then enable indexing of the map for search Use false to disablesearching and potentially improve the map performance
optionsfill_screen(Default false) Use true to fill the screen when an Escher Builder is placed in a top-level container (eg a div in the body element)
optionsfull_screen_button(Default false) Include a button in the user interface for entering full screen mode
optionsignore_bootstrap(Default false) Do not use Bootstrap for buttons even if it available This is used toembed Escher in a Jupyter notebook where it conflicts with the Jupyter Boostrap installa-tion
Map model and styles
optionsstarting_reaction(Default null) The ID (as a string) of a reaction to draw when the Builder loads
optionsnever_ask_before_quit(Default false) If false then display a warning before the user closes an Eschermap If true then never display the warning This options is only respected if op-tionsenable_editing == true If enable_editing is false then the warnings are not dis-played
optionsunique_map_id(Default null) A unique ID that will be used to UI elements donrsquot interfere whenmultiple maps are in the same HTML document
optionsprimary_metabolite_radius(Default 15) The radius of primary metabolites in px
optionssecondary_metabolite_radius(Default 10) The radius of secondary metabolites in px
optionsmarker_radius(Default 5) The radius of marker nodes in px
optionsgene_font_size(Default 18) The font size of the gene reaction rules in px
optionshide_secondary_metabolites(Default false) If true then secondary nodes and segments are hidden This is conve-nient for generating simplified map figures
optionsshow_gene_reaction_rules(Default false) If true then show the gene reaction rules even without gene data
optionshide_all_labels(Default false) If checked hide all reaction gene and metabolite labels
Applied data
40 Chapter 7 Contents
Escher Documentation Release 143
optionsreaction_data(Default null) An object with reaction ids for keys and reaction data points for values
optionsreaction_stylesDefault [rsquocolorrsquo rsquosizersquo rsquotextrsquo]
An array of style types The array can contain any of the following lsquocolorrsquo lsquosizersquo lsquotextrsquolsquoabsrsquo The lsquocolorrsquo style means that the reactions will be colored according to the loadeddataset The lsquosizersquo style means that the reactions will be sized according to the loadeddataset The lsquotextrsquo style means that the data values will be displayed in the reactionlabels The lsquoabsrsquo style means the the absolute values of reaction values will be used fordata visualization
optionsreaction_compare_style(Default rsquodiffrsquo) How to compare to datasets Can be either lsquofold lsquolog2_foldrsquo orlsquodiffrsquo
optionsreaction_scaleDefault
[ type min color c8c8c8 size 12 type median color 9696ff size 20 type max color ff0000 size 25 ]
An array of objects that define points on the data scale
Each point is an object with a type attribute Types can be lsquominrsquo lsquomaxrsquo lsquomeanrsquo lsquoQ1rsquo (firstquartile) lsquomedianrsquo lsquoQ3rsquo (third quartile) or lsquovaluersquo Each point can have a color attributethat specifies a color with a string (any CSS color specification is allowed including hexrgb and rgba) Each point can have a size attirbute that specifies a reaction thickness as anumber Finally points with type lsquovaluersquo can have a value attribute that specifies an exactnumber for pont in the scale
NOTE If lsquominrsquo or lsquomaxrsquo is not provided Escher automatically adds them To be com-pletely clear about what you expect to see on the map it is best to provide lsquominrsquo andlsquomaxrsquo in addition to other scale points
Here are examples of each type
type rsquominrsquo color rsquoredrsquo size 12 Specifies that reactionsnear the minimum value are red and have thickness 12
type rsquoQ1rsquo color rsquorgba(100 100 50 05)rsquo size 12 Specifies that reactions near the first quartile have the given color opacity andthickness
type rsquomeanrsquo color rsquorgb(100 100 50)rsquo size 50 Specifies that reactions near the mean value have the given color and thickness
type rsquovaluersquo value 85 color rsquo333rsquo size 50 Specifies that reactions near 85 value have the given color and size
optionsreaction_no_data_color(Default rsquodcdcdcrsquo) The color of reactions with no data value
optionsreaction_no_data_size(Default 8) The size of reactions with no data value
optionsgene_data(Default null) An object with Gene ids for keys and gene data points for values
78 JavaScript API 41
Escher Documentation Release 143
optionsand_method_in_gene_reaction_rule(Default mean) When evaluating a gene reaction rule use this function to evaluate ANDrules Can be lsquomeanrsquo or lsquominrsquo
optionsmetabolite_data(Default null) An object with metabolite ids for keys and metabolite data points forvalues
optionsmetabolite_stylesDefault [rsquocolorrsquo rsquosizersquo rsquotextrsquo]
An array of style types The array can contain any of the following lsquocolorrsquo lsquosizersquo lsquotextrsquolsquoabsrsquo The lsquocolorrsquo style means that the metabolites will be colored according to the loadeddataset The lsquosizersquo style means that the metabolites will be sized according to the loadeddataset The lsquotextrsquo style means that the data values will be displayed in the metabolitelabels The lsquoabsrsquo style means the the absolute values of metabolite values will be used fordata visualization
optionsmetabolite_compare_style(Default rsquodiffrsquo) How to compare to datasets Can be either lsquofoldrsquo lsquolog2_foldrsquo orlsquodiffrsquo
optionsmetabolite_scaleDefault
[ type min color fffaf0 size 20 type median color f1c470 size 30 type max color 800000 size 40 ]
An array of objects that define points on the data scale See the description of op-tionsreaction_scale for an explanation of the format
optionsmetabolite_no_data_color(Default rsquoffffffrsquo) The color of metabolites with no data value
optionsmetabolite_no_data_size(Default 10) The size of metabolites with no data value
View and build options
optionsidentifiers_on_map(Default rsquobigg_idrsquo) The identifiers that will be displayed in reaction metabolite andgene labels Can be lsquobigg_idrsquo or lsquonamersquo
optionshighlight_missing(Default false) If true then highlight in red reactions that are not in the loaded COBRAmodel
optionsallow_building_duplicate_reactions(Default true) If true then building duplicate reactions is allowed If false then dupli-cate reactions are hidden in Add reaction mode
optionscofactors(Default [rsquoatprsquo rsquoadprsquo rsquonadrsquo rsquonadhrsquo rsquonadprsquo rsquonadphrsquorsquogtprsquo rsquogdprsquo rsquohrsquo rsquocoarsquo rsquoumprsquo rsquoh20rsquo rsquoppirsquo]) A list of metabo-lite IDs to treat as cofactors These will be secondary metabolites in new reactions
Callbacks
optionsfirst_load_callbackA function to run after loading the Builder
42 Chapter 7 Contents
Escher Documentation Release 143
load_map(map_data[ should_update_data])Load a map for the loaded data Also reloads most of the Builder content
Arguments
bull map_data ndash The data for a map
bull should_update_data (Boolean) ndash (Default true) Whether data should be ap-plied to the map
load_model(model_data[ should_update_data])Load the cobra model from model data
Arguments
bull model_data ndash The data for a Cobra model (Parsing in done by escherCobraModel)
bull should_update_data (Boolean) ndash (Default true) Whether data should be ap-plied to the model
view_mode()Enter view mode
build_mode()Enter build mode
brush_mode()Enter brush mode
zoom_mode()Enter zoom mode
rotate_mode()Enter rotate mode
text_mode()Enter text mode
set_reaction_data(data)
Arguments
bull data (array) ndash An array of 1 or 2 objects where each object has keys that are reactionIDrsquos and values that are data points (numbers)
set_metabolite_data(data)
Arguments
bull data (array) ndash An array of 1 or 2 objects where each object has keys that are metaboliteIDrsquos and values that are data points (numbers)
set_gene_data(data clear_gene_reaction_rules)
Arguments
bull data (array) ndash An array of 1 or 2 objects where each object has keys that are gene IDrsquosand values that are data points (numbers)
Arguments
bull clear_gene_reaction_rules (Boolean) ndash (Optional Default false) In addi-tion to setting the data also turn of the gene_reaction_rules
78 JavaScript API 43
Escher Documentation Release 143
79 Python API
class escherBuilder(map_name=None map_json=None model=None model_name=Nonemodel_json=None embedded_css=None reaction_data=None metabo-lite_data=None gene_data=None local_host=None id=None safe=Falsekwargs)
A metabolic map that can be viewed edited and used to visualize data
This map will also show metabolic fluxes passed in during consruction It can be viewed as a standalone htmlinside a browswer Alternately the respresentation inside an IPython notebook will also display the map
Maps are stored in json files and are stored in a cache directory Maps which are not found will be downloadedfrom a map repository if found
Parameters
bull map_name ndash A string specifying a map to be downloaded from the Escher web server orloaded from the cache
bull map_json ndash A JSON string or a file path to a JSON file or a URL specifying a JSON fileto be downloaded
bull model ndash A Cobra model
bull model_name ndash A string specifying a model to be downloaded from the Escher web serveror loaded from the cache
bull model_json ndash A JSON string or a file path to a JSON file or a URL specifying a JSONfile to be downloaded
bull embedded_css ndash The CSS (as a string) to be embedded with the Escher SVG
bull reaction_data ndash A dictionary with keys that correspond to reaction ids and values thatwill be mapped to reaction arrows and labels
bull metabolite_data ndash A dictionary with keys that correspond to metabolite ids and valuesthat will be mapped to metabolite nodes and labels
bull gene_data ndash A dictionary with keys that correspond to gene ids and values that will bemapped to corresponding reactions
bull local_host ndash A hostname that will be used for any local files This is generally usedfor using the notebook offline and for testing in the IPython Notebook with modified Eschercode An example value for local_host is lsquohttplocalhost7778lsquo
bull id ndash Specify an id to make the javascript data definitions unique A random id is chosen bydefault
bull safe ndash If True then loading files from the filesytem is not allowed This is to ensure thesafety of using Builder within a web server
Keyword Arguments
These are defined in the Javascript API
bulluse_3d_transform
bullenable_search
bullfill_screen
bullzoom_to_element
bullfull_screen_button
44 Chapter 7 Contents
Escher Documentation Release 143
bullstarting_reaction
bullunique_map_id
bullprimary_metabolite_radius
bullsecondary_metabolite_radius
bullmarker_radius
bullgene_font_size
bullhide_secondary_metabolites
bullshow_gene_reaction_rules
bullhide_all_labels
bullreaction_styles
bullreaction_compare_style
bullreaction_scale
bullreaction_no_data_color
bullreaction_no_data_size
bulland_method_in_gene_reaction_rule
bullmetabolite_styles
bullmetabolite_compare_style
bullmetabolite_scale
bullmetabolite_no_data_color
bullmetabolite_no_data_size
bullidentifiers_on_map
bullhighlight_missing
bullallow_building_duplicate_reactions
bullcofactors
All keyword arguments can also be set on an existing Builder object using setter functions eg
my_builderset_reaction_styles(new_styles)
display_in_browser(ip=lsquo127001rsquo port=7655 n_retries=50 js_source=rsquowebrsquo menu=rsquoallrsquoscroll_behavior=rsquopanrsquo enable_editing=True enable_keys=True mini-fied_js=True never_ask_before_quit=False)
Launch a web browser to view the map
Parameters
bull ip ndash The IP address to serve the map on
bull port ndash The port to serve the map on If specified the port is occupied then a random freeport will be used
bull n_retries (int) ndash The number of times the server will try to find a port before quitting
bull js_source (string) ndash Can be one of the following
ndash web (Default) - Use JavaScript files from eschergithubio
79 Python API 45
Escher Documentation Release 143
ndash local - Use compiled JavaScript files in the local Escher installation Works offline
ndash dev - No longer necessary with source maps This now gives the same behavior aslsquolocalrsquo
bull menu (string) ndash Menu bar options include
ndash none - No menu or buttons
ndash zoom - Just zoom buttons
ndash all (Default) - Menu and button bar (requires Bootstrap)
bull scroll_behavior (string) ndash Scroll behavior options
ndash pan - Pan the map
ndash zoom - Zoom the map
ndash none (Default) - No scroll events
bull enable_editing (Boolean) ndash Enable the map editing modes
bull enable_keys (Boolean) ndash Enable keyboard shortcuts
bull minified_js (Boolean) ndash If True use the minified version of JavaScript and CSSfiles
bull never_ask_before_quit (Boolean) ndash Never display an alert asking if you wantto leave the page By default this message is displayed if enable_editing is True
display_in_notebook(js_source=rsquowebrsquo menu=rsquozoomrsquo scroll_behavior=rsquononersquo mini-fied_js=True height=500 enable_editing=False)
Embed the Map within the current IPython Notebook
Parameters
bull js_source (string) ndash Can be one of the following
ndash web (Default) - Use JavaScript files from eschergithubio
ndash local - Use compiled JavaScript files in the local Escher installation Works offline
ndash dev - No longer necessary with source maps This now gives the same behav-ior as lsquolocalrsquo
bull menu (string) ndash Menu bar options include
ndash none - No menu or buttons
ndash zoom - Just zoom buttons
ndash Note The all menu option does not work in an IPython notebook
bull scroll_behavior (string) ndash Scroll behavior options
ndash pan - Pan the map
ndash zoom - Zoom the map
ndash none - (Default) No scroll events
bull minified_js (Boolean) ndash If True use the minified version of JavaScript andCSS files
bull height ndash Height of the HTML container
bull enable_editing (Boolean) ndash Enable the map editing modes
46 Chapter 7 Contents
Escher Documentation Release 143
save_html(filepath=None overwrite=False js_source=rsquowebrsquo protocol=rsquohttpsrsquo menu=rsquoallrsquoscroll_behavior=rsquopanrsquo enable_editing=True enable_keys=True minified_js=Truenever_ask_before_quit=False static_site_index_json=None)
Save an HTML file containing the map
Parameters
bull filepath (string) ndash The HTML file will be saved to this location Whenjs_source is lsquolocalrsquo then a new directory will be created with this name
bull overwrite (Boolean) ndash Overwrite existing files
bull js_source (string) ndash Can be one of the following
ndash web (Default) - Use JavaScript files from eschergithubio
ndash local - Use compiled JavaScript files in the local Escher installation Works of-fline To make the dependencies available to the downloaded file a new directorywill be made with the name specified by filepath
ndash dev - No longer necessary with source maps This now gives the same behav-ior as lsquolocalrsquo
bull protocol (string) ndash The protocol can be lsquohttprsquo lsquohttpsrsquo or None which indicatesa lsquoprotocol relative URLrsquo as in eschergithubio Ignored if source is local
bull menu (string) ndash Menu bar options include
ndash none - No menu or buttons
ndash zoom - Just zoom buttons
ndash all (Default) - Menu and button bar (requires Bootstrap)
bull scroll_behavior (string) ndash Scroll behavior options
ndash pan - Pan the map
ndash zoom - Zoom the map
ndash none (Default) - No scroll events
bull enable_editing (Boolean) ndash Enable the map editing modes
bull enable_keys (Boolean) ndash Enable keyboard shortcuts
bull minified_js (Boolean) ndash If True use the minified version of JavaScript andCSS files
bull height (number) ndash Height of the HTML container
bull never_ask_before_quit (Boolean) ndash Never display an alert asking if youwant to leave the page By default this message is displayed if enable_editing isTrue
bull static_site_index_json (string) ndash The index as a JSON string for thestatic site Use javascript to parse the URL options Used for generating static pages(see static_sitepy)
791 Cache
escherget_cache_dir(versioned=True name=None)Get the cache dir as a string and make the directory if it does not already exist
Parameters
79 Python API 47
Escher Documentation Release 143
bull versioned (Boolean) ndash Whether to return the versioned path in the cache Eschermaps for the latest version of Escher are found in the versioned directory (versioned= True) but maps for previous versions of Escher can be found by visiting the parentdirectory (versioned = False)
bull name (string) ndash An optional subdirectory within the cache If versioned is False thenname is ignored
escherclear_cache(different_cache_dir=None ask=True)Empty the contents of the cache directory including all versions of all maps and models
Parameters
bull different_cache_dir (string) ndash (Optional) The directory of another cacheThis is mainly for testing
bull ask (Boolean) ndash Whether to ask before deleting
escherlist_cached_maps()Return a list of all cached maps
escherlist_cached_models()Return a list of all cached models
escherlist_available_maps()Return a list of all maps available on the server
escherlist_available_models()Return a list of all models available on the server
710 License
Escher and EscherConverter are distributed under the MIT license
bull genindex
48 Chapter 7 Contents
Python Module Index
eescher 44
49
Escher Documentation Release 143
50 Python Module Index
Index
Bbrush_mode() (built-in function) 43build_mode() (built-in function) 43Builder (class in escher) 44
Cclear_cache() (in module escher) 48
Ddisplay_in_browser() (escherBuilder method) 45display_in_notebook() (escherBuilder method) 46
Eescher (module) 44escherBuilder() (class) 39
Gget_cache_dir() (in module escher) 47
Llist_available_maps() (in module escher) 48list_available_models() (in module escher) 48list_cached_maps() (in module escher) 48list_cached_models() (in module escher) 48load_map() (built-in function) 42load_model() (built-in function) 43
Ooptionenable_keys (option attribute) 40optionsallow_building_duplicate_reactions (options at-
tribute) 42optionsand_method_in_gene_reaction_rule (options at-
tribute) 41optionscofactors (options attribute) 42optionsenable_editing (options attribute) 39optionsenable_search (options attribute) 40optionsfill_screen (options attribute) 40optionsfirst_load_callback (options attribute) 42optionsfull_screen_button (options attribute) 40optionsgene_data (options attribute) 41
optionsgene_font_size (options attribute) 40optionshide_all_labels (options attribute) 40optionshide_secondary_metabolites (options attribute)
40optionshighlight_missing (options attribute) 42optionsidentifiers_on_map (options attribute) 42optionsignore_bootstrap (options attribute) 40optionsmarker_radius (options attribute) 40optionsmenu (options attribute) 39optionsmetabolite_compare_style (options attribute) 42optionsmetabolite_data (options attribute) 42optionsmetabolite_no_data_color (options attribute) 42optionsmetabolite_no_data_size (options attribute) 42optionsmetabolite_scale (options attribute) 42optionsmetabolite_styles (options attribute) 42optionsnever_ask_before_quit (options attribute) 40optionsprimary_metabolite_radius (options attribute) 40optionsreaction_compare_style (options attribute) 41optionsreaction_data (options attribute) 40optionsreaction_no_data_color (options attribute) 41optionsreaction_no_data_size (options attribute) 41optionsreaction_scale (options attribute) 41optionsreaction_styles (options attribute) 41optionsscroll_behavior (options attribute) 39optionssecondary_metabolite_radius (options attribute)
40optionsshow_gene_reaction_rules (options attribute) 40optionsstarting_reaction (options attribute) 40optionsunique_map_id (options attribute) 40optionsuse_3d_transform (options attribute) 39
Rrotate_mode() (built-in function) 43
Ssave_html() (escherBuilder method) 46set_gene_data() (built-in function) 43set_metabolite_data() (built-in function) 43set_reaction_data() (built-in function) 43
51
Escher Documentation Release 143
Ttext_mode() (built-in function) 43
Vview_mode() (built-in function) 43
Zzoom_mode() (built-in function) 43
52 Index
Escher Documentation Release 143
python -m SimpleHTTPServer python 2python -m httpserver python 3
763 Generating and reading Escher and COBRA files
The Escher file format
Escher layouts are defined by JSON files that follow a specific schema using json schema The latest schemafor Escher JSON files is here The Escher schemas are versioned with inspiration from SchemaVer Theeschervalidate module can be used to validate models against the schema
The Escher layout schema is designed to be as simple as possible For example the core metabolism map of Es-cherichia coli is layed out like this
[
map_name E coli coreCore metabolismmap_id 2938hoq32a1map_description E coli core metabolic networknLast Modified Fri Dec 05 2014 163944 GMT-0800 (PST)homepage httpseschergithubioschema httpseschergithubioescherjsonschema1-0-0
reactions nodes text_label canvas
x 7857062530517567y 31436893920898433width 5894515691375733height 4860457037353515
]
The map_name includes the model that was used to build this layout followed by a period and then a readable namefor the map The map_id is a unique identifier for this map The map_description describes the map and thelast time it was modified Both the homepage and the schema entries must have exactly these values for the Eschermap to be valid
In the next section the reactions nodes labels and canvas are all defined For reactions nodes and text labels eachelement has a key that is an arbitrary integer As long as there are no repeated IDs (eg no 2 segments with the ID517) then everything should work fine
Read through the schema (here) for more detail on the format
The COBRA file format
COBRA models are also saved as JSON files This format has not been documented with a schema but you canbrowse through the core metabolism model as a guide to generating valid COBRA models
I still need help
If you are interested in developing with Escher and you need more information than what is provided in the documen-tation please contact Zachary King (zaking-AT-ucsd-DOT-edu)
32 Chapter 7 Contents
Escher Documentation Release 143
77 EscherConverter
EscherConverter is a standalone program that reads files created with the graphical network editor Escher and convertsthem to files in community standard formats
Download EscherConverter 05 (137 MB)
771 Using EscherConverter
Escher uses a JSON file format to represent its networks This format has been developed because of its very small filesize and its compatibility to online programs that are written in JavaScript In particular JSON is a JavaScript ObjectNotation or in other words a JSON file directly represents components of JavaScript programs This makes parsingvery simple and allows direct use of those files in web-based programs
However in systems biology specific file formats have been developed with the aim to be easily exchangeable betweensoftware implemented in diverse programming languages
To this end these formats support semantically clear annotations and are maintained by a large community of scientistsEscherConverter supports export to two particularly important XML-based community file formats SBML with layoutextension and SBGN-ML
While SBML has been mainly developed for dynamic simulation of biological networks it is nowadays also usablefor diverse other purposes Its layout extension facilitates the encoding the display of biological networks
SBGN-ML has been directly developed as a language for the display of biological pathway maps of diverse kinds Itstores the position and connection of entities similar to what is shown in Escher networks
EscherConverter takes Escherrsquos JSON files as input and generates equivalent SBML Level 3 Version 1 files with layoutextension or SBGN-ML files
In order to ensure that the conversion is correct EscherConverter provides its own display that gives users a previewof how the export data format will be rendered by other tools In this preview display you can zoom in and out movearcs and node positions However it is important to know that none of the changes made in this preview are stored inthe export file
Download and Installation
You can obtain local copy of EscherConverter by clicking here
As a Javatrade application no specific installation is required for EscherConverter
However make sure you have a recent Javatrade Runtime Environment (JRE) installed on your computer (at least JRE8) You can obtain Javatrade from the Oracle website There you can also find installation instructions for your respectiveoperating system
Once Javatrade has been installed you can simply place the EscherConverter JAR file somewhere on your local computerfor instance in the folder
bull Applications if you are working under Mac OS
77 EscherConverter 33
Escher Documentation Release 143
bull opt for Linux computers
bull CProgram Files if you are using Windows
Launching the program
You can launch EscherConverter simply by double-clicking on the application JAR file This will open a followinggraphical user interface as described in the following figures
Figure 1 | The graphical user interface of EscherConverter
bull Preferences opens a settings dialog (see next screenshot)
bull Open displays a file chooser to select an input file in JSON format
bull Save export the map that is displayed in the current tab to SBML or SBGN-ML
bull Discard closes the current tab without saving
bull Help opens the online help that displays all command-line options
bull License displays the license under which this software is distributed
bull About shows information about the authors of this software
bull Main the main panel of the software in which converted Escher maps will be displayed organized in tabs
bull Status the status bar shows information and logging messages during the conversion
34 Chapter 7 Contents
Escher Documentation Release 143
Figure 2 | The preferences dialog All settings in this dialog are also available through EscherConverterrsquos command-line interface
Layout section several properties that are required in SBML and SBGN-ML are not explicitly specified in EscherrsquosJSON format and therefore need to be adjusted by the user These are the size of the drawing canvas the default boxsize for text labels the size of primary and secondary nodes In contrast to SBGN-ML and Escherrsquos JSON formatthe SBML layout extension supports three-dimensional displays When selecting this export file format it is thereforenecessary to also define the z-coordinate and the depth of all objects
Components and naming section Most settings in this section are specific for the SBML layout extension and areonly active if this output format is selected These are names and identifiers of the layout component and the in caseof SBML mandatory default compartment (a compartment without physical meaning a reaction space in which allmetabolites are located) EscherConverter can infer compartment bounds from metabolites but this is an experimentalfeature Just try it and see how the preview changes
77 EscherConverter 35
Escher Documentation Release 143
Figure 3 | A layout preview
The birds-eye view and the navigation component on the left help you navigate through the network display Thisgraph shows you how the converted pathway map will be rendered by software that supports SBGN-ML or the SBMLlayout extension This preview can be modified by moving arcs or nodes however none of those changes are storedwhen exporting the file In this current version EscherConver only exports layouts as given in the original JSON file
Included third-party software
EscherConverter includes several third-party libraries which we here list and acknowledge
bull ArgParser
bull JSBML
bull libSBGN
bull Pixel-Mixer icons
bull yFiles
772 Command-line interface API
You can launch EscherConverter from the command-line On a Unix system (such as Linux MacOS or Solaris etc)use a command like
bash$ java -jar -Xms8G -Xmx8G -Duserlanguage=en EscherConverter-05jar [options]
Under Window use a command like
Cgt javaw -jar -Xms8G -Xmx8G -Duserlanguage=en EscherConverter-05jar [options]
Escher has a large collection of command-line options (see below) which can be useful if you want to launch theprogram with specific settings or if multiple files are to be converted in a batch mode It is even possible to completelydisable the graphical user interface
36 Chapter 7 Contents
Escher Documentation Release 143
Input and output files
Definition of input and output data files as well as the format for the output
--input=ltFilegt
Specifies the JSON input file If a directory is given the conversion will be recursively performed Accepts JSON
--output=ltFilegt
The path to the file into which the output should be written If the input is a directory this must also be a directory inorder to perform a recursive conversion Accepts SBML SBGN
Escher layout
The options in this group allow you to influence how large certain elements should be displayed
--canvas-default-height=ltDoublegt
Just as in the case of the width of the canvas this value needs to be specified for cases where the JSON input file lacksan explicit specification of the canvas height Arguments must fit into the range [11E9] (Default value 2500)
--canvas-default-width=ltDoublegt
This value is used when no width has been defined for the canvas Since the width attribute is mandatory for the layouta default value must be provided in these cases Arguments must fit into the range [11E9] (Default value 2500)
--label-height=ltDoublegt
With this option you can specify the height of the bounding box of text labels Arguments must fit into the range[11E9] (Default value 500)
--label-width=ltDoublegt
This option defines the width of bounding boxes for text labels Arguments must fit into the range [11E9] (Defaultvalue 1600)
--node-depth=ltDoublegt
The length of nodes along z-coordinate Escher maps are actually two-dimensional but in general a layout can bethree-dimensional This value should be an arbitrary value greater than zero because some rendering engines mightnot display the node if its depth is zero Arguments must fit into the range [11E9] (Default value 10)
--node-label-height=ltDoublegt
Node labels can have a size different from general labels in the graph Here you can specify how height the boundingbox of the labels for nodes should be Arguments must fit into the range [11E9] (Default value 200)
--primary-node-height=ltDoublegt
The primary node should be bigger than the secondary node With this option you can specify the height of this typeof nodes Arguments must fit into the range [11E9] (Default value 300)
--primary-node-width=ltDoublegt
Escher maps distinguish between primary and secondary nodes Primary nodes should be larger than secondary nodesand display the main flow of matter through the network This option allows you to specify the width of primarynodes Arguments must fit into the range [11E9] (Default value 300)
77 EscherConverter 37
Escher Documentation Release 143
--reaction-label-height=ltDoublegt
Reaction label heightArguments must fit into the range [11E9] (Default value 300)
--reaction-node-ratio=ltDoublegt
This value is used as a conversion factor to determine the size of the reaction display box depending on the size ofprimary nodes Height and width of reaction nodes are determined by dividing the corresponding values from theprimary node size by this factor Arguments must fit into the range [01] (Default value 05)
--secondary-node-ratio=ltDoublegt
Similar to the reaction node ratio the size of secondary nodes (width and height) is determined by dividing thecorresponding values from the primary nodes by this value Arguments must fit into the range [01] (Default value06666666666666666)
--z=ltDoublegt
The position on the z-axis where the entire two-dimensional graph should be drawn Arguments must fit into the range[-1E91E9] (Default value 00)
Escher Components and their naming
Here you can influence which elements are to be included in the layout and how elements in the layout are to be calledor identified
--format=ltOutputFormatgt
The desired format for the conversion eg SBML All possible values for type ltOutputFormatgt are SBGN andSBML (Default value SBML)
--layout-id=ltStringgt
In contrast to the name this identifier does not have to be human-readable This is a machine identifier which muststart with a letter or underscore and can only contain ASCII characters (Default value Escher_Layout)
--layout-name=ltStringgt
This should be a human-readable name for the layout that is to be created This name might be displayed to describethe figure and should therefore be explanatory (Default value Escher Layout)
--compartment-id=ltStringgt
A compartment needs to have a unique identifier which needs to be a machine-readable Sting that must start with aletter or underscore and can only contain ASCII characters Since the JSON file does not provide this information thisoption allows you to specify the required identifier (Default value default)
--compartment-name=ltStringgt
With this option it is possible to define a name for the default compartment can be that needs to be generated for theconversion to SBML The name does not have any restrictions ie any UTF-8 character can be used (Default valueDefault compartment)
--infer-compartment-bounds
This converter can infer where the boundaries of compartments could be drawn To this end it uses each nodersquos BiGGids to identify the compartment of all metabolites Assuming that compartments have rectangular shapes the algorithmcan find the outermost node on each side of the box and hence obtain the boundaries of the compartment However
38 Chapter 7 Contents
Escher Documentation Release 143
this methods will fail when metabolites are drawn inside of such a box that belong to a different compartment that isactually further outside For this reason this option is deactivated by default (Default value false)
Options for the graphical user interface
--gui
If this option is given the program will display its graphical user interface (Default value false)
--log-level=ltStringgt
Change the log-level of this application This option will influence how fine-grained error and other log messages willbe that you receive while executing this program All possible values for type ltStringgt are ALL CONFIG FINEFINER FINEST INFO OFF SEVERE and WARNING (Default value INFO)
--log-file=ltFilegt
This option allows you to specify a log file to which all information of the program will be written Accepts (bp2bp3 log owl xml)
78 JavaScript API
class escherBuilder(map_data model_data embedded_css selection options)A Builder object contains all the UI and logic to generate a map builder or viewer
Arguments
bull map_data (object) ndash The data for a map to be passed to escherMapfrom_data() Ifnull then an empty Builder is initialized
bull model_data (object) ndash The data for a cobra model to be passed to es-cherCobraModel() Can be null
bull embedded_css (string) ndash The stylesheet for the SVG elements in the Escher map
bull selection (object) ndash (Optional Default In the body element) The d3 selection of anelement to place the Builder into The selection cannot be inside an SVG element
bull options (object) ndash (Optional) An object defining any of the following options
optionsmenu(Default rsquoallrsquo) The type of menu that will be displayed Can be lsquoallrsquo for the fullmenu or lsquozoomrsquo for just zoom buttons The lsquoallrsquo option requires the full set of Escherdependencies (D3js JQuery and Bootstrap) while the lsquozoomrsquo option requires only D3jsFor more details see Developing with Escher
optionsscroll_behavior(Default rsquopanrsquo) This option determines the effect that the scroll wheel will have onan Escher map Can be lsquopanrsquo to pan the map or lsquozoomrsquo to zoom the map when the usermoves the scroll wheel
optionsuse_3d_transform(Default Chooses a good option by testing the browser) If true then use CSS3 3D trans-forms to speed up panning and zooming This feature will only work on browsers thatsupport the 3D transforms It works best in the latest versions of Chrome Firefox andInternet Explorer Safari works better with this turned off
78 JavaScript API 39
Escher Documentation Release 143
optionsenable_editing(Default true) If true then display the map editing functions If false then hide themand only allow the user to view the map
optionenable_keys(Default true) If true then enable keyboard shortcuts
optionsenable_search(Default true) If true then enable indexing of the map for search Use false to disablesearching and potentially improve the map performance
optionsfill_screen(Default false) Use true to fill the screen when an Escher Builder is placed in a top-level container (eg a div in the body element)
optionsfull_screen_button(Default false) Include a button in the user interface for entering full screen mode
optionsignore_bootstrap(Default false) Do not use Bootstrap for buttons even if it available This is used toembed Escher in a Jupyter notebook where it conflicts with the Jupyter Boostrap installa-tion
Map model and styles
optionsstarting_reaction(Default null) The ID (as a string) of a reaction to draw when the Builder loads
optionsnever_ask_before_quit(Default false) If false then display a warning before the user closes an Eschermap If true then never display the warning This options is only respected if op-tionsenable_editing == true If enable_editing is false then the warnings are not dis-played
optionsunique_map_id(Default null) A unique ID that will be used to UI elements donrsquot interfere whenmultiple maps are in the same HTML document
optionsprimary_metabolite_radius(Default 15) The radius of primary metabolites in px
optionssecondary_metabolite_radius(Default 10) The radius of secondary metabolites in px
optionsmarker_radius(Default 5) The radius of marker nodes in px
optionsgene_font_size(Default 18) The font size of the gene reaction rules in px
optionshide_secondary_metabolites(Default false) If true then secondary nodes and segments are hidden This is conve-nient for generating simplified map figures
optionsshow_gene_reaction_rules(Default false) If true then show the gene reaction rules even without gene data
optionshide_all_labels(Default false) If checked hide all reaction gene and metabolite labels
Applied data
40 Chapter 7 Contents
Escher Documentation Release 143
optionsreaction_data(Default null) An object with reaction ids for keys and reaction data points for values
optionsreaction_stylesDefault [rsquocolorrsquo rsquosizersquo rsquotextrsquo]
An array of style types The array can contain any of the following lsquocolorrsquo lsquosizersquo lsquotextrsquolsquoabsrsquo The lsquocolorrsquo style means that the reactions will be colored according to the loadeddataset The lsquosizersquo style means that the reactions will be sized according to the loadeddataset The lsquotextrsquo style means that the data values will be displayed in the reactionlabels The lsquoabsrsquo style means the the absolute values of reaction values will be used fordata visualization
optionsreaction_compare_style(Default rsquodiffrsquo) How to compare to datasets Can be either lsquofold lsquolog2_foldrsquo orlsquodiffrsquo
optionsreaction_scaleDefault
[ type min color c8c8c8 size 12 type median color 9696ff size 20 type max color ff0000 size 25 ]
An array of objects that define points on the data scale
Each point is an object with a type attribute Types can be lsquominrsquo lsquomaxrsquo lsquomeanrsquo lsquoQ1rsquo (firstquartile) lsquomedianrsquo lsquoQ3rsquo (third quartile) or lsquovaluersquo Each point can have a color attributethat specifies a color with a string (any CSS color specification is allowed including hexrgb and rgba) Each point can have a size attirbute that specifies a reaction thickness as anumber Finally points with type lsquovaluersquo can have a value attribute that specifies an exactnumber for pont in the scale
NOTE If lsquominrsquo or lsquomaxrsquo is not provided Escher automatically adds them To be com-pletely clear about what you expect to see on the map it is best to provide lsquominrsquo andlsquomaxrsquo in addition to other scale points
Here are examples of each type
type rsquominrsquo color rsquoredrsquo size 12 Specifies that reactionsnear the minimum value are red and have thickness 12
type rsquoQ1rsquo color rsquorgba(100 100 50 05)rsquo size 12 Specifies that reactions near the first quartile have the given color opacity andthickness
type rsquomeanrsquo color rsquorgb(100 100 50)rsquo size 50 Specifies that reactions near the mean value have the given color and thickness
type rsquovaluersquo value 85 color rsquo333rsquo size 50 Specifies that reactions near 85 value have the given color and size
optionsreaction_no_data_color(Default rsquodcdcdcrsquo) The color of reactions with no data value
optionsreaction_no_data_size(Default 8) The size of reactions with no data value
optionsgene_data(Default null) An object with Gene ids for keys and gene data points for values
78 JavaScript API 41
Escher Documentation Release 143
optionsand_method_in_gene_reaction_rule(Default mean) When evaluating a gene reaction rule use this function to evaluate ANDrules Can be lsquomeanrsquo or lsquominrsquo
optionsmetabolite_data(Default null) An object with metabolite ids for keys and metabolite data points forvalues
optionsmetabolite_stylesDefault [rsquocolorrsquo rsquosizersquo rsquotextrsquo]
An array of style types The array can contain any of the following lsquocolorrsquo lsquosizersquo lsquotextrsquolsquoabsrsquo The lsquocolorrsquo style means that the metabolites will be colored according to the loadeddataset The lsquosizersquo style means that the metabolites will be sized according to the loadeddataset The lsquotextrsquo style means that the data values will be displayed in the metabolitelabels The lsquoabsrsquo style means the the absolute values of metabolite values will be used fordata visualization
optionsmetabolite_compare_style(Default rsquodiffrsquo) How to compare to datasets Can be either lsquofoldrsquo lsquolog2_foldrsquo orlsquodiffrsquo
optionsmetabolite_scaleDefault
[ type min color fffaf0 size 20 type median color f1c470 size 30 type max color 800000 size 40 ]
An array of objects that define points on the data scale See the description of op-tionsreaction_scale for an explanation of the format
optionsmetabolite_no_data_color(Default rsquoffffffrsquo) The color of metabolites with no data value
optionsmetabolite_no_data_size(Default 10) The size of metabolites with no data value
View and build options
optionsidentifiers_on_map(Default rsquobigg_idrsquo) The identifiers that will be displayed in reaction metabolite andgene labels Can be lsquobigg_idrsquo or lsquonamersquo
optionshighlight_missing(Default false) If true then highlight in red reactions that are not in the loaded COBRAmodel
optionsallow_building_duplicate_reactions(Default true) If true then building duplicate reactions is allowed If false then dupli-cate reactions are hidden in Add reaction mode
optionscofactors(Default [rsquoatprsquo rsquoadprsquo rsquonadrsquo rsquonadhrsquo rsquonadprsquo rsquonadphrsquorsquogtprsquo rsquogdprsquo rsquohrsquo rsquocoarsquo rsquoumprsquo rsquoh20rsquo rsquoppirsquo]) A list of metabo-lite IDs to treat as cofactors These will be secondary metabolites in new reactions
Callbacks
optionsfirst_load_callbackA function to run after loading the Builder
42 Chapter 7 Contents
Escher Documentation Release 143
load_map(map_data[ should_update_data])Load a map for the loaded data Also reloads most of the Builder content
Arguments
bull map_data ndash The data for a map
bull should_update_data (Boolean) ndash (Default true) Whether data should be ap-plied to the map
load_model(model_data[ should_update_data])Load the cobra model from model data
Arguments
bull model_data ndash The data for a Cobra model (Parsing in done by escherCobraModel)
bull should_update_data (Boolean) ndash (Default true) Whether data should be ap-plied to the model
view_mode()Enter view mode
build_mode()Enter build mode
brush_mode()Enter brush mode
zoom_mode()Enter zoom mode
rotate_mode()Enter rotate mode
text_mode()Enter text mode
set_reaction_data(data)
Arguments
bull data (array) ndash An array of 1 or 2 objects where each object has keys that are reactionIDrsquos and values that are data points (numbers)
set_metabolite_data(data)
Arguments
bull data (array) ndash An array of 1 or 2 objects where each object has keys that are metaboliteIDrsquos and values that are data points (numbers)
set_gene_data(data clear_gene_reaction_rules)
Arguments
bull data (array) ndash An array of 1 or 2 objects where each object has keys that are gene IDrsquosand values that are data points (numbers)
Arguments
bull clear_gene_reaction_rules (Boolean) ndash (Optional Default false) In addi-tion to setting the data also turn of the gene_reaction_rules
78 JavaScript API 43
Escher Documentation Release 143
79 Python API
class escherBuilder(map_name=None map_json=None model=None model_name=Nonemodel_json=None embedded_css=None reaction_data=None metabo-lite_data=None gene_data=None local_host=None id=None safe=Falsekwargs)
A metabolic map that can be viewed edited and used to visualize data
This map will also show metabolic fluxes passed in during consruction It can be viewed as a standalone htmlinside a browswer Alternately the respresentation inside an IPython notebook will also display the map
Maps are stored in json files and are stored in a cache directory Maps which are not found will be downloadedfrom a map repository if found
Parameters
bull map_name ndash A string specifying a map to be downloaded from the Escher web server orloaded from the cache
bull map_json ndash A JSON string or a file path to a JSON file or a URL specifying a JSON fileto be downloaded
bull model ndash A Cobra model
bull model_name ndash A string specifying a model to be downloaded from the Escher web serveror loaded from the cache
bull model_json ndash A JSON string or a file path to a JSON file or a URL specifying a JSONfile to be downloaded
bull embedded_css ndash The CSS (as a string) to be embedded with the Escher SVG
bull reaction_data ndash A dictionary with keys that correspond to reaction ids and values thatwill be mapped to reaction arrows and labels
bull metabolite_data ndash A dictionary with keys that correspond to metabolite ids and valuesthat will be mapped to metabolite nodes and labels
bull gene_data ndash A dictionary with keys that correspond to gene ids and values that will bemapped to corresponding reactions
bull local_host ndash A hostname that will be used for any local files This is generally usedfor using the notebook offline and for testing in the IPython Notebook with modified Eschercode An example value for local_host is lsquohttplocalhost7778lsquo
bull id ndash Specify an id to make the javascript data definitions unique A random id is chosen bydefault
bull safe ndash If True then loading files from the filesytem is not allowed This is to ensure thesafety of using Builder within a web server
Keyword Arguments
These are defined in the Javascript API
bulluse_3d_transform
bullenable_search
bullfill_screen
bullzoom_to_element
bullfull_screen_button
44 Chapter 7 Contents
Escher Documentation Release 143
bullstarting_reaction
bullunique_map_id
bullprimary_metabolite_radius
bullsecondary_metabolite_radius
bullmarker_radius
bullgene_font_size
bullhide_secondary_metabolites
bullshow_gene_reaction_rules
bullhide_all_labels
bullreaction_styles
bullreaction_compare_style
bullreaction_scale
bullreaction_no_data_color
bullreaction_no_data_size
bulland_method_in_gene_reaction_rule
bullmetabolite_styles
bullmetabolite_compare_style
bullmetabolite_scale
bullmetabolite_no_data_color
bullmetabolite_no_data_size
bullidentifiers_on_map
bullhighlight_missing
bullallow_building_duplicate_reactions
bullcofactors
All keyword arguments can also be set on an existing Builder object using setter functions eg
my_builderset_reaction_styles(new_styles)
display_in_browser(ip=lsquo127001rsquo port=7655 n_retries=50 js_source=rsquowebrsquo menu=rsquoallrsquoscroll_behavior=rsquopanrsquo enable_editing=True enable_keys=True mini-fied_js=True never_ask_before_quit=False)
Launch a web browser to view the map
Parameters
bull ip ndash The IP address to serve the map on
bull port ndash The port to serve the map on If specified the port is occupied then a random freeport will be used
bull n_retries (int) ndash The number of times the server will try to find a port before quitting
bull js_source (string) ndash Can be one of the following
ndash web (Default) - Use JavaScript files from eschergithubio
79 Python API 45
Escher Documentation Release 143
ndash local - Use compiled JavaScript files in the local Escher installation Works offline
ndash dev - No longer necessary with source maps This now gives the same behavior aslsquolocalrsquo
bull menu (string) ndash Menu bar options include
ndash none - No menu or buttons
ndash zoom - Just zoom buttons
ndash all (Default) - Menu and button bar (requires Bootstrap)
bull scroll_behavior (string) ndash Scroll behavior options
ndash pan - Pan the map
ndash zoom - Zoom the map
ndash none (Default) - No scroll events
bull enable_editing (Boolean) ndash Enable the map editing modes
bull enable_keys (Boolean) ndash Enable keyboard shortcuts
bull minified_js (Boolean) ndash If True use the minified version of JavaScript and CSSfiles
bull never_ask_before_quit (Boolean) ndash Never display an alert asking if you wantto leave the page By default this message is displayed if enable_editing is True
display_in_notebook(js_source=rsquowebrsquo menu=rsquozoomrsquo scroll_behavior=rsquononersquo mini-fied_js=True height=500 enable_editing=False)
Embed the Map within the current IPython Notebook
Parameters
bull js_source (string) ndash Can be one of the following
ndash web (Default) - Use JavaScript files from eschergithubio
ndash local - Use compiled JavaScript files in the local Escher installation Works offline
ndash dev - No longer necessary with source maps This now gives the same behav-ior as lsquolocalrsquo
bull menu (string) ndash Menu bar options include
ndash none - No menu or buttons
ndash zoom - Just zoom buttons
ndash Note The all menu option does not work in an IPython notebook
bull scroll_behavior (string) ndash Scroll behavior options
ndash pan - Pan the map
ndash zoom - Zoom the map
ndash none - (Default) No scroll events
bull minified_js (Boolean) ndash If True use the minified version of JavaScript andCSS files
bull height ndash Height of the HTML container
bull enable_editing (Boolean) ndash Enable the map editing modes
46 Chapter 7 Contents
Escher Documentation Release 143
save_html(filepath=None overwrite=False js_source=rsquowebrsquo protocol=rsquohttpsrsquo menu=rsquoallrsquoscroll_behavior=rsquopanrsquo enable_editing=True enable_keys=True minified_js=Truenever_ask_before_quit=False static_site_index_json=None)
Save an HTML file containing the map
Parameters
bull filepath (string) ndash The HTML file will be saved to this location Whenjs_source is lsquolocalrsquo then a new directory will be created with this name
bull overwrite (Boolean) ndash Overwrite existing files
bull js_source (string) ndash Can be one of the following
ndash web (Default) - Use JavaScript files from eschergithubio
ndash local - Use compiled JavaScript files in the local Escher installation Works of-fline To make the dependencies available to the downloaded file a new directorywill be made with the name specified by filepath
ndash dev - No longer necessary with source maps This now gives the same behav-ior as lsquolocalrsquo
bull protocol (string) ndash The protocol can be lsquohttprsquo lsquohttpsrsquo or None which indicatesa lsquoprotocol relative URLrsquo as in eschergithubio Ignored if source is local
bull menu (string) ndash Menu bar options include
ndash none - No menu or buttons
ndash zoom - Just zoom buttons
ndash all (Default) - Menu and button bar (requires Bootstrap)
bull scroll_behavior (string) ndash Scroll behavior options
ndash pan - Pan the map
ndash zoom - Zoom the map
ndash none (Default) - No scroll events
bull enable_editing (Boolean) ndash Enable the map editing modes
bull enable_keys (Boolean) ndash Enable keyboard shortcuts
bull minified_js (Boolean) ndash If True use the minified version of JavaScript andCSS files
bull height (number) ndash Height of the HTML container
bull never_ask_before_quit (Boolean) ndash Never display an alert asking if youwant to leave the page By default this message is displayed if enable_editing isTrue
bull static_site_index_json (string) ndash The index as a JSON string for thestatic site Use javascript to parse the URL options Used for generating static pages(see static_sitepy)
791 Cache
escherget_cache_dir(versioned=True name=None)Get the cache dir as a string and make the directory if it does not already exist
Parameters
79 Python API 47
Escher Documentation Release 143
bull versioned (Boolean) ndash Whether to return the versioned path in the cache Eschermaps for the latest version of Escher are found in the versioned directory (versioned= True) but maps for previous versions of Escher can be found by visiting the parentdirectory (versioned = False)
bull name (string) ndash An optional subdirectory within the cache If versioned is False thenname is ignored
escherclear_cache(different_cache_dir=None ask=True)Empty the contents of the cache directory including all versions of all maps and models
Parameters
bull different_cache_dir (string) ndash (Optional) The directory of another cacheThis is mainly for testing
bull ask (Boolean) ndash Whether to ask before deleting
escherlist_cached_maps()Return a list of all cached maps
escherlist_cached_models()Return a list of all cached models
escherlist_available_maps()Return a list of all maps available on the server
escherlist_available_models()Return a list of all models available on the server
710 License
Escher and EscherConverter are distributed under the MIT license
bull genindex
48 Chapter 7 Contents
Python Module Index
eescher 44
49
Escher Documentation Release 143
50 Python Module Index
Index
Bbrush_mode() (built-in function) 43build_mode() (built-in function) 43Builder (class in escher) 44
Cclear_cache() (in module escher) 48
Ddisplay_in_browser() (escherBuilder method) 45display_in_notebook() (escherBuilder method) 46
Eescher (module) 44escherBuilder() (class) 39
Gget_cache_dir() (in module escher) 47
Llist_available_maps() (in module escher) 48list_available_models() (in module escher) 48list_cached_maps() (in module escher) 48list_cached_models() (in module escher) 48load_map() (built-in function) 42load_model() (built-in function) 43
Ooptionenable_keys (option attribute) 40optionsallow_building_duplicate_reactions (options at-
tribute) 42optionsand_method_in_gene_reaction_rule (options at-
tribute) 41optionscofactors (options attribute) 42optionsenable_editing (options attribute) 39optionsenable_search (options attribute) 40optionsfill_screen (options attribute) 40optionsfirst_load_callback (options attribute) 42optionsfull_screen_button (options attribute) 40optionsgene_data (options attribute) 41
optionsgene_font_size (options attribute) 40optionshide_all_labels (options attribute) 40optionshide_secondary_metabolites (options attribute)
40optionshighlight_missing (options attribute) 42optionsidentifiers_on_map (options attribute) 42optionsignore_bootstrap (options attribute) 40optionsmarker_radius (options attribute) 40optionsmenu (options attribute) 39optionsmetabolite_compare_style (options attribute) 42optionsmetabolite_data (options attribute) 42optionsmetabolite_no_data_color (options attribute) 42optionsmetabolite_no_data_size (options attribute) 42optionsmetabolite_scale (options attribute) 42optionsmetabolite_styles (options attribute) 42optionsnever_ask_before_quit (options attribute) 40optionsprimary_metabolite_radius (options attribute) 40optionsreaction_compare_style (options attribute) 41optionsreaction_data (options attribute) 40optionsreaction_no_data_color (options attribute) 41optionsreaction_no_data_size (options attribute) 41optionsreaction_scale (options attribute) 41optionsreaction_styles (options attribute) 41optionsscroll_behavior (options attribute) 39optionssecondary_metabolite_radius (options attribute)
40optionsshow_gene_reaction_rules (options attribute) 40optionsstarting_reaction (options attribute) 40optionsunique_map_id (options attribute) 40optionsuse_3d_transform (options attribute) 39
Rrotate_mode() (built-in function) 43
Ssave_html() (escherBuilder method) 46set_gene_data() (built-in function) 43set_metabolite_data() (built-in function) 43set_reaction_data() (built-in function) 43
51
Escher Documentation Release 143
Ttext_mode() (built-in function) 43
Vview_mode() (built-in function) 43
Zzoom_mode() (built-in function) 43
52 Index
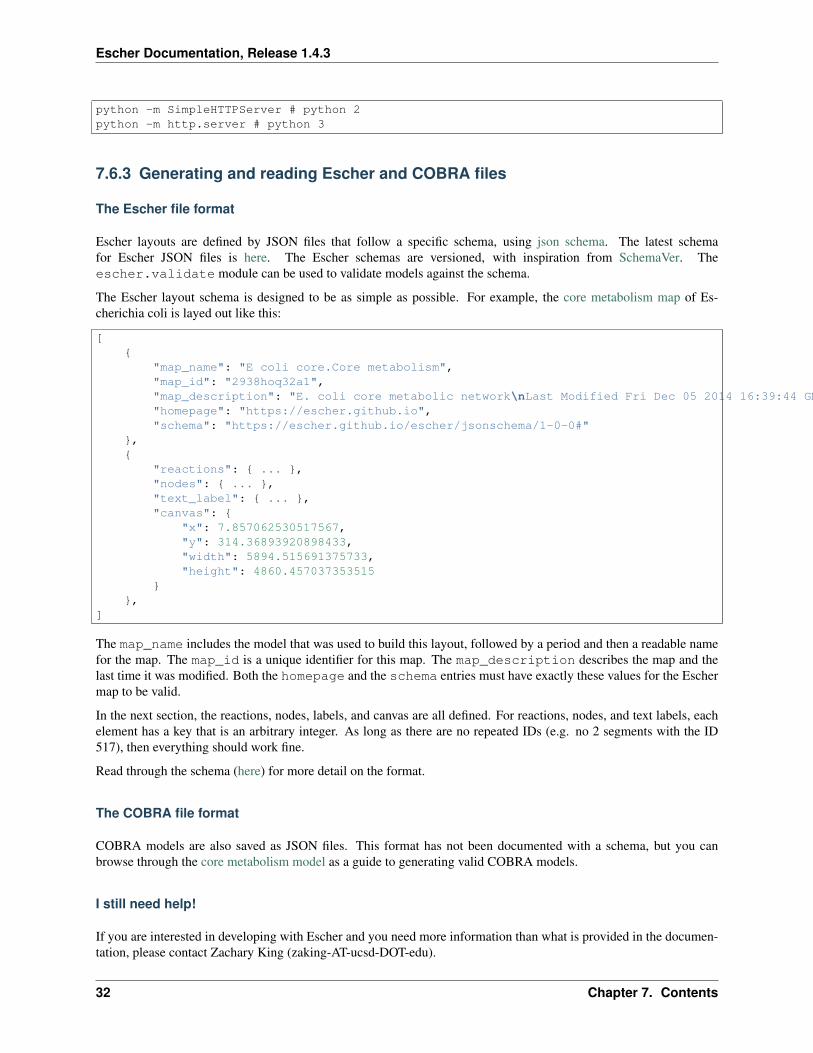
Escher Documentation Release 143
77 EscherConverter
EscherConverter is a standalone program that reads files created with the graphical network editor Escher and convertsthem to files in community standard formats
Download EscherConverter 05 (137 MB)
771 Using EscherConverter
Escher uses a JSON file format to represent its networks This format has been developed because of its very small filesize and its compatibility to online programs that are written in JavaScript In particular JSON is a JavaScript ObjectNotation or in other words a JSON file directly represents components of JavaScript programs This makes parsingvery simple and allows direct use of those files in web-based programs
However in systems biology specific file formats have been developed with the aim to be easily exchangeable betweensoftware implemented in diverse programming languages
To this end these formats support semantically clear annotations and are maintained by a large community of scientistsEscherConverter supports export to two particularly important XML-based community file formats SBML with layoutextension and SBGN-ML
While SBML has been mainly developed for dynamic simulation of biological networks it is nowadays also usablefor diverse other purposes Its layout extension facilitates the encoding the display of biological networks
SBGN-ML has been directly developed as a language for the display of biological pathway maps of diverse kinds Itstores the position and connection of entities similar to what is shown in Escher networks
EscherConverter takes Escherrsquos JSON files as input and generates equivalent SBML Level 3 Version 1 files with layoutextension or SBGN-ML files
In order to ensure that the conversion is correct EscherConverter provides its own display that gives users a previewof how the export data format will be rendered by other tools In this preview display you can zoom in and out movearcs and node positions However it is important to know that none of the changes made in this preview are stored inthe export file
Download and Installation
You can obtain local copy of EscherConverter by clicking here
As a Javatrade application no specific installation is required for EscherConverter
However make sure you have a recent Javatrade Runtime Environment (JRE) installed on your computer (at least JRE8) You can obtain Javatrade from the Oracle website There you can also find installation instructions for your respectiveoperating system
Once Javatrade has been installed you can simply place the EscherConverter JAR file somewhere on your local computerfor instance in the folder
bull Applications if you are working under Mac OS
77 EscherConverter 33
Escher Documentation Release 143
bull opt for Linux computers
bull CProgram Files if you are using Windows
Launching the program
You can launch EscherConverter simply by double-clicking on the application JAR file This will open a followinggraphical user interface as described in the following figures
Figure 1 | The graphical user interface of EscherConverter
bull Preferences opens a settings dialog (see next screenshot)
bull Open displays a file chooser to select an input file in JSON format
bull Save export the map that is displayed in the current tab to SBML or SBGN-ML
bull Discard closes the current tab without saving
bull Help opens the online help that displays all command-line options
bull License displays the license under which this software is distributed
bull About shows information about the authors of this software
bull Main the main panel of the software in which converted Escher maps will be displayed organized in tabs
bull Status the status bar shows information and logging messages during the conversion
34 Chapter 7 Contents
Escher Documentation Release 143
Figure 2 | The preferences dialog All settings in this dialog are also available through EscherConverterrsquos command-line interface
Layout section several properties that are required in SBML and SBGN-ML are not explicitly specified in EscherrsquosJSON format and therefore need to be adjusted by the user These are the size of the drawing canvas the default boxsize for text labels the size of primary and secondary nodes In contrast to SBGN-ML and Escherrsquos JSON formatthe SBML layout extension supports three-dimensional displays When selecting this export file format it is thereforenecessary to also define the z-coordinate and the depth of all objects
Components and naming section Most settings in this section are specific for the SBML layout extension and areonly active if this output format is selected These are names and identifiers of the layout component and the in caseof SBML mandatory default compartment (a compartment without physical meaning a reaction space in which allmetabolites are located) EscherConverter can infer compartment bounds from metabolites but this is an experimentalfeature Just try it and see how the preview changes
77 EscherConverter 35
Escher Documentation Release 143
Figure 3 | A layout preview
The birds-eye view and the navigation component on the left help you navigate through the network display Thisgraph shows you how the converted pathway map will be rendered by software that supports SBGN-ML or the SBMLlayout extension This preview can be modified by moving arcs or nodes however none of those changes are storedwhen exporting the file In this current version EscherConver only exports layouts as given in the original JSON file
Included third-party software
EscherConverter includes several third-party libraries which we here list and acknowledge
bull ArgParser
bull JSBML
bull libSBGN
bull Pixel-Mixer icons
bull yFiles
772 Command-line interface API
You can launch EscherConverter from the command-line On a Unix system (such as Linux MacOS or Solaris etc)use a command like
bash$ java -jar -Xms8G -Xmx8G -Duserlanguage=en EscherConverter-05jar [options]
Under Window use a command like
Cgt javaw -jar -Xms8G -Xmx8G -Duserlanguage=en EscherConverter-05jar [options]
Escher has a large collection of command-line options (see below) which can be useful if you want to launch theprogram with specific settings or if multiple files are to be converted in a batch mode It is even possible to completelydisable the graphical user interface
36 Chapter 7 Contents
Escher Documentation Release 143
Input and output files
Definition of input and output data files as well as the format for the output
--input=ltFilegt
Specifies the JSON input file If a directory is given the conversion will be recursively performed Accepts JSON
--output=ltFilegt
The path to the file into which the output should be written If the input is a directory this must also be a directory inorder to perform a recursive conversion Accepts SBML SBGN
Escher layout
The options in this group allow you to influence how large certain elements should be displayed
--canvas-default-height=ltDoublegt
Just as in the case of the width of the canvas this value needs to be specified for cases where the JSON input file lacksan explicit specification of the canvas height Arguments must fit into the range [11E9] (Default value 2500)
--canvas-default-width=ltDoublegt
This value is used when no width has been defined for the canvas Since the width attribute is mandatory for the layouta default value must be provided in these cases Arguments must fit into the range [11E9] (Default value 2500)
--label-height=ltDoublegt
With this option you can specify the height of the bounding box of text labels Arguments must fit into the range[11E9] (Default value 500)
--label-width=ltDoublegt
This option defines the width of bounding boxes for text labels Arguments must fit into the range [11E9] (Defaultvalue 1600)
--node-depth=ltDoublegt
The length of nodes along z-coordinate Escher maps are actually two-dimensional but in general a layout can bethree-dimensional This value should be an arbitrary value greater than zero because some rendering engines mightnot display the node if its depth is zero Arguments must fit into the range [11E9] (Default value 10)
--node-label-height=ltDoublegt
Node labels can have a size different from general labels in the graph Here you can specify how height the boundingbox of the labels for nodes should be Arguments must fit into the range [11E9] (Default value 200)
--primary-node-height=ltDoublegt
The primary node should be bigger than the secondary node With this option you can specify the height of this typeof nodes Arguments must fit into the range [11E9] (Default value 300)
--primary-node-width=ltDoublegt
Escher maps distinguish between primary and secondary nodes Primary nodes should be larger than secondary nodesand display the main flow of matter through the network This option allows you to specify the width of primarynodes Arguments must fit into the range [11E9] (Default value 300)
77 EscherConverter 37
Escher Documentation Release 143
--reaction-label-height=ltDoublegt
Reaction label heightArguments must fit into the range [11E9] (Default value 300)
--reaction-node-ratio=ltDoublegt
This value is used as a conversion factor to determine the size of the reaction display box depending on the size ofprimary nodes Height and width of reaction nodes are determined by dividing the corresponding values from theprimary node size by this factor Arguments must fit into the range [01] (Default value 05)
--secondary-node-ratio=ltDoublegt
Similar to the reaction node ratio the size of secondary nodes (width and height) is determined by dividing thecorresponding values from the primary nodes by this value Arguments must fit into the range [01] (Default value06666666666666666)
--z=ltDoublegt
The position on the z-axis where the entire two-dimensional graph should be drawn Arguments must fit into the range[-1E91E9] (Default value 00)
Escher Components and their naming
Here you can influence which elements are to be included in the layout and how elements in the layout are to be calledor identified
--format=ltOutputFormatgt
The desired format for the conversion eg SBML All possible values for type ltOutputFormatgt are SBGN andSBML (Default value SBML)
--layout-id=ltStringgt
In contrast to the name this identifier does not have to be human-readable This is a machine identifier which muststart with a letter or underscore and can only contain ASCII characters (Default value Escher_Layout)
--layout-name=ltStringgt
This should be a human-readable name for the layout that is to be created This name might be displayed to describethe figure and should therefore be explanatory (Default value Escher Layout)
--compartment-id=ltStringgt
A compartment needs to have a unique identifier which needs to be a machine-readable Sting that must start with aletter or underscore and can only contain ASCII characters Since the JSON file does not provide this information thisoption allows you to specify the required identifier (Default value default)
--compartment-name=ltStringgt
With this option it is possible to define a name for the default compartment can be that needs to be generated for theconversion to SBML The name does not have any restrictions ie any UTF-8 character can be used (Default valueDefault compartment)
--infer-compartment-bounds
This converter can infer where the boundaries of compartments could be drawn To this end it uses each nodersquos BiGGids to identify the compartment of all metabolites Assuming that compartments have rectangular shapes the algorithmcan find the outermost node on each side of the box and hence obtain the boundaries of the compartment However
38 Chapter 7 Contents
Escher Documentation Release 143
this methods will fail when metabolites are drawn inside of such a box that belong to a different compartment that isactually further outside For this reason this option is deactivated by default (Default value false)
Options for the graphical user interface
--gui
If this option is given the program will display its graphical user interface (Default value false)
--log-level=ltStringgt
Change the log-level of this application This option will influence how fine-grained error and other log messages willbe that you receive while executing this program All possible values for type ltStringgt are ALL CONFIG FINEFINER FINEST INFO OFF SEVERE and WARNING (Default value INFO)
--log-file=ltFilegt
This option allows you to specify a log file to which all information of the program will be written Accepts (bp2bp3 log owl xml)
78 JavaScript API
class escherBuilder(map_data model_data embedded_css selection options)A Builder object contains all the UI and logic to generate a map builder or viewer
Arguments
bull map_data (object) ndash The data for a map to be passed to escherMapfrom_data() Ifnull then an empty Builder is initialized
bull model_data (object) ndash The data for a cobra model to be passed to es-cherCobraModel() Can be null
bull embedded_css (string) ndash The stylesheet for the SVG elements in the Escher map
bull selection (object) ndash (Optional Default In the body element) The d3 selection of anelement to place the Builder into The selection cannot be inside an SVG element
bull options (object) ndash (Optional) An object defining any of the following options
optionsmenu(Default rsquoallrsquo) The type of menu that will be displayed Can be lsquoallrsquo for the fullmenu or lsquozoomrsquo for just zoom buttons The lsquoallrsquo option requires the full set of Escherdependencies (D3js JQuery and Bootstrap) while the lsquozoomrsquo option requires only D3jsFor more details see Developing with Escher
optionsscroll_behavior(Default rsquopanrsquo) This option determines the effect that the scroll wheel will have onan Escher map Can be lsquopanrsquo to pan the map or lsquozoomrsquo to zoom the map when the usermoves the scroll wheel
optionsuse_3d_transform(Default Chooses a good option by testing the browser) If true then use CSS3 3D trans-forms to speed up panning and zooming This feature will only work on browsers thatsupport the 3D transforms It works best in the latest versions of Chrome Firefox andInternet Explorer Safari works better with this turned off
78 JavaScript API 39
Escher Documentation Release 143
optionsenable_editing(Default true) If true then display the map editing functions If false then hide themand only allow the user to view the map
optionenable_keys(Default true) If true then enable keyboard shortcuts
optionsenable_search(Default true) If true then enable indexing of the map for search Use false to disablesearching and potentially improve the map performance
optionsfill_screen(Default false) Use true to fill the screen when an Escher Builder is placed in a top-level container (eg a div in the body element)
optionsfull_screen_button(Default false) Include a button in the user interface for entering full screen mode
optionsignore_bootstrap(Default false) Do not use Bootstrap for buttons even if it available This is used toembed Escher in a Jupyter notebook where it conflicts with the Jupyter Boostrap installa-tion
Map model and styles
optionsstarting_reaction(Default null) The ID (as a string) of a reaction to draw when the Builder loads
optionsnever_ask_before_quit(Default false) If false then display a warning before the user closes an Eschermap If true then never display the warning This options is only respected if op-tionsenable_editing == true If enable_editing is false then the warnings are not dis-played
optionsunique_map_id(Default null) A unique ID that will be used to UI elements donrsquot interfere whenmultiple maps are in the same HTML document
optionsprimary_metabolite_radius(Default 15) The radius of primary metabolites in px
optionssecondary_metabolite_radius(Default 10) The radius of secondary metabolites in px
optionsmarker_radius(Default 5) The radius of marker nodes in px
optionsgene_font_size(Default 18) The font size of the gene reaction rules in px
optionshide_secondary_metabolites(Default false) If true then secondary nodes and segments are hidden This is conve-nient for generating simplified map figures
optionsshow_gene_reaction_rules(Default false) If true then show the gene reaction rules even without gene data
optionshide_all_labels(Default false) If checked hide all reaction gene and metabolite labels
Applied data
40 Chapter 7 Contents
Escher Documentation Release 143
optionsreaction_data(Default null) An object with reaction ids for keys and reaction data points for values
optionsreaction_stylesDefault [rsquocolorrsquo rsquosizersquo rsquotextrsquo]
An array of style types The array can contain any of the following lsquocolorrsquo lsquosizersquo lsquotextrsquolsquoabsrsquo The lsquocolorrsquo style means that the reactions will be colored according to the loadeddataset The lsquosizersquo style means that the reactions will be sized according to the loadeddataset The lsquotextrsquo style means that the data values will be displayed in the reactionlabels The lsquoabsrsquo style means the the absolute values of reaction values will be used fordata visualization
optionsreaction_compare_style(Default rsquodiffrsquo) How to compare to datasets Can be either lsquofold lsquolog2_foldrsquo orlsquodiffrsquo
optionsreaction_scaleDefault
[ type min color c8c8c8 size 12 type median color 9696ff size 20 type max color ff0000 size 25 ]
An array of objects that define points on the data scale
Each point is an object with a type attribute Types can be lsquominrsquo lsquomaxrsquo lsquomeanrsquo lsquoQ1rsquo (firstquartile) lsquomedianrsquo lsquoQ3rsquo (third quartile) or lsquovaluersquo Each point can have a color attributethat specifies a color with a string (any CSS color specification is allowed including hexrgb and rgba) Each point can have a size attirbute that specifies a reaction thickness as anumber Finally points with type lsquovaluersquo can have a value attribute that specifies an exactnumber for pont in the scale
NOTE If lsquominrsquo or lsquomaxrsquo is not provided Escher automatically adds them To be com-pletely clear about what you expect to see on the map it is best to provide lsquominrsquo andlsquomaxrsquo in addition to other scale points
Here are examples of each type
type rsquominrsquo color rsquoredrsquo size 12 Specifies that reactionsnear the minimum value are red and have thickness 12
type rsquoQ1rsquo color rsquorgba(100 100 50 05)rsquo size 12 Specifies that reactions near the first quartile have the given color opacity andthickness
type rsquomeanrsquo color rsquorgb(100 100 50)rsquo size 50 Specifies that reactions near the mean value have the given color and thickness
type rsquovaluersquo value 85 color rsquo333rsquo size 50 Specifies that reactions near 85 value have the given color and size
optionsreaction_no_data_color(Default rsquodcdcdcrsquo) The color of reactions with no data value
optionsreaction_no_data_size(Default 8) The size of reactions with no data value
optionsgene_data(Default null) An object with Gene ids for keys and gene data points for values
78 JavaScript API 41
Escher Documentation Release 143
optionsand_method_in_gene_reaction_rule(Default mean) When evaluating a gene reaction rule use this function to evaluate ANDrules Can be lsquomeanrsquo or lsquominrsquo
optionsmetabolite_data(Default null) An object with metabolite ids for keys and metabolite data points forvalues
optionsmetabolite_stylesDefault [rsquocolorrsquo rsquosizersquo rsquotextrsquo]
An array of style types The array can contain any of the following lsquocolorrsquo lsquosizersquo lsquotextrsquolsquoabsrsquo The lsquocolorrsquo style means that the metabolites will be colored according to the loadeddataset The lsquosizersquo style means that the metabolites will be sized according to the loadeddataset The lsquotextrsquo style means that the data values will be displayed in the metabolitelabels The lsquoabsrsquo style means the the absolute values of metabolite values will be used fordata visualization
optionsmetabolite_compare_style(Default rsquodiffrsquo) How to compare to datasets Can be either lsquofoldrsquo lsquolog2_foldrsquo orlsquodiffrsquo
optionsmetabolite_scaleDefault
[ type min color fffaf0 size 20 type median color f1c470 size 30 type max color 800000 size 40 ]
An array of objects that define points on the data scale See the description of op-tionsreaction_scale for an explanation of the format
optionsmetabolite_no_data_color(Default rsquoffffffrsquo) The color of metabolites with no data value
optionsmetabolite_no_data_size(Default 10) The size of metabolites with no data value
View and build options
optionsidentifiers_on_map(Default rsquobigg_idrsquo) The identifiers that will be displayed in reaction metabolite andgene labels Can be lsquobigg_idrsquo or lsquonamersquo
optionshighlight_missing(Default false) If true then highlight in red reactions that are not in the loaded COBRAmodel
optionsallow_building_duplicate_reactions(Default true) If true then building duplicate reactions is allowed If false then dupli-cate reactions are hidden in Add reaction mode
optionscofactors(Default [rsquoatprsquo rsquoadprsquo rsquonadrsquo rsquonadhrsquo rsquonadprsquo rsquonadphrsquorsquogtprsquo rsquogdprsquo rsquohrsquo rsquocoarsquo rsquoumprsquo rsquoh20rsquo rsquoppirsquo]) A list of metabo-lite IDs to treat as cofactors These will be secondary metabolites in new reactions
Callbacks
optionsfirst_load_callbackA function to run after loading the Builder
42 Chapter 7 Contents
Escher Documentation Release 143
load_map(map_data[ should_update_data])Load a map for the loaded data Also reloads most of the Builder content
Arguments
bull map_data ndash The data for a map
bull should_update_data (Boolean) ndash (Default true) Whether data should be ap-plied to the map
load_model(model_data[ should_update_data])Load the cobra model from model data
Arguments
bull model_data ndash The data for a Cobra model (Parsing in done by escherCobraModel)
bull should_update_data (Boolean) ndash (Default true) Whether data should be ap-plied to the model
view_mode()Enter view mode
build_mode()Enter build mode
brush_mode()Enter brush mode
zoom_mode()Enter zoom mode
rotate_mode()Enter rotate mode
text_mode()Enter text mode
set_reaction_data(data)
Arguments
bull data (array) ndash An array of 1 or 2 objects where each object has keys that are reactionIDrsquos and values that are data points (numbers)
set_metabolite_data(data)
Arguments
bull data (array) ndash An array of 1 or 2 objects where each object has keys that are metaboliteIDrsquos and values that are data points (numbers)
set_gene_data(data clear_gene_reaction_rules)
Arguments
bull data (array) ndash An array of 1 or 2 objects where each object has keys that are gene IDrsquosand values that are data points (numbers)
Arguments
bull clear_gene_reaction_rules (Boolean) ndash (Optional Default false) In addi-tion to setting the data also turn of the gene_reaction_rules
78 JavaScript API 43
Escher Documentation Release 143
79 Python API
class escherBuilder(map_name=None map_json=None model=None model_name=Nonemodel_json=None embedded_css=None reaction_data=None metabo-lite_data=None gene_data=None local_host=None id=None safe=Falsekwargs)
A metabolic map that can be viewed edited and used to visualize data
This map will also show metabolic fluxes passed in during consruction It can be viewed as a standalone htmlinside a browswer Alternately the respresentation inside an IPython notebook will also display the map
Maps are stored in json files and are stored in a cache directory Maps which are not found will be downloadedfrom a map repository if found
Parameters
bull map_name ndash A string specifying a map to be downloaded from the Escher web server orloaded from the cache
bull map_json ndash A JSON string or a file path to a JSON file or a URL specifying a JSON fileto be downloaded
bull model ndash A Cobra model
bull model_name ndash A string specifying a model to be downloaded from the Escher web serveror loaded from the cache
bull model_json ndash A JSON string or a file path to a JSON file or a URL specifying a JSONfile to be downloaded
bull embedded_css ndash The CSS (as a string) to be embedded with the Escher SVG
bull reaction_data ndash A dictionary with keys that correspond to reaction ids and values thatwill be mapped to reaction arrows and labels
bull metabolite_data ndash A dictionary with keys that correspond to metabolite ids and valuesthat will be mapped to metabolite nodes and labels
bull gene_data ndash A dictionary with keys that correspond to gene ids and values that will bemapped to corresponding reactions
bull local_host ndash A hostname that will be used for any local files This is generally usedfor using the notebook offline and for testing in the IPython Notebook with modified Eschercode An example value for local_host is lsquohttplocalhost7778lsquo
bull id ndash Specify an id to make the javascript data definitions unique A random id is chosen bydefault
bull safe ndash If True then loading files from the filesytem is not allowed This is to ensure thesafety of using Builder within a web server
Keyword Arguments
These are defined in the Javascript API
bulluse_3d_transform
bullenable_search
bullfill_screen
bullzoom_to_element
bullfull_screen_button
44 Chapter 7 Contents
Escher Documentation Release 143
bullstarting_reaction
bullunique_map_id
bullprimary_metabolite_radius
bullsecondary_metabolite_radius
bullmarker_radius
bullgene_font_size
bullhide_secondary_metabolites
bullshow_gene_reaction_rules
bullhide_all_labels
bullreaction_styles
bullreaction_compare_style
bullreaction_scale
bullreaction_no_data_color
bullreaction_no_data_size
bulland_method_in_gene_reaction_rule
bullmetabolite_styles
bullmetabolite_compare_style
bullmetabolite_scale
bullmetabolite_no_data_color
bullmetabolite_no_data_size
bullidentifiers_on_map
bullhighlight_missing
bullallow_building_duplicate_reactions
bullcofactors
All keyword arguments can also be set on an existing Builder object using setter functions eg
my_builderset_reaction_styles(new_styles)
display_in_browser(ip=lsquo127001rsquo port=7655 n_retries=50 js_source=rsquowebrsquo menu=rsquoallrsquoscroll_behavior=rsquopanrsquo enable_editing=True enable_keys=True mini-fied_js=True never_ask_before_quit=False)
Launch a web browser to view the map
Parameters
bull ip ndash The IP address to serve the map on
bull port ndash The port to serve the map on If specified the port is occupied then a random freeport will be used
bull n_retries (int) ndash The number of times the server will try to find a port before quitting
bull js_source (string) ndash Can be one of the following
ndash web (Default) - Use JavaScript files from eschergithubio
79 Python API 45
Escher Documentation Release 143
ndash local - Use compiled JavaScript files in the local Escher installation Works offline
ndash dev - No longer necessary with source maps This now gives the same behavior aslsquolocalrsquo
bull menu (string) ndash Menu bar options include
ndash none - No menu or buttons
ndash zoom - Just zoom buttons
ndash all (Default) - Menu and button bar (requires Bootstrap)
bull scroll_behavior (string) ndash Scroll behavior options
ndash pan - Pan the map
ndash zoom - Zoom the map
ndash none (Default) - No scroll events
bull enable_editing (Boolean) ndash Enable the map editing modes
bull enable_keys (Boolean) ndash Enable keyboard shortcuts
bull minified_js (Boolean) ndash If True use the minified version of JavaScript and CSSfiles
bull never_ask_before_quit (Boolean) ndash Never display an alert asking if you wantto leave the page By default this message is displayed if enable_editing is True
display_in_notebook(js_source=rsquowebrsquo menu=rsquozoomrsquo scroll_behavior=rsquononersquo mini-fied_js=True height=500 enable_editing=False)
Embed the Map within the current IPython Notebook
Parameters
bull js_source (string) ndash Can be one of the following
ndash web (Default) - Use JavaScript files from eschergithubio
ndash local - Use compiled JavaScript files in the local Escher installation Works offline
ndash dev - No longer necessary with source maps This now gives the same behav-ior as lsquolocalrsquo
bull menu (string) ndash Menu bar options include
ndash none - No menu or buttons
ndash zoom - Just zoom buttons
ndash Note The all menu option does not work in an IPython notebook
bull scroll_behavior (string) ndash Scroll behavior options
ndash pan - Pan the map
ndash zoom - Zoom the map
ndash none - (Default) No scroll events
bull minified_js (Boolean) ndash If True use the minified version of JavaScript andCSS files
bull height ndash Height of the HTML container
bull enable_editing (Boolean) ndash Enable the map editing modes
46 Chapter 7 Contents
Escher Documentation Release 143
save_html(filepath=None overwrite=False js_source=rsquowebrsquo protocol=rsquohttpsrsquo menu=rsquoallrsquoscroll_behavior=rsquopanrsquo enable_editing=True enable_keys=True minified_js=Truenever_ask_before_quit=False static_site_index_json=None)
Save an HTML file containing the map
Parameters
bull filepath (string) ndash The HTML file will be saved to this location Whenjs_source is lsquolocalrsquo then a new directory will be created with this name
bull overwrite (Boolean) ndash Overwrite existing files
bull js_source (string) ndash Can be one of the following
ndash web (Default) - Use JavaScript files from eschergithubio
ndash local - Use compiled JavaScript files in the local Escher installation Works of-fline To make the dependencies available to the downloaded file a new directorywill be made with the name specified by filepath
ndash dev - No longer necessary with source maps This now gives the same behav-ior as lsquolocalrsquo
bull protocol (string) ndash The protocol can be lsquohttprsquo lsquohttpsrsquo or None which indicatesa lsquoprotocol relative URLrsquo as in eschergithubio Ignored if source is local
bull menu (string) ndash Menu bar options include
ndash none - No menu or buttons
ndash zoom - Just zoom buttons
ndash all (Default) - Menu and button bar (requires Bootstrap)
bull scroll_behavior (string) ndash Scroll behavior options
ndash pan - Pan the map
ndash zoom - Zoom the map
ndash none (Default) - No scroll events
bull enable_editing (Boolean) ndash Enable the map editing modes
bull enable_keys (Boolean) ndash Enable keyboard shortcuts
bull minified_js (Boolean) ndash If True use the minified version of JavaScript andCSS files
bull height (number) ndash Height of the HTML container
bull never_ask_before_quit (Boolean) ndash Never display an alert asking if youwant to leave the page By default this message is displayed if enable_editing isTrue
bull static_site_index_json (string) ndash The index as a JSON string for thestatic site Use javascript to parse the URL options Used for generating static pages(see static_sitepy)
791 Cache
escherget_cache_dir(versioned=True name=None)Get the cache dir as a string and make the directory if it does not already exist
Parameters
79 Python API 47
Escher Documentation Release 143
bull versioned (Boolean) ndash Whether to return the versioned path in the cache Eschermaps for the latest version of Escher are found in the versioned directory (versioned= True) but maps for previous versions of Escher can be found by visiting the parentdirectory (versioned = False)
bull name (string) ndash An optional subdirectory within the cache If versioned is False thenname is ignored
escherclear_cache(different_cache_dir=None ask=True)Empty the contents of the cache directory including all versions of all maps and models
Parameters
bull different_cache_dir (string) ndash (Optional) The directory of another cacheThis is mainly for testing
bull ask (Boolean) ndash Whether to ask before deleting
escherlist_cached_maps()Return a list of all cached maps
escherlist_cached_models()Return a list of all cached models
escherlist_available_maps()Return a list of all maps available on the server
escherlist_available_models()Return a list of all models available on the server
710 License
Escher and EscherConverter are distributed under the MIT license
bull genindex
48 Chapter 7 Contents
Python Module Index
eescher 44
49
Escher Documentation Release 143
50 Python Module Index
Index
Bbrush_mode() (built-in function) 43build_mode() (built-in function) 43Builder (class in escher) 44
Cclear_cache() (in module escher) 48
Ddisplay_in_browser() (escherBuilder method) 45display_in_notebook() (escherBuilder method) 46
Eescher (module) 44escherBuilder() (class) 39
Gget_cache_dir() (in module escher) 47
Llist_available_maps() (in module escher) 48list_available_models() (in module escher) 48list_cached_maps() (in module escher) 48list_cached_models() (in module escher) 48load_map() (built-in function) 42load_model() (built-in function) 43
Ooptionenable_keys (option attribute) 40optionsallow_building_duplicate_reactions (options at-
tribute) 42optionsand_method_in_gene_reaction_rule (options at-
tribute) 41optionscofactors (options attribute) 42optionsenable_editing (options attribute) 39optionsenable_search (options attribute) 40optionsfill_screen (options attribute) 40optionsfirst_load_callback (options attribute) 42optionsfull_screen_button (options attribute) 40optionsgene_data (options attribute) 41
optionsgene_font_size (options attribute) 40optionshide_all_labels (options attribute) 40optionshide_secondary_metabolites (options attribute)
40optionshighlight_missing (options attribute) 42optionsidentifiers_on_map (options attribute) 42optionsignore_bootstrap (options attribute) 40optionsmarker_radius (options attribute) 40optionsmenu (options attribute) 39optionsmetabolite_compare_style (options attribute) 42optionsmetabolite_data (options attribute) 42optionsmetabolite_no_data_color (options attribute) 42optionsmetabolite_no_data_size (options attribute) 42optionsmetabolite_scale (options attribute) 42optionsmetabolite_styles (options attribute) 42optionsnever_ask_before_quit (options attribute) 40optionsprimary_metabolite_radius (options attribute) 40optionsreaction_compare_style (options attribute) 41optionsreaction_data (options attribute) 40optionsreaction_no_data_color (options attribute) 41optionsreaction_no_data_size (options attribute) 41optionsreaction_scale (options attribute) 41optionsreaction_styles (options attribute) 41optionsscroll_behavior (options attribute) 39optionssecondary_metabolite_radius (options attribute)
40optionsshow_gene_reaction_rules (options attribute) 40optionsstarting_reaction (options attribute) 40optionsunique_map_id (options attribute) 40optionsuse_3d_transform (options attribute) 39
Rrotate_mode() (built-in function) 43
Ssave_html() (escherBuilder method) 46set_gene_data() (built-in function) 43set_metabolite_data() (built-in function) 43set_reaction_data() (built-in function) 43
51
Escher Documentation Release 143
Ttext_mode() (built-in function) 43
Vview_mode() (built-in function) 43
Zzoom_mode() (built-in function) 43
52 Index
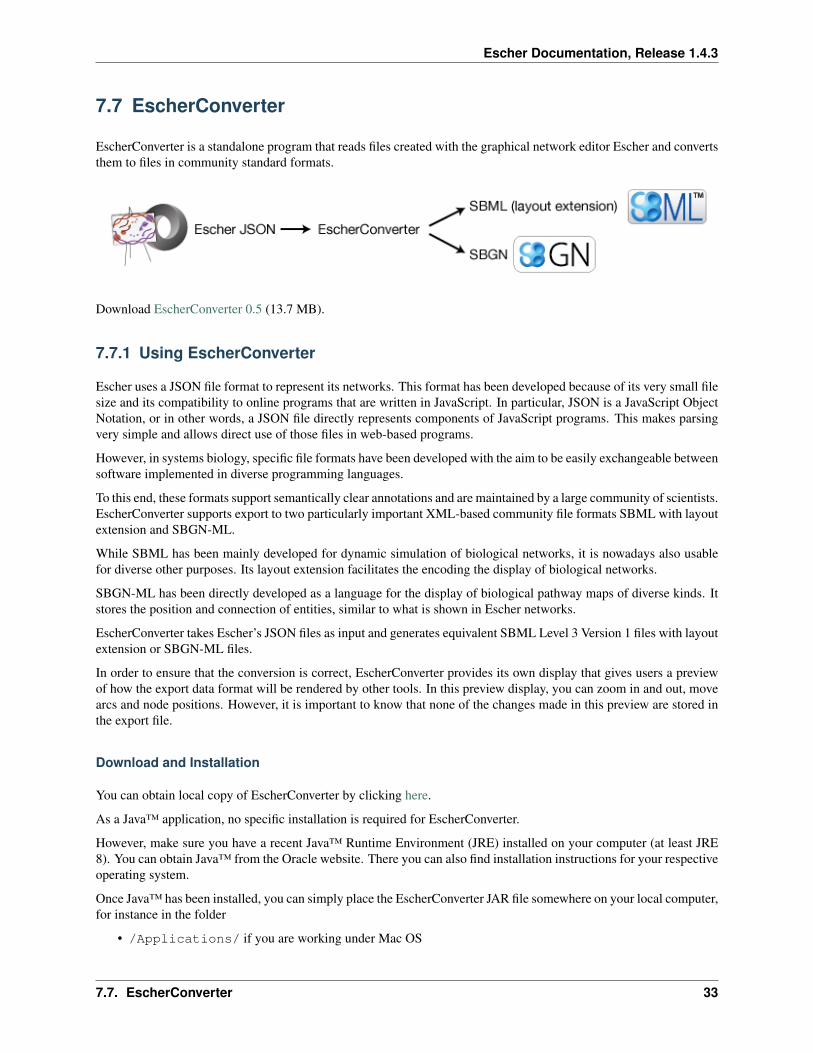
Escher Documentation Release 143
bull opt for Linux computers
bull CProgram Files if you are using Windows
Launching the program
You can launch EscherConverter simply by double-clicking on the application JAR file This will open a followinggraphical user interface as described in the following figures
Figure 1 | The graphical user interface of EscherConverter
bull Preferences opens a settings dialog (see next screenshot)
bull Open displays a file chooser to select an input file in JSON format
bull Save export the map that is displayed in the current tab to SBML or SBGN-ML
bull Discard closes the current tab without saving
bull Help opens the online help that displays all command-line options
bull License displays the license under which this software is distributed
bull About shows information about the authors of this software
bull Main the main panel of the software in which converted Escher maps will be displayed organized in tabs
bull Status the status bar shows information and logging messages during the conversion
34 Chapter 7 Contents
Escher Documentation Release 143
Figure 2 | The preferences dialog All settings in this dialog are also available through EscherConverterrsquos command-line interface
Layout section several properties that are required in SBML and SBGN-ML are not explicitly specified in EscherrsquosJSON format and therefore need to be adjusted by the user These are the size of the drawing canvas the default boxsize for text labels the size of primary and secondary nodes In contrast to SBGN-ML and Escherrsquos JSON formatthe SBML layout extension supports three-dimensional displays When selecting this export file format it is thereforenecessary to also define the z-coordinate and the depth of all objects
Components and naming section Most settings in this section are specific for the SBML layout extension and areonly active if this output format is selected These are names and identifiers of the layout component and the in caseof SBML mandatory default compartment (a compartment without physical meaning a reaction space in which allmetabolites are located) EscherConverter can infer compartment bounds from metabolites but this is an experimentalfeature Just try it and see how the preview changes
77 EscherConverter 35
Escher Documentation Release 143
Figure 3 | A layout preview
The birds-eye view and the navigation component on the left help you navigate through the network display Thisgraph shows you how the converted pathway map will be rendered by software that supports SBGN-ML or the SBMLlayout extension This preview can be modified by moving arcs or nodes however none of those changes are storedwhen exporting the file In this current version EscherConver only exports layouts as given in the original JSON file
Included third-party software
EscherConverter includes several third-party libraries which we here list and acknowledge
bull ArgParser
bull JSBML
bull libSBGN
bull Pixel-Mixer icons
bull yFiles
772 Command-line interface API
You can launch EscherConverter from the command-line On a Unix system (such as Linux MacOS or Solaris etc)use a command like
bash$ java -jar -Xms8G -Xmx8G -Duserlanguage=en EscherConverter-05jar [options]
Under Window use a command like
Cgt javaw -jar -Xms8G -Xmx8G -Duserlanguage=en EscherConverter-05jar [options]
Escher has a large collection of command-line options (see below) which can be useful if you want to launch theprogram with specific settings or if multiple files are to be converted in a batch mode It is even possible to completelydisable the graphical user interface
36 Chapter 7 Contents
Escher Documentation Release 143
Input and output files
Definition of input and output data files as well as the format for the output
--input=ltFilegt
Specifies the JSON input file If a directory is given the conversion will be recursively performed Accepts JSON
--output=ltFilegt
The path to the file into which the output should be written If the input is a directory this must also be a directory inorder to perform a recursive conversion Accepts SBML SBGN
Escher layout
The options in this group allow you to influence how large certain elements should be displayed
--canvas-default-height=ltDoublegt
Just as in the case of the width of the canvas this value needs to be specified for cases where the JSON input file lacksan explicit specification of the canvas height Arguments must fit into the range [11E9] (Default value 2500)
--canvas-default-width=ltDoublegt
This value is used when no width has been defined for the canvas Since the width attribute is mandatory for the layouta default value must be provided in these cases Arguments must fit into the range [11E9] (Default value 2500)
--label-height=ltDoublegt
With this option you can specify the height of the bounding box of text labels Arguments must fit into the range[11E9] (Default value 500)
--label-width=ltDoublegt
This option defines the width of bounding boxes for text labels Arguments must fit into the range [11E9] (Defaultvalue 1600)
--node-depth=ltDoublegt
The length of nodes along z-coordinate Escher maps are actually two-dimensional but in general a layout can bethree-dimensional This value should be an arbitrary value greater than zero because some rendering engines mightnot display the node if its depth is zero Arguments must fit into the range [11E9] (Default value 10)
--node-label-height=ltDoublegt
Node labels can have a size different from general labels in the graph Here you can specify how height the boundingbox of the labels for nodes should be Arguments must fit into the range [11E9] (Default value 200)
--primary-node-height=ltDoublegt
The primary node should be bigger than the secondary node With this option you can specify the height of this typeof nodes Arguments must fit into the range [11E9] (Default value 300)
--primary-node-width=ltDoublegt
Escher maps distinguish between primary and secondary nodes Primary nodes should be larger than secondary nodesand display the main flow of matter through the network This option allows you to specify the width of primarynodes Arguments must fit into the range [11E9] (Default value 300)
77 EscherConverter 37
Escher Documentation Release 143
--reaction-label-height=ltDoublegt
Reaction label heightArguments must fit into the range [11E9] (Default value 300)
--reaction-node-ratio=ltDoublegt
This value is used as a conversion factor to determine the size of the reaction display box depending on the size ofprimary nodes Height and width of reaction nodes are determined by dividing the corresponding values from theprimary node size by this factor Arguments must fit into the range [01] (Default value 05)
--secondary-node-ratio=ltDoublegt
Similar to the reaction node ratio the size of secondary nodes (width and height) is determined by dividing thecorresponding values from the primary nodes by this value Arguments must fit into the range [01] (Default value06666666666666666)
--z=ltDoublegt
The position on the z-axis where the entire two-dimensional graph should be drawn Arguments must fit into the range[-1E91E9] (Default value 00)
Escher Components and their naming
Here you can influence which elements are to be included in the layout and how elements in the layout are to be calledor identified
--format=ltOutputFormatgt
The desired format for the conversion eg SBML All possible values for type ltOutputFormatgt are SBGN andSBML (Default value SBML)
--layout-id=ltStringgt
In contrast to the name this identifier does not have to be human-readable This is a machine identifier which muststart with a letter or underscore and can only contain ASCII characters (Default value Escher_Layout)
--layout-name=ltStringgt
This should be a human-readable name for the layout that is to be created This name might be displayed to describethe figure and should therefore be explanatory (Default value Escher Layout)
--compartment-id=ltStringgt
A compartment needs to have a unique identifier which needs to be a machine-readable Sting that must start with aletter or underscore and can only contain ASCII characters Since the JSON file does not provide this information thisoption allows you to specify the required identifier (Default value default)
--compartment-name=ltStringgt
With this option it is possible to define a name for the default compartment can be that needs to be generated for theconversion to SBML The name does not have any restrictions ie any UTF-8 character can be used (Default valueDefault compartment)
--infer-compartment-bounds
This converter can infer where the boundaries of compartments could be drawn To this end it uses each nodersquos BiGGids to identify the compartment of all metabolites Assuming that compartments have rectangular shapes the algorithmcan find the outermost node on each side of the box and hence obtain the boundaries of the compartment However
38 Chapter 7 Contents
Escher Documentation Release 143
this methods will fail when metabolites are drawn inside of such a box that belong to a different compartment that isactually further outside For this reason this option is deactivated by default (Default value false)
Options for the graphical user interface
--gui
If this option is given the program will display its graphical user interface (Default value false)
--log-level=ltStringgt
Change the log-level of this application This option will influence how fine-grained error and other log messages willbe that you receive while executing this program All possible values for type ltStringgt are ALL CONFIG FINEFINER FINEST INFO OFF SEVERE and WARNING (Default value INFO)
--log-file=ltFilegt
This option allows you to specify a log file to which all information of the program will be written Accepts (bp2bp3 log owl xml)
78 JavaScript API
class escherBuilder(map_data model_data embedded_css selection options)A Builder object contains all the UI and logic to generate a map builder or viewer
Arguments
bull map_data (object) ndash The data for a map to be passed to escherMapfrom_data() Ifnull then an empty Builder is initialized
bull model_data (object) ndash The data for a cobra model to be passed to es-cherCobraModel() Can be null
bull embedded_css (string) ndash The stylesheet for the SVG elements in the Escher map
bull selection (object) ndash (Optional Default In the body element) The d3 selection of anelement to place the Builder into The selection cannot be inside an SVG element
bull options (object) ndash (Optional) An object defining any of the following options
optionsmenu(Default rsquoallrsquo) The type of menu that will be displayed Can be lsquoallrsquo for the fullmenu or lsquozoomrsquo for just zoom buttons The lsquoallrsquo option requires the full set of Escherdependencies (D3js JQuery and Bootstrap) while the lsquozoomrsquo option requires only D3jsFor more details see Developing with Escher
optionsscroll_behavior(Default rsquopanrsquo) This option determines the effect that the scroll wheel will have onan Escher map Can be lsquopanrsquo to pan the map or lsquozoomrsquo to zoom the map when the usermoves the scroll wheel
optionsuse_3d_transform(Default Chooses a good option by testing the browser) If true then use CSS3 3D trans-forms to speed up panning and zooming This feature will only work on browsers thatsupport the 3D transforms It works best in the latest versions of Chrome Firefox andInternet Explorer Safari works better with this turned off
78 JavaScript API 39
Escher Documentation Release 143
optionsenable_editing(Default true) If true then display the map editing functions If false then hide themand only allow the user to view the map
optionenable_keys(Default true) If true then enable keyboard shortcuts
optionsenable_search(Default true) If true then enable indexing of the map for search Use false to disablesearching and potentially improve the map performance
optionsfill_screen(Default false) Use true to fill the screen when an Escher Builder is placed in a top-level container (eg a div in the body element)
optionsfull_screen_button(Default false) Include a button in the user interface for entering full screen mode
optionsignore_bootstrap(Default false) Do not use Bootstrap for buttons even if it available This is used toembed Escher in a Jupyter notebook where it conflicts with the Jupyter Boostrap installa-tion
Map model and styles
optionsstarting_reaction(Default null) The ID (as a string) of a reaction to draw when the Builder loads
optionsnever_ask_before_quit(Default false) If false then display a warning before the user closes an Eschermap If true then never display the warning This options is only respected if op-tionsenable_editing == true If enable_editing is false then the warnings are not dis-played
optionsunique_map_id(Default null) A unique ID that will be used to UI elements donrsquot interfere whenmultiple maps are in the same HTML document
optionsprimary_metabolite_radius(Default 15) The radius of primary metabolites in px
optionssecondary_metabolite_radius(Default 10) The radius of secondary metabolites in px
optionsmarker_radius(Default 5) The radius of marker nodes in px
optionsgene_font_size(Default 18) The font size of the gene reaction rules in px
optionshide_secondary_metabolites(Default false) If true then secondary nodes and segments are hidden This is conve-nient for generating simplified map figures
optionsshow_gene_reaction_rules(Default false) If true then show the gene reaction rules even without gene data
optionshide_all_labels(Default false) If checked hide all reaction gene and metabolite labels
Applied data
40 Chapter 7 Contents
Escher Documentation Release 143
optionsreaction_data(Default null) An object with reaction ids for keys and reaction data points for values
optionsreaction_stylesDefault [rsquocolorrsquo rsquosizersquo rsquotextrsquo]
An array of style types The array can contain any of the following lsquocolorrsquo lsquosizersquo lsquotextrsquolsquoabsrsquo The lsquocolorrsquo style means that the reactions will be colored according to the loadeddataset The lsquosizersquo style means that the reactions will be sized according to the loadeddataset The lsquotextrsquo style means that the data values will be displayed in the reactionlabels The lsquoabsrsquo style means the the absolute values of reaction values will be used fordata visualization
optionsreaction_compare_style(Default rsquodiffrsquo) How to compare to datasets Can be either lsquofold lsquolog2_foldrsquo orlsquodiffrsquo
optionsreaction_scaleDefault
[ type min color c8c8c8 size 12 type median color 9696ff size 20 type max color ff0000 size 25 ]
An array of objects that define points on the data scale
Each point is an object with a type attribute Types can be lsquominrsquo lsquomaxrsquo lsquomeanrsquo lsquoQ1rsquo (firstquartile) lsquomedianrsquo lsquoQ3rsquo (third quartile) or lsquovaluersquo Each point can have a color attributethat specifies a color with a string (any CSS color specification is allowed including hexrgb and rgba) Each point can have a size attirbute that specifies a reaction thickness as anumber Finally points with type lsquovaluersquo can have a value attribute that specifies an exactnumber for pont in the scale
NOTE If lsquominrsquo or lsquomaxrsquo is not provided Escher automatically adds them To be com-pletely clear about what you expect to see on the map it is best to provide lsquominrsquo andlsquomaxrsquo in addition to other scale points
Here are examples of each type
type rsquominrsquo color rsquoredrsquo size 12 Specifies that reactionsnear the minimum value are red and have thickness 12
type rsquoQ1rsquo color rsquorgba(100 100 50 05)rsquo size 12 Specifies that reactions near the first quartile have the given color opacity andthickness
type rsquomeanrsquo color rsquorgb(100 100 50)rsquo size 50 Specifies that reactions near the mean value have the given color and thickness
type rsquovaluersquo value 85 color rsquo333rsquo size 50 Specifies that reactions near 85 value have the given color and size
optionsreaction_no_data_color(Default rsquodcdcdcrsquo) The color of reactions with no data value
optionsreaction_no_data_size(Default 8) The size of reactions with no data value
optionsgene_data(Default null) An object with Gene ids for keys and gene data points for values
78 JavaScript API 41
Escher Documentation Release 143
optionsand_method_in_gene_reaction_rule(Default mean) When evaluating a gene reaction rule use this function to evaluate ANDrules Can be lsquomeanrsquo or lsquominrsquo
optionsmetabolite_data(Default null) An object with metabolite ids for keys and metabolite data points forvalues
optionsmetabolite_stylesDefault [rsquocolorrsquo rsquosizersquo rsquotextrsquo]
An array of style types The array can contain any of the following lsquocolorrsquo lsquosizersquo lsquotextrsquolsquoabsrsquo The lsquocolorrsquo style means that the metabolites will be colored according to the loadeddataset The lsquosizersquo style means that the metabolites will be sized according to the loadeddataset The lsquotextrsquo style means that the data values will be displayed in the metabolitelabels The lsquoabsrsquo style means the the absolute values of metabolite values will be used fordata visualization
optionsmetabolite_compare_style(Default rsquodiffrsquo) How to compare to datasets Can be either lsquofoldrsquo lsquolog2_foldrsquo orlsquodiffrsquo
optionsmetabolite_scaleDefault
[ type min color fffaf0 size 20 type median color f1c470 size 30 type max color 800000 size 40 ]
An array of objects that define points on the data scale See the description of op-tionsreaction_scale for an explanation of the format
optionsmetabolite_no_data_color(Default rsquoffffffrsquo) The color of metabolites with no data value
optionsmetabolite_no_data_size(Default 10) The size of metabolites with no data value
View and build options
optionsidentifiers_on_map(Default rsquobigg_idrsquo) The identifiers that will be displayed in reaction metabolite andgene labels Can be lsquobigg_idrsquo or lsquonamersquo
optionshighlight_missing(Default false) If true then highlight in red reactions that are not in the loaded COBRAmodel
optionsallow_building_duplicate_reactions(Default true) If true then building duplicate reactions is allowed If false then dupli-cate reactions are hidden in Add reaction mode
optionscofactors(Default [rsquoatprsquo rsquoadprsquo rsquonadrsquo rsquonadhrsquo rsquonadprsquo rsquonadphrsquorsquogtprsquo rsquogdprsquo rsquohrsquo rsquocoarsquo rsquoumprsquo rsquoh20rsquo rsquoppirsquo]) A list of metabo-lite IDs to treat as cofactors These will be secondary metabolites in new reactions
Callbacks
optionsfirst_load_callbackA function to run after loading the Builder
42 Chapter 7 Contents
Escher Documentation Release 143
load_map(map_data[ should_update_data])Load a map for the loaded data Also reloads most of the Builder content
Arguments
bull map_data ndash The data for a map
bull should_update_data (Boolean) ndash (Default true) Whether data should be ap-plied to the map
load_model(model_data[ should_update_data])Load the cobra model from model data
Arguments
bull model_data ndash The data for a Cobra model (Parsing in done by escherCobraModel)
bull should_update_data (Boolean) ndash (Default true) Whether data should be ap-plied to the model
view_mode()Enter view mode
build_mode()Enter build mode
brush_mode()Enter brush mode
zoom_mode()Enter zoom mode
rotate_mode()Enter rotate mode
text_mode()Enter text mode
set_reaction_data(data)
Arguments
bull data (array) ndash An array of 1 or 2 objects where each object has keys that are reactionIDrsquos and values that are data points (numbers)
set_metabolite_data(data)
Arguments
bull data (array) ndash An array of 1 or 2 objects where each object has keys that are metaboliteIDrsquos and values that are data points (numbers)
set_gene_data(data clear_gene_reaction_rules)
Arguments
bull data (array) ndash An array of 1 or 2 objects where each object has keys that are gene IDrsquosand values that are data points (numbers)
Arguments
bull clear_gene_reaction_rules (Boolean) ndash (Optional Default false) In addi-tion to setting the data also turn of the gene_reaction_rules
78 JavaScript API 43
Escher Documentation Release 143
79 Python API
class escherBuilder(map_name=None map_json=None model=None model_name=Nonemodel_json=None embedded_css=None reaction_data=None metabo-lite_data=None gene_data=None local_host=None id=None safe=Falsekwargs)
A metabolic map that can be viewed edited and used to visualize data
This map will also show metabolic fluxes passed in during consruction It can be viewed as a standalone htmlinside a browswer Alternately the respresentation inside an IPython notebook will also display the map
Maps are stored in json files and are stored in a cache directory Maps which are not found will be downloadedfrom a map repository if found
Parameters
bull map_name ndash A string specifying a map to be downloaded from the Escher web server orloaded from the cache
bull map_json ndash A JSON string or a file path to a JSON file or a URL specifying a JSON fileto be downloaded
bull model ndash A Cobra model
bull model_name ndash A string specifying a model to be downloaded from the Escher web serveror loaded from the cache
bull model_json ndash A JSON string or a file path to a JSON file or a URL specifying a JSONfile to be downloaded
bull embedded_css ndash The CSS (as a string) to be embedded with the Escher SVG
bull reaction_data ndash A dictionary with keys that correspond to reaction ids and values thatwill be mapped to reaction arrows and labels
bull metabolite_data ndash A dictionary with keys that correspond to metabolite ids and valuesthat will be mapped to metabolite nodes and labels
bull gene_data ndash A dictionary with keys that correspond to gene ids and values that will bemapped to corresponding reactions
bull local_host ndash A hostname that will be used for any local files This is generally usedfor using the notebook offline and for testing in the IPython Notebook with modified Eschercode An example value for local_host is lsquohttplocalhost7778lsquo
bull id ndash Specify an id to make the javascript data definitions unique A random id is chosen bydefault
bull safe ndash If True then loading files from the filesytem is not allowed This is to ensure thesafety of using Builder within a web server
Keyword Arguments
These are defined in the Javascript API
bulluse_3d_transform
bullenable_search
bullfill_screen
bullzoom_to_element
bullfull_screen_button
44 Chapter 7 Contents
Escher Documentation Release 143
bullstarting_reaction
bullunique_map_id
bullprimary_metabolite_radius
bullsecondary_metabolite_radius
bullmarker_radius
bullgene_font_size
bullhide_secondary_metabolites
bullshow_gene_reaction_rules
bullhide_all_labels
bullreaction_styles
bullreaction_compare_style
bullreaction_scale
bullreaction_no_data_color
bullreaction_no_data_size
bulland_method_in_gene_reaction_rule
bullmetabolite_styles
bullmetabolite_compare_style
bullmetabolite_scale
bullmetabolite_no_data_color
bullmetabolite_no_data_size
bullidentifiers_on_map
bullhighlight_missing
bullallow_building_duplicate_reactions
bullcofactors
All keyword arguments can also be set on an existing Builder object using setter functions eg
my_builderset_reaction_styles(new_styles)
display_in_browser(ip=lsquo127001rsquo port=7655 n_retries=50 js_source=rsquowebrsquo menu=rsquoallrsquoscroll_behavior=rsquopanrsquo enable_editing=True enable_keys=True mini-fied_js=True never_ask_before_quit=False)
Launch a web browser to view the map
Parameters
bull ip ndash The IP address to serve the map on
bull port ndash The port to serve the map on If specified the port is occupied then a random freeport will be used
bull n_retries (int) ndash The number of times the server will try to find a port before quitting
bull js_source (string) ndash Can be one of the following
ndash web (Default) - Use JavaScript files from eschergithubio
79 Python API 45
Escher Documentation Release 143
ndash local - Use compiled JavaScript files in the local Escher installation Works offline
ndash dev - No longer necessary with source maps This now gives the same behavior aslsquolocalrsquo
bull menu (string) ndash Menu bar options include
ndash none - No menu or buttons
ndash zoom - Just zoom buttons
ndash all (Default) - Menu and button bar (requires Bootstrap)
bull scroll_behavior (string) ndash Scroll behavior options
ndash pan - Pan the map
ndash zoom - Zoom the map
ndash none (Default) - No scroll events
bull enable_editing (Boolean) ndash Enable the map editing modes
bull enable_keys (Boolean) ndash Enable keyboard shortcuts
bull minified_js (Boolean) ndash If True use the minified version of JavaScript and CSSfiles
bull never_ask_before_quit (Boolean) ndash Never display an alert asking if you wantto leave the page By default this message is displayed if enable_editing is True
display_in_notebook(js_source=rsquowebrsquo menu=rsquozoomrsquo scroll_behavior=rsquononersquo mini-fied_js=True height=500 enable_editing=False)
Embed the Map within the current IPython Notebook
Parameters
bull js_source (string) ndash Can be one of the following
ndash web (Default) - Use JavaScript files from eschergithubio
ndash local - Use compiled JavaScript files in the local Escher installation Works offline
ndash dev - No longer necessary with source maps This now gives the same behav-ior as lsquolocalrsquo
bull menu (string) ndash Menu bar options include
ndash none - No menu or buttons
ndash zoom - Just zoom buttons
ndash Note The all menu option does not work in an IPython notebook
bull scroll_behavior (string) ndash Scroll behavior options
ndash pan - Pan the map
ndash zoom - Zoom the map
ndash none - (Default) No scroll events
bull minified_js (Boolean) ndash If True use the minified version of JavaScript andCSS files
bull height ndash Height of the HTML container
bull enable_editing (Boolean) ndash Enable the map editing modes
46 Chapter 7 Contents
Escher Documentation Release 143
save_html(filepath=None overwrite=False js_source=rsquowebrsquo protocol=rsquohttpsrsquo menu=rsquoallrsquoscroll_behavior=rsquopanrsquo enable_editing=True enable_keys=True minified_js=Truenever_ask_before_quit=False static_site_index_json=None)
Save an HTML file containing the map
Parameters
bull filepath (string) ndash The HTML file will be saved to this location Whenjs_source is lsquolocalrsquo then a new directory will be created with this name
bull overwrite (Boolean) ndash Overwrite existing files
bull js_source (string) ndash Can be one of the following
ndash web (Default) - Use JavaScript files from eschergithubio
ndash local - Use compiled JavaScript files in the local Escher installation Works of-fline To make the dependencies available to the downloaded file a new directorywill be made with the name specified by filepath
ndash dev - No longer necessary with source maps This now gives the same behav-ior as lsquolocalrsquo
bull protocol (string) ndash The protocol can be lsquohttprsquo lsquohttpsrsquo or None which indicatesa lsquoprotocol relative URLrsquo as in eschergithubio Ignored if source is local
bull menu (string) ndash Menu bar options include
ndash none - No menu or buttons
ndash zoom - Just zoom buttons
ndash all (Default) - Menu and button bar (requires Bootstrap)
bull scroll_behavior (string) ndash Scroll behavior options
ndash pan - Pan the map
ndash zoom - Zoom the map
ndash none (Default) - No scroll events
bull enable_editing (Boolean) ndash Enable the map editing modes
bull enable_keys (Boolean) ndash Enable keyboard shortcuts
bull minified_js (Boolean) ndash If True use the minified version of JavaScript andCSS files
bull height (number) ndash Height of the HTML container
bull never_ask_before_quit (Boolean) ndash Never display an alert asking if youwant to leave the page By default this message is displayed if enable_editing isTrue
bull static_site_index_json (string) ndash The index as a JSON string for thestatic site Use javascript to parse the URL options Used for generating static pages(see static_sitepy)
791 Cache
escherget_cache_dir(versioned=True name=None)Get the cache dir as a string and make the directory if it does not already exist
Parameters
79 Python API 47
Escher Documentation Release 143
bull versioned (Boolean) ndash Whether to return the versioned path in the cache Eschermaps for the latest version of Escher are found in the versioned directory (versioned= True) but maps for previous versions of Escher can be found by visiting the parentdirectory (versioned = False)
bull name (string) ndash An optional subdirectory within the cache If versioned is False thenname is ignored
escherclear_cache(different_cache_dir=None ask=True)Empty the contents of the cache directory including all versions of all maps and models
Parameters
bull different_cache_dir (string) ndash (Optional) The directory of another cacheThis is mainly for testing
bull ask (Boolean) ndash Whether to ask before deleting
escherlist_cached_maps()Return a list of all cached maps
escherlist_cached_models()Return a list of all cached models
escherlist_available_maps()Return a list of all maps available on the server
escherlist_available_models()Return a list of all models available on the server
710 License
Escher and EscherConverter are distributed under the MIT license
bull genindex
48 Chapter 7 Contents
Python Module Index
eescher 44
49
Escher Documentation Release 143
50 Python Module Index
Index
Bbrush_mode() (built-in function) 43build_mode() (built-in function) 43Builder (class in escher) 44
Cclear_cache() (in module escher) 48
Ddisplay_in_browser() (escherBuilder method) 45display_in_notebook() (escherBuilder method) 46
Eescher (module) 44escherBuilder() (class) 39
Gget_cache_dir() (in module escher) 47
Llist_available_maps() (in module escher) 48list_available_models() (in module escher) 48list_cached_maps() (in module escher) 48list_cached_models() (in module escher) 48load_map() (built-in function) 42load_model() (built-in function) 43
Ooptionenable_keys (option attribute) 40optionsallow_building_duplicate_reactions (options at-
tribute) 42optionsand_method_in_gene_reaction_rule (options at-
tribute) 41optionscofactors (options attribute) 42optionsenable_editing (options attribute) 39optionsenable_search (options attribute) 40optionsfill_screen (options attribute) 40optionsfirst_load_callback (options attribute) 42optionsfull_screen_button (options attribute) 40optionsgene_data (options attribute) 41
optionsgene_font_size (options attribute) 40optionshide_all_labels (options attribute) 40optionshide_secondary_metabolites (options attribute)
40optionshighlight_missing (options attribute) 42optionsidentifiers_on_map (options attribute) 42optionsignore_bootstrap (options attribute) 40optionsmarker_radius (options attribute) 40optionsmenu (options attribute) 39optionsmetabolite_compare_style (options attribute) 42optionsmetabolite_data (options attribute) 42optionsmetabolite_no_data_color (options attribute) 42optionsmetabolite_no_data_size (options attribute) 42optionsmetabolite_scale (options attribute) 42optionsmetabolite_styles (options attribute) 42optionsnever_ask_before_quit (options attribute) 40optionsprimary_metabolite_radius (options attribute) 40optionsreaction_compare_style (options attribute) 41optionsreaction_data (options attribute) 40optionsreaction_no_data_color (options attribute) 41optionsreaction_no_data_size (options attribute) 41optionsreaction_scale (options attribute) 41optionsreaction_styles (options attribute) 41optionsscroll_behavior (options attribute) 39optionssecondary_metabolite_radius (options attribute)
40optionsshow_gene_reaction_rules (options attribute) 40optionsstarting_reaction (options attribute) 40optionsunique_map_id (options attribute) 40optionsuse_3d_transform (options attribute) 39
Rrotate_mode() (built-in function) 43
Ssave_html() (escherBuilder method) 46set_gene_data() (built-in function) 43set_metabolite_data() (built-in function) 43set_reaction_data() (built-in function) 43
51
Escher Documentation Release 143
Ttext_mode() (built-in function) 43
Vview_mode() (built-in function) 43
Zzoom_mode() (built-in function) 43
52 Index
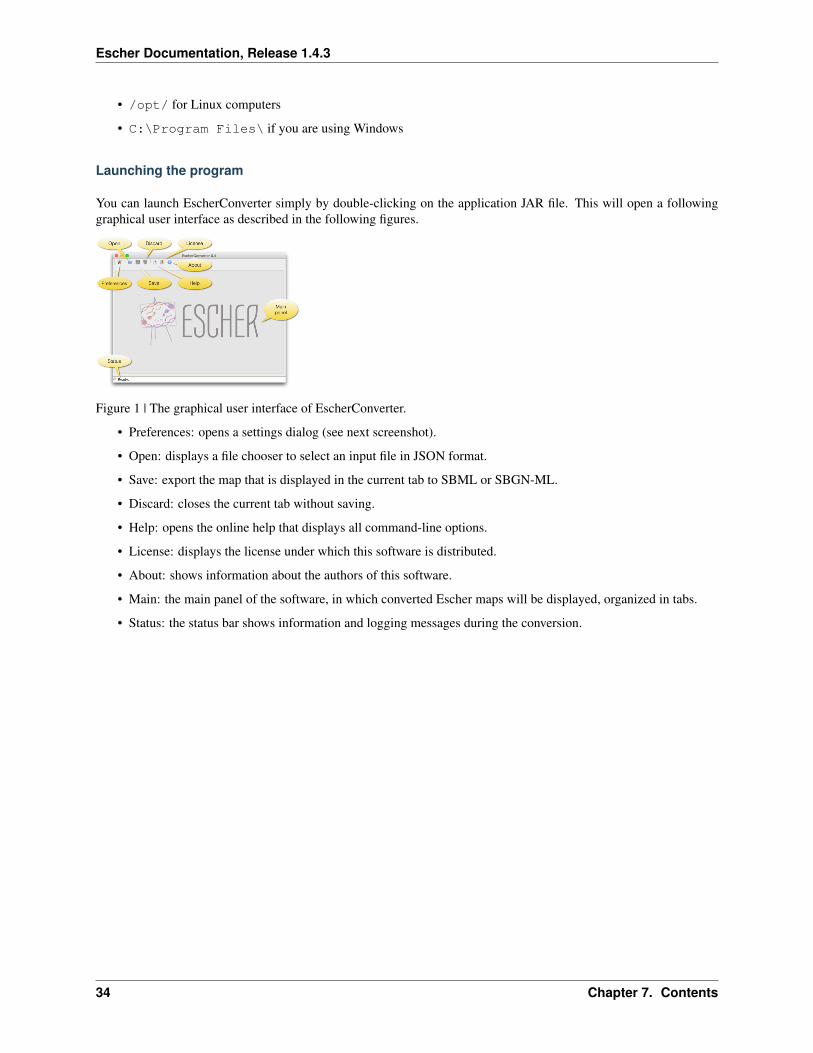
Escher Documentation Release 143
Figure 2 | The preferences dialog All settings in this dialog are also available through EscherConverterrsquos command-line interface
Layout section several properties that are required in SBML and SBGN-ML are not explicitly specified in EscherrsquosJSON format and therefore need to be adjusted by the user These are the size of the drawing canvas the default boxsize for text labels the size of primary and secondary nodes In contrast to SBGN-ML and Escherrsquos JSON formatthe SBML layout extension supports three-dimensional displays When selecting this export file format it is thereforenecessary to also define the z-coordinate and the depth of all objects
Components and naming section Most settings in this section are specific for the SBML layout extension and areonly active if this output format is selected These are names and identifiers of the layout component and the in caseof SBML mandatory default compartment (a compartment without physical meaning a reaction space in which allmetabolites are located) EscherConverter can infer compartment bounds from metabolites but this is an experimentalfeature Just try it and see how the preview changes
77 EscherConverter 35
Escher Documentation Release 143
Figure 3 | A layout preview
The birds-eye view and the navigation component on the left help you navigate through the network display Thisgraph shows you how the converted pathway map will be rendered by software that supports SBGN-ML or the SBMLlayout extension This preview can be modified by moving arcs or nodes however none of those changes are storedwhen exporting the file In this current version EscherConver only exports layouts as given in the original JSON file
Included third-party software
EscherConverter includes several third-party libraries which we here list and acknowledge
bull ArgParser
bull JSBML
bull libSBGN
bull Pixel-Mixer icons
bull yFiles
772 Command-line interface API
You can launch EscherConverter from the command-line On a Unix system (such as Linux MacOS or Solaris etc)use a command like
bash$ java -jar -Xms8G -Xmx8G -Duserlanguage=en EscherConverter-05jar [options]
Under Window use a command like
Cgt javaw -jar -Xms8G -Xmx8G -Duserlanguage=en EscherConverter-05jar [options]
Escher has a large collection of command-line options (see below) which can be useful if you want to launch theprogram with specific settings or if multiple files are to be converted in a batch mode It is even possible to completelydisable the graphical user interface
36 Chapter 7 Contents
Escher Documentation Release 143
Input and output files
Definition of input and output data files as well as the format for the output
--input=ltFilegt
Specifies the JSON input file If a directory is given the conversion will be recursively performed Accepts JSON
--output=ltFilegt
The path to the file into which the output should be written If the input is a directory this must also be a directory inorder to perform a recursive conversion Accepts SBML SBGN
Escher layout
The options in this group allow you to influence how large certain elements should be displayed
--canvas-default-height=ltDoublegt
Just as in the case of the width of the canvas this value needs to be specified for cases where the JSON input file lacksan explicit specification of the canvas height Arguments must fit into the range [11E9] (Default value 2500)
--canvas-default-width=ltDoublegt
This value is used when no width has been defined for the canvas Since the width attribute is mandatory for the layouta default value must be provided in these cases Arguments must fit into the range [11E9] (Default value 2500)
--label-height=ltDoublegt
With this option you can specify the height of the bounding box of text labels Arguments must fit into the range[11E9] (Default value 500)
--label-width=ltDoublegt
This option defines the width of bounding boxes for text labels Arguments must fit into the range [11E9] (Defaultvalue 1600)
--node-depth=ltDoublegt
The length of nodes along z-coordinate Escher maps are actually two-dimensional but in general a layout can bethree-dimensional This value should be an arbitrary value greater than zero because some rendering engines mightnot display the node if its depth is zero Arguments must fit into the range [11E9] (Default value 10)
--node-label-height=ltDoublegt
Node labels can have a size different from general labels in the graph Here you can specify how height the boundingbox of the labels for nodes should be Arguments must fit into the range [11E9] (Default value 200)
--primary-node-height=ltDoublegt
The primary node should be bigger than the secondary node With this option you can specify the height of this typeof nodes Arguments must fit into the range [11E9] (Default value 300)
--primary-node-width=ltDoublegt
Escher maps distinguish between primary and secondary nodes Primary nodes should be larger than secondary nodesand display the main flow of matter through the network This option allows you to specify the width of primarynodes Arguments must fit into the range [11E9] (Default value 300)
77 EscherConverter 37
Escher Documentation Release 143
--reaction-label-height=ltDoublegt
Reaction label heightArguments must fit into the range [11E9] (Default value 300)
--reaction-node-ratio=ltDoublegt
This value is used as a conversion factor to determine the size of the reaction display box depending on the size ofprimary nodes Height and width of reaction nodes are determined by dividing the corresponding values from theprimary node size by this factor Arguments must fit into the range [01] (Default value 05)
--secondary-node-ratio=ltDoublegt
Similar to the reaction node ratio the size of secondary nodes (width and height) is determined by dividing thecorresponding values from the primary nodes by this value Arguments must fit into the range [01] (Default value06666666666666666)
--z=ltDoublegt
The position on the z-axis where the entire two-dimensional graph should be drawn Arguments must fit into the range[-1E91E9] (Default value 00)
Escher Components and their naming
Here you can influence which elements are to be included in the layout and how elements in the layout are to be calledor identified
--format=ltOutputFormatgt
The desired format for the conversion eg SBML All possible values for type ltOutputFormatgt are SBGN andSBML (Default value SBML)
--layout-id=ltStringgt
In contrast to the name this identifier does not have to be human-readable This is a machine identifier which muststart with a letter or underscore and can only contain ASCII characters (Default value Escher_Layout)
--layout-name=ltStringgt
This should be a human-readable name for the layout that is to be created This name might be displayed to describethe figure and should therefore be explanatory (Default value Escher Layout)
--compartment-id=ltStringgt
A compartment needs to have a unique identifier which needs to be a machine-readable Sting that must start with aletter or underscore and can only contain ASCII characters Since the JSON file does not provide this information thisoption allows you to specify the required identifier (Default value default)
--compartment-name=ltStringgt
With this option it is possible to define a name for the default compartment can be that needs to be generated for theconversion to SBML The name does not have any restrictions ie any UTF-8 character can be used (Default valueDefault compartment)
--infer-compartment-bounds
This converter can infer where the boundaries of compartments could be drawn To this end it uses each nodersquos BiGGids to identify the compartment of all metabolites Assuming that compartments have rectangular shapes the algorithmcan find the outermost node on each side of the box and hence obtain the boundaries of the compartment However
38 Chapter 7 Contents
Escher Documentation Release 143
this methods will fail when metabolites are drawn inside of such a box that belong to a different compartment that isactually further outside For this reason this option is deactivated by default (Default value false)
Options for the graphical user interface
--gui
If this option is given the program will display its graphical user interface (Default value false)
--log-level=ltStringgt
Change the log-level of this application This option will influence how fine-grained error and other log messages willbe that you receive while executing this program All possible values for type ltStringgt are ALL CONFIG FINEFINER FINEST INFO OFF SEVERE and WARNING (Default value INFO)
--log-file=ltFilegt
This option allows you to specify a log file to which all information of the program will be written Accepts (bp2bp3 log owl xml)
78 JavaScript API
class escherBuilder(map_data model_data embedded_css selection options)A Builder object contains all the UI and logic to generate a map builder or viewer
Arguments
bull map_data (object) ndash The data for a map to be passed to escherMapfrom_data() Ifnull then an empty Builder is initialized
bull model_data (object) ndash The data for a cobra model to be passed to es-cherCobraModel() Can be null
bull embedded_css (string) ndash The stylesheet for the SVG elements in the Escher map
bull selection (object) ndash (Optional Default In the body element) The d3 selection of anelement to place the Builder into The selection cannot be inside an SVG element
bull options (object) ndash (Optional) An object defining any of the following options
optionsmenu(Default rsquoallrsquo) The type of menu that will be displayed Can be lsquoallrsquo for the fullmenu or lsquozoomrsquo for just zoom buttons The lsquoallrsquo option requires the full set of Escherdependencies (D3js JQuery and Bootstrap) while the lsquozoomrsquo option requires only D3jsFor more details see Developing with Escher
optionsscroll_behavior(Default rsquopanrsquo) This option determines the effect that the scroll wheel will have onan Escher map Can be lsquopanrsquo to pan the map or lsquozoomrsquo to zoom the map when the usermoves the scroll wheel
optionsuse_3d_transform(Default Chooses a good option by testing the browser) If true then use CSS3 3D trans-forms to speed up panning and zooming This feature will only work on browsers thatsupport the 3D transforms It works best in the latest versions of Chrome Firefox andInternet Explorer Safari works better with this turned off
78 JavaScript API 39
Escher Documentation Release 143
optionsenable_editing(Default true) If true then display the map editing functions If false then hide themand only allow the user to view the map
optionenable_keys(Default true) If true then enable keyboard shortcuts
optionsenable_search(Default true) If true then enable indexing of the map for search Use false to disablesearching and potentially improve the map performance
optionsfill_screen(Default false) Use true to fill the screen when an Escher Builder is placed in a top-level container (eg a div in the body element)
optionsfull_screen_button(Default false) Include a button in the user interface for entering full screen mode
optionsignore_bootstrap(Default false) Do not use Bootstrap for buttons even if it available This is used toembed Escher in a Jupyter notebook where it conflicts with the Jupyter Boostrap installa-tion
Map model and styles
optionsstarting_reaction(Default null) The ID (as a string) of a reaction to draw when the Builder loads
optionsnever_ask_before_quit(Default false) If false then display a warning before the user closes an Eschermap If true then never display the warning This options is only respected if op-tionsenable_editing == true If enable_editing is false then the warnings are not dis-played
optionsunique_map_id(Default null) A unique ID that will be used to UI elements donrsquot interfere whenmultiple maps are in the same HTML document
optionsprimary_metabolite_radius(Default 15) The radius of primary metabolites in px
optionssecondary_metabolite_radius(Default 10) The radius of secondary metabolites in px
optionsmarker_radius(Default 5) The radius of marker nodes in px
optionsgene_font_size(Default 18) The font size of the gene reaction rules in px
optionshide_secondary_metabolites(Default false) If true then secondary nodes and segments are hidden This is conve-nient for generating simplified map figures
optionsshow_gene_reaction_rules(Default false) If true then show the gene reaction rules even without gene data
optionshide_all_labels(Default false) If checked hide all reaction gene and metabolite labels
Applied data
40 Chapter 7 Contents
Escher Documentation Release 143
optionsreaction_data(Default null) An object with reaction ids for keys and reaction data points for values
optionsreaction_stylesDefault [rsquocolorrsquo rsquosizersquo rsquotextrsquo]
An array of style types The array can contain any of the following lsquocolorrsquo lsquosizersquo lsquotextrsquolsquoabsrsquo The lsquocolorrsquo style means that the reactions will be colored according to the loadeddataset The lsquosizersquo style means that the reactions will be sized according to the loadeddataset The lsquotextrsquo style means that the data values will be displayed in the reactionlabels The lsquoabsrsquo style means the the absolute values of reaction values will be used fordata visualization
optionsreaction_compare_style(Default rsquodiffrsquo) How to compare to datasets Can be either lsquofold lsquolog2_foldrsquo orlsquodiffrsquo
optionsreaction_scaleDefault
[ type min color c8c8c8 size 12 type median color 9696ff size 20 type max color ff0000 size 25 ]
An array of objects that define points on the data scale
Each point is an object with a type attribute Types can be lsquominrsquo lsquomaxrsquo lsquomeanrsquo lsquoQ1rsquo (firstquartile) lsquomedianrsquo lsquoQ3rsquo (third quartile) or lsquovaluersquo Each point can have a color attributethat specifies a color with a string (any CSS color specification is allowed including hexrgb and rgba) Each point can have a size attirbute that specifies a reaction thickness as anumber Finally points with type lsquovaluersquo can have a value attribute that specifies an exactnumber for pont in the scale
NOTE If lsquominrsquo or lsquomaxrsquo is not provided Escher automatically adds them To be com-pletely clear about what you expect to see on the map it is best to provide lsquominrsquo andlsquomaxrsquo in addition to other scale points
Here are examples of each type
type rsquominrsquo color rsquoredrsquo size 12 Specifies that reactionsnear the minimum value are red and have thickness 12
type rsquoQ1rsquo color rsquorgba(100 100 50 05)rsquo size 12 Specifies that reactions near the first quartile have the given color opacity andthickness
type rsquomeanrsquo color rsquorgb(100 100 50)rsquo size 50 Specifies that reactions near the mean value have the given color and thickness
type rsquovaluersquo value 85 color rsquo333rsquo size 50 Specifies that reactions near 85 value have the given color and size
optionsreaction_no_data_color(Default rsquodcdcdcrsquo) The color of reactions with no data value
optionsreaction_no_data_size(Default 8) The size of reactions with no data value
optionsgene_data(Default null) An object with Gene ids for keys and gene data points for values
78 JavaScript API 41
Escher Documentation Release 143
optionsand_method_in_gene_reaction_rule(Default mean) When evaluating a gene reaction rule use this function to evaluate ANDrules Can be lsquomeanrsquo or lsquominrsquo
optionsmetabolite_data(Default null) An object with metabolite ids for keys and metabolite data points forvalues
optionsmetabolite_stylesDefault [rsquocolorrsquo rsquosizersquo rsquotextrsquo]
An array of style types The array can contain any of the following lsquocolorrsquo lsquosizersquo lsquotextrsquolsquoabsrsquo The lsquocolorrsquo style means that the metabolites will be colored according to the loadeddataset The lsquosizersquo style means that the metabolites will be sized according to the loadeddataset The lsquotextrsquo style means that the data values will be displayed in the metabolitelabels The lsquoabsrsquo style means the the absolute values of metabolite values will be used fordata visualization
optionsmetabolite_compare_style(Default rsquodiffrsquo) How to compare to datasets Can be either lsquofoldrsquo lsquolog2_foldrsquo orlsquodiffrsquo
optionsmetabolite_scaleDefault
[ type min color fffaf0 size 20 type median color f1c470 size 30 type max color 800000 size 40 ]
An array of objects that define points on the data scale See the description of op-tionsreaction_scale for an explanation of the format
optionsmetabolite_no_data_color(Default rsquoffffffrsquo) The color of metabolites with no data value
optionsmetabolite_no_data_size(Default 10) The size of metabolites with no data value
View and build options
optionsidentifiers_on_map(Default rsquobigg_idrsquo) The identifiers that will be displayed in reaction metabolite andgene labels Can be lsquobigg_idrsquo or lsquonamersquo
optionshighlight_missing(Default false) If true then highlight in red reactions that are not in the loaded COBRAmodel
optionsallow_building_duplicate_reactions(Default true) If true then building duplicate reactions is allowed If false then dupli-cate reactions are hidden in Add reaction mode
optionscofactors(Default [rsquoatprsquo rsquoadprsquo rsquonadrsquo rsquonadhrsquo rsquonadprsquo rsquonadphrsquorsquogtprsquo rsquogdprsquo rsquohrsquo rsquocoarsquo rsquoumprsquo rsquoh20rsquo rsquoppirsquo]) A list of metabo-lite IDs to treat as cofactors These will be secondary metabolites in new reactions
Callbacks
optionsfirst_load_callbackA function to run after loading the Builder
42 Chapter 7 Contents
Escher Documentation Release 143
load_map(map_data[ should_update_data])Load a map for the loaded data Also reloads most of the Builder content
Arguments
bull map_data ndash The data for a map
bull should_update_data (Boolean) ndash (Default true) Whether data should be ap-plied to the map
load_model(model_data[ should_update_data])Load the cobra model from model data
Arguments
bull model_data ndash The data for a Cobra model (Parsing in done by escherCobraModel)
bull should_update_data (Boolean) ndash (Default true) Whether data should be ap-plied to the model
view_mode()Enter view mode
build_mode()Enter build mode
brush_mode()Enter brush mode
zoom_mode()Enter zoom mode
rotate_mode()Enter rotate mode
text_mode()Enter text mode
set_reaction_data(data)
Arguments
bull data (array) ndash An array of 1 or 2 objects where each object has keys that are reactionIDrsquos and values that are data points (numbers)
set_metabolite_data(data)
Arguments
bull data (array) ndash An array of 1 or 2 objects where each object has keys that are metaboliteIDrsquos and values that are data points (numbers)
set_gene_data(data clear_gene_reaction_rules)
Arguments
bull data (array) ndash An array of 1 or 2 objects where each object has keys that are gene IDrsquosand values that are data points (numbers)
Arguments
bull clear_gene_reaction_rules (Boolean) ndash (Optional Default false) In addi-tion to setting the data also turn of the gene_reaction_rules
78 JavaScript API 43
Escher Documentation Release 143
79 Python API
class escherBuilder(map_name=None map_json=None model=None model_name=Nonemodel_json=None embedded_css=None reaction_data=None metabo-lite_data=None gene_data=None local_host=None id=None safe=Falsekwargs)
A metabolic map that can be viewed edited and used to visualize data
This map will also show metabolic fluxes passed in during consruction It can be viewed as a standalone htmlinside a browswer Alternately the respresentation inside an IPython notebook will also display the map
Maps are stored in json files and are stored in a cache directory Maps which are not found will be downloadedfrom a map repository if found
Parameters
bull map_name ndash A string specifying a map to be downloaded from the Escher web server orloaded from the cache
bull map_json ndash A JSON string or a file path to a JSON file or a URL specifying a JSON fileto be downloaded
bull model ndash A Cobra model
bull model_name ndash A string specifying a model to be downloaded from the Escher web serveror loaded from the cache
bull model_json ndash A JSON string or a file path to a JSON file or a URL specifying a JSONfile to be downloaded
bull embedded_css ndash The CSS (as a string) to be embedded with the Escher SVG
bull reaction_data ndash A dictionary with keys that correspond to reaction ids and values thatwill be mapped to reaction arrows and labels
bull metabolite_data ndash A dictionary with keys that correspond to metabolite ids and valuesthat will be mapped to metabolite nodes and labels
bull gene_data ndash A dictionary with keys that correspond to gene ids and values that will bemapped to corresponding reactions
bull local_host ndash A hostname that will be used for any local files This is generally usedfor using the notebook offline and for testing in the IPython Notebook with modified Eschercode An example value for local_host is lsquohttplocalhost7778lsquo
bull id ndash Specify an id to make the javascript data definitions unique A random id is chosen bydefault
bull safe ndash If True then loading files from the filesytem is not allowed This is to ensure thesafety of using Builder within a web server
Keyword Arguments
These are defined in the Javascript API
bulluse_3d_transform
bullenable_search
bullfill_screen
bullzoom_to_element
bullfull_screen_button
44 Chapter 7 Contents
Escher Documentation Release 143
bullstarting_reaction
bullunique_map_id
bullprimary_metabolite_radius
bullsecondary_metabolite_radius
bullmarker_radius
bullgene_font_size
bullhide_secondary_metabolites
bullshow_gene_reaction_rules
bullhide_all_labels
bullreaction_styles
bullreaction_compare_style
bullreaction_scale
bullreaction_no_data_color
bullreaction_no_data_size
bulland_method_in_gene_reaction_rule
bullmetabolite_styles
bullmetabolite_compare_style
bullmetabolite_scale
bullmetabolite_no_data_color
bullmetabolite_no_data_size
bullidentifiers_on_map
bullhighlight_missing
bullallow_building_duplicate_reactions
bullcofactors
All keyword arguments can also be set on an existing Builder object using setter functions eg
my_builderset_reaction_styles(new_styles)
display_in_browser(ip=lsquo127001rsquo port=7655 n_retries=50 js_source=rsquowebrsquo menu=rsquoallrsquoscroll_behavior=rsquopanrsquo enable_editing=True enable_keys=True mini-fied_js=True never_ask_before_quit=False)
Launch a web browser to view the map
Parameters
bull ip ndash The IP address to serve the map on
bull port ndash The port to serve the map on If specified the port is occupied then a random freeport will be used
bull n_retries (int) ndash The number of times the server will try to find a port before quitting
bull js_source (string) ndash Can be one of the following
ndash web (Default) - Use JavaScript files from eschergithubio
79 Python API 45
Escher Documentation Release 143
ndash local - Use compiled JavaScript files in the local Escher installation Works offline
ndash dev - No longer necessary with source maps This now gives the same behavior aslsquolocalrsquo
bull menu (string) ndash Menu bar options include
ndash none - No menu or buttons
ndash zoom - Just zoom buttons
ndash all (Default) - Menu and button bar (requires Bootstrap)
bull scroll_behavior (string) ndash Scroll behavior options
ndash pan - Pan the map
ndash zoom - Zoom the map
ndash none (Default) - No scroll events
bull enable_editing (Boolean) ndash Enable the map editing modes
bull enable_keys (Boolean) ndash Enable keyboard shortcuts
bull minified_js (Boolean) ndash If True use the minified version of JavaScript and CSSfiles
bull never_ask_before_quit (Boolean) ndash Never display an alert asking if you wantto leave the page By default this message is displayed if enable_editing is True
display_in_notebook(js_source=rsquowebrsquo menu=rsquozoomrsquo scroll_behavior=rsquononersquo mini-fied_js=True height=500 enable_editing=False)
Embed the Map within the current IPython Notebook
Parameters
bull js_source (string) ndash Can be one of the following
ndash web (Default) - Use JavaScript files from eschergithubio
ndash local - Use compiled JavaScript files in the local Escher installation Works offline
ndash dev - No longer necessary with source maps This now gives the same behav-ior as lsquolocalrsquo
bull menu (string) ndash Menu bar options include
ndash none - No menu or buttons
ndash zoom - Just zoom buttons
ndash Note The all menu option does not work in an IPython notebook
bull scroll_behavior (string) ndash Scroll behavior options
ndash pan - Pan the map
ndash zoom - Zoom the map
ndash none - (Default) No scroll events
bull minified_js (Boolean) ndash If True use the minified version of JavaScript andCSS files
bull height ndash Height of the HTML container
bull enable_editing (Boolean) ndash Enable the map editing modes
46 Chapter 7 Contents
Escher Documentation Release 143
save_html(filepath=None overwrite=False js_source=rsquowebrsquo protocol=rsquohttpsrsquo menu=rsquoallrsquoscroll_behavior=rsquopanrsquo enable_editing=True enable_keys=True minified_js=Truenever_ask_before_quit=False static_site_index_json=None)
Save an HTML file containing the map
Parameters
bull filepath (string) ndash The HTML file will be saved to this location Whenjs_source is lsquolocalrsquo then a new directory will be created with this name
bull overwrite (Boolean) ndash Overwrite existing files
bull js_source (string) ndash Can be one of the following
ndash web (Default) - Use JavaScript files from eschergithubio
ndash local - Use compiled JavaScript files in the local Escher installation Works of-fline To make the dependencies available to the downloaded file a new directorywill be made with the name specified by filepath
ndash dev - No longer necessary with source maps This now gives the same behav-ior as lsquolocalrsquo
bull protocol (string) ndash The protocol can be lsquohttprsquo lsquohttpsrsquo or None which indicatesa lsquoprotocol relative URLrsquo as in eschergithubio Ignored if source is local
bull menu (string) ndash Menu bar options include
ndash none - No menu or buttons
ndash zoom - Just zoom buttons
ndash all (Default) - Menu and button bar (requires Bootstrap)
bull scroll_behavior (string) ndash Scroll behavior options
ndash pan - Pan the map
ndash zoom - Zoom the map
ndash none (Default) - No scroll events
bull enable_editing (Boolean) ndash Enable the map editing modes
bull enable_keys (Boolean) ndash Enable keyboard shortcuts
bull minified_js (Boolean) ndash If True use the minified version of JavaScript andCSS files
bull height (number) ndash Height of the HTML container
bull never_ask_before_quit (Boolean) ndash Never display an alert asking if youwant to leave the page By default this message is displayed if enable_editing isTrue
bull static_site_index_json (string) ndash The index as a JSON string for thestatic site Use javascript to parse the URL options Used for generating static pages(see static_sitepy)
791 Cache
escherget_cache_dir(versioned=True name=None)Get the cache dir as a string and make the directory if it does not already exist
Parameters
79 Python API 47
Escher Documentation Release 143
bull versioned (Boolean) ndash Whether to return the versioned path in the cache Eschermaps for the latest version of Escher are found in the versioned directory (versioned= True) but maps for previous versions of Escher can be found by visiting the parentdirectory (versioned = False)
bull name (string) ndash An optional subdirectory within the cache If versioned is False thenname is ignored
escherclear_cache(different_cache_dir=None ask=True)Empty the contents of the cache directory including all versions of all maps and models
Parameters
bull different_cache_dir (string) ndash (Optional) The directory of another cacheThis is mainly for testing
bull ask (Boolean) ndash Whether to ask before deleting
escherlist_cached_maps()Return a list of all cached maps
escherlist_cached_models()Return a list of all cached models
escherlist_available_maps()Return a list of all maps available on the server
escherlist_available_models()Return a list of all models available on the server
710 License
Escher and EscherConverter are distributed under the MIT license
bull genindex
48 Chapter 7 Contents
Python Module Index
eescher 44
49
Escher Documentation Release 143
50 Python Module Index
Index
Bbrush_mode() (built-in function) 43build_mode() (built-in function) 43Builder (class in escher) 44
Cclear_cache() (in module escher) 48
Ddisplay_in_browser() (escherBuilder method) 45display_in_notebook() (escherBuilder method) 46
Eescher (module) 44escherBuilder() (class) 39
Gget_cache_dir() (in module escher) 47
Llist_available_maps() (in module escher) 48list_available_models() (in module escher) 48list_cached_maps() (in module escher) 48list_cached_models() (in module escher) 48load_map() (built-in function) 42load_model() (built-in function) 43
Ooptionenable_keys (option attribute) 40optionsallow_building_duplicate_reactions (options at-
tribute) 42optionsand_method_in_gene_reaction_rule (options at-
tribute) 41optionscofactors (options attribute) 42optionsenable_editing (options attribute) 39optionsenable_search (options attribute) 40optionsfill_screen (options attribute) 40optionsfirst_load_callback (options attribute) 42optionsfull_screen_button (options attribute) 40optionsgene_data (options attribute) 41
optionsgene_font_size (options attribute) 40optionshide_all_labels (options attribute) 40optionshide_secondary_metabolites (options attribute)
40optionshighlight_missing (options attribute) 42optionsidentifiers_on_map (options attribute) 42optionsignore_bootstrap (options attribute) 40optionsmarker_radius (options attribute) 40optionsmenu (options attribute) 39optionsmetabolite_compare_style (options attribute) 42optionsmetabolite_data (options attribute) 42optionsmetabolite_no_data_color (options attribute) 42optionsmetabolite_no_data_size (options attribute) 42optionsmetabolite_scale (options attribute) 42optionsmetabolite_styles (options attribute) 42optionsnever_ask_before_quit (options attribute) 40optionsprimary_metabolite_radius (options attribute) 40optionsreaction_compare_style (options attribute) 41optionsreaction_data (options attribute) 40optionsreaction_no_data_color (options attribute) 41optionsreaction_no_data_size (options attribute) 41optionsreaction_scale (options attribute) 41optionsreaction_styles (options attribute) 41optionsscroll_behavior (options attribute) 39optionssecondary_metabolite_radius (options attribute)
40optionsshow_gene_reaction_rules (options attribute) 40optionsstarting_reaction (options attribute) 40optionsunique_map_id (options attribute) 40optionsuse_3d_transform (options attribute) 39
Rrotate_mode() (built-in function) 43
Ssave_html() (escherBuilder method) 46set_gene_data() (built-in function) 43set_metabolite_data() (built-in function) 43set_reaction_data() (built-in function) 43
51
Escher Documentation Release 143
Ttext_mode() (built-in function) 43
Vview_mode() (built-in function) 43
Zzoom_mode() (built-in function) 43
52 Index
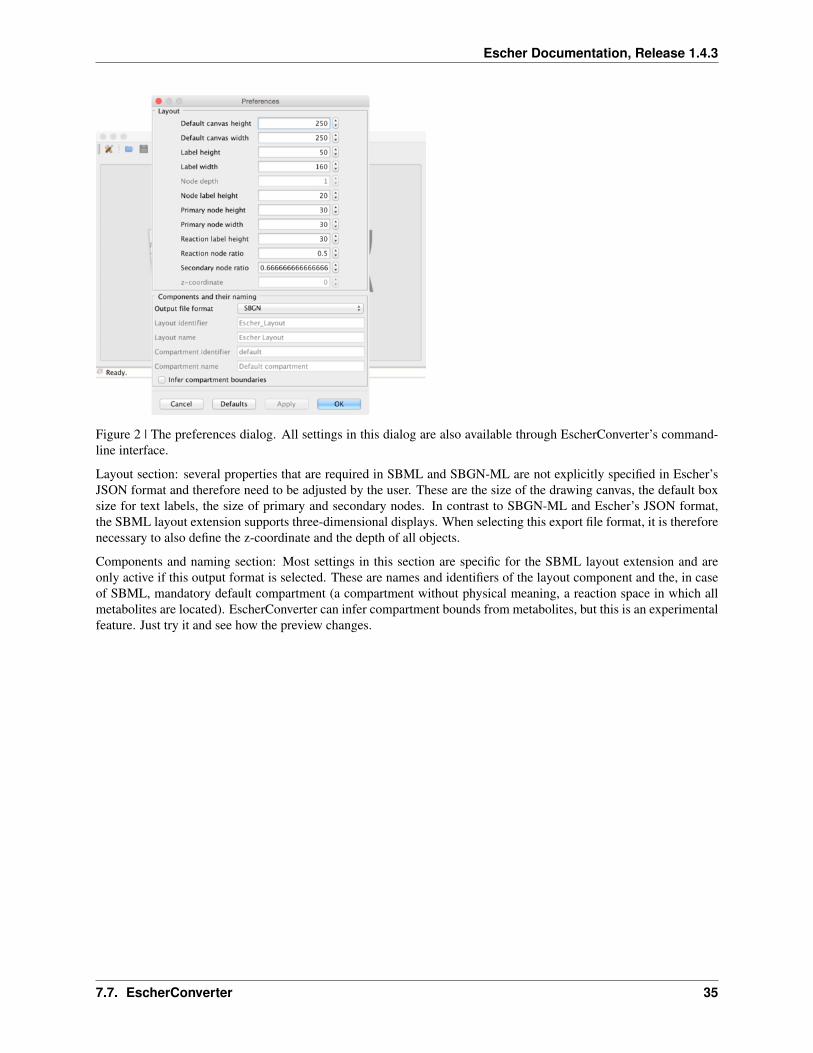
Escher Documentation Release 143
Figure 3 | A layout preview
The birds-eye view and the navigation component on the left help you navigate through the network display Thisgraph shows you how the converted pathway map will be rendered by software that supports SBGN-ML or the SBMLlayout extension This preview can be modified by moving arcs or nodes however none of those changes are storedwhen exporting the file In this current version EscherConver only exports layouts as given in the original JSON file
Included third-party software
EscherConverter includes several third-party libraries which we here list and acknowledge
bull ArgParser
bull JSBML
bull libSBGN
bull Pixel-Mixer icons
bull yFiles
772 Command-line interface API
You can launch EscherConverter from the command-line On a Unix system (such as Linux MacOS or Solaris etc)use a command like
bash$ java -jar -Xms8G -Xmx8G -Duserlanguage=en EscherConverter-05jar [options]
Under Window use a command like
Cgt javaw -jar -Xms8G -Xmx8G -Duserlanguage=en EscherConverter-05jar [options]
Escher has a large collection of command-line options (see below) which can be useful if you want to launch theprogram with specific settings or if multiple files are to be converted in a batch mode It is even possible to completelydisable the graphical user interface
36 Chapter 7 Contents
Escher Documentation Release 143
Input and output files
Definition of input and output data files as well as the format for the output
--input=ltFilegt
Specifies the JSON input file If a directory is given the conversion will be recursively performed Accepts JSON
--output=ltFilegt
The path to the file into which the output should be written If the input is a directory this must also be a directory inorder to perform a recursive conversion Accepts SBML SBGN
Escher layout
The options in this group allow you to influence how large certain elements should be displayed
--canvas-default-height=ltDoublegt
Just as in the case of the width of the canvas this value needs to be specified for cases where the JSON input file lacksan explicit specification of the canvas height Arguments must fit into the range [11E9] (Default value 2500)
--canvas-default-width=ltDoublegt
This value is used when no width has been defined for the canvas Since the width attribute is mandatory for the layouta default value must be provided in these cases Arguments must fit into the range [11E9] (Default value 2500)
--label-height=ltDoublegt
With this option you can specify the height of the bounding box of text labels Arguments must fit into the range[11E9] (Default value 500)
--label-width=ltDoublegt
This option defines the width of bounding boxes for text labels Arguments must fit into the range [11E9] (Defaultvalue 1600)
--node-depth=ltDoublegt
The length of nodes along z-coordinate Escher maps are actually two-dimensional but in general a layout can bethree-dimensional This value should be an arbitrary value greater than zero because some rendering engines mightnot display the node if its depth is zero Arguments must fit into the range [11E9] (Default value 10)
--node-label-height=ltDoublegt
Node labels can have a size different from general labels in the graph Here you can specify how height the boundingbox of the labels for nodes should be Arguments must fit into the range [11E9] (Default value 200)
--primary-node-height=ltDoublegt
The primary node should be bigger than the secondary node With this option you can specify the height of this typeof nodes Arguments must fit into the range [11E9] (Default value 300)
--primary-node-width=ltDoublegt
Escher maps distinguish between primary and secondary nodes Primary nodes should be larger than secondary nodesand display the main flow of matter through the network This option allows you to specify the width of primarynodes Arguments must fit into the range [11E9] (Default value 300)
77 EscherConverter 37
Escher Documentation Release 143
--reaction-label-height=ltDoublegt
Reaction label heightArguments must fit into the range [11E9] (Default value 300)
--reaction-node-ratio=ltDoublegt
This value is used as a conversion factor to determine the size of the reaction display box depending on the size ofprimary nodes Height and width of reaction nodes are determined by dividing the corresponding values from theprimary node size by this factor Arguments must fit into the range [01] (Default value 05)
--secondary-node-ratio=ltDoublegt
Similar to the reaction node ratio the size of secondary nodes (width and height) is determined by dividing thecorresponding values from the primary nodes by this value Arguments must fit into the range [01] (Default value06666666666666666)
--z=ltDoublegt
The position on the z-axis where the entire two-dimensional graph should be drawn Arguments must fit into the range[-1E91E9] (Default value 00)
Escher Components and their naming
Here you can influence which elements are to be included in the layout and how elements in the layout are to be calledor identified
--format=ltOutputFormatgt
The desired format for the conversion eg SBML All possible values for type ltOutputFormatgt are SBGN andSBML (Default value SBML)
--layout-id=ltStringgt
In contrast to the name this identifier does not have to be human-readable This is a machine identifier which muststart with a letter or underscore and can only contain ASCII characters (Default value Escher_Layout)
--layout-name=ltStringgt
This should be a human-readable name for the layout that is to be created This name might be displayed to describethe figure and should therefore be explanatory (Default value Escher Layout)
--compartment-id=ltStringgt
A compartment needs to have a unique identifier which needs to be a machine-readable Sting that must start with aletter or underscore and can only contain ASCII characters Since the JSON file does not provide this information thisoption allows you to specify the required identifier (Default value default)
--compartment-name=ltStringgt
With this option it is possible to define a name for the default compartment can be that needs to be generated for theconversion to SBML The name does not have any restrictions ie any UTF-8 character can be used (Default valueDefault compartment)
--infer-compartment-bounds
This converter can infer where the boundaries of compartments could be drawn To this end it uses each nodersquos BiGGids to identify the compartment of all metabolites Assuming that compartments have rectangular shapes the algorithmcan find the outermost node on each side of the box and hence obtain the boundaries of the compartment However
38 Chapter 7 Contents
Escher Documentation Release 143
this methods will fail when metabolites are drawn inside of such a box that belong to a different compartment that isactually further outside For this reason this option is deactivated by default (Default value false)
Options for the graphical user interface
--gui
If this option is given the program will display its graphical user interface (Default value false)
--log-level=ltStringgt
Change the log-level of this application This option will influence how fine-grained error and other log messages willbe that you receive while executing this program All possible values for type ltStringgt are ALL CONFIG FINEFINER FINEST INFO OFF SEVERE and WARNING (Default value INFO)
--log-file=ltFilegt
This option allows you to specify a log file to which all information of the program will be written Accepts (bp2bp3 log owl xml)
78 JavaScript API
class escherBuilder(map_data model_data embedded_css selection options)A Builder object contains all the UI and logic to generate a map builder or viewer
Arguments
bull map_data (object) ndash The data for a map to be passed to escherMapfrom_data() Ifnull then an empty Builder is initialized
bull model_data (object) ndash The data for a cobra model to be passed to es-cherCobraModel() Can be null
bull embedded_css (string) ndash The stylesheet for the SVG elements in the Escher map
bull selection (object) ndash (Optional Default In the body element) The d3 selection of anelement to place the Builder into The selection cannot be inside an SVG element
bull options (object) ndash (Optional) An object defining any of the following options
optionsmenu(Default rsquoallrsquo) The type of menu that will be displayed Can be lsquoallrsquo for the fullmenu or lsquozoomrsquo for just zoom buttons The lsquoallrsquo option requires the full set of Escherdependencies (D3js JQuery and Bootstrap) while the lsquozoomrsquo option requires only D3jsFor more details see Developing with Escher
optionsscroll_behavior(Default rsquopanrsquo) This option determines the effect that the scroll wheel will have onan Escher map Can be lsquopanrsquo to pan the map or lsquozoomrsquo to zoom the map when the usermoves the scroll wheel
optionsuse_3d_transform(Default Chooses a good option by testing the browser) If true then use CSS3 3D trans-forms to speed up panning and zooming This feature will only work on browsers thatsupport the 3D transforms It works best in the latest versions of Chrome Firefox andInternet Explorer Safari works better with this turned off
78 JavaScript API 39
Escher Documentation Release 143
optionsenable_editing(Default true) If true then display the map editing functions If false then hide themand only allow the user to view the map
optionenable_keys(Default true) If true then enable keyboard shortcuts
optionsenable_search(Default true) If true then enable indexing of the map for search Use false to disablesearching and potentially improve the map performance
optionsfill_screen(Default false) Use true to fill the screen when an Escher Builder is placed in a top-level container (eg a div in the body element)
optionsfull_screen_button(Default false) Include a button in the user interface for entering full screen mode
optionsignore_bootstrap(Default false) Do not use Bootstrap for buttons even if it available This is used toembed Escher in a Jupyter notebook where it conflicts with the Jupyter Boostrap installa-tion
Map model and styles
optionsstarting_reaction(Default null) The ID (as a string) of a reaction to draw when the Builder loads
optionsnever_ask_before_quit(Default false) If false then display a warning before the user closes an Eschermap If true then never display the warning This options is only respected if op-tionsenable_editing == true If enable_editing is false then the warnings are not dis-played
optionsunique_map_id(Default null) A unique ID that will be used to UI elements donrsquot interfere whenmultiple maps are in the same HTML document
optionsprimary_metabolite_radius(Default 15) The radius of primary metabolites in px
optionssecondary_metabolite_radius(Default 10) The radius of secondary metabolites in px
optionsmarker_radius(Default 5) The radius of marker nodes in px
optionsgene_font_size(Default 18) The font size of the gene reaction rules in px
optionshide_secondary_metabolites(Default false) If true then secondary nodes and segments are hidden This is conve-nient for generating simplified map figures
optionsshow_gene_reaction_rules(Default false) If true then show the gene reaction rules even without gene data
optionshide_all_labels(Default false) If checked hide all reaction gene and metabolite labels
Applied data
40 Chapter 7 Contents
Escher Documentation Release 143
optionsreaction_data(Default null) An object with reaction ids for keys and reaction data points for values
optionsreaction_stylesDefault [rsquocolorrsquo rsquosizersquo rsquotextrsquo]
An array of style types The array can contain any of the following lsquocolorrsquo lsquosizersquo lsquotextrsquolsquoabsrsquo The lsquocolorrsquo style means that the reactions will be colored according to the loadeddataset The lsquosizersquo style means that the reactions will be sized according to the loadeddataset The lsquotextrsquo style means that the data values will be displayed in the reactionlabels The lsquoabsrsquo style means the the absolute values of reaction values will be used fordata visualization
optionsreaction_compare_style(Default rsquodiffrsquo) How to compare to datasets Can be either lsquofold lsquolog2_foldrsquo orlsquodiffrsquo
optionsreaction_scaleDefault
[ type min color c8c8c8 size 12 type median color 9696ff size 20 type max color ff0000 size 25 ]
An array of objects that define points on the data scale
Each point is an object with a type attribute Types can be lsquominrsquo lsquomaxrsquo lsquomeanrsquo lsquoQ1rsquo (firstquartile) lsquomedianrsquo lsquoQ3rsquo (third quartile) or lsquovaluersquo Each point can have a color attributethat specifies a color with a string (any CSS color specification is allowed including hexrgb and rgba) Each point can have a size attirbute that specifies a reaction thickness as anumber Finally points with type lsquovaluersquo can have a value attribute that specifies an exactnumber for pont in the scale
NOTE If lsquominrsquo or lsquomaxrsquo is not provided Escher automatically adds them To be com-pletely clear about what you expect to see on the map it is best to provide lsquominrsquo andlsquomaxrsquo in addition to other scale points
Here are examples of each type
type rsquominrsquo color rsquoredrsquo size 12 Specifies that reactionsnear the minimum value are red and have thickness 12
type rsquoQ1rsquo color rsquorgba(100 100 50 05)rsquo size 12 Specifies that reactions near the first quartile have the given color opacity andthickness
type rsquomeanrsquo color rsquorgb(100 100 50)rsquo size 50 Specifies that reactions near the mean value have the given color and thickness
type rsquovaluersquo value 85 color rsquo333rsquo size 50 Specifies that reactions near 85 value have the given color and size
optionsreaction_no_data_color(Default rsquodcdcdcrsquo) The color of reactions with no data value
optionsreaction_no_data_size(Default 8) The size of reactions with no data value
optionsgene_data(Default null) An object with Gene ids for keys and gene data points for values
78 JavaScript API 41
Escher Documentation Release 143
optionsand_method_in_gene_reaction_rule(Default mean) When evaluating a gene reaction rule use this function to evaluate ANDrules Can be lsquomeanrsquo or lsquominrsquo
optionsmetabolite_data(Default null) An object with metabolite ids for keys and metabolite data points forvalues
optionsmetabolite_stylesDefault [rsquocolorrsquo rsquosizersquo rsquotextrsquo]
An array of style types The array can contain any of the following lsquocolorrsquo lsquosizersquo lsquotextrsquolsquoabsrsquo The lsquocolorrsquo style means that the metabolites will be colored according to the loadeddataset The lsquosizersquo style means that the metabolites will be sized according to the loadeddataset The lsquotextrsquo style means that the data values will be displayed in the metabolitelabels The lsquoabsrsquo style means the the absolute values of metabolite values will be used fordata visualization
optionsmetabolite_compare_style(Default rsquodiffrsquo) How to compare to datasets Can be either lsquofoldrsquo lsquolog2_foldrsquo orlsquodiffrsquo
optionsmetabolite_scaleDefault
[ type min color fffaf0 size 20 type median color f1c470 size 30 type max color 800000 size 40 ]
An array of objects that define points on the data scale See the description of op-tionsreaction_scale for an explanation of the format
optionsmetabolite_no_data_color(Default rsquoffffffrsquo) The color of metabolites with no data value
optionsmetabolite_no_data_size(Default 10) The size of metabolites with no data value
View and build options
optionsidentifiers_on_map(Default rsquobigg_idrsquo) The identifiers that will be displayed in reaction metabolite andgene labels Can be lsquobigg_idrsquo or lsquonamersquo
optionshighlight_missing(Default false) If true then highlight in red reactions that are not in the loaded COBRAmodel
optionsallow_building_duplicate_reactions(Default true) If true then building duplicate reactions is allowed If false then dupli-cate reactions are hidden in Add reaction mode
optionscofactors(Default [rsquoatprsquo rsquoadprsquo rsquonadrsquo rsquonadhrsquo rsquonadprsquo rsquonadphrsquorsquogtprsquo rsquogdprsquo rsquohrsquo rsquocoarsquo rsquoumprsquo rsquoh20rsquo rsquoppirsquo]) A list of metabo-lite IDs to treat as cofactors These will be secondary metabolites in new reactions
Callbacks
optionsfirst_load_callbackA function to run after loading the Builder
42 Chapter 7 Contents
Escher Documentation Release 143
load_map(map_data[ should_update_data])Load a map for the loaded data Also reloads most of the Builder content
Arguments
bull map_data ndash The data for a map
bull should_update_data (Boolean) ndash (Default true) Whether data should be ap-plied to the map
load_model(model_data[ should_update_data])Load the cobra model from model data
Arguments
bull model_data ndash The data for a Cobra model (Parsing in done by escherCobraModel)
bull should_update_data (Boolean) ndash (Default true) Whether data should be ap-plied to the model
view_mode()Enter view mode
build_mode()Enter build mode
brush_mode()Enter brush mode
zoom_mode()Enter zoom mode
rotate_mode()Enter rotate mode
text_mode()Enter text mode
set_reaction_data(data)
Arguments
bull data (array) ndash An array of 1 or 2 objects where each object has keys that are reactionIDrsquos and values that are data points (numbers)
set_metabolite_data(data)
Arguments
bull data (array) ndash An array of 1 or 2 objects where each object has keys that are metaboliteIDrsquos and values that are data points (numbers)
set_gene_data(data clear_gene_reaction_rules)
Arguments
bull data (array) ndash An array of 1 or 2 objects where each object has keys that are gene IDrsquosand values that are data points (numbers)
Arguments
bull clear_gene_reaction_rules (Boolean) ndash (Optional Default false) In addi-tion to setting the data also turn of the gene_reaction_rules
78 JavaScript API 43
Escher Documentation Release 143
79 Python API
class escherBuilder(map_name=None map_json=None model=None model_name=Nonemodel_json=None embedded_css=None reaction_data=None metabo-lite_data=None gene_data=None local_host=None id=None safe=Falsekwargs)
A metabolic map that can be viewed edited and used to visualize data
This map will also show metabolic fluxes passed in during consruction It can be viewed as a standalone htmlinside a browswer Alternately the respresentation inside an IPython notebook will also display the map
Maps are stored in json files and are stored in a cache directory Maps which are not found will be downloadedfrom a map repository if found
Parameters
bull map_name ndash A string specifying a map to be downloaded from the Escher web server orloaded from the cache
bull map_json ndash A JSON string or a file path to a JSON file or a URL specifying a JSON fileto be downloaded
bull model ndash A Cobra model
bull model_name ndash A string specifying a model to be downloaded from the Escher web serveror loaded from the cache
bull model_json ndash A JSON string or a file path to a JSON file or a URL specifying a JSONfile to be downloaded
bull embedded_css ndash The CSS (as a string) to be embedded with the Escher SVG
bull reaction_data ndash A dictionary with keys that correspond to reaction ids and values thatwill be mapped to reaction arrows and labels
bull metabolite_data ndash A dictionary with keys that correspond to metabolite ids and valuesthat will be mapped to metabolite nodes and labels
bull gene_data ndash A dictionary with keys that correspond to gene ids and values that will bemapped to corresponding reactions
bull local_host ndash A hostname that will be used for any local files This is generally usedfor using the notebook offline and for testing in the IPython Notebook with modified Eschercode An example value for local_host is lsquohttplocalhost7778lsquo
bull id ndash Specify an id to make the javascript data definitions unique A random id is chosen bydefault
bull safe ndash If True then loading files from the filesytem is not allowed This is to ensure thesafety of using Builder within a web server
Keyword Arguments
These are defined in the Javascript API
bulluse_3d_transform
bullenable_search
bullfill_screen
bullzoom_to_element
bullfull_screen_button
44 Chapter 7 Contents
Escher Documentation Release 143
bullstarting_reaction
bullunique_map_id
bullprimary_metabolite_radius
bullsecondary_metabolite_radius
bullmarker_radius
bullgene_font_size
bullhide_secondary_metabolites
bullshow_gene_reaction_rules
bullhide_all_labels
bullreaction_styles
bullreaction_compare_style
bullreaction_scale
bullreaction_no_data_color
bullreaction_no_data_size
bulland_method_in_gene_reaction_rule
bullmetabolite_styles
bullmetabolite_compare_style
bullmetabolite_scale
bullmetabolite_no_data_color
bullmetabolite_no_data_size
bullidentifiers_on_map
bullhighlight_missing
bullallow_building_duplicate_reactions
bullcofactors
All keyword arguments can also be set on an existing Builder object using setter functions eg
my_builderset_reaction_styles(new_styles)
display_in_browser(ip=lsquo127001rsquo port=7655 n_retries=50 js_source=rsquowebrsquo menu=rsquoallrsquoscroll_behavior=rsquopanrsquo enable_editing=True enable_keys=True mini-fied_js=True never_ask_before_quit=False)
Launch a web browser to view the map
Parameters
bull ip ndash The IP address to serve the map on
bull port ndash The port to serve the map on If specified the port is occupied then a random freeport will be used
bull n_retries (int) ndash The number of times the server will try to find a port before quitting
bull js_source (string) ndash Can be one of the following
ndash web (Default) - Use JavaScript files from eschergithubio
79 Python API 45
Escher Documentation Release 143
ndash local - Use compiled JavaScript files in the local Escher installation Works offline
ndash dev - No longer necessary with source maps This now gives the same behavior aslsquolocalrsquo
bull menu (string) ndash Menu bar options include
ndash none - No menu or buttons
ndash zoom - Just zoom buttons
ndash all (Default) - Menu and button bar (requires Bootstrap)
bull scroll_behavior (string) ndash Scroll behavior options
ndash pan - Pan the map
ndash zoom - Zoom the map
ndash none (Default) - No scroll events
bull enable_editing (Boolean) ndash Enable the map editing modes
bull enable_keys (Boolean) ndash Enable keyboard shortcuts
bull minified_js (Boolean) ndash If True use the minified version of JavaScript and CSSfiles
bull never_ask_before_quit (Boolean) ndash Never display an alert asking if you wantto leave the page By default this message is displayed if enable_editing is True
display_in_notebook(js_source=rsquowebrsquo menu=rsquozoomrsquo scroll_behavior=rsquononersquo mini-fied_js=True height=500 enable_editing=False)
Embed the Map within the current IPython Notebook
Parameters
bull js_source (string) ndash Can be one of the following
ndash web (Default) - Use JavaScript files from eschergithubio
ndash local - Use compiled JavaScript files in the local Escher installation Works offline
ndash dev - No longer necessary with source maps This now gives the same behav-ior as lsquolocalrsquo
bull menu (string) ndash Menu bar options include
ndash none - No menu or buttons
ndash zoom - Just zoom buttons
ndash Note The all menu option does not work in an IPython notebook
bull scroll_behavior (string) ndash Scroll behavior options
ndash pan - Pan the map
ndash zoom - Zoom the map
ndash none - (Default) No scroll events
bull minified_js (Boolean) ndash If True use the minified version of JavaScript andCSS files
bull height ndash Height of the HTML container
bull enable_editing (Boolean) ndash Enable the map editing modes
46 Chapter 7 Contents
Escher Documentation Release 143
save_html(filepath=None overwrite=False js_source=rsquowebrsquo protocol=rsquohttpsrsquo menu=rsquoallrsquoscroll_behavior=rsquopanrsquo enable_editing=True enable_keys=True minified_js=Truenever_ask_before_quit=False static_site_index_json=None)
Save an HTML file containing the map
Parameters
bull filepath (string) ndash The HTML file will be saved to this location Whenjs_source is lsquolocalrsquo then a new directory will be created with this name
bull overwrite (Boolean) ndash Overwrite existing files
bull js_source (string) ndash Can be one of the following
ndash web (Default) - Use JavaScript files from eschergithubio
ndash local - Use compiled JavaScript files in the local Escher installation Works of-fline To make the dependencies available to the downloaded file a new directorywill be made with the name specified by filepath
ndash dev - No longer necessary with source maps This now gives the same behav-ior as lsquolocalrsquo
bull protocol (string) ndash The protocol can be lsquohttprsquo lsquohttpsrsquo or None which indicatesa lsquoprotocol relative URLrsquo as in eschergithubio Ignored if source is local
bull menu (string) ndash Menu bar options include
ndash none - No menu or buttons
ndash zoom - Just zoom buttons
ndash all (Default) - Menu and button bar (requires Bootstrap)
bull scroll_behavior (string) ndash Scroll behavior options
ndash pan - Pan the map
ndash zoom - Zoom the map
ndash none (Default) - No scroll events
bull enable_editing (Boolean) ndash Enable the map editing modes
bull enable_keys (Boolean) ndash Enable keyboard shortcuts
bull minified_js (Boolean) ndash If True use the minified version of JavaScript andCSS files
bull height (number) ndash Height of the HTML container
bull never_ask_before_quit (Boolean) ndash Never display an alert asking if youwant to leave the page By default this message is displayed if enable_editing isTrue
bull static_site_index_json (string) ndash The index as a JSON string for thestatic site Use javascript to parse the URL options Used for generating static pages(see static_sitepy)
791 Cache
escherget_cache_dir(versioned=True name=None)Get the cache dir as a string and make the directory if it does not already exist
Parameters
79 Python API 47
Escher Documentation Release 143
bull versioned (Boolean) ndash Whether to return the versioned path in the cache Eschermaps for the latest version of Escher are found in the versioned directory (versioned= True) but maps for previous versions of Escher can be found by visiting the parentdirectory (versioned = False)
bull name (string) ndash An optional subdirectory within the cache If versioned is False thenname is ignored
escherclear_cache(different_cache_dir=None ask=True)Empty the contents of the cache directory including all versions of all maps and models
Parameters
bull different_cache_dir (string) ndash (Optional) The directory of another cacheThis is mainly for testing
bull ask (Boolean) ndash Whether to ask before deleting
escherlist_cached_maps()Return a list of all cached maps
escherlist_cached_models()Return a list of all cached models
escherlist_available_maps()Return a list of all maps available on the server
escherlist_available_models()Return a list of all models available on the server
710 License
Escher and EscherConverter are distributed under the MIT license
bull genindex
48 Chapter 7 Contents
Python Module Index
eescher 44
49
Escher Documentation Release 143
50 Python Module Index
Index
Bbrush_mode() (built-in function) 43build_mode() (built-in function) 43Builder (class in escher) 44
Cclear_cache() (in module escher) 48
Ddisplay_in_browser() (escherBuilder method) 45display_in_notebook() (escherBuilder method) 46
Eescher (module) 44escherBuilder() (class) 39
Gget_cache_dir() (in module escher) 47
Llist_available_maps() (in module escher) 48list_available_models() (in module escher) 48list_cached_maps() (in module escher) 48list_cached_models() (in module escher) 48load_map() (built-in function) 42load_model() (built-in function) 43
Ooptionenable_keys (option attribute) 40optionsallow_building_duplicate_reactions (options at-
tribute) 42optionsand_method_in_gene_reaction_rule (options at-
tribute) 41optionscofactors (options attribute) 42optionsenable_editing (options attribute) 39optionsenable_search (options attribute) 40optionsfill_screen (options attribute) 40optionsfirst_load_callback (options attribute) 42optionsfull_screen_button (options attribute) 40optionsgene_data (options attribute) 41
optionsgene_font_size (options attribute) 40optionshide_all_labels (options attribute) 40optionshide_secondary_metabolites (options attribute)
40optionshighlight_missing (options attribute) 42optionsidentifiers_on_map (options attribute) 42optionsignore_bootstrap (options attribute) 40optionsmarker_radius (options attribute) 40optionsmenu (options attribute) 39optionsmetabolite_compare_style (options attribute) 42optionsmetabolite_data (options attribute) 42optionsmetabolite_no_data_color (options attribute) 42optionsmetabolite_no_data_size (options attribute) 42optionsmetabolite_scale (options attribute) 42optionsmetabolite_styles (options attribute) 42optionsnever_ask_before_quit (options attribute) 40optionsprimary_metabolite_radius (options attribute) 40optionsreaction_compare_style (options attribute) 41optionsreaction_data (options attribute) 40optionsreaction_no_data_color (options attribute) 41optionsreaction_no_data_size (options attribute) 41optionsreaction_scale (options attribute) 41optionsreaction_styles (options attribute) 41optionsscroll_behavior (options attribute) 39optionssecondary_metabolite_radius (options attribute)
40optionsshow_gene_reaction_rules (options attribute) 40optionsstarting_reaction (options attribute) 40optionsunique_map_id (options attribute) 40optionsuse_3d_transform (options attribute) 39
Rrotate_mode() (built-in function) 43
Ssave_html() (escherBuilder method) 46set_gene_data() (built-in function) 43set_metabolite_data() (built-in function) 43set_reaction_data() (built-in function) 43
51
Escher Documentation Release 143
Ttext_mode() (built-in function) 43
Vview_mode() (built-in function) 43
Zzoom_mode() (built-in function) 43
52 Index
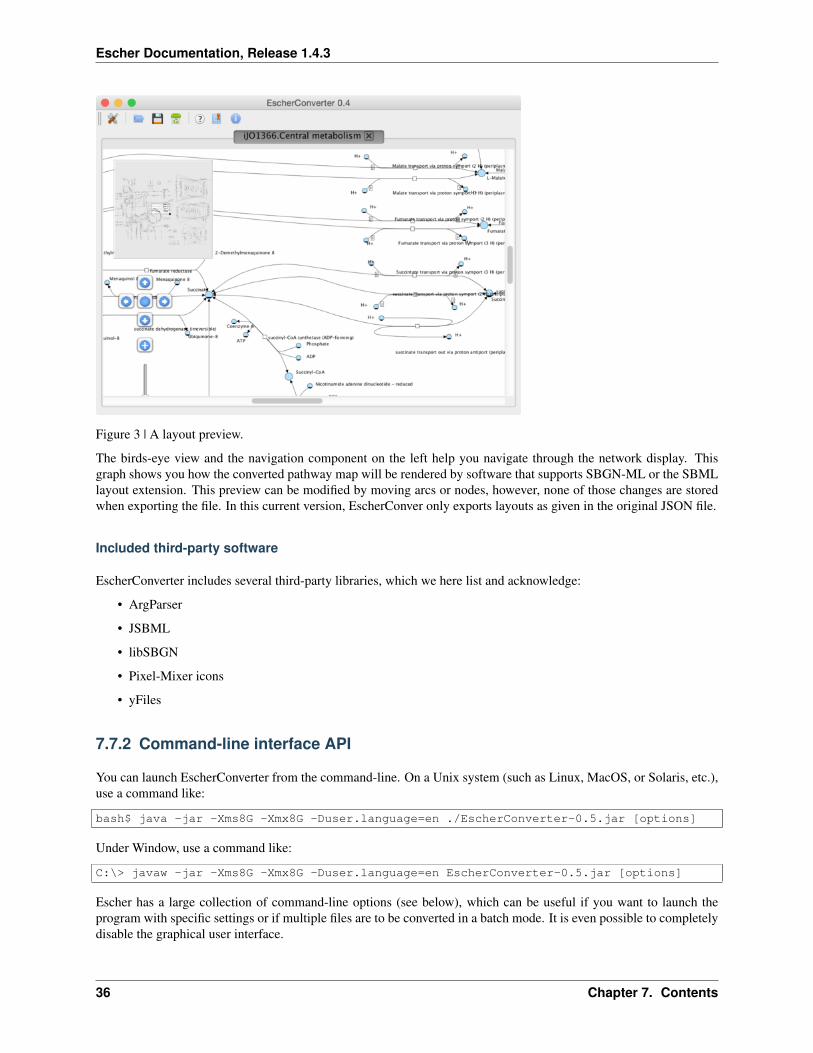
Escher Documentation Release 143
Input and output files
Definition of input and output data files as well as the format for the output
--input=ltFilegt
Specifies the JSON input file If a directory is given the conversion will be recursively performed Accepts JSON
--output=ltFilegt
The path to the file into which the output should be written If the input is a directory this must also be a directory inorder to perform a recursive conversion Accepts SBML SBGN
Escher layout
The options in this group allow you to influence how large certain elements should be displayed
--canvas-default-height=ltDoublegt
Just as in the case of the width of the canvas this value needs to be specified for cases where the JSON input file lacksan explicit specification of the canvas height Arguments must fit into the range [11E9] (Default value 2500)
--canvas-default-width=ltDoublegt
This value is used when no width has been defined for the canvas Since the width attribute is mandatory for the layouta default value must be provided in these cases Arguments must fit into the range [11E9] (Default value 2500)
--label-height=ltDoublegt
With this option you can specify the height of the bounding box of text labels Arguments must fit into the range[11E9] (Default value 500)
--label-width=ltDoublegt
This option defines the width of bounding boxes for text labels Arguments must fit into the range [11E9] (Defaultvalue 1600)
--node-depth=ltDoublegt
The length of nodes along z-coordinate Escher maps are actually two-dimensional but in general a layout can bethree-dimensional This value should be an arbitrary value greater than zero because some rendering engines mightnot display the node if its depth is zero Arguments must fit into the range [11E9] (Default value 10)
--node-label-height=ltDoublegt
Node labels can have a size different from general labels in the graph Here you can specify how height the boundingbox of the labels for nodes should be Arguments must fit into the range [11E9] (Default value 200)
--primary-node-height=ltDoublegt
The primary node should be bigger than the secondary node With this option you can specify the height of this typeof nodes Arguments must fit into the range [11E9] (Default value 300)
--primary-node-width=ltDoublegt
Escher maps distinguish between primary and secondary nodes Primary nodes should be larger than secondary nodesand display the main flow of matter through the network This option allows you to specify the width of primarynodes Arguments must fit into the range [11E9] (Default value 300)
77 EscherConverter 37
Escher Documentation Release 143
--reaction-label-height=ltDoublegt
Reaction label heightArguments must fit into the range [11E9] (Default value 300)
--reaction-node-ratio=ltDoublegt
This value is used as a conversion factor to determine the size of the reaction display box depending on the size ofprimary nodes Height and width of reaction nodes are determined by dividing the corresponding values from theprimary node size by this factor Arguments must fit into the range [01] (Default value 05)
--secondary-node-ratio=ltDoublegt
Similar to the reaction node ratio the size of secondary nodes (width and height) is determined by dividing thecorresponding values from the primary nodes by this value Arguments must fit into the range [01] (Default value06666666666666666)
--z=ltDoublegt
The position on the z-axis where the entire two-dimensional graph should be drawn Arguments must fit into the range[-1E91E9] (Default value 00)
Escher Components and their naming
Here you can influence which elements are to be included in the layout and how elements in the layout are to be calledor identified
--format=ltOutputFormatgt
The desired format for the conversion eg SBML All possible values for type ltOutputFormatgt are SBGN andSBML (Default value SBML)
--layout-id=ltStringgt
In contrast to the name this identifier does not have to be human-readable This is a machine identifier which muststart with a letter or underscore and can only contain ASCII characters (Default value Escher_Layout)
--layout-name=ltStringgt
This should be a human-readable name for the layout that is to be created This name might be displayed to describethe figure and should therefore be explanatory (Default value Escher Layout)
--compartment-id=ltStringgt
A compartment needs to have a unique identifier which needs to be a machine-readable Sting that must start with aletter or underscore and can only contain ASCII characters Since the JSON file does not provide this information thisoption allows you to specify the required identifier (Default value default)
--compartment-name=ltStringgt
With this option it is possible to define a name for the default compartment can be that needs to be generated for theconversion to SBML The name does not have any restrictions ie any UTF-8 character can be used (Default valueDefault compartment)
--infer-compartment-bounds
This converter can infer where the boundaries of compartments could be drawn To this end it uses each nodersquos BiGGids to identify the compartment of all metabolites Assuming that compartments have rectangular shapes the algorithmcan find the outermost node on each side of the box and hence obtain the boundaries of the compartment However
38 Chapter 7 Contents
Escher Documentation Release 143
this methods will fail when metabolites are drawn inside of such a box that belong to a different compartment that isactually further outside For this reason this option is deactivated by default (Default value false)
Options for the graphical user interface
--gui
If this option is given the program will display its graphical user interface (Default value false)
--log-level=ltStringgt
Change the log-level of this application This option will influence how fine-grained error and other log messages willbe that you receive while executing this program All possible values for type ltStringgt are ALL CONFIG FINEFINER FINEST INFO OFF SEVERE and WARNING (Default value INFO)
--log-file=ltFilegt
This option allows you to specify a log file to which all information of the program will be written Accepts (bp2bp3 log owl xml)
78 JavaScript API
class escherBuilder(map_data model_data embedded_css selection options)A Builder object contains all the UI and logic to generate a map builder or viewer
Arguments
bull map_data (object) ndash The data for a map to be passed to escherMapfrom_data() Ifnull then an empty Builder is initialized
bull model_data (object) ndash The data for a cobra model to be passed to es-cherCobraModel() Can be null
bull embedded_css (string) ndash The stylesheet for the SVG elements in the Escher map
bull selection (object) ndash (Optional Default In the body element) The d3 selection of anelement to place the Builder into The selection cannot be inside an SVG element
bull options (object) ndash (Optional) An object defining any of the following options
optionsmenu(Default rsquoallrsquo) The type of menu that will be displayed Can be lsquoallrsquo for the fullmenu or lsquozoomrsquo for just zoom buttons The lsquoallrsquo option requires the full set of Escherdependencies (D3js JQuery and Bootstrap) while the lsquozoomrsquo option requires only D3jsFor more details see Developing with Escher
optionsscroll_behavior(Default rsquopanrsquo) This option determines the effect that the scroll wheel will have onan Escher map Can be lsquopanrsquo to pan the map or lsquozoomrsquo to zoom the map when the usermoves the scroll wheel
optionsuse_3d_transform(Default Chooses a good option by testing the browser) If true then use CSS3 3D trans-forms to speed up panning and zooming This feature will only work on browsers thatsupport the 3D transforms It works best in the latest versions of Chrome Firefox andInternet Explorer Safari works better with this turned off
78 JavaScript API 39
Escher Documentation Release 143
optionsenable_editing(Default true) If true then display the map editing functions If false then hide themand only allow the user to view the map
optionenable_keys(Default true) If true then enable keyboard shortcuts
optionsenable_search(Default true) If true then enable indexing of the map for search Use false to disablesearching and potentially improve the map performance
optionsfill_screen(Default false) Use true to fill the screen when an Escher Builder is placed in a top-level container (eg a div in the body element)
optionsfull_screen_button(Default false) Include a button in the user interface for entering full screen mode
optionsignore_bootstrap(Default false) Do not use Bootstrap for buttons even if it available This is used toembed Escher in a Jupyter notebook where it conflicts with the Jupyter Boostrap installa-tion
Map model and styles
optionsstarting_reaction(Default null) The ID (as a string) of a reaction to draw when the Builder loads
optionsnever_ask_before_quit(Default false) If false then display a warning before the user closes an Eschermap If true then never display the warning This options is only respected if op-tionsenable_editing == true If enable_editing is false then the warnings are not dis-played
optionsunique_map_id(Default null) A unique ID that will be used to UI elements donrsquot interfere whenmultiple maps are in the same HTML document
optionsprimary_metabolite_radius(Default 15) The radius of primary metabolites in px
optionssecondary_metabolite_radius(Default 10) The radius of secondary metabolites in px
optionsmarker_radius(Default 5) The radius of marker nodes in px
optionsgene_font_size(Default 18) The font size of the gene reaction rules in px
optionshide_secondary_metabolites(Default false) If true then secondary nodes and segments are hidden This is conve-nient for generating simplified map figures
optionsshow_gene_reaction_rules(Default false) If true then show the gene reaction rules even without gene data
optionshide_all_labels(Default false) If checked hide all reaction gene and metabolite labels
Applied data
40 Chapter 7 Contents
Escher Documentation Release 143
optionsreaction_data(Default null) An object with reaction ids for keys and reaction data points for values
optionsreaction_stylesDefault [rsquocolorrsquo rsquosizersquo rsquotextrsquo]
An array of style types The array can contain any of the following lsquocolorrsquo lsquosizersquo lsquotextrsquolsquoabsrsquo The lsquocolorrsquo style means that the reactions will be colored according to the loadeddataset The lsquosizersquo style means that the reactions will be sized according to the loadeddataset The lsquotextrsquo style means that the data values will be displayed in the reactionlabels The lsquoabsrsquo style means the the absolute values of reaction values will be used fordata visualization
optionsreaction_compare_style(Default rsquodiffrsquo) How to compare to datasets Can be either lsquofold lsquolog2_foldrsquo orlsquodiffrsquo
optionsreaction_scaleDefault
[ type min color c8c8c8 size 12 type median color 9696ff size 20 type max color ff0000 size 25 ]
An array of objects that define points on the data scale
Each point is an object with a type attribute Types can be lsquominrsquo lsquomaxrsquo lsquomeanrsquo lsquoQ1rsquo (firstquartile) lsquomedianrsquo lsquoQ3rsquo (third quartile) or lsquovaluersquo Each point can have a color attributethat specifies a color with a string (any CSS color specification is allowed including hexrgb and rgba) Each point can have a size attirbute that specifies a reaction thickness as anumber Finally points with type lsquovaluersquo can have a value attribute that specifies an exactnumber for pont in the scale
NOTE If lsquominrsquo or lsquomaxrsquo is not provided Escher automatically adds them To be com-pletely clear about what you expect to see on the map it is best to provide lsquominrsquo andlsquomaxrsquo in addition to other scale points
Here are examples of each type
type rsquominrsquo color rsquoredrsquo size 12 Specifies that reactionsnear the minimum value are red and have thickness 12
type rsquoQ1rsquo color rsquorgba(100 100 50 05)rsquo size 12 Specifies that reactions near the first quartile have the given color opacity andthickness
type rsquomeanrsquo color rsquorgb(100 100 50)rsquo size 50 Specifies that reactions near the mean value have the given color and thickness
type rsquovaluersquo value 85 color rsquo333rsquo size 50 Specifies that reactions near 85 value have the given color and size
optionsreaction_no_data_color(Default rsquodcdcdcrsquo) The color of reactions with no data value
optionsreaction_no_data_size(Default 8) The size of reactions with no data value
optionsgene_data(Default null) An object with Gene ids for keys and gene data points for values
78 JavaScript API 41
Escher Documentation Release 143
optionsand_method_in_gene_reaction_rule(Default mean) When evaluating a gene reaction rule use this function to evaluate ANDrules Can be lsquomeanrsquo or lsquominrsquo
optionsmetabolite_data(Default null) An object with metabolite ids for keys and metabolite data points forvalues
optionsmetabolite_stylesDefault [rsquocolorrsquo rsquosizersquo rsquotextrsquo]
An array of style types The array can contain any of the following lsquocolorrsquo lsquosizersquo lsquotextrsquolsquoabsrsquo The lsquocolorrsquo style means that the metabolites will be colored according to the loadeddataset The lsquosizersquo style means that the metabolites will be sized according to the loadeddataset The lsquotextrsquo style means that the data values will be displayed in the metabolitelabels The lsquoabsrsquo style means the the absolute values of metabolite values will be used fordata visualization
optionsmetabolite_compare_style(Default rsquodiffrsquo) How to compare to datasets Can be either lsquofoldrsquo lsquolog2_foldrsquo orlsquodiffrsquo
optionsmetabolite_scaleDefault
[ type min color fffaf0 size 20 type median color f1c470 size 30 type max color 800000 size 40 ]
An array of objects that define points on the data scale See the description of op-tionsreaction_scale for an explanation of the format
optionsmetabolite_no_data_color(Default rsquoffffffrsquo) The color of metabolites with no data value
optionsmetabolite_no_data_size(Default 10) The size of metabolites with no data value
View and build options
optionsidentifiers_on_map(Default rsquobigg_idrsquo) The identifiers that will be displayed in reaction metabolite andgene labels Can be lsquobigg_idrsquo or lsquonamersquo
optionshighlight_missing(Default false) If true then highlight in red reactions that are not in the loaded COBRAmodel
optionsallow_building_duplicate_reactions(Default true) If true then building duplicate reactions is allowed If false then dupli-cate reactions are hidden in Add reaction mode
optionscofactors(Default [rsquoatprsquo rsquoadprsquo rsquonadrsquo rsquonadhrsquo rsquonadprsquo rsquonadphrsquorsquogtprsquo rsquogdprsquo rsquohrsquo rsquocoarsquo rsquoumprsquo rsquoh20rsquo rsquoppirsquo]) A list of metabo-lite IDs to treat as cofactors These will be secondary metabolites in new reactions
Callbacks
optionsfirst_load_callbackA function to run after loading the Builder
42 Chapter 7 Contents
Escher Documentation Release 143
load_map(map_data[ should_update_data])Load a map for the loaded data Also reloads most of the Builder content
Arguments
bull map_data ndash The data for a map
bull should_update_data (Boolean) ndash (Default true) Whether data should be ap-plied to the map
load_model(model_data[ should_update_data])Load the cobra model from model data
Arguments
bull model_data ndash The data for a Cobra model (Parsing in done by escherCobraModel)
bull should_update_data (Boolean) ndash (Default true) Whether data should be ap-plied to the model
view_mode()Enter view mode
build_mode()Enter build mode
brush_mode()Enter brush mode
zoom_mode()Enter zoom mode
rotate_mode()Enter rotate mode
text_mode()Enter text mode
set_reaction_data(data)
Arguments
bull data (array) ndash An array of 1 or 2 objects where each object has keys that are reactionIDrsquos and values that are data points (numbers)
set_metabolite_data(data)
Arguments
bull data (array) ndash An array of 1 or 2 objects where each object has keys that are metaboliteIDrsquos and values that are data points (numbers)
set_gene_data(data clear_gene_reaction_rules)
Arguments
bull data (array) ndash An array of 1 or 2 objects where each object has keys that are gene IDrsquosand values that are data points (numbers)
Arguments
bull clear_gene_reaction_rules (Boolean) ndash (Optional Default false) In addi-tion to setting the data also turn of the gene_reaction_rules
78 JavaScript API 43
Escher Documentation Release 143
79 Python API
class escherBuilder(map_name=None map_json=None model=None model_name=Nonemodel_json=None embedded_css=None reaction_data=None metabo-lite_data=None gene_data=None local_host=None id=None safe=Falsekwargs)
A metabolic map that can be viewed edited and used to visualize data
This map will also show metabolic fluxes passed in during consruction It can be viewed as a standalone htmlinside a browswer Alternately the respresentation inside an IPython notebook will also display the map
Maps are stored in json files and are stored in a cache directory Maps which are not found will be downloadedfrom a map repository if found
Parameters
bull map_name ndash A string specifying a map to be downloaded from the Escher web server orloaded from the cache
bull map_json ndash A JSON string or a file path to a JSON file or a URL specifying a JSON fileto be downloaded
bull model ndash A Cobra model
bull model_name ndash A string specifying a model to be downloaded from the Escher web serveror loaded from the cache
bull model_json ndash A JSON string or a file path to a JSON file or a URL specifying a JSONfile to be downloaded
bull embedded_css ndash The CSS (as a string) to be embedded with the Escher SVG
bull reaction_data ndash A dictionary with keys that correspond to reaction ids and values thatwill be mapped to reaction arrows and labels
bull metabolite_data ndash A dictionary with keys that correspond to metabolite ids and valuesthat will be mapped to metabolite nodes and labels
bull gene_data ndash A dictionary with keys that correspond to gene ids and values that will bemapped to corresponding reactions
bull local_host ndash A hostname that will be used for any local files This is generally usedfor using the notebook offline and for testing in the IPython Notebook with modified Eschercode An example value for local_host is lsquohttplocalhost7778lsquo
bull id ndash Specify an id to make the javascript data definitions unique A random id is chosen bydefault
bull safe ndash If True then loading files from the filesytem is not allowed This is to ensure thesafety of using Builder within a web server
Keyword Arguments
These are defined in the Javascript API
bulluse_3d_transform
bullenable_search
bullfill_screen
bullzoom_to_element
bullfull_screen_button
44 Chapter 7 Contents
Escher Documentation Release 143
bullstarting_reaction
bullunique_map_id
bullprimary_metabolite_radius
bullsecondary_metabolite_radius
bullmarker_radius
bullgene_font_size
bullhide_secondary_metabolites
bullshow_gene_reaction_rules
bullhide_all_labels
bullreaction_styles
bullreaction_compare_style
bullreaction_scale
bullreaction_no_data_color
bullreaction_no_data_size
bulland_method_in_gene_reaction_rule
bullmetabolite_styles
bullmetabolite_compare_style
bullmetabolite_scale
bullmetabolite_no_data_color
bullmetabolite_no_data_size
bullidentifiers_on_map
bullhighlight_missing
bullallow_building_duplicate_reactions
bullcofactors
All keyword arguments can also be set on an existing Builder object using setter functions eg
my_builderset_reaction_styles(new_styles)
display_in_browser(ip=lsquo127001rsquo port=7655 n_retries=50 js_source=rsquowebrsquo menu=rsquoallrsquoscroll_behavior=rsquopanrsquo enable_editing=True enable_keys=True mini-fied_js=True never_ask_before_quit=False)
Launch a web browser to view the map
Parameters
bull ip ndash The IP address to serve the map on
bull port ndash The port to serve the map on If specified the port is occupied then a random freeport will be used
bull n_retries (int) ndash The number of times the server will try to find a port before quitting
bull js_source (string) ndash Can be one of the following
ndash web (Default) - Use JavaScript files from eschergithubio
79 Python API 45
Escher Documentation Release 143
ndash local - Use compiled JavaScript files in the local Escher installation Works offline
ndash dev - No longer necessary with source maps This now gives the same behavior aslsquolocalrsquo
bull menu (string) ndash Menu bar options include
ndash none - No menu or buttons
ndash zoom - Just zoom buttons
ndash all (Default) - Menu and button bar (requires Bootstrap)
bull scroll_behavior (string) ndash Scroll behavior options
ndash pan - Pan the map
ndash zoom - Zoom the map
ndash none (Default) - No scroll events
bull enable_editing (Boolean) ndash Enable the map editing modes
bull enable_keys (Boolean) ndash Enable keyboard shortcuts
bull minified_js (Boolean) ndash If True use the minified version of JavaScript and CSSfiles
bull never_ask_before_quit (Boolean) ndash Never display an alert asking if you wantto leave the page By default this message is displayed if enable_editing is True
display_in_notebook(js_source=rsquowebrsquo menu=rsquozoomrsquo scroll_behavior=rsquononersquo mini-fied_js=True height=500 enable_editing=False)
Embed the Map within the current IPython Notebook
Parameters
bull js_source (string) ndash Can be one of the following
ndash web (Default) - Use JavaScript files from eschergithubio
ndash local - Use compiled JavaScript files in the local Escher installation Works offline
ndash dev - No longer necessary with source maps This now gives the same behav-ior as lsquolocalrsquo
bull menu (string) ndash Menu bar options include
ndash none - No menu or buttons
ndash zoom - Just zoom buttons
ndash Note The all menu option does not work in an IPython notebook
bull scroll_behavior (string) ndash Scroll behavior options
ndash pan - Pan the map
ndash zoom - Zoom the map
ndash none - (Default) No scroll events
bull minified_js (Boolean) ndash If True use the minified version of JavaScript andCSS files
bull height ndash Height of the HTML container
bull enable_editing (Boolean) ndash Enable the map editing modes
46 Chapter 7 Contents
Escher Documentation Release 143
save_html(filepath=None overwrite=False js_source=rsquowebrsquo protocol=rsquohttpsrsquo menu=rsquoallrsquoscroll_behavior=rsquopanrsquo enable_editing=True enable_keys=True minified_js=Truenever_ask_before_quit=False static_site_index_json=None)
Save an HTML file containing the map
Parameters
bull filepath (string) ndash The HTML file will be saved to this location Whenjs_source is lsquolocalrsquo then a new directory will be created with this name
bull overwrite (Boolean) ndash Overwrite existing files
bull js_source (string) ndash Can be one of the following
ndash web (Default) - Use JavaScript files from eschergithubio
ndash local - Use compiled JavaScript files in the local Escher installation Works of-fline To make the dependencies available to the downloaded file a new directorywill be made with the name specified by filepath
ndash dev - No longer necessary with source maps This now gives the same behav-ior as lsquolocalrsquo
bull protocol (string) ndash The protocol can be lsquohttprsquo lsquohttpsrsquo or None which indicatesa lsquoprotocol relative URLrsquo as in eschergithubio Ignored if source is local
bull menu (string) ndash Menu bar options include
ndash none - No menu or buttons
ndash zoom - Just zoom buttons
ndash all (Default) - Menu and button bar (requires Bootstrap)
bull scroll_behavior (string) ndash Scroll behavior options
ndash pan - Pan the map
ndash zoom - Zoom the map
ndash none (Default) - No scroll events
bull enable_editing (Boolean) ndash Enable the map editing modes
bull enable_keys (Boolean) ndash Enable keyboard shortcuts
bull minified_js (Boolean) ndash If True use the minified version of JavaScript andCSS files
bull height (number) ndash Height of the HTML container
bull never_ask_before_quit (Boolean) ndash Never display an alert asking if youwant to leave the page By default this message is displayed if enable_editing isTrue
bull static_site_index_json (string) ndash The index as a JSON string for thestatic site Use javascript to parse the URL options Used for generating static pages(see static_sitepy)
791 Cache
escherget_cache_dir(versioned=True name=None)Get the cache dir as a string and make the directory if it does not already exist
Parameters
79 Python API 47
Escher Documentation Release 143
bull versioned (Boolean) ndash Whether to return the versioned path in the cache Eschermaps for the latest version of Escher are found in the versioned directory (versioned= True) but maps for previous versions of Escher can be found by visiting the parentdirectory (versioned = False)
bull name (string) ndash An optional subdirectory within the cache If versioned is False thenname is ignored
escherclear_cache(different_cache_dir=None ask=True)Empty the contents of the cache directory including all versions of all maps and models
Parameters
bull different_cache_dir (string) ndash (Optional) The directory of another cacheThis is mainly for testing
bull ask (Boolean) ndash Whether to ask before deleting
escherlist_cached_maps()Return a list of all cached maps
escherlist_cached_models()Return a list of all cached models
escherlist_available_maps()Return a list of all maps available on the server
escherlist_available_models()Return a list of all models available on the server
710 License
Escher and EscherConverter are distributed under the MIT license
bull genindex
48 Chapter 7 Contents
Python Module Index
eescher 44
49
Escher Documentation Release 143
50 Python Module Index
Index
Bbrush_mode() (built-in function) 43build_mode() (built-in function) 43Builder (class in escher) 44
Cclear_cache() (in module escher) 48
Ddisplay_in_browser() (escherBuilder method) 45display_in_notebook() (escherBuilder method) 46
Eescher (module) 44escherBuilder() (class) 39
Gget_cache_dir() (in module escher) 47
Llist_available_maps() (in module escher) 48list_available_models() (in module escher) 48list_cached_maps() (in module escher) 48list_cached_models() (in module escher) 48load_map() (built-in function) 42load_model() (built-in function) 43
Ooptionenable_keys (option attribute) 40optionsallow_building_duplicate_reactions (options at-
tribute) 42optionsand_method_in_gene_reaction_rule (options at-
tribute) 41optionscofactors (options attribute) 42optionsenable_editing (options attribute) 39optionsenable_search (options attribute) 40optionsfill_screen (options attribute) 40optionsfirst_load_callback (options attribute) 42optionsfull_screen_button (options attribute) 40optionsgene_data (options attribute) 41
optionsgene_font_size (options attribute) 40optionshide_all_labels (options attribute) 40optionshide_secondary_metabolites (options attribute)
40optionshighlight_missing (options attribute) 42optionsidentifiers_on_map (options attribute) 42optionsignore_bootstrap (options attribute) 40optionsmarker_radius (options attribute) 40optionsmenu (options attribute) 39optionsmetabolite_compare_style (options attribute) 42optionsmetabolite_data (options attribute) 42optionsmetabolite_no_data_color (options attribute) 42optionsmetabolite_no_data_size (options attribute) 42optionsmetabolite_scale (options attribute) 42optionsmetabolite_styles (options attribute) 42optionsnever_ask_before_quit (options attribute) 40optionsprimary_metabolite_radius (options attribute) 40optionsreaction_compare_style (options attribute) 41optionsreaction_data (options attribute) 40optionsreaction_no_data_color (options attribute) 41optionsreaction_no_data_size (options attribute) 41optionsreaction_scale (options attribute) 41optionsreaction_styles (options attribute) 41optionsscroll_behavior (options attribute) 39optionssecondary_metabolite_radius (options attribute)
40optionsshow_gene_reaction_rules (options attribute) 40optionsstarting_reaction (options attribute) 40optionsunique_map_id (options attribute) 40optionsuse_3d_transform (options attribute) 39
Rrotate_mode() (built-in function) 43
Ssave_html() (escherBuilder method) 46set_gene_data() (built-in function) 43set_metabolite_data() (built-in function) 43set_reaction_data() (built-in function) 43
51
Escher Documentation Release 143
Ttext_mode() (built-in function) 43
Vview_mode() (built-in function) 43
Zzoom_mode() (built-in function) 43
52 Index
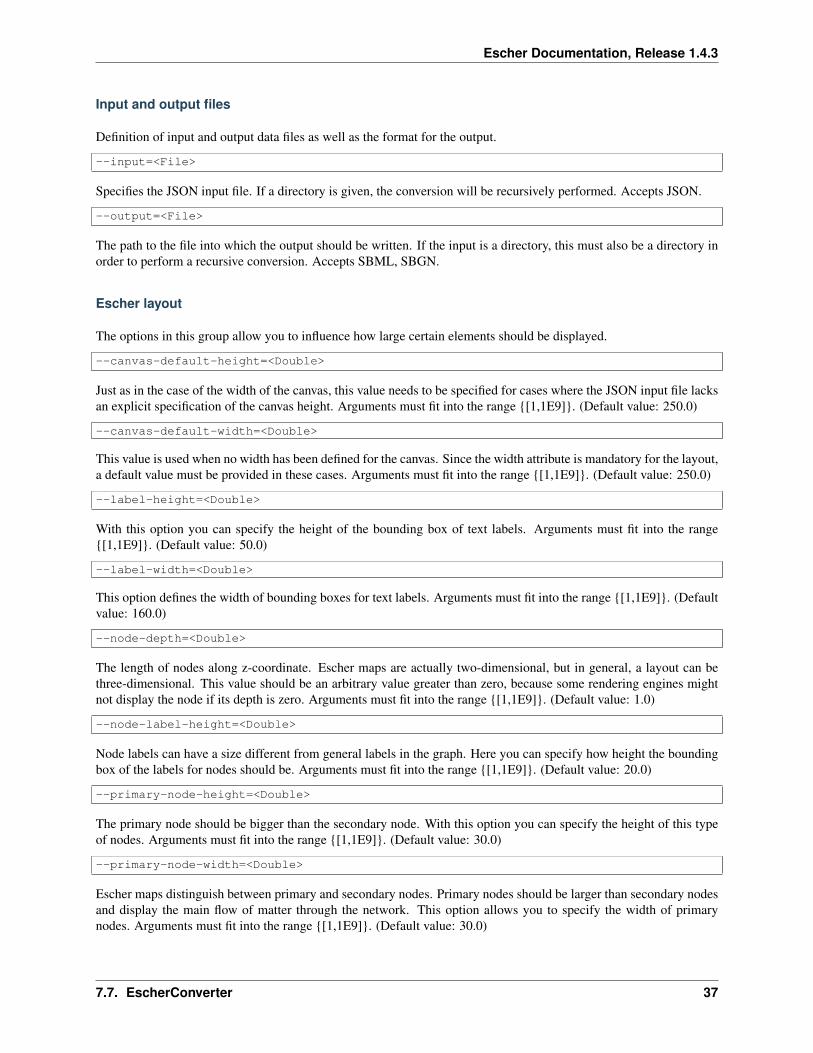
Escher Documentation Release 143
--reaction-label-height=ltDoublegt
Reaction label heightArguments must fit into the range [11E9] (Default value 300)
--reaction-node-ratio=ltDoublegt
This value is used as a conversion factor to determine the size of the reaction display box depending on the size ofprimary nodes Height and width of reaction nodes are determined by dividing the corresponding values from theprimary node size by this factor Arguments must fit into the range [01] (Default value 05)
--secondary-node-ratio=ltDoublegt
Similar to the reaction node ratio the size of secondary nodes (width and height) is determined by dividing thecorresponding values from the primary nodes by this value Arguments must fit into the range [01] (Default value06666666666666666)
--z=ltDoublegt
The position on the z-axis where the entire two-dimensional graph should be drawn Arguments must fit into the range[-1E91E9] (Default value 00)
Escher Components and their naming
Here you can influence which elements are to be included in the layout and how elements in the layout are to be calledor identified
--format=ltOutputFormatgt
The desired format for the conversion eg SBML All possible values for type ltOutputFormatgt are SBGN andSBML (Default value SBML)
--layout-id=ltStringgt
In contrast to the name this identifier does not have to be human-readable This is a machine identifier which muststart with a letter or underscore and can only contain ASCII characters (Default value Escher_Layout)
--layout-name=ltStringgt
This should be a human-readable name for the layout that is to be created This name might be displayed to describethe figure and should therefore be explanatory (Default value Escher Layout)
--compartment-id=ltStringgt
A compartment needs to have a unique identifier which needs to be a machine-readable Sting that must start with aletter or underscore and can only contain ASCII characters Since the JSON file does not provide this information thisoption allows you to specify the required identifier (Default value default)
--compartment-name=ltStringgt
With this option it is possible to define a name for the default compartment can be that needs to be generated for theconversion to SBML The name does not have any restrictions ie any UTF-8 character can be used (Default valueDefault compartment)
--infer-compartment-bounds
This converter can infer where the boundaries of compartments could be drawn To this end it uses each nodersquos BiGGids to identify the compartment of all metabolites Assuming that compartments have rectangular shapes the algorithmcan find the outermost node on each side of the box and hence obtain the boundaries of the compartment However
38 Chapter 7 Contents
Escher Documentation Release 143
this methods will fail when metabolites are drawn inside of such a box that belong to a different compartment that isactually further outside For this reason this option is deactivated by default (Default value false)
Options for the graphical user interface
--gui
If this option is given the program will display its graphical user interface (Default value false)
--log-level=ltStringgt
Change the log-level of this application This option will influence how fine-grained error and other log messages willbe that you receive while executing this program All possible values for type ltStringgt are ALL CONFIG FINEFINER FINEST INFO OFF SEVERE and WARNING (Default value INFO)
--log-file=ltFilegt
This option allows you to specify a log file to which all information of the program will be written Accepts (bp2bp3 log owl xml)
78 JavaScript API
class escherBuilder(map_data model_data embedded_css selection options)A Builder object contains all the UI and logic to generate a map builder or viewer
Arguments
bull map_data (object) ndash The data for a map to be passed to escherMapfrom_data() Ifnull then an empty Builder is initialized
bull model_data (object) ndash The data for a cobra model to be passed to es-cherCobraModel() Can be null
bull embedded_css (string) ndash The stylesheet for the SVG elements in the Escher map
bull selection (object) ndash (Optional Default In the body element) The d3 selection of anelement to place the Builder into The selection cannot be inside an SVG element
bull options (object) ndash (Optional) An object defining any of the following options
optionsmenu(Default rsquoallrsquo) The type of menu that will be displayed Can be lsquoallrsquo for the fullmenu or lsquozoomrsquo for just zoom buttons The lsquoallrsquo option requires the full set of Escherdependencies (D3js JQuery and Bootstrap) while the lsquozoomrsquo option requires only D3jsFor more details see Developing with Escher
optionsscroll_behavior(Default rsquopanrsquo) This option determines the effect that the scroll wheel will have onan Escher map Can be lsquopanrsquo to pan the map or lsquozoomrsquo to zoom the map when the usermoves the scroll wheel
optionsuse_3d_transform(Default Chooses a good option by testing the browser) If true then use CSS3 3D trans-forms to speed up panning and zooming This feature will only work on browsers thatsupport the 3D transforms It works best in the latest versions of Chrome Firefox andInternet Explorer Safari works better with this turned off
78 JavaScript API 39
Escher Documentation Release 143
optionsenable_editing(Default true) If true then display the map editing functions If false then hide themand only allow the user to view the map
optionenable_keys(Default true) If true then enable keyboard shortcuts
optionsenable_search(Default true) If true then enable indexing of the map for search Use false to disablesearching and potentially improve the map performance
optionsfill_screen(Default false) Use true to fill the screen when an Escher Builder is placed in a top-level container (eg a div in the body element)
optionsfull_screen_button(Default false) Include a button in the user interface for entering full screen mode
optionsignore_bootstrap(Default false) Do not use Bootstrap for buttons even if it available This is used toembed Escher in a Jupyter notebook where it conflicts with the Jupyter Boostrap installa-tion
Map model and styles
optionsstarting_reaction(Default null) The ID (as a string) of a reaction to draw when the Builder loads
optionsnever_ask_before_quit(Default false) If false then display a warning before the user closes an Eschermap If true then never display the warning This options is only respected if op-tionsenable_editing == true If enable_editing is false then the warnings are not dis-played
optionsunique_map_id(Default null) A unique ID that will be used to UI elements donrsquot interfere whenmultiple maps are in the same HTML document
optionsprimary_metabolite_radius(Default 15) The radius of primary metabolites in px
optionssecondary_metabolite_radius(Default 10) The radius of secondary metabolites in px
optionsmarker_radius(Default 5) The radius of marker nodes in px
optionsgene_font_size(Default 18) The font size of the gene reaction rules in px
optionshide_secondary_metabolites(Default false) If true then secondary nodes and segments are hidden This is conve-nient for generating simplified map figures
optionsshow_gene_reaction_rules(Default false) If true then show the gene reaction rules even without gene data
optionshide_all_labels(Default false) If checked hide all reaction gene and metabolite labels
Applied data
40 Chapter 7 Contents
Escher Documentation Release 143
optionsreaction_data(Default null) An object with reaction ids for keys and reaction data points for values
optionsreaction_stylesDefault [rsquocolorrsquo rsquosizersquo rsquotextrsquo]
An array of style types The array can contain any of the following lsquocolorrsquo lsquosizersquo lsquotextrsquolsquoabsrsquo The lsquocolorrsquo style means that the reactions will be colored according to the loadeddataset The lsquosizersquo style means that the reactions will be sized according to the loadeddataset The lsquotextrsquo style means that the data values will be displayed in the reactionlabels The lsquoabsrsquo style means the the absolute values of reaction values will be used fordata visualization
optionsreaction_compare_style(Default rsquodiffrsquo) How to compare to datasets Can be either lsquofold lsquolog2_foldrsquo orlsquodiffrsquo
optionsreaction_scaleDefault
[ type min color c8c8c8 size 12 type median color 9696ff size 20 type max color ff0000 size 25 ]
An array of objects that define points on the data scale
Each point is an object with a type attribute Types can be lsquominrsquo lsquomaxrsquo lsquomeanrsquo lsquoQ1rsquo (firstquartile) lsquomedianrsquo lsquoQ3rsquo (third quartile) or lsquovaluersquo Each point can have a color attributethat specifies a color with a string (any CSS color specification is allowed including hexrgb and rgba) Each point can have a size attirbute that specifies a reaction thickness as anumber Finally points with type lsquovaluersquo can have a value attribute that specifies an exactnumber for pont in the scale
NOTE If lsquominrsquo or lsquomaxrsquo is not provided Escher automatically adds them To be com-pletely clear about what you expect to see on the map it is best to provide lsquominrsquo andlsquomaxrsquo in addition to other scale points
Here are examples of each type
type rsquominrsquo color rsquoredrsquo size 12 Specifies that reactionsnear the minimum value are red and have thickness 12
type rsquoQ1rsquo color rsquorgba(100 100 50 05)rsquo size 12 Specifies that reactions near the first quartile have the given color opacity andthickness
type rsquomeanrsquo color rsquorgb(100 100 50)rsquo size 50 Specifies that reactions near the mean value have the given color and thickness
type rsquovaluersquo value 85 color rsquo333rsquo size 50 Specifies that reactions near 85 value have the given color and size
optionsreaction_no_data_color(Default rsquodcdcdcrsquo) The color of reactions with no data value
optionsreaction_no_data_size(Default 8) The size of reactions with no data value
optionsgene_data(Default null) An object with Gene ids for keys and gene data points for values
78 JavaScript API 41
Escher Documentation Release 143
optionsand_method_in_gene_reaction_rule(Default mean) When evaluating a gene reaction rule use this function to evaluate ANDrules Can be lsquomeanrsquo or lsquominrsquo
optionsmetabolite_data(Default null) An object with metabolite ids for keys and metabolite data points forvalues
optionsmetabolite_stylesDefault [rsquocolorrsquo rsquosizersquo rsquotextrsquo]
An array of style types The array can contain any of the following lsquocolorrsquo lsquosizersquo lsquotextrsquolsquoabsrsquo The lsquocolorrsquo style means that the metabolites will be colored according to the loadeddataset The lsquosizersquo style means that the metabolites will be sized according to the loadeddataset The lsquotextrsquo style means that the data values will be displayed in the metabolitelabels The lsquoabsrsquo style means the the absolute values of metabolite values will be used fordata visualization
optionsmetabolite_compare_style(Default rsquodiffrsquo) How to compare to datasets Can be either lsquofoldrsquo lsquolog2_foldrsquo orlsquodiffrsquo
optionsmetabolite_scaleDefault
[ type min color fffaf0 size 20 type median color f1c470 size 30 type max color 800000 size 40 ]
An array of objects that define points on the data scale See the description of op-tionsreaction_scale for an explanation of the format
optionsmetabolite_no_data_color(Default rsquoffffffrsquo) The color of metabolites with no data value
optionsmetabolite_no_data_size(Default 10) The size of metabolites with no data value
View and build options
optionsidentifiers_on_map(Default rsquobigg_idrsquo) The identifiers that will be displayed in reaction metabolite andgene labels Can be lsquobigg_idrsquo or lsquonamersquo
optionshighlight_missing(Default false) If true then highlight in red reactions that are not in the loaded COBRAmodel
optionsallow_building_duplicate_reactions(Default true) If true then building duplicate reactions is allowed If false then dupli-cate reactions are hidden in Add reaction mode
optionscofactors(Default [rsquoatprsquo rsquoadprsquo rsquonadrsquo rsquonadhrsquo rsquonadprsquo rsquonadphrsquorsquogtprsquo rsquogdprsquo rsquohrsquo rsquocoarsquo rsquoumprsquo rsquoh20rsquo rsquoppirsquo]) A list of metabo-lite IDs to treat as cofactors These will be secondary metabolites in new reactions
Callbacks
optionsfirst_load_callbackA function to run after loading the Builder
42 Chapter 7 Contents
Escher Documentation Release 143
load_map(map_data[ should_update_data])Load a map for the loaded data Also reloads most of the Builder content
Arguments
bull map_data ndash The data for a map
bull should_update_data (Boolean) ndash (Default true) Whether data should be ap-plied to the map
load_model(model_data[ should_update_data])Load the cobra model from model data
Arguments
bull model_data ndash The data for a Cobra model (Parsing in done by escherCobraModel)
bull should_update_data (Boolean) ndash (Default true) Whether data should be ap-plied to the model
view_mode()Enter view mode
build_mode()Enter build mode
brush_mode()Enter brush mode
zoom_mode()Enter zoom mode
rotate_mode()Enter rotate mode
text_mode()Enter text mode
set_reaction_data(data)
Arguments
bull data (array) ndash An array of 1 or 2 objects where each object has keys that are reactionIDrsquos and values that are data points (numbers)
set_metabolite_data(data)
Arguments
bull data (array) ndash An array of 1 or 2 objects where each object has keys that are metaboliteIDrsquos and values that are data points (numbers)
set_gene_data(data clear_gene_reaction_rules)
Arguments
bull data (array) ndash An array of 1 or 2 objects where each object has keys that are gene IDrsquosand values that are data points (numbers)
Arguments
bull clear_gene_reaction_rules (Boolean) ndash (Optional Default false) In addi-tion to setting the data also turn of the gene_reaction_rules
78 JavaScript API 43
Escher Documentation Release 143
79 Python API
class escherBuilder(map_name=None map_json=None model=None model_name=Nonemodel_json=None embedded_css=None reaction_data=None metabo-lite_data=None gene_data=None local_host=None id=None safe=Falsekwargs)
A metabolic map that can be viewed edited and used to visualize data
This map will also show metabolic fluxes passed in during consruction It can be viewed as a standalone htmlinside a browswer Alternately the respresentation inside an IPython notebook will also display the map
Maps are stored in json files and are stored in a cache directory Maps which are not found will be downloadedfrom a map repository if found
Parameters
bull map_name ndash A string specifying a map to be downloaded from the Escher web server orloaded from the cache
bull map_json ndash A JSON string or a file path to a JSON file or a URL specifying a JSON fileto be downloaded
bull model ndash A Cobra model
bull model_name ndash A string specifying a model to be downloaded from the Escher web serveror loaded from the cache
bull model_json ndash A JSON string or a file path to a JSON file or a URL specifying a JSONfile to be downloaded
bull embedded_css ndash The CSS (as a string) to be embedded with the Escher SVG
bull reaction_data ndash A dictionary with keys that correspond to reaction ids and values thatwill be mapped to reaction arrows and labels
bull metabolite_data ndash A dictionary with keys that correspond to metabolite ids and valuesthat will be mapped to metabolite nodes and labels
bull gene_data ndash A dictionary with keys that correspond to gene ids and values that will bemapped to corresponding reactions
bull local_host ndash A hostname that will be used for any local files This is generally usedfor using the notebook offline and for testing in the IPython Notebook with modified Eschercode An example value for local_host is lsquohttplocalhost7778lsquo
bull id ndash Specify an id to make the javascript data definitions unique A random id is chosen bydefault
bull safe ndash If True then loading files from the filesytem is not allowed This is to ensure thesafety of using Builder within a web server
Keyword Arguments
These are defined in the Javascript API
bulluse_3d_transform
bullenable_search
bullfill_screen
bullzoom_to_element
bullfull_screen_button
44 Chapter 7 Contents
Escher Documentation Release 143
bullstarting_reaction
bullunique_map_id
bullprimary_metabolite_radius
bullsecondary_metabolite_radius
bullmarker_radius
bullgene_font_size
bullhide_secondary_metabolites
bullshow_gene_reaction_rules
bullhide_all_labels
bullreaction_styles
bullreaction_compare_style
bullreaction_scale
bullreaction_no_data_color
bullreaction_no_data_size
bulland_method_in_gene_reaction_rule
bullmetabolite_styles
bullmetabolite_compare_style
bullmetabolite_scale
bullmetabolite_no_data_color
bullmetabolite_no_data_size
bullidentifiers_on_map
bullhighlight_missing
bullallow_building_duplicate_reactions
bullcofactors
All keyword arguments can also be set on an existing Builder object using setter functions eg
my_builderset_reaction_styles(new_styles)
display_in_browser(ip=lsquo127001rsquo port=7655 n_retries=50 js_source=rsquowebrsquo menu=rsquoallrsquoscroll_behavior=rsquopanrsquo enable_editing=True enable_keys=True mini-fied_js=True never_ask_before_quit=False)
Launch a web browser to view the map
Parameters
bull ip ndash The IP address to serve the map on
bull port ndash The port to serve the map on If specified the port is occupied then a random freeport will be used
bull n_retries (int) ndash The number of times the server will try to find a port before quitting
bull js_source (string) ndash Can be one of the following
ndash web (Default) - Use JavaScript files from eschergithubio
79 Python API 45
Escher Documentation Release 143
ndash local - Use compiled JavaScript files in the local Escher installation Works offline
ndash dev - No longer necessary with source maps This now gives the same behavior aslsquolocalrsquo
bull menu (string) ndash Menu bar options include
ndash none - No menu or buttons
ndash zoom - Just zoom buttons
ndash all (Default) - Menu and button bar (requires Bootstrap)
bull scroll_behavior (string) ndash Scroll behavior options
ndash pan - Pan the map
ndash zoom - Zoom the map
ndash none (Default) - No scroll events
bull enable_editing (Boolean) ndash Enable the map editing modes
bull enable_keys (Boolean) ndash Enable keyboard shortcuts
bull minified_js (Boolean) ndash If True use the minified version of JavaScript and CSSfiles
bull never_ask_before_quit (Boolean) ndash Never display an alert asking if you wantto leave the page By default this message is displayed if enable_editing is True
display_in_notebook(js_source=rsquowebrsquo menu=rsquozoomrsquo scroll_behavior=rsquononersquo mini-fied_js=True height=500 enable_editing=False)
Embed the Map within the current IPython Notebook
Parameters
bull js_source (string) ndash Can be one of the following
ndash web (Default) - Use JavaScript files from eschergithubio
ndash local - Use compiled JavaScript files in the local Escher installation Works offline
ndash dev - No longer necessary with source maps This now gives the same behav-ior as lsquolocalrsquo
bull menu (string) ndash Menu bar options include
ndash none - No menu or buttons
ndash zoom - Just zoom buttons
ndash Note The all menu option does not work in an IPython notebook
bull scroll_behavior (string) ndash Scroll behavior options
ndash pan - Pan the map
ndash zoom - Zoom the map
ndash none - (Default) No scroll events
bull minified_js (Boolean) ndash If True use the minified version of JavaScript andCSS files
bull height ndash Height of the HTML container
bull enable_editing (Boolean) ndash Enable the map editing modes
46 Chapter 7 Contents
Escher Documentation Release 143
save_html(filepath=None overwrite=False js_source=rsquowebrsquo protocol=rsquohttpsrsquo menu=rsquoallrsquoscroll_behavior=rsquopanrsquo enable_editing=True enable_keys=True minified_js=Truenever_ask_before_quit=False static_site_index_json=None)
Save an HTML file containing the map
Parameters
bull filepath (string) ndash The HTML file will be saved to this location Whenjs_source is lsquolocalrsquo then a new directory will be created with this name
bull overwrite (Boolean) ndash Overwrite existing files
bull js_source (string) ndash Can be one of the following
ndash web (Default) - Use JavaScript files from eschergithubio
ndash local - Use compiled JavaScript files in the local Escher installation Works of-fline To make the dependencies available to the downloaded file a new directorywill be made with the name specified by filepath
ndash dev - No longer necessary with source maps This now gives the same behav-ior as lsquolocalrsquo
bull protocol (string) ndash The protocol can be lsquohttprsquo lsquohttpsrsquo or None which indicatesa lsquoprotocol relative URLrsquo as in eschergithubio Ignored if source is local
bull menu (string) ndash Menu bar options include
ndash none - No menu or buttons
ndash zoom - Just zoom buttons
ndash all (Default) - Menu and button bar (requires Bootstrap)
bull scroll_behavior (string) ndash Scroll behavior options
ndash pan - Pan the map
ndash zoom - Zoom the map
ndash none (Default) - No scroll events
bull enable_editing (Boolean) ndash Enable the map editing modes
bull enable_keys (Boolean) ndash Enable keyboard shortcuts
bull minified_js (Boolean) ndash If True use the minified version of JavaScript andCSS files
bull height (number) ndash Height of the HTML container
bull never_ask_before_quit (Boolean) ndash Never display an alert asking if youwant to leave the page By default this message is displayed if enable_editing isTrue
bull static_site_index_json (string) ndash The index as a JSON string for thestatic site Use javascript to parse the URL options Used for generating static pages(see static_sitepy)
791 Cache
escherget_cache_dir(versioned=True name=None)Get the cache dir as a string and make the directory if it does not already exist
Parameters
79 Python API 47
Escher Documentation Release 143
bull versioned (Boolean) ndash Whether to return the versioned path in the cache Eschermaps for the latest version of Escher are found in the versioned directory (versioned= True) but maps for previous versions of Escher can be found by visiting the parentdirectory (versioned = False)
bull name (string) ndash An optional subdirectory within the cache If versioned is False thenname is ignored
escherclear_cache(different_cache_dir=None ask=True)Empty the contents of the cache directory including all versions of all maps and models
Parameters
bull different_cache_dir (string) ndash (Optional) The directory of another cacheThis is mainly for testing
bull ask (Boolean) ndash Whether to ask before deleting
escherlist_cached_maps()Return a list of all cached maps
escherlist_cached_models()Return a list of all cached models
escherlist_available_maps()Return a list of all maps available on the server
escherlist_available_models()Return a list of all models available on the server
710 License
Escher and EscherConverter are distributed under the MIT license
bull genindex
48 Chapter 7 Contents
Python Module Index
eescher 44
49
Escher Documentation Release 143
50 Python Module Index
Index
Bbrush_mode() (built-in function) 43build_mode() (built-in function) 43Builder (class in escher) 44
Cclear_cache() (in module escher) 48
Ddisplay_in_browser() (escherBuilder method) 45display_in_notebook() (escherBuilder method) 46
Eescher (module) 44escherBuilder() (class) 39
Gget_cache_dir() (in module escher) 47
Llist_available_maps() (in module escher) 48list_available_models() (in module escher) 48list_cached_maps() (in module escher) 48list_cached_models() (in module escher) 48load_map() (built-in function) 42load_model() (built-in function) 43
Ooptionenable_keys (option attribute) 40optionsallow_building_duplicate_reactions (options at-
tribute) 42optionsand_method_in_gene_reaction_rule (options at-
tribute) 41optionscofactors (options attribute) 42optionsenable_editing (options attribute) 39optionsenable_search (options attribute) 40optionsfill_screen (options attribute) 40optionsfirst_load_callback (options attribute) 42optionsfull_screen_button (options attribute) 40optionsgene_data (options attribute) 41
optionsgene_font_size (options attribute) 40optionshide_all_labels (options attribute) 40optionshide_secondary_metabolites (options attribute)
40optionshighlight_missing (options attribute) 42optionsidentifiers_on_map (options attribute) 42optionsignore_bootstrap (options attribute) 40optionsmarker_radius (options attribute) 40optionsmenu (options attribute) 39optionsmetabolite_compare_style (options attribute) 42optionsmetabolite_data (options attribute) 42optionsmetabolite_no_data_color (options attribute) 42optionsmetabolite_no_data_size (options attribute) 42optionsmetabolite_scale (options attribute) 42optionsmetabolite_styles (options attribute) 42optionsnever_ask_before_quit (options attribute) 40optionsprimary_metabolite_radius (options attribute) 40optionsreaction_compare_style (options attribute) 41optionsreaction_data (options attribute) 40optionsreaction_no_data_color (options attribute) 41optionsreaction_no_data_size (options attribute) 41optionsreaction_scale (options attribute) 41optionsreaction_styles (options attribute) 41optionsscroll_behavior (options attribute) 39optionssecondary_metabolite_radius (options attribute)
40optionsshow_gene_reaction_rules (options attribute) 40optionsstarting_reaction (options attribute) 40optionsunique_map_id (options attribute) 40optionsuse_3d_transform (options attribute) 39
Rrotate_mode() (built-in function) 43
Ssave_html() (escherBuilder method) 46set_gene_data() (built-in function) 43set_metabolite_data() (built-in function) 43set_reaction_data() (built-in function) 43
51
Escher Documentation Release 143
Ttext_mode() (built-in function) 43
Vview_mode() (built-in function) 43
Zzoom_mode() (built-in function) 43
52 Index
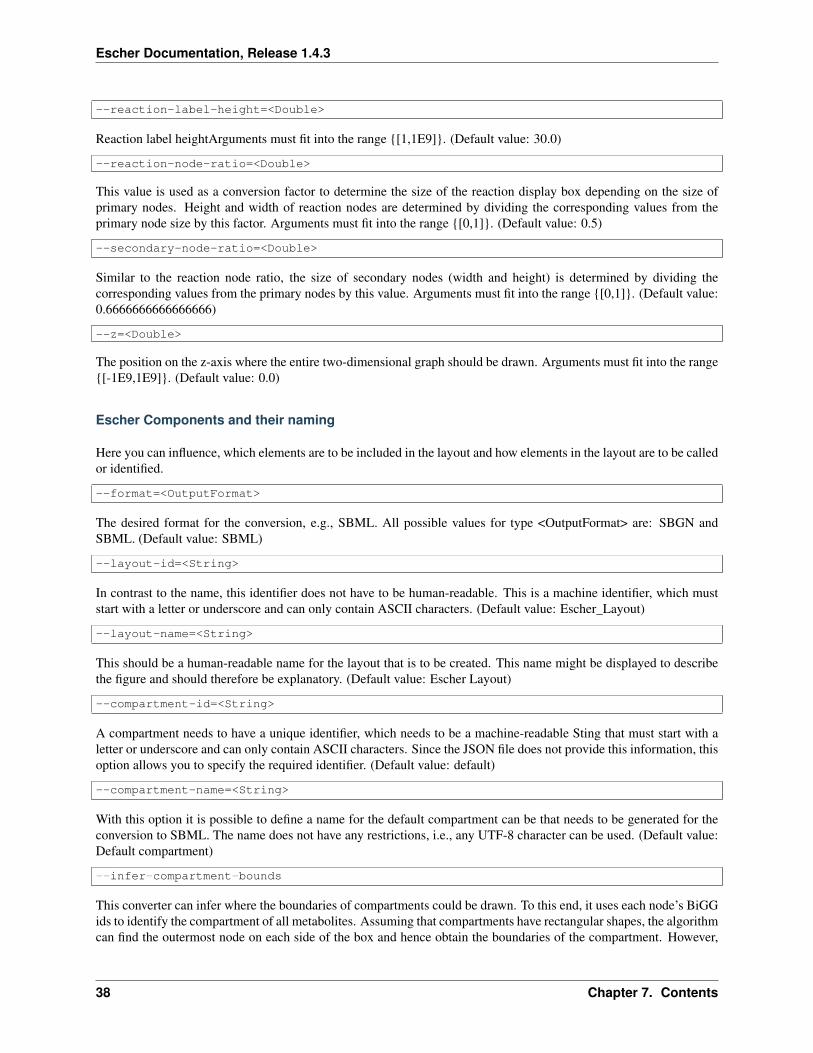
Escher Documentation Release 143
this methods will fail when metabolites are drawn inside of such a box that belong to a different compartment that isactually further outside For this reason this option is deactivated by default (Default value false)
Options for the graphical user interface
--gui
If this option is given the program will display its graphical user interface (Default value false)
--log-level=ltStringgt
Change the log-level of this application This option will influence how fine-grained error and other log messages willbe that you receive while executing this program All possible values for type ltStringgt are ALL CONFIG FINEFINER FINEST INFO OFF SEVERE and WARNING (Default value INFO)
--log-file=ltFilegt
This option allows you to specify a log file to which all information of the program will be written Accepts (bp2bp3 log owl xml)
78 JavaScript API
class escherBuilder(map_data model_data embedded_css selection options)A Builder object contains all the UI and logic to generate a map builder or viewer
Arguments
bull map_data (object) ndash The data for a map to be passed to escherMapfrom_data() Ifnull then an empty Builder is initialized
bull model_data (object) ndash The data for a cobra model to be passed to es-cherCobraModel() Can be null
bull embedded_css (string) ndash The stylesheet for the SVG elements in the Escher map
bull selection (object) ndash (Optional Default In the body element) The d3 selection of anelement to place the Builder into The selection cannot be inside an SVG element
bull options (object) ndash (Optional) An object defining any of the following options
optionsmenu(Default rsquoallrsquo) The type of menu that will be displayed Can be lsquoallrsquo for the fullmenu or lsquozoomrsquo for just zoom buttons The lsquoallrsquo option requires the full set of Escherdependencies (D3js JQuery and Bootstrap) while the lsquozoomrsquo option requires only D3jsFor more details see Developing with Escher
optionsscroll_behavior(Default rsquopanrsquo) This option determines the effect that the scroll wheel will have onan Escher map Can be lsquopanrsquo to pan the map or lsquozoomrsquo to zoom the map when the usermoves the scroll wheel
optionsuse_3d_transform(Default Chooses a good option by testing the browser) If true then use CSS3 3D trans-forms to speed up panning and zooming This feature will only work on browsers thatsupport the 3D transforms It works best in the latest versions of Chrome Firefox andInternet Explorer Safari works better with this turned off
78 JavaScript API 39
Escher Documentation Release 143
optionsenable_editing(Default true) If true then display the map editing functions If false then hide themand only allow the user to view the map
optionenable_keys(Default true) If true then enable keyboard shortcuts
optionsenable_search(Default true) If true then enable indexing of the map for search Use false to disablesearching and potentially improve the map performance
optionsfill_screen(Default false) Use true to fill the screen when an Escher Builder is placed in a top-level container (eg a div in the body element)
optionsfull_screen_button(Default false) Include a button in the user interface for entering full screen mode
optionsignore_bootstrap(Default false) Do not use Bootstrap for buttons even if it available This is used toembed Escher in a Jupyter notebook where it conflicts with the Jupyter Boostrap installa-tion
Map model and styles
optionsstarting_reaction(Default null) The ID (as a string) of a reaction to draw when the Builder loads
optionsnever_ask_before_quit(Default false) If false then display a warning before the user closes an Eschermap If true then never display the warning This options is only respected if op-tionsenable_editing == true If enable_editing is false then the warnings are not dis-played
optionsunique_map_id(Default null) A unique ID that will be used to UI elements donrsquot interfere whenmultiple maps are in the same HTML document
optionsprimary_metabolite_radius(Default 15) The radius of primary metabolites in px
optionssecondary_metabolite_radius(Default 10) The radius of secondary metabolites in px
optionsmarker_radius(Default 5) The radius of marker nodes in px
optionsgene_font_size(Default 18) The font size of the gene reaction rules in px
optionshide_secondary_metabolites(Default false) If true then secondary nodes and segments are hidden This is conve-nient for generating simplified map figures
optionsshow_gene_reaction_rules(Default false) If true then show the gene reaction rules even without gene data
optionshide_all_labels(Default false) If checked hide all reaction gene and metabolite labels
Applied data
40 Chapter 7 Contents
Escher Documentation Release 143
optionsreaction_data(Default null) An object with reaction ids for keys and reaction data points for values
optionsreaction_stylesDefault [rsquocolorrsquo rsquosizersquo rsquotextrsquo]
An array of style types The array can contain any of the following lsquocolorrsquo lsquosizersquo lsquotextrsquolsquoabsrsquo The lsquocolorrsquo style means that the reactions will be colored according to the loadeddataset The lsquosizersquo style means that the reactions will be sized according to the loadeddataset The lsquotextrsquo style means that the data values will be displayed in the reactionlabels The lsquoabsrsquo style means the the absolute values of reaction values will be used fordata visualization
optionsreaction_compare_style(Default rsquodiffrsquo) How to compare to datasets Can be either lsquofold lsquolog2_foldrsquo orlsquodiffrsquo
optionsreaction_scaleDefault
[ type min color c8c8c8 size 12 type median color 9696ff size 20 type max color ff0000 size 25 ]
An array of objects that define points on the data scale
Each point is an object with a type attribute Types can be lsquominrsquo lsquomaxrsquo lsquomeanrsquo lsquoQ1rsquo (firstquartile) lsquomedianrsquo lsquoQ3rsquo (third quartile) or lsquovaluersquo Each point can have a color attributethat specifies a color with a string (any CSS color specification is allowed including hexrgb and rgba) Each point can have a size attirbute that specifies a reaction thickness as anumber Finally points with type lsquovaluersquo can have a value attribute that specifies an exactnumber for pont in the scale
NOTE If lsquominrsquo or lsquomaxrsquo is not provided Escher automatically adds them To be com-pletely clear about what you expect to see on the map it is best to provide lsquominrsquo andlsquomaxrsquo in addition to other scale points
Here are examples of each type
type rsquominrsquo color rsquoredrsquo size 12 Specifies that reactionsnear the minimum value are red and have thickness 12
type rsquoQ1rsquo color rsquorgba(100 100 50 05)rsquo size 12 Specifies that reactions near the first quartile have the given color opacity andthickness
type rsquomeanrsquo color rsquorgb(100 100 50)rsquo size 50 Specifies that reactions near the mean value have the given color and thickness
type rsquovaluersquo value 85 color rsquo333rsquo size 50 Specifies that reactions near 85 value have the given color and size
optionsreaction_no_data_color(Default rsquodcdcdcrsquo) The color of reactions with no data value
optionsreaction_no_data_size(Default 8) The size of reactions with no data value
optionsgene_data(Default null) An object with Gene ids for keys and gene data points for values
78 JavaScript API 41
Escher Documentation Release 143
optionsand_method_in_gene_reaction_rule(Default mean) When evaluating a gene reaction rule use this function to evaluate ANDrules Can be lsquomeanrsquo or lsquominrsquo
optionsmetabolite_data(Default null) An object with metabolite ids for keys and metabolite data points forvalues
optionsmetabolite_stylesDefault [rsquocolorrsquo rsquosizersquo rsquotextrsquo]
An array of style types The array can contain any of the following lsquocolorrsquo lsquosizersquo lsquotextrsquolsquoabsrsquo The lsquocolorrsquo style means that the metabolites will be colored according to the loadeddataset The lsquosizersquo style means that the metabolites will be sized according to the loadeddataset The lsquotextrsquo style means that the data values will be displayed in the metabolitelabels The lsquoabsrsquo style means the the absolute values of metabolite values will be used fordata visualization
optionsmetabolite_compare_style(Default rsquodiffrsquo) How to compare to datasets Can be either lsquofoldrsquo lsquolog2_foldrsquo orlsquodiffrsquo
optionsmetabolite_scaleDefault
[ type min color fffaf0 size 20 type median color f1c470 size 30 type max color 800000 size 40 ]
An array of objects that define points on the data scale See the description of op-tionsreaction_scale for an explanation of the format
optionsmetabolite_no_data_color(Default rsquoffffffrsquo) The color of metabolites with no data value
optionsmetabolite_no_data_size(Default 10) The size of metabolites with no data value
View and build options
optionsidentifiers_on_map(Default rsquobigg_idrsquo) The identifiers that will be displayed in reaction metabolite andgene labels Can be lsquobigg_idrsquo or lsquonamersquo
optionshighlight_missing(Default false) If true then highlight in red reactions that are not in the loaded COBRAmodel
optionsallow_building_duplicate_reactions(Default true) If true then building duplicate reactions is allowed If false then dupli-cate reactions are hidden in Add reaction mode
optionscofactors(Default [rsquoatprsquo rsquoadprsquo rsquonadrsquo rsquonadhrsquo rsquonadprsquo rsquonadphrsquorsquogtprsquo rsquogdprsquo rsquohrsquo rsquocoarsquo rsquoumprsquo rsquoh20rsquo rsquoppirsquo]) A list of metabo-lite IDs to treat as cofactors These will be secondary metabolites in new reactions
Callbacks
optionsfirst_load_callbackA function to run after loading the Builder
42 Chapter 7 Contents
Escher Documentation Release 143
load_map(map_data[ should_update_data])Load a map for the loaded data Also reloads most of the Builder content
Arguments
bull map_data ndash The data for a map
bull should_update_data (Boolean) ndash (Default true) Whether data should be ap-plied to the map
load_model(model_data[ should_update_data])Load the cobra model from model data
Arguments
bull model_data ndash The data for a Cobra model (Parsing in done by escherCobraModel)
bull should_update_data (Boolean) ndash (Default true) Whether data should be ap-plied to the model
view_mode()Enter view mode
build_mode()Enter build mode
brush_mode()Enter brush mode
zoom_mode()Enter zoom mode
rotate_mode()Enter rotate mode
text_mode()Enter text mode
set_reaction_data(data)
Arguments
bull data (array) ndash An array of 1 or 2 objects where each object has keys that are reactionIDrsquos and values that are data points (numbers)
set_metabolite_data(data)
Arguments
bull data (array) ndash An array of 1 or 2 objects where each object has keys that are metaboliteIDrsquos and values that are data points (numbers)
set_gene_data(data clear_gene_reaction_rules)
Arguments
bull data (array) ndash An array of 1 or 2 objects where each object has keys that are gene IDrsquosand values that are data points (numbers)
Arguments
bull clear_gene_reaction_rules (Boolean) ndash (Optional Default false) In addi-tion to setting the data also turn of the gene_reaction_rules
78 JavaScript API 43
Escher Documentation Release 143
79 Python API
class escherBuilder(map_name=None map_json=None model=None model_name=Nonemodel_json=None embedded_css=None reaction_data=None metabo-lite_data=None gene_data=None local_host=None id=None safe=Falsekwargs)
A metabolic map that can be viewed edited and used to visualize data
This map will also show metabolic fluxes passed in during consruction It can be viewed as a standalone htmlinside a browswer Alternately the respresentation inside an IPython notebook will also display the map
Maps are stored in json files and are stored in a cache directory Maps which are not found will be downloadedfrom a map repository if found
Parameters
bull map_name ndash A string specifying a map to be downloaded from the Escher web server orloaded from the cache
bull map_json ndash A JSON string or a file path to a JSON file or a URL specifying a JSON fileto be downloaded
bull model ndash A Cobra model
bull model_name ndash A string specifying a model to be downloaded from the Escher web serveror loaded from the cache
bull model_json ndash A JSON string or a file path to a JSON file or a URL specifying a JSONfile to be downloaded
bull embedded_css ndash The CSS (as a string) to be embedded with the Escher SVG
bull reaction_data ndash A dictionary with keys that correspond to reaction ids and values thatwill be mapped to reaction arrows and labels
bull metabolite_data ndash A dictionary with keys that correspond to metabolite ids and valuesthat will be mapped to metabolite nodes and labels
bull gene_data ndash A dictionary with keys that correspond to gene ids and values that will bemapped to corresponding reactions
bull local_host ndash A hostname that will be used for any local files This is generally usedfor using the notebook offline and for testing in the IPython Notebook with modified Eschercode An example value for local_host is lsquohttplocalhost7778lsquo
bull id ndash Specify an id to make the javascript data definitions unique A random id is chosen bydefault
bull safe ndash If True then loading files from the filesytem is not allowed This is to ensure thesafety of using Builder within a web server
Keyword Arguments
These are defined in the Javascript API
bulluse_3d_transform
bullenable_search
bullfill_screen
bullzoom_to_element
bullfull_screen_button
44 Chapter 7 Contents
Escher Documentation Release 143
bullstarting_reaction
bullunique_map_id
bullprimary_metabolite_radius
bullsecondary_metabolite_radius
bullmarker_radius
bullgene_font_size
bullhide_secondary_metabolites
bullshow_gene_reaction_rules
bullhide_all_labels
bullreaction_styles
bullreaction_compare_style
bullreaction_scale
bullreaction_no_data_color
bullreaction_no_data_size
bulland_method_in_gene_reaction_rule
bullmetabolite_styles
bullmetabolite_compare_style
bullmetabolite_scale
bullmetabolite_no_data_color
bullmetabolite_no_data_size
bullidentifiers_on_map
bullhighlight_missing
bullallow_building_duplicate_reactions
bullcofactors
All keyword arguments can also be set on an existing Builder object using setter functions eg
my_builderset_reaction_styles(new_styles)
display_in_browser(ip=lsquo127001rsquo port=7655 n_retries=50 js_source=rsquowebrsquo menu=rsquoallrsquoscroll_behavior=rsquopanrsquo enable_editing=True enable_keys=True mini-fied_js=True never_ask_before_quit=False)
Launch a web browser to view the map
Parameters
bull ip ndash The IP address to serve the map on
bull port ndash The port to serve the map on If specified the port is occupied then a random freeport will be used
bull n_retries (int) ndash The number of times the server will try to find a port before quitting
bull js_source (string) ndash Can be one of the following
ndash web (Default) - Use JavaScript files from eschergithubio
79 Python API 45
Escher Documentation Release 143
ndash local - Use compiled JavaScript files in the local Escher installation Works offline
ndash dev - No longer necessary with source maps This now gives the same behavior aslsquolocalrsquo
bull menu (string) ndash Menu bar options include
ndash none - No menu or buttons
ndash zoom - Just zoom buttons
ndash all (Default) - Menu and button bar (requires Bootstrap)
bull scroll_behavior (string) ndash Scroll behavior options
ndash pan - Pan the map
ndash zoom - Zoom the map
ndash none (Default) - No scroll events
bull enable_editing (Boolean) ndash Enable the map editing modes
bull enable_keys (Boolean) ndash Enable keyboard shortcuts
bull minified_js (Boolean) ndash If True use the minified version of JavaScript and CSSfiles
bull never_ask_before_quit (Boolean) ndash Never display an alert asking if you wantto leave the page By default this message is displayed if enable_editing is True
display_in_notebook(js_source=rsquowebrsquo menu=rsquozoomrsquo scroll_behavior=rsquononersquo mini-fied_js=True height=500 enable_editing=False)
Embed the Map within the current IPython Notebook
Parameters
bull js_source (string) ndash Can be one of the following
ndash web (Default) - Use JavaScript files from eschergithubio
ndash local - Use compiled JavaScript files in the local Escher installation Works offline
ndash dev - No longer necessary with source maps This now gives the same behav-ior as lsquolocalrsquo
bull menu (string) ndash Menu bar options include
ndash none - No menu or buttons
ndash zoom - Just zoom buttons
ndash Note The all menu option does not work in an IPython notebook
bull scroll_behavior (string) ndash Scroll behavior options
ndash pan - Pan the map
ndash zoom - Zoom the map
ndash none - (Default) No scroll events
bull minified_js (Boolean) ndash If True use the minified version of JavaScript andCSS files
bull height ndash Height of the HTML container
bull enable_editing (Boolean) ndash Enable the map editing modes
46 Chapter 7 Contents
Escher Documentation Release 143
save_html(filepath=None overwrite=False js_source=rsquowebrsquo protocol=rsquohttpsrsquo menu=rsquoallrsquoscroll_behavior=rsquopanrsquo enable_editing=True enable_keys=True minified_js=Truenever_ask_before_quit=False static_site_index_json=None)
Save an HTML file containing the map
Parameters
bull filepath (string) ndash The HTML file will be saved to this location Whenjs_source is lsquolocalrsquo then a new directory will be created with this name
bull overwrite (Boolean) ndash Overwrite existing files
bull js_source (string) ndash Can be one of the following
ndash web (Default) - Use JavaScript files from eschergithubio
ndash local - Use compiled JavaScript files in the local Escher installation Works of-fline To make the dependencies available to the downloaded file a new directorywill be made with the name specified by filepath
ndash dev - No longer necessary with source maps This now gives the same behav-ior as lsquolocalrsquo
bull protocol (string) ndash The protocol can be lsquohttprsquo lsquohttpsrsquo or None which indicatesa lsquoprotocol relative URLrsquo as in eschergithubio Ignored if source is local
bull menu (string) ndash Menu bar options include
ndash none - No menu or buttons
ndash zoom - Just zoom buttons
ndash all (Default) - Menu and button bar (requires Bootstrap)
bull scroll_behavior (string) ndash Scroll behavior options
ndash pan - Pan the map
ndash zoom - Zoom the map
ndash none (Default) - No scroll events
bull enable_editing (Boolean) ndash Enable the map editing modes
bull enable_keys (Boolean) ndash Enable keyboard shortcuts
bull minified_js (Boolean) ndash If True use the minified version of JavaScript andCSS files
bull height (number) ndash Height of the HTML container
bull never_ask_before_quit (Boolean) ndash Never display an alert asking if youwant to leave the page By default this message is displayed if enable_editing isTrue
bull static_site_index_json (string) ndash The index as a JSON string for thestatic site Use javascript to parse the URL options Used for generating static pages(see static_sitepy)
791 Cache
escherget_cache_dir(versioned=True name=None)Get the cache dir as a string and make the directory if it does not already exist
Parameters
79 Python API 47
Escher Documentation Release 143
bull versioned (Boolean) ndash Whether to return the versioned path in the cache Eschermaps for the latest version of Escher are found in the versioned directory (versioned= True) but maps for previous versions of Escher can be found by visiting the parentdirectory (versioned = False)
bull name (string) ndash An optional subdirectory within the cache If versioned is False thenname is ignored
escherclear_cache(different_cache_dir=None ask=True)Empty the contents of the cache directory including all versions of all maps and models
Parameters
bull different_cache_dir (string) ndash (Optional) The directory of another cacheThis is mainly for testing
bull ask (Boolean) ndash Whether to ask before deleting
escherlist_cached_maps()Return a list of all cached maps
escherlist_cached_models()Return a list of all cached models
escherlist_available_maps()Return a list of all maps available on the server
escherlist_available_models()Return a list of all models available on the server
710 License
Escher and EscherConverter are distributed under the MIT license
bull genindex
48 Chapter 7 Contents
Python Module Index
eescher 44
49
Escher Documentation Release 143
50 Python Module Index
Index
Bbrush_mode() (built-in function) 43build_mode() (built-in function) 43Builder (class in escher) 44
Cclear_cache() (in module escher) 48
Ddisplay_in_browser() (escherBuilder method) 45display_in_notebook() (escherBuilder method) 46
Eescher (module) 44escherBuilder() (class) 39
Gget_cache_dir() (in module escher) 47
Llist_available_maps() (in module escher) 48list_available_models() (in module escher) 48list_cached_maps() (in module escher) 48list_cached_models() (in module escher) 48load_map() (built-in function) 42load_model() (built-in function) 43
Ooptionenable_keys (option attribute) 40optionsallow_building_duplicate_reactions (options at-
tribute) 42optionsand_method_in_gene_reaction_rule (options at-
tribute) 41optionscofactors (options attribute) 42optionsenable_editing (options attribute) 39optionsenable_search (options attribute) 40optionsfill_screen (options attribute) 40optionsfirst_load_callback (options attribute) 42optionsfull_screen_button (options attribute) 40optionsgene_data (options attribute) 41
optionsgene_font_size (options attribute) 40optionshide_all_labels (options attribute) 40optionshide_secondary_metabolites (options attribute)
40optionshighlight_missing (options attribute) 42optionsidentifiers_on_map (options attribute) 42optionsignore_bootstrap (options attribute) 40optionsmarker_radius (options attribute) 40optionsmenu (options attribute) 39optionsmetabolite_compare_style (options attribute) 42optionsmetabolite_data (options attribute) 42optionsmetabolite_no_data_color (options attribute) 42optionsmetabolite_no_data_size (options attribute) 42optionsmetabolite_scale (options attribute) 42optionsmetabolite_styles (options attribute) 42optionsnever_ask_before_quit (options attribute) 40optionsprimary_metabolite_radius (options attribute) 40optionsreaction_compare_style (options attribute) 41optionsreaction_data (options attribute) 40optionsreaction_no_data_color (options attribute) 41optionsreaction_no_data_size (options attribute) 41optionsreaction_scale (options attribute) 41optionsreaction_styles (options attribute) 41optionsscroll_behavior (options attribute) 39optionssecondary_metabolite_radius (options attribute)
40optionsshow_gene_reaction_rules (options attribute) 40optionsstarting_reaction (options attribute) 40optionsunique_map_id (options attribute) 40optionsuse_3d_transform (options attribute) 39
Rrotate_mode() (built-in function) 43
Ssave_html() (escherBuilder method) 46set_gene_data() (built-in function) 43set_metabolite_data() (built-in function) 43set_reaction_data() (built-in function) 43
51
Escher Documentation Release 143
Ttext_mode() (built-in function) 43
Vview_mode() (built-in function) 43
Zzoom_mode() (built-in function) 43
52 Index
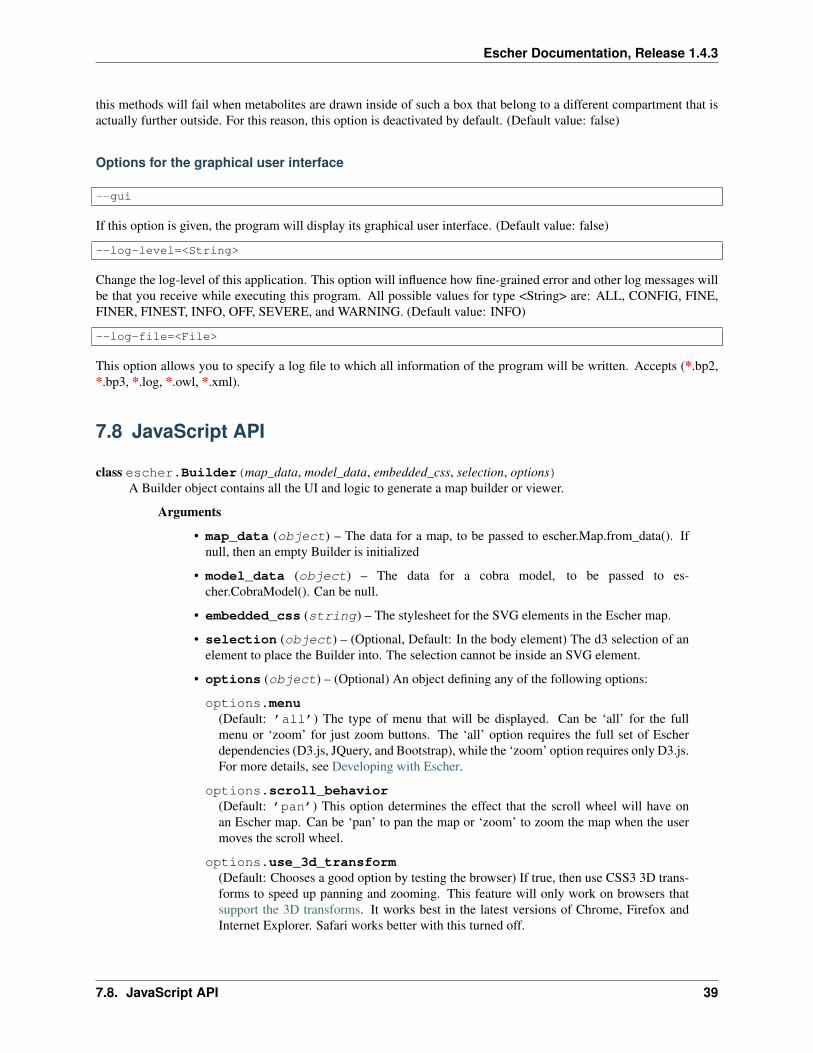
Escher Documentation Release 143
optionsenable_editing(Default true) If true then display the map editing functions If false then hide themand only allow the user to view the map
optionenable_keys(Default true) If true then enable keyboard shortcuts
optionsenable_search(Default true) If true then enable indexing of the map for search Use false to disablesearching and potentially improve the map performance
optionsfill_screen(Default false) Use true to fill the screen when an Escher Builder is placed in a top-level container (eg a div in the body element)
optionsfull_screen_button(Default false) Include a button in the user interface for entering full screen mode
optionsignore_bootstrap(Default false) Do not use Bootstrap for buttons even if it available This is used toembed Escher in a Jupyter notebook where it conflicts with the Jupyter Boostrap installa-tion
Map model and styles
optionsstarting_reaction(Default null) The ID (as a string) of a reaction to draw when the Builder loads
optionsnever_ask_before_quit(Default false) If false then display a warning before the user closes an Eschermap If true then never display the warning This options is only respected if op-tionsenable_editing == true If enable_editing is false then the warnings are not dis-played
optionsunique_map_id(Default null) A unique ID that will be used to UI elements donrsquot interfere whenmultiple maps are in the same HTML document
optionsprimary_metabolite_radius(Default 15) The radius of primary metabolites in px
optionssecondary_metabolite_radius(Default 10) The radius of secondary metabolites in px
optionsmarker_radius(Default 5) The radius of marker nodes in px
optionsgene_font_size(Default 18) The font size of the gene reaction rules in px
optionshide_secondary_metabolites(Default false) If true then secondary nodes and segments are hidden This is conve-nient for generating simplified map figures
optionsshow_gene_reaction_rules(Default false) If true then show the gene reaction rules even without gene data
optionshide_all_labels(Default false) If checked hide all reaction gene and metabolite labels
Applied data
40 Chapter 7 Contents
Escher Documentation Release 143
optionsreaction_data(Default null) An object with reaction ids for keys and reaction data points for values
optionsreaction_stylesDefault [rsquocolorrsquo rsquosizersquo rsquotextrsquo]
An array of style types The array can contain any of the following lsquocolorrsquo lsquosizersquo lsquotextrsquolsquoabsrsquo The lsquocolorrsquo style means that the reactions will be colored according to the loadeddataset The lsquosizersquo style means that the reactions will be sized according to the loadeddataset The lsquotextrsquo style means that the data values will be displayed in the reactionlabels The lsquoabsrsquo style means the the absolute values of reaction values will be used fordata visualization
optionsreaction_compare_style(Default rsquodiffrsquo) How to compare to datasets Can be either lsquofold lsquolog2_foldrsquo orlsquodiffrsquo
optionsreaction_scaleDefault
[ type min color c8c8c8 size 12 type median color 9696ff size 20 type max color ff0000 size 25 ]
An array of objects that define points on the data scale
Each point is an object with a type attribute Types can be lsquominrsquo lsquomaxrsquo lsquomeanrsquo lsquoQ1rsquo (firstquartile) lsquomedianrsquo lsquoQ3rsquo (third quartile) or lsquovaluersquo Each point can have a color attributethat specifies a color with a string (any CSS color specification is allowed including hexrgb and rgba) Each point can have a size attirbute that specifies a reaction thickness as anumber Finally points with type lsquovaluersquo can have a value attribute that specifies an exactnumber for pont in the scale
NOTE If lsquominrsquo or lsquomaxrsquo is not provided Escher automatically adds them To be com-pletely clear about what you expect to see on the map it is best to provide lsquominrsquo andlsquomaxrsquo in addition to other scale points
Here are examples of each type
type rsquominrsquo color rsquoredrsquo size 12 Specifies that reactionsnear the minimum value are red and have thickness 12
type rsquoQ1rsquo color rsquorgba(100 100 50 05)rsquo size 12 Specifies that reactions near the first quartile have the given color opacity andthickness
type rsquomeanrsquo color rsquorgb(100 100 50)rsquo size 50 Specifies that reactions near the mean value have the given color and thickness
type rsquovaluersquo value 85 color rsquo333rsquo size 50 Specifies that reactions near 85 value have the given color and size
optionsreaction_no_data_color(Default rsquodcdcdcrsquo) The color of reactions with no data value
optionsreaction_no_data_size(Default 8) The size of reactions with no data value
optionsgene_data(Default null) An object with Gene ids for keys and gene data points for values
78 JavaScript API 41
Escher Documentation Release 143
optionsand_method_in_gene_reaction_rule(Default mean) When evaluating a gene reaction rule use this function to evaluate ANDrules Can be lsquomeanrsquo or lsquominrsquo
optionsmetabolite_data(Default null) An object with metabolite ids for keys and metabolite data points forvalues
optionsmetabolite_stylesDefault [rsquocolorrsquo rsquosizersquo rsquotextrsquo]
An array of style types The array can contain any of the following lsquocolorrsquo lsquosizersquo lsquotextrsquolsquoabsrsquo The lsquocolorrsquo style means that the metabolites will be colored according to the loadeddataset The lsquosizersquo style means that the metabolites will be sized according to the loadeddataset The lsquotextrsquo style means that the data values will be displayed in the metabolitelabels The lsquoabsrsquo style means the the absolute values of metabolite values will be used fordata visualization
optionsmetabolite_compare_style(Default rsquodiffrsquo) How to compare to datasets Can be either lsquofoldrsquo lsquolog2_foldrsquo orlsquodiffrsquo
optionsmetabolite_scaleDefault
[ type min color fffaf0 size 20 type median color f1c470 size 30 type max color 800000 size 40 ]
An array of objects that define points on the data scale See the description of op-tionsreaction_scale for an explanation of the format
optionsmetabolite_no_data_color(Default rsquoffffffrsquo) The color of metabolites with no data value
optionsmetabolite_no_data_size(Default 10) The size of metabolites with no data value
View and build options
optionsidentifiers_on_map(Default rsquobigg_idrsquo) The identifiers that will be displayed in reaction metabolite andgene labels Can be lsquobigg_idrsquo or lsquonamersquo
optionshighlight_missing(Default false) If true then highlight in red reactions that are not in the loaded COBRAmodel
optionsallow_building_duplicate_reactions(Default true) If true then building duplicate reactions is allowed If false then dupli-cate reactions are hidden in Add reaction mode
optionscofactors(Default [rsquoatprsquo rsquoadprsquo rsquonadrsquo rsquonadhrsquo rsquonadprsquo rsquonadphrsquorsquogtprsquo rsquogdprsquo rsquohrsquo rsquocoarsquo rsquoumprsquo rsquoh20rsquo rsquoppirsquo]) A list of metabo-lite IDs to treat as cofactors These will be secondary metabolites in new reactions
Callbacks
optionsfirst_load_callbackA function to run after loading the Builder
42 Chapter 7 Contents
Escher Documentation Release 143
load_map(map_data[ should_update_data])Load a map for the loaded data Also reloads most of the Builder content
Arguments
bull map_data ndash The data for a map
bull should_update_data (Boolean) ndash (Default true) Whether data should be ap-plied to the map
load_model(model_data[ should_update_data])Load the cobra model from model data
Arguments
bull model_data ndash The data for a Cobra model (Parsing in done by escherCobraModel)
bull should_update_data (Boolean) ndash (Default true) Whether data should be ap-plied to the model
view_mode()Enter view mode
build_mode()Enter build mode
brush_mode()Enter brush mode
zoom_mode()Enter zoom mode
rotate_mode()Enter rotate mode
text_mode()Enter text mode
set_reaction_data(data)
Arguments
bull data (array) ndash An array of 1 or 2 objects where each object has keys that are reactionIDrsquos and values that are data points (numbers)
set_metabolite_data(data)
Arguments
bull data (array) ndash An array of 1 or 2 objects where each object has keys that are metaboliteIDrsquos and values that are data points (numbers)
set_gene_data(data clear_gene_reaction_rules)
Arguments
bull data (array) ndash An array of 1 or 2 objects where each object has keys that are gene IDrsquosand values that are data points (numbers)
Arguments
bull clear_gene_reaction_rules (Boolean) ndash (Optional Default false) In addi-tion to setting the data also turn of the gene_reaction_rules
78 JavaScript API 43
Escher Documentation Release 143
79 Python API
class escherBuilder(map_name=None map_json=None model=None model_name=Nonemodel_json=None embedded_css=None reaction_data=None metabo-lite_data=None gene_data=None local_host=None id=None safe=Falsekwargs)
A metabolic map that can be viewed edited and used to visualize data
This map will also show metabolic fluxes passed in during consruction It can be viewed as a standalone htmlinside a browswer Alternately the respresentation inside an IPython notebook will also display the map
Maps are stored in json files and are stored in a cache directory Maps which are not found will be downloadedfrom a map repository if found
Parameters
bull map_name ndash A string specifying a map to be downloaded from the Escher web server orloaded from the cache
bull map_json ndash A JSON string or a file path to a JSON file or a URL specifying a JSON fileto be downloaded
bull model ndash A Cobra model
bull model_name ndash A string specifying a model to be downloaded from the Escher web serveror loaded from the cache
bull model_json ndash A JSON string or a file path to a JSON file or a URL specifying a JSONfile to be downloaded
bull embedded_css ndash The CSS (as a string) to be embedded with the Escher SVG
bull reaction_data ndash A dictionary with keys that correspond to reaction ids and values thatwill be mapped to reaction arrows and labels
bull metabolite_data ndash A dictionary with keys that correspond to metabolite ids and valuesthat will be mapped to metabolite nodes and labels
bull gene_data ndash A dictionary with keys that correspond to gene ids and values that will bemapped to corresponding reactions
bull local_host ndash A hostname that will be used for any local files This is generally usedfor using the notebook offline and for testing in the IPython Notebook with modified Eschercode An example value for local_host is lsquohttplocalhost7778lsquo
bull id ndash Specify an id to make the javascript data definitions unique A random id is chosen bydefault
bull safe ndash If True then loading files from the filesytem is not allowed This is to ensure thesafety of using Builder within a web server
Keyword Arguments
These are defined in the Javascript API
bulluse_3d_transform
bullenable_search
bullfill_screen
bullzoom_to_element
bullfull_screen_button
44 Chapter 7 Contents
Escher Documentation Release 143
bullstarting_reaction
bullunique_map_id
bullprimary_metabolite_radius
bullsecondary_metabolite_radius
bullmarker_radius
bullgene_font_size
bullhide_secondary_metabolites
bullshow_gene_reaction_rules
bullhide_all_labels
bullreaction_styles
bullreaction_compare_style
bullreaction_scale
bullreaction_no_data_color
bullreaction_no_data_size
bulland_method_in_gene_reaction_rule
bullmetabolite_styles
bullmetabolite_compare_style
bullmetabolite_scale
bullmetabolite_no_data_color
bullmetabolite_no_data_size
bullidentifiers_on_map
bullhighlight_missing
bullallow_building_duplicate_reactions
bullcofactors
All keyword arguments can also be set on an existing Builder object using setter functions eg
my_builderset_reaction_styles(new_styles)
display_in_browser(ip=lsquo127001rsquo port=7655 n_retries=50 js_source=rsquowebrsquo menu=rsquoallrsquoscroll_behavior=rsquopanrsquo enable_editing=True enable_keys=True mini-fied_js=True never_ask_before_quit=False)
Launch a web browser to view the map
Parameters
bull ip ndash The IP address to serve the map on
bull port ndash The port to serve the map on If specified the port is occupied then a random freeport will be used
bull n_retries (int) ndash The number of times the server will try to find a port before quitting
bull js_source (string) ndash Can be one of the following
ndash web (Default) - Use JavaScript files from eschergithubio
79 Python API 45
Escher Documentation Release 143
ndash local - Use compiled JavaScript files in the local Escher installation Works offline
ndash dev - No longer necessary with source maps This now gives the same behavior aslsquolocalrsquo
bull menu (string) ndash Menu bar options include
ndash none - No menu or buttons
ndash zoom - Just zoom buttons
ndash all (Default) - Menu and button bar (requires Bootstrap)
bull scroll_behavior (string) ndash Scroll behavior options
ndash pan - Pan the map
ndash zoom - Zoom the map
ndash none (Default) - No scroll events
bull enable_editing (Boolean) ndash Enable the map editing modes
bull enable_keys (Boolean) ndash Enable keyboard shortcuts
bull minified_js (Boolean) ndash If True use the minified version of JavaScript and CSSfiles
bull never_ask_before_quit (Boolean) ndash Never display an alert asking if you wantto leave the page By default this message is displayed if enable_editing is True
display_in_notebook(js_source=rsquowebrsquo menu=rsquozoomrsquo scroll_behavior=rsquononersquo mini-fied_js=True height=500 enable_editing=False)
Embed the Map within the current IPython Notebook
Parameters
bull js_source (string) ndash Can be one of the following
ndash web (Default) - Use JavaScript files from eschergithubio
ndash local - Use compiled JavaScript files in the local Escher installation Works offline
ndash dev - No longer necessary with source maps This now gives the same behav-ior as lsquolocalrsquo
bull menu (string) ndash Menu bar options include
ndash none - No menu or buttons
ndash zoom - Just zoom buttons
ndash Note The all menu option does not work in an IPython notebook
bull scroll_behavior (string) ndash Scroll behavior options
ndash pan - Pan the map
ndash zoom - Zoom the map
ndash none - (Default) No scroll events
bull minified_js (Boolean) ndash If True use the minified version of JavaScript andCSS files
bull height ndash Height of the HTML container
bull enable_editing (Boolean) ndash Enable the map editing modes
46 Chapter 7 Contents
Escher Documentation Release 143
save_html(filepath=None overwrite=False js_source=rsquowebrsquo protocol=rsquohttpsrsquo menu=rsquoallrsquoscroll_behavior=rsquopanrsquo enable_editing=True enable_keys=True minified_js=Truenever_ask_before_quit=False static_site_index_json=None)
Save an HTML file containing the map
Parameters
bull filepath (string) ndash The HTML file will be saved to this location Whenjs_source is lsquolocalrsquo then a new directory will be created with this name
bull overwrite (Boolean) ndash Overwrite existing files
bull js_source (string) ndash Can be one of the following
ndash web (Default) - Use JavaScript files from eschergithubio
ndash local - Use compiled JavaScript files in the local Escher installation Works of-fline To make the dependencies available to the downloaded file a new directorywill be made with the name specified by filepath
ndash dev - No longer necessary with source maps This now gives the same behav-ior as lsquolocalrsquo
bull protocol (string) ndash The protocol can be lsquohttprsquo lsquohttpsrsquo or None which indicatesa lsquoprotocol relative URLrsquo as in eschergithubio Ignored if source is local
bull menu (string) ndash Menu bar options include
ndash none - No menu or buttons
ndash zoom - Just zoom buttons
ndash all (Default) - Menu and button bar (requires Bootstrap)
bull scroll_behavior (string) ndash Scroll behavior options
ndash pan - Pan the map
ndash zoom - Zoom the map
ndash none (Default) - No scroll events
bull enable_editing (Boolean) ndash Enable the map editing modes
bull enable_keys (Boolean) ndash Enable keyboard shortcuts
bull minified_js (Boolean) ndash If True use the minified version of JavaScript andCSS files
bull height (number) ndash Height of the HTML container
bull never_ask_before_quit (Boolean) ndash Never display an alert asking if youwant to leave the page By default this message is displayed if enable_editing isTrue
bull static_site_index_json (string) ndash The index as a JSON string for thestatic site Use javascript to parse the URL options Used for generating static pages(see static_sitepy)
791 Cache
escherget_cache_dir(versioned=True name=None)Get the cache dir as a string and make the directory if it does not already exist
Parameters
79 Python API 47
Escher Documentation Release 143
bull versioned (Boolean) ndash Whether to return the versioned path in the cache Eschermaps for the latest version of Escher are found in the versioned directory (versioned= True) but maps for previous versions of Escher can be found by visiting the parentdirectory (versioned = False)
bull name (string) ndash An optional subdirectory within the cache If versioned is False thenname is ignored
escherclear_cache(different_cache_dir=None ask=True)Empty the contents of the cache directory including all versions of all maps and models
Parameters
bull different_cache_dir (string) ndash (Optional) The directory of another cacheThis is mainly for testing
bull ask (Boolean) ndash Whether to ask before deleting
escherlist_cached_maps()Return a list of all cached maps
escherlist_cached_models()Return a list of all cached models
escherlist_available_maps()Return a list of all maps available on the server
escherlist_available_models()Return a list of all models available on the server
710 License
Escher and EscherConverter are distributed under the MIT license
bull genindex
48 Chapter 7 Contents
Python Module Index
eescher 44
49
Escher Documentation Release 143
50 Python Module Index
Index
Bbrush_mode() (built-in function) 43build_mode() (built-in function) 43Builder (class in escher) 44
Cclear_cache() (in module escher) 48
Ddisplay_in_browser() (escherBuilder method) 45display_in_notebook() (escherBuilder method) 46
Eescher (module) 44escherBuilder() (class) 39
Gget_cache_dir() (in module escher) 47
Llist_available_maps() (in module escher) 48list_available_models() (in module escher) 48list_cached_maps() (in module escher) 48list_cached_models() (in module escher) 48load_map() (built-in function) 42load_model() (built-in function) 43
Ooptionenable_keys (option attribute) 40optionsallow_building_duplicate_reactions (options at-
tribute) 42optionsand_method_in_gene_reaction_rule (options at-
tribute) 41optionscofactors (options attribute) 42optionsenable_editing (options attribute) 39optionsenable_search (options attribute) 40optionsfill_screen (options attribute) 40optionsfirst_load_callback (options attribute) 42optionsfull_screen_button (options attribute) 40optionsgene_data (options attribute) 41
optionsgene_font_size (options attribute) 40optionshide_all_labels (options attribute) 40optionshide_secondary_metabolites (options attribute)
40optionshighlight_missing (options attribute) 42optionsidentifiers_on_map (options attribute) 42optionsignore_bootstrap (options attribute) 40optionsmarker_radius (options attribute) 40optionsmenu (options attribute) 39optionsmetabolite_compare_style (options attribute) 42optionsmetabolite_data (options attribute) 42optionsmetabolite_no_data_color (options attribute) 42optionsmetabolite_no_data_size (options attribute) 42optionsmetabolite_scale (options attribute) 42optionsmetabolite_styles (options attribute) 42optionsnever_ask_before_quit (options attribute) 40optionsprimary_metabolite_radius (options attribute) 40optionsreaction_compare_style (options attribute) 41optionsreaction_data (options attribute) 40optionsreaction_no_data_color (options attribute) 41optionsreaction_no_data_size (options attribute) 41optionsreaction_scale (options attribute) 41optionsreaction_styles (options attribute) 41optionsscroll_behavior (options attribute) 39optionssecondary_metabolite_radius (options attribute)
40optionsshow_gene_reaction_rules (options attribute) 40optionsstarting_reaction (options attribute) 40optionsunique_map_id (options attribute) 40optionsuse_3d_transform (options attribute) 39
Rrotate_mode() (built-in function) 43
Ssave_html() (escherBuilder method) 46set_gene_data() (built-in function) 43set_metabolite_data() (built-in function) 43set_reaction_data() (built-in function) 43
51
Escher Documentation Release 143
Ttext_mode() (built-in function) 43
Vview_mode() (built-in function) 43
Zzoom_mode() (built-in function) 43
52 Index
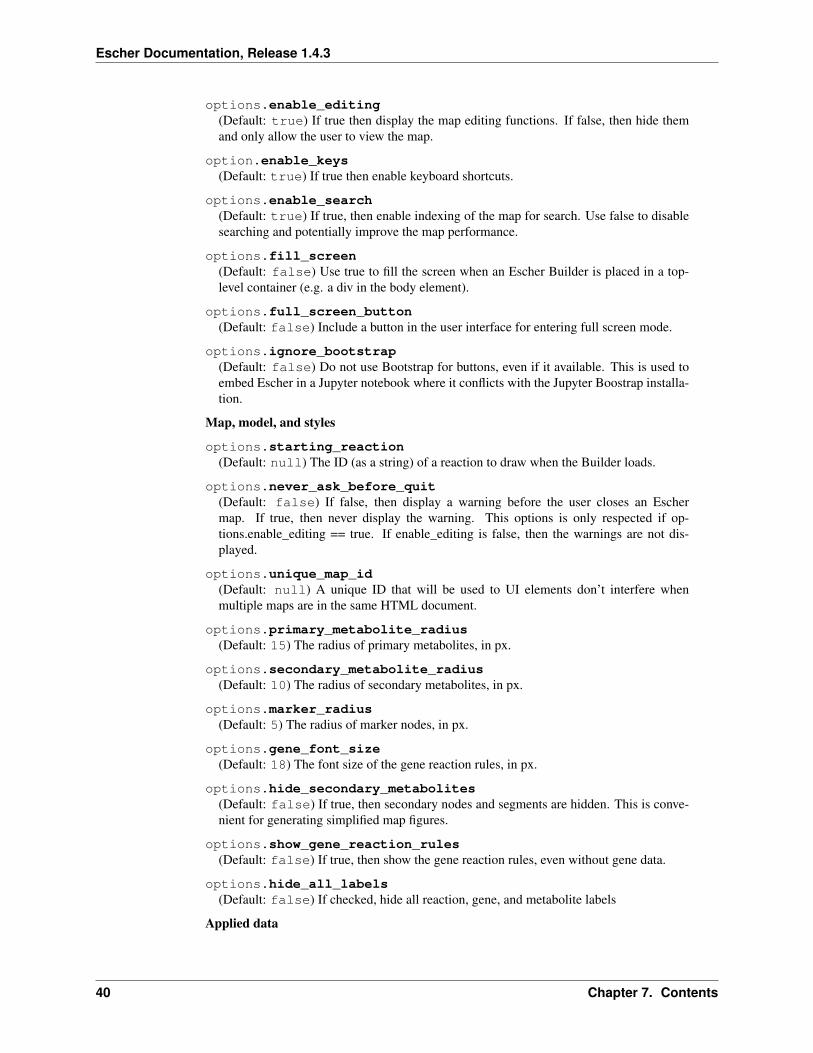
Escher Documentation Release 143
optionsreaction_data(Default null) An object with reaction ids for keys and reaction data points for values
optionsreaction_stylesDefault [rsquocolorrsquo rsquosizersquo rsquotextrsquo]
An array of style types The array can contain any of the following lsquocolorrsquo lsquosizersquo lsquotextrsquolsquoabsrsquo The lsquocolorrsquo style means that the reactions will be colored according to the loadeddataset The lsquosizersquo style means that the reactions will be sized according to the loadeddataset The lsquotextrsquo style means that the data values will be displayed in the reactionlabels The lsquoabsrsquo style means the the absolute values of reaction values will be used fordata visualization
optionsreaction_compare_style(Default rsquodiffrsquo) How to compare to datasets Can be either lsquofold lsquolog2_foldrsquo orlsquodiffrsquo
optionsreaction_scaleDefault
[ type min color c8c8c8 size 12 type median color 9696ff size 20 type max color ff0000 size 25 ]
An array of objects that define points on the data scale
Each point is an object with a type attribute Types can be lsquominrsquo lsquomaxrsquo lsquomeanrsquo lsquoQ1rsquo (firstquartile) lsquomedianrsquo lsquoQ3rsquo (third quartile) or lsquovaluersquo Each point can have a color attributethat specifies a color with a string (any CSS color specification is allowed including hexrgb and rgba) Each point can have a size attirbute that specifies a reaction thickness as anumber Finally points with type lsquovaluersquo can have a value attribute that specifies an exactnumber for pont in the scale
NOTE If lsquominrsquo or lsquomaxrsquo is not provided Escher automatically adds them To be com-pletely clear about what you expect to see on the map it is best to provide lsquominrsquo andlsquomaxrsquo in addition to other scale points
Here are examples of each type
type rsquominrsquo color rsquoredrsquo size 12 Specifies that reactionsnear the minimum value are red and have thickness 12
type rsquoQ1rsquo color rsquorgba(100 100 50 05)rsquo size 12 Specifies that reactions near the first quartile have the given color opacity andthickness
type rsquomeanrsquo color rsquorgb(100 100 50)rsquo size 50 Specifies that reactions near the mean value have the given color and thickness
type rsquovaluersquo value 85 color rsquo333rsquo size 50 Specifies that reactions near 85 value have the given color and size
optionsreaction_no_data_color(Default rsquodcdcdcrsquo) The color of reactions with no data value
optionsreaction_no_data_size(Default 8) The size of reactions with no data value
optionsgene_data(Default null) An object with Gene ids for keys and gene data points for values
78 JavaScript API 41
Escher Documentation Release 143
optionsand_method_in_gene_reaction_rule(Default mean) When evaluating a gene reaction rule use this function to evaluate ANDrules Can be lsquomeanrsquo or lsquominrsquo
optionsmetabolite_data(Default null) An object with metabolite ids for keys and metabolite data points forvalues
optionsmetabolite_stylesDefault [rsquocolorrsquo rsquosizersquo rsquotextrsquo]
An array of style types The array can contain any of the following lsquocolorrsquo lsquosizersquo lsquotextrsquolsquoabsrsquo The lsquocolorrsquo style means that the metabolites will be colored according to the loadeddataset The lsquosizersquo style means that the metabolites will be sized according to the loadeddataset The lsquotextrsquo style means that the data values will be displayed in the metabolitelabels The lsquoabsrsquo style means the the absolute values of metabolite values will be used fordata visualization
optionsmetabolite_compare_style(Default rsquodiffrsquo) How to compare to datasets Can be either lsquofoldrsquo lsquolog2_foldrsquo orlsquodiffrsquo
optionsmetabolite_scaleDefault
[ type min color fffaf0 size 20 type median color f1c470 size 30 type max color 800000 size 40 ]
An array of objects that define points on the data scale See the description of op-tionsreaction_scale for an explanation of the format
optionsmetabolite_no_data_color(Default rsquoffffffrsquo) The color of metabolites with no data value
optionsmetabolite_no_data_size(Default 10) The size of metabolites with no data value
View and build options
optionsidentifiers_on_map(Default rsquobigg_idrsquo) The identifiers that will be displayed in reaction metabolite andgene labels Can be lsquobigg_idrsquo or lsquonamersquo
optionshighlight_missing(Default false) If true then highlight in red reactions that are not in the loaded COBRAmodel
optionsallow_building_duplicate_reactions(Default true) If true then building duplicate reactions is allowed If false then dupli-cate reactions are hidden in Add reaction mode
optionscofactors(Default [rsquoatprsquo rsquoadprsquo rsquonadrsquo rsquonadhrsquo rsquonadprsquo rsquonadphrsquorsquogtprsquo rsquogdprsquo rsquohrsquo rsquocoarsquo rsquoumprsquo rsquoh20rsquo rsquoppirsquo]) A list of metabo-lite IDs to treat as cofactors These will be secondary metabolites in new reactions
Callbacks
optionsfirst_load_callbackA function to run after loading the Builder
42 Chapter 7 Contents
Escher Documentation Release 143
load_map(map_data[ should_update_data])Load a map for the loaded data Also reloads most of the Builder content
Arguments
bull map_data ndash The data for a map
bull should_update_data (Boolean) ndash (Default true) Whether data should be ap-plied to the map
load_model(model_data[ should_update_data])Load the cobra model from model data
Arguments
bull model_data ndash The data for a Cobra model (Parsing in done by escherCobraModel)
bull should_update_data (Boolean) ndash (Default true) Whether data should be ap-plied to the model
view_mode()Enter view mode
build_mode()Enter build mode
brush_mode()Enter brush mode
zoom_mode()Enter zoom mode
rotate_mode()Enter rotate mode
text_mode()Enter text mode
set_reaction_data(data)
Arguments
bull data (array) ndash An array of 1 or 2 objects where each object has keys that are reactionIDrsquos and values that are data points (numbers)
set_metabolite_data(data)
Arguments
bull data (array) ndash An array of 1 or 2 objects where each object has keys that are metaboliteIDrsquos and values that are data points (numbers)
set_gene_data(data clear_gene_reaction_rules)
Arguments
bull data (array) ndash An array of 1 or 2 objects where each object has keys that are gene IDrsquosand values that are data points (numbers)
Arguments
bull clear_gene_reaction_rules (Boolean) ndash (Optional Default false) In addi-tion to setting the data also turn of the gene_reaction_rules
78 JavaScript API 43
Escher Documentation Release 143
79 Python API
class escherBuilder(map_name=None map_json=None model=None model_name=Nonemodel_json=None embedded_css=None reaction_data=None metabo-lite_data=None gene_data=None local_host=None id=None safe=Falsekwargs)
A metabolic map that can be viewed edited and used to visualize data
This map will also show metabolic fluxes passed in during consruction It can be viewed as a standalone htmlinside a browswer Alternately the respresentation inside an IPython notebook will also display the map
Maps are stored in json files and are stored in a cache directory Maps which are not found will be downloadedfrom a map repository if found
Parameters
bull map_name ndash A string specifying a map to be downloaded from the Escher web server orloaded from the cache
bull map_json ndash A JSON string or a file path to a JSON file or a URL specifying a JSON fileto be downloaded
bull model ndash A Cobra model
bull model_name ndash A string specifying a model to be downloaded from the Escher web serveror loaded from the cache
bull model_json ndash A JSON string or a file path to a JSON file or a URL specifying a JSONfile to be downloaded
bull embedded_css ndash The CSS (as a string) to be embedded with the Escher SVG
bull reaction_data ndash A dictionary with keys that correspond to reaction ids and values thatwill be mapped to reaction arrows and labels
bull metabolite_data ndash A dictionary with keys that correspond to metabolite ids and valuesthat will be mapped to metabolite nodes and labels
bull gene_data ndash A dictionary with keys that correspond to gene ids and values that will bemapped to corresponding reactions
bull local_host ndash A hostname that will be used for any local files This is generally usedfor using the notebook offline and for testing in the IPython Notebook with modified Eschercode An example value for local_host is lsquohttplocalhost7778lsquo
bull id ndash Specify an id to make the javascript data definitions unique A random id is chosen bydefault
bull safe ndash If True then loading files from the filesytem is not allowed This is to ensure thesafety of using Builder within a web server
Keyword Arguments
These are defined in the Javascript API
bulluse_3d_transform
bullenable_search
bullfill_screen
bullzoom_to_element
bullfull_screen_button
44 Chapter 7 Contents
Escher Documentation Release 143
bullstarting_reaction
bullunique_map_id
bullprimary_metabolite_radius
bullsecondary_metabolite_radius
bullmarker_radius
bullgene_font_size
bullhide_secondary_metabolites
bullshow_gene_reaction_rules
bullhide_all_labels
bullreaction_styles
bullreaction_compare_style
bullreaction_scale
bullreaction_no_data_color
bullreaction_no_data_size
bulland_method_in_gene_reaction_rule
bullmetabolite_styles
bullmetabolite_compare_style
bullmetabolite_scale
bullmetabolite_no_data_color
bullmetabolite_no_data_size
bullidentifiers_on_map
bullhighlight_missing
bullallow_building_duplicate_reactions
bullcofactors
All keyword arguments can also be set on an existing Builder object using setter functions eg
my_builderset_reaction_styles(new_styles)
display_in_browser(ip=lsquo127001rsquo port=7655 n_retries=50 js_source=rsquowebrsquo menu=rsquoallrsquoscroll_behavior=rsquopanrsquo enable_editing=True enable_keys=True mini-fied_js=True never_ask_before_quit=False)
Launch a web browser to view the map
Parameters
bull ip ndash The IP address to serve the map on
bull port ndash The port to serve the map on If specified the port is occupied then a random freeport will be used
bull n_retries (int) ndash The number of times the server will try to find a port before quitting
bull js_source (string) ndash Can be one of the following
ndash web (Default) - Use JavaScript files from eschergithubio
79 Python API 45
Escher Documentation Release 143
ndash local - Use compiled JavaScript files in the local Escher installation Works offline
ndash dev - No longer necessary with source maps This now gives the same behavior aslsquolocalrsquo
bull menu (string) ndash Menu bar options include
ndash none - No menu or buttons
ndash zoom - Just zoom buttons
ndash all (Default) - Menu and button bar (requires Bootstrap)
bull scroll_behavior (string) ndash Scroll behavior options
ndash pan - Pan the map
ndash zoom - Zoom the map
ndash none (Default) - No scroll events
bull enable_editing (Boolean) ndash Enable the map editing modes
bull enable_keys (Boolean) ndash Enable keyboard shortcuts
bull minified_js (Boolean) ndash If True use the minified version of JavaScript and CSSfiles
bull never_ask_before_quit (Boolean) ndash Never display an alert asking if you wantto leave the page By default this message is displayed if enable_editing is True
display_in_notebook(js_source=rsquowebrsquo menu=rsquozoomrsquo scroll_behavior=rsquononersquo mini-fied_js=True height=500 enable_editing=False)
Embed the Map within the current IPython Notebook
Parameters
bull js_source (string) ndash Can be one of the following
ndash web (Default) - Use JavaScript files from eschergithubio
ndash local - Use compiled JavaScript files in the local Escher installation Works offline
ndash dev - No longer necessary with source maps This now gives the same behav-ior as lsquolocalrsquo
bull menu (string) ndash Menu bar options include
ndash none - No menu or buttons
ndash zoom - Just zoom buttons
ndash Note The all menu option does not work in an IPython notebook
bull scroll_behavior (string) ndash Scroll behavior options
ndash pan - Pan the map
ndash zoom - Zoom the map
ndash none - (Default) No scroll events
bull minified_js (Boolean) ndash If True use the minified version of JavaScript andCSS files
bull height ndash Height of the HTML container
bull enable_editing (Boolean) ndash Enable the map editing modes
46 Chapter 7 Contents
Escher Documentation Release 143
save_html(filepath=None overwrite=False js_source=rsquowebrsquo protocol=rsquohttpsrsquo menu=rsquoallrsquoscroll_behavior=rsquopanrsquo enable_editing=True enable_keys=True minified_js=Truenever_ask_before_quit=False static_site_index_json=None)
Save an HTML file containing the map
Parameters
bull filepath (string) ndash The HTML file will be saved to this location Whenjs_source is lsquolocalrsquo then a new directory will be created with this name
bull overwrite (Boolean) ndash Overwrite existing files
bull js_source (string) ndash Can be one of the following
ndash web (Default) - Use JavaScript files from eschergithubio
ndash local - Use compiled JavaScript files in the local Escher installation Works of-fline To make the dependencies available to the downloaded file a new directorywill be made with the name specified by filepath
ndash dev - No longer necessary with source maps This now gives the same behav-ior as lsquolocalrsquo
bull protocol (string) ndash The protocol can be lsquohttprsquo lsquohttpsrsquo or None which indicatesa lsquoprotocol relative URLrsquo as in eschergithubio Ignored if source is local
bull menu (string) ndash Menu bar options include
ndash none - No menu or buttons
ndash zoom - Just zoom buttons
ndash all (Default) - Menu and button bar (requires Bootstrap)
bull scroll_behavior (string) ndash Scroll behavior options
ndash pan - Pan the map
ndash zoom - Zoom the map
ndash none (Default) - No scroll events
bull enable_editing (Boolean) ndash Enable the map editing modes
bull enable_keys (Boolean) ndash Enable keyboard shortcuts
bull minified_js (Boolean) ndash If True use the minified version of JavaScript andCSS files
bull height (number) ndash Height of the HTML container
bull never_ask_before_quit (Boolean) ndash Never display an alert asking if youwant to leave the page By default this message is displayed if enable_editing isTrue
bull static_site_index_json (string) ndash The index as a JSON string for thestatic site Use javascript to parse the URL options Used for generating static pages(see static_sitepy)
791 Cache
escherget_cache_dir(versioned=True name=None)Get the cache dir as a string and make the directory if it does not already exist
Parameters
79 Python API 47
Escher Documentation Release 143
bull versioned (Boolean) ndash Whether to return the versioned path in the cache Eschermaps for the latest version of Escher are found in the versioned directory (versioned= True) but maps for previous versions of Escher can be found by visiting the parentdirectory (versioned = False)
bull name (string) ndash An optional subdirectory within the cache If versioned is False thenname is ignored
escherclear_cache(different_cache_dir=None ask=True)Empty the contents of the cache directory including all versions of all maps and models
Parameters
bull different_cache_dir (string) ndash (Optional) The directory of another cacheThis is mainly for testing
bull ask (Boolean) ndash Whether to ask before deleting
escherlist_cached_maps()Return a list of all cached maps
escherlist_cached_models()Return a list of all cached models
escherlist_available_maps()Return a list of all maps available on the server
escherlist_available_models()Return a list of all models available on the server
710 License
Escher and EscherConverter are distributed under the MIT license
bull genindex
48 Chapter 7 Contents
Python Module Index
eescher 44
49
Escher Documentation Release 143
50 Python Module Index
Index
Bbrush_mode() (built-in function) 43build_mode() (built-in function) 43Builder (class in escher) 44
Cclear_cache() (in module escher) 48
Ddisplay_in_browser() (escherBuilder method) 45display_in_notebook() (escherBuilder method) 46
Eescher (module) 44escherBuilder() (class) 39
Gget_cache_dir() (in module escher) 47
Llist_available_maps() (in module escher) 48list_available_models() (in module escher) 48list_cached_maps() (in module escher) 48list_cached_models() (in module escher) 48load_map() (built-in function) 42load_model() (built-in function) 43
Ooptionenable_keys (option attribute) 40optionsallow_building_duplicate_reactions (options at-
tribute) 42optionsand_method_in_gene_reaction_rule (options at-
tribute) 41optionscofactors (options attribute) 42optionsenable_editing (options attribute) 39optionsenable_search (options attribute) 40optionsfill_screen (options attribute) 40optionsfirst_load_callback (options attribute) 42optionsfull_screen_button (options attribute) 40optionsgene_data (options attribute) 41
optionsgene_font_size (options attribute) 40optionshide_all_labels (options attribute) 40optionshide_secondary_metabolites (options attribute)
40optionshighlight_missing (options attribute) 42optionsidentifiers_on_map (options attribute) 42optionsignore_bootstrap (options attribute) 40optionsmarker_radius (options attribute) 40optionsmenu (options attribute) 39optionsmetabolite_compare_style (options attribute) 42optionsmetabolite_data (options attribute) 42optionsmetabolite_no_data_color (options attribute) 42optionsmetabolite_no_data_size (options attribute) 42optionsmetabolite_scale (options attribute) 42optionsmetabolite_styles (options attribute) 42optionsnever_ask_before_quit (options attribute) 40optionsprimary_metabolite_radius (options attribute) 40optionsreaction_compare_style (options attribute) 41optionsreaction_data (options attribute) 40optionsreaction_no_data_color (options attribute) 41optionsreaction_no_data_size (options attribute) 41optionsreaction_scale (options attribute) 41optionsreaction_styles (options attribute) 41optionsscroll_behavior (options attribute) 39optionssecondary_metabolite_radius (options attribute)
40optionsshow_gene_reaction_rules (options attribute) 40optionsstarting_reaction (options attribute) 40optionsunique_map_id (options attribute) 40optionsuse_3d_transform (options attribute) 39
Rrotate_mode() (built-in function) 43
Ssave_html() (escherBuilder method) 46set_gene_data() (built-in function) 43set_metabolite_data() (built-in function) 43set_reaction_data() (built-in function) 43
51
Escher Documentation Release 143
Ttext_mode() (built-in function) 43
Vview_mode() (built-in function) 43
Zzoom_mode() (built-in function) 43
52 Index
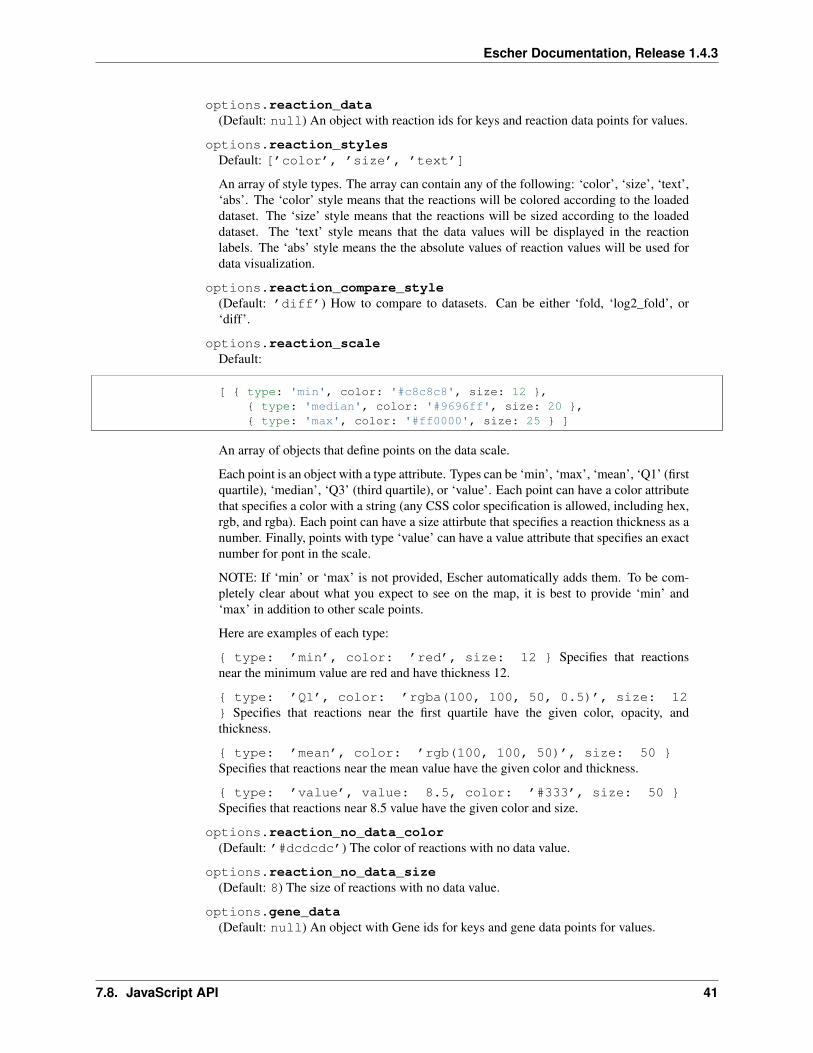
Escher Documentation Release 143
optionsand_method_in_gene_reaction_rule(Default mean) When evaluating a gene reaction rule use this function to evaluate ANDrules Can be lsquomeanrsquo or lsquominrsquo
optionsmetabolite_data(Default null) An object with metabolite ids for keys and metabolite data points forvalues
optionsmetabolite_stylesDefault [rsquocolorrsquo rsquosizersquo rsquotextrsquo]
An array of style types The array can contain any of the following lsquocolorrsquo lsquosizersquo lsquotextrsquolsquoabsrsquo The lsquocolorrsquo style means that the metabolites will be colored according to the loadeddataset The lsquosizersquo style means that the metabolites will be sized according to the loadeddataset The lsquotextrsquo style means that the data values will be displayed in the metabolitelabels The lsquoabsrsquo style means the the absolute values of metabolite values will be used fordata visualization
optionsmetabolite_compare_style(Default rsquodiffrsquo) How to compare to datasets Can be either lsquofoldrsquo lsquolog2_foldrsquo orlsquodiffrsquo
optionsmetabolite_scaleDefault
[ type min color fffaf0 size 20 type median color f1c470 size 30 type max color 800000 size 40 ]
An array of objects that define points on the data scale See the description of op-tionsreaction_scale for an explanation of the format
optionsmetabolite_no_data_color(Default rsquoffffffrsquo) The color of metabolites with no data value
optionsmetabolite_no_data_size(Default 10) The size of metabolites with no data value
View and build options
optionsidentifiers_on_map(Default rsquobigg_idrsquo) The identifiers that will be displayed in reaction metabolite andgene labels Can be lsquobigg_idrsquo or lsquonamersquo
optionshighlight_missing(Default false) If true then highlight in red reactions that are not in the loaded COBRAmodel
optionsallow_building_duplicate_reactions(Default true) If true then building duplicate reactions is allowed If false then dupli-cate reactions are hidden in Add reaction mode
optionscofactors(Default [rsquoatprsquo rsquoadprsquo rsquonadrsquo rsquonadhrsquo rsquonadprsquo rsquonadphrsquorsquogtprsquo rsquogdprsquo rsquohrsquo rsquocoarsquo rsquoumprsquo rsquoh20rsquo rsquoppirsquo]) A list of metabo-lite IDs to treat as cofactors These will be secondary metabolites in new reactions
Callbacks
optionsfirst_load_callbackA function to run after loading the Builder
42 Chapter 7 Contents
Escher Documentation Release 143
load_map(map_data[ should_update_data])Load a map for the loaded data Also reloads most of the Builder content
Arguments
bull map_data ndash The data for a map
bull should_update_data (Boolean) ndash (Default true) Whether data should be ap-plied to the map
load_model(model_data[ should_update_data])Load the cobra model from model data
Arguments
bull model_data ndash The data for a Cobra model (Parsing in done by escherCobraModel)
bull should_update_data (Boolean) ndash (Default true) Whether data should be ap-plied to the model
view_mode()Enter view mode
build_mode()Enter build mode
brush_mode()Enter brush mode
zoom_mode()Enter zoom mode
rotate_mode()Enter rotate mode
text_mode()Enter text mode
set_reaction_data(data)
Arguments
bull data (array) ndash An array of 1 or 2 objects where each object has keys that are reactionIDrsquos and values that are data points (numbers)
set_metabolite_data(data)
Arguments
bull data (array) ndash An array of 1 or 2 objects where each object has keys that are metaboliteIDrsquos and values that are data points (numbers)
set_gene_data(data clear_gene_reaction_rules)
Arguments
bull data (array) ndash An array of 1 or 2 objects where each object has keys that are gene IDrsquosand values that are data points (numbers)
Arguments
bull clear_gene_reaction_rules (Boolean) ndash (Optional Default false) In addi-tion to setting the data also turn of the gene_reaction_rules
78 JavaScript API 43
Escher Documentation Release 143
79 Python API
class escherBuilder(map_name=None map_json=None model=None model_name=Nonemodel_json=None embedded_css=None reaction_data=None metabo-lite_data=None gene_data=None local_host=None id=None safe=Falsekwargs)
A metabolic map that can be viewed edited and used to visualize data
This map will also show metabolic fluxes passed in during consruction It can be viewed as a standalone htmlinside a browswer Alternately the respresentation inside an IPython notebook will also display the map
Maps are stored in json files and are stored in a cache directory Maps which are not found will be downloadedfrom a map repository if found
Parameters
bull map_name ndash A string specifying a map to be downloaded from the Escher web server orloaded from the cache
bull map_json ndash A JSON string or a file path to a JSON file or a URL specifying a JSON fileto be downloaded
bull model ndash A Cobra model
bull model_name ndash A string specifying a model to be downloaded from the Escher web serveror loaded from the cache
bull model_json ndash A JSON string or a file path to a JSON file or a URL specifying a JSONfile to be downloaded
bull embedded_css ndash The CSS (as a string) to be embedded with the Escher SVG
bull reaction_data ndash A dictionary with keys that correspond to reaction ids and values thatwill be mapped to reaction arrows and labels
bull metabolite_data ndash A dictionary with keys that correspond to metabolite ids and valuesthat will be mapped to metabolite nodes and labels
bull gene_data ndash A dictionary with keys that correspond to gene ids and values that will bemapped to corresponding reactions
bull local_host ndash A hostname that will be used for any local files This is generally usedfor using the notebook offline and for testing in the IPython Notebook with modified Eschercode An example value for local_host is lsquohttplocalhost7778lsquo
bull id ndash Specify an id to make the javascript data definitions unique A random id is chosen bydefault
bull safe ndash If True then loading files from the filesytem is not allowed This is to ensure thesafety of using Builder within a web server
Keyword Arguments
These are defined in the Javascript API
bulluse_3d_transform
bullenable_search
bullfill_screen
bullzoom_to_element
bullfull_screen_button
44 Chapter 7 Contents
Escher Documentation Release 143
bullstarting_reaction
bullunique_map_id
bullprimary_metabolite_radius
bullsecondary_metabolite_radius
bullmarker_radius
bullgene_font_size
bullhide_secondary_metabolites
bullshow_gene_reaction_rules
bullhide_all_labels
bullreaction_styles
bullreaction_compare_style
bullreaction_scale
bullreaction_no_data_color
bullreaction_no_data_size
bulland_method_in_gene_reaction_rule
bullmetabolite_styles
bullmetabolite_compare_style
bullmetabolite_scale
bullmetabolite_no_data_color
bullmetabolite_no_data_size
bullidentifiers_on_map
bullhighlight_missing
bullallow_building_duplicate_reactions
bullcofactors
All keyword arguments can also be set on an existing Builder object using setter functions eg
my_builderset_reaction_styles(new_styles)
display_in_browser(ip=lsquo127001rsquo port=7655 n_retries=50 js_source=rsquowebrsquo menu=rsquoallrsquoscroll_behavior=rsquopanrsquo enable_editing=True enable_keys=True mini-fied_js=True never_ask_before_quit=False)
Launch a web browser to view the map
Parameters
bull ip ndash The IP address to serve the map on
bull port ndash The port to serve the map on If specified the port is occupied then a random freeport will be used
bull n_retries (int) ndash The number of times the server will try to find a port before quitting
bull js_source (string) ndash Can be one of the following
ndash web (Default) - Use JavaScript files from eschergithubio
79 Python API 45
Escher Documentation Release 143
ndash local - Use compiled JavaScript files in the local Escher installation Works offline
ndash dev - No longer necessary with source maps This now gives the same behavior aslsquolocalrsquo
bull menu (string) ndash Menu bar options include
ndash none - No menu or buttons
ndash zoom - Just zoom buttons
ndash all (Default) - Menu and button bar (requires Bootstrap)
bull scroll_behavior (string) ndash Scroll behavior options
ndash pan - Pan the map
ndash zoom - Zoom the map
ndash none (Default) - No scroll events
bull enable_editing (Boolean) ndash Enable the map editing modes
bull enable_keys (Boolean) ndash Enable keyboard shortcuts
bull minified_js (Boolean) ndash If True use the minified version of JavaScript and CSSfiles
bull never_ask_before_quit (Boolean) ndash Never display an alert asking if you wantto leave the page By default this message is displayed if enable_editing is True
display_in_notebook(js_source=rsquowebrsquo menu=rsquozoomrsquo scroll_behavior=rsquononersquo mini-fied_js=True height=500 enable_editing=False)
Embed the Map within the current IPython Notebook
Parameters
bull js_source (string) ndash Can be one of the following
ndash web (Default) - Use JavaScript files from eschergithubio
ndash local - Use compiled JavaScript files in the local Escher installation Works offline
ndash dev - No longer necessary with source maps This now gives the same behav-ior as lsquolocalrsquo
bull menu (string) ndash Menu bar options include
ndash none - No menu or buttons
ndash zoom - Just zoom buttons
ndash Note The all menu option does not work in an IPython notebook
bull scroll_behavior (string) ndash Scroll behavior options
ndash pan - Pan the map
ndash zoom - Zoom the map
ndash none - (Default) No scroll events
bull minified_js (Boolean) ndash If True use the minified version of JavaScript andCSS files
bull height ndash Height of the HTML container
bull enable_editing (Boolean) ndash Enable the map editing modes
46 Chapter 7 Contents
Escher Documentation Release 143
save_html(filepath=None overwrite=False js_source=rsquowebrsquo protocol=rsquohttpsrsquo menu=rsquoallrsquoscroll_behavior=rsquopanrsquo enable_editing=True enable_keys=True minified_js=Truenever_ask_before_quit=False static_site_index_json=None)
Save an HTML file containing the map
Parameters
bull filepath (string) ndash The HTML file will be saved to this location Whenjs_source is lsquolocalrsquo then a new directory will be created with this name
bull overwrite (Boolean) ndash Overwrite existing files
bull js_source (string) ndash Can be one of the following
ndash web (Default) - Use JavaScript files from eschergithubio
ndash local - Use compiled JavaScript files in the local Escher installation Works of-fline To make the dependencies available to the downloaded file a new directorywill be made with the name specified by filepath
ndash dev - No longer necessary with source maps This now gives the same behav-ior as lsquolocalrsquo
bull protocol (string) ndash The protocol can be lsquohttprsquo lsquohttpsrsquo or None which indicatesa lsquoprotocol relative URLrsquo as in eschergithubio Ignored if source is local
bull menu (string) ndash Menu bar options include
ndash none - No menu or buttons
ndash zoom - Just zoom buttons
ndash all (Default) - Menu and button bar (requires Bootstrap)
bull scroll_behavior (string) ndash Scroll behavior options
ndash pan - Pan the map
ndash zoom - Zoom the map
ndash none (Default) - No scroll events
bull enable_editing (Boolean) ndash Enable the map editing modes
bull enable_keys (Boolean) ndash Enable keyboard shortcuts
bull minified_js (Boolean) ndash If True use the minified version of JavaScript andCSS files
bull height (number) ndash Height of the HTML container
bull never_ask_before_quit (Boolean) ndash Never display an alert asking if youwant to leave the page By default this message is displayed if enable_editing isTrue
bull static_site_index_json (string) ndash The index as a JSON string for thestatic site Use javascript to parse the URL options Used for generating static pages(see static_sitepy)
791 Cache
escherget_cache_dir(versioned=True name=None)Get the cache dir as a string and make the directory if it does not already exist
Parameters
79 Python API 47
Escher Documentation Release 143
bull versioned (Boolean) ndash Whether to return the versioned path in the cache Eschermaps for the latest version of Escher are found in the versioned directory (versioned= True) but maps for previous versions of Escher can be found by visiting the parentdirectory (versioned = False)
bull name (string) ndash An optional subdirectory within the cache If versioned is False thenname is ignored
escherclear_cache(different_cache_dir=None ask=True)Empty the contents of the cache directory including all versions of all maps and models
Parameters
bull different_cache_dir (string) ndash (Optional) The directory of another cacheThis is mainly for testing
bull ask (Boolean) ndash Whether to ask before deleting
escherlist_cached_maps()Return a list of all cached maps
escherlist_cached_models()Return a list of all cached models
escherlist_available_maps()Return a list of all maps available on the server
escherlist_available_models()Return a list of all models available on the server
710 License
Escher and EscherConverter are distributed under the MIT license
bull genindex
48 Chapter 7 Contents
Python Module Index
eescher 44
49
Escher Documentation Release 143
50 Python Module Index
Index
Bbrush_mode() (built-in function) 43build_mode() (built-in function) 43Builder (class in escher) 44
Cclear_cache() (in module escher) 48
Ddisplay_in_browser() (escherBuilder method) 45display_in_notebook() (escherBuilder method) 46
Eescher (module) 44escherBuilder() (class) 39
Gget_cache_dir() (in module escher) 47
Llist_available_maps() (in module escher) 48list_available_models() (in module escher) 48list_cached_maps() (in module escher) 48list_cached_models() (in module escher) 48load_map() (built-in function) 42load_model() (built-in function) 43
Ooptionenable_keys (option attribute) 40optionsallow_building_duplicate_reactions (options at-
tribute) 42optionsand_method_in_gene_reaction_rule (options at-
tribute) 41optionscofactors (options attribute) 42optionsenable_editing (options attribute) 39optionsenable_search (options attribute) 40optionsfill_screen (options attribute) 40optionsfirst_load_callback (options attribute) 42optionsfull_screen_button (options attribute) 40optionsgene_data (options attribute) 41
optionsgene_font_size (options attribute) 40optionshide_all_labels (options attribute) 40optionshide_secondary_metabolites (options attribute)
40optionshighlight_missing (options attribute) 42optionsidentifiers_on_map (options attribute) 42optionsignore_bootstrap (options attribute) 40optionsmarker_radius (options attribute) 40optionsmenu (options attribute) 39optionsmetabolite_compare_style (options attribute) 42optionsmetabolite_data (options attribute) 42optionsmetabolite_no_data_color (options attribute) 42optionsmetabolite_no_data_size (options attribute) 42optionsmetabolite_scale (options attribute) 42optionsmetabolite_styles (options attribute) 42optionsnever_ask_before_quit (options attribute) 40optionsprimary_metabolite_radius (options attribute) 40optionsreaction_compare_style (options attribute) 41optionsreaction_data (options attribute) 40optionsreaction_no_data_color (options attribute) 41optionsreaction_no_data_size (options attribute) 41optionsreaction_scale (options attribute) 41optionsreaction_styles (options attribute) 41optionsscroll_behavior (options attribute) 39optionssecondary_metabolite_radius (options attribute)
40optionsshow_gene_reaction_rules (options attribute) 40optionsstarting_reaction (options attribute) 40optionsunique_map_id (options attribute) 40optionsuse_3d_transform (options attribute) 39
Rrotate_mode() (built-in function) 43
Ssave_html() (escherBuilder method) 46set_gene_data() (built-in function) 43set_metabolite_data() (built-in function) 43set_reaction_data() (built-in function) 43
51
Escher Documentation Release 143
Ttext_mode() (built-in function) 43
Vview_mode() (built-in function) 43
Zzoom_mode() (built-in function) 43
52 Index
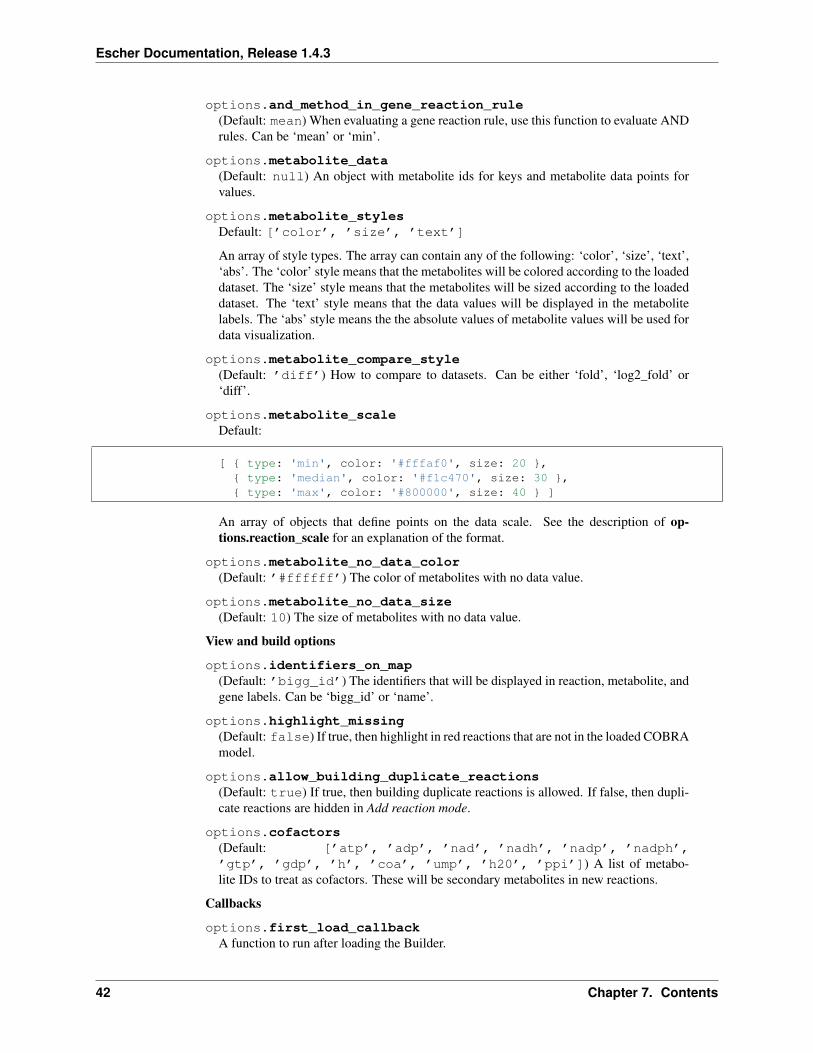
Escher Documentation Release 143
load_map(map_data[ should_update_data])Load a map for the loaded data Also reloads most of the Builder content
Arguments
bull map_data ndash The data for a map
bull should_update_data (Boolean) ndash (Default true) Whether data should be ap-plied to the map
load_model(model_data[ should_update_data])Load the cobra model from model data
Arguments
bull model_data ndash The data for a Cobra model (Parsing in done by escherCobraModel)
bull should_update_data (Boolean) ndash (Default true) Whether data should be ap-plied to the model
view_mode()Enter view mode
build_mode()Enter build mode
brush_mode()Enter brush mode
zoom_mode()Enter zoom mode
rotate_mode()Enter rotate mode
text_mode()Enter text mode
set_reaction_data(data)
Arguments
bull data (array) ndash An array of 1 or 2 objects where each object has keys that are reactionIDrsquos and values that are data points (numbers)
set_metabolite_data(data)
Arguments
bull data (array) ndash An array of 1 or 2 objects where each object has keys that are metaboliteIDrsquos and values that are data points (numbers)
set_gene_data(data clear_gene_reaction_rules)
Arguments
bull data (array) ndash An array of 1 or 2 objects where each object has keys that are gene IDrsquosand values that are data points (numbers)
Arguments
bull clear_gene_reaction_rules (Boolean) ndash (Optional Default false) In addi-tion to setting the data also turn of the gene_reaction_rules
78 JavaScript API 43
Escher Documentation Release 143
79 Python API
class escherBuilder(map_name=None map_json=None model=None model_name=Nonemodel_json=None embedded_css=None reaction_data=None metabo-lite_data=None gene_data=None local_host=None id=None safe=Falsekwargs)
A metabolic map that can be viewed edited and used to visualize data
This map will also show metabolic fluxes passed in during consruction It can be viewed as a standalone htmlinside a browswer Alternately the respresentation inside an IPython notebook will also display the map
Maps are stored in json files and are stored in a cache directory Maps which are not found will be downloadedfrom a map repository if found
Parameters
bull map_name ndash A string specifying a map to be downloaded from the Escher web server orloaded from the cache
bull map_json ndash A JSON string or a file path to a JSON file or a URL specifying a JSON fileto be downloaded
bull model ndash A Cobra model
bull model_name ndash A string specifying a model to be downloaded from the Escher web serveror loaded from the cache
bull model_json ndash A JSON string or a file path to a JSON file or a URL specifying a JSONfile to be downloaded
bull embedded_css ndash The CSS (as a string) to be embedded with the Escher SVG
bull reaction_data ndash A dictionary with keys that correspond to reaction ids and values thatwill be mapped to reaction arrows and labels
bull metabolite_data ndash A dictionary with keys that correspond to metabolite ids and valuesthat will be mapped to metabolite nodes and labels
bull gene_data ndash A dictionary with keys that correspond to gene ids and values that will bemapped to corresponding reactions
bull local_host ndash A hostname that will be used for any local files This is generally usedfor using the notebook offline and for testing in the IPython Notebook with modified Eschercode An example value for local_host is lsquohttplocalhost7778lsquo
bull id ndash Specify an id to make the javascript data definitions unique A random id is chosen bydefault
bull safe ndash If True then loading files from the filesytem is not allowed This is to ensure thesafety of using Builder within a web server
Keyword Arguments
These are defined in the Javascript API
bulluse_3d_transform
bullenable_search
bullfill_screen
bullzoom_to_element
bullfull_screen_button
44 Chapter 7 Contents
Escher Documentation Release 143
bullstarting_reaction
bullunique_map_id
bullprimary_metabolite_radius
bullsecondary_metabolite_radius
bullmarker_radius
bullgene_font_size
bullhide_secondary_metabolites
bullshow_gene_reaction_rules
bullhide_all_labels
bullreaction_styles
bullreaction_compare_style
bullreaction_scale
bullreaction_no_data_color
bullreaction_no_data_size
bulland_method_in_gene_reaction_rule
bullmetabolite_styles
bullmetabolite_compare_style
bullmetabolite_scale
bullmetabolite_no_data_color
bullmetabolite_no_data_size
bullidentifiers_on_map
bullhighlight_missing
bullallow_building_duplicate_reactions
bullcofactors
All keyword arguments can also be set on an existing Builder object using setter functions eg
my_builderset_reaction_styles(new_styles)
display_in_browser(ip=lsquo127001rsquo port=7655 n_retries=50 js_source=rsquowebrsquo menu=rsquoallrsquoscroll_behavior=rsquopanrsquo enable_editing=True enable_keys=True mini-fied_js=True never_ask_before_quit=False)
Launch a web browser to view the map
Parameters
bull ip ndash The IP address to serve the map on
bull port ndash The port to serve the map on If specified the port is occupied then a random freeport will be used
bull n_retries (int) ndash The number of times the server will try to find a port before quitting
bull js_source (string) ndash Can be one of the following
ndash web (Default) - Use JavaScript files from eschergithubio
79 Python API 45
Escher Documentation Release 143
ndash local - Use compiled JavaScript files in the local Escher installation Works offline
ndash dev - No longer necessary with source maps This now gives the same behavior aslsquolocalrsquo
bull menu (string) ndash Menu bar options include
ndash none - No menu or buttons
ndash zoom - Just zoom buttons
ndash all (Default) - Menu and button bar (requires Bootstrap)
bull scroll_behavior (string) ndash Scroll behavior options
ndash pan - Pan the map
ndash zoom - Zoom the map
ndash none (Default) - No scroll events
bull enable_editing (Boolean) ndash Enable the map editing modes
bull enable_keys (Boolean) ndash Enable keyboard shortcuts
bull minified_js (Boolean) ndash If True use the minified version of JavaScript and CSSfiles
bull never_ask_before_quit (Boolean) ndash Never display an alert asking if you wantto leave the page By default this message is displayed if enable_editing is True
display_in_notebook(js_source=rsquowebrsquo menu=rsquozoomrsquo scroll_behavior=rsquononersquo mini-fied_js=True height=500 enable_editing=False)
Embed the Map within the current IPython Notebook
Parameters
bull js_source (string) ndash Can be one of the following
ndash web (Default) - Use JavaScript files from eschergithubio
ndash local - Use compiled JavaScript files in the local Escher installation Works offline
ndash dev - No longer necessary with source maps This now gives the same behav-ior as lsquolocalrsquo
bull menu (string) ndash Menu bar options include
ndash none - No menu or buttons
ndash zoom - Just zoom buttons
ndash Note The all menu option does not work in an IPython notebook
bull scroll_behavior (string) ndash Scroll behavior options
ndash pan - Pan the map
ndash zoom - Zoom the map
ndash none - (Default) No scroll events
bull minified_js (Boolean) ndash If True use the minified version of JavaScript andCSS files
bull height ndash Height of the HTML container
bull enable_editing (Boolean) ndash Enable the map editing modes
46 Chapter 7 Contents
Escher Documentation Release 143
save_html(filepath=None overwrite=False js_source=rsquowebrsquo protocol=rsquohttpsrsquo menu=rsquoallrsquoscroll_behavior=rsquopanrsquo enable_editing=True enable_keys=True minified_js=Truenever_ask_before_quit=False static_site_index_json=None)
Save an HTML file containing the map
Parameters
bull filepath (string) ndash The HTML file will be saved to this location Whenjs_source is lsquolocalrsquo then a new directory will be created with this name
bull overwrite (Boolean) ndash Overwrite existing files
bull js_source (string) ndash Can be one of the following
ndash web (Default) - Use JavaScript files from eschergithubio
ndash local - Use compiled JavaScript files in the local Escher installation Works of-fline To make the dependencies available to the downloaded file a new directorywill be made with the name specified by filepath
ndash dev - No longer necessary with source maps This now gives the same behav-ior as lsquolocalrsquo
bull protocol (string) ndash The protocol can be lsquohttprsquo lsquohttpsrsquo or None which indicatesa lsquoprotocol relative URLrsquo as in eschergithubio Ignored if source is local
bull menu (string) ndash Menu bar options include
ndash none - No menu or buttons
ndash zoom - Just zoom buttons
ndash all (Default) - Menu and button bar (requires Bootstrap)
bull scroll_behavior (string) ndash Scroll behavior options
ndash pan - Pan the map
ndash zoom - Zoom the map
ndash none (Default) - No scroll events
bull enable_editing (Boolean) ndash Enable the map editing modes
bull enable_keys (Boolean) ndash Enable keyboard shortcuts
bull minified_js (Boolean) ndash If True use the minified version of JavaScript andCSS files
bull height (number) ndash Height of the HTML container
bull never_ask_before_quit (Boolean) ndash Never display an alert asking if youwant to leave the page By default this message is displayed if enable_editing isTrue
bull static_site_index_json (string) ndash The index as a JSON string for thestatic site Use javascript to parse the URL options Used for generating static pages(see static_sitepy)
791 Cache
escherget_cache_dir(versioned=True name=None)Get the cache dir as a string and make the directory if it does not already exist
Parameters
79 Python API 47
Escher Documentation Release 143
bull versioned (Boolean) ndash Whether to return the versioned path in the cache Eschermaps for the latest version of Escher are found in the versioned directory (versioned= True) but maps for previous versions of Escher can be found by visiting the parentdirectory (versioned = False)
bull name (string) ndash An optional subdirectory within the cache If versioned is False thenname is ignored
escherclear_cache(different_cache_dir=None ask=True)Empty the contents of the cache directory including all versions of all maps and models
Parameters
bull different_cache_dir (string) ndash (Optional) The directory of another cacheThis is mainly for testing
bull ask (Boolean) ndash Whether to ask before deleting
escherlist_cached_maps()Return a list of all cached maps
escherlist_cached_models()Return a list of all cached models
escherlist_available_maps()Return a list of all maps available on the server
escherlist_available_models()Return a list of all models available on the server
710 License
Escher and EscherConverter are distributed under the MIT license
bull genindex
48 Chapter 7 Contents
Python Module Index
eescher 44
49
Escher Documentation Release 143
50 Python Module Index
Index
Bbrush_mode() (built-in function) 43build_mode() (built-in function) 43Builder (class in escher) 44
Cclear_cache() (in module escher) 48
Ddisplay_in_browser() (escherBuilder method) 45display_in_notebook() (escherBuilder method) 46
Eescher (module) 44escherBuilder() (class) 39
Gget_cache_dir() (in module escher) 47
Llist_available_maps() (in module escher) 48list_available_models() (in module escher) 48list_cached_maps() (in module escher) 48list_cached_models() (in module escher) 48load_map() (built-in function) 42load_model() (built-in function) 43
Ooptionenable_keys (option attribute) 40optionsallow_building_duplicate_reactions (options at-
tribute) 42optionsand_method_in_gene_reaction_rule (options at-
tribute) 41optionscofactors (options attribute) 42optionsenable_editing (options attribute) 39optionsenable_search (options attribute) 40optionsfill_screen (options attribute) 40optionsfirst_load_callback (options attribute) 42optionsfull_screen_button (options attribute) 40optionsgene_data (options attribute) 41
optionsgene_font_size (options attribute) 40optionshide_all_labels (options attribute) 40optionshide_secondary_metabolites (options attribute)
40optionshighlight_missing (options attribute) 42optionsidentifiers_on_map (options attribute) 42optionsignore_bootstrap (options attribute) 40optionsmarker_radius (options attribute) 40optionsmenu (options attribute) 39optionsmetabolite_compare_style (options attribute) 42optionsmetabolite_data (options attribute) 42optionsmetabolite_no_data_color (options attribute) 42optionsmetabolite_no_data_size (options attribute) 42optionsmetabolite_scale (options attribute) 42optionsmetabolite_styles (options attribute) 42optionsnever_ask_before_quit (options attribute) 40optionsprimary_metabolite_radius (options attribute) 40optionsreaction_compare_style (options attribute) 41optionsreaction_data (options attribute) 40optionsreaction_no_data_color (options attribute) 41optionsreaction_no_data_size (options attribute) 41optionsreaction_scale (options attribute) 41optionsreaction_styles (options attribute) 41optionsscroll_behavior (options attribute) 39optionssecondary_metabolite_radius (options attribute)
40optionsshow_gene_reaction_rules (options attribute) 40optionsstarting_reaction (options attribute) 40optionsunique_map_id (options attribute) 40optionsuse_3d_transform (options attribute) 39
Rrotate_mode() (built-in function) 43
Ssave_html() (escherBuilder method) 46set_gene_data() (built-in function) 43set_metabolite_data() (built-in function) 43set_reaction_data() (built-in function) 43
51
Escher Documentation Release 143
Ttext_mode() (built-in function) 43
Vview_mode() (built-in function) 43
Zzoom_mode() (built-in function) 43
52 Index
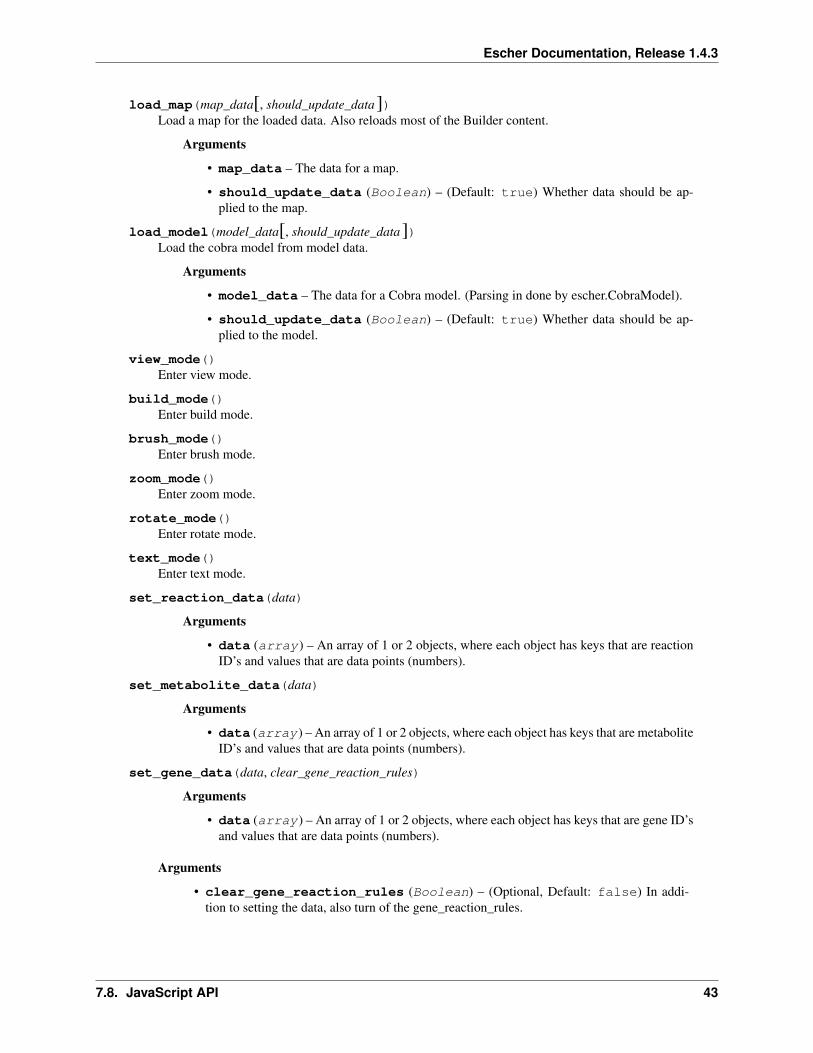
Escher Documentation Release 143
79 Python API
class escherBuilder(map_name=None map_json=None model=None model_name=Nonemodel_json=None embedded_css=None reaction_data=None metabo-lite_data=None gene_data=None local_host=None id=None safe=Falsekwargs)
A metabolic map that can be viewed edited and used to visualize data
This map will also show metabolic fluxes passed in during consruction It can be viewed as a standalone htmlinside a browswer Alternately the respresentation inside an IPython notebook will also display the map
Maps are stored in json files and are stored in a cache directory Maps which are not found will be downloadedfrom a map repository if found
Parameters
bull map_name ndash A string specifying a map to be downloaded from the Escher web server orloaded from the cache
bull map_json ndash A JSON string or a file path to a JSON file or a URL specifying a JSON fileto be downloaded
bull model ndash A Cobra model
bull model_name ndash A string specifying a model to be downloaded from the Escher web serveror loaded from the cache
bull model_json ndash A JSON string or a file path to a JSON file or a URL specifying a JSONfile to be downloaded
bull embedded_css ndash The CSS (as a string) to be embedded with the Escher SVG
bull reaction_data ndash A dictionary with keys that correspond to reaction ids and values thatwill be mapped to reaction arrows and labels
bull metabolite_data ndash A dictionary with keys that correspond to metabolite ids and valuesthat will be mapped to metabolite nodes and labels
bull gene_data ndash A dictionary with keys that correspond to gene ids and values that will bemapped to corresponding reactions
bull local_host ndash A hostname that will be used for any local files This is generally usedfor using the notebook offline and for testing in the IPython Notebook with modified Eschercode An example value for local_host is lsquohttplocalhost7778lsquo
bull id ndash Specify an id to make the javascript data definitions unique A random id is chosen bydefault
bull safe ndash If True then loading files from the filesytem is not allowed This is to ensure thesafety of using Builder within a web server
Keyword Arguments
These are defined in the Javascript API
bulluse_3d_transform
bullenable_search
bullfill_screen
bullzoom_to_element
bullfull_screen_button
44 Chapter 7 Contents
Escher Documentation Release 143
bullstarting_reaction
bullunique_map_id
bullprimary_metabolite_radius
bullsecondary_metabolite_radius
bullmarker_radius
bullgene_font_size
bullhide_secondary_metabolites
bullshow_gene_reaction_rules
bullhide_all_labels
bullreaction_styles
bullreaction_compare_style
bullreaction_scale
bullreaction_no_data_color
bullreaction_no_data_size
bulland_method_in_gene_reaction_rule
bullmetabolite_styles
bullmetabolite_compare_style
bullmetabolite_scale
bullmetabolite_no_data_color
bullmetabolite_no_data_size
bullidentifiers_on_map
bullhighlight_missing
bullallow_building_duplicate_reactions
bullcofactors
All keyword arguments can also be set on an existing Builder object using setter functions eg
my_builderset_reaction_styles(new_styles)
display_in_browser(ip=lsquo127001rsquo port=7655 n_retries=50 js_source=rsquowebrsquo menu=rsquoallrsquoscroll_behavior=rsquopanrsquo enable_editing=True enable_keys=True mini-fied_js=True never_ask_before_quit=False)
Launch a web browser to view the map
Parameters
bull ip ndash The IP address to serve the map on
bull port ndash The port to serve the map on If specified the port is occupied then a random freeport will be used
bull n_retries (int) ndash The number of times the server will try to find a port before quitting
bull js_source (string) ndash Can be one of the following
ndash web (Default) - Use JavaScript files from eschergithubio
79 Python API 45
Escher Documentation Release 143
ndash local - Use compiled JavaScript files in the local Escher installation Works offline
ndash dev - No longer necessary with source maps This now gives the same behavior aslsquolocalrsquo
bull menu (string) ndash Menu bar options include
ndash none - No menu or buttons
ndash zoom - Just zoom buttons
ndash all (Default) - Menu and button bar (requires Bootstrap)
bull scroll_behavior (string) ndash Scroll behavior options
ndash pan - Pan the map
ndash zoom - Zoom the map
ndash none (Default) - No scroll events
bull enable_editing (Boolean) ndash Enable the map editing modes
bull enable_keys (Boolean) ndash Enable keyboard shortcuts
bull minified_js (Boolean) ndash If True use the minified version of JavaScript and CSSfiles
bull never_ask_before_quit (Boolean) ndash Never display an alert asking if you wantto leave the page By default this message is displayed if enable_editing is True
display_in_notebook(js_source=rsquowebrsquo menu=rsquozoomrsquo scroll_behavior=rsquononersquo mini-fied_js=True height=500 enable_editing=False)
Embed the Map within the current IPython Notebook
Parameters
bull js_source (string) ndash Can be one of the following
ndash web (Default) - Use JavaScript files from eschergithubio
ndash local - Use compiled JavaScript files in the local Escher installation Works offline
ndash dev - No longer necessary with source maps This now gives the same behav-ior as lsquolocalrsquo
bull menu (string) ndash Menu bar options include
ndash none - No menu or buttons
ndash zoom - Just zoom buttons
ndash Note The all menu option does not work in an IPython notebook
bull scroll_behavior (string) ndash Scroll behavior options
ndash pan - Pan the map
ndash zoom - Zoom the map
ndash none - (Default) No scroll events
bull minified_js (Boolean) ndash If True use the minified version of JavaScript andCSS files
bull height ndash Height of the HTML container
bull enable_editing (Boolean) ndash Enable the map editing modes
46 Chapter 7 Contents
Escher Documentation Release 143
save_html(filepath=None overwrite=False js_source=rsquowebrsquo protocol=rsquohttpsrsquo menu=rsquoallrsquoscroll_behavior=rsquopanrsquo enable_editing=True enable_keys=True minified_js=Truenever_ask_before_quit=False static_site_index_json=None)
Save an HTML file containing the map
Parameters
bull filepath (string) ndash The HTML file will be saved to this location Whenjs_source is lsquolocalrsquo then a new directory will be created with this name
bull overwrite (Boolean) ndash Overwrite existing files
bull js_source (string) ndash Can be one of the following
ndash web (Default) - Use JavaScript files from eschergithubio
ndash local - Use compiled JavaScript files in the local Escher installation Works of-fline To make the dependencies available to the downloaded file a new directorywill be made with the name specified by filepath
ndash dev - No longer necessary with source maps This now gives the same behav-ior as lsquolocalrsquo
bull protocol (string) ndash The protocol can be lsquohttprsquo lsquohttpsrsquo or None which indicatesa lsquoprotocol relative URLrsquo as in eschergithubio Ignored if source is local
bull menu (string) ndash Menu bar options include
ndash none - No menu or buttons
ndash zoom - Just zoom buttons
ndash all (Default) - Menu and button bar (requires Bootstrap)
bull scroll_behavior (string) ndash Scroll behavior options
ndash pan - Pan the map
ndash zoom - Zoom the map
ndash none (Default) - No scroll events
bull enable_editing (Boolean) ndash Enable the map editing modes
bull enable_keys (Boolean) ndash Enable keyboard shortcuts
bull minified_js (Boolean) ndash If True use the minified version of JavaScript andCSS files
bull height (number) ndash Height of the HTML container
bull never_ask_before_quit (Boolean) ndash Never display an alert asking if youwant to leave the page By default this message is displayed if enable_editing isTrue
bull static_site_index_json (string) ndash The index as a JSON string for thestatic site Use javascript to parse the URL options Used for generating static pages(see static_sitepy)
791 Cache
escherget_cache_dir(versioned=True name=None)Get the cache dir as a string and make the directory if it does not already exist
Parameters
79 Python API 47
Escher Documentation Release 143
bull versioned (Boolean) ndash Whether to return the versioned path in the cache Eschermaps for the latest version of Escher are found in the versioned directory (versioned= True) but maps for previous versions of Escher can be found by visiting the parentdirectory (versioned = False)
bull name (string) ndash An optional subdirectory within the cache If versioned is False thenname is ignored
escherclear_cache(different_cache_dir=None ask=True)Empty the contents of the cache directory including all versions of all maps and models
Parameters
bull different_cache_dir (string) ndash (Optional) The directory of another cacheThis is mainly for testing
bull ask (Boolean) ndash Whether to ask before deleting
escherlist_cached_maps()Return a list of all cached maps
escherlist_cached_models()Return a list of all cached models
escherlist_available_maps()Return a list of all maps available on the server
escherlist_available_models()Return a list of all models available on the server
710 License
Escher and EscherConverter are distributed under the MIT license
bull genindex
48 Chapter 7 Contents
Python Module Index
eescher 44
49
Escher Documentation Release 143
50 Python Module Index
Index
Bbrush_mode() (built-in function) 43build_mode() (built-in function) 43Builder (class in escher) 44
Cclear_cache() (in module escher) 48
Ddisplay_in_browser() (escherBuilder method) 45display_in_notebook() (escherBuilder method) 46
Eescher (module) 44escherBuilder() (class) 39
Gget_cache_dir() (in module escher) 47
Llist_available_maps() (in module escher) 48list_available_models() (in module escher) 48list_cached_maps() (in module escher) 48list_cached_models() (in module escher) 48load_map() (built-in function) 42load_model() (built-in function) 43
Ooptionenable_keys (option attribute) 40optionsallow_building_duplicate_reactions (options at-
tribute) 42optionsand_method_in_gene_reaction_rule (options at-
tribute) 41optionscofactors (options attribute) 42optionsenable_editing (options attribute) 39optionsenable_search (options attribute) 40optionsfill_screen (options attribute) 40optionsfirst_load_callback (options attribute) 42optionsfull_screen_button (options attribute) 40optionsgene_data (options attribute) 41
optionsgene_font_size (options attribute) 40optionshide_all_labels (options attribute) 40optionshide_secondary_metabolites (options attribute)
40optionshighlight_missing (options attribute) 42optionsidentifiers_on_map (options attribute) 42optionsignore_bootstrap (options attribute) 40optionsmarker_radius (options attribute) 40optionsmenu (options attribute) 39optionsmetabolite_compare_style (options attribute) 42optionsmetabolite_data (options attribute) 42optionsmetabolite_no_data_color (options attribute) 42optionsmetabolite_no_data_size (options attribute) 42optionsmetabolite_scale (options attribute) 42optionsmetabolite_styles (options attribute) 42optionsnever_ask_before_quit (options attribute) 40optionsprimary_metabolite_radius (options attribute) 40optionsreaction_compare_style (options attribute) 41optionsreaction_data (options attribute) 40optionsreaction_no_data_color (options attribute) 41optionsreaction_no_data_size (options attribute) 41optionsreaction_scale (options attribute) 41optionsreaction_styles (options attribute) 41optionsscroll_behavior (options attribute) 39optionssecondary_metabolite_radius (options attribute)
40optionsshow_gene_reaction_rules (options attribute) 40optionsstarting_reaction (options attribute) 40optionsunique_map_id (options attribute) 40optionsuse_3d_transform (options attribute) 39
Rrotate_mode() (built-in function) 43
Ssave_html() (escherBuilder method) 46set_gene_data() (built-in function) 43set_metabolite_data() (built-in function) 43set_reaction_data() (built-in function) 43
51
Escher Documentation Release 143
Ttext_mode() (built-in function) 43
Vview_mode() (built-in function) 43
Zzoom_mode() (built-in function) 43
52 Index
Escher Documentation Release 143
ndash local - Use compiled JavaScript files in the local Escher installation Works offline
ndash dev - No longer necessary with source maps This now gives the same behavior aslsquolocalrsquo
bull menu (string) ndash Menu bar options include
ndash none - No menu or buttons
ndash zoom - Just zoom buttons
ndash all (Default) - Menu and button bar (requires Bootstrap)
bull scroll_behavior (string) ndash Scroll behavior options
ndash pan - Pan the map
ndash zoom - Zoom the map
ndash none (Default) - No scroll events
bull enable_editing (Boolean) ndash Enable the map editing modes
bull enable_keys (Boolean) ndash Enable keyboard shortcuts
bull minified_js (Boolean) ndash If True use the minified version of JavaScript and CSSfiles
bull never_ask_before_quit (Boolean) ndash Never display an alert asking if you wantto leave the page By default this message is displayed if enable_editing is True
display_in_notebook(js_source=rsquowebrsquo menu=rsquozoomrsquo scroll_behavior=rsquononersquo mini-fied_js=True height=500 enable_editing=False)
Embed the Map within the current IPython Notebook
Parameters
bull js_source (string) ndash Can be one of the following
ndash web (Default) - Use JavaScript files from eschergithubio
ndash local - Use compiled JavaScript files in the local Escher installation Works offline
ndash dev - No longer necessary with source maps This now gives the same behav-ior as lsquolocalrsquo
bull menu (string) ndash Menu bar options include
ndash none - No menu or buttons
ndash zoom - Just zoom buttons
ndash Note The all menu option does not work in an IPython notebook
bull scroll_behavior (string) ndash Scroll behavior options
ndash pan - Pan the map
ndash zoom - Zoom the map
ndash none - (Default) No scroll events
bull minified_js (Boolean) ndash If True use the minified version of JavaScript andCSS files
bull height ndash Height of the HTML container
bull enable_editing (Boolean) ndash Enable the map editing modes
46 Chapter 7 Contents
Escher Documentation Release 143
save_html(filepath=None overwrite=False js_source=rsquowebrsquo protocol=rsquohttpsrsquo menu=rsquoallrsquoscroll_behavior=rsquopanrsquo enable_editing=True enable_keys=True minified_js=Truenever_ask_before_quit=False static_site_index_json=None)
Save an HTML file containing the map
Parameters
bull filepath (string) ndash The HTML file will be saved to this location Whenjs_source is lsquolocalrsquo then a new directory will be created with this name
bull overwrite (Boolean) ndash Overwrite existing files
bull js_source (string) ndash Can be one of the following
ndash web (Default) - Use JavaScript files from eschergithubio
ndash local - Use compiled JavaScript files in the local Escher installation Works of-fline To make the dependencies available to the downloaded file a new directorywill be made with the name specified by filepath
ndash dev - No longer necessary with source maps This now gives the same behav-ior as lsquolocalrsquo
bull protocol (string) ndash The protocol can be lsquohttprsquo lsquohttpsrsquo or None which indicatesa lsquoprotocol relative URLrsquo as in eschergithubio Ignored if source is local
bull menu (string) ndash Menu bar options include
ndash none - No menu or buttons
ndash zoom - Just zoom buttons
ndash all (Default) - Menu and button bar (requires Bootstrap)
bull scroll_behavior (string) ndash Scroll behavior options
ndash pan - Pan the map
ndash zoom - Zoom the map
ndash none (Default) - No scroll events
bull enable_editing (Boolean) ndash Enable the map editing modes
bull enable_keys (Boolean) ndash Enable keyboard shortcuts
bull minified_js (Boolean) ndash If True use the minified version of JavaScript andCSS files
bull height (number) ndash Height of the HTML container
bull never_ask_before_quit (Boolean) ndash Never display an alert asking if youwant to leave the page By default this message is displayed if enable_editing isTrue
bull static_site_index_json (string) ndash The index as a JSON string for thestatic site Use javascript to parse the URL options Used for generating static pages(see static_sitepy)
791 Cache
escherget_cache_dir(versioned=True name=None)Get the cache dir as a string and make the directory if it does not already exist
Parameters
79 Python API 47
Escher Documentation Release 143
bull versioned (Boolean) ndash Whether to return the versioned path in the cache Eschermaps for the latest version of Escher are found in the versioned directory (versioned= True) but maps for previous versions of Escher can be found by visiting the parentdirectory (versioned = False)
bull name (string) ndash An optional subdirectory within the cache If versioned is False thenname is ignored
escherclear_cache(different_cache_dir=None ask=True)Empty the contents of the cache directory including all versions of all maps and models
Parameters
bull different_cache_dir (string) ndash (Optional) The directory of another cacheThis is mainly for testing
bull ask (Boolean) ndash Whether to ask before deleting
escherlist_cached_maps()Return a list of all cached maps
escherlist_cached_models()Return a list of all cached models
escherlist_available_maps()Return a list of all maps available on the server
escherlist_available_models()Return a list of all models available on the server
710 License
Escher and EscherConverter are distributed under the MIT license
bull genindex
48 Chapter 7 Contents
Python Module Index
eescher 44
49
Escher Documentation Release 143
50 Python Module Index
Index
Bbrush_mode() (built-in function) 43build_mode() (built-in function) 43Builder (class in escher) 44
Cclear_cache() (in module escher) 48
Ddisplay_in_browser() (escherBuilder method) 45display_in_notebook() (escherBuilder method) 46
Eescher (module) 44escherBuilder() (class) 39
Gget_cache_dir() (in module escher) 47
Llist_available_maps() (in module escher) 48list_available_models() (in module escher) 48list_cached_maps() (in module escher) 48list_cached_models() (in module escher) 48load_map() (built-in function) 42load_model() (built-in function) 43
Ooptionenable_keys (option attribute) 40optionsallow_building_duplicate_reactions (options at-
tribute) 42optionsand_method_in_gene_reaction_rule (options at-
tribute) 41optionscofactors (options attribute) 42optionsenable_editing (options attribute) 39optionsenable_search (options attribute) 40optionsfill_screen (options attribute) 40optionsfirst_load_callback (options attribute) 42optionsfull_screen_button (options attribute) 40optionsgene_data (options attribute) 41
optionsgene_font_size (options attribute) 40optionshide_all_labels (options attribute) 40optionshide_secondary_metabolites (options attribute)
40optionshighlight_missing (options attribute) 42optionsidentifiers_on_map (options attribute) 42optionsignore_bootstrap (options attribute) 40optionsmarker_radius (options attribute) 40optionsmenu (options attribute) 39optionsmetabolite_compare_style (options attribute) 42optionsmetabolite_data (options attribute) 42optionsmetabolite_no_data_color (options attribute) 42optionsmetabolite_no_data_size (options attribute) 42optionsmetabolite_scale (options attribute) 42optionsmetabolite_styles (options attribute) 42optionsnever_ask_before_quit (options attribute) 40optionsprimary_metabolite_radius (options attribute) 40optionsreaction_compare_style (options attribute) 41optionsreaction_data (options attribute) 40optionsreaction_no_data_color (options attribute) 41optionsreaction_no_data_size (options attribute) 41optionsreaction_scale (options attribute) 41optionsreaction_styles (options attribute) 41optionsscroll_behavior (options attribute) 39optionssecondary_metabolite_radius (options attribute)
40optionsshow_gene_reaction_rules (options attribute) 40optionsstarting_reaction (options attribute) 40optionsunique_map_id (options attribute) 40optionsuse_3d_transform (options attribute) 39
Rrotate_mode() (built-in function) 43
Ssave_html() (escherBuilder method) 46set_gene_data() (built-in function) 43set_metabolite_data() (built-in function) 43set_reaction_data() (built-in function) 43
51
Escher Documentation Release 143
Ttext_mode() (built-in function) 43
Vview_mode() (built-in function) 43
Zzoom_mode() (built-in function) 43
52 Index
Escher Documentation Release 143
bull versioned (Boolean) ndash Whether to return the versioned path in the cache Eschermaps for the latest version of Escher are found in the versioned directory (versioned= True) but maps for previous versions of Escher can be found by visiting the parentdirectory (versioned = False)
bull name (string) ndash An optional subdirectory within the cache If versioned is False thenname is ignored
escherclear_cache(different_cache_dir=None ask=True)Empty the contents of the cache directory including all versions of all maps and models
Parameters
bull different_cache_dir (string) ndash (Optional) The directory of another cacheThis is mainly for testing
bull ask (Boolean) ndash Whether to ask before deleting
escherlist_cached_maps()Return a list of all cached maps
escherlist_cached_models()Return a list of all cached models
escherlist_available_maps()Return a list of all maps available on the server
escherlist_available_models()Return a list of all models available on the server
710 License
Escher and EscherConverter are distributed under the MIT license
bull genindex
48 Chapter 7 Contents
Python Module Index
eescher 44
49
Escher Documentation Release 143
50 Python Module Index
Index
Bbrush_mode() (built-in function) 43build_mode() (built-in function) 43Builder (class in escher) 44
Cclear_cache() (in module escher) 48
Ddisplay_in_browser() (escherBuilder method) 45display_in_notebook() (escherBuilder method) 46
Eescher (module) 44escherBuilder() (class) 39
Gget_cache_dir() (in module escher) 47
Llist_available_maps() (in module escher) 48list_available_models() (in module escher) 48list_cached_maps() (in module escher) 48list_cached_models() (in module escher) 48load_map() (built-in function) 42load_model() (built-in function) 43
Ooptionenable_keys (option attribute) 40optionsallow_building_duplicate_reactions (options at-
tribute) 42optionsand_method_in_gene_reaction_rule (options at-
tribute) 41optionscofactors (options attribute) 42optionsenable_editing (options attribute) 39optionsenable_search (options attribute) 40optionsfill_screen (options attribute) 40optionsfirst_load_callback (options attribute) 42optionsfull_screen_button (options attribute) 40optionsgene_data (options attribute) 41
optionsgene_font_size (options attribute) 40optionshide_all_labels (options attribute) 40optionshide_secondary_metabolites (options attribute)
40optionshighlight_missing (options attribute) 42optionsidentifiers_on_map (options attribute) 42optionsignore_bootstrap (options attribute) 40optionsmarker_radius (options attribute) 40optionsmenu (options attribute) 39optionsmetabolite_compare_style (options attribute) 42optionsmetabolite_data (options attribute) 42optionsmetabolite_no_data_color (options attribute) 42optionsmetabolite_no_data_size (options attribute) 42optionsmetabolite_scale (options attribute) 42optionsmetabolite_styles (options attribute) 42optionsnever_ask_before_quit (options attribute) 40optionsprimary_metabolite_radius (options attribute) 40optionsreaction_compare_style (options attribute) 41optionsreaction_data (options attribute) 40optionsreaction_no_data_color (options attribute) 41optionsreaction_no_data_size (options attribute) 41optionsreaction_scale (options attribute) 41optionsreaction_styles (options attribute) 41optionsscroll_behavior (options attribute) 39optionssecondary_metabolite_radius (options attribute)
40optionsshow_gene_reaction_rules (options attribute) 40optionsstarting_reaction (options attribute) 40optionsunique_map_id (options attribute) 40optionsuse_3d_transform (options attribute) 39
Rrotate_mode() (built-in function) 43
Ssave_html() (escherBuilder method) 46set_gene_data() (built-in function) 43set_metabolite_data() (built-in function) 43set_reaction_data() (built-in function) 43
51
Escher Documentation Release 143
Ttext_mode() (built-in function) 43
Vview_mode() (built-in function) 43
Zzoom_mode() (built-in function) 43
52 Index

Escher Documentation Release 143
50 Python Module Index
Index
Bbrush_mode() (built-in function) 43build_mode() (built-in function) 43Builder (class in escher) 44
Cclear_cache() (in module escher) 48
Ddisplay_in_browser() (escherBuilder method) 45display_in_notebook() (escherBuilder method) 46
Eescher (module) 44escherBuilder() (class) 39
Gget_cache_dir() (in module escher) 47
Llist_available_maps() (in module escher) 48list_available_models() (in module escher) 48list_cached_maps() (in module escher) 48list_cached_models() (in module escher) 48load_map() (built-in function) 42load_model() (built-in function) 43
Ooptionenable_keys (option attribute) 40optionsallow_building_duplicate_reactions (options at-
tribute) 42optionsand_method_in_gene_reaction_rule (options at-
tribute) 41optionscofactors (options attribute) 42optionsenable_editing (options attribute) 39optionsenable_search (options attribute) 40optionsfill_screen (options attribute) 40optionsfirst_load_callback (options attribute) 42optionsfull_screen_button (options attribute) 40optionsgene_data (options attribute) 41
optionsgene_font_size (options attribute) 40optionshide_all_labels (options attribute) 40optionshide_secondary_metabolites (options attribute)
40optionshighlight_missing (options attribute) 42optionsidentifiers_on_map (options attribute) 42optionsignore_bootstrap (options attribute) 40optionsmarker_radius (options attribute) 40optionsmenu (options attribute) 39optionsmetabolite_compare_style (options attribute) 42optionsmetabolite_data (options attribute) 42optionsmetabolite_no_data_color (options attribute) 42optionsmetabolite_no_data_size (options attribute) 42optionsmetabolite_scale (options attribute) 42optionsmetabolite_styles (options attribute) 42optionsnever_ask_before_quit (options attribute) 40optionsprimary_metabolite_radius (options attribute) 40optionsreaction_compare_style (options attribute) 41optionsreaction_data (options attribute) 40optionsreaction_no_data_color (options attribute) 41optionsreaction_no_data_size (options attribute) 41optionsreaction_scale (options attribute) 41optionsreaction_styles (options attribute) 41optionsscroll_behavior (options attribute) 39optionssecondary_metabolite_radius (options attribute)
40optionsshow_gene_reaction_rules (options attribute) 40optionsstarting_reaction (options attribute) 40optionsunique_map_id (options attribute) 40optionsuse_3d_transform (options attribute) 39
Rrotate_mode() (built-in function) 43
Ssave_html() (escherBuilder method) 46set_gene_data() (built-in function) 43set_metabolite_data() (built-in function) 43set_reaction_data() (built-in function) 43
51
Escher Documentation Release 143
Ttext_mode() (built-in function) 43
Vview_mode() (built-in function) 43
Zzoom_mode() (built-in function) 43
52 Index
Escher Documentation Release 143
Ttext_mode() (built-in function) 43
Vview_mode() (built-in function) 43
Zzoom_mode() (built-in function) 43
52 Index