Embed Size (px)
Citation preview

Dividend taxation and Corporate investment: A Comparative Study Between the Classical System and Imputation System of Dividend
Taxation in the United States and Australia
Bhavish Jugurnatha,*, Mark Stewarta and Robert Brooksb
aRMIT University, School of Economics and Finance, Melbourne 3000, Australia bRMIT University, Research and Development Unit, Melbourne 3000, Australia
Abstract In recent times a number of countries have initiated some important tax reforms to
eliminate the distortions of double taxation. In this context, Australia adopted a dividend
imputation system in 1987, while the US employed the 1986 Tax Reform Act (TRA).
The analysis in this paper examines the effects on the level of corporate capital
investment, on proxies for corporate tax rates, financial leverage, liquidity, capital
intensity and firm size after controlling for the tax reforms. The empirical results provide
evidence that: (1) dividend imputation as introduced in Australia is an effective way to
reduce the distortions caused by the traditional system of taxation. (2) Compared with the
TRA, dividend imputation has been better able to positively stimulate corporate capital
investment. (3) TRA effect on corporate investment is more pronounced in the US for
firms having a net operating loss. (4) Individual tax rates play a role in corporate
investment decisions in both the US and Australia.
JEL classification: E62; F21
Keywords: Corporate investment, Dividend imputation, Tax Reform Act
_____________________ Corresponding author. Tel + 61-3-9387 5980; fax 61-3-9925 5595 Email address: [email protected] We thank Heather Mitchell and Tim Fry for their very helpful suggestions.
1
1.0 Introduction Taxation of dividends raises fundamental tax policy issues. The United States
(US) is still one of the few remaining countries to employ the classical system of taxation
that fully taxes distributed corporate earnings twice, once at the corporate level, and again
at the individual level. Kari and Ylä-Liedenpohja (2002) state that classical corporation
tax regards corporations and their owners as separate tax entities and therefore double-
taxes their income, first the corporation and then the owners, on dividends and realised
capital gains. Such a tax system discriminates against the incorporation of business ideas,
restrains the supply of equity finance necessary for their economic utilisation, reallocates
resources from the corporate to the unincorporated sector and thus causes an efficiency
loss to the whole economy.
The potential misallocation of resources and the subsequent loss of efficiency
associated with the traditional corporate tax systems has been the subject of much
research. For example, Harberger (1962) demonstrates that the traditional double taxation
on corporate profits causes capital to flow out of the corporate sector, thereby artificially
reducing capital investment by corporations. This bias against capital investment in the
corporate sector in turn results in inefficient pricing and consumption of corporate
products. Gravelle (1991) indicates that these distortions can have significant
macroeconomic effects, including lower growth of GNP.
To eliminate the distortions associated with double taxation, Australia has
adopted an imputation tax system in 1987. This taxation approach works by refunding
corporate taxes through franking1 credits associated with dividend payments. Morck
(2003) recently points out that the US double taxation of corporate income continues to
affect share values and distorts savings and investment flows. In comparison to
Australia’s 1987 dividend imputation system2, the US reformed its corporate tax system
in 1986 with the Tax Reform Act (TRA). The TRA eliminated much of the preferential
treatment afforded to capital gains. This Act also contained several other provisions
which potentially could affect investment. The Investment Tax Credit (ITC) originally
1 A franking account tracks income earned by the company on which corporate tax has been paid. This is used only in an imputation system. 2 For a background discussion of Australia’s dividend imputation system, see Hamson, D., Ziegler, P. 1990. The impact of dividend imputation on firms' financial decisions. Accounting and Finance 30, 29-53.
2
enacted in 1962 was repealed, depreciation lifetimes were generally extended and to
compensate these changes the statutory tax rate was reduced. Australia, implemented
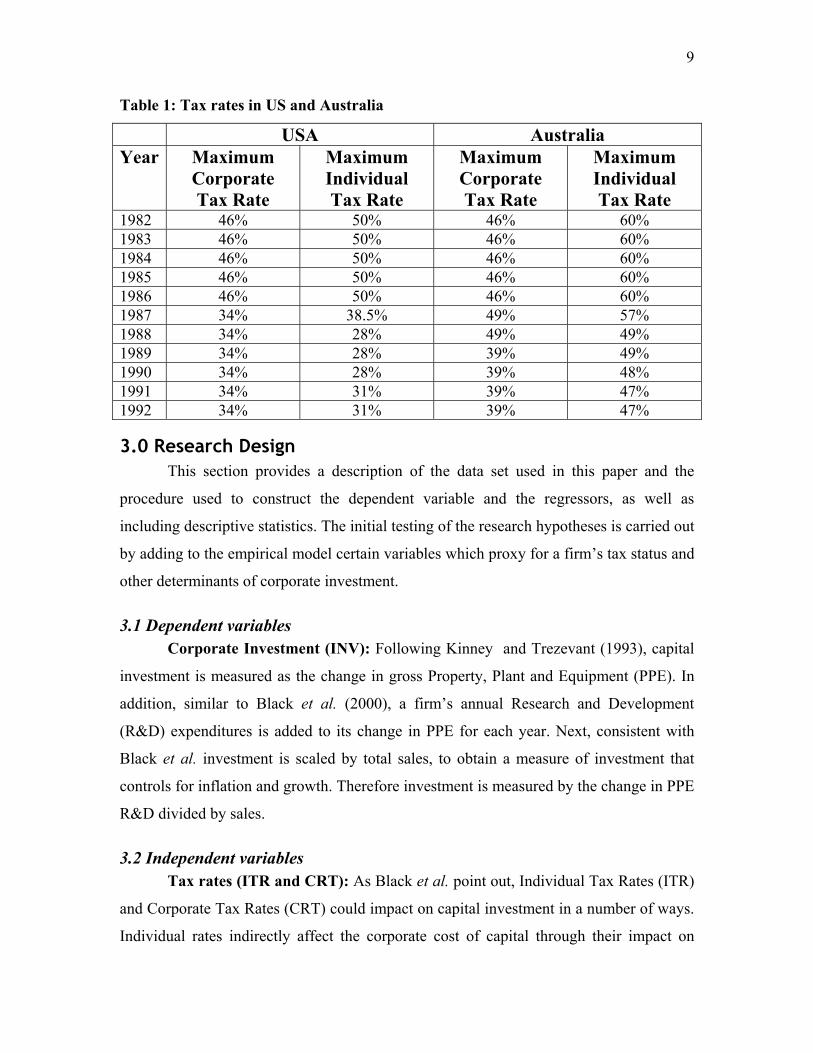
similar changes to corporate taxation within a few years of the US reforms. (Table 1
gives a detailed summary of the changes in corporate tax rates and individual tax rates in
both countries) These reforms in the US may have disrupted the strategic decision
making of investors, who frequently found themselves either racing to invest in order to
claim an investment tax credit or delaying investment so as to qualify for a credit after it
became available.
The US TRA was passed with significant, but mixed tax incentive effects on
investment. This reform is widely believed to have increased the marginal cost of new
investment to firms while in Australia the introduction of dividend imputation and the
associated tax benefit to shareholders was an attempt to stimulate corporate investment.
This combination of different dividend taxation systems (classical and imputation) and
different tax reforms (the American TRA and the Australian introduction of dividend
imputation) offers an ideal setting for this study. By treating the tax changes in these
countries as experiments in tax and investment policy, this study compares their relative
and incremental effects. Although economic conditions differed over time between these
countries, by including general economic and firm specific measures in an econometric
model, it is possible to control for the various non-tax variables that affect corporate
investment. This would enable the effects of the tax reforms to be examined in isolation.
The aim of this study is to examine and provide empirical evidence of the effects of the
US TRA and the Australian dividend imputation on corporate investment.
The remainder of the paper is organised as follows. Section two provides a review
of the theoretical and empirical literature related to dividend taxation and investment and
subsequently develops the research hypotheses. Section three presents the empirical
research design of the study. Section four reports the empirical results. Finally, section
five provides the overall conclusions of the study.
3
2.0 Literature Review
2.1 Literature related to Dividends and Investment The impact of taxes on corporate financial decisions has been the focus of much
research since Modigliani and Miller (1958). There has been a recurrent controversy in
the finance and economics literature about the interdependence of investment and
financial variables. Modigliani and Miller (1958) argued that the value of the firm
depends only on its investment policy and not on the method of financing investments.
This conclusion is the corollary of their assumption of perfect capital markets. The
opposing view would argue that capital markets are sufficiently imperfect that the firm
must consider the method of financing in its investment decisions. To this end, Dhrymes
and Kurz (1967), assuming imperfect capital markets, studied a large cross section of
American firms from 1951 to 1960. Using single equation and simultaneous equation
models, they reported substantial interdependence between investment and dividend
decisions. Dhrymes and Kurz then fitted their model as a cross-section for each of the
years from 1951 to 1960, and although the independent variables were generally
significant they did not always have the predicted sign. However, when the equations
were estimated using simultaneous equation methods, the signs of the independent
variables were fairly consistent with predictions3. Their findings led them to caution
against the use of single-equation models of investment and dividend behaviour.
Probably the most widely cited of the studies that tests the relationship between
investment and financing is Fama (1974). Fama used a sample comprising 298 US firms
over the period 1946 to 1968. Instead of using cross-section data he chose to fit his
regressions as time series for individual firms and then compared the results across firms.
Fama found that investment had the expected negative effect on dividends in about 60
3 This conclusion was supported by Mueller, D. 1967. The firm decision process: An econometric investigation. Quarterly Journal of Business and Economics, 5887. who conducted a study similar to that of Dhrymes and Kurz, even using a similar time period except that he omitted external financing and included advertising, research and development expenditures as independent variables. In general his results were similar to those of Dhrymes and Kurz. However, Higgins, R. 1972. The corporate dividend-savings decision. Journal of Financial and Quantitative Analysis 7, 1527-1541., questioned the findings of Dhrymes and Kurz with some new evidence from American companies during the period 1961 to 1965. His study concluded that dividends were a function of profit and investment but that investment did not depend on dividends. His results were consistent with the Miller and Modigliani theorem. .

4
percent of his regressions, but that dividends had the expected negative effect on
investment in only about 40 percent of his time series regressions. He concluded that this
supports the Modigliani and Miller (1958) position and that there is no evidence for the
interdependence of dividend and investment decisions. Fama (1974) suggested that the
difference in his results with those of Dhrymes and Kurz (1967) arises because they
omitted certain lagged variables, constrained the parameters of the dividend and
investment models to be equal for all firms, and chose inappropriate deflators. Fama
admits, however, that his own results may be influenced by sampling errors that obscure
the true relationship between dividends and investment. Hence the empirical evidence
must be considered inconclusive4.
2.2 Literature related to Dividend Imputation and Tax Reform Act Though the introduction of dividend imputation in numerous countries and the
TRA in the US has been the focus of many studies, research which focuses on the impact
of investment flows under both Australian imputation and the American TRA is limited.
Bellamy (1994) using Australian firm data from 1987 to 1992, examined dividend
drop-off for dividends with and without credits attached5. Bellamy, found that the
dividend drop-offs for dividends with credits attached were significantly higher than for
those without credits. That is, there was a positive and significant relationship between
the amount of the credit attached and the amount of dividends paid, implying that
corporations with tax credits increase their dividends in order to pass these credits to
shareholders. Bellamy finds support for this notion with the increase in use of dividend
reinvestment plans since the introduction of dividend imputation.
Heming (1994) also investigated the impact of dividend imputation on payout
ratios in Australia. He uses a sample of 145 firms with data for a ten year period either
4 For a detailed discussion on the literature of dividend and investment see McCabe, G. 1979. The empirical relationships between investment and financing: A new look. Journal of Financial and Quantitative Analysis 14, 119-135., McDonald, J., Jacquillet, B., Nussenbaum, M. 1975. Dividend, investment and financing decisions: Empirical evidence on french firms. Journal of Financial and Quatitative Analysis 7. and Peterson, P., Benesh, G. 1983. A re-examination of the empirical relationship between investment and financing decisions. Thr Journal of Financial and Quantitative Analysis 18, 439-453. 5 Taxation of dividends implies that the drop-off in price when a stock becomes ex-dividend should be less than the value of the dividend. Thus, the elimination of the double taxation system is expected to cause the drop-off ratio to move closer toward one

5
side the introduction of the dividend imputation system. Employing a univariate
statistical approach, Heming found statistically higher payout ratios in the post-
imputation period. However, Heming suggested that this finding is unlikely to be the
result of the imputation system since he finds no difference in the increase of the payout
ratio for firms that paid dividends with full imputation credits and those that had only
partial imputation credits. Following Heming (1994), Black, Legoria and Sellers (2000),
using firm data in Australia and New Zealand from 1982 to 1991, investigated the
impact of dividend imputation on corporate capital investment. Employing a pooled cross
section approach, Black et al. found statistically higher corporate investment in both
countries. In addition separating the firms between high-dividend paying and low-
dividend paying firms, they found that dividend imputation are more pronounced for
high-dividend paying firms. Black et al. find support for the notion that the “traditional”
double tax on corporate distribution increases the cost of equity capital to the corporate
sector and creates a bias against investment by the corporate sector.
Studies on the impact of TRA and capital flows are also limited. Abrutyn and
Turner (1990) use survey methods to analyse the impact of the TRA on dividend payouts.
The results report reactions and expectations of how CEOs thought they would respond
to the 1986 TRA6. Their results indicate that 85% of CEOs surveyed expected no change
in the dividend payout ratios as a result of the 1986 TRA. Eleven percent of CEOs
indicated their firms would pay out a higher percentage of after tax profits in the form of
dividends.
Bolster and Janjigian (1991) examined shareholder wealth effects and dividend
policy changes with respect to the 1986 TRA using a sample of 883 American firms.
High dividend yield stocks7 significantly outperformed low dividend yield stocks in the
period surrounding the passage of the 1986 TRA. Anticipation of the Act caused much of
the price adjustment to occur prior to the formal passage. Their findings indicate that
dividends increase monotically throughout the time period 1984 to 1989, with no 6 The time frame of the survey, early in 1988, coincides with the first year that the tax changes were complete. The results report reactions and expectations of how CEOs thought they would respond to the 1986 TRA. Actual responses could be completely different if investor demand appears to warrant a change in dividend payout ratios. 7 Bolster and Janjigian define dividend payout ratios as total dividends divided by total after tax earnings and examine aggregate dividend payouts, focusing only on the mean and median aggregate dividend payments.

6
significant change after the passage of 1986 TRA. Bolster and Janjigian concluded that
the existence of tax clienteles did not appear to significantly impact corporate dividend
decisions. In line with Bolster and Janjigian, Means, Charoenwong and Kang (1992)
investigated the changes in dividend yield8 patterns with the introduction of the 1986
TRA in US. The authors hypothesised that the introduction of the TRA would cause an
increase in dividend yields and a decrease in capital gains yield. Their findings indicated
that dividend yields trended downward over the period 1984 to 1986, while after 1986
dividend yields moved upwards again.
The aim of this study is to add to the previous American and Australian literature
by testing simultaneously the effect of the Australian dividend imputation and the
American TRA on corporate investment. Specifically, this study undertakes to test the
following hypotheses:
Hypothesis 1: As part of the tax reform that permitted the introduction of imputation,
Australia also introduced a capital gains tax. Prior to these changes Australia operated
under a classical taxation regime. The elimination of double taxation of corporate income
and the introduction of a capital gains tax in Australia presents a unique opportunity for
analysing the effects of a change in the taxing regime. However, the potentially
counteracting effects of dividend imputation and capital gains tax makes it difficult to
predict the directional impact on capital investment, hence two hypotheses are developed.
H1A: If the positive effects of dividend imputation exceeded the negative effects of the new capital gains tax, then the net effect of the tax reform on corporate capital investment would be positive. H1B: If the negative effects of the new capital gains tax exceeded the positive effects of dividend imputation, then the net effect of the tax reform on corporate capital investment would be negative.
Hypothesis 2: Unlike Australia, the US still operates under a classical taxation system
and as such corporate income is taxed twice. However, in 1986 the US introduced a Tax
Reform Act which repealed the investment tax credit from its original enactment in 1962.
The TRA theoretically should have negatively effected investment, as potential
8Their calculations of yearly dividends involve summing monthly dividend yields divided by the summation of monthly total yields.
7
investment projects would be required to generate higher cash flows before becoming
feasible. This leads to the second hypothesis.
H2 : The introduction of the TRA in 1986 in US had a negative impact on corporate capital investment.
To this end, the work of Heming (1994), Black et al.(2000), Bolster and Janjigian
(1991) and Means et al.(1992) is extended to a sample of American and Australian firms
operating under the TRA and dividend imputation respectively.
2.3 Other factors affecting Corporate Investment While the primary motivation of the study was to investigate the impact of
Australian imputation and American TRA on investment, it is also necessary to control
for certain non-tax determinants of corporate investment. Black et al. (2000), Callihan
(1994), Gupta and Newberry (1997b), Gilchrist and Himmelberg (1995) and Stickney
and McGee (1982), for example, have specified a number of significant non-tax factors,
which affect a firm’s investment. The most important of these variables are included in
the empirical model as follows:
• Financial Leverage; • Liquidity; • Investment; • Capital intensity; and • Firm size;
Debt to Equity Ratio (DE): Financial Leverage may also affect corporate
investment9. Gupta and Newberry (1997a) suggest that the tax deductibility of debt
would imply that there is a negative relationship between effective tax rates and the level
of leverage. In other words, differences in marginal tax rates may be driving firms’
capital investment and financing decisions. Moreover Black et al.(2000) point out, in an
efficient market it is reasonable to assume that capital is provided to firms with better
9 The relationship between financial leverage and investment is discussed fully by Lintner, J. 1956. Distribution of income of corporations among dividends, retained earnings and taxes. American Economic Review 46, 97-118., Meyer, J., Kuh, E. 1957. The investment decision: Harvard University Press. Boston. and Meyer, J., Glauber, R. 1964. Investment decisions, economic forecasting and public policy: Harvard University Press. Boston..
8
investment opportunities. Hence inclusion of DE will control for the effect of financial
leverage.
Operating Cash Flow (OPR): This is a measure of the firm’s ability to raise
funds internally to finance its capital expenditures/investments10. Gilchrist and
Himmelberg (1995) find evidence that cash flow affects a firm’s capital investment.
Thus, it can be hypothesised that a firm with higher operating cash flow will be better
able to raise capital investment.
Capital Intensity Ratio (CIR): Stickney and McGee (1982) recognise that the
existence of accelerated depreciation provisions and investment allowances meant that
the effective tax rates should be inversely related to investment in depreciable assets.
Therefore, it is expected that capital investment by firms with high capital intensity
would likely be more affected by the tax reforms than firms with relatively lower capital
intensity.
Size (SIZE): As argued by Black et al. size of the firm also affects the ability of
the firm to raise capital and investment. This is measured as the natural logarithm of total
assets.
Lagged Investment (LINV): Corporate investment can also be correlated with
investment over succeeding years. The inclusion of a lagged term of PPE is included as a
measure of capital investment for the prior year scaled by total sales to be consistent with
the dependent variable.
10 Anderson, L. 1964. Corporate finance and fixed investment: An econometric study: Division of Research, Graduate school of Business Administration, Harvard University. and Lintner, J. 1967. Corporate finance: Risk and investment, Determinants of investment behaviour. National Bureau of Economic Research: New York. provide a discussion of internal liquidity as a potential determinant of investment.
9
Table 1: Tax rates in US and Australia
USA Australia Year Maximum
Corporate Tax Rate
Maximum Individual Tax Rate
Maximum Corporate Tax Rate
Maximum Individual Tax Rate
1982 46% 50% 46% 60% 1983 46% 50% 46% 60% 1984 46% 50% 46% 60% 1985 46% 50% 46% 60% 1986 46% 50% 46% 60% 1987 34% 38.5% 49% 57% 1988 34% 28% 49% 49% 1989 34% 28% 39% 49% 1990 34% 28% 39% 48% 1991 34% 31% 39% 47% 1992 34% 31% 39% 47%
3.0 Research Design This section provides a description of the data set used in this paper and the
procedure used to construct the dependent variable and the regressors, as well as
including descriptive statistics. The initial testing of the research hypotheses is carried out
by adding to the empirical model certain variables which proxy for a firm’s tax status and
other determinants of corporate investment.
3.1 Dependent variables Corporate Investment (INV): Following Kinney and Trezevant (1993), capital
investment is measured as the change in gross Property, Plant and Equipment (PPE). In
addition, similar to Black et al. (2000), a firm’s annual Research and Development
(R&D) expenditures is added to its change in PPE for each year. Next, consistent with
Black et al. investment is scaled by total sales, to obtain a measure of investment that
controls for inflation and growth. Therefore investment is measured by the change in PPE
R&D divided by sales.
3.2 Independent variables Tax rates (ITR and CRT): As Black et al. point out, Individual Tax Rates (ITR)
and Corporate Tax Rates (CRT) could impact on capital investment in a number of ways.
Individual rates indirectly affect the corporate cost of capital through their impact on

10
required pretax rates of return. Corporate taxes clearly decrease the net after-tax cash
flows from an investment. Hence these two variables are included in the model.
Tax reform (TREF): This is a dummy variable which will indicate the effect of
the tax reform. TREF is set 0 prior to the effective date of tax reform and 1 otherwise.
Therefore, for Australian data TREF is set 0 prior to 1987 (year of the introduction of
dividend imputation in Australia) and 1 for years after 1987, while for the US, TREF is
set 0 prior to 1987(year when TRA came into effect) and 1 for years after 1987. As
discussed before a positive relationship is expected between dividend imputation and
investment while a negative relationship is expected between the TRA and corporate
investment.
Net Operating Loss (DNOL): The effects of tax rate changes on capital and
investment are likely to be conditioned on a firm’s marginal tax rate. In order to control
for firms having an operating loss which might then not have to pay any corporate tax,
firms are classified as NOL11. More specifically NOL is used as a dummy variable
whereby it is set to 1 for firms with an operating and 0 otherwise. Black et al. argue that
this is the best proxy measure for low marginal tax rates. In addition, two multiplicative
dummies are used, DNOLCRT (DNOL*CRT) controls for the two groups (NOL and
non-NOL) of firms which are differently impacted by the corporate tax rate changes and
DNOLTREF (DNOL*TREF) variable will be used to capture the effects of the tax
reform on NOL firms. A change in corporate tax rates and in the tax legislation should
not be associated with a reduction of investment. Hence there is no expected relationship.
3.3 Data The sample of firms is from the Datastream International Ltd (2000) Company
Accounts Database (DICA). Annual cross section data from 1982 to 1992 is used. To
generate the variables included in the model, information was taken from the DICA
balance sheets and profit and loss accounts relative to five years before and after the
respective tax reforms. This resulted in a total of 82 firms in USA and 67 firms in
Australia. Initially data for 1987 was omitted as it was a transition year for the 1986 TRA
in US and the introduction of dividend imputation in Australia. Many companies may
11 Similar to Black et al.(2000) a firm is classified as NOL if it reported an operating loss during the previous year, the current year or the following year.
11
have changed policies dramatically in this year in anticipation of the changes in the tax
law. By removing this year from the sample, any distortions created by these fluctuations
are eliminated from the empirical results.12 Moreover, only firms that survived for the
entire period of analysis (1982 to 1992) and have data in each year in the 5-year pre tax
reform period (1982 to 1986) and the 5-year post tax reform period (1988 to 1992) were
chosen. If there were missing observations the variables were deleted. This results in a
potential survivorship bias. A further problem with the data selection technique is that it
resulted a small sample size of 35 firms and 374 observations for the US and 28 firms
and 308 observations for Australia. However, this is not inconsistent with previous
research. In his seminal paper on dividend behaviour, Lintner (1956) uses a sample of 28
US firms from 1947 to 1953 period, with 196 firm-year observations. Lintner, does point
out, his research cannot be used to draw statistical conclusions and as such cannot be
generalised.
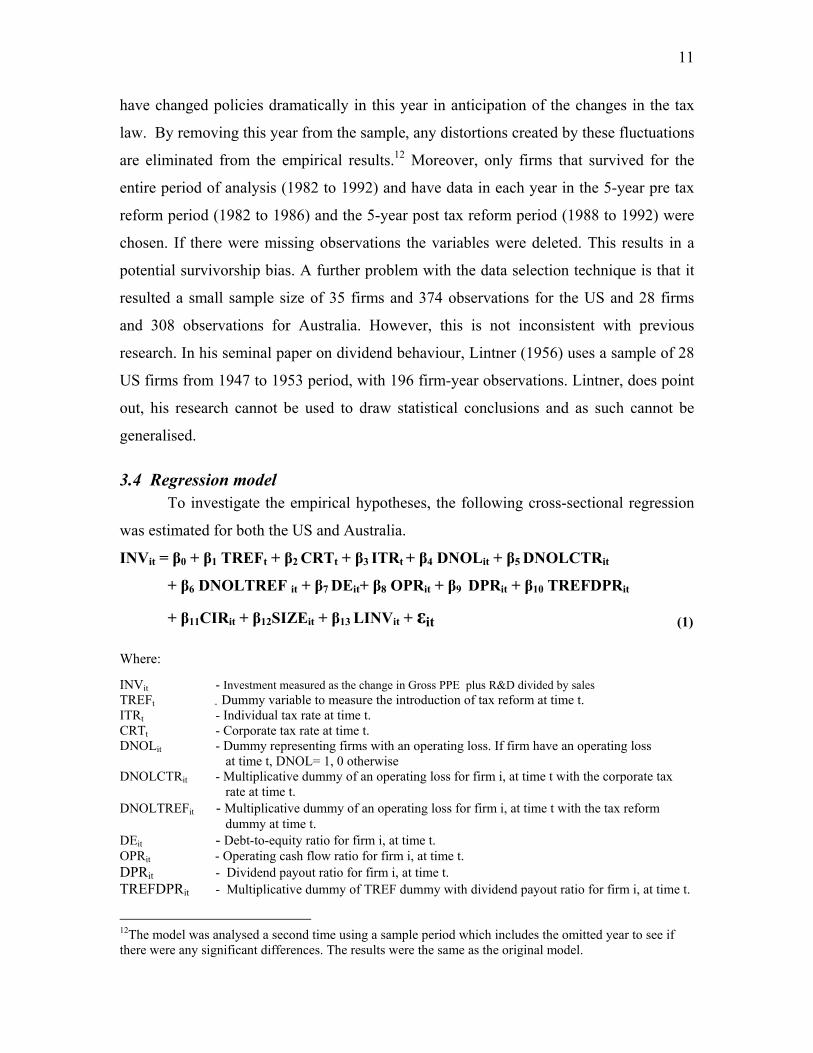
3.4 Regression model To investigate the empirical hypotheses, the following cross-sectional regression
was estimated for both the US and Australia.
INVit = β0 + β1 TREFt + β2 CRTt + β3 ITRt + β4 DNOLit + β5 DNOLCTRit
+ β6 DNOLTREF it + β7 DEit+ β8 OPRit + β9 DPRit + β10 TREFDPRit
+ β11CIRit + β12SIZEit + β13 LINVit + εit (1)
Where: INVit - Investment measured as the change in Gross PPE plus R&D divided by sales TREFt - Dummy variable to measure the introduction of tax reform at time t. ITRt - Individual tax rate at time t. CRTt - Corporate tax rate at time t. DNOLit - Dummy representing firms with an operating loss. If firm have an operating loss at time t, DNOL= 1, 0 otherwise DNOLCTRit - Multiplicative dummy of an operating loss for firm i, at time t with the corporate tax rate at time t. DNOLTREFit - Multiplicative dummy of an operating loss for firm i, at time t with the tax reform dummy at time t. DEit - Debt-to-equity ratio for firm i, at time t. OPRit - Operating cash flow ratio for firm i, at time t. DPRit - Dividend payout ratio for firm i, at time t. TREFDPRit - Multiplicative dummy of TREF dummy with dividend payout ratio for firm i, at time t.
12The model was analysed a second time using a sample period which includes the omitted year to see if there were any significant differences. The results were the same as the original model.

12
CIRit - Capital intensity ratio for firm i, at time t. SIZEit - Measure for size of firm i, as the natural log of total assets at time t. LINVit - Lagged measure of investment for firm i, at time t.
4.0 Results
4.1 Descriptive statistics Table 2 reports the descriptive statistics associated with the dependent variable
and the independent variables for the regression model. Of particular relevance the mean
of Corporate Investment (INV), Operating Cash Flow (OPR) and Capital Intensity Ratio
(CIR) were higher in Australia while Debt to Equity ratio (DE) was higher in the US.
Table 2: Descriptve Statistics of Regression variables
USA INV? DNOL? DE? OPR? DPR? CIR? SIZE? LINV? PPE? RD? Mean 0.103 0.094 0.353 0.025 0.270 0.276 4.649 0.103 448.403 76.398 Median 0.059 0.000 0.213 0.072 0.300 0.269 4.448 0.059 38.493 19.359 Std. Dev. 0.273 0.292 1.943 0.348 1.999 0.132 1.594 0.273 1335.860 170.365 Observations 374 374 374 374 374 374 374 374 374 374 Australia INV? DNOL? DE? OPR? DPR? CIR? SIZE? LINV? PPE? RD? Mean 1.227 0.101 0.347 0.121 0.489 0.391 6.549 0.834 919.978 4.770 Median 0.119 0.000 0.265 0.093 0.520 0.329 6.468 0.080 150.975 0.728 Std. Dev. 3.476 0.301 0.352 0.165 0.602 0.686 1.341 3.087 2061.727 19.038 Observations 308 308 308 308 308 308 308 308 308 308
Table 3 provides a Pairwise correlation analysis of the variables being used in the
regression model to check for any correlations which could affect the result of this study.
Based on the table results, it is unlikely that multicollinearity will be an issue in the
regression analysis. Of particular relevance is the high negative correlation between
TREF which measures the effect of tax reform with the corporate income tax rate and the
individual tax rate. However the non-inclusion of these variables will make it difficult to
distinguish between the tax reform and the statutory tax rate changes which occurred
concurrently. For the other variables there do not appear to be significant partial
correlations.

13
Table 3: Pairwise Correlation Analysis USA
Australia
INV TREF DNOL CRT ITR DE OPR DPR CIR SIZE LINV
INV 1
TREF -0.02121 1
DNOL 0.246788 0.102974 1
CRT 0.021215 -1 -0.10297 1
ITR 0.037046 -0.96136 -0.10253 0.961359 1
DE -0.01867 0.043066 -0.07697 -0.04307 -0.06008 1
OPR -0.76426 0.03585 -0.36818 -0.03585 -0.05288 0.038359 1
DPR -0.00393 -0.03664 -0.00148 0.036637 0.027807 0.028815 0.003211 1
CIR -0.08109 -0.01163 0.014233 0.011634 0.012578 -0.02665 0.103066 0.020422 1
SIZE -0.05784 0.087137 0.020294 -0.08714 -0.09074 -0.00491 0.022644 0.038078 -0.14295 1
LINV 0.646854 0.033918 0.253154 -0.03392 -0.02819 -0.05428 -0.47184 -0.00595 -0.07551 -0.03641 1
INV TREF DNOL CRT ITR DE OPR DPR CIR SIZE LINV
INV 1
TREF 0.323634 1
DNOL 0.026628 0.199257 1
CRT -0.32363 -1 -0.19926 1
ITR -0.3345 -0.99504 -0.18885 0.995044 1
DE 0.077919 0.074385 -0.07491 -0.07439 -0.07619 1
OPR -0.01747 -0.0424 -0.08109 0.042401 0.040853 -0.07667 1
DPR 0.064041 -0.00319 0.071132 0.003186 0.003993 -0.03092 0.045246 1
CIR -0.02619 -0.07829 -0.04579 0.078293 0.082201 -0.05558 -0.07214 0.006499 1
SIZE 0.038194 0.276647 -0.0445 -0.27665 -0.27301 0.017076 0.130956 -0.00933 -0.08403 1
LINV -0.0093 0.149774 0.057988 -0.14977 -0.14022 -0.07782 0.08048 0.038486 -0.06699 0.101184 1
14
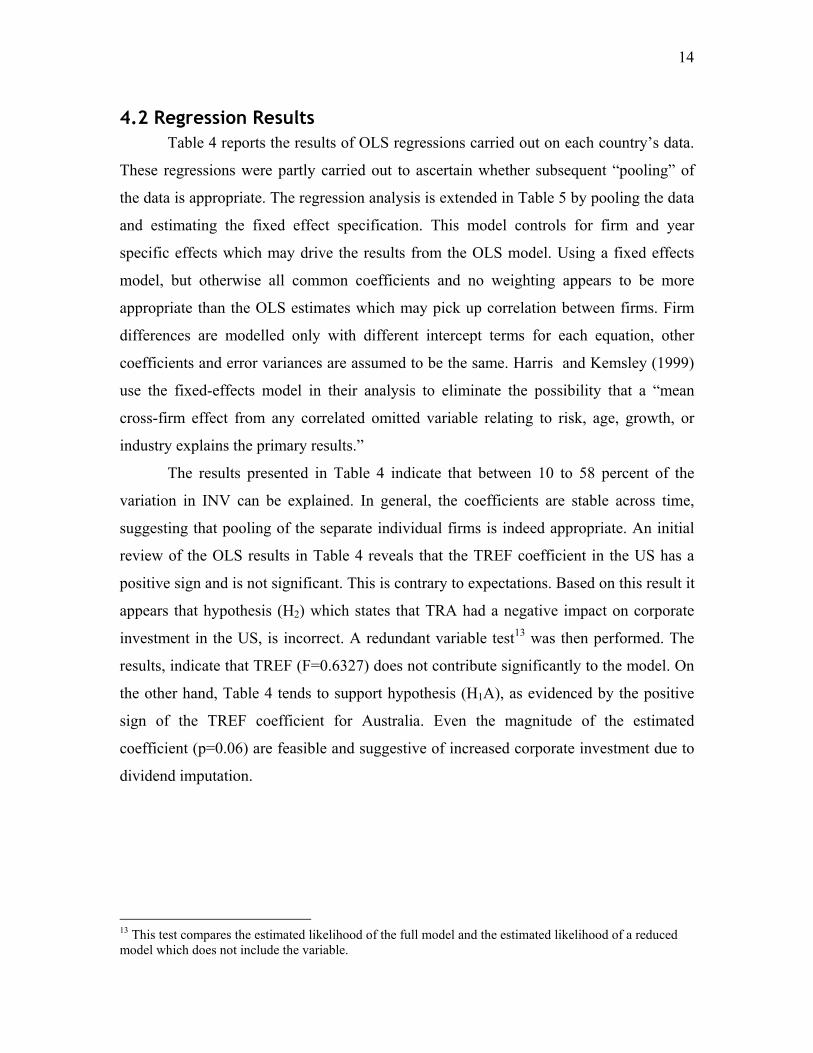
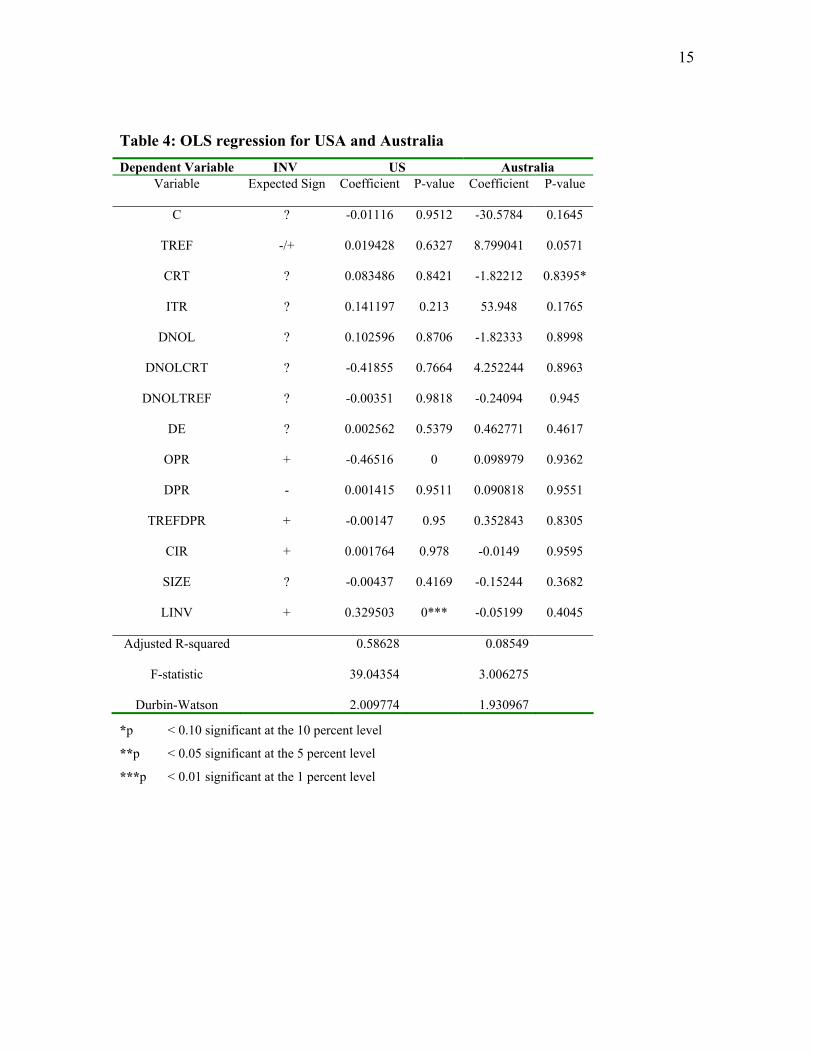
4.2 Regression Results Table 4 reports the results of OLS regressions carried out on each country’s data.
These regressions were partly carried out to ascertain whether subsequent “pooling” of
the data is appropriate. The regression analysis is extended in Table 5 by pooling the data
and estimating the fixed effect specification. This model controls for firm and year
specific effects which may drive the results from the OLS model. Using a fixed effects
model, but otherwise all common coefficients and no weighting appears to be more
appropriate than the OLS estimates which may pick up correlation between firms. Firm
differences are modelled only with different intercept terms for each equation, other
coefficients and error variances are assumed to be the same. Harris and Kemsley (1999)
use the fixed-effects model in their analysis to eliminate the possibility that a “mean
cross-firm effect from any correlated omitted variable relating to risk, age, growth, or
industry explains the primary results.”
The results presented in Table 4 indicate that between 10 to 58 percent of the
variation in INV can be explained. In general, the coefficients are stable across time,
suggesting that pooling of the separate individual firms is indeed appropriate. An initial
review of the OLS results in Table 4 reveals that the TREF coefficient in the US has a
positive sign and is not significant. This is contrary to expectations. Based on this result it
appears that hypothesis (H2) which states that TRA had a negative impact on corporate
investment in the US, is incorrect. A redundant variable test13 was then performed. The
results, indicate that TREF (F=0.6327) does not contribute significantly to the model. On
the other hand, Table 4 tends to support hypothesis (H1A), as evidenced by the positive
sign of the TREF coefficient for Australia. Even the magnitude of the estimated
coefficient (p=0.06) are feasible and suggestive of increased corporate investment due to
dividend imputation.
13 This test compares the estimated likelihood of the full model and the estimated likelihood of a reduced model which does not include the variable.
15
Table 4: OLS regression for USA and Australia Dependent Variable INV US Australia
Variable Expected Sign Coefficient P-value Coefficient P-value
C ? -0.01116 0.9512 -30.5784 0.1645
TREF -/+ 0.019428 0.6327 8.799041 0.0571
CRT ? 0.083486 0.8421 -1.82212 0.8395*
ITR ? 0.141197 0.213 53.948 0.1765
DNOL ? 0.102596 0.8706 -1.82333 0.8998
DNOLCRT ? -0.41855 0.7664 4.252244 0.8963
DNOLTREF ? -0.00351 0.9818 -0.24094 0.945
DE ? 0.002562 0.5379 0.462771 0.4617
OPR + -0.46516 0 0.098979 0.9362
DPR - 0.001415 0.9511 0.090818 0.9551
TREFDPR + -0.00147 0.95 0.352843 0.8305
CIR + 0.001764 0.978 -0.0149 0.9595
SIZE ? -0.00437 0.4169 -0.15244 0.3682
LINV + 0.329503 0*** -0.05199 0.4045
Adjusted R-squared 0.58628 0.08549
F-statistic 39.04354 3.006275
Durbin-Watson 2.009774 1.930967
*p < 0.10 significant at the 10 percent level
**p < 0.05 significant at the 5 percent level
***p < 0.01 significant at the 1 percent level

16
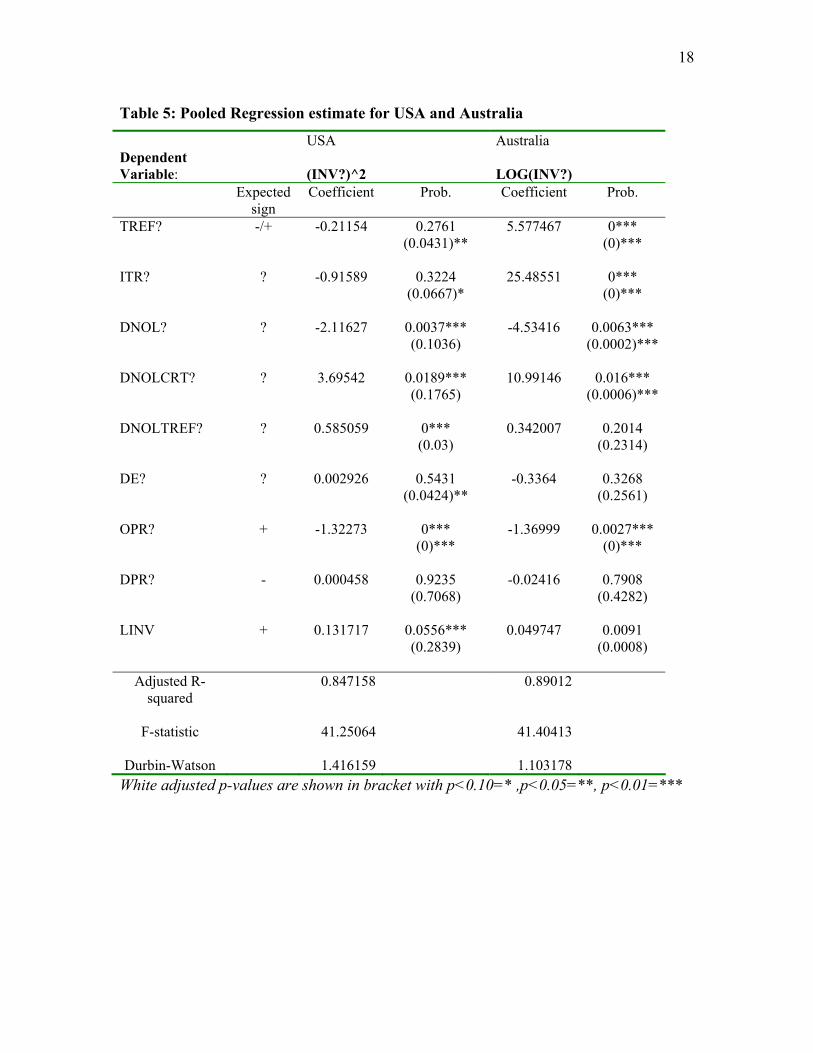
The fixed-effect estimates as presented in Table 514 indicates the model is
significant for both the US (F=41.25) and Australia (F=41.40), suggesting that this is the
more appropriate model. For the US the equation has an explanatory power (adjusted R2)
of 84.7%, while for Australia it has an explanatory power (adjusted R2) of 89.01%. This
implies that the models were adequately specified. The Durbin-Watson statistic is 1.41
for the US and 1.10 for Australia. The low DW value for the US may be a result of the
nature of cross-sectional estimates, which may pick up correlation between firms. It may
be realistic to expect different error variances for the different cross-sections. For
example, Greene (2000) notes that for a cross- country comparison there may be variation
in the scales of the variables in the model. Visual inspections of the residuals consistent
with White (1980) and Breusch and Pagan (1979) indicates that heteroskedasticity is
present. Consequently, the numbers in parentheses in Table 4 are White (1980) adjusted
values.
6.3 Regression Results for US The US 1986 tax reform mainly consisted of the repeal of the tax credit, repeal of
the preferential treatment afforded to capital gains and the extension of depreciation
allowances. The negative coefficient of TREF (-0.2115) observed from the regression
results is consistent with what was hypothesised (hypothesis 2). Theoretically it was
expected that these changes in the 1986 tax reform will have a negative impact on
corporate investment. This coefficient was significant indicating that it did have a major
effect on corporate investment from the other variables of primary interest in this study
CRT and ITR, measuring the corporate tax rate and the individual tax rate changes
respectively, which both occurred in the US at the same time as when the 1986 tax
reform was implemented, only ITR was significant. This indicates that the decrease of
ITR at the same time the 1986 tax reform was implemented had a negative impact on
corporate investment. CRT was found not to have any statistical significance on
corporate investment.
14 Originally, the models also included a CRT, TREFDPR, CIR and SIZE variables. The increase in the adjusted R2 for the model which includes these variables shows only a .01 percent increase for the US and only a .04 percent increase for Australia. A redundant variables test reveals that these variables had no statistical significance. Therefore, the final model did not include these variables.
17
The variable DNOL which measures the impact on NOL firms was negative and
significant. This shows that NOL (earning status) firms were negatively related to current
corporate investment in US. However, the variables DNOLCRT and DNOLTREF which
measures the effect of the tax reform and the change in corporate tax rates respectively on
firms having an operating loss in a particular year is positive and significant. This
indicates that the tax reform and corporate tax rates decrease had a positive impact on
corporate investment for NOL firms. With inference to this result it can be deduced that
the 1986 tax reform has resulted in a lower marginal tax rate for NOL firms.
6.4 Regression Results for Australia The Australian dividend tax reform mainly consisted of the elimination of double
taxation. Essentially, the Australian imputation system operates by allowing income tax
paid at the corporate level to be passed to shareholders in the form of imputation credits.
It was hypothesised (hypothesis H1A) that if the positive effects of dividend imputation
on shareholder returns exceeded the negative effects of capital gain taxes on shareholder
returns, corporate capital investment in Australia would increase after the tax reform. The
result supports this hypothesis with TREF having a positive coefficient and is significant
at the one percent level. For the other variables of interest in this study CRT and ITR,
similar to the US only ITR was positive and significant while CRT did not have any
statistical significance in measuring corporate investment. DNOL and DNOLCRT were
significant while DNOLTREF was insignificant in Australia. This indicates that dividend
imputation had a negative impact on corporate investment while the decrease in corporate
tax rates had a positive impact on corporate investment for NOL firms. Hence it can be
inferred from these results that the introduction of dividend imputation in Australia had
an overall positive impact on corporate investment.
18
Table 5: Pooled Regression estimate for USA and Australia
Dependent Variable:
USA (INV?)^2
Australia LOG(INV?)
Expected sign
Coefficient Prob. Coefficient Prob.
TREF? -/+ -0.21154 0.2761 5.577467 0*** (0.0431)** (0)*** ITR? ? -0.91589 0.3224 25.48551 0*** (0.0667)* (0)*** DNOL? ? -2.11627 0.0037*** -4.53416 0.0063*** (0.1036) (0.0002)*** DNOLCRT? ? 3.69542 0.0189*** 10.99146 0.016*** (0.1765) (0.0006)*** DNOLTREF? ? 0.585059 0*** 0.342007 0.2014 (0.03) (0.2314) DE? ? 0.002926 0.5431 -0.3364 0.3268 (0.0424)** (0.2561) OPR? + -1.32273 0*** -1.36999 0.0027*** (0)*** (0)*** DPR? - 0.000458 0.9235 -0.02416 0.7908 (0.7068) (0.4282) LINV + 0.131717 0.0556*** 0.049747 0.0091 (0.2839) (0.0008)
Adjusted R-squared
0.847158 0.89012
F-statistic 41.25064 41.40413
Durbin-Watson 1.416159 1.103178
White adjusted p-values are shown in bracket with p<0.10=* ,p<0.05=**, p<0.01=***
19
6.5 Regression result for Control variables As for the control variables, OPR which measures the operating cash flow ratio
has a significant and negative impact on investment in both US and Australia. Similarly
LINV which is a measure of the lag term of capital investment is significant and
positively related to current capital investment in both the US and Australia. Finally DE
which measures the debt to equity ratio was positive and significant in the US only. This
provides some evidence that financial leverage influences corporate capital investment in
the US.
7.0 Summary and Concluding remarks This paper has conducted an empirical investigation of the effects of tax reform
on corporate investment in the US and Australia. The Tax Reform Act of 1986 in the US
and dividend imputation in Australia affects the tax regime in which corporations operate
and provide a rich testing ground for the impact of tax reforms on corporate investment.
This paper also examines the determinants of corporate investment changes surrounding
the enactment of the TRA act and dividend imputation. Some non-tax control variables
that might affect corporate investment are also analysed. This increases the power of the
regression tests, leading to more conclusive results. Most of the same variables were
included in the final model of the US and Australia. Finally, the results provide support
for both hypotheses tested.
Specifically, the findings of this paper support the assertions of Black et al.
(2000), Harberger (1962) and Morck (2003) that dividend imputation as introduced in
Australia was an effective way to reduce the distortions caused by the traditional system
of double taxation as currently in place in the US. The results provide evidence that the
introduction of the TRA had a negative impact on corporate investment. Futhermore, this
paper provides evidence that individual taxes play a significant role in corporate
investment decisions in both the US and Australia. Based on these results it can be
inferred that both the 1986 TRA and the dividend imputation do have an effect on
corporate capital investment.
20
References Abrutyn, S., Turner, R. 1990. Taxes and firms' dividend policies: Survey results. National
Tax Journal 43, 491-496. Anderson, L. 1964. Corporate finance and fixed investment: An econometric study:
Division of Research, Graduate school of Business Administration, Harvard University.
Bellamy, D. 1994. Evidence of imputation clienteles in the australian equity market. Asia Pacific Journal of Management 11, 275-287.
Black, E., Legoria, J., Sellers, K. 2000. Capital investment effects of dividend imputation. Journal of The American Taxation Association 22, 40-59.
Bolster, P., Janjigian, V. 1991. Dividend policy and valuation effects of the tax reform act of 1986. National Tax Journal, 511-518.
Breusch, T., Pagan, A. 1979. A simplest test for heteroskedaticity. Econometricia, 1287-1294.
Callihan, D. 1994. Corporate effective tax rates: A synthesis of the literature. Journal of Accounting Literature 13, 1-43.
Datastream International Ltd. 2000. Datastream advance version 3.5. London. Dhrymes, P., Kurz, M. 1967. Investments, dividends and external finance behaviour of
firms. In R. Ferber (Ed.), Determinants of investment behaviour. Columbia University Press: New York.
Fama, E. 1974. The empirical relationships between the dividend and investment decisions of firms. American Economic Review 64, 304-318.
Gilchrist, S., Himmelberg, C. 1995. Evidence on the role of cash flow for investment. Journal of Monetary Economics 36, 541-572.
Gravelle, G. 1991. Corporate tax integration: Issues and options,. Congressional research services report for congress: Washington D.C.
Greene, W. 2000. Econometric analysis (4 ed.): Prentice Hall. Gupta, S., Newberry, K. 1997a. Determinants of the variability in corporate effective tax
rates: Evidence from longitudinal data. Journal of Accounting and Public Policy 16, 1-34.
Gupta, S., Newberry, K. 1997b. Determinants of the variability in corporate effective tax rates: Evidence from longitudinal data. Journal of Accounting and Public Policy 16, 1-34.
Hamson, D., Ziegler, P. 1990. The impact of dividend imputation on firms' financial decisions. Accounting and Finance 30, 29-53.
Harberger, A. 1962. The incidence of corporate income tax. Journal of political economy 70, 215-240.
Harris, T., Kemsley, D. 1999. Dividend taxation in firm valuation: New evidence. Journal of Accounting Research 37, 275-291.
Heming, T. 1994. The effect of dividend imputation on the payout ratios of australian companies. Australian Tax Forum 11, 203-227.
Higgins, R. 1972. The corporate dividend-savings decision. Journal of Financial and Quantitative Analysis 7, 1527-1541.

21
Kari, S., Ylä-Liedenpohja, J. 2002. Classical corporation tax as a global means of tax harmonization. University of Munich Centre for Economic Studies and the IFO Institute for Economic Research 665.
Kinney, M., Trezevant, R. 1993. Taxes and the timing of corporate capital expenditures. Journal of American Taxation Association 15.
Lintner, J. 1956. Distribution of income of corporations among dividends, retained earnings and taxes. American Economic Review 46, 97-118.
Lintner, J. 1967. Corporate finance: Risk and investment, Determinants of investment behaviour. National Bureau of Economic Research: New York.
McCabe, G. 1979. The empirical relationships between investment and financing: A new look. Journal of Financial and Quantitative Analysis 14, 119-135.
McDonald, J., Jacquillet, B., Nussenbaum, M. 1975. Dividend, investment and financing decisions: Empirical evidence on french firms. Journal of Financial and Quatitative Analysis 7.
Means, D., Charoenwong, C., Kang, Y. 1992. Changing dividend policies caused by the tax reform act of 1986: An empirical analysis. Journal of Economics and Finance 16, 153-160.
Meyer, J., Glauber, R. 1964. Investment decisions, economic forecasting and public policy: Harvard University Press. Boston.
Meyer, J., Kuh, E. 1957. The investment decision: Harvard University Press. Boston. Modigliani, F., Miller, M. 1958. The cost of capital, corporate finance and theory
investment. American Economic Review 261-297. Morck, R. 2003. Why some double taxation might make sense: The special case of inter-
corporate dividends. Working Paper Series National Bureau of Economic Research 9651.
Mueller, D. 1967. The firm decision process: An econometric investigation. Quarterly Journal of Business and Economics, 5887.
Peterson, P., Benesh, G. 1983. A re-examination of the empirical relationship between investment and financing decisions. Thr Journal of Financial and Quantitative Analysis 18, 439-453.
Stickney, C., McGee, V. 1982. Effective corporate tax rates: The effect of size, capital intensity, leverage, and other factors. Journal of Accounting and Public Policy 1, 125-152.
White, H. 1980. A heteroskedasticity-consistent covariance matrix estimator and a direct test of heteroskedasticity. Econometricia 48, 817-838.