Embed Size (px)
Citation preview
Page
Operating performance improves on strong revenue growth; guidance confirmed Andreas Treichl, CEO Erste Group Gernot Mittendorfer, CFO Erste Group Willibald Cernko, CRO Erste Group
3 May 2019
Erste Group investor presentation Q1 19 results (unaudited)
Page
Disclaimer – Cautionary note regarding forward-looking statements
2
• THE INFORMATION CONTAINED IN THIS DOCUMENT HAS NOT BEEN INDEPENDENTLY VERIFIED AND NO REPRESENTATION OR WARRANTY EXPRESSED OR IMPLIED IS MADE AS TO, AND NO RELIANCE SHOULD BE PLACED ON, THE FAIRNESS, ACCURACY, COMPLETENESS OR CORRECTNESS OF THIS INFORMATION OR OPINIONS CONTAINED HEREIN.
• CERTAIN STATEMENTS CONTAINED IN THIS DOCUMENT MAY BE STATEMENTS OF FUTURE EXPECTATIONS AND OTHER FORWARD-LOOKING STATEMENTS THAT ARE BASED ON MANAGEMENT’S CURRENT VIEWS AND ASSUMPTIONS AND INVOLVE KNOWN AND UNKNOWN RISKS AND UNCERTAINTIES THAT COULD CAUSE ACTUAL RESULTS, PERFORMANCE OR EVENTS TO DIFFER MATERIALLY FROM THOSE EXPRESSED OR IMPLIED IN SUCH STATEMENTS.
• NONE OF ERSTE GROUP OR ANY OF ITS AFFILIATES, ADVISORS OR REPRESENTATIVES SHALL HAVE ANY LIABILITY WHATSOEVER (IN NEGLIGENCE OR OTHERWISE) FOR ANY LOSS HOWSOEVER ARISING FROM ANY USE OF THIS DOCUMENT OR ITS CONTENT OR OTHERWISE ARISING IN CONNECTION WITH THIS DOCUMENT.
• THIS DOCUMENT DOES NOT CONSTITUTE AN OFFER OR INVITATION TO PURCHASE OR SUBSCRIBE FOR ANY SHARES AND NEITHER IT NOR ANY PART OF IT SHALL FORM THE BASIS OF OR BE RELIED UPON IN CONNECTION WITH ANY CONTRACT OR COMMITMENT WHATSOEVER.

Page
Presentation topics
3
• Executive summary • Business environment • Business performance • Assets and liabilities • Outlook • Additional information
Page
Executive summary – Group income statement performance
QoQ net profit reconciliation (EUR m)
YoY net profit reconciliation (EUR m)
4
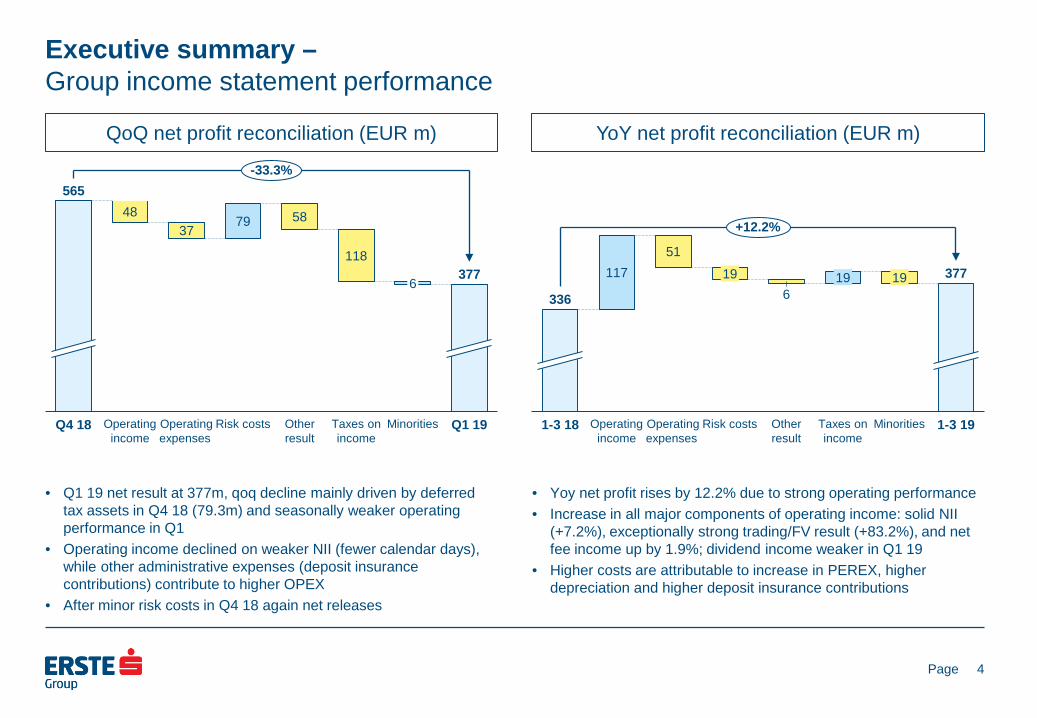
• Q1 19 net result at 377m, qoq decline mainly driven by deferred tax assets in Q4 18 (79.3m) and seasonally weaker operating performance in Q1
• Operating income declined on weaker NII (fewer calendar days), while other administrative expenses (deposit insurance contributions) contribute to higher OPEX
• After minor risk costs in Q4 18 again net releases
• Yoy net profit rises by 12.2% due to strong operating performance • Increase in all major components of operating income: solid NII
(+7.2%), exceptionally strong trading/FV result (+83.2%), and net fee income up by 1.9%; dividend income weaker in Q1 19
• Higher costs are attributable to increase in PEREX, higher depreciation and higher deposit insurance contributions
48 37
79 58
118
Q4 18 Taxes on income
Operating income
Operating expenses
Risk costs Other result
6
Minorities
377
Q1 19
565 -33.3%
117 51
6
1-3 18 Operating income
Operating expenses
19
Risk costs Other result
19
Taxes on income
19
Minorities 1-3 19
336
377
+12.2%
Page
Executive summary – Key income statement data
Net interest income & margin
5
Operating result & cost/income ratio Cost of risk
Banking levies
Reported EPS & ROE
Return on tangible equity
590 656
1-3 18 1-3 19
+11.2%
43
-36
0.12% 0.01%
Q4 18 Q1 19 -54
-36
1-3 18 1-3 19
741 656
59.3% 63.0%
Q4 18 Q1 19
1,210 1,161
2.33% 2.18%
Q4 18 Q1 19
24 39
Q4 18 Q1 19
39 39
1-3 18 1-3 19
0.79 0.88
10.5% 11.1%
1-3 18 1-3 19
1.23 0.88
16.0% 11.1%
Q4 18 Q1 19
1,083 1,161
2.27% 2.18%
1-3 18 1-3 19
in EUR m
in EUR m
in EUR m in EUR m
in EUR
12.5%
1-3 18 1-3 19
12.0%
Q4 18 Q1 19
12.5%
18.1%
Page
Executive summary – Group balance sheet performance
YTD total asset reconciliation (EUR m)
YTD equity & total liability reconciliation (EUR m)
6
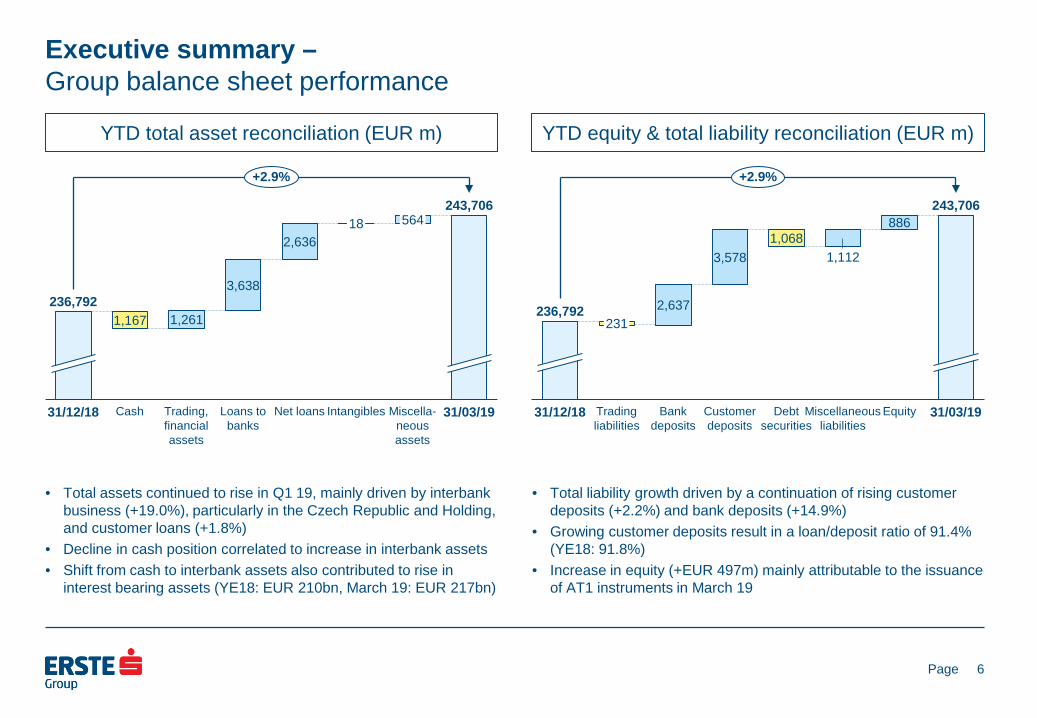
• Total assets continued to rise in Q1 19, mainly driven by interbank business (+19.0%), particularly in the Czech Republic and Holding, and customer loans (+1.8%)
• Decline in cash position correlated to increase in interbank assets • Shift from cash to interbank assets also contributed to rise in
interest bearing assets (YE18: EUR 210bn, March 19: EUR 217bn)
• Total liability growth driven by a continuation of rising customer deposits (+2.2%) and bank deposits (+14.9%)
• Growing customer deposits result in a loan/deposit ratio of 91.4% (YE18: 91.8%)
• Increase in equity (+EUR 497m) mainly attributable to the issuance of AT1 instruments in March 19
1,167 1,261
3,638
2,636
236,792
31/12/18 Cash
243,706
Miscella-neous assets
18
Trading, financial assets
Loans to banks
Net loans Intangibles
564
31/03/19
+2.9%
2,637
3,578 1,068
1,112
886
231
Miscellaneous liabilities
236,792
31/12/18 Trading liabilities
Bank deposits
Customer deposits
Debt securities
Equity 31/03/19
243,706
+2.9%
Page
Executive summary – Key balance sheet data
Loan/deposit & loan/TA ratio
7
Net loans & credit RWA NPL coverage ratio & NPL ratio
B3FL capital ratios
B3FL capital & tangible equity1
Liquidity coverage & leverage ratio2
149.3
95.9
152.0
99.6
Net loans Credit RWA
+1.8%
31/12/18 31/03/19
3.2% 3.0%
73.4%
NPL coverage NPL ratio
74.5% 91.8%
63.1%
91.4%
62.4%
Loan/deposit ratio Loans/total assets
15.5
12.2
CET 1 Tangible equity
15.5
11.9 18.1%
13.5%
18.2%
13.2%
CET 1 Total capital
1) Based on shareholders’ equity, not total equity
6.6% 6.6%
150.3%
LCR LR (B3FL)
150.9%
in EUR bn
in EUR bn
2) Pursuant to Delegated Act

Page
Presentation topics
8
• Executive summary • Business environment • Business performance • Assets and liabilities • Outlook • Additional information
Page
Business environment – Economic outlook remains strong for 2019-2020
Real GDP growth (in %)
9
Dom. demand contribution* (in %) Net export contribution* (in %)
Unemployment rate (avg, in %)
Current account balance (% of GDP)
Gen gov balance (% of GDP)
Consumer price inflation (avg, in %)
Public debt (% of GDP)
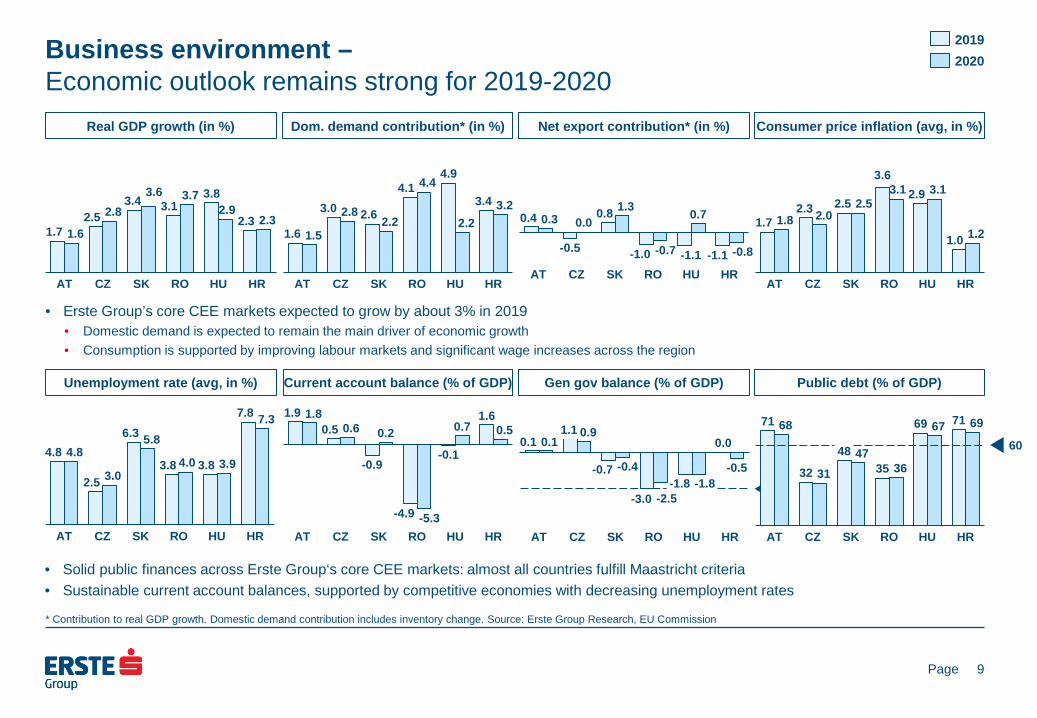
• Erste Group’s core CEE markets expected to grow by about 3% in 2019 • Domestic demand is expected to remain the main driver of economic growth • Consumption is supported by improving labour markets and significant wage increases across the region
• Solid public finances across Erste Group‘s core CEE markets: almost all countries fulfill Maastricht criteria • Sustainable current account balances, supported by competitive economies with decreasing unemployment rates
1.6
3.0 2.6
4.1 4.9
3.4
1.5
2.8 2.2
4.4
2.2 3.2
HR AT CZ RO SK HU
2020 2019
1.7 2.5
3.4 3.1 3.8
2.3 1.6
2.8 3.6 3.7
2.9 2.3
CZ AT SK RO HU HR
1.7 2.3 2.5
3.6 2.9
1.0 1.8 2.0
2.5 3.1 3.1
1.2
HU SK AT CZ RO HR
4.8
2.5
6.3
3.8 3.8
7.8
4.8
3.0
5.8
4.0 3.9
7.3
CZ AT RO SK HU HR
1.9 0.5
-0.9
-4.9
-0.1
1.6 1.8 0.6 0.2
-5.3
0.7 0.5
CZ AT HR HU SK RO
0.1 1.1
-0.7
-3.0 -1.8
0.1 0.9
-0.4
-2.5 -1.8
-0.5
HU AT
-3
RO CZ SK HR
0.0
71
32
48 35
69 71 68
31 47
36
67 69
AT CZ SK RO
60
HU HR
* Contribution to real GDP growth. Domestic demand contribution includes inventory change. Source: Erste Group Research, EU Commission
0.4
-0.5
0.8
-1.0 -1.1 -1.1
0.3 1.3
-0.7
0.7
-0.8
0.0
RO SK AT CZ HU HR
Page
Business environment – CZ has increased key policy rate in eight steps to 2.0% since August 2017
Austria
10
Czech Republic Romania
Slovakia
Hungary
Croatia
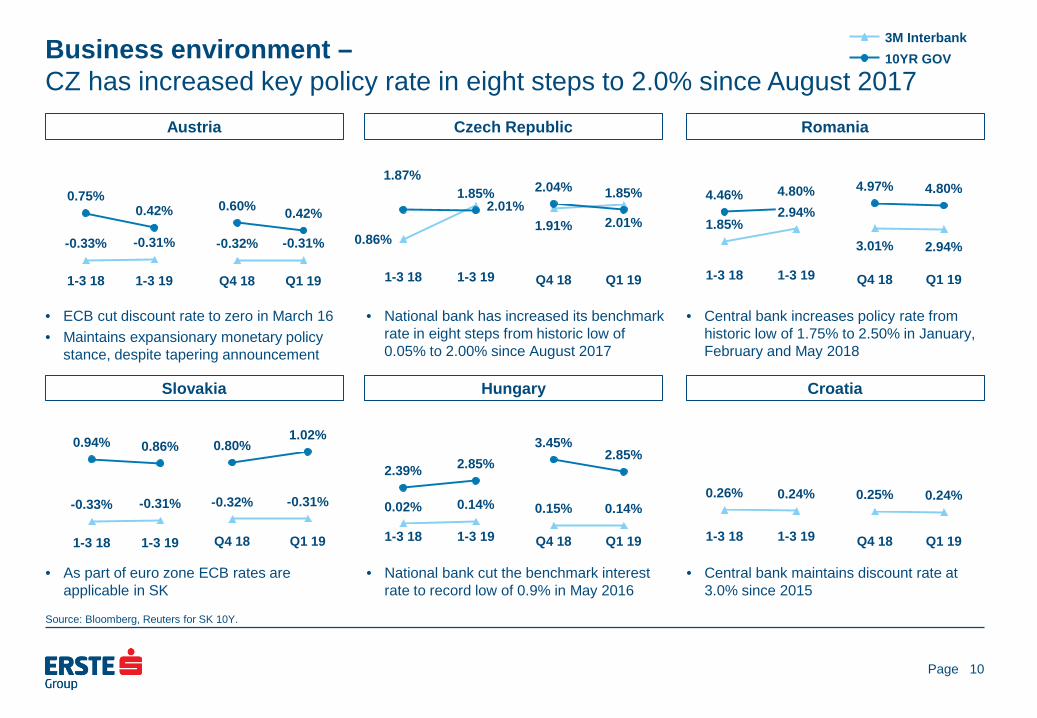
• ECB cut discount rate to zero in March 16 • Maintains expansionary monetary policy
stance, despite tapering announcement
• National bank has increased its benchmark rate in eight steps from historic low of 0.05% to 2.00% since August 2017
• Central bank increases policy rate from historic low of 1.75% to 2.50% in January, February and May 2018
• As part of euro zone ECB rates are applicable in SK
• National bank cut the benchmark interest rate to record low of 0.9% in May 2016
• Central bank maintains discount rate at 3.0% since 2015
0.86%
2.01%
1.87% 1.85%
1-3 18 1-3 19
1.85%
4.46% 4.80% 2.94%
1-3 19 1-3 18
0.02% 0.14%
2.39% 2.85%
1-3 18 1-3 19
0.26% 0.24%
1-3 18 1-3 19
-0.32% -0.31%
0.60% 0.42%
Q1 19 Q4 18
1.91% 2.01%
2.04% 1.85%
Q4 18 Q1 19
3.01% 2.94%
4.97% 4.80%
Q1 19 Q4 18
-0.32% -0.31%
0.80% 1.02%
Q4 18 Q1 19
0.15% 0.14%
3.45% 2.85%
Q4 18 Q1 19
0.25% 0.24%
Q4 18 Q1 19
Source: Bloomberg, Reuters for SK 10Y.
-0.33% -0.31%
0.75% 0.42%
1-3 19 1-3 18
3M Interbank 10YR GOV
-0.33% -0.31%
0.94% 0.86%
1-3 18 1-3 19
Page
Business environment – Emerging market volatility has minor impact on CEE currencies
EUR/CZK
11
EUR/RON
EUR/HUF
EUR/HRK
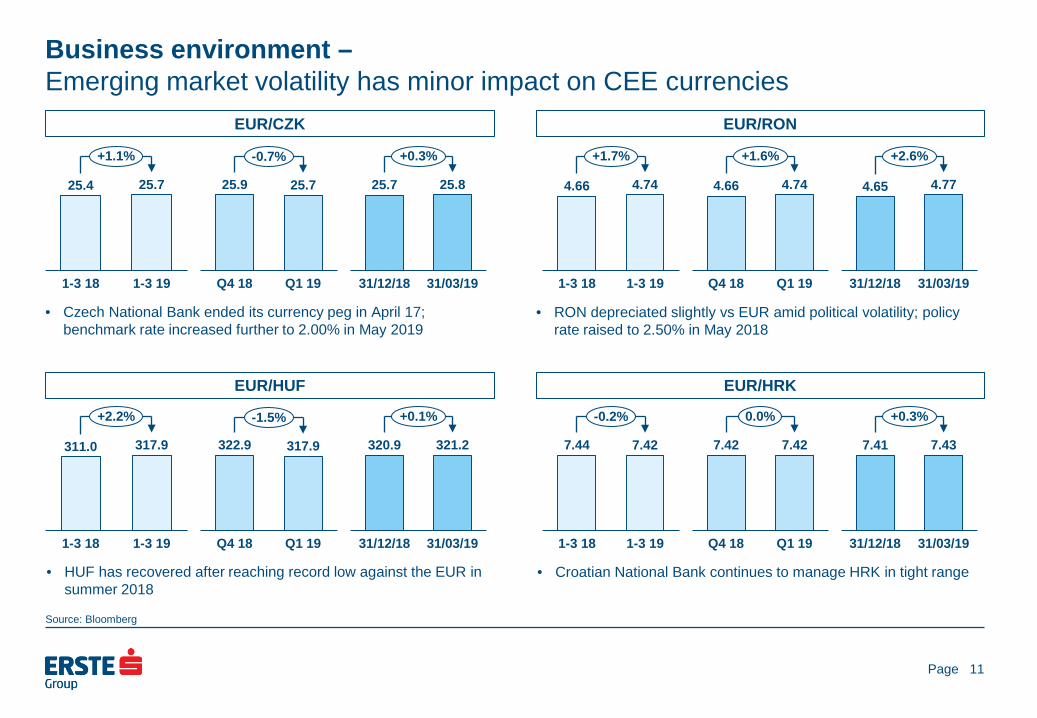
• Czech National Bank ended its currency peg in April 17; benchmark rate increased further to 2.00% in May 2019
• RON depreciated slightly vs EUR amid political volatility; policy rate raised to 2.50% in May 2018
• HUF has recovered after reaching record low against the EUR in summer 2018
• Croatian National Bank continues to manage HRK in tight range
25.4 25.7
1-3 18 1-3 19
+1.1%
25.9 25.7
Q1 19 Q4 18
-0.7%
25.7 25.8
31/12/18 31/03/19
+0.3%
4.66 4.74
1-3 18 1-3 19
+1.7%
4.66 4.74
Q1 19 Q4 18
+1.6%
4.65 4.77
31/12/18 31/03/19
+2.6%
311.0 317.9
1-3 19 1-3 18
+2.2%
322.9 317.9
Q4 18 Q1 19
-1.5%
320.9 321.2
31/12/18 31/03/19
+0.1%
7.44 7.42
1-3 18 1-3 19
-0.2%
7.42 7.42
Q1 19 Q4 18
0.0%
7.41 7.43
31/12/18 31/03/19
+0.3%
Source: Bloomberg
Page
Business environment – Market shares: mostly stable or increasing shares across the region
Gross retail loans
12
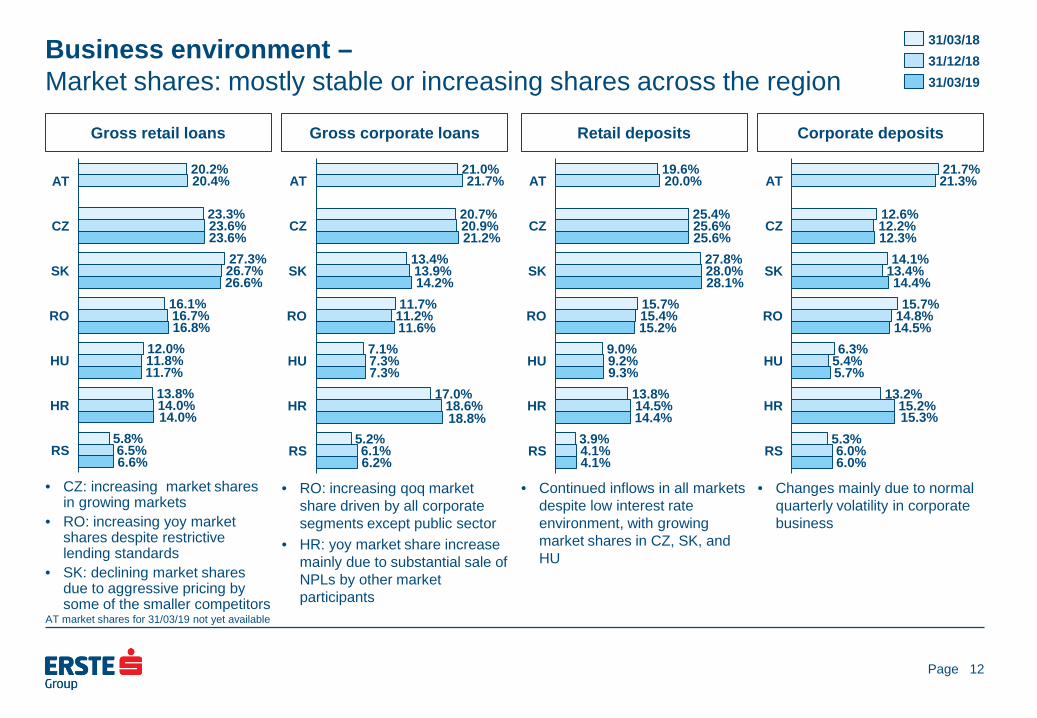
• CZ: increasing market shares in growing markets
• RO: increasing yoy market shares despite restrictive lending standards
• SK: declining market shares due to aggressive pricing by some of the smaller competitors
Gross corporate loans
• RO: increasing qoq market share driven by all corporate segments except public sector
• HR: yoy market share increase mainly due to substantial sale of NPLs by other market participants
Retail deposits
• Continued inflows in all markets despite low interest rate environment, with growing market shares in CZ, SK, and HU
Corporate deposits
• Changes mainly due to normal quarterly volatility in corporate business
20.2%
23.3%
27.3%
16.1%
12.0%
13.8%
5.8%
20.4%
23.6%
26.7%
16.7%
11.8%
14.0%
6.5%
23.6%
26.6%
16.8%
11.7%
6.6%
AT
RS
CZ
SK
HR
RO
HU
31/03/18 31/12/18 31/03/19
21.0%
20.7%
13.4%
11.7%
7.1%
17.0%
5.2%
21.7%
20.9%
13.9%
11.2%
7.3%
18.6%
6.1%
21.2%
14.2%
11.6%
7.3%
6.2%
AT
HU
CZ
SK
RO
HR
RS
19.6%
25.4%
27.8%
15.7%
9.0%
13.8%
3.9%
20.0%
25.6%
28.0%
15.4%
9.2%
14.5%
4.1%
25.6%
28.1%
15.2%
9.3%
4.1%
HU
AT
CZ
SK
RS
HR
RO
21.7%
12.6%
14.1%
15.7%
6.3%
13.2%
5.3%
21.3%
12.2%
13.4%
14.8%
5.4%
15.2%
6.0%
12.3%
14.4%
14.5%
5.7%
6.0%
SK
CZ
HR
HU
AT
RO
RS
14.0% 18.8% 14.4% 15.3%
AT market shares for 31/03/19 not yet available

Page
Presentation topics
13
• Executive summary • Business environment • Business performance • Assets and liabilities • Outlook • Additional information
Page
Business performance: performing loan stock & growth – Performing loans continue to grow across all geographies
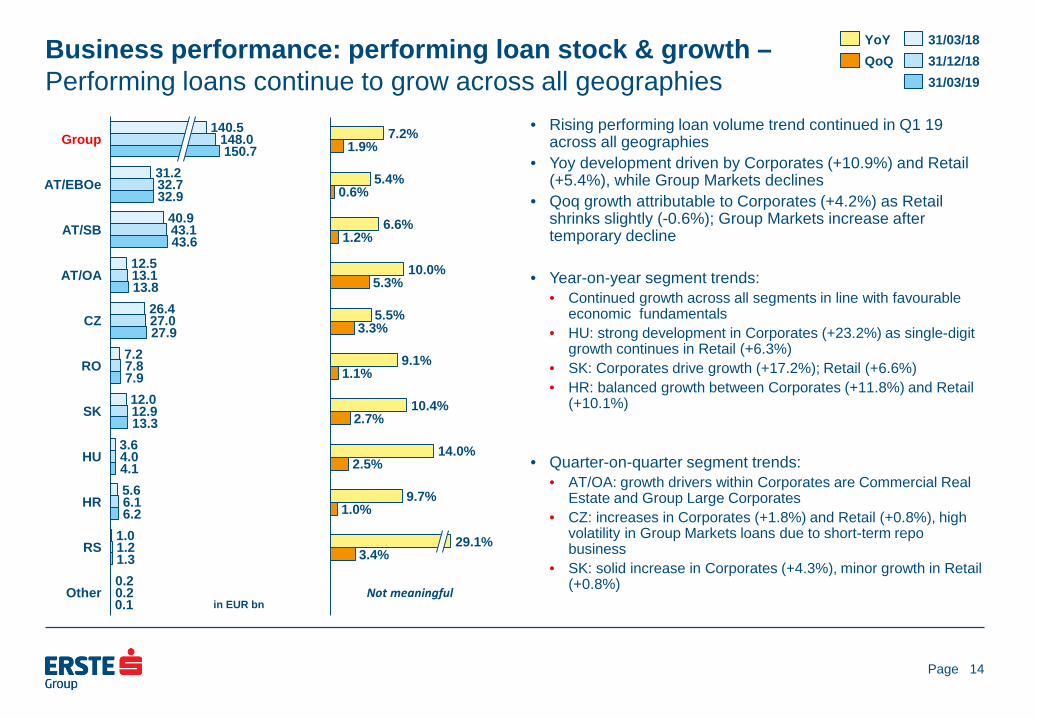
• Rising performing loan volume trend continued in Q1 19 across all geographies
• Yoy development driven by Corporates (+10.9%) and Retail (+5.4%), while Group Markets declines
• Qoq growth attributable to Corporates (+4.2%) as Retail shrinks slightly (-0.6%); Group Markets increase after temporary decline
• Year-on-year segment trends: • Continued growth across all segments in line with favourable
economic fundamentals • HU: strong development in Corporates (+23.2%) as single-digit
growth continues in Retail (+6.3%) • SK: Corporates drive growth (+17.2%); Retail (+6.6%) • HR: balanced growth between Corporates (+11.8%) and Retail
(+10.1%)
• Quarter-on-quarter segment trends: • AT/OA: growth drivers within Corporates are Commercial Real
Estate and Group Large Corporates • CZ: increases in Corporates (+1.8%) and Retail (+0.8%), high
volatility in Group Markets loans due to short-term repo business
• SK: solid increase in Corporates (+4.3%), minor growth in Retail (+0.8%)
14
140.5
12.5
Group
43.6
HU
AT/OA
RS
AT/EBOe
AT/SB
CZ
4.1
26.4
RO
SK
HR
12.0
Other
13.1
148.0 150.7
31.2 32.7
0.1
32.9
7.2
40.9
6.2
43.1
13.8
4.0
27.0
5.6
27.9
7.8 7.9
12.9 13.3
0.2
6.1
1.0 1.2 1.3
0.2
3.6
7.2%
5.4%
6.6%
10.0%
5.5%
9.1%
10.4%
14.0%
9.7%
1.9%
0.6%
1.2%
5.3%
3.3%
1.1%
2.7%
2.5%
1.0%
3.4% 29.1%
YoY QoQ
31/03/19
31/03/18 31/12/18
in EUR bn Not meaningful
Page
Business performance: customer deposit stock & growth – Deposit build-up continues in Q1 19
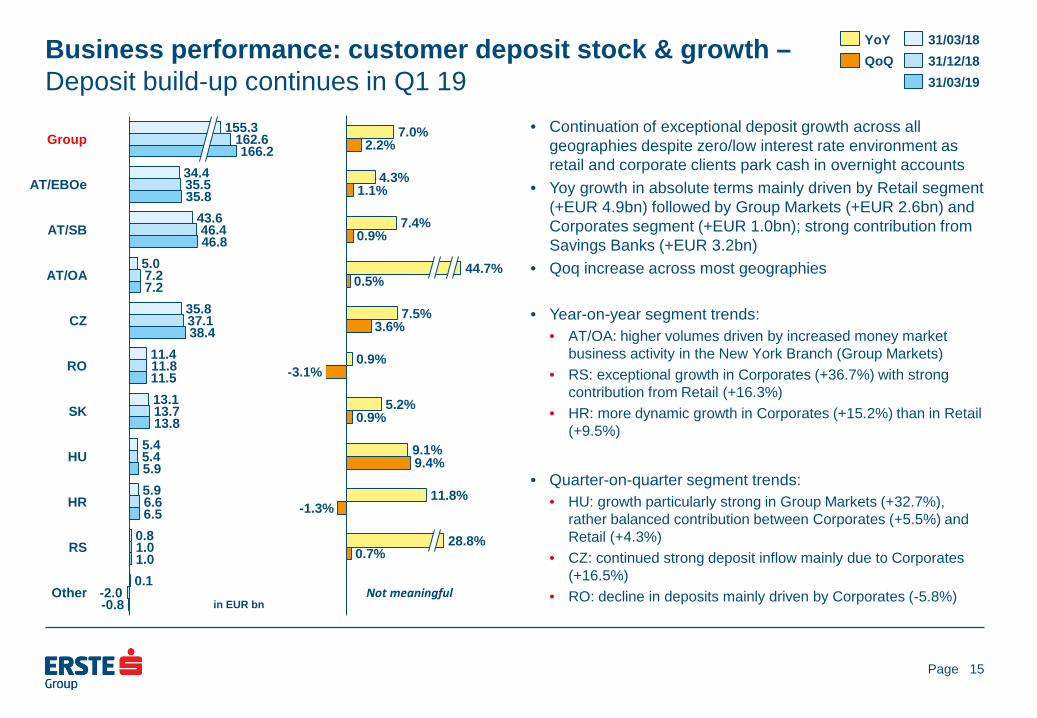
• Continuation of exceptional deposit growth across all geographies despite zero/low interest rate environment as retail and corporate clients park cash in overnight accounts
• Yoy growth in absolute terms mainly driven by Retail segment (+EUR 4.9bn) followed by Group Markets (+EUR 2.6bn) and Corporates segment (+EUR 1.0bn); strong contribution from Savings Banks (+EUR 3.2bn)
• Qoq increase across most geographies
• Year-on-year segment trends: • AT/OA: higher volumes driven by increased money market
business activity in the New York Branch (Group Markets) • RS: exceptional growth in Corporates (+36.7%) with strong
contribution from Retail (+16.3%) • HR: more dynamic growth in Corporates (+15.2%) than in Retail
(+9.5%)
• Quarter-on-quarter segment trends:
• HU: growth particularly strong in Group Markets (+32.7%), rather balanced contribution between Corporates (+5.5%) and Retail (+4.3%)
• CZ: continued strong deposit inflow mainly due to Corporates (+16.5%)
• RO: decline in deposits mainly driven by Corporates (-5.8%)
15
5.4
AT/SB 43.6
-0.8
38.4
AT/EBOe
Group
5.9
CZ
13.7
RO
SK
HU
HR
RS
11.5
Other
155.3 162.6
0.1
7.2
166.2
11.8
34.4
11.4
35.5 35.8
46.4 46.8
5.0 7.2 AT/OA
37.1
0.8
13.1
13.8 5.4
35.8
6.6 6.5
1.0 1.0
-2.0
5.9
7.0%
4.3%
7.4%
7.5%
0.9%
5.2%
9.1%
11.8%
2.2%
1.1%
0.9%
0.5%
3.6%
-3.1%
0.9%
9.4%
-1.3%
0.7%
44.7%
28.8%
YoY QoQ
in EUR bn
31/12/18 31/03/18
31/03/19
Not meaningful
Page
Business performance: NII and NIM – NII advances 7.2% yoy, seasonally lower qoq
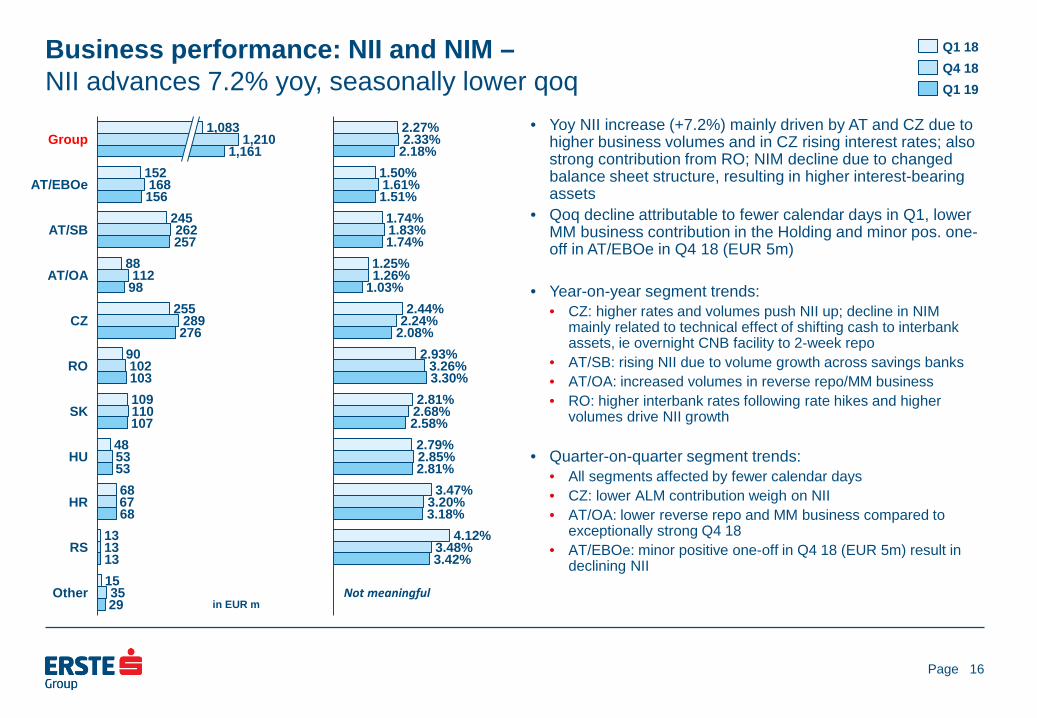
• Yoy NII increase (+7.2%) mainly driven by AT and CZ due to higher business volumes and in CZ rising interest rates; also strong contribution from RO; NIM decline due to changed balance sheet structure, resulting in higher interest-bearing assets
• Qoq decline attributable to fewer calendar days in Q1, lower MM business contribution in the Holding and minor pos. one-off in AT/EBOe in Q4 18 (EUR 5m)
• Year-on-year segment trends: • CZ: higher rates and volumes push NII up; decline in NIM
mainly related to technical effect of shifting cash to interbank assets, ie overnight CNB facility to 2-week repo
• AT/SB: rising NII due to volume growth across savings banks • AT/OA: increased volumes in reverse repo/MM business • RO: higher interbank rates following rate hikes and higher
volumes drive NII growth
• Quarter-on-quarter segment trends: • All segments affected by fewer calendar days • CZ: lower ALM contribution weigh on NII • AT/OA: lower reverse repo and MM business compared to
exceptionally strong Q4 18 • AT/EBOe: minor positive one-off in Q4 18 (EUR 5m) result in
declining NII
16
152
245
88
255
90
109
48
68
13
15
168
262
112
289
102
110
53
67
13
35
156
257
98
276
103
107
53
68
13
29
AT/OA
RS
AT/SB
Group
AT/EBOe
CZ
SK
RO
HU
1,210
HR
Other
1,083
1,161
Q1 18 Q4 18 Q1 19
2.27%
1.50%
1.74%
1.25%
2.44%
2.93%
2.81%
2.79%
3.47%
4.12%
2.33%
1.61%
1.83%
1.26%
2.24%
3.26%
2.68%
2.85%
3.20%
3.48%
2.18%
1.51%
1.74%
1.03%
2.08%
3.30%
2.58%
2.81%
3.18%
3.42%
in EUR m Not meaningful
Page
Business performance: operating income – Operating income up yoy, mainly on NII and net trading and FV result
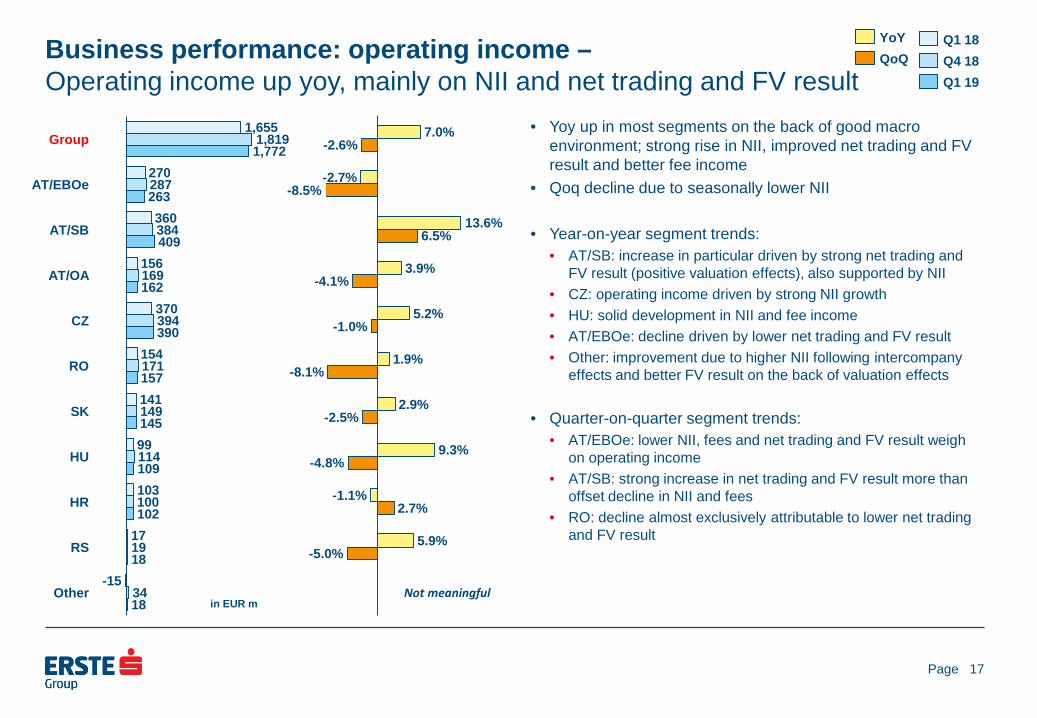
• Yoy up in most segments on the back of good macro environment; strong rise in NII, improved net trading and FV result and better fee income
• Qoq decline due to seasonally lower NII
• Year-on-year segment trends: • AT/SB: increase in particular driven by strong net trading and
FV result (positive valuation effects), also supported by NII • CZ: operating income driven by strong NII growth • HU: solid development in NII and fee income • AT/EBOe: decline driven by lower net trading and FV result • Other: improvement due to higher NII following intercompany
effects and better FV result on the back of valuation effects
• Quarter-on-quarter segment trends: • AT/EBOe: lower NII, fees and net trading and FV result weigh
on operating income • AT/SB: strong increase in net trading and FV result more than
offset decline in NII and fees • RO: decline almost exclusively attributable to lower net trading
and FV result
17
1,655
270
360
156
370
154
141
99
103
17
-15
1,819
287
384
169
394
171
149
114
100
19
34
1,772
263
409
162
390
157
145
109
102
18
18
Group
HU
AT/OA
AT/EBOe
AT/SB
RO
CZ
SK
HR
RS
Other
Q1 18 Q4 18 Q1 19
in EUR m
7.0%
-2.7%
13.6%
3.9%
5.2%
1.9%
2.9%
9.3%
-1.1%
5.9%
-2.6%
-8.5%
6.5%
-4.1%
-1.0%
-8.1%
-2.5%
-4.8%
2.7%
-5.0%
YoY QoQ
Not meaningful
Page
Business performance: operating expenses – Q1 cost development impacted by deposit insurance contributions
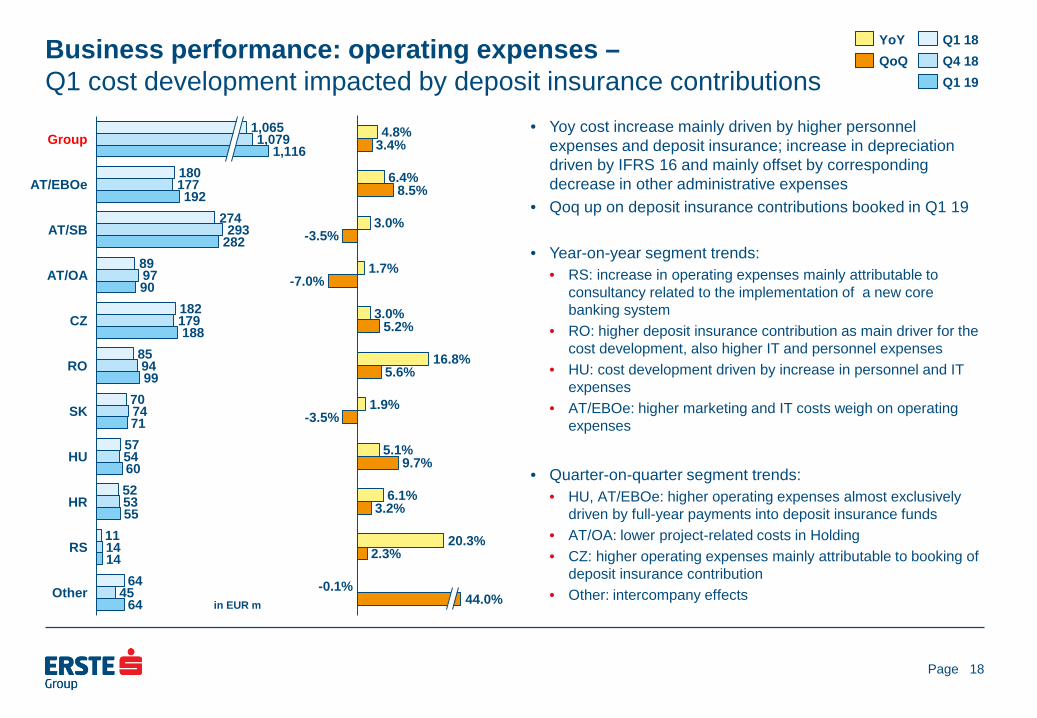
• Yoy cost increase mainly driven by higher personnel expenses and deposit insurance; increase in depreciation driven by IFRS 16 and mainly offset by corresponding decrease in other administrative expenses
• Qoq up on deposit insurance contributions booked in Q1 19
• Year-on-year segment trends: • RS: increase in operating expenses mainly attributable to
consultancy related to the implementation of a new core banking system
• RO: higher deposit insurance contribution as main driver for the cost development, also higher IT and personnel expenses
• HU: cost development driven by increase in personnel and IT expenses
• AT/EBOe: higher marketing and IT costs weigh on operating expenses
• Quarter-on-quarter segment trends:
• HU, AT/EBOe: higher operating expenses almost exclusively driven by full-year payments into deposit insurance funds
• AT/OA: lower project-related costs in Holding • CZ: higher operating expenses mainly attributable to booking of
deposit insurance contribution • Other: intercompany effects
18
180
274
89
182
85
70
57
52
11
64
177
293
97
179
94
74
54
53
14
45
192
282
90
188
99
71
60
55
14
64
AT/SB
AT/EBOe
Group
AT/OA
CZ
RO
SK
HU
HR
RS
Other
1,065 1,079
1,116
Q1 18
Q1 19 Q4 18
in EUR m
4.8%
6.4%
3.0%
1.7%
3.0%
16.8%
1.9%
5.1%
6.1%
20.3%
3.4%
8.5%
-3.5%
-7.0%
5.2%
5.6%
-3.5%
9.7%
3.2%
2.3%
-0.1% 44.0%
YoY QoQ
Page
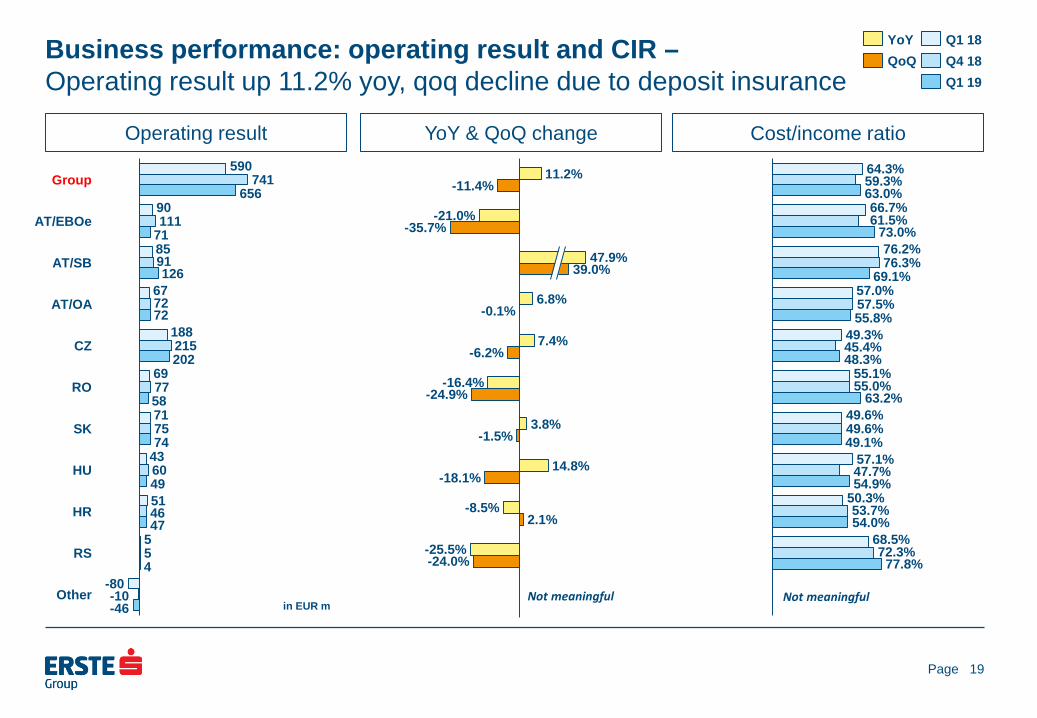
Business performance: operating result and CIR – Operating result up 11.2% yoy, qoq decline due to deposit insurance
Operating result
YoY & QoQ change
19
Cost/income ratio 590
90
85
67
188
69
71
43
51
5
-80
741
111
91
72
215
77
75
60
46
5
-10
656
71
126
72
202
58
74
49
47
4
-46
HU
Group
SK
AT/EBOe
RO
CZ
AT/OA
AT/SB
HR
RS
Other
64.3%
66.7%
76.2%
57.0%
49.3%
55.1%
49.6%
57.1%
50.3%
68.5%
59.3%
61.5%
76.3%
57.5%
45.4%
55.0%
49.6%
47.7%
53.7%
72.3%
63.0%
73.0%
69.1%
55.8%
48.3%
63.2%
49.1%
54.9%
54.0%
77.8%
in EUR m Not meaningful
11.2%
-21.0%
6.8%
7.4%
-16.4%
3.8%
14.8%
-8.5%
-25.5%
-11.4%
-35.7%
-0.1%
-6.2%
-24.9%
-1.5%
-18.1%
2.1%
-24.0%
39.0% 47.9%
YoY QoQ
Q1 18
Q1 19 Q4 18
Not meaningful
Page
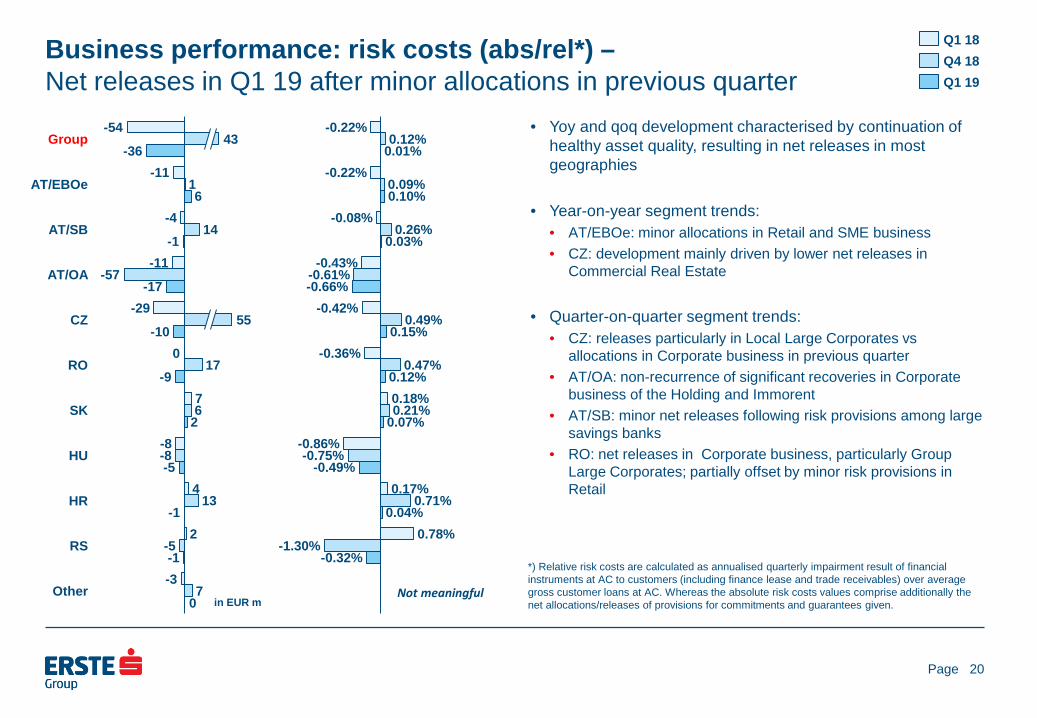
Business performance: risk costs (abs/rel*) – Net releases in Q1 19 after minor allocations in previous quarter
• Yoy and qoq development characterised by continuation of healthy asset quality, resulting in net releases in most geographies
• Year-on-year segment trends:
• AT/EBOe: minor allocations in Retail and SME business • CZ: development mainly driven by lower net releases in
Commercial Real Estate
• Quarter-on-quarter segment trends: • CZ: releases particularly in Local Large Corporates vs
allocations in Corporate business in previous quarter • AT/OA: non-recurrence of significant recoveries in Corporate
business of the Holding and Immorent • AT/SB: minor net releases following risk provisions among large
savings banks • RO: net releases in Corporate business, particularly Group
Large Corporates; partially offset by minor risk provisions in Retail
20
-54
-11
-4
-11
-29
7
-8
4
2
-3
1
14
-57
17
6
-8
13
-5
7
-36
6
-1
-17
-10
-9
2
-5
-1
-1
CZ
Group
AT/EBOe
AT/SB
AT/OA
RO
SK
HU
HR
RS
Other
43
55
0
0
-0.22%
-0.22%
-0.08%
-0.43%
-0.42%
-0.36%
0.18%
-0.86%
0.17%
0.78%
0.12%
0.09%
0.26%
-0.61%
0.49%
0.47%
0.21%
-0.75%
0.71%
-1.30%
0.01%
0.10%
0.03%
-0.66%
0.15%
0.12%
0.07%
-0.49%
0.04%
-0.32%
Q1 18 Q4 18 Q1 19
in EUR m
*) Relative risk costs are calculated as annualised quarterly impairment result of financial instruments at AC to customers (including finance lease and trade receivables) over average gross customer loans at AC. Whereas the absolute risk costs values comprise additionally the net allocations/releases of provisions for commitments and guarantees given.
Not meaningful
Page
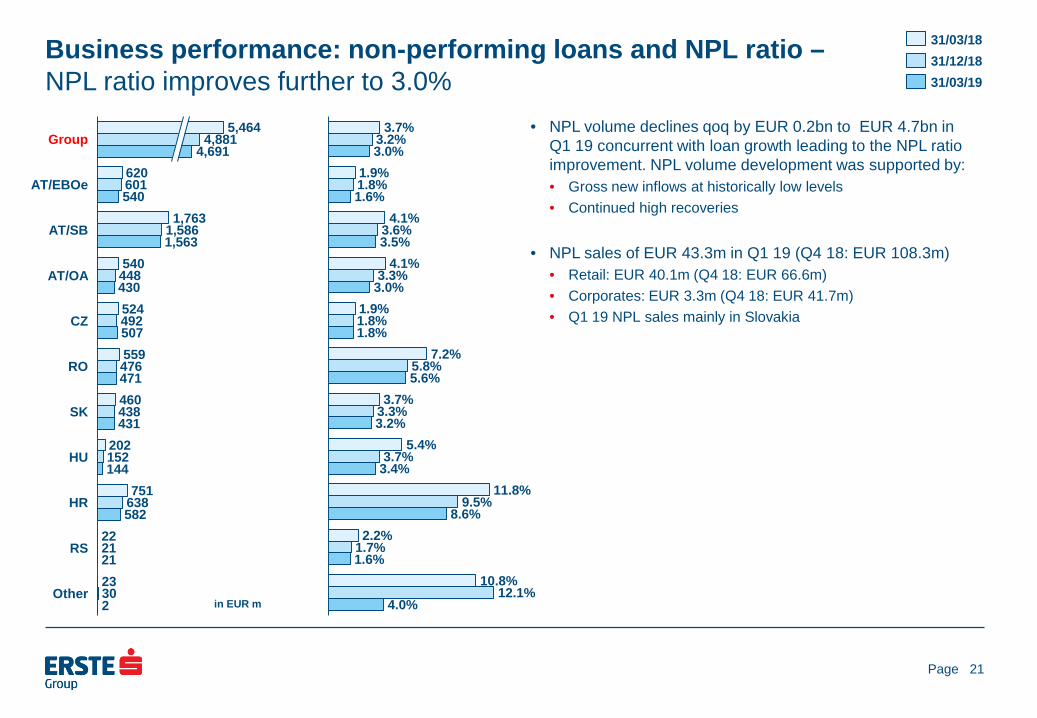
Business performance: non-performing loans and NPL ratio – NPL ratio improves further to 3.0%
• NPL volume declines qoq by EUR 0.2bn to EUR 4.7bn in Q1 19 concurrent with loan growth leading to the NPL ratio improvement. NPL volume development was supported by: • Gross new inflows at historically low levels • Continued high recoveries
• NPL sales of EUR 43.3m in Q1 19 (Q4 18: EUR 108.3m) • Retail: EUR 40.1m (Q4 18: EUR 66.6m) • Corporates: EUR 3.3m (Q4 18: EUR 41.7m) • Q1 19 NPL sales mainly in Slovakia
21
620
1,763
540
524
559
460
202
751
22
23
601
1,586
448
492
476
438
152
638
21
30
540
1,563
430
507
471
431
144
582
21
HU
AT/EBOe
Group 4,691
AT/SB
2
AT/OA
CZ
RO
RS
SK
HR
Other
5,464 4,881
3.7%
1.9%
4.1%
4.1%
1.9%
7.2%
3.7%
5.4%
11.8%
2.2%
10.8%
3.2%
1.8%
3.6%
3.3%
1.8%
5.8%
3.3%
3.7%
9.5%
1.7%
12.1%
3.0%
1.6%
3.5%
3.0%
1.8%
5.6%
3.2%
3.4%
8.6%
1.6%
4.0%
31/12/18 31/03/18
31/03/19
in EUR m
Page
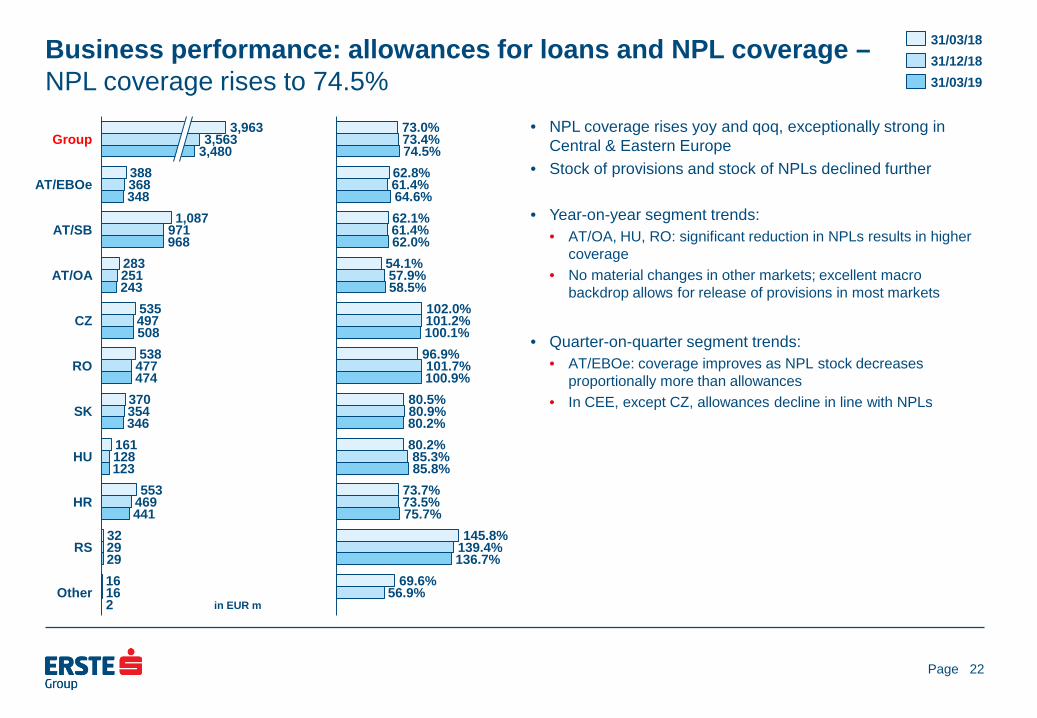
Business performance: allowances for loans and NPL coverage – NPL coverage rises to 74.5%
• NPL coverage rises yoy and qoq, exceptionally strong in Central & Eastern Europe
• Stock of provisions and stock of NPLs declined further
• Year-on-year segment trends: • AT/OA, HU, RO: significant reduction in NPLs results in higher
coverage • No material changes in other markets; excellent macro
backdrop allows for release of provisions in most markets
• Quarter-on-quarter segment trends:
• AT/EBOe: coverage improves as NPL stock decreases proportionally more than allowances
• In CEE, except CZ, allowances decline in line with NPLs
22
388
1,087
283
535
538
370
161
553
32
16
368
971
251
497
477
354
128
469
29
16
348
968
243
508
474
346
123
441
29
3,963
CZ
AT/EBOe
AT/SB
Group
AT/OA
RO
SK
HU
2
HR
RS
Other
3,563 3,480
73.0%
62.8%
62.1%
54.1%
102.0%
96.9%
80.5%
80.2%
73.7%
145.8%
69.6%
73.4%
61.4%
61.4%
57.9%
101.2%
101.7%
80.9%
85.3%
73.5%
139.4%
56.9%
74.5%
64.6%
62.0%
58.5%
100.1%
100.9%
80.2%
85.8%
75.7%
136.7%
31/03/18 31/12/18 31/03/19
in EUR m
Page
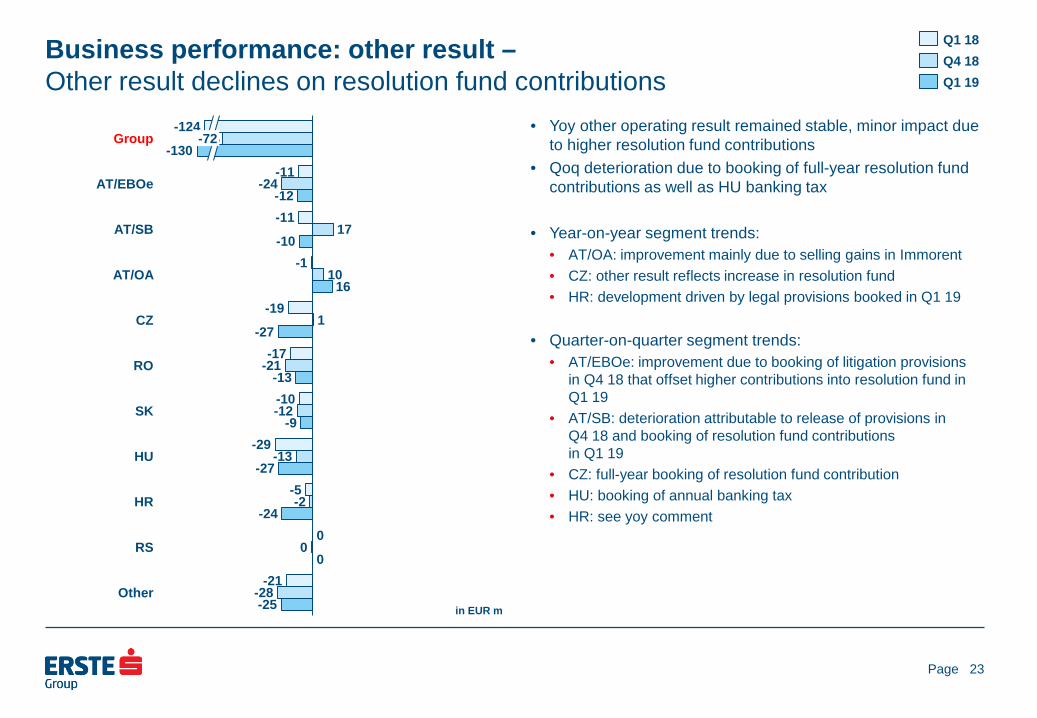
Business performance: other result – Other result declines on resolution fund contributions
• Yoy other operating result remained stable, minor impact due to higher resolution fund contributions
• Qoq deterioration due to booking of full-year resolution fund contributions as well as HU banking tax
• Year-on-year segment trends: • AT/OA: improvement mainly due to selling gains in Immorent • CZ: other result reflects increase in resolution fund • HR: development driven by legal provisions booked in Q1 19
• Quarter-on-quarter segment trends:
• AT/EBOe: improvement due to booking of litigation provisions in Q4 18 that offset higher contributions into resolution fund in Q1 19
• AT/SB: deterioration attributable to release of provisions in Q4 18 and booking of resolution fund contributions in Q1 19
• CZ: full-year booking of resolution fund contribution • HU: booking of annual banking tax • HR: see yoy comment
23
-11
-11
-1
-19
-17
-10
-29
-5
-21
-24
17
10
1
-21
-12
-13
-2
-28
-12
-10
16
-27
-13
-9
-27
-24
-25
0
Other
SK
0
Group
AT/EBOe
AT/SB
AT/OA
CZ
-130
RO
HU
HR
0 RS
-124 -72
in EUR m
Q1 18 Q4 18 Q1 19
Page
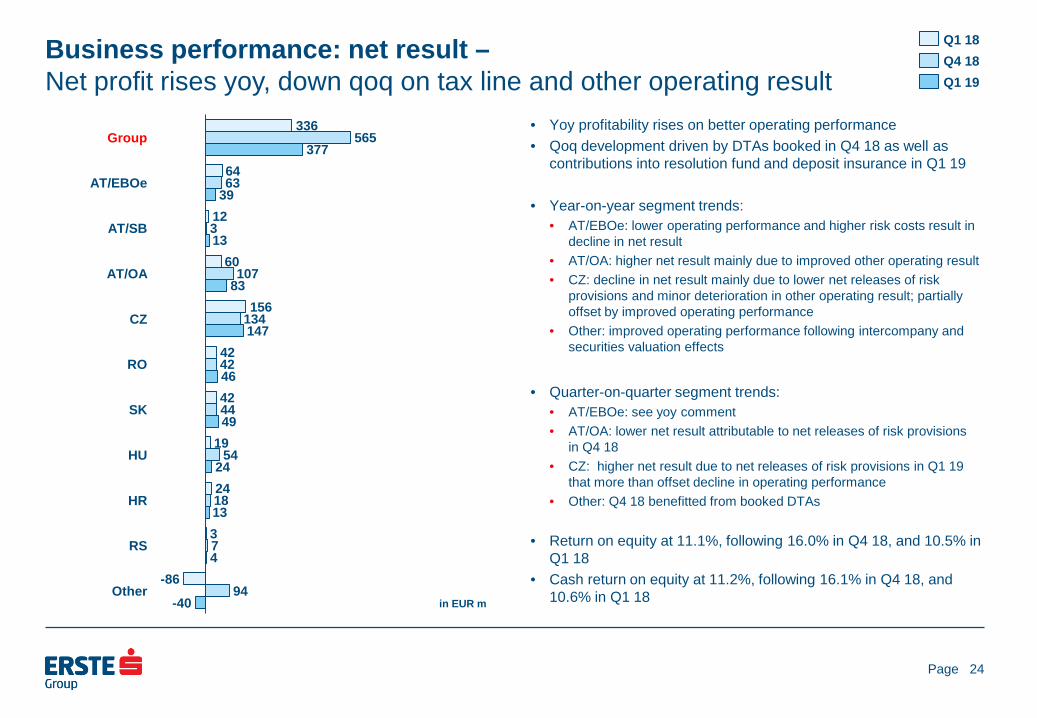
Business performance: net result – Net profit rises yoy, down qoq on tax line and other operating result
• Yoy profitability rises on better operating performance • Qoq development driven by DTAs booked in Q4 18 as well as
contributions into resolution fund and deposit insurance in Q1 19
• Year-on-year segment trends: • AT/EBOe: lower operating performance and higher risk costs result in
decline in net result • AT/OA: higher net result mainly due to improved other operating result • CZ: decline in net result mainly due to lower net releases of risk
provisions and minor deterioration in other operating result; partially offset by improved operating performance
• Other: improved operating performance following intercompany and securities valuation effects
• Quarter-on-quarter segment trends:
• AT/EBOe: see yoy comment • AT/OA: lower net result attributable to net releases of risk provisions
in Q4 18 • CZ: higher net result due to net releases of risk provisions in Q1 19
that more than offset decline in operating performance • Other: Q4 18 benefitted from booked DTAs
• Return on equity at 11.1%, following 16.0% in Q4 18, and 10.5% in
Q1 18 • Cash return on equity at 11.2%, following 16.1% in Q4 18, and
10.6% in Q1 18
24
336
64
12
60
156
42
42
19
24
3
-86
565
63
3
107
134
42
44
54
18
7
94
377
39
13
83
147
46
49
24
13
4
-40
Group
CZ
AT/EBOe
AT/SB
HU
RO
AT/OA
SK
HR
RS
Other in EUR m
Q1 18
Q1 19 Q4 18

Page
Presentation topics
25
• Executive summary • Business environment • Business performance • Assets and liabilities • Outlook • Additional information
Page
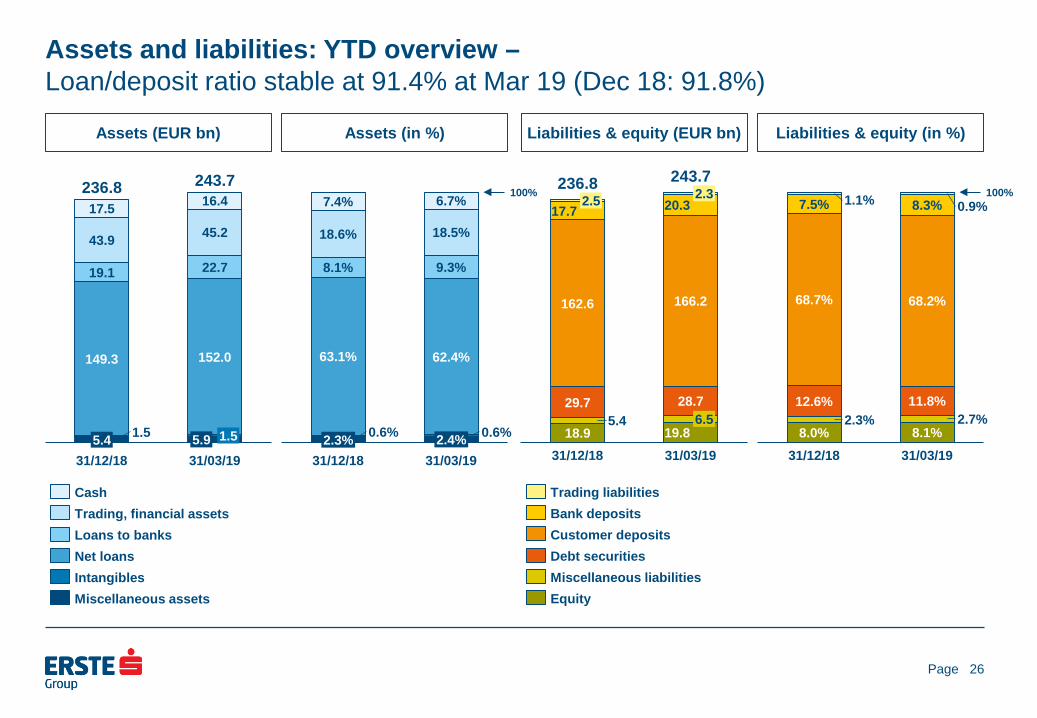
Assets and liabilities: YTD overview – Loan/deposit ratio stable at 91.4% at Mar 19 (Dec 18: 91.8%)
Assets (EUR bn)
26
Assets (in %)
Liabilities & equity (EUR bn)
Liabilities & equity (in %)
19.1
17.5
1.5
43.9
149.3
5.4 31/12/18
16.4
45.2
22.7
152.0
1.5 5.9 31/03/19
236.8 243.7
Cash Trading, financial assets Loans to banks Net loans Intangibles Miscellaneous assets
29.7
2.5
18.9
17.7
162.6
5.4
31/12/18
2.3 20.3
166.2
28.7 6.5
19.8 31/03/19
236.8 243.7
Miscellaneous liabilities Debt securities
Trading liabilities
Customer deposits Bank deposits
Equity
0.6% 0.6%
63.1% 62.4%
8.1% 9.3%
18.6% 18.5%
7.4% 6.7%
2.4% 2.3% 31/12/18 31/03/19
100%
8.0% 8.1% 2.3% 2.7%
12.6% 11.8%
68.7% 68.2%
7.5% 8.3% 1.1% 0.9%
31/12/18
100%
31/03/19
Page
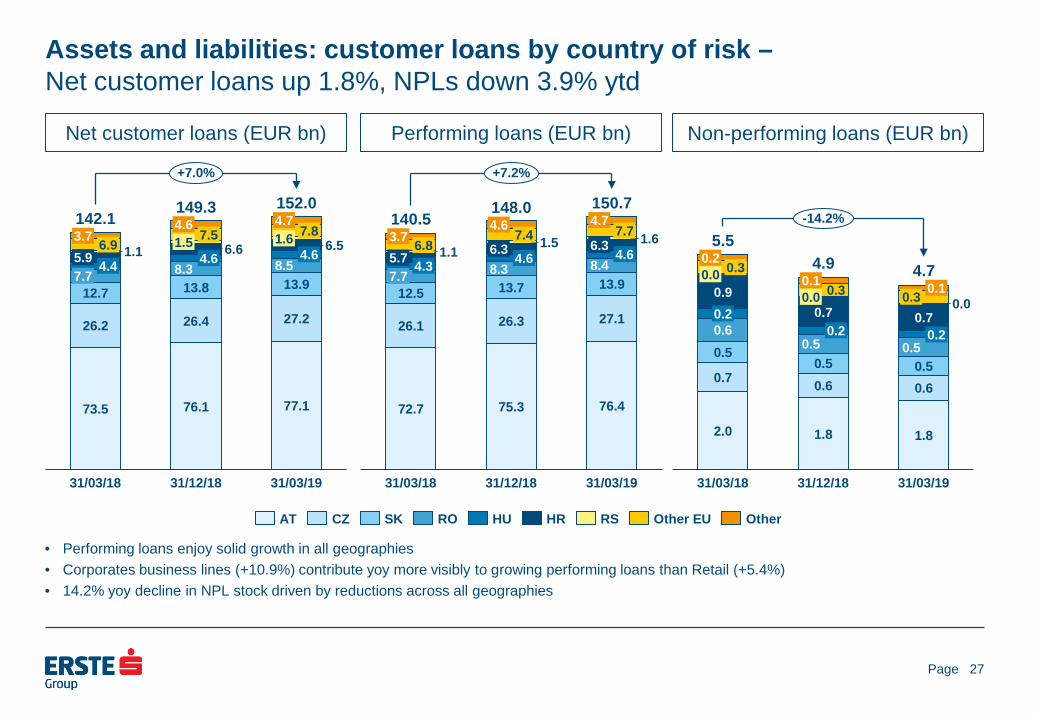
Assets and liabilities: customer loans by country of risk – Net customer loans up 1.8%, NPLs down 3.9% ytd
Net customer loans (EUR bn)
Performing loans (EUR bn)
27
Non-performing loans (EUR bn)
• Performing loans enjoy solid growth in all geographies • Corporates business lines (+10.9%) contribute yoy more visibly to growing performing loans than Retail (+5.4%) • 14.2% yoy decline in NPL stock driven by reductions across all geographies
12.7 13.8 4.4
1.1 4.6 6.6 5.9
73.5
26.2
4.7
31/12/18 31/03/18
7.8 4.6 7.5
7.7
1.5
152.0
13.9
76.1
26.4
4.6 8.3
1.6 6.5
31/03/19
8.5
77.1
27.2
6.9 3.7 142.1
149.3
+7.0%
AT HU CZ RO SK HR RS Other EU Other
1.1 6.3 4.6
72.7
5.7
7.7 3.7 6.8
12.5 7.7
4.3
26.1
31/03/18
4.6
76.4
6.3
27.1
13.9 8.3
13.7
26.3
31/12/18
4.7 1.5 1.6
4.6 8.4
31/03/19
75.3
7.4 140.5
148.0 150.7
+7.2%
0.2
0.7 0.5
0.3
0.6
0.0 0.9
0.5
2.0
5.5
31/03/18
0.1
0.2
0.3 0.0 0.7
31/12/18
0.6
1.8
0.1 0.3 0.0 0.7
0.6
0.2
0.5 0.5
1.8
31/03/19
0.5
4.9
0.2
4.7
-14.2%
Page
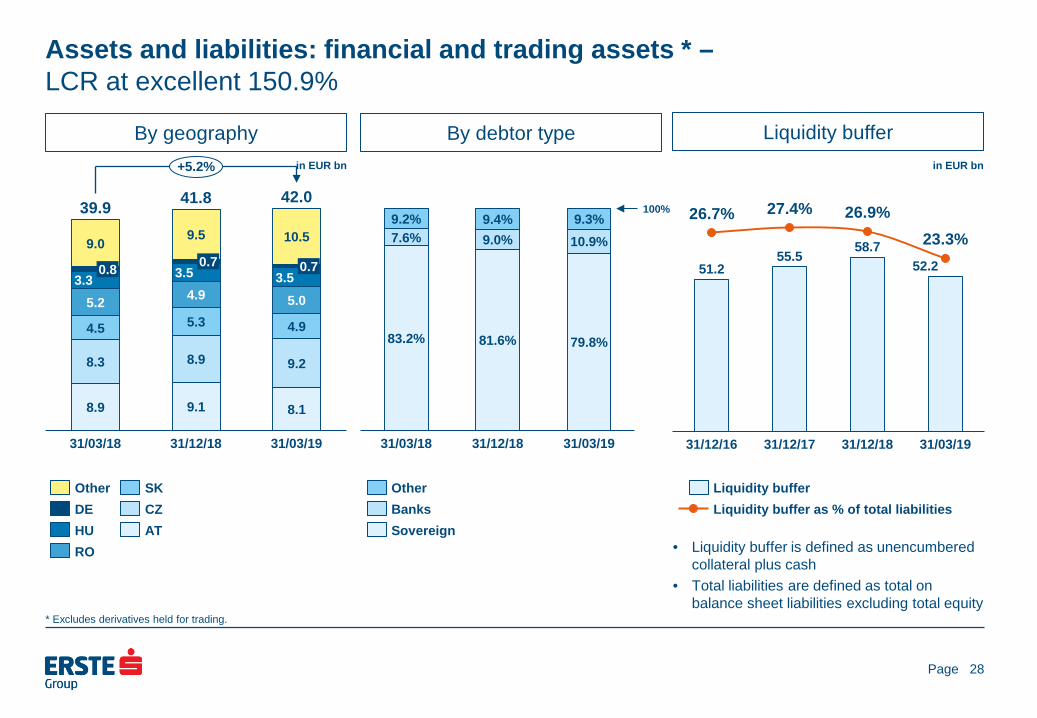
Assets and liabilities: financial and trading assets * – LCR at excellent 150.9%
By geography in EUR bn
By debtor type
28
Liquidity buffer in EUR bn
• Liquidity buffer is defined as unencumbered collateral plus cash
• Total liabilities are defined as total on balance sheet liabilities excluding total equity
0.7 9.0
0.8
4.5
39.9
3.3 5.2
8.9
8.3 9.2
31/03/18
9.5
0.7 3.5
4.9
5.3
8.9
9.1
31/12/18
10.5
3.5 5.0
8.1
4.9
31/03/19
42.0 41.8
+5.2%
Other
HU DE
RO
SK CZ AT
83.2% 81.6% 79.8%
7.6% 9.0% 10.9% 9.2% 9.4% 9.3%
31/03/19 31/03/18 31/12/18
100%
Other Banks Sovereign
51.2 55.5
58.7 52.2
26.7% 27.4% 26.9% 23.3%
31/12/16 31/03/19 31/12/17 31/12/18
Liquidity buffer as % of total liabilities Liquidity buffer
* Excludes derivatives held for trading.
Page
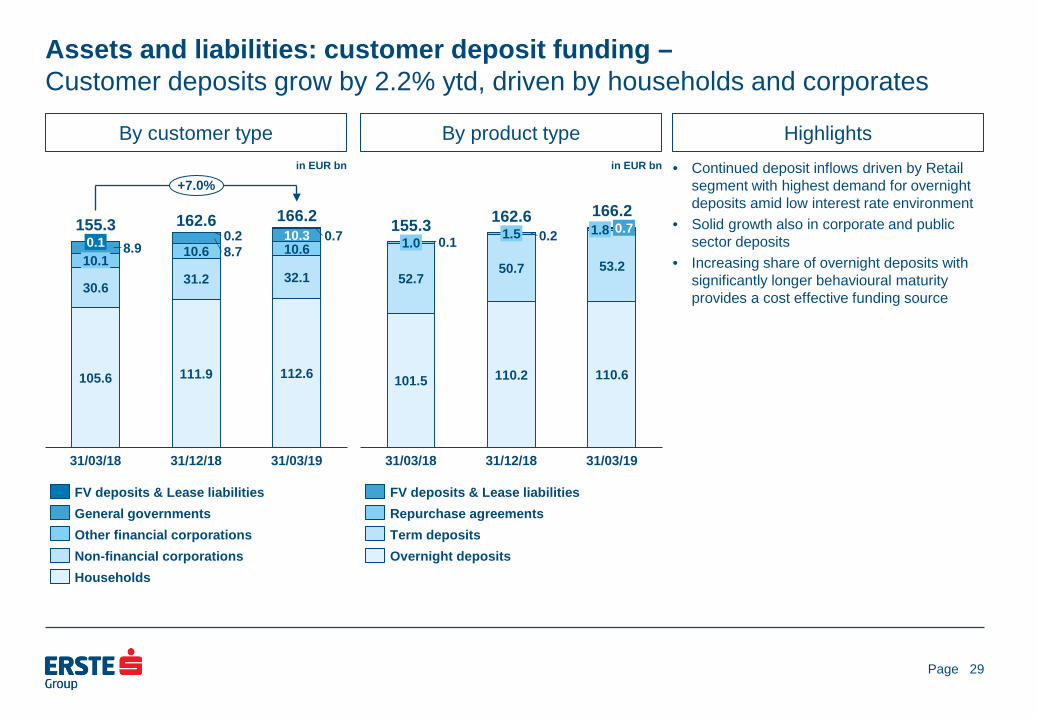
Assets and liabilities: customer deposit funding – Customer deposits grow by 2.2% ytd, driven by households and corporates
By customer type in EUR bn
By product type
29
in EUR bn
Highlights • Continued deposit inflows driven by Retail
segment with highest demand for overnight deposits amid low interest rate environment
• Solid growth also in corporate and public sector deposits
• Increasing share of overnight deposits with significantly longer behavioural maturity provides a cost effective funding source
31/03/18
110.6 101.5
0.1 0.2
31/03/19
1.0
52.7
1.5
50.7
110.2
31/12/18
0.7 1.8
53.2
155.3 162.6 166.2
FV deposits & Lease liabilities Repurchase agreements Term deposits Overnight deposits
31.2
0.1
30.6
8.9 10.1
105.6
166.2
31/03/18
0.2 8.7
112.6
10.6 0.7
111.9
31/12/18
10.3 10.6
32.1
31/03/19
155.3 162.6
+7.0%
Households
FV deposits & Lease liabilities General governments Other financial corporations Non-financial corporations
Page
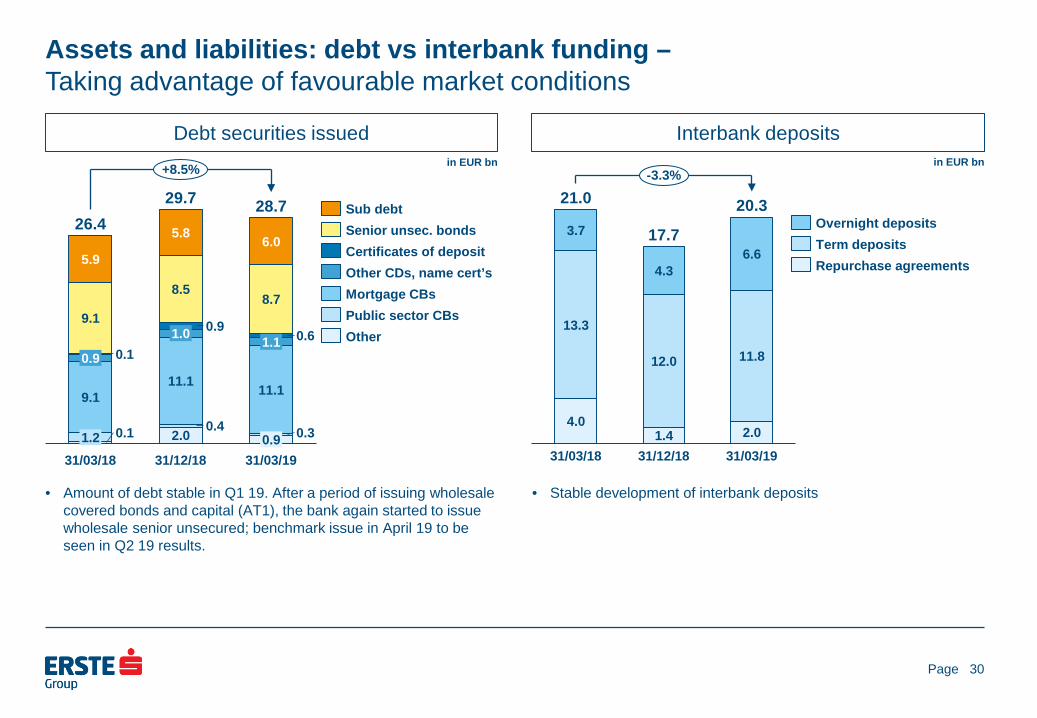
Assets and liabilities: debt vs interbank funding – Taking advantage of favourable market conditions
Debt securities issued in EUR bn
Interbank deposits in EUR bn
30
• Amount of debt stable in Q1 19. After a period of issuing wholesale covered bonds and capital (AT1), the bank again started to issue wholesale senior unsecured; benchmark issue in April 19 to be seen in Q2 19 results.
• Stable development of interbank deposits
9.1
11.1 9.1
31/03/19
0.1
31/03/18
5.8
0.4
8.5
0.9
11.1
1.0
2.0
31/12/18
6.0
8.7
1.2
0.6 1.1
5.9
0.3 0.9
0.9 0.1
26.4 29.7 28.7
+8.5%
Sub debt Senior unsec. bonds Certificates of deposit
Mortgage CBs Other CDs, name cert’s
Public sector CBs Other
31/12/18
4.3
3.7
13.3
4.0
31/03/18
12.0
20.3
1.4
6.6
11.8
2.0 31/03/19
21.0
17.7
-3.3%
Overnight deposits
Repurchase agreements Term deposits
Page
Assets and liabilities: LT funding – Limited LT funding needs in 2019
Maturity profile of debt
31
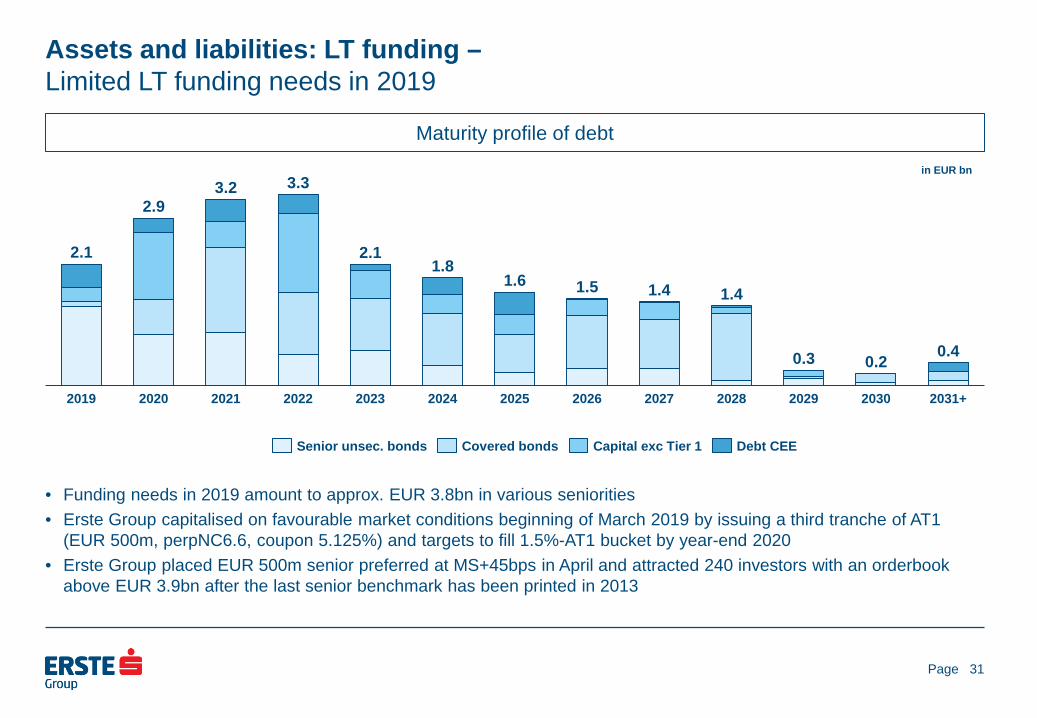
• Funding needs in 2019 amount to approx. EUR 3.8bn in various seniorities • Erste Group capitalised on favourable market conditions beginning of March 2019 by issuing a third tranche of AT1
(EUR 500m, perpNC6.6, coupon 5.125%) and targets to fill 1.5%-AT1 bucket by year-end 2020 • Erste Group placed EUR 500m senior preferred at MS+45bps in April and attracted 240 investors with an orderbook
above EUR 3.9bn after the last senior benchmark has been printed in 2013
2.1
2025 2019 2021 2022 2020 2023 2028 2024 2026
2.9
2027 2029 2030 2031+
3.2
0.3
1.5
3.3
2.1
0.2
1.8 1.6 1.4 1.4
0.4
Senior unsec. bonds Debt CEE Covered bonds Capital exc Tier 1
in EUR bn
Page 32
* Subject to joint decision of resolution authorities
Assets and liabilities: LT funding – MPE resolution strategy
Majority ownership
Minority ownership
AT
CZ
SK
HU
RO HR
RS
Resolution strategy Austrian resolution group
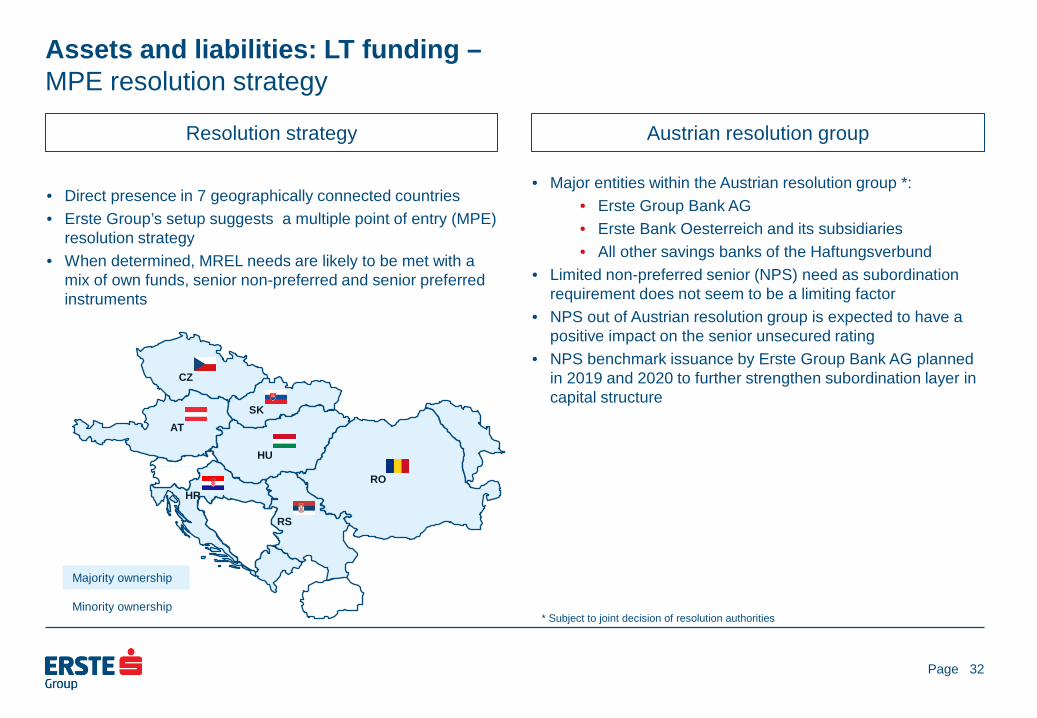
• Direct presence in 7 geographically connected countries • Erste Group’s setup suggests a multiple point of entry (MPE)
resolution strategy • When determined, MREL needs are likely to be met with a
mix of own funds, senior non-preferred and senior preferred instruments
• Major entities within the Austrian resolution group *: • Erste Group Bank AG • Erste Bank Oesterreich and its subsidiaries • All other savings banks of the Haftungsverbund
• Limited non-preferred senior (NPS) need as subordination requirement does not seem to be a limiting factor
• NPS out of Austrian resolution group is expected to have a positive impact on the senior unsecured rating
• NPS benchmark issuance by Erste Group Bank AG planned in 2019 and 2020 to further strengthen subordination layer in capital structure
Page
Basel 3 capital (phased-in) in EUR bn
Risk-weighted assets (phased-in)
33
in EUR bn
Basel 3 capital ratios (phased-in)
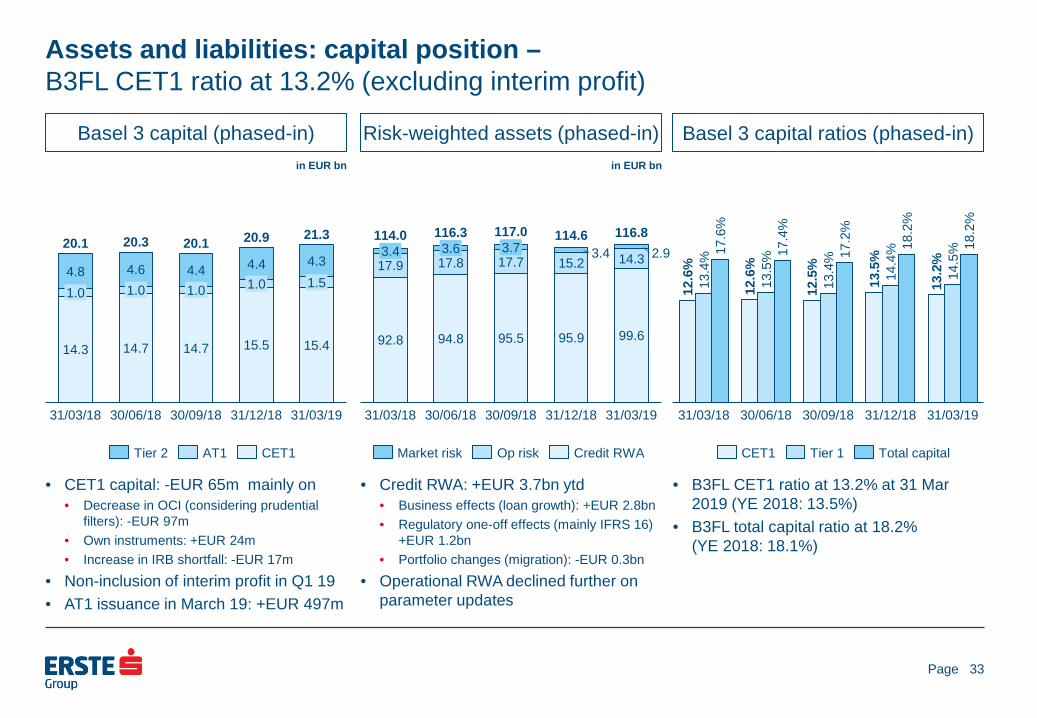
• CET1 capital: -EUR 65m mainly on • Decrease in OCI (considering prudential
filters): -EUR 97m • Own instruments: +EUR 24m • Increase in IRB shortfall: -EUR 17m
• Non-inclusion of interim profit in Q1 19 • AT1 issuance in March 19: +EUR 497m
• Credit RWA: +EUR 3.7bn ytd • Business effects (loan growth): +EUR 2.8bn • Regulatory one-off effects (mainly IFRS 16)
+EUR 1.2bn • Portfolio changes (migration): -EUR 0.3bn
• Operational RWA declined further on parameter updates
• B3FL CET1 ratio at 13.2% at 31 Mar 2019 (YE 2018: 13.5%)
• B3FL total capital ratio at 18.2% (YE 2018: 18.1%)
14.3
31/03/19
15.5
4.8 4.6
1.0 1.0 4.4
31/03/18
14.7
30/06/18
15.4
1.0
14.7
30/09/18
4.4 1.0
31/12/18
4.3 1.5
20.1 20.3 21.3 20.1 20.9
Tier 2 CET1 AT1
94.8
3.4 3.6 15.2 17.9
92.8
30/06/18 31/12/18 31/03/18
17.8 3.7
114.0
17.7
116.3
95.5
30/09/18
3.4
95.9 99.6
2.9 14.3
31/03/19
117.0 114.6 116.8
Op risk Market risk Credit RWA
30/09/18
13.5
%
31/03/18 30/06/18 31/03/19
17.2
%
31/12/18
13.4
% 17
.6%
12.6
%
13.4
%
12.6
% 17
.4%
12.5
%
14.4
%
13.5
% 18
.2%
13.2
%
14.5
% 18
.2%
CET1 Tier 1 Total capital
Assets and liabilities: capital position – B3FL CET1 ratio at 13.2% (excluding interim profit)

Page
Presentation topics
34
• Executive summary • Business environment • Business performance • Assets and liabilities • Outlook • Additional information
Page
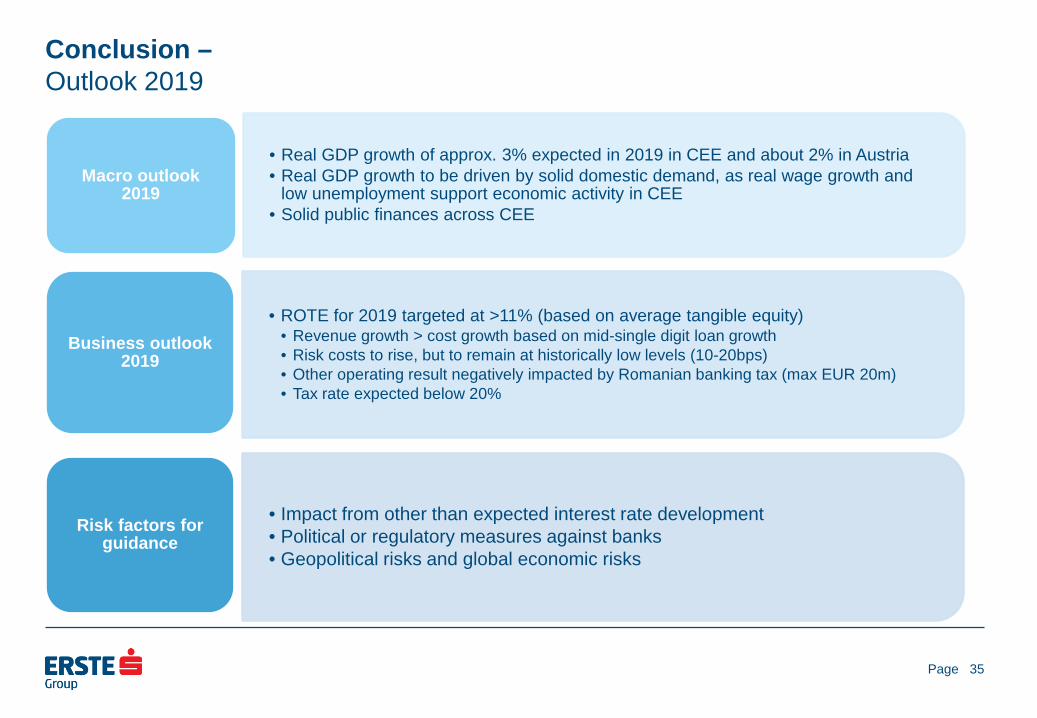
• Real GDP growth of approx. 3% expected in 2019 in CEE and about 2% in Austria • Real GDP growth to be driven by solid domestic demand, as real wage growth and
low unemployment support economic activity in CEE • Solid public finances across CEE
Macro outlook 2019
• ROTE for 2019 targeted at >11% (based on average tangible equity) • Revenue growth > cost growth based on mid-single digit loan growth • Risk costs to rise, but to remain at historically low levels (10-20bps) • Other operating result negatively impacted by Romanian banking tax (max EUR 20m) • Tax rate expected below 20%
Business outlook 2019
• Impact from other than expected interest rate development • Political or regulatory measures against banks • Geopolitical risks and global economic risks
Risk factors for guidance
Conclusion – Outlook 2019
35

Page
Presentation topics
36
• Executive summary • Business environment • Business performance • Assets and liabilities • Outlook • Additional information
Page
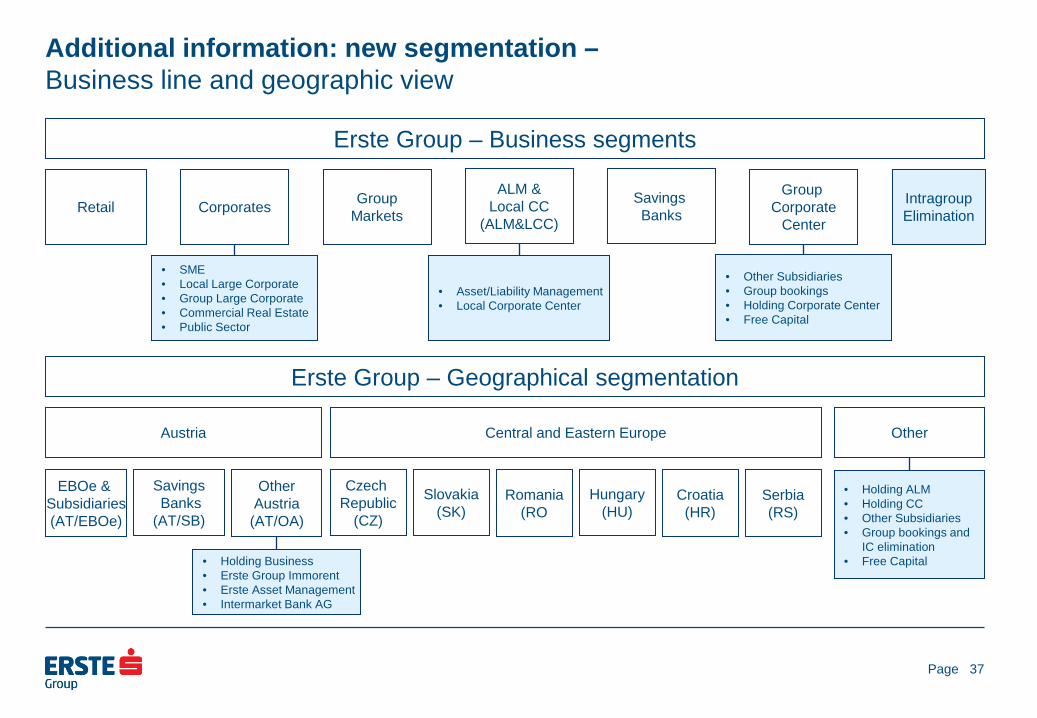
Additional information: new segmentation – Business line and geographic view
Retail
Erste Group – Business segments
Corporates Savings Banks
Group Markets
Group Corporate
Center
Intragroup Elimination
Erste Group – Geographical segmentation
Austria Central and Eastern Europe Other
EBOe & Subsidiaries (AT/EBOe)
Savings Banks (AT/SB)
Other Austria
(AT/OA)
Czech Republic
(CZ)
Slovakia (SK)
Romania (RO
Hungary (HU)
Croatia (HR)
Serbia (RS)
• Holding Business • Erste Group Immorent • Erste Asset Management • Intermarket Bank AG
• Asset/Liability Management • Local Corporate Center
• SME • Local Large Corporate • Group Large Corporate • Commercial Real Estate • Public Sector
• Other Subsidiaries • Group bookings • Holding Corporate Center • Free Capital
• Holding ALM • Holding CC • Other Subsidiaries • Group bookings and
IC elimination • Free Capital
37
ALM & Local CC
(ALM&LCC)
Page
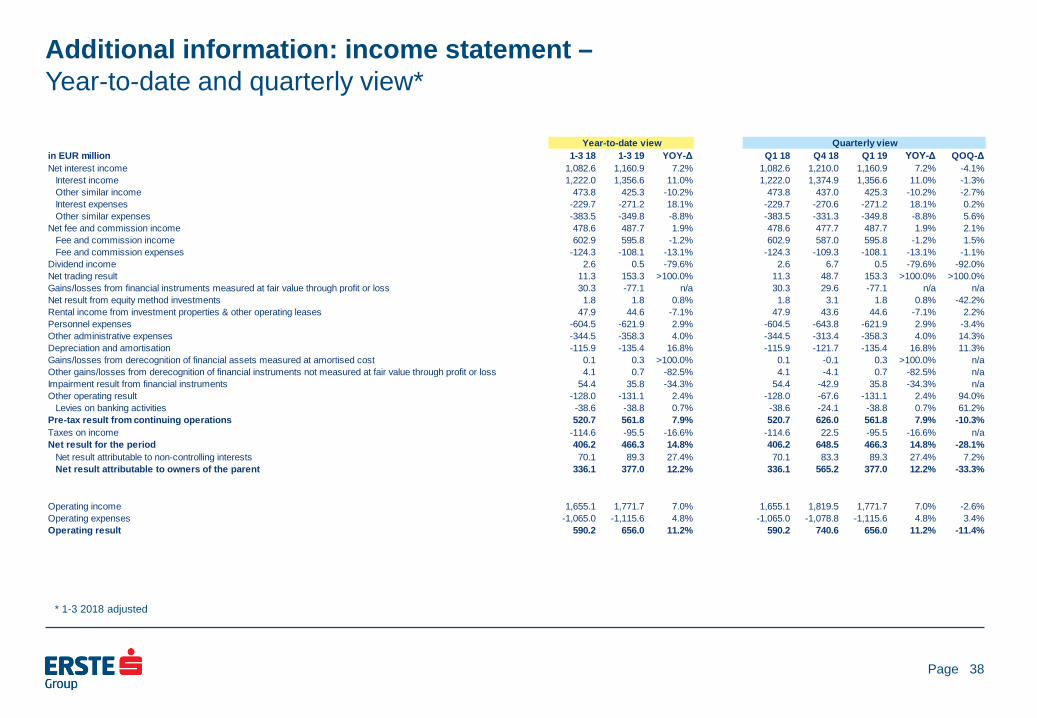
Additional information: income statement – Year-to-date and quarterly view*
38
in EUR million 1-3 18 1-3 19 YOY-Δ Q1 18 Q4 18 Q1 19 YOY-Δ QOQ-ΔNet interest income 1,082.6 1,160.9 7.2% 1,082.6 1,210.0 1,160.9 7.2% -4.1%
Interest income 1,222.0 1,356.6 11.0% 1,222.0 1,374.9 1,356.6 11.0% -1.3%Other similar income 473.8 425.3 -10.2% 473.8 437.0 425.3 -10.2% -2.7%Interest expenses -229.7 -271.2 18.1% -229.7 -270.6 -271.2 18.1% 0.2%Other similar expenses -383.5 -349.8 -8.8% -383.5 -331.3 -349.8 -8.8% 5.6%
Net fee and commission income 478.6 487.7 1.9% 478.6 477.7 487.7 1.9% 2.1%Fee and commission income 602.9 595.8 -1.2% 602.9 587.0 595.8 -1.2% 1.5%Fee and commission expenses -124.3 -108.1 -13.1% -124.3 -109.3 -108.1 -13.1% -1.1%
Dividend income 2.6 0.5 -79.6% 2.6 6.7 0.5 -79.6% -92.0%Net trading result 11.3 153.3 >100.0% 11.3 48.7 153.3 >100.0% >100.0%Gains/losses from financial instruments measured at fair value through profit or loss 30.3 -77.1 n/a 30.3 29.6 -77.1 n/a n/aNet result from equity method investments 1.8 1.8 0.8% 1.8 3.1 1.8 0.8% -42.2%Rental income from investment properties & other operating leases 47.9 44.6 -7.1% 47.9 43.6 44.6 -7.1% 2.2%Personnel expenses -604.5 -621.9 2.9% -604.5 -643.8 -621.9 2.9% -3.4%Other administrative expenses -344.5 -358.3 4.0% -344.5 -313.4 -358.3 4.0% 14.3%Depreciation and amortisation -115.9 -135.4 16.8% -115.9 -121.7 -135.4 16.8% 11.3%Gains/losses from derecognition of financial assets measured at amortised cost 0.1 0.3 >100.0% 0.1 -0.1 0.3 >100.0% n/aOther gains/losses from derecognition of financial instruments not measured at fair value through profit or loss 4.1 0.7 -82.5% 4.1 -4.1 0.7 -82.5% n/aImpairment result from financial instruments 54.4 35.8 -34.3% 54.4 -42.9 35.8 -34.3% n/aOther operating result -128.0 -131.1 2.4% -128.0 -67.6 -131.1 2.4% 94.0%
Levies on banking activities -38.6 -38.8 0.7% -38.6 -24.1 -38.8 0.7% 61.2%Pre-tax result from continuing operations 520.7 561.8 7.9% 520.7 626.0 561.8 7.9% -10.3%Taxes on income -114.6 -95.5 -16.6% -114.6 22.5 -95.5 -16.6% n/aNet result for the period 406.2 466.3 14.8% 406.2 648.5 466.3 14.8% -28.1%
Net result attributable to non-controlling interests 70.1 89.3 27.4% 70.1 83.3 89.3 27.4% 7.2%Net result attributable to owners of the parent 336.1 377.0 12.2% 336.1 565.2 377.0 12.2% -33.3%
Operating income 1,655.1 1,771.7 7.0% 1,655.1 1,819.5 1,771.7 7.0% -2.6%Operating expenses -1,065.0 -1,115.6 4.8% -1,065.0 -1,078.8 -1,115.6 4.8% 3.4%Operating result 590.2 656.0 11.2% 590.2 740.6 656.0 11.2% -11.4%
Year-to-date view Quarterly view
* 1-3 2018 adjusted
Page
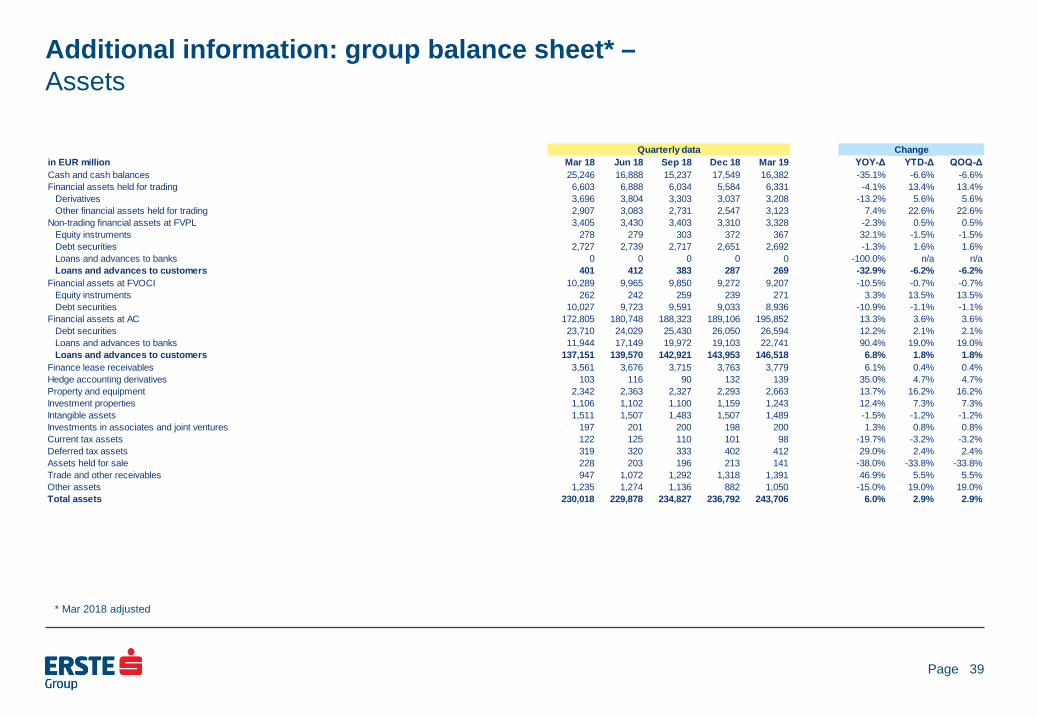
Additional information: group balance sheet* – Assets
39
in EUR million Mar 18 Jun 18 Sep 18 Dec 18 Mar 19 YOY-Δ YTD-Δ QOQ-ΔCash and cash balances 25,246 16,888 15,237 17,549 16,382 -35.1% -6.6% -6.6%Financial assets held for trading 6,603 6,888 6,034 5,584 6,331 -4.1% 13.4% 13.4%
Derivatives 3,696 3,804 3,303 3,037 3,208 -13.2% 5.6% 5.6%Other financial assets held for trading 2,907 3,083 2,731 2,547 3,123 7.4% 22.6% 22.6%
Non-trading financial assets at FVPL 3,405 3,430 3,403 3,310 3,328 -2.3% 0.5% 0.5%Equity instruments 278 279 303 372 367 32.1% -1.5% -1.5%Debt securities 2,727 2,739 2,717 2,651 2,692 -1.3% 1.6% 1.6%Loans and advances to banks 0 0 0 0 0 -100.0% n/a n/aLoans and advances to customers 401 412 383 287 269 -32.9% -6.2% -6.2%
Financial assets at FVOCI 10,289 9,965 9,850 9,272 9,207 -10.5% -0.7% -0.7%Equity instruments 262 242 259 239 271 3.3% 13.5% 13.5%Debt securities 10,027 9,723 9,591 9,033 8,936 -10.9% -1.1% -1.1%
Financial assets at AC 172,805 180,748 188,323 189,106 195,852 13.3% 3.6% 3.6%Debt securities 23,710 24,029 25,430 26,050 26,594 12.2% 2.1% 2.1%Loans and advances to banks 11,944 17,149 19,972 19,103 22,741 90.4% 19.0% 19.0%Loans and advances to customers 137,151 139,570 142,921 143,953 146,518 6.8% 1.8% 1.8%
Finance lease receivables 3,561 3,676 3,715 3,763 3,779 6.1% 0.4% 0.4%Hedge accounting derivatives 103 116 90 132 139 35.0% 4.7% 4.7%Property and equipment 2,342 2,363 2,327 2,293 2,663 13.7% 16.2% 16.2%Investment properties 1,106 1,102 1,100 1,159 1,243 12.4% 7.3% 7.3%Intangible assets 1,511 1,507 1,483 1,507 1,489 -1.5% -1.2% -1.2%Investments in associates and joint ventures 197 201 200 198 200 1.3% 0.8% 0.8%Current tax assets 122 125 110 101 98 -19.7% -3.2% -3.2%Deferred tax assets 319 320 333 402 412 29.0% 2.4% 2.4%Assets held for sale 228 203 196 213 141 -38.0% -33.8% -33.8%Trade and other receivables 947 1,072 1,292 1,318 1,391 46.9% 5.5% 5.5%Other assets 1,235 1,274 1,136 882 1,050 -15.0% 19.0% 19.0%Total assets 230,018 229,878 234,827 236,792 243,706 6.0% 2.9% 2.9%
Quarterly data Change
* Mar 2018 adjusted
Page
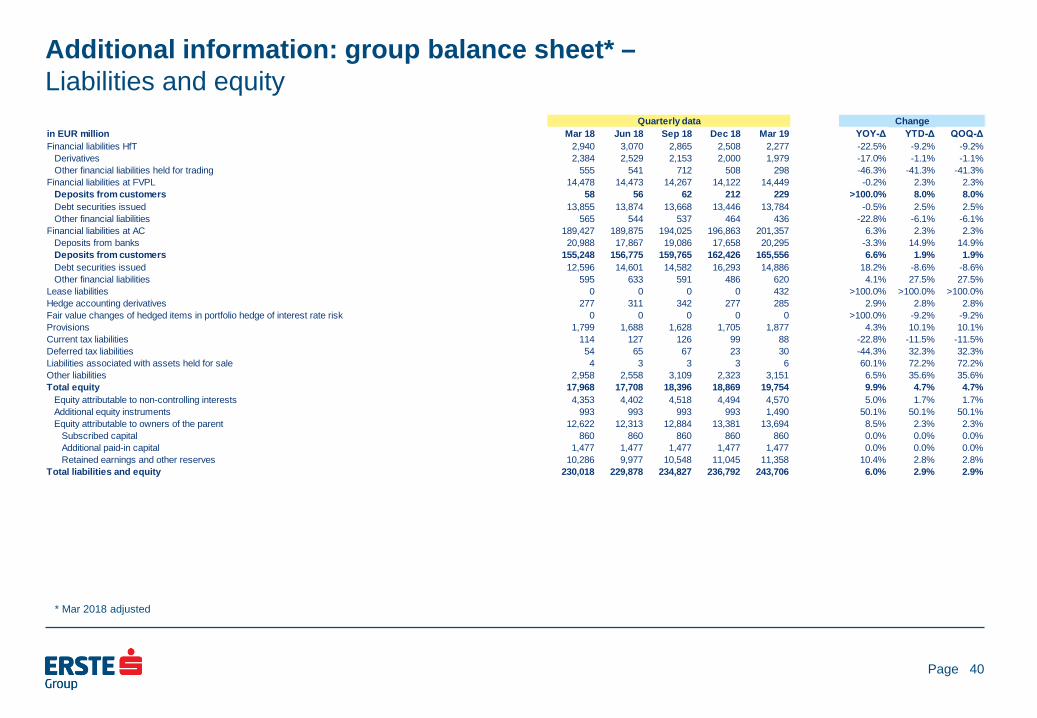
Additional information: group balance sheet* – Liabilities and equity
40
in EUR million Mar 18 Jun 18 Sep 18 Dec 18 Mar 19 YOY-Δ YTD-Δ QOQ-ΔFinancial liabilities HfT 2,940 3,070 2,865 2,508 2,277 -22.5% -9.2% -9.2%
Derivatives 2,384 2,529 2,153 2,000 1,979 -17.0% -1.1% -1.1%Other financial liabilities held for trading 555 541 712 508 298 -46.3% -41.3% -41.3%
Financial liabilities at FVPL 14,478 14,473 14,267 14,122 14,449 -0.2% 2.3% 2.3%Deposits from customers 58 56 62 212 229 >100.0% 8.0% 8.0%Debt securities issued 13,855 13,874 13,668 13,446 13,784 -0.5% 2.5% 2.5%Other financial liabilities 565 544 537 464 436 -22.8% -6.1% -6.1%
Financial liabilities at AC 189,427 189,875 194,025 196,863 201,357 6.3% 2.3% 2.3%Deposits from banks 20,988 17,867 19,086 17,658 20,295 -3.3% 14.9% 14.9%Deposits from customers 155,248 156,775 159,765 162,426 165,556 6.6% 1.9% 1.9%Debt securities issued 12,596 14,601 14,582 16,293 14,886 18.2% -8.6% -8.6%Other financial liabilities 595 633 591 486 620 4.1% 27.5% 27.5%
Lease liabilities 0 0 0 0 432 >100.0% >100.0% >100.0%Hedge accounting derivatives 277 311 342 277 285 2.9% 2.8% 2.8%Fair value changes of hedged items in portfolio hedge of interest rate risk 0 0 0 0 0 >100.0% -9.2% -9.2%Provisions 1,799 1,688 1,628 1,705 1,877 4.3% 10.1% 10.1%Current tax liabilities 114 127 126 99 88 -22.8% -11.5% -11.5%Deferred tax liabilities 54 65 67 23 30 -44.3% 32.3% 32.3%Liabilities associated with assets held for sale 4 3 3 3 6 60.1% 72.2% 72.2%Other liabilities 2,958 2,558 3,109 2,323 3,151 6.5% 35.6% 35.6%Total equity 17,968 17,708 18,396 18,869 19,754 9.9% 4.7% 4.7%
Equity attributable to non-controlling interests 4,353 4,402 4,518 4,494 4,570 5.0% 1.7% 1.7%Additional equity instruments 993 993 993 993 1,490 50.1% 50.1% 50.1%Equity attributable to owners of the parent 12,622 12,313 12,884 13,381 13,694 8.5% 2.3% 2.3%
Subscribed capital 860 860 860 860 860 0.0% 0.0% 0.0%Additional paid-in capital 1,477 1,477 1,477 1,477 1,477 0.0% 0.0% 0.0%Retained earnings and other reserves 10,286 9,977 10,548 11,045 11,358 10.4% 2.8% 2.8%
Total liabilities and equity 230,018 229,878 234,827 236,792 243,706 6.0% 2.9% 2.9%
Quarterly data Change
* Mar 2018 adjusted
Page
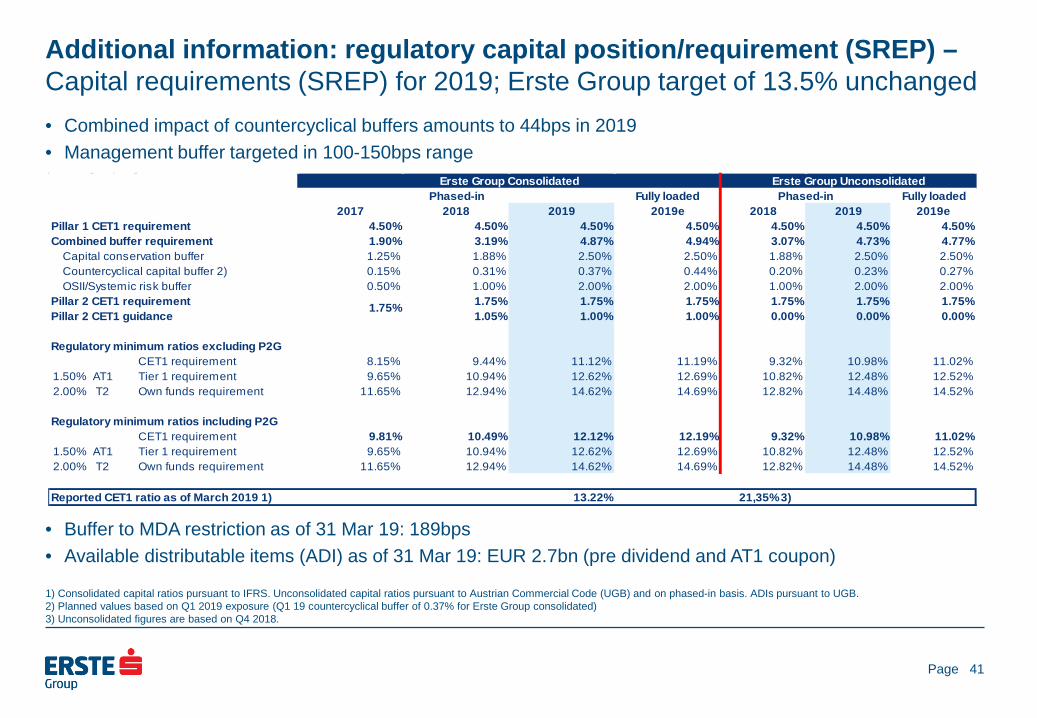
Additional information: regulatory capital position/requirement (SREP) – Capital requirements (SREP) for 2019; Erste Group target of 13.5% unchanged • Combined impact of countercyclical buffers amounts to 44bps in 2019 • Management buffer targeted in 100-150bps range
• Buffer to MDA restriction as of 31 Mar 19: 189bps • Available distributable items (ADI) as of 31 Mar 19: EUR 2.7bn (pre dividend and AT1 coupon)
41
1) Consolidated capital ratios pursuant to IFRS. Unconsolidated capital ratios pursuant to Austrian Commercial Code (UGB) and on phased-in basis. ADIs pursuant to UGB. 2) Planned values based on Q1 2019 exposure (Q1 19 countercyclical buffer of 0.37% for Erste Group consolidated) 3) Unconsolidated figures are based on Q4 2018.
Fully loaded Fully loaded2017 2018 2019 2019e 2018 2019 2019e
Pillar 1 CET1 requirement 4.50% 4.50% 4.50% 4.50% 4.50% 4.50% 4.50%Combined buffer requirement 1.90% 3.19% 4.87% 4.94% 3.07% 4.73% 4.77%
Capital conservation buffer 1.25% 1.88% 2.50% 2.50% 1.88% 2.50% 2.50%Countercyclical capital buffer 2) 0.15% 0.31% 0.37% 0.44% 0.20% 0.23% 0.27%OSII/Systemic risk buffer 0.50% 1.00% 2.00% 2.00% 1.00% 2.00% 2.00%
Pillar 2 CET1 requirement 1.75% 1.75% 1.75% 1.75% 1.75% 1.75%Pillar 2 CET1 guidance 1.05% 1.00% 1.00% 0.00% 0.00% 0.00%
Regulatory minimum ratios excluding P2GCET1 requirement 8.15% 9.44% 11.12% 11.19% 9.32% 10.98% 11.02%
1.50% AT1 Tier 1 requirement 9.65% 10.94% 12.62% 12.69% 10.82% 12.48% 12.52%2.00% T2 Own funds requirement 11.65% 12.94% 14.62% 14.69% 12.82% 14.48% 14.52%
Regulatory minimum ratios including P2GCET1 requirement 9.81% 10.49% 12.12% 12.19% 9.32% 10.98% 11.02%
1.50% AT1 Tier 1 requirement 9.65% 10.94% 12.62% 12.69% 10.82% 12.48% 12.52%2.00% T2 Own funds requirement 11.65% 12.94% 14.62% 14.69% 12.82% 14.48% 14.52%
Reported CET1 ratio as of March 2019 1) 13.22% 21,35% 3)
Phased-inErste Group Consolidated Erste Group Unconsolidated
1.75%
Phased-in
Page
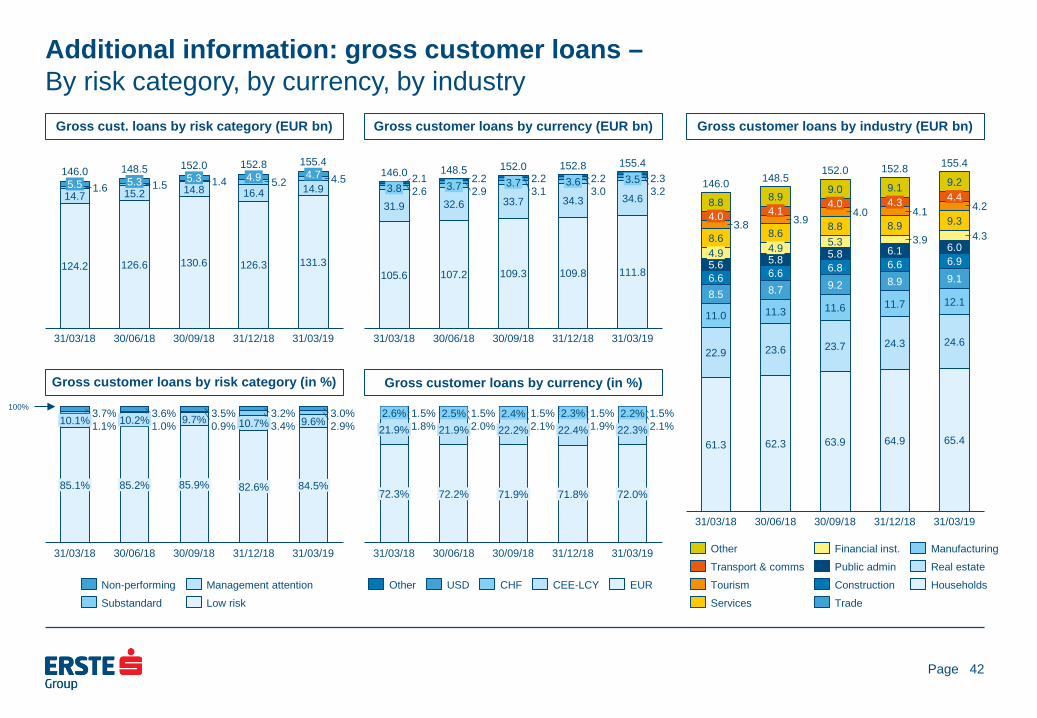
Additional information: gross customer loans – By risk category, by currency, by industry
Gross cust. loans by risk category (EUR bn)
42
Gross customer loans by currency (EUR bn) Gross customer loans by industry (EUR bn)
Gross customer loans by risk category (in %)
Gross customer loans by currency (in %)
31/03/18
1.4 1.6 16.4 5.5
131.3 124.2 130.6
14.7 5.3 1.5
15.2
126.6
30/06/18
5.3 14.8
5.2
126.3
31/12/18
4.5
31/03/19
146.0 148.5 152.0 152.8 155.4
14.9 4.9 4.7
30/09/18
Management attention Non-performing Substandard Low risk
9.7% 9.6% 1.1% 1.0% 0.9% 3.4% 2.9% 3.7% 3.6% 3.5% 3.2% 3.0% 10.1%
85.1%
10.2%
31/03/18
85.2%
30/06/18
85.9%
30/09/18
10.7%
82.6%
31/12/18
84.5%
31/03/19
100%
2.6
105.6
3.8 2.2 2.9 3.7
32.6
111.8
3.7
107.2
30/06/18
2.2
33.7 3.1
109.3
146.0
34.3
3.6
30/09/18
2.3 2.2
31/03/18
152.0
3.0 31.9
109.8
31/12/18
2.1 3.2
31/03/19
34.6
148.5 152.8 155.4 3.5
Other USD EUR CHF CEE-LCY
1.8% 2.0% 2.1% 1.9% 2.1% 1.5% 1.5% 1.5% 1.5% 1.5%
30/06/18
22.4% 21.9%
72.3%
22.3%
72.0%
2.6%
31/03/18
2.5% 21.9%
71.9% 72.2%
22.2% 2.4%
30/09/18
2.3%
71.8%
31/12/18
2.2%
31/03/19
6.6
4.9
22.9
4.3
6.1
3.8
5.8
8.6
4.2
6.6
8.5
8.6
6.6
9.1
3.9
6.0
30/09/18
11.0
61.3
8.9 4.1
64.9
4.9
11.3
5.8
8.7
23.6
11.6
5.3
62.3
30/06/18
9.0
63.9
146.0
9.2
4.0
6.9
4.0 8.8
6.8
11.7
23.7
4.1 8.9
3.9
8.9
8.8
31/12/18
9.2 4.4
31/03/18
4.3
9.1
12.1
24.6 24.3
31/03/19
148.5 152.0 152.8 155.4
9.3 4.0
5.6
65.4
Other Financial inst. Transport & comms
Services Tourism
Manufacturing Public admin Real estate Construction Trade
Households
Page
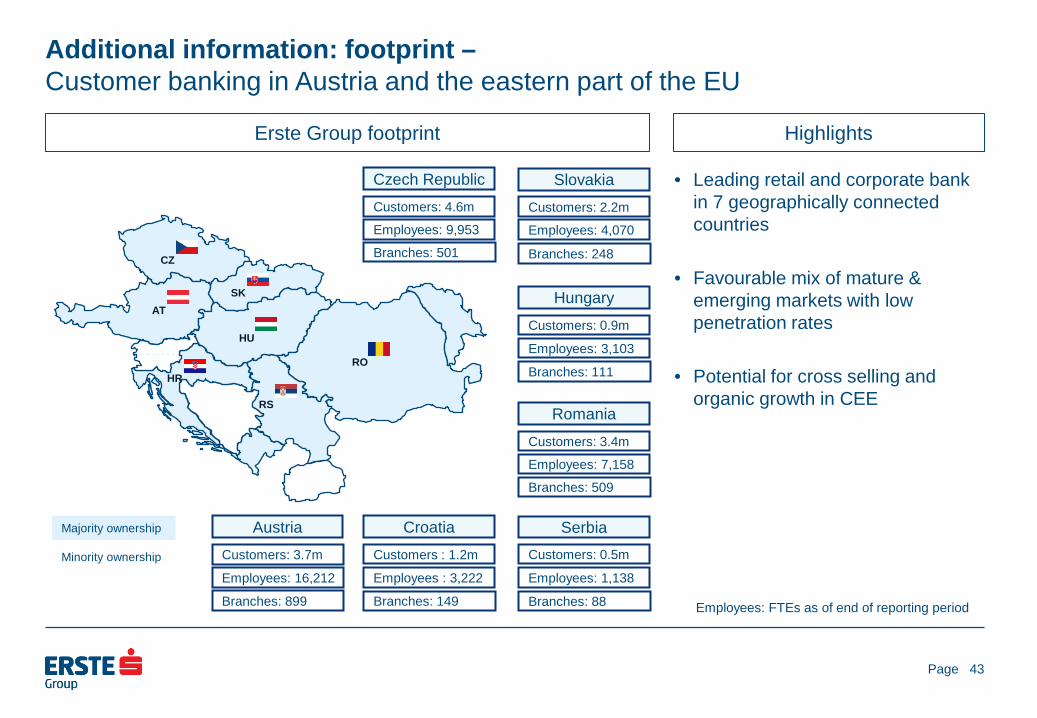
• Leading retail and corporate bank in 7 geographically connected countries
• Favourable mix of mature & emerging markets with low penetration rates
• Potential for cross selling and organic growth in CEE
Additional information: footprint – Customer banking in Austria and the eastern part of the EU
Erste Group footprint Highlights
43
Majority ownership
Minority ownership
Customers: 0.9m
Hungary
Employees: 3,103
Branches: 111
Customers: 3.4m
Romania
Employees: 7,158
Branches: 509
Customers: 0.5m
Serbia
Employees: 1,138
Branches: 88
Customers : 1.2m
Croatia
Employees : 3,222
Branches: 149
Customers: 4.6m
Czech Republic
Employees: 9,953
Branches: 501
Customers: 2.2m
Slovakia
Employees: 4,070
Branches: 248
Customers: 3.7m
Austria
Employees: 16,212
Branches: 899
AT
CZ
SK
HU
RO HR
RS
Employees: FTEs as of end of reporting period
Page
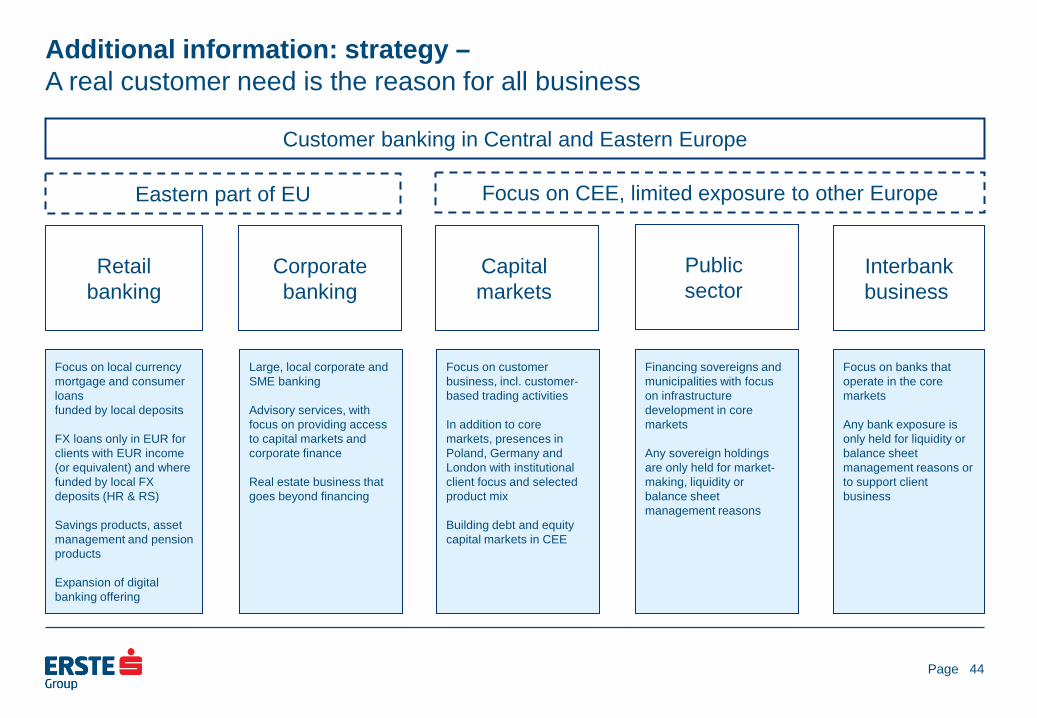
Additional information: strategy – A real customer need is the reason for all business
Retail banking
Corporate banking
Capital markets
Public sector
Interbank business
Customer banking in Central and Eastern Europe
Eastern part of EU Focus on CEE, limited exposure to other Europe
Focus on local currency mortgage and consumer loans funded by local deposits FX loans only in EUR for clients with EUR income (or equivalent) and where funded by local FX deposits (HR & RS) Savings products, asset management and pension products Expansion of digital banking offering
Focus on customer business, incl. customer-based trading activities In addition to core markets, presences in Poland, Germany and London with institutional client focus and selected product mix Building debt and equity capital markets in CEE
Financing sovereigns and municipalities with focus on infrastructure development in core markets Any sovereign holdings are only held for market-making, liquidity or balance sheet management reasons
Large, local corporate and SME banking Advisory services, with focus on providing access to capital markets and corporate finance Real estate business that goes beyond financing
Focus on banks that operate in the core markets Any bank exposure is only held for liquidity or balance sheet management reasons or to support client business
44
Page
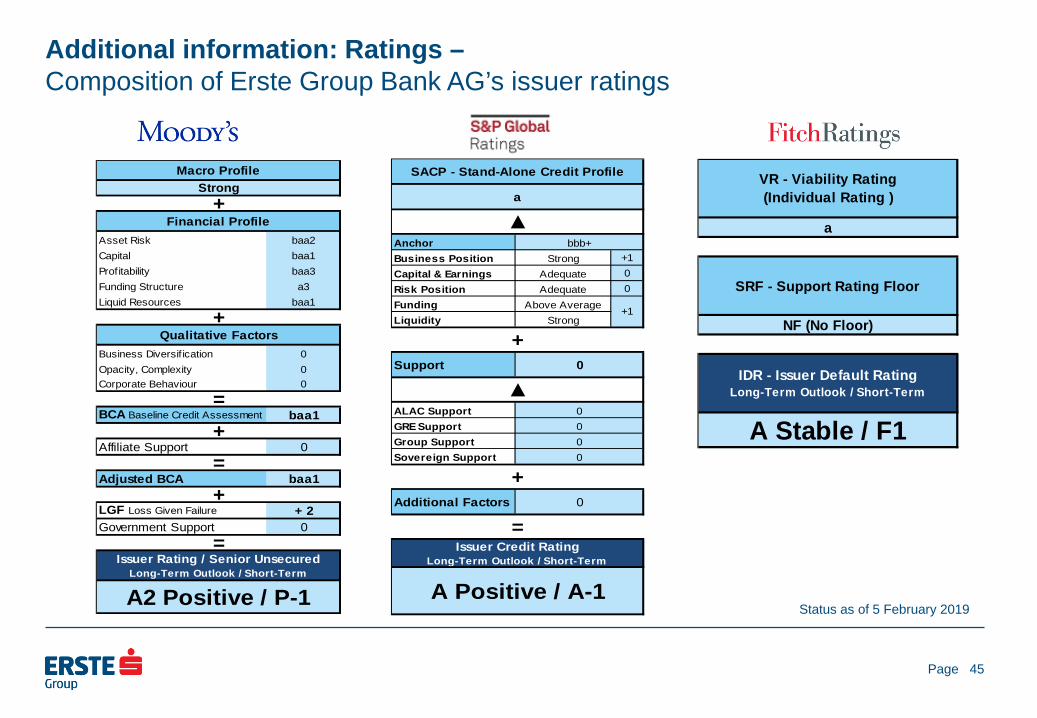
Additional information: Ratings – Composition of Erste Group Bank AG’s issuer ratings
45
Status as of 5 February 2019
AnchorBusiness Position Strong +1Capital & Earnings Adequate 0Risk Position Adequate 0Funding Above AverageLiquidity Strong
Support
ALAC SupportGRE SupportGroup SupportSovereign Support
Additional Factors
SACP - Stand-Alone Credit Profile
a
00
+
bbb+
+1
0
▲
▲
=Issuer Credit Rating
Long-Term Outlook / Short-Term
A Positive / A-1
00
0
+
Asset Risk baa2Capital baa1Profitability baa3Funding Structure a3Liquid Resources baa1
Business Diversif ication 0Opacity, Complexity 0Corporate Behaviour 0
BCA Baseline Credit Assessment baa1
Affiliate Support 0
Adjusted BCA baa1
LGF Loss Given Failure + 2Government Support 0
Qualitative Factors
Macro ProfileStrong
+Financial Profile
+
+
=Issuer Rating / Senior Unsecured
Long-Term Outlook / Short-Term
A2 Positive / P-1
=+=
A Stable / F1
VR - Viability Rating (Individual Rating )
a
SRF - Support Rating Floor
NF (No Floor)
IDR - Issuer Default Rating Long-Term Outlook / Short-Term
Page 46
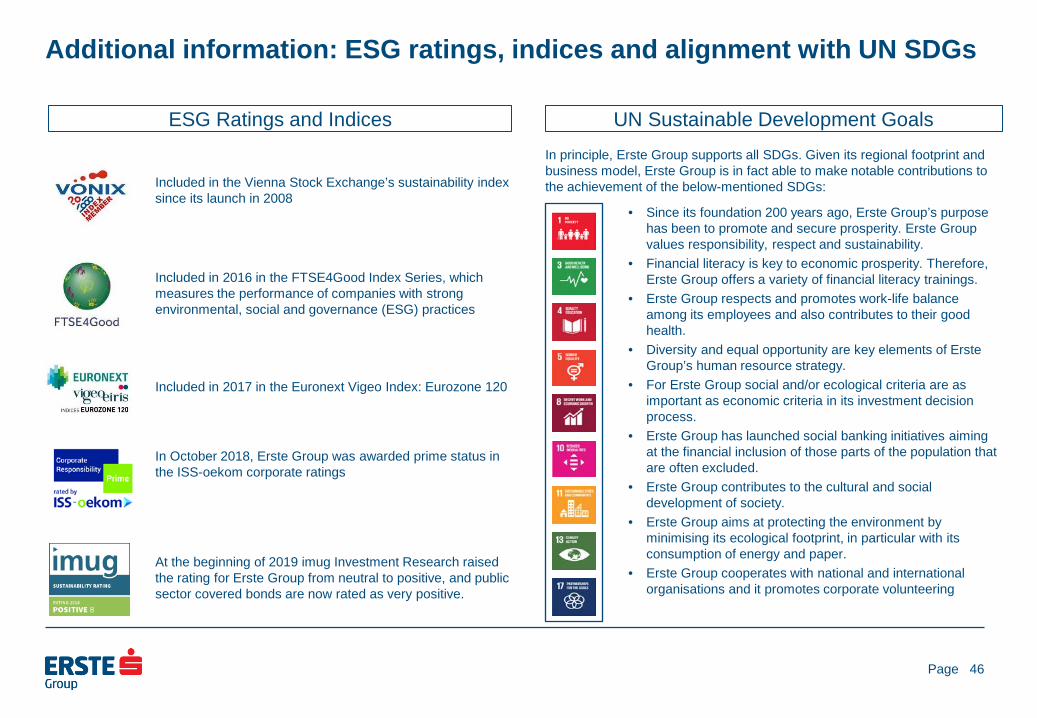
Additional information: ESG ratings, indices and alignment with UN SDGs
Included in 2016 in the FTSE4Good Index Series, which measures the performance of companies with strong environmental, social and governance (ESG) practices
In October 2018, Erste Group was awarded prime status in the ISS-oekom corporate ratings
UN Sustainable Development Goals
• Since its foundation 200 years ago, Erste Group’s purpose has been to promote and secure prosperity. Erste Group values responsibility, respect and sustainability.
• Financial literacy is key to economic prosperity. Therefore, Erste Group offers a variety of financial literacy trainings.
• Erste Group respects and promotes work-life balance among its employees and also contributes to their good health.
• Diversity and equal opportunity are key elements of Erste Group’s human resource strategy.
• For Erste Group social and/or ecological criteria are as important as economic criteria in its investment decision process.
• Erste Group has launched social banking initiatives aiming at the financial inclusion of those parts of the population that are often excluded.
• Erste Group contributes to the cultural and social development of society.
• Erste Group aims at protecting the environment by minimising its ecological footprint, in particular with its consumption of energy and paper.
• Erste Group cooperates with national and international organisations and it promotes corporate volunteering
Included in the Vienna Stock Exchange’s sustainability index since its launch in 2008
Included in 2017 in the Euronext Vigeo Index: Eurozone 120
ESG Ratings and Indices
At the beginning of 2019 imug Investment Research raised the rating for Erste Group from neutral to positive, and public sector covered bonds are now rated as very positive.
In principle, Erste Group supports all SDGs. Given its regional footprint and business model, Erste Group is in fact able to make notable contributions to the achievement of the below-mentioned SDGs:
Page
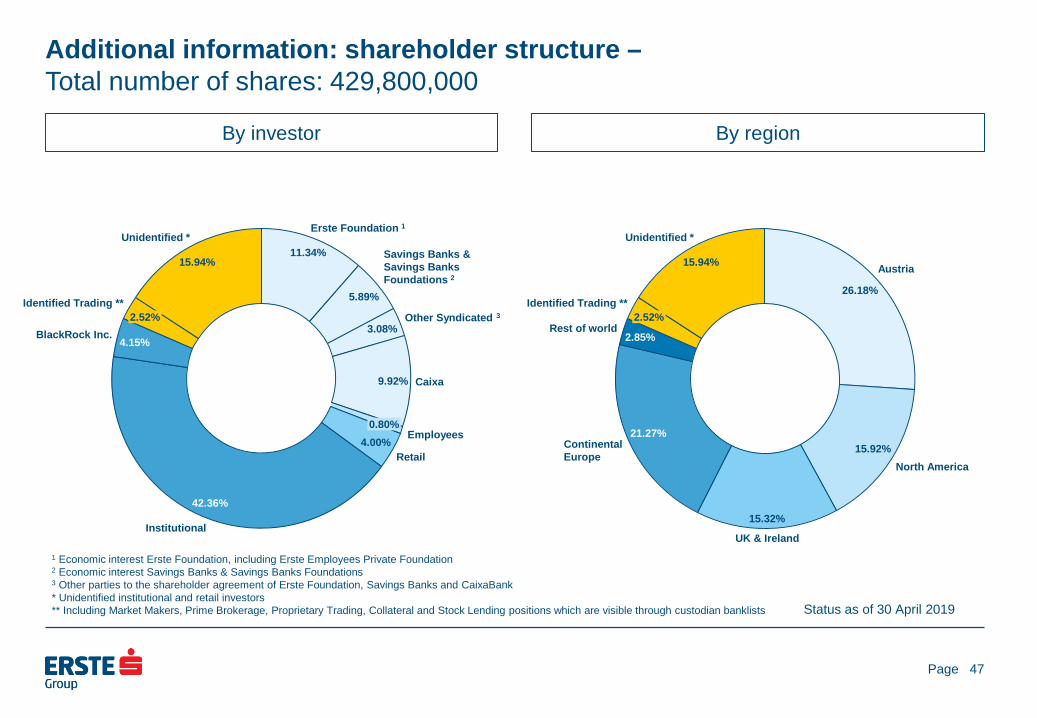
Additional information: shareholder structure – Total number of shares: 429,800,000
By investor By region
47
1 Economic interest Erste Foundation, including Erste Employees Private Foundation 2 Economic interest Savings Banks & Savings Banks Foundations 3 Other parties to the shareholder agreement of Erste Foundation, Savings Banks and CaixaBank * Unidentified institutional and retail investors ** Including Market Makers, Prime Brokerage, Proprietary Trading, Collateral and Stock Lending positions which are visible through custodian banklists Status as of 30 April 2019
11.34%
5.89%
3.08%
9.92%
4.00%
42.36%
4.15%
15.94%
Caixa
Erste Foundation 1
Retail
Unidentified *
0.80%
Savings Banks & Savings Banks Foundations 2
Other Syndicated 3
Employees
Institutional
BlackRock Inc. 2.52%
Identified Trading ** 26.18%
15.92%
15.32%
21.27%
2.85%
15.94% Austria
Continental Europe
2.52%
North America
Identified Trading **
UK & Ireland
Rest of world
Unidentified *
Page
Investor relations details
• Erste Group Bank AG, Am Belvedere 1, 1100 Vienna E-mail: [email protected] Internet: http://www.erstegroup.com/investorrelations
http://twitter.com/ErsteGroupIR http://www.slideshare.net/Erste_Group Erste Group IR App for iPad, iPhone and Android http://www.erstegroup.com/de/Investoren/IR_App
Reuters: ERST.VI Bloomberg: EBS AV Datastream: O:ERS ISIN: AT0000652011
• Contacts Thomas Sommerauer Tel: +43 (0)5 0100 17326 e-mail: [email protected] Peter Makray Tel: +43 (0)5 0100 16878 e-mail: [email protected] Simone Pilz Tel: +43 (0)5 0100 13036 e-mail: [email protected] Gerald Krames Tel: +43 (0)5 0100 12751 e-mail: [email protected]
48