Embed Size (px)
Citation preview

Journal of Surgical Oncology 2004;88:161–181
Errors in Pathology and Laboratory Medicine:Consequences and Prevention
SANDRA C. HOLLENSEAD, MD, WILLIAM B. LOCKWOOD, PhD, MD, AND RONALD J. ELIN, MD, PhD,*Department of Pathology and Laboratory Medicine, University of Louisville SOM, Louisville, Kentucky
Reducing errors and improving quality are an integral part of Pathology and Labo-ratory Medicine. The rate of errors is reviewed for the pre-analytical, analytical, andpost-analytical phases for a specimen. The quality systems in place in pathology todayare identified and compared with benchmarks for quality. The types and frequency oferrors and quality systems are reviewed for surgical pathology, cytopathology, clinicalchemistry, hematology, microbiology, molecular biology, and transfusion medicine.Seven recommendations are made to reduce errors in future for Pathology and Labo-ratory Medicine.J. Surg. Oncol. 2004;88:161–181. � 2004 Wiley-Liss, Inc.
KEY WORDS: pathology; laboratory medicine; errors; quality improvement
Intelligence is not to make no mistakes,But quickly to see how to make them good.
Bertolt Brecht, The Measures Taken
INTRODUCTION
According to the National Academies Institute ofMedicine (IOM), medical errors lead to an estimated44,000–98,000 deaths and perhaps as many as 1 millioninjuries per year in the United States [1]. The JointCommission on Accreditation of Hospitals Organization(JCAHO) has begun to address this by issuing patientsafety goals for 2004 [2]. An important goal is improvedaccuracy of patient identification, while another is im-proved effectiveness of communication among care givers.Both of these goals have implications in the practice ofpathology and laboratory medicine, and indeed, havebeen recognized before these formal declarations.
The following comments are heard far too often inpathology and laboratory medicine: ‘‘This result can’t beright. The laboratory messed up again!’’ Clinicians fordecades have attributed many patient results that do notfit expected findings to laboratory error. Only recentlyhave pathologists and laboratorians begun to scientifi-cally investigate the root cause of analytical andoperational errors in pathology and the clinical labora-tory. It has been estimated that up to 75% of laboratoryerrors generate ‘‘normal’’ results, approximately 12%produce absurd results, and approximately 12% are signi-ficant errors that may impact patient care [3]. The validityof such data has been influenced in the past by the lack of
adequate reporting of laboratory errors, by the culture oflitigation in healthcare in general, and by the slow migra-tion of quality assurance tools used in other industries topathology and the clinical laboratory arena.
A transitional point in the movement of pathology andthe clinical laboratory towards improved industry stan-dards was the implementation of the federal governmentClinical Laboratory Improvement Amendments of 1988(CLIA’88) [4]. Although the impetus for this regulationwas due to media investigative reports of patient deathsrelated to erroneous cytopathology reports, the legislationincorporated standards for general laboratory qualityperformance. A second regulatory document havingmajor impact on laboratory quality assurance was thepublication by the US Food and Drug Administration(FDA) in 1995 giving guidance to blood bank establish-ments [5]. Shortly thereafter, the major accreditingagency for blood establishments, the American Associa-tion of Blood Banks (AABB), issued Quality SystemEssentials (QSEs) for their membership [6]. Otherbusiness and industry groups were also formulating‘‘quality’’ manufacturing initiatives which culminated inthe publication in 1998 by the International Organization
*Correspondence to: Ronald J. Elin, MD, PhD, Professor and Chairman,Department of Pathology and Laboratory Medicine, University ofLouisville SOM, 512 S. Hancock St. #203, Louisville, KY 40202. Fax:502-852-8299. E-mail: [email protected]
DOI 10.1002/jso.20125
Published online in Wiley InterScience (www.interscience.wiley.com).
� 2004 Wiley-Liss, Inc.

for Standardization (IOS) of their guidelines—ISO 9000[7]. Quality systems were beginning to arise in all sectorsto improve consumer confidence and safety.Although the definitions of ‘‘error’’ are varied, a reaso-
nable definition for clinical laboratories is ‘‘any defectfrom ordering tests to reporting results and appropriatelyinterpreting and reacting on these’’ [8]. This definition ofa total testing process begins and ends with patient careand incorporates the classic three phases of performinglaboratory testing: (1) pre-analytical, (2) analytical, and(3) post-analytical (Fig. 1) [9]. Each of these phases whencarried out properly plays an important role in preventinglaboratory errors.
Pre-analytical Phase
The traditional laboratory approach to correct pre-analytical tasks has involved providing appropriate clinicalhistory, proper patient preparation, proper collection oflaboratory specimens (patient and specimen identifica-tion, appropriate sample collection containers), properpreparation of these samples (transportation, handling,accession), and assurance that the testing equipment was‘‘in control’’ for testing. Newer models for the pre-analytical phase also include patient satisfaction with thecollection process (demeanor and knowledge of staff),professional staff satisfaction with this phase (requestforms easy to understand, availability of satellite drawingstations, adequate specimen transport), and generalcustomer service satisfaction with the menu of testingoffered.In a recent study by an ISO 9002:1994 certified clinical
laboratory, 84.5% of errors detected in their laboratory
occurred in the pre-analytical phase [10]. Patient careunits using non-laboratory personnel accounted for95.2% of these mistakes. The causes attributed to theseerrors in both the inpatient and outpatient areas are listedin Table I. As all the errors in this study resulted fromhuman error, more effective processes, technology (bar-code readers), and educational tools are needed todecrease the pre-analytical causes of error.Pathologists and clinical laboratory scientists are aware
of other less controllable sources for potential pre-analytical error that include cyclic (circadian) variationand patient-related physical variables (exercise, diet,stress, positional effects). When combined with otherknown pre-analytical sources of error (incorrect bloodcollection technique, anticoagulants, and sample tubes),the errors in just obtaining the optimum sample foranalysis can add additional cost to healthcare.
Analytical Phase
The traditional laboratory approach to the analyticalprocess has involved the actual test performance andresult calculation. Enhancements to the analytical phasenow include adequate turn-around time (TAT), easyunderstanding of test result reports (manual or electronicformat), availability of add-on and repeat testing, andgeneral customer service in timely and accurate responseto questions. Newer audit criteria in anatomic pathologyare focusing on correctness of diagnosis, number of de-ferred diagnoses, and physician performance assessment.Anatomic and clinical laboratories have the respon-
sibility for research and development of newer testmethods, implementing and communicating to theircustomers revised laboratory test protocols, currentlaboratory terminology and normal/abnormal test resultcriteria. Rejection of a specimen because it does notmeet laboratory requirements is not well received bythe clinical staff, but is a necessary component of theanalytical phase of testing. Analytical timeliness (TAT)has been a common audit tool for the analytical phase oflaboratory testing. However, a rapid TAT for an erroneousresult will not improve laboratory operations or patientcare. Adherence by the clinical laboratory to standard
Fig. 1. Laboratory testing begins and ends with patient care. Any partof the process may contribute to laboratory error [9]. (Used withpermission)
TABLE I. Types of Pre-analytical Error in Laboratory Testing(Modified From Wiwanitkit [10])
Type of error
Percent of pre-analytical
errors
Inaccurate quality of specimen 47.0
Wrong identification of the patient 26.8
Missing physician order 14.0
Inappropriate quantity of specimen 11.6
Use of inappropriate container 0.6
162 Hollensead et al.

operating procedures (SOPs) and manufacturers/regula-tors instrument calibration and preventative maintenanceschedules, providing an adequate number of staff toperform the analytical phase of testing who are properlytrained in their job tasks, and participation in externalreviews of analyte testing (proficiency testing) will helpensure that the laboratory provides quality service duringthe analytical phase of patient testing.
Post-analytical Phase
The traditional laboratory approach to the post-analytical phase has involved routine generation andtransmission of the test results. Newer models includebilling issues (correct codes, user-friendly bill format),patient safety issues (reporting STAT results and criticalvalues in a timely manner), and general customer satis-faction surveys (wait times, informational materials, useof the lab in the future).
The inability of the clinical laboratory to report resultshas been attributed by Stahl et al. to: (1) patient-related(patient not available for sample procurement); (2)specimen-related (pre-analytical errors); (3) specimen-transport related (broken tubes, incorrect transport condi-tions); (4) laboratory-related (pre-analytical/analytical);and (5) calculation/evaluation of results [11]. Approxi-mately 16% of the laboratory mistakes in the study weredue to a post-analytical mistake. In another study, post-analytical mistakes accounted for 18.5% of errors inSTAT testing [12]. The majority of these errors resultedfrom failing to correct an erroneous result and notnotifying the physician of a laboratory-testing problem.
Advancement in computer technology has assistedclinical laboratories in reducing problems in the post-analytical phase of testing. However, keyboard entryerrors occur and hospital and/or laboratory computerdown-time can have major consequences in resultingpatient tests. The cost for many of the informationtechnologies now available may be prohibitive to manylaboratories in an era of budget reduction.
What is the impact of errors in the three phases ofclinical laboratory testing on patient outcomes? Inanatomic pathology, the outcome of an erroneous frozensection diagnosis resulting in surgery modification,termination or a new procedure has been shown to be39% [13]. In the laboratory medicine, 70–74% of thelaboratory errors had no significant impact on patientoutcome [12,14]. However, in 7–20% of the errors,inappropriate patient care resulted. These were, for themost part, avoidable negative patient outcomes.
The clinical laboratory must continue to pursue higherquality initiatives in order to minimize ‘‘blunders’’ in anyaspect of patient testing. Reduction of human errorthrough root-cause analysis, process control, enhanced
metric utilization, use of newer information technologies,and constant education and communication can beachieved.
What concerns everyone can only be resolved byeveryone.
Freidrich Durrenmatt
QUALITY SYSTEMS ESSENTIALSIN PATHOLOGY
Definitions of quality abound depending on the industryin question, as stated by Moore and Foss [15]. ‘‘Quality,like pornography, is somewhat difficult to define, butis usually recognizable when it is seen.’’ Healthcareorganizations have lagged behind their manufacturingcounterparts in recognizing the importance of imple-menting quality systems as an integral component of theiroperations. The impetus for improvements in the qualitymission in healthcare facilities has been spearheaded bygreater regulatory and/or accreditation oversight. Moreknowledgeable patient consumers have also required thisindustry to intensify their focus on error management andoutcomes assessment.
The official definition of a ‘‘quality system’’ comesfrom the ISO 9000 Quality Standards used in businessand industry [16]: A quality system is the organizationalstructure, responsibilities, procedures, processes, and re-sources for implementing quality management [12,16].The quality system represents only one level of amultilevel quality model as shown in Figure 2 [17].
Laboratory Medicine specialists have traditionallyemphasized the quality control (QC) level in this modelin the daily operations of the clinical laboratory. Instru-ment calibration and validation, reagent performance,linearity measurements, and result output undergo robustanalysis and monitoring. Surgical pathology utilizescontrol tissue slides with special stains and peer reviewof tissue diagnoses. Progression to the higher levels of
Fig. 2. The Pyramid Model to Total Quality Management (TQM).
Errors in Pathology 163

Total Quality Management (TQM) is rapidly beingundertaken in this setting as greater emphasis on totalfacility quality becomes the norm. QSEs represents thekeystone of achieving ‘‘world class quality’’ status.What are QSEs? They represent what the organization
says it will do to have a quality system in place to preventerrors and then do what they say they are going to do.Components of a QSE plan usually incorporate thefollowing items [16,18,19]:
* policies (statement of what the facility will do),* processes (written documents describing the who,
what, when, where of the operation),* organization* personnel (staffing, job descriptions, training, compe-
tency)* equipment (proper use, validation, maintenance,
adjacencies with other departments)* supplier issues (qualifications, contracts)* process control, final inspection, handling (perfor-
mance of task, evaluation of task, minimize handoffs)* documents and records (design, user friendliness,
storage/retention, legibility)* incidents, errors, and accidents (reporting, investigat-
ing, corrective actions, effectiveness checks)* assessments (internal and external)* process improvement* facilities and safety (space, design, review of safety
policies)* standard operating procedures (SOPs), forms, records.
Hospitals and other healthcare organizations voluntarilyaccredited by the JCAHO have been required to reportserious adverse patient occurrences (sentinel events)since 1998 [20]. The requirement was later revised tohave accredited facilities develop a system to detect,evaluate, and track such cases in a more proactive manner[21]. A recent report on the status of errors in medicinehas generated renewed interest by both regulatory andvolunteer accrediting organizations in developing qualitymechanisms for preventing patient errors before theyoccur [1].The Transfusion Medicine section of the clinical
laboratory has been the earliest unit to develop qualityprocedures to evaluate the frequency, cause, and preven-tion of errors. This was in response to the realization thatcatastrophic consequences occur in patients who mayreceive a wrong unit of blood. Due to the strict regulationof the blood industry by the FDA blood centers, bloodbanks, and transfusion services implemented QSEs priorto other patient care departments. The AABB memberswere introduced to these concepts in 1997 [22] andimplemented with the publication of the 18th edition ofStandards for Blood Banks and Transfusion Services[23]. It has taken the blood banking community several
years to master the essentials, but now noncompliance(observations) as shown by FDA and AABB externalassessments is now decreasing (Fig. 3) [24,25].Manufacturing companies are now advancing into
the next generation of quality improvement essentials.This new quality tool, Six Sigma, incorporates manage-ment commitment and support, a basic problem-solvingmethodology relying heavily on metric analysis, anda management system that supports continual improve-ment [26]. Sigma is an approximation of the averagedistance from the peak of a bell shaped curve. This istypically represented in laboratory statistics as thestandard deviation (SD), which measures the variabilityof testing data around the mean of that data set. Labo-ratory deviation for QC is normally acceptable at �2 SD.This equates to Two Sigma (approximately 1 out of 20) orresults within 95.44% dispersion from the mean. Theaverage American company operates at the Four Sigmalevel or a 99.4% yield [27]. Examples of Four Sigmaoperations in healthcare include: 5000 incorrect surgicalprocedures per week, or 200,000 incorrect drug prescrip-tions per year [28]. A decrease of errors to Six Sigmaequates to 3.4 errors per million actions, compared to6,210 per million actions for a Four Sigma process. Inorder to raise the bar of QSEs to this nearly perfectperformance in process control, the healthcare organi-zations will need to improve the ‘‘will, ideas, andexecution’’ of their quality approach for success in errorreduction [29].In conjunction with Six Sigma, many manufacturing
organizations include Lean Thinking as a methodologyfor identifying opportunities to eliminate errors [30].A ‘‘lean’’ laboratory organization delivers the serviceat the right time, reduces waste, and improves overallefficiency in the pre-analytical, analytical, and post-analytical phases of specimen testing. Such improve-ments in performance should assist the organization inmeeting or exceeding the ‘‘customer’’ expectations.
Fig. 3. Percent non-compliant observations graphed by year ofinspection showing an overall downward trend. [Color figure can beviewed in the online issue, available at www.interscience.wiley.com.]
164 Hollensead et al.

Although there is a 12% vacancy rate in the nation’sclinical laboratories, an example of Lean Thinking wouldbe to prioritize technologist assignments on value-addedtasks that yield greater productivity and improve morale[31].
Several models have been proposed to identify andreduce hospital errors. One such model is a modificationof the aviation safety model which now has reduced theairlines industry error rate to 1 in 2,000,000 tasks [32].As depicted in Figure 4, the model depicts three pathsa hospital error may take: (1) an unidentified problemwithout a negative patient outcome, (2) an identifiedproblem through safety policies and processes designedto improve quality (QSEs), or (3) an error that results in apatient adverse event.
Pathology as a hospital-based profession is in a uniqueposition to facilitate the incorporation of QSEs into theoperation models of their hospital colleagues. Represen-tation by pathologists on hospital quality councils forutilization of their quality expertise, participation byclinical laboratory professionals/technologists in assist-ing other medical/surgical unit staff on how to implementQSEs in their division, open communication by allhospital groups to detect and report process failures andpatient errors, and strong support by hospital adminis-trators and boards to promote the use of QSEs bothfinancially and philosophically can only help lead theorganization to the top hierarchy of TQM.
The greatest mistake you can make in life is to becontinually fearing you will make one.
Elbert Hubbard (1856–1915)
ERRORS IN ANATOMIC PATHOLOGY
Emphasis on error reduction as a response to publicconcern is not new to anatomic pathology. In 1987, aseries of articles regarding accuracy of Papanicolaou(Pap) smears appeared in the press [33,34]. The concernraised about false-negative Pap smears led to federalregulation for all laboratories practicing gynecologiccytology under CLIA’88, and subsequently to theBethesda system for reporting cervical cytology diag-noses in a standardized way with clinically acceptedterminology [35]. Experience with the response to thesemandates by cytopathology services is also helpful inaddressing the current concerns about patient safety andmedical error reduction in anatomic pathology.
Surgical Pathology
Many of the points discussed for cytopathology errorreduction have similar applications for anatomic pathologyand tissue examination. However, the task may be moredifficult, as surgical pathology is more complex, invol-ving neoplastic and non-neoplastic lesions, classification,staging, and grading of malignancies. Studies involvingreview of consecutive cases for surgical pathology errorshave identified false-negative errors (missing a lesioncompletely) to be the most frequent. This is in contrast tostudies regarding error as determined by consultativepathology services, where false positive diagnosis,threshold errors (a difference of opinion involving aspectrum of a process, but not an error in identifying theprocess), and typing and grading of tumors were the mostfrequent errors [36].
Guidelines for performance of quality work in theareas of gross and histologic examinations, performanceof frozen sections, and autopsy examinations have comefrom the College of American Pathologists (CAP) andJCAHO. Communication between clinicians and pathol-ogists is again essential for arriving at the correct patho-logic diagnosis. Although most request forms for surgicalpathology exam have a place for a brief history, theavailability of medical records through hospital infor-mation systems has greatly aided the pathologist in ob-taining pertinent clinical history for a surgical pathologyexamination. In many instances, an organ can only reactin a few ways to different stimuli, and addition of clinicalhistory, physical examination, and results of laboratorytests can help greatly in narrowing a differential for thesurgical pathologist. Clinical correlation of pathologicfindings is then instrumental in arriving at the correctdiagnosis for the patient.
The timely reporting of interpretive results for smallbiopsies, and complex large anatomic specimens is alsoimportant for patient care, and many laboratories willmonitor their TAT for anatomic pathology with the goal
Fig. 4. A PROCESS model for the reduction and prevention ofhospital errors [32].
Errors in Pathology 165

of having the majority of cases signed out within a day ortwo of receipt of the specimen within the anatomicpathology section. TAT of a frozen section diagnosis isalso monitored, along with correlation of frozen sectioninterpretation with that of permanent sections. Discre-pancies should be communicated to the clinician, andtracked for trends that could offer opportunities for theimprovement of frozen section diagnoses.Correct patient identification of tissues and subsequent
tissue slides and blocks is crucial for error reduction, as isrecord keeping through the surgical report of gross andmicroscopic observations. Digital imaging has been usedin some institutions to provide the inclusion of grossphotographs and microscopic fields into the patient’sreport. Since glass slides and paraffin blocks deteriorateover time, the storing of such digital images with thepatient’s report may be the best option for maintaininga patient record of pathologic tissue exam. Automatedfaxing of tissue examination results, immediately per-formed by computer after the case is finalized, has aidedthe laboratory in the quick dissemination of results.A standardized approach to the gross and microscopic
examination of tissue, using concise terminology forreporting is useful for quality assurance by reducingerrors of omission, and for providing referring physicianswith the information necessary to plan treatment, estimateprognosis, and follow outcome. Checklists and protocolsare available to the pathologist, especially for reporting offindings in malignancies. Cancer protocols have beendeveloped by the Cancer Committee of the CAP, andpublished in the Archives of Pathology and LaboratoryMedicine [37]. Similar recommendations have beendeveloped by the Association of Directors of Anatomicand Surgical Pathology and published in the HumanPathology and the American Journal of Clinical Pathol-ogy. The protocols provide a basis for development ofconsistent written reports, an outline for the narrativeportion of the report, and a basis for research designs.They are written in a standard format that suggestshandling of macroscopic and microscopic examinations,as well as histologic grading and pathologic staging, byorgan. The protocols provide a framework of informationthat should be included in surgical pathology reports, butthe format of the reporting is left to the individualpathologist or institution for flexibility. The protocols arerevised as needed to include new information regardingspecimen examination. Interestingly, the effort to make areport complete does not ensure that a clinician willunderstand it’s content. A study involving questionnairescompleted by surgeons regarding pathology reportsindicated that surgeons misunderstood pathologists’reports 30% of the time [38]. Surgical experience reducedbut did not eliminate the problem, and stylistic improve-ments to report formats had the potential to interfere
with comprehension and increase misunderstandings. Aslaboratories are consolidated and reports disseminatedwidely by the Internet, the communication gap is likely toincrease, unless ways to correct it are delineated [38].In addition to optimal communication with clinicians
and proper specimen identification, peer review ofdifficult cases is imperative for error reduction in theanatomic service. Seeking consultation with one’s peersor at an expert level is usually based on a pathologistbeing familiar with his or her limitations, and beingaware of pathologic processes for which one has minimalexperience. When an experienced pathologist finds thatimmediate recognition of a pathologic process does notoccur, and that applying familiar rules and criteria do notlead to a diagnosis, the pathologist enters unfamiliarterritory and is prone to the same types of error as thenovice in the field. The difference between the novice andthe expert is that the expert has a larger repertoire of skill-based and rule-based diagnoses. It is important for thepathologist to identify cases where a better diagnosiscould be made if the case were referred to anotherpathologist [39]. Selection of cases for peer review and/orconsultation may also be based on the severity of con-sequences of error [40]. A study involving 180 labora-tories established a multi-institutional extra-departmentaggregate consultation rate of 0.5% [41], and this findingcan be used as a target rate in quality assurance plans foranatomic pathology.Once a decision has been made to seek consultation,
the next consideration is the expertise required of theconsultant. Using institutional peers for consultationshould be done regularly, but may not resolve the diagno-stic issue. In these cases, consultation with an expertat another institution is wise. Consultants who havepublished studies, books, and book chapters about theprocess in question usually have the most experience withdiagnostic problems that can arise in the organ system oftheir expertise [42]. No system is perfect, however, andrarely an error in diagnosis is made even after peer reviewand expert consultation has been obtained, because ofagreement on the erroneous diagnostic impression.Occasionally, more than one diagnosis is ‘‘right’’ for a
given pathologic process, depending on interpretationof criteria. Every pathologist is aware of variation ininterpretation among pathologists for the same slide, aswell as his or her own variation in diagnosis of the samecase on different days, and is a complex issue for surgicalpathology [42]. Cramer and colleagues have classifiedsources of variability among pathology observers thatinclude mistakes, ambiguous qualitative terms, lesionheterogeneity, difficult diagnoses, imprecise quantitativeterms, and relative importance of criteria (Fig. 5) [43]. Astudy by Schnitt et al. involved the review of 24 breasttissue slides by 6 pathologists, in which the diagnoses
166 Hollensead et al.

represented a spectrum of duct hyperplasia for usual, toatypical to noncomedo ductal carcinoma in situ [44].Before looking at the slides, all 6 pathologists were giveninstruction regarding Page’s criteria for intraductallesions and 15 slides to illustrate the criteria wereincluded in the training session [45]. The ‘‘pretraining’’allowed agreement among all 6 pathologists in 14 ofthe cases, agreement of 5 pathologists in 17 cases, andagreement of 4 pathologists in 22 of the unknown cases.The study indicates that a high degree of reproducibilityin tissue diagnosis can be obtained when standardizedcriteria are applied.
The exact process of how the brain recognizes visualimages and converts them to a diagnosis is mostly un-
known; however, a general understanding of the processhas been described [42,46–48]. Bartels described theprocess of human visual perception as having first a highspeed stage in which an overview of the image isobtained, and then a slower, sequential stage whichfocuses on smaller areas and details of the image. For thesurgical pathologist this is a quick scan of a slide undera microscope using low power, to see the number offragments, the slide quality, and the intricacy of theprocess. This is usually followed by a study under highpower of individual fields and cells, to apply rules andcriteria that must be met to establish a definitivediagnosis, or a differential diagnosis. Bartels describesvisual patterns in the surgical pathology diagnostic work
Fig. 5. Six types of diagnostic variability in histopathologic classification [43].
Errors in Pathology 167

as ‘‘good’’ patterns, or ‘‘poor’’ patterns. Good patternsare easily recognized, and are correctly classified evenwhen the differential diagnosis is broad. Poor patternsrepresent a spectrum of changes so subtle that muchexperience is required to make a diagnosis, even when asfew as two choices exist. Examples of such poor patternsare the spectrum of intraductal lesions of the breast, asmentioned in the Page study above, and the subtledifferences of dysplastic nevi and melanomas. Examplesof good patterns are the easily recognizable features ofthe classic seborrheic keratosis, basal cell carcinomas,and keratinizing squamous cell carcinomas. As experi-ence is gained and a broader understanding of theinterrelationships of patterns is obtained, the pathologistthat has mastered the good patterns will also becomeproficient in the poor patterns, although total interobser-ver agreement may not exist in all cases.Although proficiency testing is not required in surgical
pathology for CAP accreditation, as it is in gynecologicalcytopathology, many surgical pathologists opt to studyunknown cases periodically throughout the year to testtheir knowledge and gain continuing medical education[4]. The programs are very helpful for self assessment, forstaying current in the field of surgical pathology, and assupplementation for pathology meetings and trainingcourses. However, the nature of such self-testing meansthat the unknown slides must be excellent examples ofthe processes they are representing, with high agreementamong observers for the diagnosis. For this reason,performance on a set of unknown slides may not alwaysaccurately reflect the competency of a pathologist inactual practice, since many variables that effect perfor-mance are present in the day-to-day work load, and cannotbe reproduced in a testing situation [42]. Computerizedinteractive video programs may enhance future profi-ciency tests, as inclusion of cases with small amounts oftissue would be possible, and not limited by the numberof slides that could be prepared from the material, withdispersion to a large number of participants [40].Computer technology is becoming a convenient tool by
which pathologists can share information, obtain educa-tion, and obtain consultation. Digital photography and theinternet allow the possibility of immediate consults,without the time delays of preparing and mailing slidesfor outside consultation. Telepathology [49,50] andtelecytology are promising tools for the future that wouldallow pathologists with subspecialty training to viewdifficult cases both nationally and internationally. Arecent study indicates that digital images are suitablesubstitutes for glass slides, and telecytology can be usedfor the cytologic diagnosis of cervical smears, as well asin quality assurance programs [51]. Informatics trainingis being added to pathology residency programs, to helppathologists contribute to the need for clinical informa-
tion management [52,53]. Informatics can be used toorganize work, correlate findings from different areas ofthe laboratory, and to store findings. Future growth in theareas of genomics and proteomics will make informa-tion management even more critical for correlating allfindings for the proper diagnostic impression.Perhaps one of the best ways to reduce errors in
anatomic pathology is for the pathologist to avoid fatigueand physician burnout. Physician burnout increases inthose who consistently experience work overload with aperceived lack of control over the extent to which thework exceeds the individual’s capacity. Symptoms ofburnout include impaired job performance, headaches,sleep disturbances, irritability, fatigue, hypertension,anxiety, and depression. These symptoms can lead tophysician error, and the errors perpetuate the burnout,leading to a devastating emotional impact for the practic-ing physician [54]. Certainly it is difficult to be useful toothers when one’s own emotional and physical reservesare depleted.
Cytopathology
Quality improvement measures for the practice ofcytopathology mandated limits of workload for cytolo-gists, rescreening of some Pap smears initially screenedas negative, and computation and maintenance of labo-ratory statistics. Also required by CLIA’88 was periodicproficiency testing for all laboratories screening orinterpreting Pap smears [8]. To properly select the casesfor rescreening, patients at high risk for developingcervical cancer had to be recognizable by the laboratory.This has necessitated communication between theclinician and the laboratorian, and is often indicated onthe test request for the Pap smear through history ordesignation as ‘‘high risk’’ by a checkbox on the re-quisition form. Laboratory computer systems are alsohelpful for obtaining a past record of the patient’scytology and surgical pathology findings [55].Efforts to limit the work load of a cytotechnologist,
and thus decrease errors related to fatigue have beentempered by the issues of reimbursement by third partypayers, which seek to increase productivity and decreasecost in the evaluation of Pap smears. This has become amajor challenge for the health care system in general, ashigh demand for services stress available providers andavailable funding. Thus, efficiency in maintaining thestatistics regarding laboratory performance becomescritical, and computer software designed specifically formeeting the cytology requirements of CLIA’88 isavailable. These statistical requirements include numberof specimens processed by specimen type, percentagerate of cases interpreted as abnormal by diagnosis, andcorrelation with histology.
168 Hollensead et al.
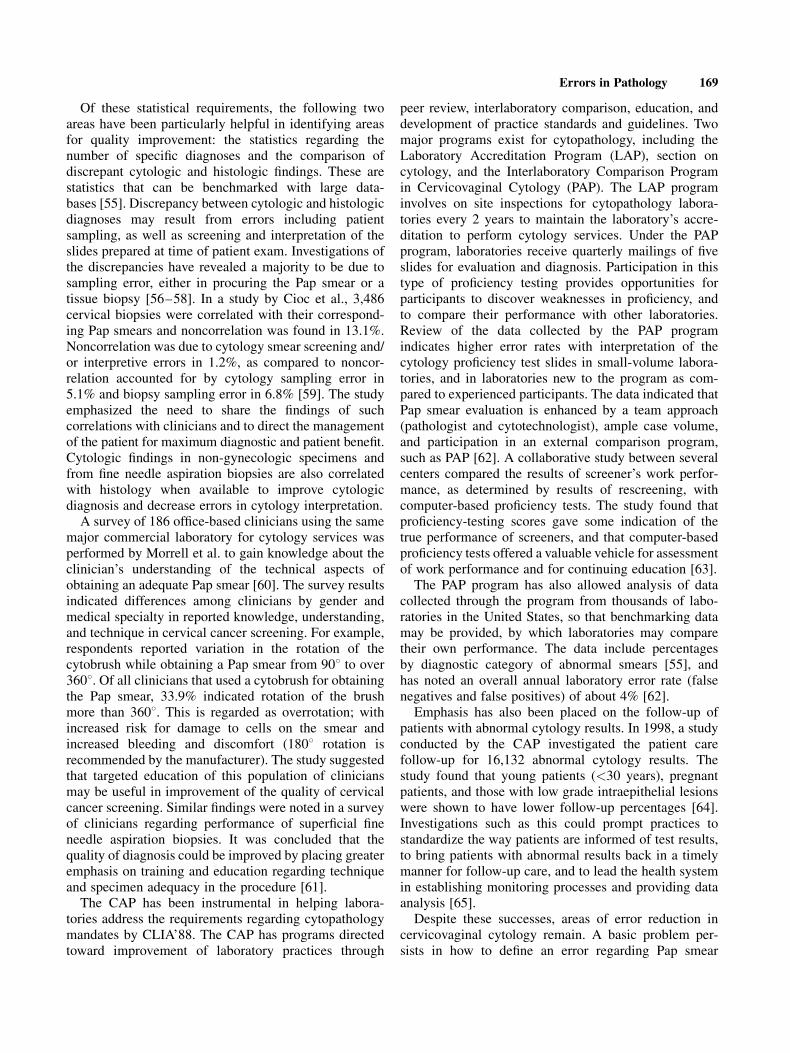
Of these statistical requirements, the following twoareas have been particularly helpful in identifying areasfor quality improvement: the statistics regarding thenumber of specific diagnoses and the comparison ofdiscrepant cytologic and histologic findings. These arestatistics that can be benchmarked with large data-bases [55]. Discrepancy between cytologic and histologicdiagnoses may result from errors including patientsampling, as well as screening and interpretation of theslides prepared at time of patient exam. Investigations ofthe discrepancies have revealed a majority to be due tosampling error, either in procuring the Pap smear or atissue biopsy [56–58]. In a study by Cioc et al., 3,486cervical biopsies were correlated with their correspond-ing Pap smears and noncorrelation was found in 13.1%.Noncorrelation was due to cytology smear screening and/or interpretive errors in 1.2%, as compared to noncor-relation accounted for by cytology sampling error in5.1% and biopsy sampling error in 6.8% [59]. The studyemphasized the need to share the findings of suchcorrelations with clinicians and to direct the managementof the patient for maximum diagnostic and patient benefit.Cytologic findings in non-gynecologic specimens andfrom fine needle aspiration biopsies are also correlatedwith histology when available to improve cytologicdiagnosis and decrease errors in cytology interpretation.
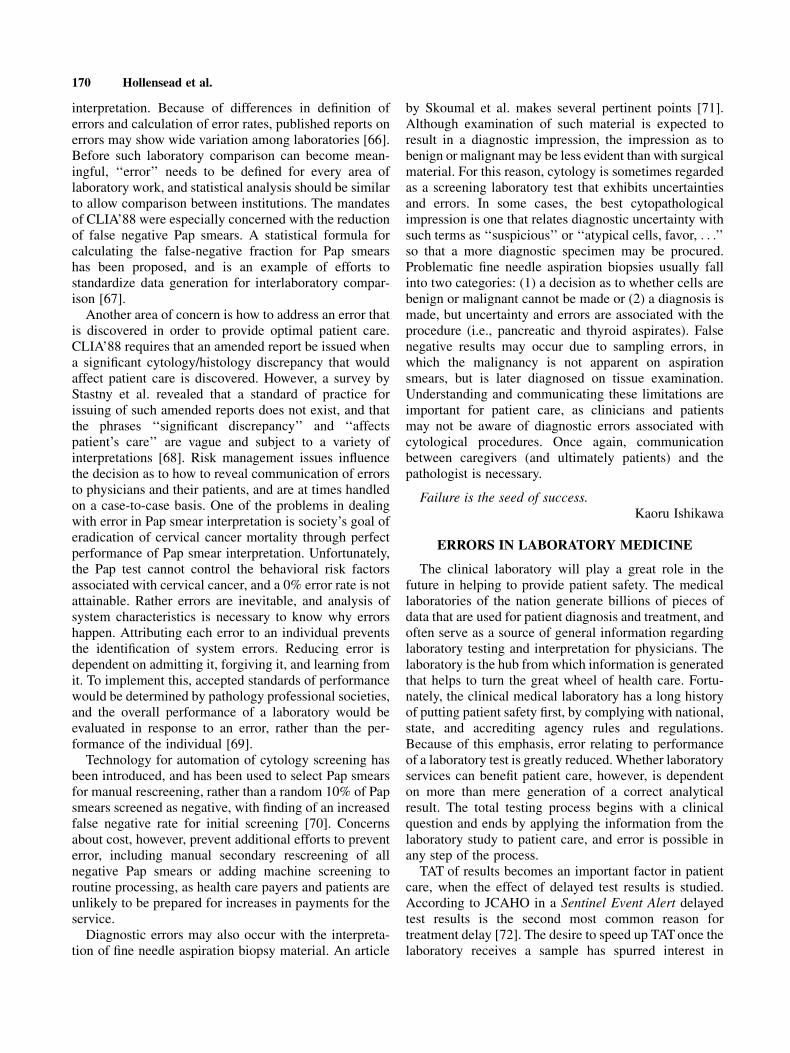
A survey of 186 office-based clinicians using the samemajor commercial laboratory for cytology services wasperformed by Morrell et al. to gain knowledge about theclinician’s understanding of the technical aspects ofobtaining an adequate Pap smear [60]. The survey resultsindicated differences among clinicians by gender andmedical specialty in reported knowledge, understanding,and technique in cervical cancer screening. For example,respondents reported variation in the rotation of thecytobrush while obtaining a Pap smear from 908 to over3608. Of all clinicians that used a cytobrush for obtainingthe Pap smear, 33.9% indicated rotation of the brushmore than 3608. This is regarded as overrotation; withincreased risk for damage to cells on the smear andincreased bleeding and discomfort (1808 rotation isrecommended by the manufacturer). The study suggestedthat targeted education of this population of cliniciansmay be useful in improvement of the quality of cervicalcancer screening. Similar findings were noted in a surveyof clinicians regarding performance of superficial fineneedle aspiration biopsies. It was concluded that thequality of diagnosis could be improved by placing greateremphasis on training and education regarding techniqueand specimen adequacy in the procedure [61].
The CAP has been instrumental in helping labora-tories address the requirements regarding cytopathologymandates by CLIA’88. The CAP has programs directedtoward improvement of laboratory practices through
peer review, interlaboratory comparison, education, anddevelopment of practice standards and guidelines. Twomajor programs exist for cytopathology, including theLaboratory Accreditation Program (LAP), section oncytology, and the Interlaboratory Comparison Programin Cervicovaginal Cytology (PAP). The LAP programinvolves on site inspections for cytopathology labora-tories every 2 years to maintain the laboratory’s accre-ditation to perform cytology services. Under the PAPprogram, laboratories receive quarterly mailings of fiveslides for evaluation and diagnosis. Participation in thistype of proficiency testing provides opportunities forparticipants to discover weaknesses in proficiency, andto compare their performance with other laboratories.Review of the data collected by the PAP programindicates higher error rates with interpretation of thecytology proficiency test slides in small-volume labora-tories, and in laboratories new to the program as com-pared to experienced participants. The data indicated thatPap smear evaluation is enhanced by a team approach(pathologist and cytotechnologist), ample case volume,and participation in an external comparison program,such as PAP [62]. A collaborative study between severalcenters compared the results of screener’s work perfor-mance, as determined by results of rescreening, withcomputer-based proficiency tests. The study found thatproficiency-testing scores gave some indication of thetrue performance of screeners, and that computer-basedproficiency tests offered a valuable vehicle for assessmentof work performance and for continuing education [63].
The PAP program has also allowed analysis of datacollected through the program from thousands of labo-ratories in the United States, so that benchmarking datamay be provided, by which laboratories may comparetheir own performance. The data include percentagesby diagnostic category of abnormal smears [55], andhas noted an overall annual laboratory error rate (falsenegatives and false positives) of about 4% [62].
Emphasis has also been placed on the follow-up ofpatients with abnormal cytology results. In 1998, a studyconducted by the CAP investigated the patient carefollow-up for 16,132 abnormal cytology results. Thestudy found that young patients (<30 years), pregnantpatients, and those with low grade intraepithelial lesionswere shown to have lower follow-up percentages [64].Investigations such as this could prompt practices tostandardize the way patients are informed of test results,to bring patients with abnormal results back in a timelymanner for follow-up care, and to lead the health systemin establishing monitoring processes and providing dataanalysis [65].
Despite these successes, areas of error reduction incervicovaginal cytology remain. A basic problem per-sists in how to define an error regarding Pap smear
Errors in Pathology 169
interpretation. Because of differences in definition oferrors and calculation of error rates, published reports onerrors may show wide variation among laboratories [66].Before such laboratory comparison can become mean-ingful, ‘‘error’’ needs to be defined for every area oflaboratory work, and statistical analysis should be similarto allow comparison between institutions. The mandatesof CLIA’88 were especially concerned with the reductionof false negative Pap smears. A statistical formula forcalculating the false-negative fraction for Pap smearshas been proposed, and is an example of efforts tostandardize data generation for interlaboratory compar-ison [67].Another area of concern is how to address an error that
is discovered in order to provide optimal patient care.CLIA’88 requires that an amended report be issued whena significant cytology/histology discrepancy that wouldaffect patient care is discovered. However, a survey byStastny et al. revealed that a standard of practice forissuing of such amended reports does not exist, and thatthe phrases ‘‘significant discrepancy’’ and ‘‘affectspatient’s care’’ are vague and subject to a variety ofinterpretations [68]. Risk management issues influencethe decision as to how to reveal communication of errorsto physicians and their patients, and are at times handledon a case-to-case basis. One of the problems in dealingwith error in Pap smear interpretation is society’s goal oferadication of cervical cancer mortality through perfectperformance of Pap smear interpretation. Unfortunately,the Pap test cannot control the behavioral risk factorsassociated with cervical cancer, and a 0% error rate is notattainable. Rather errors are inevitable, and analysis ofsystem characteristics is necessary to know why errorshappen. Attributing each error to an individual preventsthe identification of system errors. Reducing error isdependent on admitting it, forgiving it, and learning fromit. To implement this, accepted standards of performancewould be determined by pathology professional societies,and the overall performance of a laboratory would beevaluated in response to an error, rather than the per-formance of the individual [69].Technology for automation of cytology screening has
been introduced, and has been used to select Pap smearsfor manual rescreening, rather than a random 10% of Papsmears screened as negative, with finding of an increasedfalse negative rate for initial screening [70]. Concernsabout cost, however, prevent additional efforts to preventerror, including manual secondary rescreening of allnegative Pap smears or adding machine screening toroutine processing, as health care payers and patients areunlikely to be prepared for increases in payments for theservice.Diagnostic errors may also occur with the interpreta-
tion of fine needle aspiration biopsy material. An article
by Skoumal et al. makes several pertinent points [71].Although examination of such material is expected toresult in a diagnostic impression, the impression as tobenign or malignant may be less evident than with surgicalmaterial. For this reason, cytology is sometimes regardedas a screening laboratory test that exhibits uncertaintiesand errors. In some cases, the best cytopathologicalimpression is one that relates diagnostic uncertainty withsuch terms as ‘‘suspicious’’ or ‘‘atypical cells, favor, . . .’’so that a more diagnostic specimen may be procured.Problematic fine needle aspiration biopsies usually fallinto two categories: (1) a decision as to whether cells arebenign or malignant cannot be made or (2) a diagnosis ismade, but uncertainty and errors are associated with theprocedure (i.e., pancreatic and thyroid aspirates). Falsenegative results may occur due to sampling errors, inwhich the malignancy is not apparent on aspirationsmears, but is later diagnosed on tissue examination.Understanding and communicating these limitations areimportant for patient care, as clinicians and patientsmay not be aware of diagnostic errors associated withcytological procedures. Once again, communicationbetween caregivers (and ultimately patients) and thepathologist is necessary.
Failure is the seed of success.Kaoru Ishikawa
ERRORS IN LABORATORY MEDICINE
The clinical laboratory will play a great role in thefuture in helping to provide patient safety. The medicallaboratories of the nation generate billions of pieces ofdata that are used for patient diagnosis and treatment, andoften serve as a source of general information regardinglaboratory testing and interpretation for physicians. Thelaboratory is the hub from which information is generatedthat helps to turn the great wheel of health care. Fortu-nately, the clinical medical laboratory has a long historyof putting patient safety first, by complying with national,state, and accrediting agency rules and regulations.Because of this emphasis, error relating to performanceof a laboratory test is greatly reduced. Whether laboratoryservices can benefit patient care, however, is dependenton more than mere generation of a correct analyticalresult. The total testing process begins with a clinicalquestion and ends by applying the information from thelaboratory study to patient care, and error is possible inany step of the process.TAT of results becomes an important factor in patient
care, when the effect of delayed test results is studied.According to JCAHO in a Sentinel Event Alert delayedtest results is the second most common reason fortreatment delay [72]. The desire to speed up TATonce thelaboratory receives a sample has spurred interest in
170 Hollensead et al.

automation of sample processing. These processesinclude sample log in, centrifugation, and sample sorting,by using bar coded labels attached to the specimens.Automation incorporated in these stages can reduceclerical and labeling errors that occur when laboratorianstransport and aliquot patient samples, and eliminate someof the rote work that causes errors due to fatigue ordistraction [72]. Automation may also be used to checkthe quality of a sample, with instruments designed todetect substances that interfere with testing such aspresence of hemoglobin, bilirubin, and lipemia. Interfa-cing of laboratory information systems allows computersto transfer results directly to the patient’s report to avoidtranscription errors. The reports, once manually or auto-verified, can then be immediately faxed to a physician orprinted to a clinical service area providing care for thepatient.
Errors made in the actual performance of a laboratorytest are rare because of efforts to provide accurateanalytical methods. Bonini et al. has summarized theliterature on laboratory errors from January 1994 to June2001 [8]. The findings indicated a very limited number ofstudies of the topic of laboratory errors, and the resultswere heterogeneous. A common finding, however, wasthe distribution of errors across different phases of theentire testing process. A large percentage of laboratoryerrors occurred in the pre- and post-analytical phases,with fewer mistakes being the result of an analyticalprocess. Another study, a survey of laboratory incidentreports by Astion et al. was done to help identifyproblems that jeopardize patient safety [73]. In this studythe most common specific impact on patient care of anadverse laboratory event was delay in receiving testresults (85%). The pre-analytic testing phasewas involvedin 71% of incidents, the analytic in 18%, and thepost-analytic in 11%. The most common pre-analyticproblem was specimen transportation (16%), and themost frequently implicated error in laboratory functionwas specimen processing (31%). This information fromformal studies can help to identify the most common typeof errors and to improve system processes to preventthem.
Clinical Chemistry
The discipline of clinical chemistry has activelyintroduced systems to reduce analytical error beginningmore than 50 years ago. In the late 1940s, proficiencytesting among laboratories began in Philadelphia underthe direction of Dr. William Sunderman and the CAP[74]. This concept has been greatly expanded over theyears and now involves all aspects of laboratory medicineand pathology. The Clinical Laboratory ImprovementAct of 1967 (CLIA’67) required all laboratories to
participate in proficiency testing programs. However,CLIA’88 established a passing grade of 80% for pro-ficiency testing and used results to accredit laboratories.In 1950, Levey and Jennings published their classic studyon the use of control charts in clinical chemistry andclinical laboratories [75]. Westgard et al. developed anumber of QC rules based on statistics for effectivelyusing a Levey–Jennings chart to reduce error [76]. Theseare some of the milestones that have helped to identifyand reduce analytical errors and improve quality forclinical chemistry. Today, an extensive QC program isin place in most clinical chemistry laboratories thatcontinues to reduce the error rate.
Only a few studies have been done to specificallyevaluate the analytical error rate of a clinical chemistrylaboratory. For essentially any laboratory, the majority ofresults come from the clinical chemistry section. Clinicalchemistry more than the other sections of the laboratoryusually produces a quantitative result that facilitatesstatistical QC and error detection. In an early report,McSwiney and Woodrow reported an error rate of 2.3%(number of documented errors within the laboratory/number of tests performed) [77]. Several years later,Chambers et al. reported the rate of erroneous resultsfrom a clinical chemistry laboratory was 0.3% [78]. Forthis study, an error was defined as an erroneous resultwhich was issued or would have been issued by thedepartment if the final cumulative reports were notchecked. Failure to perform or report requested analyseswere also considered an error. Errors detected beforeanalysis were not included; these were analyses whenblood samples were received more than 12 hr afterphlebotomy, inappropriate samples and samples with aninadequate or wrong identification. Technical errors oromissions detected at the bench level were also excluded.The denominator was the number of test results reportedduring the time interval. Lapworth and Teal reported arate of error of 0.05% [79]. For this study, an error wasdefined as an incident leading to an incorrect result/setof results either being reported or detected at the finalchecking-out stage in the laboratory. Errors detectedbefore or during analysis, or before the final validationstage were not included. The denominator was the numberof accessions that may have included several differenttest results and not the number of individual test results.This study also found that the number of errors wasapproximately the same in the pre-analytical, analytical,and post-analytical phases. Further, this study found ahigher error rate for proficiency testing than patientanalyses that the authors attributed to the need for recon-stitution in some cases, transcription errors and calcula-tion steps that are required with these specimens. Thus,the error rate within the laboratory for patient specimensshould be less than that documented for proficiency
Errors in Pathology 171

testing based on the results of this study. Another studyused methods comparison data with over 200,000 resultsobtained over several years and found an error rate of0.045% [80]. In this study, each result was prospectivelycompared with its replicate, comparative, or repeat valueto identify differences from expected values. The resultswere expressed as unacceptable results/errors per millionresults. The error rate was higher for patients’ samplescompared with control samples. These four studies showa progressive decrease in the rate of errors over time.However, it is difficult to determine if we have madeprogress over time based on these four studies since thedenominator may have been different for each study. Inthe study by Chambers et al. the denominator was thenumber of test results reported, but the study by Lapworthand Teal used accessions (a set of results) for the deno-minator. Since, to date, there has not been a standardiza-tion of what constitutes an ‘‘error,’’ it is difficult to make acomparison among studies, but we seem to be heading inthe right direction.The error rate in STAT laboratories has also been
studied. Plebani and Carraro reported an error rate of0.47% based on the number of test results reported in fourdifferent STAT laboratories in a hospital [12]. This isapproximately 10-fold higher than Witte et al. reportedfor chemistry laboratories in the same year [80]. Thedistribution of errors in the study was the following: pre-analytical 60.2%, analytical 13.3%, and post-analytical18.5%. A review study evaluating several reports oferrors in laboratory medicine also found that most errorsoccur in the pre-analytical phase [8], which differs fromthe similar distribution of errors among the three phasesreported by Lapworth and Teal [79].Interference with clinical laboratory analyses that
primarily occurs in clinical chemistry is an importantsource of error. Interference by endogenous or exogenoussubstances with assays for clinical analytes is a commonproblem. Interference has been defined as the effect of asubstance present in the sample that alters the correctvalue of the result, usually expressed as concentration oractivity, for an analyte [81]. The following four majorendogenous compounds when present in excess consis-tently interfere with laboratory test results: hemoglobin,bilirubin, lipids, and paraproteins. The major exogenoussources of interference are drugs prescribed for thepatient. Evaluating interference may be tricky since itmay increase or decrease the concentration of the analyteand the interferent may interact with the analyte (analytedependent interference) or alter the assay result indepen-dent of the analyte concentration (analyte independentinterference). The frequency of interference with clinicallaboratory analyses is difficult to determine. A study of100 outpatients found that the percentage of tests effectedby interference was 7% when the patient took one drug,
16.7% when the patient took two drugs, 66.7% when thepatient took three or four drugs, and 100% when thepatient took five or more drugs [82]. It is important tothink of interferencewhen a patient has a highly abnormallaboratory result that is inconsistent with the clinicalpicture. There are several sources of information to assistthe laboratorian with the resolution of an interferenceproblem. A starting point is the manufacturer’s packageinsert in which the description of the method usuallyincludes an analysis of probable interfering substances.In most clinical laboratories, the publication by Dr.Donald Young on the Effects of Drugs on ClinicalLaboratory Tests is a great resource for resolving inter-ference problems [83]. The information in this publica-tion is organized by laboratory tests and drugs, and anindex lists all laboratory tests and drugs. Thus, forunusual laboratory results, it is important to review thepatient’s laboratory values and chart for medications thatmay interfere with the abnormal result for the analyte inquestion.
Hematology
Proper collection and labeling of specimens is ex-tremely important for the hematology and coagulationservices, where special attention to the quality of asample is necessary for an optimal laboratory result.Clots in whole blood samples, even small ones, causeerrors in results in both complete blood counts (CBC) andcoagulation parameters. Incorrect coagulation test resultscan be caused by contamination of blood samplesincorrectly drawn from heparinized intravenous lines orcatheters. For the prothrombin time (PT) and activatedpartial thromboplastin time (aPTT), the ratio of blood toanticoagulant (sodium citrate) must be correct for thepatient’s hemoglobin and hematocrit. Less anticoagulantis used for patients with elevated hemoglobin and hema-tocrits, to avoid incomplete utilization of the antic-oagulant by plasma, leaving excess anticoagulant presentto falsely prolong clotting assays [84]. Such issues arefamiliar to clinical laboratory scientists working in thehematology/coagulation area; however, many bloodsamples are now drawn by non-laboratorians, who mustbe informed of such nuances as part of the laboratoryquality assurance programs.Timeliness of specimen transport to the hematology/
coagulation laboratory is also an important factor inobtaining reliable results. Cells exposed to EDTA de-generate and appear dysplastic over time, so thatperipheral blood and bone marrow aspirate specimensobtained for morphologic review and placed in EDTA arebest delivered promptly to the laboratory [84]. Whenavailable, bedside assistance in making bone marrowaspirate smears directly from the aspiration needle by a
172 Hollensead et al.

trained assistant ensures optimal preparations. Samplesfrom patients being evaluated for heparin therapy by theaPTT should be assayed as soon as possible, as heparin iseventually neutralized by platelets in the test tube, anddelay of testing may lead to a falsely low aPTT value.These criteria are often addressed in an instructionalmanual and made available to services sending speci-mens for analysis to the clinical laboratory. Timeliness ofspecimen transport also helps to improve the TAT forgenerating test results.
The analytical phase of laboratory testing is becomingmore challenging, however, as work forces dwindle dueto attrition and lack of incoming trained medical techno-logists and technicians. This makes automation evenmore necessary, to handle routine work and free technicalpersonnel to concentrate on problematic results. Forexample, in the hematology laboratory, normal differentialcounts are performed by the instrument and reported,leaving only those flagged by the blood counting instru-ment to be counted manually.
In addition to maintaining an adequate laboratory laborforce by raising the esteem of the profession and main-taining an adequate number of training programs, thisgroup of health care providers needs access to continuingmedical education to stay current with new laboratorytests and theory. Providing the latest and most accuratetests is a critical service for the clinical laboratory,necessitating constant review of test menus and imple-mentation of new equipment and procedures. JCAHOcites offering of ‘‘outmoded’’ tests as a critical risk factorfor clinical laboratories. As an example, the mostsensitive testing method now for paroxysmal nocturnalhemoglobinuria is flow cytometry using anti-CD 55 andanti-CD 59, replacing the veritable Ham’s and sucrosehemolysis tests previously used for diagnosis and screening.Examination of bone marrow aspirate specimens frompatients with leukemia now routinely incorporatesfindings from flow cytometry and cytogenetic studies.These ancillary tests improve diagnostic accuracy byproviding additional information to morphologic exam-ination (immature cells of different lineage can lookalike), and providing information regarding classificationand prognosis.
The natural adjunct to performing updated laboratorytests is providing laboratory consultative services tophysicians, to help them best utilize the laboratory’sarmament of tests and interpret them correctly (post-analytical services). In an editorial written by Lundbergin JAMA [85], proper interpretation and action must beaccomplished before the laboratory test loops are actuallycompleted. This type of closed loop testing approach isparticularly suited to hematology, where many morpho-logic impressions are converted to numerics, and tocoagulation where theory is complex. A survey con-
ducted by Sandhaus and Meyer [86] examined theperceived usefulness of CBC and reticulocyte reports toclinicians at the University Hospitals of Cleveland—CaseWestern Reserve. The study surveyed 1,353 attendingand 689 house staff physicians to determine which of theCBC parameters were regarded as useful to clinicalpractice. Only 4 of the 11 reported parameters wereselected as frequently or always useful by more than 90%of physicians: hemoglobin, hematocrit, platelet count,and WBC count. Among primary care physicians, themean cell volume (MCV) was also selected as frequentlyuseful in the evaluation of anemia. Physicians practicingless than 10 years infrequently used this parameter. Thestudy indicated that modifications of report formats wereneeded to facilitate physician perception of hematologylaboratory results. Currently this is being accomplishedthrough clinical pathology consultative reports, such as apathologist’s interpretation after review of a peripheralsmear and CBC. This method enhances only a few of thereports generated daily from the hematology laboratory,however, correlation with clinical history and laboratoryresults could be beneficial for all patients being studiedin the laboratory. Computers could assist with this in thefuture, by linking interpretive comments for certainlaboratory results with key words in the provided clinicalhistory. Of course, it is the clinician who ultimatelyinterprets laboratory data and applies it to patient care,but improved relationships with clinicians and laborator-ians could help eliminate errors, as the ultimate qualityassurance of a laboratory test is whether it is a rationalresult given the patient’s condition.
Interpretation of coagulation tests can often be per-plexing, and coagulation test results are highly dependenton methods performed. Coagulation test results are alsogreatly influenced by pre-analytical factors, includingtherapy and techniques of phlebotomy. A survey ofhospital coagulation laboratory practices in the UnitedStates was conducted by the Centers for Disease Controland Prevention in 2001 [87]. A part of the survey dealingwith clinical service and laboratory capacities found thatonly 57% of hospital coagulation laboratories had aclinician available for consultation with expertise incoagulation disorders. A minority of the hospitals wereassociated with outpatient coagulation services, specifi-cally, only 20% of the responding hospitals had a clinicspecializing in adjustment of oral anticoagulants, andonly 9% offered outpatient clinics specializing in diag-nosis and treatment of coagulation disorders. Results of aportion of the survey dealing with coagulation laboratorypractices found departure from certain accepted coagula-tion laboratory practices which may result in adverseoutcomes, and called for laboratorians and clinicians towork together to understand the reasons behind thevariabilites. Coagulation laboratories clearly have an
Errors in Pathology 173
opportunity to positively impact patient care by makinginterpretive consult reports regarding specialized coagu-lation laboratory work-ups available to clinicians, and byestablishing dedicated phone lines or e-mail addresseswithin the laboratory to facilitate communication betweenlaboratorians and care givers. Becoming involved withoutpatient clinics and point of care coagulation testing isanother way to ensure that high quality laboratorymethods are being made available to outpatients as wellas hospitalized patients. Point-of-care laboratory testingaccuracy is improved when the service has a qualityassurance plan, including proficiency testing for thoseperforming the assays.
Microbiology and Molecular Biology
Microbiology may be the area of laboratory medicinethat is most difficult to detect and to quantify errors. Thepre-analytical part of microbiology is the most importantfactor for successful analytical and post-analytical phasesof a culture. If a specimen is contaminated when obtainedfrom the patient, the laboratory has no way to resolve thiserror. The rate of blood and urine culture contaminationhas been evaluated by the CAP Q-Probe Studies. In a Q-probe study evaluating just under one-half millioncultures and 640 institutions showed the median adultinpatient blood culture contamination rate was 2.5% bylaboratory assessment [88]. Factors associated with asignificantly lower contamination rate were a dedicatedphlebotomy service, use of a tincture of iodine for skindisinfecting, and application of an antiseptic to the top ofthe collection device before inoculation. There was nosignificant difference in the contamination rate betweeninpatient and outpatient cultures. Further, teachinginstitutions and high numbers of occupied beds withdemographic factors associated with higher contamina-tion rates for inpatients by not for outpatients. Contam-ination rates were not significantly affected by the type ofblood culture method used, or use of a double-needlecollection procedure.The contamination rate for urine cultures in this
country is more problematic. A CAP Q-probe study with906 institutions each reporting results on 250 urinecultures from outpatients showed the median urineculture contamination rate was 18.1% [89]. The 10% ofinstitutions with the lowest urine contamination ratereported 5.6% or fewer of their cultures were contami-nated. In contrast, the 10% of institutions with the highestcontamination rates reported that 36.8% or more of theirurine specimens were contaminated. Institutions withlower contamination rates tended to process a lowerproportion of specimens from female patients. Thus,contamination of outpatient urine cultures is a commonoccurrence and facilities differ significantly in theiroverall frequency of urine culture contamination.
Very little data are available about errors that occurduring molecular testing. The results of survey data from42 laboratories in this country reported significant errorsin 0.33% of tests performed [90]. Of the errors identified,60% occurred in the pre-analytical phase, 32% in theanalytical phase, and 8% in the post-analytical phase.Moderate or high levels of harm to the patient occurredin only 0.008% of the total cases. The study involved227,000 molecular tests with no lawsuits, judgements, ordisciplinary action reported. Further, the overall fre-quency of errors in a given laboratory did not correlatewith laboratory age, test volume, accreditation status,proficiency testing performance, or institution type. Thus,errors with molecular testing occur infrequently, andharm to a patient is a rare event.
Transfusion Medicine
The first blood transfusion to a human occurred in1666 in Paris performed by Jean Baptiste Denis [91].Lamb’s blood was used as the source, and 3 of the 4patients transfused survived. However, due to the onepatient death and subsequent lawsuits, human bloodtransfusion was banned in Europe until the early 1800s.James Blundell revived human transfusion in England in1818 [92] and the practice evolved through the next150 years, which included many discoveries: blood groupantigens, blood anticoagulants, blood group inheritance,and transfusion-transmitted agents. These discoverieswere all crucial to the development of safe bloodtransfusions.In 1990, approximately 41% of transfusion related
deaths reported to the FDA were acute hemolytic trans-fusion reactions [93]. According to the FDA Center forBiologics Evaluation and Research (CBER), 189 transfu-sion-related deaths were reported during the period1999–2001 [94]. The major etiologies of these deathswere bacterial contamination (15.4%), acute hemolytictransfusion reaction (14.3%), and transfusion-relatedacute lung injury (TRALI; 12.7%). Transfusion-trans-mitted diseases have come full circle since the 1940swhen open vented glass bottles were used for plasma andblood infusion and the risk of bacterial contaminationwas high. The only infectious disease test was for syphilis,and the donor questionnaire elicited only informationrelated to a history of hepatitis, IV drug use, and inter-national travel to malarial areas. Today the blood manu-facturers utilize nine tests for potential donor infectiousdisease (Human Immunodeficiency Virus/HIV antibo-dy(ies), Human T-cell Lymphotrophic Virus/HTLV anti-body(ies), HIV p24, Hepatitis B surface antigen/HBsAg,antibody to Hepatitis B core antigen/anti-HBc, HepatitisC Virus antibody(ies), HIV RNA and HCVRNA [NucleicAcid Test/NAT], and syphilis). The donor history ques-tionnaire now has over 40 questions related to social,
174 Hollensead et al.

medical, and infectious disease risks. Figure 6 demon-strates the significant steps from blood donor recruitmentto patient transfusion [95].
As can be appreciated from the steps involved toprepare a blood component for transfusion, the possibilityof errors exists at any point in this complex process.Most of the errors reported are associated with clerical(human) error. A review of the literature reports ontransfusion errors in hospitals revealed that contributingfactors included patient wristbands (multiple, incom-plete, erroneous, illegible), wrong blood tube collected ormislabeled, and patient misidentification (transfusion towrong patient, phlebotomy errors, multiple errors) [8].In the hospital transfusion services alone, 24 qualityassurance steps have been identified for the transfusionprocess [96]. The step descriptions for 88,038 transfusiondefects found in a CAP Blood Bank Quality Improve-ment questionnaire are listed in Table II.
This study identified that the majority of errors relatedto transfusion of a blood component occurred outsidethe transfusion services. Miscollected blood samples (thewrong blood in the tube) were found to occur in a 10-nation study in 1 in 2,000 collections; mislabeled samples(samples with labels not meeting locally acceptedstandards) occurred in a 1 in 165 frequency [97]. TheFDA has proposed point-of-care bar code requirementsfor medication and blood transfusions in order to reducethese errors of patient identification [98]. Experience withseveral barcode technologies to reduce mistransfusionshas proven successful [99,100].
With the discovery of acquired immune deficiencydisorder (AIDS) and the causal agent HIV in the early1980s, the public became more attuned to blood trans-fusion risks, the regulatory agencies and blood industryresponded, and transfusion medicine transformed itselfinto a ‘‘zero risk’’ operation. The FDA published theirguidelines on quality assurance in blood establishments
[101], and have subsequently revised multiple regulationsto reduce the errors in blood manufacturing. Areasincluded in reporting errors (Biological Product Devia-tion Reporting [BPD]) to the FDA now required of bothblood/plasma collection centers and transfusion servicesinclude the following [102]:
* donor suitability* blood collection (donor and patient)* component manufacturing/preparation* product testing* compatibility* labeling* storage and distribution
From October 1, 2000 through September 30, 2001,there were 23,839 reportable BPDs submitted from theblood industry. Table III shows the breakdown of thevarious reporting categories.
The majority of errors (76.6%) in licensed bloodestablishment and plasma centers result from informationsupplied by the donor after the donation that would have
Fig. 6. Blood transfusion flow diagram [95].
TABLE II. Twenty-four Quality Assurance Steps forTransfusion [99]
Testing phase Step description
Pre-analytic—35,922
defects (40.8%)
1. Physician’s order missed
2. Orders misinterpreted
3. Donor/recipient misidentified
4. Wrong container used for collection
5. Specimen container/requisition
misidentified
6. Specimen mishandled
Analytic—3,727
defects (4.2%)
7. ABO/Rh performed incorrectly
8. Antibody detection performed incor-
rectly
9. Cross-match procedure performed
incorrectly
10. Blood testing incomplete on component
release
Post-analytic—48,389
defects (55.0%)
11. Results misinterpreted
12. Results misidentified
13. Transcription error
14. Results on wrong patient
15. Results sent to wrong physician
16. Results not charted correctly
17. Turn-around time exceeded
18. Physician not notified of problem
19. Blood component administered
improperly
20. Component date expired
21. Patient or component misidentified
22. Baseline vital signs not recorded
23. Patient not observed during transfusion
24. Patient not observed after transfusion
Errors in Pathology 175

disqualified them at the time of donation (post-donationinformation). Errors in viral testing account for only 0.3%of total errors reported by all facilities. In transfusionservices which only began reporting errors to the FDAduring FY01, errors in QC and distribution accounted for42.0% of total errors reported. These errors were made upof human errors in not following procedures (componentnot leukoreduced, 13.0%; component not irradiated,11.5%; improper ABO/Rh selected, 11.0%). Labelingerrors in transfusion medicine (31.3%) were the result ofhuman error in not following procedures that led tomissing/incorrect labels on blood components. Routinetesting errors by the transfusion services (24.6%) weredue to human error in not correctly performing the com-patibility testing or antibody screening, or because ofsample misidentification.Although blood centers and transfusion services are
among the most heavily regulated and externally in-spected department in the clinical laboratory (FDA,CLIA, CAP, AABB, Nuclear Regulatory Commission/NRC, state laboratory license), errors still occur. In orderto further reduce errors (deviations in manufacturing),newer technologies and automation are being devel-oped and implemented. Figure 7 highlights these newtechnologies [95].For the blood donation process, new requirements by
the AABB and CAP to reduce bacterial contaminationin platelets took effect on March 1, 2004 [103,104].Leukoreduction of red blood cells and platelets, althoughnot required universally by FDA, is being performedroutinely by many blood collection agencies. NucleicAcid Testing (NAT) is now required of all blood donationsto improve the detection of HIV and HCV. Pathogenreduction technology (PRT) is in various clinical trialsand soon will be available to reduce pathogen transmis-
sion by blood transfusion. New automated blood collec-tion devices are either currently being used or are underinvestigation to allow fully automated component pre-paration during the donation process (minimize humanerror). Transfusion services have integrated more auto-mation including bar-coding into their operation to reducelabeling errors (patient blood specimens and blood compo-nents) and electronic crossmatching to decrease costs andstaff benchwork. New patient typing, antibody screening,and compatibility testing technology (gel and solidphase) have been introduced and have the capability forautomation (standardization) which will also assist inreducing human errors (analytic phase).Can an error free (zero risk) transfusion medicine
service be achieved? Probably not as long as there is ahuman element (from the raw material—the donor—tothe hanging of the blood component for patient transfu-sion) involved even in the best of a quality system culture.As stated by AuBuchon, ‘‘It is to be hoped that we willcontinue to devise new strategies, uncover new facts, anddevelop new solutions to continue to move forwardtoward the universal goals of improved transfusion safetyand supply while balancing economic pressure andpatient and society needs’’ [105]. Transfusion medicinesafety has progressed radically since Blundell’s firsthuman transfusion in 1666. World-class quality intransfusion medicine that is essentially error free can beachieved!
It takes a long time to bring excellence to maturity.Publilius Syrus (�100 BC), Maxims
ERROR REDUCTION FOR THE FUTURE
The approach to reducing errors in pathology andlaboratory medicine is similar to that for most systems.
TABLE III. US Food and Drug Administration, Center for Biologics Evaluation and Research, and Biological Product DeviationReports—FY01 Annual Summary
Reportable BPDs by manufacturing system
Manufacturing system
Licensed
establishments
Unlicensed
establishments
Transfusion
services Plasma centers
Total
No. Percent
Post-donation information 14,636 126 0 3,494 18,256 76.6
QC & distribution 1,229 365 200 98 1,892 7.9
Labeling 833 321 149 10 1,313 5.5
Donor screening 997 24 0 189 1,210 5.1
Routine testing 315 108 117 2 542 2.3
Component preparation 235 20 9 0 264 1.1
Blood collection 139 4 0 7 150 0.6
Donor deferral 66 1 0 23 90 0.4
Viral testing 68 5 1 8 82 0.3
Miscellaneous 36 2 0 2 40 0.2
Total 18,554 976 476 3,833 23,839 100
176 Hollensead et al.

At present, the error rate for pathology and laboratorymedicine does not approach Six Sigma (3.4 errors permillion events), which has become a goal for manycompanies that manufacture products. Automation andcomputers have greatly improved quality and reduced theerror rate in pathology and laboratory medicine, but alarge component of this field is still manual. Further, eachphysician office laboratory and hospital laboratory, forthe most part, are independent entities and have varyingapproaches to quality and error reduction. However, theapproach to error reduction for the future has certaincommonalties for all pathology and laboratory medicinedepartments. We will comment on the generic approachto error reduction (improve quality) and then makespecific suggestions for the three phases of the process.
Error reduction and improved quality are essentiallytwo names for the same goal; you can’t have one withoutthe other. Probably the most important factor for errorreduction is a commitment by the team (pathologists,technologists, phlebotomists, etc.) to reduce errors/improve quality. The tools for the team are spelled outin the Juran trilogy; quality planning, QC, and qualityimprovement [106]. These three concepts are not foreignto pathology and laboratory medicine. We continuallymonitor the quality/error rate of our service throughdelta checks, blood culture contamination rate, patientsreceiving a mismatched unit of blood, comparing cyto-logic diagnosis with tissue diagnosis for lesions of thecervix, etc. These and many other error rates have beenmonitored for many years by pathology and laboratory
medicine with a modicum of improvement. Most ofthese are outcome measurements. W. Edwards Demingemphasized that outcome measures after the service orproduct is completed are an indication of performancebut not the key to the solution. Dr. Deming emphasizedthe importance of improving the process to achieve betterquality/fewer errors. The fifth point of Deming’s 14points is ‘‘improve constantly and forever every processfor planning, production, and service’’ [107]. Dr. Demingpostulated the 85–15 rule based on his research whichindicates that 85% of what goes wrong is with the systemor process, and only 15% with the individual person orthing [108]. Thus, the key to error reduction is continuousquality improvement of the many systems and processesin the thousands of individual clinical laboratoriesand pathology departments throughout the country.However, since each one of these laboratories/depart-ments is an independent entity, the resources, commit-ment and knowledge for improvement/error reductiondiffers in each entity, and this is a significant factor forreducing the error rate.
Recommendation #1. Establish a continuous qual-ity improvement program that focuses on improving theprocesses in the laboratory/pathology.
The majority of errors for the laboratory occur duringthe pre-analytical phase [80,108]. A study by Nuttinget al. found that 56% of the errors for laboratory testinginvolved test ordering and specimen handling—pre-analytical components [109]. In a study by Witte et al.,
Fig. 7. Blood transfusion flow diagram with new technologies [95].
Errors in Pathology 177

62.2% of the errors were pre-analytical [80]. A CAP Q-probe study involving 660 institutions found that 4.8% ofoutpatient requisitions had at least one order entry errorand the median participant reported one or more ordererrors on 6% of requisitions [110].
Recommendation #2. Have a user-friendly compu-ter system that facilitates direct physician ordering forlaboratory and pathology services.
Another Q-probe study in 712 hospitals showed awristband identification error rate of 2.7% [111]. Themost significant factor in the error rate was the policygoverning the initial placement of the wristband by thenursing staff.
Recommendation #3. Develop a quality wristbandpolicy and use bar codes on the wristband and specimenlabels to insure positive patient identification.
There are two important components of the analyticalphase of the laboratory; personnel and instrumentation.Assessing laboratory employee competence is a chal-lenge and has only been done recently. The CLIA’88requires a laboratory to have policies and procedures forevaluating personnel competency and the regulationsinclude appropriate evaluation factors. In a Q-probe study,89.8% of institutions had a written competence plan and98.1% reported reviewing employee competence at leastyearly [112]. Personnel failure rate ranged from 0.9 to6.4%, depending on the competence evaluated. Theauthors concluded that opportunities for improvement inemployee competence assessment are numerous.
Recommendation #4. Establish quality programsfor continuing education and personnel competencyassessment.
The choices for laboratory instrumentation have in-creased greatly in the past several years. It is a challengeto laboratory personnel to select equipment that improvesquality and reduces error. A recent study documentedthat an automated robotic workstation does decrease thenumber of laboratory errors that occur with sorting,labeling, and aliquotting [113].
Recommendation #5. Use automated systems wherefeasible in the laboratory and use error reduction/improved quality as a factor when selecting instrumentation.
The pathology/clinical laboratory report and transmit-ting abnormal results to the patient care physician are thekey components of the post-analytical process. The rateof errors in pathology/laboratory reports is difficult tomeasure since it depends on the error detection systemsused by a given pathology department. A study of errorsin reports found greater than 61,000 errors over a 3-month period in reports from 641 laboratories [114]. This
study also noted that the error rate is lowest in transfusionmedicine and highest in hematology.
Recommendation #6. An effective system for errordetection in patient reports should be present in allpathology departments.
It is important for a pathology department to definehow it transmits abnormal results such as a tissuespecimen positive for cancer or a markedly abnormallaboratory result, to the patient care physician. A studyhas documented that physicians frequently do not respondappropriately to an abnormal laboratory result due to avariety of reasons [115].
Recommendation #7. Pathologists and laboratorypersonnel must have policies and procedures in placethat insure abnormal results are promptly received bythe patient care physician and provide consultationfor the abnormal results.
Current climates are supportive of changing reactionto medical error from a system that is determined tofind individual fault to a system that examines all aspectsof the process that contributed to the error [116]. Oftenthe individual associated with a medical error hasinherited a number of problems inherent with the taskthat include organizational or system factors, includingwork environment and management decisions [117].Enhancing total laboratory testing practices is the goalof the federally funded cooperative agreement betweenthe American Society for Clinical Pathology and theCenters for Disease Control and Prevention. The title ofthe agreement is Enhancing Testing Practices in theClinical Laboratory by Developing Specific TrainingActivities for Medical Technologists, Medical LaboratoryTechnicians, and Pathologists. The project will encom-pass a number of laboratory functions, and help toprepare laboratories for challenges of the future includingchemical terrorism testing and clinical tasks involvedwith spin offs from the human genome project. Suchcollaboration will give the individual working daily inclinical laboratories the support and information neededto perform the highest quality of laboratory practices[118].We began this chapter with statistics from the IOM
indicating the large number of deaths and injuries in theUnited States attributed to medical errors. Pathology andlaboratory medicine are a diagnostic arm of the healthcare team and contribute to these statistics. However,pathology and laboratory medicine in this country havefocused on quality, improving the process for service anderror reduction since their inception. In every pathologyand laboratory medicine department in this country, thereare many systems in place to insure high quality andminimize errors. The standards set by CLIA’88, the
178 Hollensead et al.

JCAHO, AABB, and the CAP are maintained by theinspection and accreditation process and proficiencytesting. The goal of pathology and laboratory medicineis to provide an error free service to physicians and theirpatients. The pursuit of this goal is in the commitmentpeople have made when they have chosen a career inpathology and laboratory medicine.
ACKNOWLEDGMENTS
The authors thank Bonnie Deppert for her clerical helpwith the preparation of the manuscript.
REFERENCES
1. Kohn L, Corrigan J, Donaldson M, editors: To err is human:Building a safer health system. Washington, DC: NationalAcademies Press; 2000.
2. National Patient Safety Goals. Joint Commission on Accreditationof Healthcare Organization. 2004. www.jcaho.org/accreditedþorganization/patientþsafety.
3. Goldschmidt HML, Lent RW: Gross errors and work flowanalysis in the clinical laboratory. Klin Biochem Metab 1995;3:131–140.
4. Code of Federal Regulations. Title 42 CFR Parts 493 to end.Washington, DC: US Government Printing Office; 1998. (revisedannually).
5. Food and Drug Administration. Guideline for quality assurancein blood establishments. Docket #91N-0450, Rockville, MD:CBER Office of Communication, Training, and Manufacturer’sAssistance; 1995.
6. Quality program implementation. Association Bulletin 97-4.Bethesda, MD: American Association of Blood Banks; 1997.
7. Schlickman JJ: ISO 9000 quality management system design.Milwaukee, WI: ASQ Quality Press; 1998. pp 69–80.
8. Bonini P, Plebani M, Ceriotti F, et al.: Errors in laboratorymedicine. Clin Chem 2002;48:691–698.
9. Barr JT: Clinical laboratory utilization: Rationale. In: Davis B,Mass D, Bishop M, eds.: Principles of clinical laboratory utili-zation and consultation. Philadelphia, PA: Saunders; 1999. p 6.
10. Wiwanitkit V: Types and frequency of pre-analytical mistakesin the first Thai ISO 9002:1994 certified clinical laboratory, a6-month monitoring. BMC Clin Path 2001;1:5.
11. Stahl M, Lund ED, Brandslund I: Reasons for a laboratory’sinability to report results for requested analytical tests. ClinChem 1998;44:2195–2197.
12. Plebani M, Carraro P: Mistakes in a stat laboratory: Types andfrequency. Clin Chem 1997;43:1348–1351.
13. Zarbo RJ, Schmidt WA, Bachner P, et al.: Indications andimmediate patient outcomes of pathology intraoperative con-sultations. College of American Pathologists/Centers for DiseaseControl and Prevention Outcomes Working Group Study. ArchPathol Lab Med 1996;120:19–25.
14. Ross JW, Boone DJ: Assessing the effect of mistakes in the totaltesting process on the quality of patient care (Abstract 102).In: Martin L, Wagner W, Essien JDK, editors. 1989 Institute ofCritical Issues in Health Laboratory Practice. Minneapolis, MN:DuPont Press; 1991.
15. Moore SB, Foss ML: Error management: Theory and applicationin transfusion medicine at a tertiary-care institution. Arch PatholLab Med 2003;127:1517–1522.
16. ISO 9000 Compendium. 6th edn. Geneva, Switzerland: Interna-tional Organization for Standardization; 1996.
17. Tsiakals J: A description of the quality hierarchy presented at themeeting of the AABB. Bethesda, MD: Accreditation ProgramCommittee; 1996.
18. The quality program. Bethesda, MD: American Association ofBlood Banks; 1994.
19. Technical Manual. Bethesda, MD: American Association ofBlood Banks; 2002.
20. Sentinel events in the age of performance improvement.Oakbrook Terrace, IL: Joint Commission on Accreditation ofHealthcare Organizations; 1998.
21. Comprehensive accreditation manual for hospitals. OakbrookTerrace, IL: Joint Commission on Accreditation for HealthcareOrganizations; 1999.
22. American Association of Blood Banks. Bulletin, #97-4, August,1997.
23. Menitove J, editor. Standards for blood banks and transfusionservices, 18th edn. Bethesda, MD: American Association ofBlood Banks; 1997.
24. Rossiter EB, editor. Regulatory resources information exchange.Richmond, VA: CITINGS; 2002.
25. Rossiter EB, editor. Regulatory resources information exchange.Richmond, VA: CITINGS; 2004.
26. Phillips-Donaldson DJ, editor. Shaping quality with six sigma.Quality Progress 2003;36:77–80.
27. Harry M: Six sigma: A breakthrough strategy for profitability.Quality Progress 1998;31:60–64.
28. Folan K: Six sigma: Striving for perfection. AABB AnnualMeeting News. Bethesda, MD: American Association of BloodBanks; 2003. 3p.
29. Nolan T: A primer on leading improvement in health care.Amsterdam: Presented at the Fifth European Forum on QualityImprovement in Health Care; 2000.
30. Oakes D, Westcott RT: Quality management tools. In: ASQQuality Management Division, editors. The Certified QualityManager Handbook, 2nd edn. Milwaukee: American Society forQuality Press; 2001. pp 135–141.
31. Foster M: Process excellence in the laboratory environment.Transfusion Medicine Update, Winter 2002–2003; pp 8–9.
32. McFadden KL, Towell ER, Stock GN: Critical success factorsfor controlling and managing hospital errors. Qual Manag J2004;11:61–73.
33. Bogdanich W: The Pap test misses much cervical cancer throughlab’s error. Wall Street J 1987; 1.
34. Bogdanich W: Physician’s carelessness with Pap tests is cited inprocedure’s high failure rate. Wall Street J 1987; 17.
35. Davey DD: Papanicolaou smear 5-year retrospective review:What is required by the Clinical Laboratory ImprovementAmendments of 1988? Arch Pathol Lab Med 1997;121:296–298.
36. Renshaw AA: Measuring and reporting errors in surgicalpathology. Lessons from gynecologic cytology. Am J ClinPathol 2001;115:338–341.
37. Hammond ME, Compton CC: Protocols for the examination oftumors of diverse sites: Introduction. Cancer Committee of theCollege of American Pathologists. Arch Pathol Lab Med 2000;124:13–16.
38. Powsner SM, Costa J, Homer RJ: Clinicians are from Mars andpathologists are from Venus. Arch Path Lab Med 2000;124:1040–1046.
39. Foucar E: Error in anatomic pathology. Am J Clin Pathol 2001;116:S34–S46.
40. Travers H: Quality assurance indicators in anatomic pathology.Arch Pathol Lab Med 1990;114:1149–1156.
41. Azam M, Nakhleh RE: Surgical pathology extradepartmentalconsultation practices. Arch Pathol Lab Med 2002;126:405–412.
42. Leslie KO, Fechner RE, Kempson RL: Second opinions insurgical pathology. Am J Clin Pathol 1996;106:S58–S64.
43. Cramer SF, Roth LM, Mills SE, et al.: Sources of variability inclassifying common ovarian cancers using the World HealthOrganization classification. Application of the pathtrackingmethod. Pathol Annu 1993;28:243–286.
44. Schnitt SJ, Connolly JL, Tavassoli FA, et al.: Interobserverreproducibility in the diagnosis of ductal proliferative breastlesions using standardized criteria. Am J Surg Pathol 1992;16:1133–1143.
Errors in Pathology 179
45. Page DL, Rogers LW: Carcinoma in situ (CIS). In: Page DL,Anderson TJ, editors. Diagnostic histopahtology of the breast.Edinburgh: Churchill Livingstone; 1987. pp 157–192.
46. Baak JPA, Oort J: A manual of morphometry in diagnosticpathology. New York: Springer-Verlag; 1983. pp 2–13.
47. Frable WJ: Needle aspiration biopsy: Past, present and future.Hum Pathol 1989;20:504–517.
48. Bartels PH: The diagnostic pattern in histopathology. Am J ClinPathol 1989;91:S7–S13.
49. Singson RP, Natarajan S, Greenson JK, et al.: Virtual microscopyand the Internet as telepathology consultation tools. A study ofgastrointestinal biopsy specimens. Am J Clin Pathol 1999;111:792–795.
50. Agha Z, Weinstein RS, Dunn BE: Cost minimization analysis oftelepathology. Am J Clin Pathol 1999;112:470–478.
51. Lee ES, Kim IS, Jong SC, et al.: Accuracy and reproducibility oftelecytology diagnosis of cervical smears. A tool for qualityassurance programs. Am J Clin Pathol 2003;119:356–360.
52. Harrison JH, Jr., Stewart J III: Training in pathology informatics:Implementation at the University of Pittsburgh. Arch Pathol LabMed 2003;127:1019–1025.
53. Henricks WH, Boyer PJ, Harrison JH, et al.: Informatics trainingin pathology residency programs: Proposed learning objectivesand skill sets for the new millennium. Arch Pathol Lab Med2003;127:1009–1018.
54. Spickard A, Jr., Gabbe SG, Christensen JF: Mid-career burnoutin generalist and specialist physicians. JAMA 2002;288:1447–1450.
55. Kline TS: The challenge of quality improvement with thePapanicolaou smear. Arch Pathol Lab Med 1997;121:253–255.
56. Davey DD, Tritz DM: Communication and cytopathology—Part IV: Cytohistologic correlation and patient care. DiagnCytopathol 1995;13:1–2.
57. Dodd LG, Sneige N, Villarreal Y, et al.: Quality-assurance studyof simultaneously sampled, non-correlating cervical cytologyand biopsies. Diagn Cytopathol 1993;9:138–144.
58. Joste NE, Crum CP, Cibas ES: Cytologic/histologic correlationfor quality cervicovaginal cytology. Experiencewith 1,582 pairedcases. Am J Clin Pathol 1995;103:32–34.
59. Cioc AM, Julius CJ, Proca DM, et al.: Cervical biopsy/cytologycorrelation data can be collected prospectively and sharedclinically. Diagn Cytopathol 2002;26:49–52.
60. Morrell D, Curtis P, Mintzer M, et al.: Perceptions and opinionson the performance of Pap smears: A survey of clinicians using acommercial laboratory. Am J Prev Med 1996;12:271–276.
61. Fitzpatrick BT, Bibbo M: Superficial fine needle aspiration byclinicians: A survey of utilization. Am Surg 1996;62:719–723.
62. Nielsen ML: Cytopathology laboratory improvement programsof the College of American Pathologists: Laboratory Accredita-tion Program (CAP LAP) and Performance ImprovementProgram in Cervicovaginal Cytology (CAP PAP). Arch PatholLab Med 1997;121:256–259.
63. Keenlyside RA, Collins CL, Hancock JS, et al.: Do proficiencytest results correlate with the work performance of screeners whoscreen Papanicolaou smears? Am J Clin Pathol 1999;112:769–776.
64. Jones BA, Novis DA: Follow-up of abnormal gynecologiccytology: A college of American pathologists Q-probes study of16132 cases from 306 laboratories. Arch Pathol Lab Med 2000;124:665–671.
65. Jones BA, Davey DD: Quality management in gynecologiccytology using interlaboratory comparison. Arch Pathol LabMed 2000;124:672–681.
66. Davey DD: Quality and liability issues with the Papanicolaousmear: The problem of definition of errors and false-negativesmears. Arch Pathol Lab Med 1997;121:267–269.
67. Naryshkin S: The false-negative fraction for Papanicolaousmears: How often are ‘‘abnormal’’ smears not detected by a‘‘standard’’ screening cytologist? Arch Pathol Lab Med 1997;121:270–272.
68. Stastny JF, Geisinger KR, Michael CW, et al.: Another qualityassurance issue—Amended reports: What do we really knowabout them? Diagn Cytopathol 1998;18:67–70.
69. Derman H: Quality and liability issues with the Papanicolaousmear: Lessons from the science of error prevention. Arch PatholLab Med 1997;121:287–291.
70. Marshall CJ, Rowe L, Bentz JS: Improved quality-controldetection of false-negative Pap smears using the Autopap 300QC system. Diagn Cytopathol 1999;20:170–174.
71. Skoumal SM, Florell SR, Bydalek MD, et al.: Malpracticeprotection: Communication of diagnostic uncertainty. DiagnCytopathol 1996;14:385–389.
72. Houwen B: Make no mistake. Advance/Laboratory 2003;12:32–43, www.advanceweb.com.
73. Astion ML, Shojania KG, Hamill TR, et al.: Classifying labo-ratory incident reports to identify problems that jeopardizepatient safety. Am J Clin Pathol 2003;120:18–26.
74. Sunderman FW, Sr.: The history of proficiency testing/qualitycontrol. Clin Chem 1992;38:1205–1209.
75. Levey S, Jennings ER: The use of control charts in the clinicallaboratories. Am J Clin Pathol 1950;20:1059–1066.
76. Westgard JO, Barry PL, Hunt MR, et al.: A multi-rule Shewhartchart for quality control in clinical chemistry. Clin Chem 1981;27:493–501.
77. McSwiney RR, Woodrow DA: Types of error within a clinicallaboratory. J Med Lab Technol 1969;26:340–346.
78. Chambers AM, Elder J, O’Reilly DS: The blunder-rate in aclinical biochemistry service. Ann Clin Biochem 1986;23:470–473.
79. Lapworth R, Teal TK: Laboratory blunders revisited. Ann ClinBiochem 1994;31:78–84.
80. Witte DL, VanNess SA, Angstadt DS, et al.: Errors, mistakes,blunders, outliers, or unacceptable results: How many? ClinChem 1997;43:1352–1356.
81. Kroll MH, Elin RJ: Interference with clinical laboratoryanalyses. Clin Chem 1994;40:1996–2005.
82. Munzenberger P: Emmanuel Sister. The incidence of drug-diagnostic test interferences in outpatients. Am J Hosp Pharm1971;28:786–791.
83. Young DS: Effects of drugs on clinical laboratory tests, 5th edn.Washington, DC: AACC Press; 2000.
84. Narayanan S: The preanalytic phase. An important component oflaboratory medicine. Am J Clin Pathol 2000;113:429–452.
85. Lundberg GD: The need for an outcomes research agenda forclinical laboratory testing. JAMA 1998;280:565–566.
86. Sandhaus LM, Meyer P: How useful are CBC and ReticulocyteReports to clinicians? Am J Clin Pathol 2002;118:787–793.
87. Shahangian S, Stankovic AK, Lubin IM, et al.: Survey ofhospital coagulation laboratory practices, United States-2001.Centers for Disease Control and Prevention 2003; http://www.phppo.cdc.gov/mlp/coag2001.asp.
88. Schifman RB, Strand CL, Meier FA, et al.: Blood culturecontamination: A College of American Pathologists Q-probesstudy involving 640 institutions and 497134 specimens fromadult patients. Arch Pathol Lab Med 1998;122:216–221.
89. Valenstein P, Meier F: Urine culture contamination: ACollege ofAmerican Pathologists Q-Probes study of contaminated urinecultures in 906 institutions. Arch Pathol Lab Med 1998;122:123–129.
90. Hofgartner WT, Tait JF: Frequency of problems during clinicalmolecular-genetic testing. Am J Clin Pathol 1999;112:14–21.
91. Denis JB: Lettre touchant deux experiences de la transfusionfaites sur des homes. J Cusson, Paris 1667.
92. Blundell J: Experiments on the transfusion of blood by syringe.Med Chir Trans 1818;9:56–92.
93. Sazama K: Reports of 355 transfusion-associated deaths: 1976through 1985. Transfusion 1990;30:583–590.
94. Center for Biologics Evaluation and Research and AmericanAssociation of Blood Banks Annual Meeting (Internet). Rock-ville, MD: Center for Biologics Evaluation and Research; 2001.Available from: http://www.fda.gov/cber/meetings.htm.
180 Hollensead et al.

95. Goodman C, Chan S, Collins P, et al.: Ensuring blood safetyand availability in the US: Technological advances, costs, andchallenges to payment—Final report. Transfusion 2003;43:3S–46S.
96. Boone DJ, Steindel SD, Herron R, et al.: Transfusion medicinemonitoring practices. A study of the College of AmericanPathologists/Centers for Disease Control and Prevention Out-comes Working Group. Arch Pathol Lab Med 1995;119:999–1006.
97. Dzik WH, Murphy MF, Andreu G, et al.: Biomedical Excellencefor Safer Transfusion (BEST) Working Party of the InternationalSociety for Blood Transfusion. An international study of theperformance of sample collection from patients. Vox Sang2003;85:40–47.
98. Food and Drug Administration, Center for Biologics Evaluationand Research. Bar code label for human drug products andblood; proposed rule. 21 CFR parts 201, 606, and 610. Rockville,MD: Food and Drug Administration; 2003. Available from:http://www.fda.gov.
99. Wenz B, Mercuriali F, AuBuchon JP: Practical methods toimprove transfusion safety by using novel blood unit and patientidentification systems. Am J Clin Path 1997;107:S12–S16.
100. Turner CL, Casbard AC, Murphy XX: Barcode technology: It’srole in increasing the safety of blood transfusion. Transfusion2003;43:1200–1209.
101. Food and Drug Administration, Center for Biologics Evaluationand Research. Guideline for quality assurance in bloodestablishments. Rockville, MD: Food and Drug Administration;1995. (Docket No. 91N-0450).
102. Food and Drug Administration, Center for Biologics Evaluationand Research. Draft guidance for industry: Biological productdeviation reporting for blood and plasma establishments. Rock-ville, MD: Food and Drug Administration; 2001.
103. Transfusion Medicine Checklist. College of Pathology Accred-itation Program, Chicago, 2003.
104. Guidance on implementation of new bacteria reduction anddetecting systems. American Association of Blood BanksBulletin. #03-10, August 29, 2003.
105. Aubuchon J: Evolution to the 21st century. In: Hillyer CD,et al.: editor. Blood banking and transfusion medicine.
Basic principles & practice. Philadelphia: Churchill Livingston;2003.
106. Juran JM: Juran on leadership for quality. New York: The FreePress; 1989.
107. Neave HR: The deming dimension. Knoxville, Tennessee: SPCPress; 1990.
108. Walton M: Deming management at work. New York: G.P.Putnam’s Sons; 1991.
109. Nutting PA, Main DS, Fischer PM, et al.: Toward optimallaboratory use. Problems in laboratory testing in primary care.JAMA 1996;275:635–639.
110. Valenstein P, Meier F: Outpatient order accuracy: A Collegeof American Pathologists Q-probes study of requisition orderentry accuracy in 660 institutions. Arch Pathol Lab Med1999;123:1145–1150.
111. Renner SW, Howanitz PJ, Bachner P: Wristband identificationerror reporting in 712 hospitals. A College of AmericanPathologists’s Q-Probes study of quality issues in transfusionpractice. Arch Pathol Lab Med 1993;117:573–577.
112. Howanitz PJ, Valenstein PN, Fine G: Employee competence andperformance-based assessment: A College of American Pathol-ogists Q-probes study of laboratory personnel in 522 institutions.Arch Pathol Lab Med 2000;124:195–202.
113. Holman JW, Mifflin TE, Felder RA, et al.: Evaluation of anautomated preanalytic robotic workstation at two academichealth centers. Clin Chem 2002;48:540–548.
114. Howanitz PJ, Walker K, Bachner P: Quantification of errors inlaboratory reports. A quality improvement study of the Collegeof American Pathologists’s Q-Probes program. Arch Pathol LabMed 1992;116:694–700.
115. Howanitz PJ, Cembrowski GS: Postanalytical quality improve-ment: A College of American Pathologists Q-Probes study ofelevated calcium results in 525 institutions. Arch Pathol LabMed 2000;124:504–510.
116. Berwick DM: Errors today and errors tomorrow. N Engl J Med2003;348:2570–2572.
117. Foucar E, Foucar K: Medical error. In: Bone marrow pathology,2nd edn. Chicago: ASCP Press; 2001. pp 77–86.
118. ASCP news. ASCP Receives $150,000 CDC CooperativeAgreement. Lab Med 2004;35:28.
Errors in Pathology 181