Embed Size (px)
Citation preview

Error and Uncertainty
Scott Ferson, [email protected] September 2007, Stony Brook University, MAR 550, Challenger 165
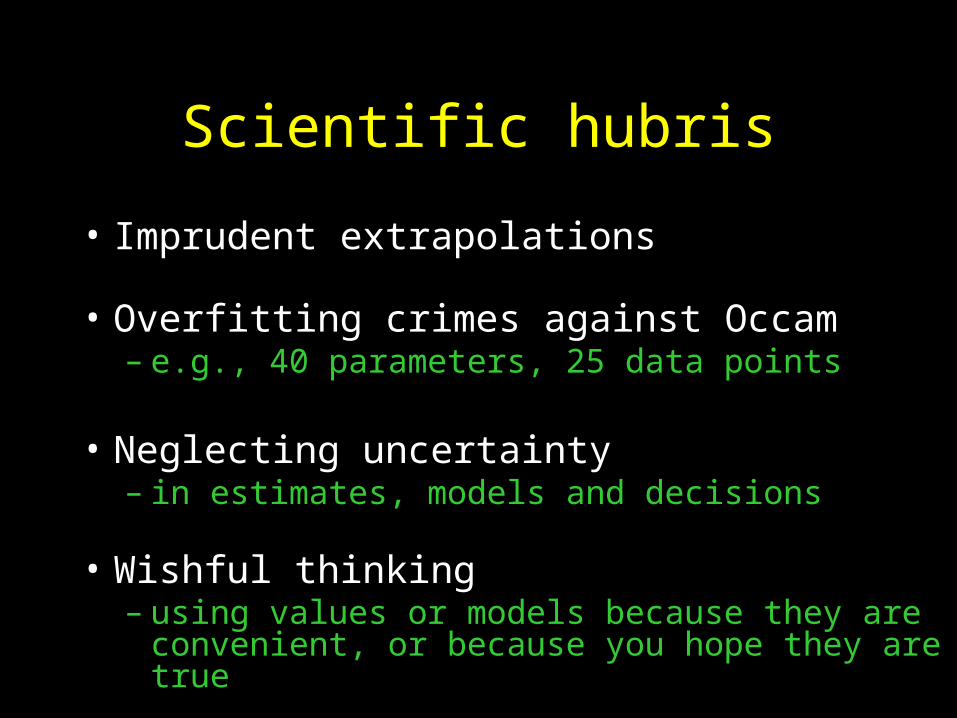
Scientific hubris
• Imprudent extrapolations
• Overfitting crimes against Occam – e.g., 40 parameters, 25 data points
• Neglecting uncertainty– in estimates, models and decisions
• Wishful thinking– using values or models because they are convenient,
or because you hope they are true

Kansai International Airport
• 30 km from Kobe in Osaka Bay
• Artificial island made with fill
• Engineers told planners it’d sink [6, 8] m
• Planners elected to design for 6 m
• It’s sunk 9 m so far and is still sinking
(The operator of the airport denies these media reports)

Wishfulthinking
Prudent analysis
Failure
Success
Dumb luck
Negligence Honorable failure
Good engineering

“Uncertainties appear everywhere! … When using a mathematical model, careful attention must be given to uncertainties in the model.” Richard Feynman
“Uncertainty quantification is the missing piece of the puzzle in large scale computations.” Tim Barth
“We have to make the best model we possibly can, and then not trust it.” Robert Costanza

Credible uncertainty analysis
• Decision makers far more likely to use modeling results because they’d know the outputs are good enough
• Program managers could focus research on areas where uncertainty is intolerable

So how to do it?
• Direct statistical analysis of mechanistic model– Monte Carlo simulation– Latin hypercube and stratified sampling– Response surface approaches
• Recast model as stochastic PDE and solve it– Perturbation expansion methods for random fields– Stochastic operator expansions
We need simple methods that don’t require unreasonable assumptions or inordinate effort
–Polynomial chaos methods

Traditional uncertainty analyses
• Worst case bounding analysis
• Taylor series approximations (delta method)
• Normal theory propagation (ISO/NIST)
• Monte Carlo simulation
• Two-dimensional Monte Carlo

Untenable assumptions
• Uncertainties are small
• Sources of variation are independent
• Uncertainties cancel each other out
• Linearized models good enough
• Underlying mechanisms are known and modeled
• Computations are inexpensive to make

Need ways to relax assumptions
• Possibly large uncertainties
• Non-independent, or unknown dependencies
• Uncertainties that may not cancel
• Arbitrary mathematical operations
• Model uncertainty

Kinds of uncertainty
• Variability– aleatory uncertainty, stochasticity, randomness, Type A
• Incertitude– epistemic uncertainty, imprecision, uncertainty, Type B
• Vagueness– semantic uncertainty, fuzziness, multivalent uncertainty
• Confusion, etc.

Incertitude
• Arises from incomplete knowledge
• Incertitude arises from– limited sample size– mensurational limits (‘measurement error’)– use of surrogate data
• Reducible with empirical effort

Variability
• Arises from natural stochasticity
• Variability arises from– spatial variation– temporal fluctuations– genetic or manufacturing differences
• Not reducible by empirical effort

Propagating variability
• Probability theory can project variability in inputs through mathematical models
• Suppose – Doses of an environmental contaminant vary
among individuals– Susceptibilities also vary independently among
those individuals
• Model both by probability distributions

Suppose
A is in [2, 4]
B is in [3, 5]
What can be said about the sum A+B?
4 6 8 10
The right answer is [5,9]
Propagating incertitude

They must be treated differently
• Variability should be modeled as randomness with the methods of probability theory
• Incertitude should be modeled as ignorance with the methods of interval analysis

Incertitude is common
• Periodic observationsWhen did the fish in my aquarium die during the night?
• Plus-or-minus measurement uncertaintiesCoarse measurements, measurements from digital readouts
• Non-detects and data censoringChemical detection limits, studies prematurely terminated
• Privacy requirementsEpidemiological or medical information, census data
• Theoretical constraintsConcentrations, solubilities, probabilities, survival rates
• Bounding studies Presumed or hypothetical limits in what-if calculations

Basic problems
• Representation of what’s (un)known• Aggregation and updating• Prediction
– Arithmetic expressions– Logical expressions (fault or event trees)– Differential equations
• Sensitivity analysis• Validation• Decision making• Backcalculation• Optimization• Etc.

Deterministic
calculation
Probabilistic
convolution
Interval
analysis
Probability
bounds analysis
Second-order
probability
Deterministic
calculation
Probabilistic
convolution
Interval
analysis
Probability
bounds analysis
Second-order
probability
Two basic approaches

Example applications
• Plume travel time
• Dike reliability
• Endangered species
• Environmental pollution

Example: contaminant plume
• Hydrocarbon in groundwater near some wells
• Constant, one-dimensional, uniform Darcian flow
• Homogeneous properties (e.g., no pipes, conduits, barriers or differential permeability among layers)
• Linear retardation
• No dispersion
• How long before the contaminant reaches the wells?

Plume travel time
iK
LKocfocBDnT
ParameterL source-receptor distancei hydraulic gradientK hydraulic conductivityn effective soil porosityBD soil bulk densityfoc fraction organic carbonKoc organic partition coefficient
Min800.00033000.215000.00015
Max1200.000830000.3517500.00520
Mean1000.0005510000.2516500.0025510
Stdv11.550.00014437500.051000.0014153
Unitsmm/mm/yr-kg/m3
-m3/kg

Example: dike reliability
D
wavesea level
revetmentblocks
clay layer

Reliability is strength minus stress
relative density of the revetment blocks
D revetment blocks thickness
H offshore peak wave steepness
slope of the revetment
s significant wave height
M model parameter
H tan() Z = D ——————
cos() M s
What kind of information might be available about these variables? (all variables are independent)

Reliability function
Z0 1
0
1
Ris
k (c
umul
ativ
e pr
obab
ilit
y)

Example: endangered species
• Northern spotted owl Strix occidentalis caurina
• Olympic Peninsula, Washington State
• Leslie matrix model (with composite age)
• Environmental and demographic stochasticity
• Density dependence (territorial, Allee effects)
• Catastrophic windstorms

IUCN threat criteria
Extinct
Critical
Endangered
Vulnerable
Nonthreatened
(not sighted in the wild for 50 years)
(50% risk of extinction in 18 years)
(20% risk of extinction in 89 years)
(10% risk of extinction in 100 years)
(better than any of the above)

Leslie matrix model
juveniles t + 1
subadults t + 1
adults t + 1
=juveniles t
subadults t
adults t
0 Fsubadults Fadults
Sjuveniles 0 0 0 Ssubadults Sadults
What kind of information might be available about these variables?

0 20 40 60 80 100
1
0.8
0.6
0.4
0.2
0
Time (years)
Cum
ulat
ive
prob
abili
ty
critical
endangered
vulnerable
Risk of quasi-extinction

Example: environmental pollution
Location: Bayou d’Inde, Louisiana
Receptor: generic piscivorous small mammal
Contaminant: mercury
Exposure route: diet (fish and invertebrates)
Based on the assessment described in “Appendix I2: Assessment of Risks to Piscivorus [sic] Mammals in the Calcasieu Estuary”, Calcasieu Estuary Remedial Investigation/Feasibility Study (RI/FS): Baseline Ecological Risk Assessment (BERA), prepared October 2002 for the U.S. Environmental Protection Agency. See http://www.epa.gov/earth1r6/6sf/pdffiles/appendixi2.pdf.

Total daily intake from diet
FMR normalized free metabolic rate
Cfish, Cinverts mercury concentration in fish or invertebrate tissue
Pfish, Pinverts proportion of fish or inverts in the mammal’s dietBW body mass of the mammal
AEfish, AEinverts assimilation efficiency for dietary fish or inverts
GEfish, GEinverts gross energy of fish or invertebrate tissue
What kind of information might be available about these variables?

Results
0 0.1 0.20
1
TDI, mg kg1 day1
Exc
eeda
nce
risk

How to use uncertainty results
When uncertainty makes no difference (because results are so clear), bounding gives confidence in the reliability of the decision
When uncertainty swamps the decision(i) use results to identify inputs to study better, or
(ii) use other criteria within probability bounds

More complicated models
• It will not always be easy to propagate uncertainty correctly through very complex process models
• New methods are under development to do it
• It must be done

Contentions
• Biometry is insufficient– Need decision analysis, ways to handle poor data
• Worst case analysis is misleading– Usually ignores some knowledge or information
• Monte Carlo simulation alone is obsolete– Need methods that handle incertitude

Ethic
• Failing to report uncertainty is lying
• Overstating uncertainty is cowardice
• Assumptions are a playground where honesty and courage are developed

Everyone makes assumptions
• But not all sets of assumptions are equal
Point value Linear functionInterval range Monotone functionEntire real line Any function
Normal distribution IndependenceUnimodal distribution Known correlationAny distribution Any dependence
• Want to discharge unwarranted assumptions“Certainties lead to doubt; doubts lead to certainty”

End

For next time
• Discuss an example from your discipline where ignoring uncertainty led to a poor result
• Discuss a situation in which you made an assumption you knew was probably false
• Read Nikolaidis and Haftka