Embed Size (px)
Citation preview

U.S. Department of the Interior Bureau of Reclamation Technical Service Center Hydraulic Investigations and Laboratory Services Group Concrete, Geotechnical, and Structural Laboratory Denver, Colorado December 2016
Hydraulic Laboratory Technical Memorandum, PAP-1159
Erosion Tests and Index Properties of Soil Specimens from American Falls Reservoir

U.S. Department of the Interior Bureau of Reclamation Technical Service Center Hydraulic Investigations and Laboratory Services Group Concrete, Geotechnical, and Structural Laboratory Denver, Colorado December 2016
BUREAU OF RECLAMATION Technical Service Center, Denver, Colorado Hydraulic Investigations and Laboratory Services, 86-68560 Technical Memorandum PAP-1159
Erosion Tests and Index Properties of Soil Specimens from American Falls Reservoir Prepared: Tony L. Wahl, P.E. Date Hydraulic Engineer, Hydraulic Investigations and Laboratory Services, 86-68560 Checked: Jason Inskeep Date Civil Engineer Intern, Concrete, Geotechnical, and Structural Laboratory, 86-68530 Technical Approval: Robert F. Einhellig, P.E. Date Manager, Hydraulic Investigations and Laboratory Services, 86-68560 Peer Review: Robert Rinehart, Ph.D., P.E. Date Civil Engineer, Concrete, Geotechnical, and Structural Laboratory, 86-68530

3
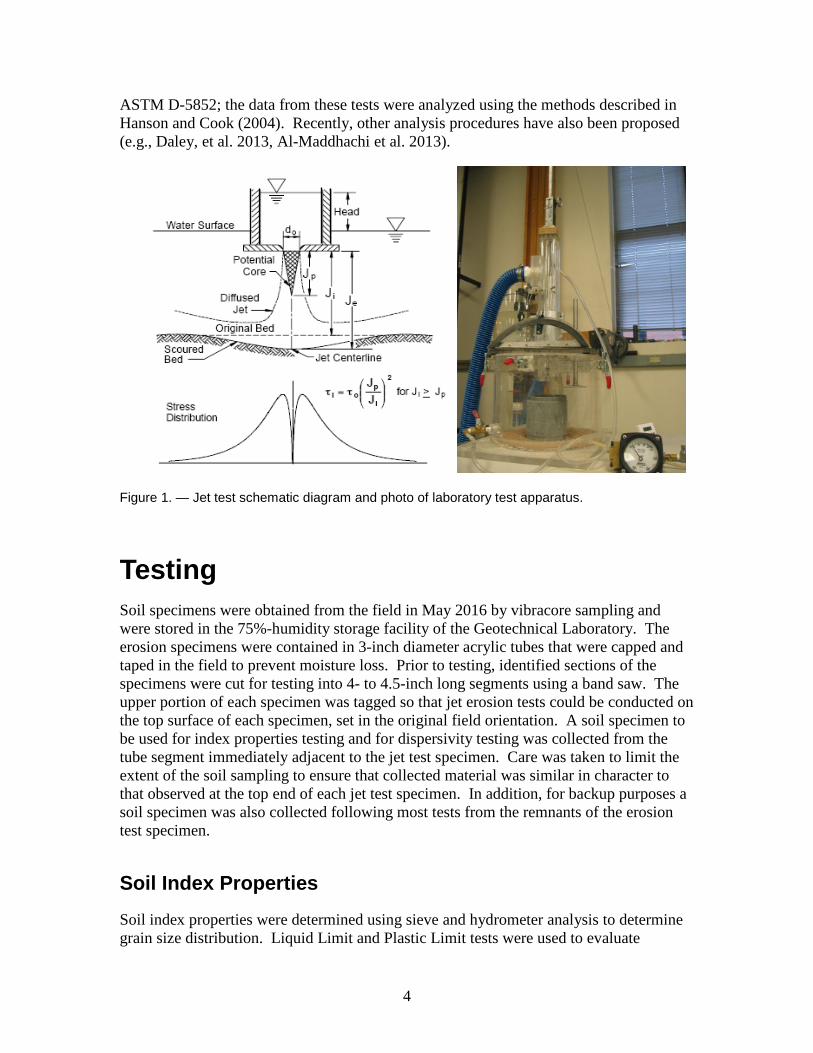
Introduction Soil specimens obtained in May 2016 from depositional zones within American Falls Reservoir were evaluated with index properties tests, soil dispersivity tests and erosion tests conducted in Reclamation’s Denver laboratories in the summer of 2016. Index properties and soil dispersivity tests were performed in the soil mechanics laboratory. Erodibility characteristics were evaluated using pinhole dispersion, crumb dispersion, and submerged jet erosion tests. The latter test was performed in the hydraulics laboratory using a jet test apparatus constructed by Reclamation in accordance with ASTM D-5852, Standard Test Method for Erodibility Determination of Soil in the Field or in the Laboratory by the Jet Index Method. This standard was first developed in 1995 and was most recently renewed in 2007 before being withdrawn in early 2016. ASTM is presently developing new jet test standards. More details of the jet test apparatus and its use are given in Wahl et al. (2008).
Test Background
The pinhole and crumb tests evaluate clayey soils to identify those that are dispersive, i.e., that tend to naturally deflocculate in water without the application of shear stress, due to physiochemical repulsion forces between clay particles. The pinhole test is a direct, physical, quantitative test, while the crumb test is qualitative and sometimes gives a nondispersive reaction for soils that are shown to be dispersive in other tests. For these reasons the crumb test is usually performed jointly with the pinhole test, and also often in combination with the double hydrometer test. The latter test was not performed for this study. The pinhole (USBR 5410-89) and crumb tests (USBR 5400-89) are well established and are documented in Reclamation’s Earth Manual, Part 2, 3rd ed.
The submerged jet test simulates scour of a soil surface due to a perpendicular impinging jet. The depth of scour beneath the jet is measured over time and is used to estimate the critical shear stress needed to initiate erosion and the detachment rate coefficient relating the rate of erosion to the applied stress in excess of the critical value. The analysis is based on a volumetric form of the excess stress erosion model:
( )cdk ττε −=
where ε is the volume of material removed per unit surface area per unit time (m3/s/m2, or m/s), kd is a detachment rate coefficient, τ is the applied stress (N/m2=Pa), and τc is the critical shear stress (N/m2=Pa). Typical units for kd are m3/s/m2/Pa which reduces to m/s/Pa or m3/(N∙s) in S.I. units; kd is also commonly reported in cm3/(N∙s). When working in U.S. customary units, kd is usually expressed in ft/hr/psf [1 cm3/(N∙s) = 0.5655 ft/hr/psf = 10–6 m3/(N∙s)] and τc is reported in lb/ft2. Procedures for analyzing the test data to determine values of kd and τc have been improved since the publication of
4
ASTM D-5852; the data from these tests were analyzed using the methods described in Hanson and Cook (2004). Recently, other analysis procedures have also been proposed (e.g., Daley, et al. 2013, Al-Maddhachi et al. 2013).
Figure 1. — Jet test schematic diagram and photo of laboratory test apparatus.
Testing Soil specimens were obtained from the field in May 2016 by vibracore sampling and were stored in the 75%-humidity storage facility of the Geotechnical Laboratory. The erosion specimens were contained in 3-inch diameter acrylic tubes that were capped and taped in the field to prevent moisture loss. Prior to testing, identified sections of the specimens were cut for testing into 4- to 4.5-inch long segments using a band saw. The upper portion of each specimen was tagged so that jet erosion tests could be conducted on the top surface of each specimen, set in the original field orientation. A soil specimen to be used for index properties testing and for dispersivity testing was collected from the tube segment immediately adjacent to the jet test specimen. Care was taken to limit the extent of the soil sampling to ensure that collected material was similar in character to that observed at the top end of each jet test specimen. In addition, for backup purposes a soil specimen was also collected following most tests from the remnants of the erosion test specimen.
Soil Index Properties
Soil index properties were determined using sieve and hydrometer analysis to determine grain size distribution. Liquid Limit and Plastic Limit tests were used to evaluate

5
consistency and plasticity of fine-grained soils. Water content and wet density of specimens were determined from measurements made just after the capped and taped tubes were re-opened in the laboratory. Table 1 on the following page summarizes the results and the soil classifications based on the Unified Soil Classification System (USCS).
Dispersivity Testing
The crumb and pinhole tests were used to evaluate soil dispersivity. Table 2 summarizes the results.
The crumb test is performed by using the thumb and index fingers to lightly remold a soil specimen into a 15 mm cube, and the cube is then placed into an evaporating dish containing distilled water. The cube is observed as it absorbs water and the reaction is classified into one of four grades that indicate the dispersivity of the soil. The crumb test is a simple, quick method for identifying dispersive clay, but can give false-negative results in some cases. All specimens tested for this project exhibited a Grade 1 reaction, suggesting that they are not dispersive. For a Grade 1 reaction, samples may crumble, slake, diffuse, and spread out, but there is no turbid water created by colloids in suspension, and all detached particles settle during the first hour.
The pinhole test is the generally accepted reference test in the U.S. for identifying dispersive clays. The test is performed by passing water through a 1-mm diameter hole punched through a 25-mm long by 35-mm diameter cylindrical soil specimen. Water flows for set intervals under heads of 50, 180, and 380 mm, and the flow rate and effluent turbidity are recorded. For nondispersive soils, the pinhole diameter remains essentially unchanged throughout the test, the discharge effluent remains clear, and the measured flow rate remains constant at each head setting. For dispersive soils, the pinhole diameter substantially increases throughout the test, the discharge effluent contains visible clay colloids in suspension, and the flow rate (at the 50-mm head) increases rapidly during the first 10 minutes of the test. Six test results are possible, ranging from most to least dispersive (D1, D2, ND4, ND3, ND2, ND1). D1 and D2 soils are considered dispersive; ND4, and ND3 soils exhibit intermediate dispersion; and ND2 and ND1 soils are nondispersive. The specimens tested for this project were all categorized as dispersive or intermediately dispersive. These results override the qualitative nondispersive indication given by the crumb test.

6
Table 1 - Summary of Physical Properties Test Results American Falls Dam, Idaho
SPECIMEN LOCATION
LITHOLOGY
LAB CLASSIFICATION
(USCS)
PARTICLE - SIZE FRACTION CONSISTENCY (%) LIMITS DEPTH
Clay (< 0.002 mm)
Silt (0.002 mm to
0.075 mm)
Sand (#200 to
#4)
Gravel (#4 to 3 inch)
Liquid Limit
Plasticity Index
Tube Wet Density 1
lb/ft³
Lab Water Content 2
% SAMPLE (feet) NUMBER From To
3CL-P
47Z-1 0.3 0.7 Reservoir Sediment s(CL) 15 53 32 0 32 9
110.9 38.0
47Z-1b 0.7 1.0 Reservoir Sediment (CL) 19 78 3 0 36 19 32.5
5C-1
47Z-2 3 0.0 1.2 Reservoir Sediment (CH) 33 67 0 0 62 37 — 136.4 4
47Z-2a 1.2 2.4 Reservoir Sediment (CH) 39 61 0 0 64 40 81.7 139.0
47Z-2b 2.4 3.6 Reservoir Sediment (CH) 33 67 0 0 53 32 90.4 101.3
Notes: 1. Tube wet density determined from specimen that had been stored; water content may not represent field conditions. 2. Moisture contents were determined immediately after capped and taped tubes were opened, but may not represent the field moisture content. 3. Tube density data not available for determination of wet density. 4. Water content represents average value from top and bottom of tube sample.

7
Table 2 - Summary of Dispersion Test Results American Falls Dam, Idaho
Specimen Location Description Pinhole Test1 Crumb Test2
Sample Number
Approx. Depth [ft] Lithology
Lab Classification
Placement Conditions Dispersive Grade
Classification 24 hr
Temp. [°C] 24 hr Grade
Dry Density
Water Content
47Z-13 0.3-0.7 Soil s(CL) 81.0 38.1% ND4 20.2 1
47Z-23 0.0-1.2 Soil (CH) 58.5 69.5% ND3 20.1 1
47Z-2b3 2.4-3.6 Soil (CH) 59.6 65.5% D1 20.5 1
Notes: 1. Test performed in general accordance with USBR 5410-89. 2. Test performed in general accordance with USBR 5400-89. 3. Pinhole testing could not be performed at as-received water content. Sample
was partially dewatered and test was performed at the highest workable water content. Water content taken from specimen at the time of testing.
Erosion Testing
Five jet erosion tests were performed. The jet pressure and initial nozzle distance above the specimen determine the initial hydraulic stress applied to the specimen. As the test proceeds, the applied stress at the erosion interface reduces as the scour hole deepens. The initial stress is often set based on the expected range of stresses that will be applied to the soil in the application of interest. In this case, initial observation of the specimens suggested that their erodibility would be high, so jet pressures were set relatively low (about 15 to 22 inches of water pressure). Initial shear stresses applied to the test specimens ranged from about 8 to 37 Pa. Final stresses applied to the specimens at the end of the tests ranged from 3 to 6 Pa. All water used for erosion testing was obtained from the tap water system in the hydraulics laboratory, whose source is the Denver municipal water system. Water temperature at the time of the tests was about 16.5°C (62°F). Each specimen was tested with the jet impinging on the top surface of the specimen.
Scour depths along the axis of the jet were recorded at relatively short intervals at the beginning of each test, typically 15 to 60 seconds depending on the initially observed erosion, and at increasing intervals as the tests continued. One specimen (test AF-1) experienced non-symmetric erosion so that no noticeable scour could be measured at the

8
jet axis until about 5 minutes had elapsed. Test durations ranged from 6 to 36 minutes. Table 1 lists the specimens and the test results. Figure 2 shows the pre-test condition of two of the test specimens, and Figure 3 provides post-test photographs.
Table 1. — Soil specimens and jet erosion test results.
Jet Test / Sample Tube Sample Depth
USCS soil classification
kd ft/hr/psf τc psf
AF-1 / 47Z-1 3CL-P 0.3' - 0.7' s(CL) 10.59 0 AF-2 / 47Z-1b 3CL-P 0.7' - 1.0' (CL) 4.38 0.000178 AF-3 / 47Z-2 5C-1 9" - 14" (CH) 7.86 0.000067
AF-4 / 47Z-2a 5C-1 20" - 25" (CH) 14.80 0.003951 AF-5 / 47Z-2b 5C-1 29" - 33" (CH) 4.95 0.010832
Jet test results are plotted in Figure 4, along with lines that indicate erodibility categories proposed by Hanson and Simon (2001). These classifications were established to span the range of erodibilities observed in a study of natural cohesive streambed deposits in loess areas of eastern Nebraska, western Iowa, and northern Mississippi. They also represent typical ranges of erodibility measured in compacted soils used in civil engineering infrastructure, such as dams and levees (Wahl et al. 2008; Hanson et al. 2010). Five erodibility classes are recognized from the work of Hanson and Simon (2001): very resistant, resistant, moderately resistant, erodible, and very erodible. Figure 4 shows that all of the tested specimens are in the very erodible category.
For comparison, dotted vertical lines and labels at the bottom of the chart in Figure 4 show the critical shear stress values that would be expected for cohesionless soil particles of specific sizes, applying Shield’s criteria for incipient motion with a critical Shield’s parameter value of 0.047. Widely varying critical shear stress values were determined from the test results, even though detachment rate coefficients were relatively consistent. For two of the five specimens the critical shear stress was much greater than would be expected for the predominant particles (clay and silt) based on Shield’s criteria. This effectively illustrates the importance of cohesion in fine-grained soils.
Figure 2. — Representative jet test specimens from American Falls Reservoir, prior to testing.

9
(AF-1) (AF-2)
(AF-3)
(AF-4) (AF-5)
Figure 3. — Post-test photographs of jet test specimens.

10
Figure 4. — JET erosion test results. Tests yielding extremely low τc values are plotted at τc=0.0001 psf. Erodibility classifications are those proposed by Hanson and Simon (2001). For comparison, dotted vertical lines and labels indicate expected critical shear stresses for granular particles of the indicated size classes, calculated using the Shield’s parameter. Unit conversions: 1 cm3/(N-s) = 0.5655 ft/hr/psf; 1 Pa = 0.0209 psf.
11
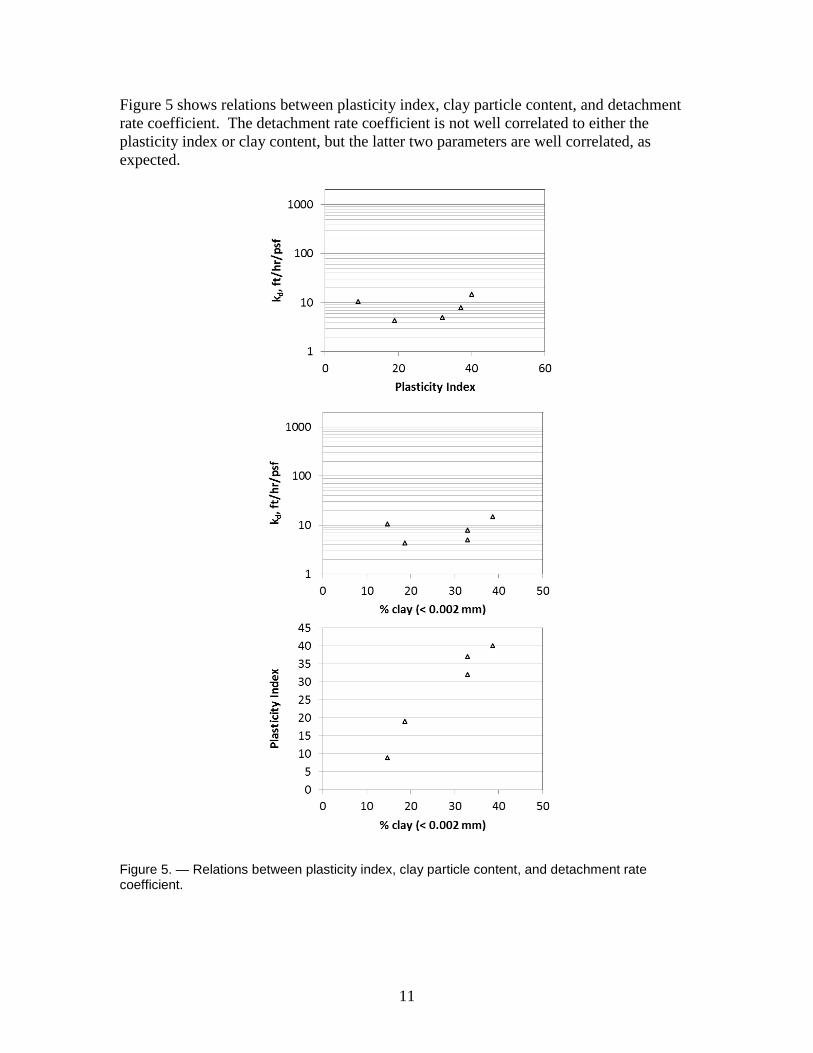
Figure 5 shows relations between plasticity index, clay particle content, and detachment rate coefficient. The detachment rate coefficient is not well correlated to either the plasticity index or clay content, but the latter two parameters are well correlated, as expected.
Figure 5. — Relations between plasticity index, clay particle content, and detachment rate coefficient.
12
Summary Five soil specimens obtained from American Falls Reservoir were analyzed in the Geotechnical Laboratory to determine soil gradation, Atterberg limits (plasticity properties), and soil type using the Unified Soil Classification System (USCS). Tests to identify dispersive soils indicated that 2 of 3 tested specimens were intermediately dispersive and one was dispersive.
Submerged jet erosion tests were performed in the hydraulics laboratory on specimens cut from the 3-inch diameter sample tubes. Critical shear stress values determined from the tests varied widely on a logarithmic scale, although all were numerically near zero in an algebraic sense. Detachment rate coefficients were relatively consistent among the five tested specimens, suggesting that they would all erode at similar rates if subjected to large stresses. All specimens were categorized as very erodible.
References Al-Madhhachi, A. T., G. J. Hanson, G. A. Fox, A. K. Tyagi, and R. Bulut, 2013a. Deriving parameters of a
fundamental detachment model for cohesive soils from flume and jet erosion tests. Transactions of the ASABE, 56(2):489-504. http://dx.doi.org/10.13031/2013.42669.
ASTM, 2007. Standard D-5852. Standard test method for erodibility determination of soil in the field or in the laboratory by the jet index method. Annual Book of ASTM Standards, Section 4: Construction, Vol. 04.08. Philadelphia, Penn.: American Society for Testing and Materials.
Bureau of Reclamation, Earth Manual, Part 2, 3rd Edition, Denver, CO, 1990. Daley, E.R., G.A. Fox, A.T. Al-Madhhachi, and R.B. Miller, 2013. A scour depth approach for deriving
erodibility parameters from jet erosion tests. Transactions of the ASABE, 56(6): 1343-1351 ISSN 2151-0032 DOI 10.13031/trans.56.10350
Hanson, G.J., and Simon, A., 2001. Erodibility of cohesive streambeds in the loess area of the midwestern USA. Hydrological Processes, Vol. 15, pp. 23-38.
Hanson, G.J., and Cook, K.R., 2004. Apparatus, test procedures, and analytical methods to measure soil erodibility in situ. Applied Engineering in Agriculture, 20(4):455-462.
Hanson, G.J., T.L. Wahl, D.M. Temple, S.L. Hunt, and R.D. Tejral, 2010. Erodibility characteristics of embankment materials. In: Dam Safety 2010. Proceedings of the Association of State Dam Safety Officials Annual Conference, September 19-23, 2010, Seattle, WA. (CDROM).
Wahl, Tony L., Regazzoni, Pierre-Louis, and Erdogan, Zeynep, 2008. Determining Erosion Indices of Cohesive Soils with the Hole Erosion Test and Jet Erosion Test, Dam Safety Technology Development Report DSO-08-05, U.S. Dept. of the Interior, Bureau of Reclamation, Denver, Colorado, 45 pp. http://www.usbr.gov/pmts/hydraulics_lab/pubs/DSO/DSO-08-05.pdf